methods for assessing economic, environmental and social impacts of aquaculture technologies:...
Post on 19-Dec-2015
218 views
TRANSCRIPT
Methods for Assessing Economic, Environmental and Social Impacts of Aquaculture Technologies: Integrated
Agriculture-Aquaculture in Malawi
John AntleOregon State University
Roberto ValdiviaMontana State University
tradeoffs.oregonstate.edu
9AFAF Conference Shanghai April 18 2011

What is the TOA-MD Model?
• The TOA-MD Model is a unique simulation tool for multi-dimensional impact assessment that uses a statistical description of a heterogeneous farm population to simulate the adoption and impacts of a new technology or a change in environmental conditions. • TOA-MD is designed to simulate what would be observed if it were possible to conduct a controlled experiment to measure the effects of farms adopting a new production technology• In fact it is never possible to carry out such ideal experiments, so TOA-MD is designed to utilize the available data to attain the best possible approximation, given the available time and other resources available to conduct the analysis. • Additionally, TOA-MD is designed to facilitate analysis of the inevitable uncertainties associated with impact assessment.

• There are two components in the TOA analysis: • First, the model simulates the proportion of farms that would adopt the new system • Second, based on the adoption rate of the new system, the TOA-MD model simulates selected economic, environmental and social impact indicators for adopters, non-adopters and the entire population.
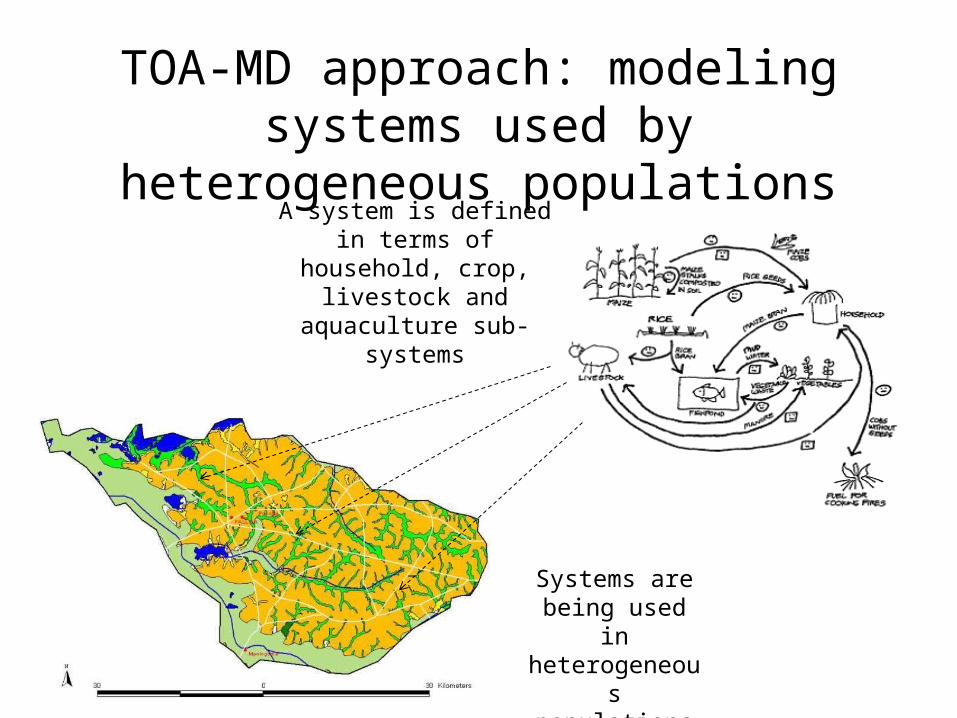
TOA-MD approach: modeling systems used by heterogeneous populations
Systems are being used in
heterogeneous populations
A system is defined in terms of household, crop, livestock and
aquaculture sub-systems

(ω)
0
Map of a heterogeneous region
Opportunity cost, system choice and adoption
Opportunity cost = v1 – v2
follows distribution ()
System 1: > 0(non-adopters)
System 2: < 0 (adopters)
opportunity cost

• Outcome distributions are associated with system choice– Farms select themselves into “non-adopter” and “adopter” sub-
populations, generating corresponding outcome distributions for these sub-populations
• Impact indicators are based on system choice and outcome distributions– TOA-MD produces mean indicators and threshold-based
indicators• Analysis shows that impacts depend on the correlations
between adoption (opportunity cost) and outcomes– Many impact assessments ignore correlations
Adoption, Outcome Distributions and Impact Indicators

Adoption and outcome distributions
Entire Population with adoption: 55% >
r(1,a)% non-adopters
System 1: 20% >
System 1 before adoption: 25% > threshold
System 2: 90% >
Outcome z
(z|1)
r(2,a)% adopters (z|1,a) (z|2,a)
(z|a)

Components of TOA-MD Analysis
System characterization
Adoption rate
Population (Strata)
Impact indicator design
Opportunity cost distribution
Outcome distributions
Indicators and Tradeoffs
Design
Data
Simulation

The Malawi Case Study: Integrated Agriculture-Aquaculture• Based on Dey et al (2010) Agricultural Economics: economic analysis of IAA• stratified survey of farms, without and with IAA• estimate adoption model but cannot predict adoption rate…
• Design of TOA-MD analysis• population: farm households in southern Malawi where aquaculture is
feasible• strata: 5 southern districts• systems:
• Subsistence crops• Crops + aquaculture, low or high integration
Subsistence crops
Aquaculture
Irrigated vegetables

-1000
-800
-600
-400
-200
0
200
400
600
800
0 10 20 30 40 50 60 70 80 90 100
Opp
ortu
nity
Cos
t
Adoption Rate (%)
Zomba Mwanza Mulanje Thyolo Mangochi
Adoption Rate and Opportunity Cost of Adopting IAA in Southern Malawi – Predicted Adoption Rate is Point Where Curves Cross the
Horizontal Axis
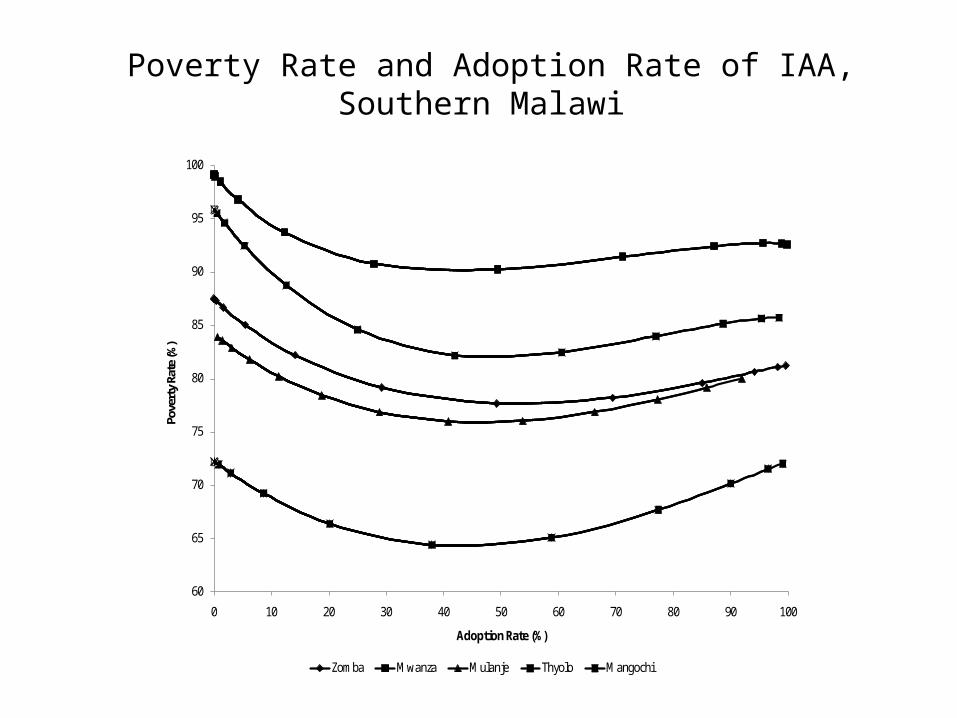
Poverty Rate and Adoption Rate of IAA, Southern Malawi
60
65
70
75
80
85
90
95
100
0 10 20 30 40 50 60 70 80 90 100
Pove
rty
Rate
(%)
Adoption Rate (%)
Zomba Mwanza Mulanje Thyolo Mangochi

Mean Monthly Protein Consumption and Adoption of IAA, Southern Malawi
0
0.5
1
1.5
2
2.5
0 10 20 30 40 50 60 70 80 90 100
Mea
n M
onth
ly P
rote
in C
onsu
mpti
on p
er p
erso
n (k
g)
Adoption Rate (%)
Zomba Mwanza Mulanje Thyolo Mangochi

Relationship between adoption and Protein Consumption, Non-adopters and Adopters of IAA, Mulanje Dist., Malawi
Non-adopter sub-population and entire
population are equal at 0% adoption
Adopter sub-population and entire population are equal at 100% adoption
Slope of relationship between indicator and adoption rate has
same sign as the correlation between opp cost and the
outcome variable (negative in this case)

Relationship between adoption and Mean Returns per Farm, Non-Adopters and Adopters of IAA, Mulanje District, Malawi
Economic outcomes that are positively related to net returns have a maximum in the entire population at the
predicted adoption rate (41% in this example)
-1000
-800
-600
-400
-200
0
200
400
600
800
0 10 20 30 40 50 60 70 80 90 100
Op
po
rtu
nit
y C
ost
Adoption Rate (%)
Zomba Mwanza Mulanje Thyolo Mangochi

Ave. farm income ($/year) Poverty rate (%)
Mean Monthly Protein Consumption (kg/person)
Strata Adoption rate (%)
base (no adoption)
% Change on
population
% Change
on adopters
base (no adoption)
% Change on
population
% Change
on adopters
base (no adoption)
% Change on
population
% Change
on adopters
ZOMBA 49.22 112.47 54.60% 135.62% 87.50 -15.81% -42.48% 1.41 12.86% 38.95%
MWANZA 49.40 89.01 50.77% 137.61% 99.16 -16.01% -51.88% 1.94 0.30% 10.64%
MULANJE 40.81 81.01 54.46% 179.51% 84.30 -11.38% -44.26% 0.65 53.10% 191.35%
THYOLO 41.92 170.85 41.85% 116.92% 95.93 -16.48% -56.11% 1.75 -0.49% 28.63%
MANGOCHI 37.95 188.62 30.77% 116.63% 72.24 -10.53% -53.66% 0.77 56.42% 178.33%
REGION 44.49 123.90 45.23% 132.70% 87.11 -11.25% -30.45% 1.29 15.32% 59.00% 1
Summary: Impacts of IAA Adoption on Farm Population and IAA Adopters

Conclusions• TOA-MD is a unique simulation tool for multi-dimensional impact assessment of agriculture and aquaculture systems• The Malawi case study illustrates how it can be used with available data to simulate:
• the adoption rate of a new technology• the economic, environmental or social impacts of the new technology
• The model can also be used for analysis of ecosystem services, and impacts of climate change and other environmental change• Training in use of the model, and the model software are available from the TOA Team.
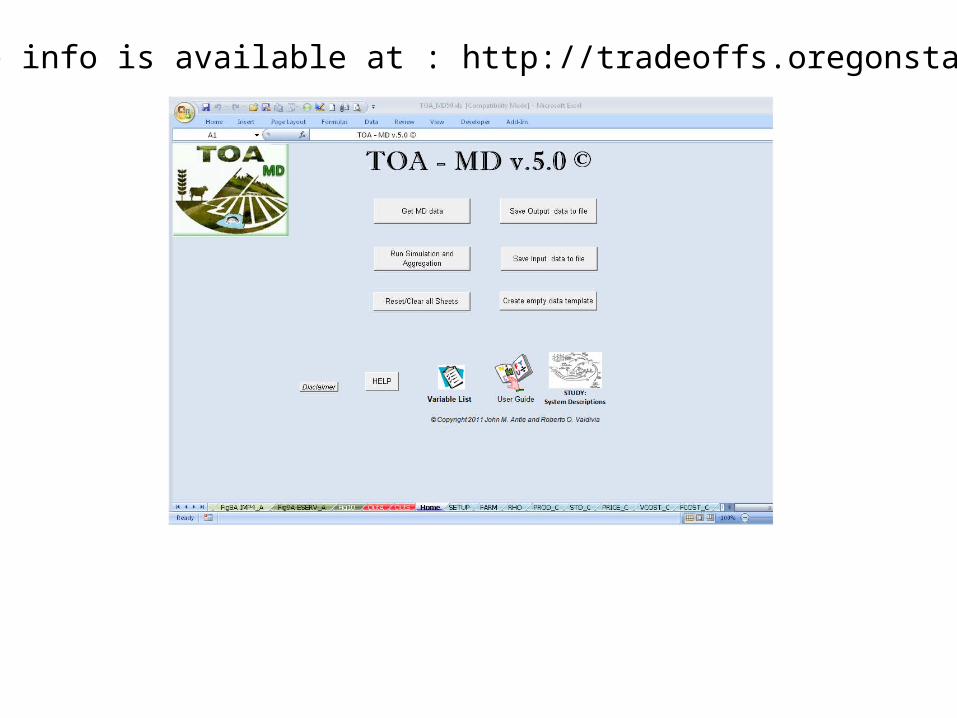
• More info is available at : http://tradeoffs.oregonstate.edu