an introduction in the trade-off analysis j.j. stoorvogel, j. antle, c. crissman
TRANSCRIPT

An introduction in the Trade-off analysis
J.J. Stoorvogel, J. Antle, C. Crissman
Economic indicators
Social indicators
Environmental indicators
Health indicators
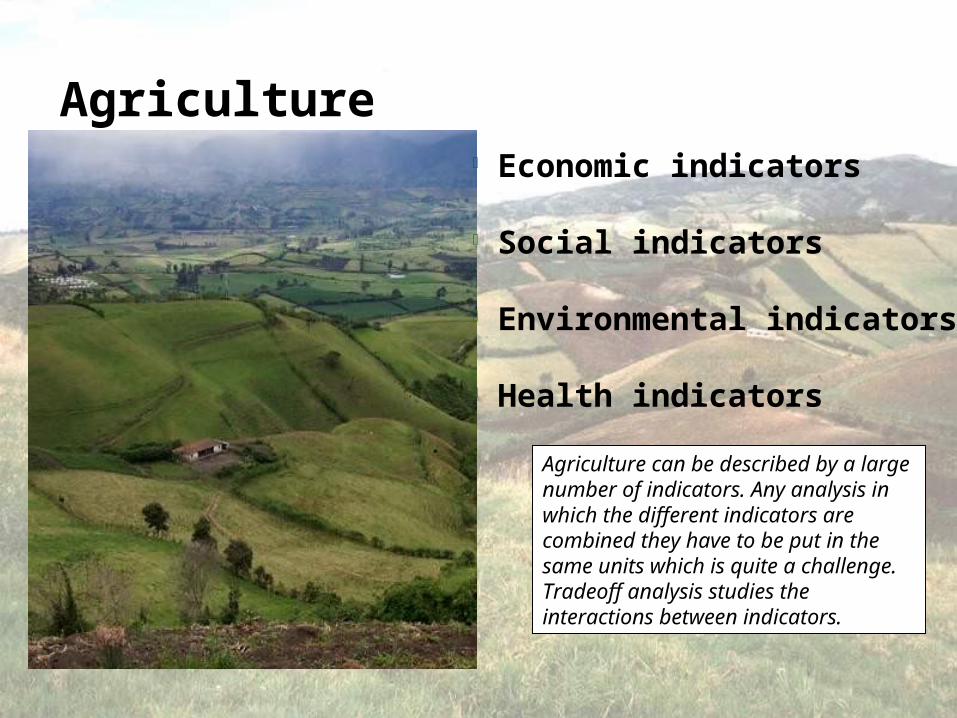
Agriculture
Agriculture can be described by a large number of indicators. Any analysis in which the different indicators are combined they have to be put in the same units which is quite a challenge. Tradeoff analysis studies the interactions between indicators.
Agriculture
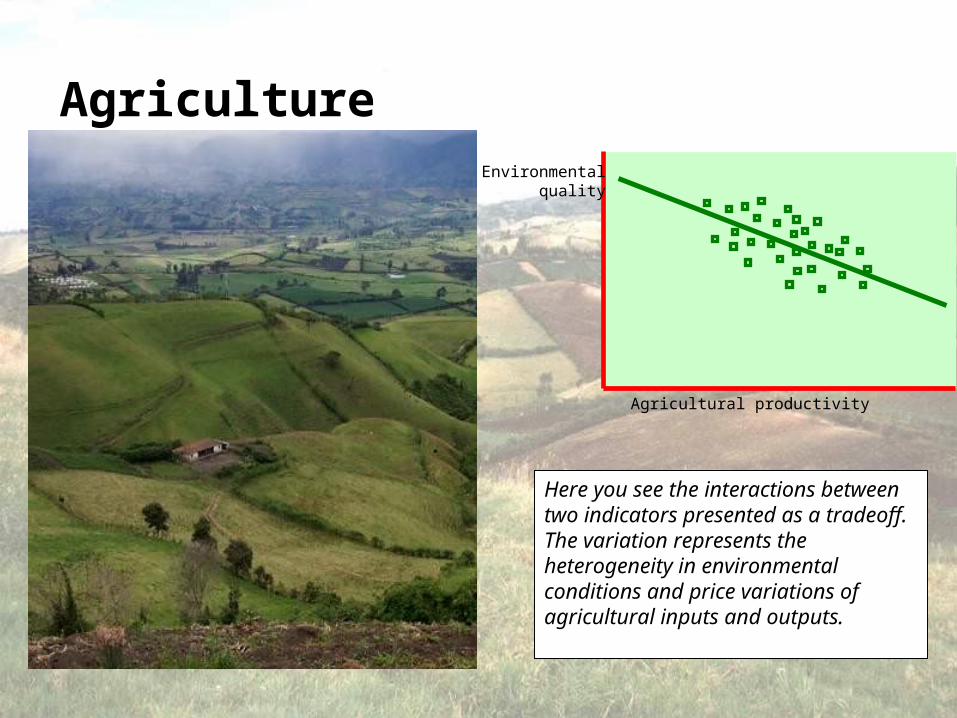
Here you see the interactions between two indicators presented as a tradeoff. The variation represents the heterogeneity in environmental conditions and price variations of agricultural inputs and outputs.
Environmentalquality
Agricultural productivity
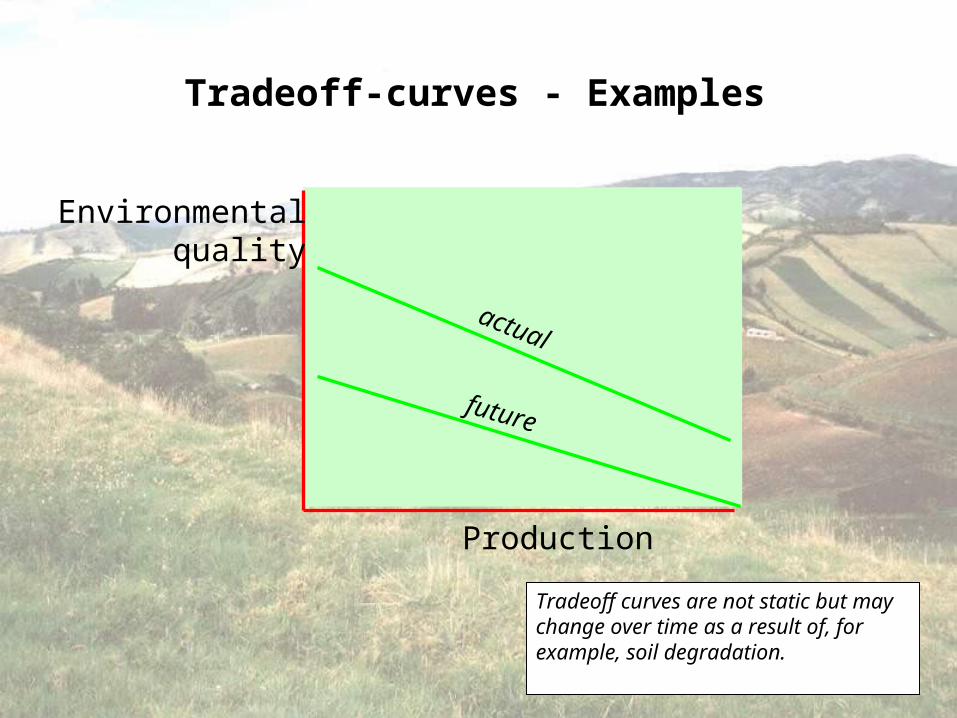
Production
Environmentalquality
actual
future
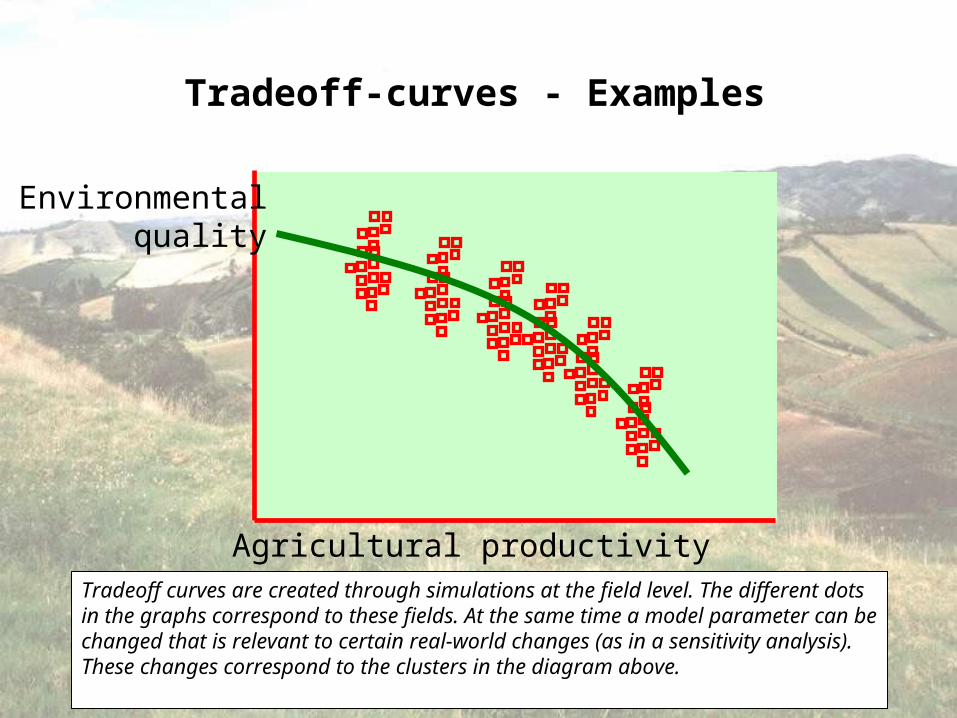
Tradeoff-curves - Examples
Tradeoff curves are not static but may change over time as a result of, for example, soil degradation.
Environmentalquality
Agricultural productivity
Tradeoff-curves - Examples
Tradeoff curves are created through simulations at the field level. The different dots in the graphs correspond to these fields. At the same time a model parameter can be changed that is relevant to certain real-world changes (as in a sensitivity analysis). These changes correspond to the clusters in the diagram above.
Current productivity
Futureproductivity
1:1
Tradeoff-curves - Examples
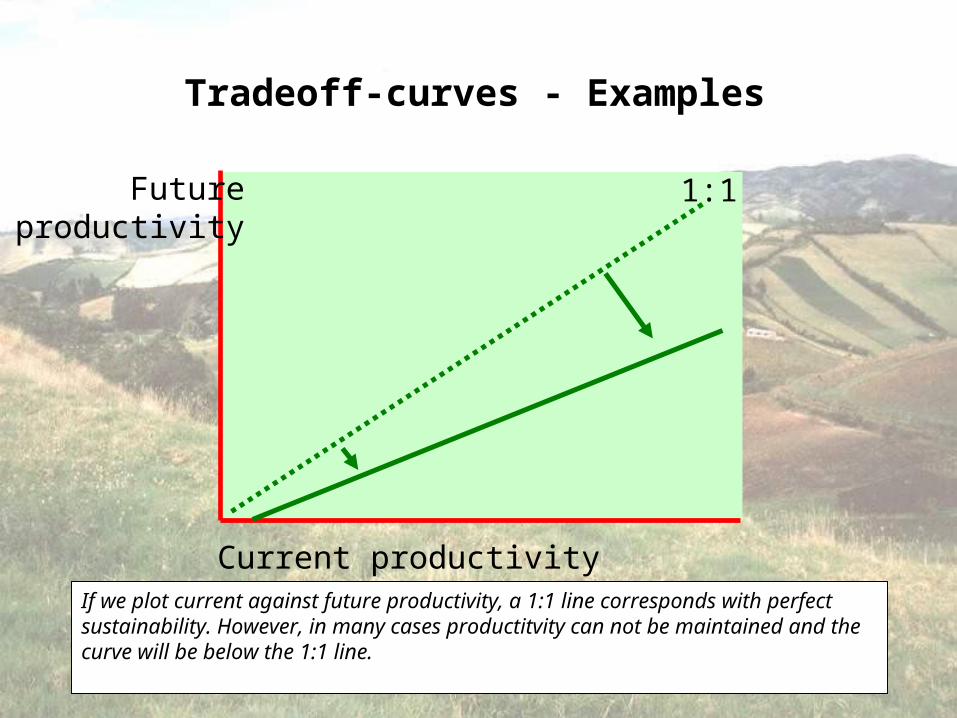
If we plot current against future productivity, a 1:1 line corresponds with perfect sustainability. However, in many cases productitvity can not be maintained and the curve will be below the 1:1 line.
Current productivity
Futureproductivity
Tradeoff-curves - Examples
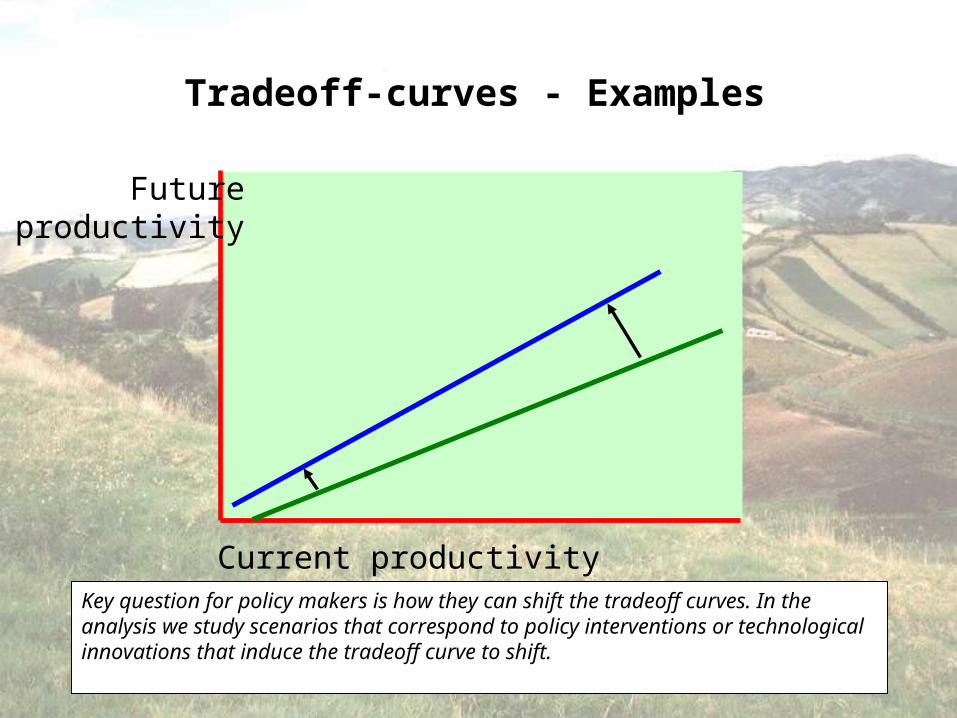
Key question for policy makers is how they can shift the tradeoff curves. In the analysis we study scenarios that correspond to policy interventions or technological innovations that induce the tradeoff curve to shift.
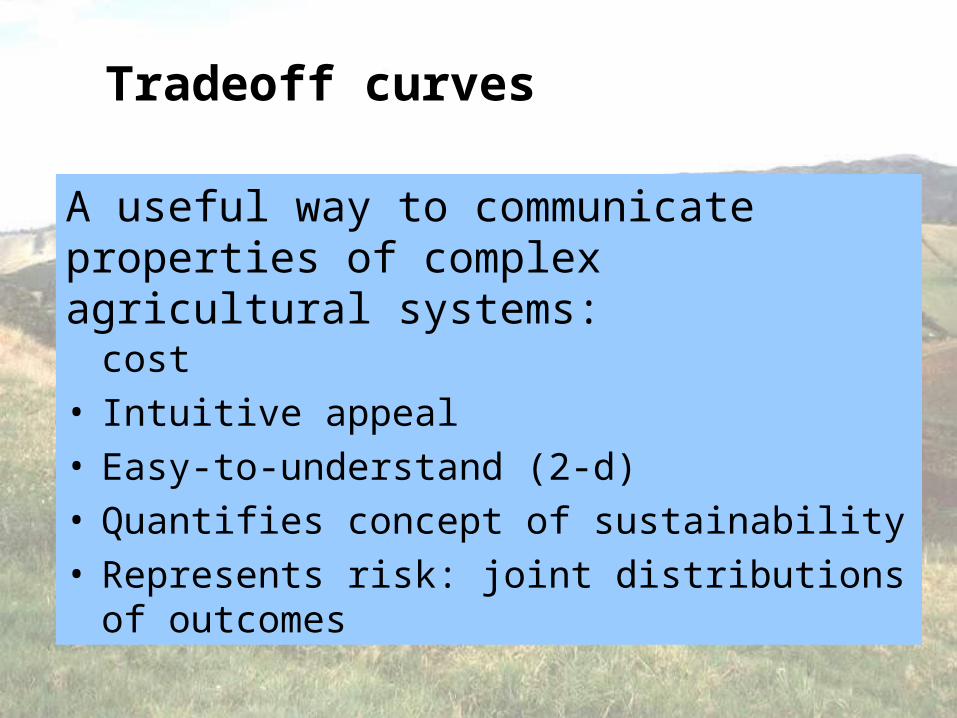
• Economic principle of opportunity cost• Intuitive appeal• Easy-to-understand (2-d)• Quantifies concept of sustainability• Represents risk: joint distributions of outcomes
A useful way to communicate properties of complex agricultural systems:
Tradeoff curves
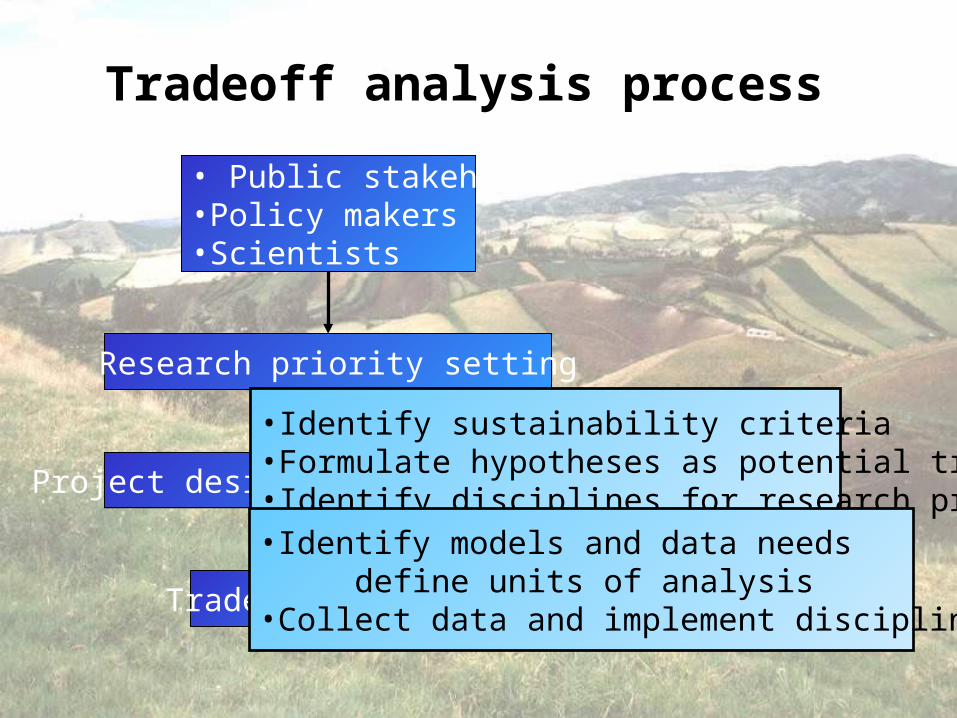
• Public stakeholders•Policy makers•Scientists
Research priority setting
Project design & implementation
Tradeoff analysis
•Identify sustainability criteria•Formulate hypotheses as potential tradeoffs•Identify disciplines for research project•Identify models and data needs
define units of analysis•Collect data and implement disciplinary research
Tradeoff analysis process
Soil erosion
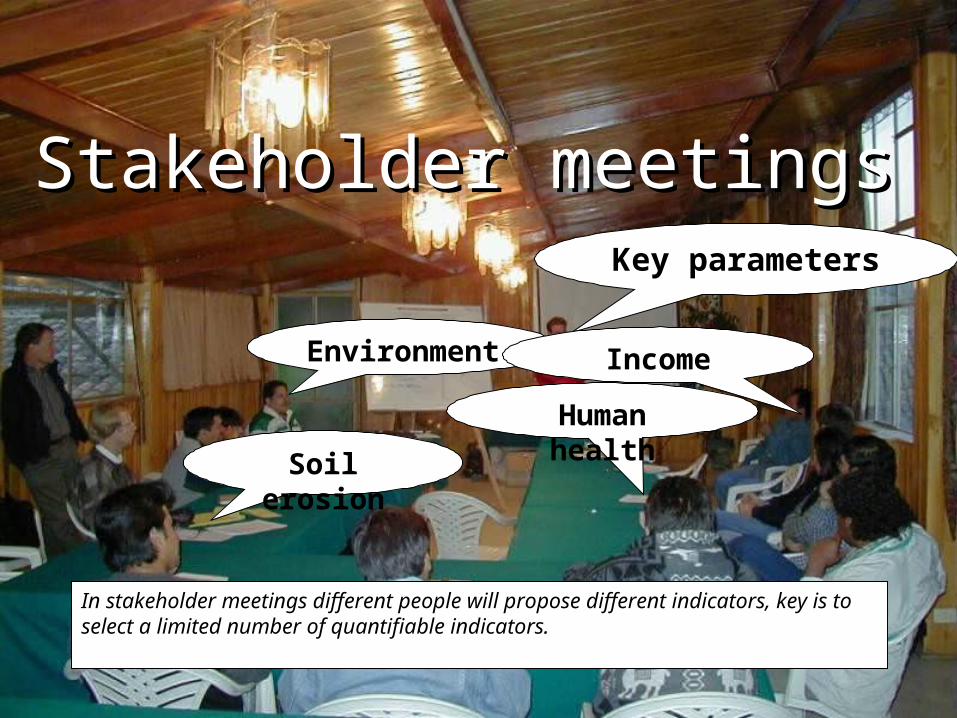
Stakeholder meetingsStakeholder meetingsKey parameters
Human health
Environment Income
In stakeholder meetings different people will propose different indicators, key is to select a limited number of quantifiable indicators.
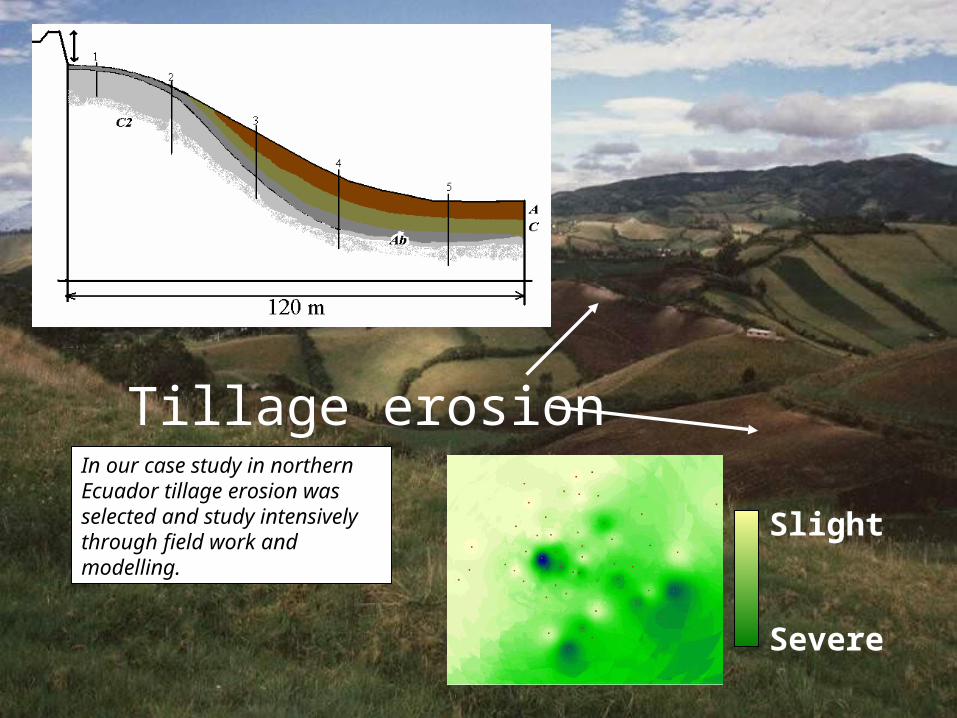
Tillage erosion
Slight
Severe
In our case study in northern Ecuador tillage erosion was selected and study intensively through field work and modelling.
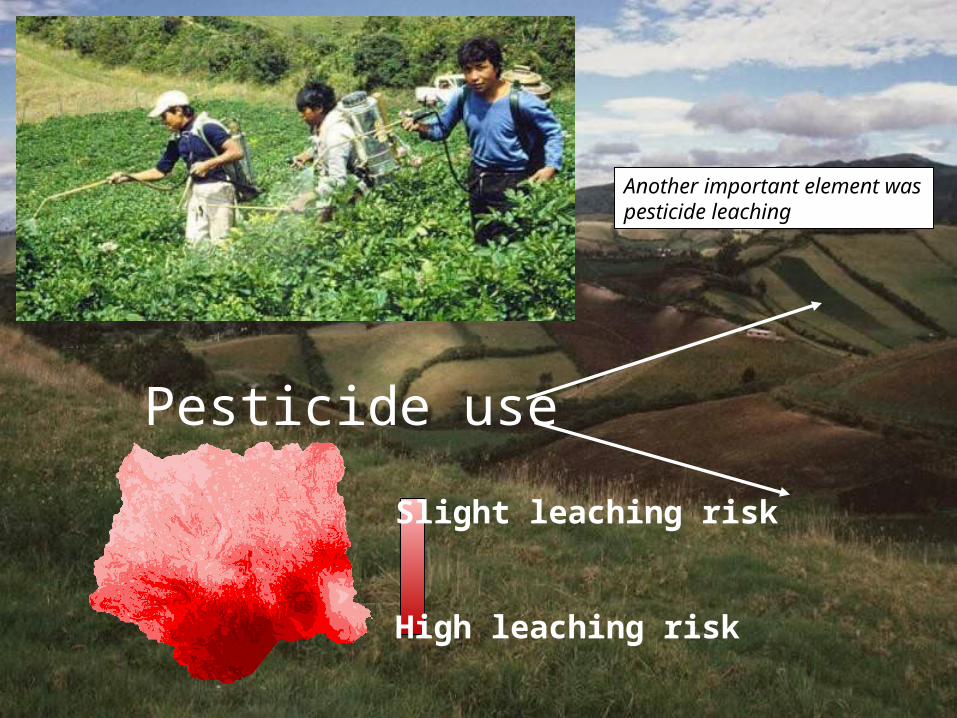
Pesticide use
Slight leaching risk
High leaching risk
Another important element was pesticide leaching
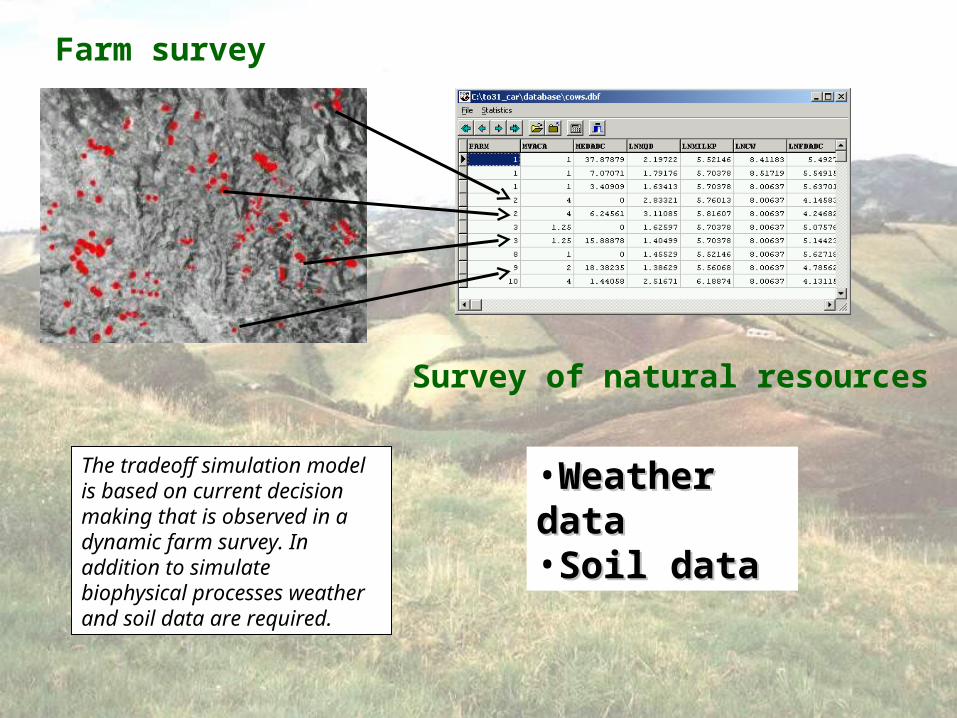
Farm survey
Survey of natural resources
•Weather dataWeather data•Soil dataSoil data
The tradeoff simulation model is based on current decision making that is observed in a dynamic farm survey. In addition to simulate biophysical processes weather and soil data are required.
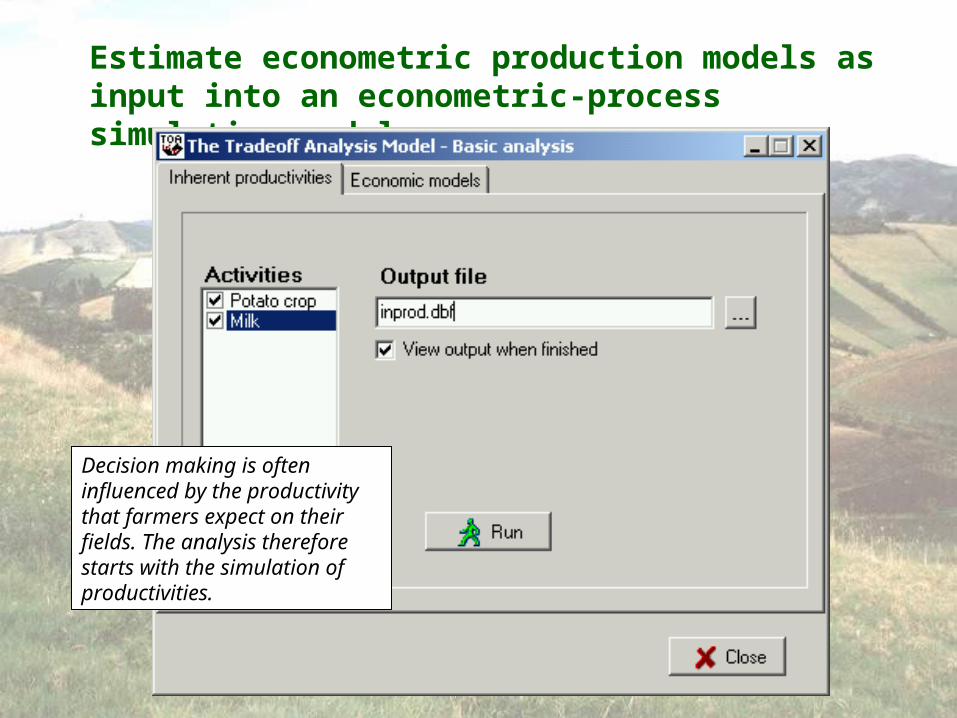
Estimate econometric production models as input into an econometric-process simulation model
Decision making is often influenced by the productivity that farmers expect on their fields. The analysis therefore starts with the simulation of productivities.
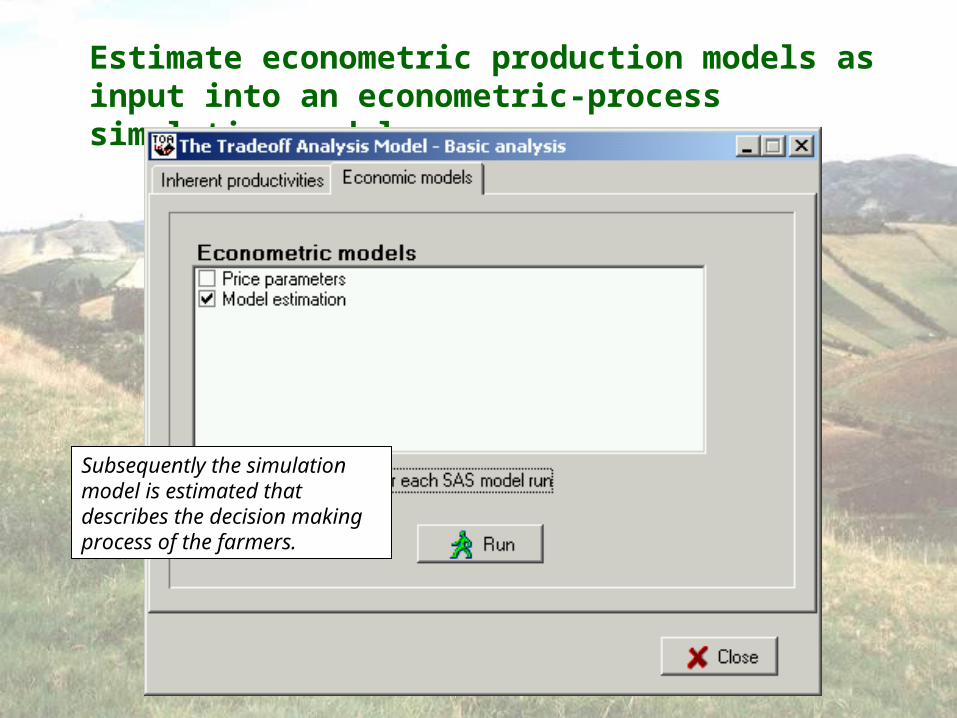
Estimate econometric production models as input into an econometric-process simulation model
Subsequently the simulation model is estimated that describes the decision making process of the farmers.
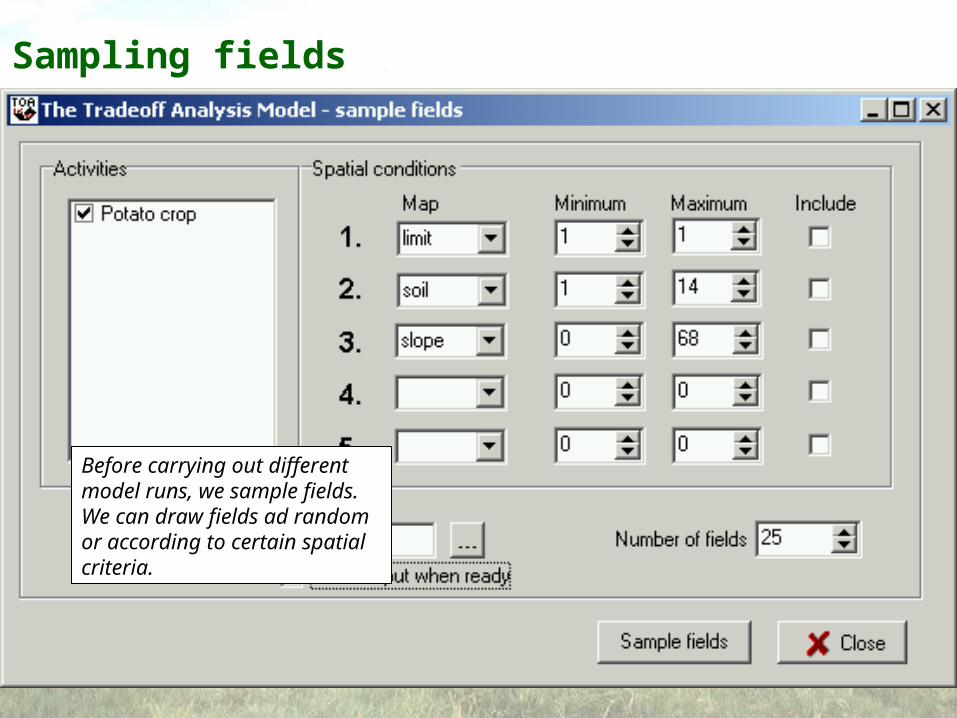
Sampling fields
Before carrying out different model runs, we sample fields. We can draw fields ad random or according to certain spatial criteria.
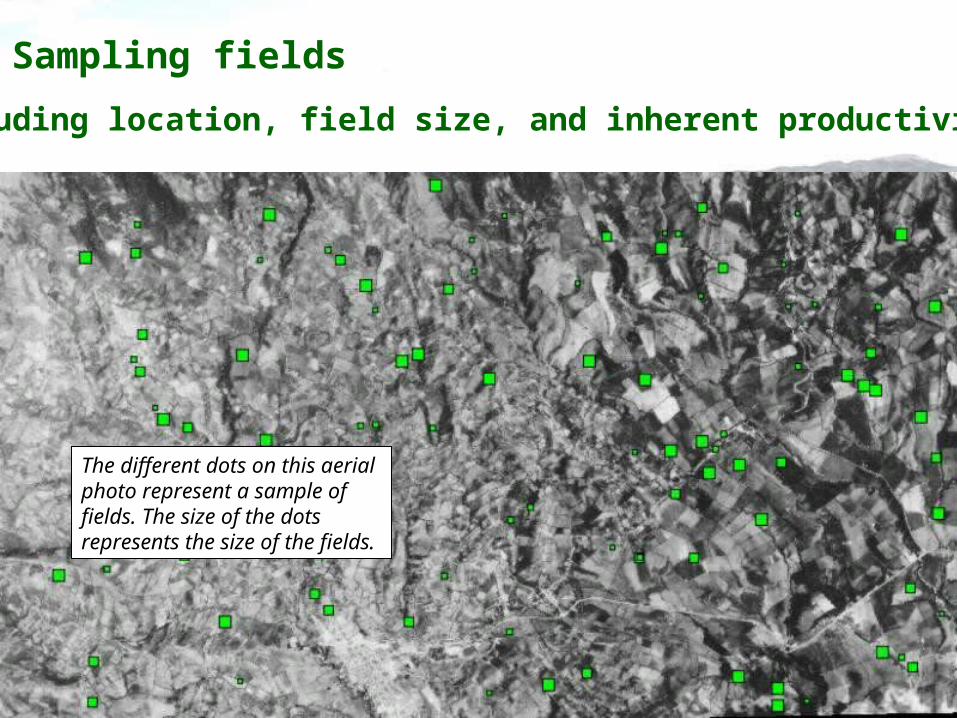
Sampling fields
Including location, field size, and inherent productivity
The different dots on this aerial photo represent a sample of fields. The size of the dots represents the size of the fields.
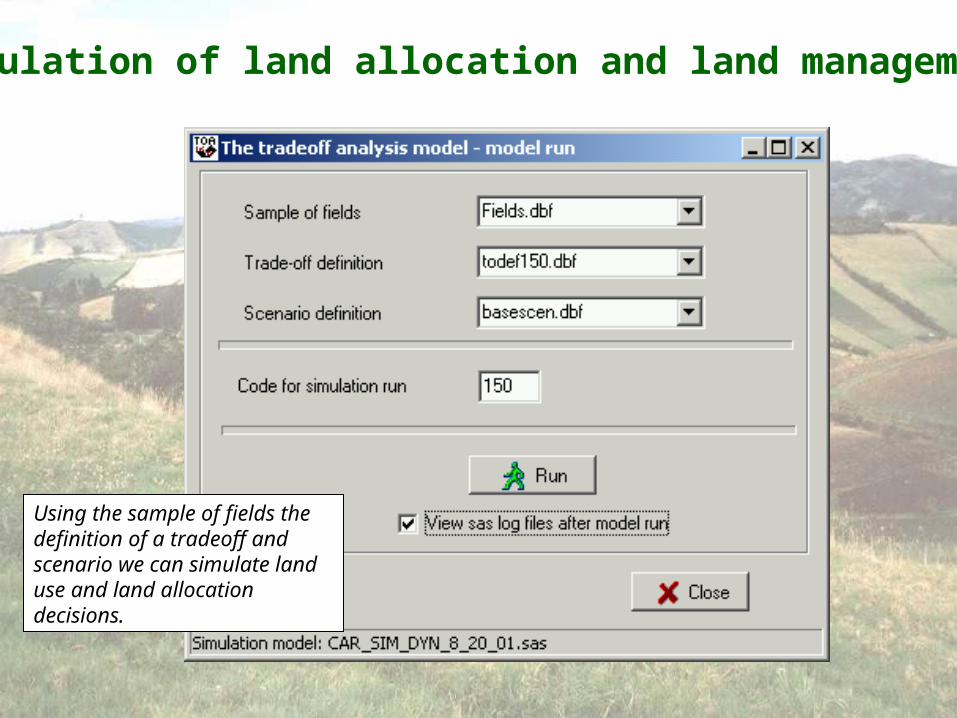
Simulation of land allocation and land management
Using the sample of fields the definition of a tradeoff and scenario we can simulate land use and land allocation decisions.
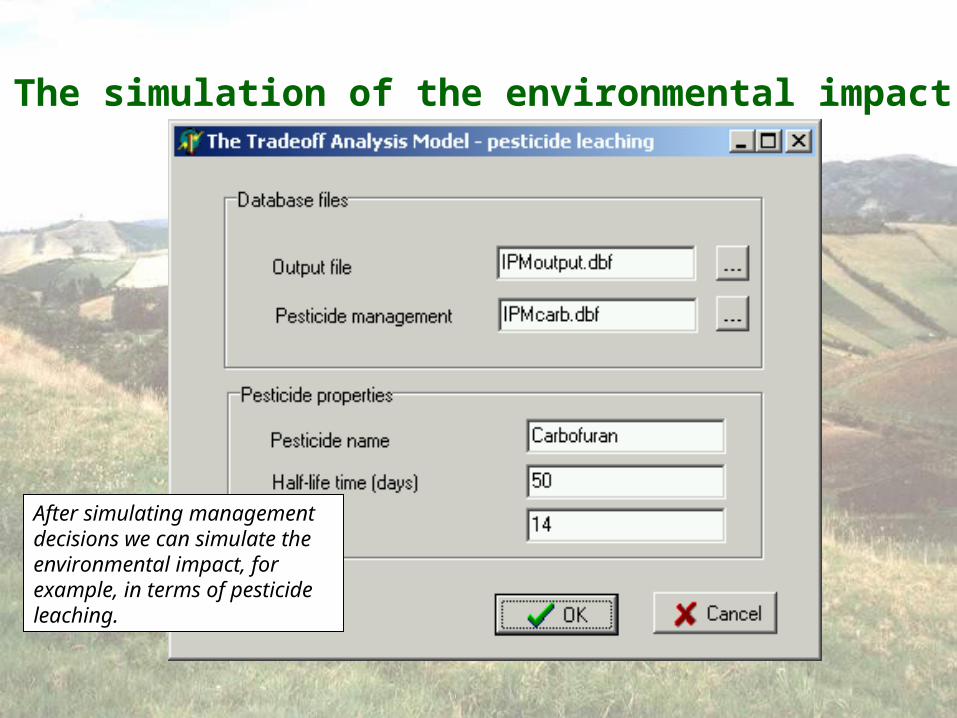
The simulation of the environmental impact
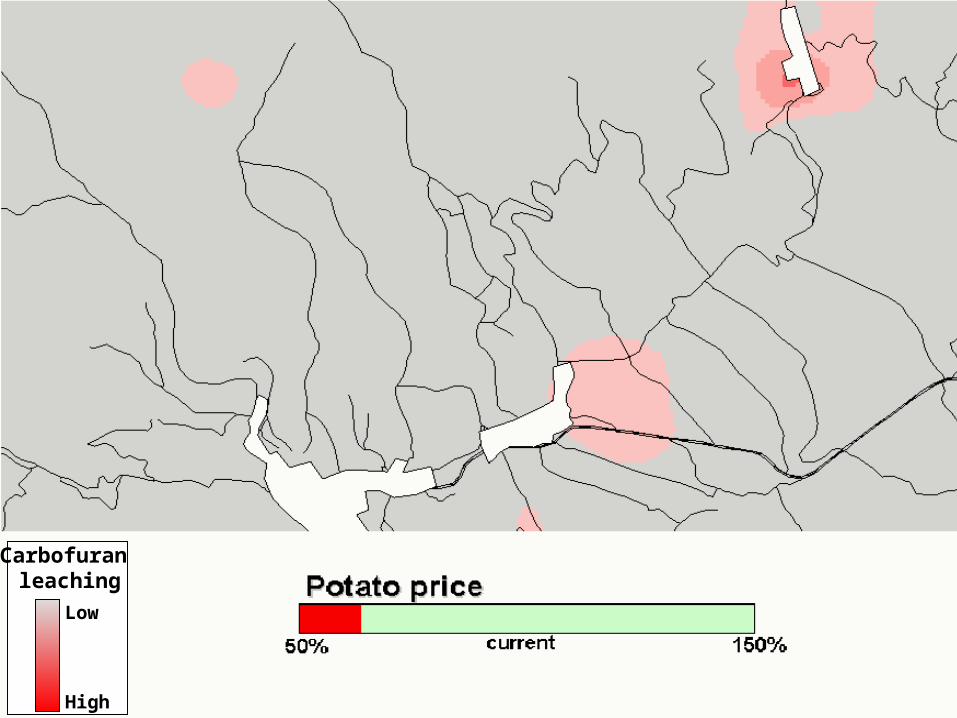
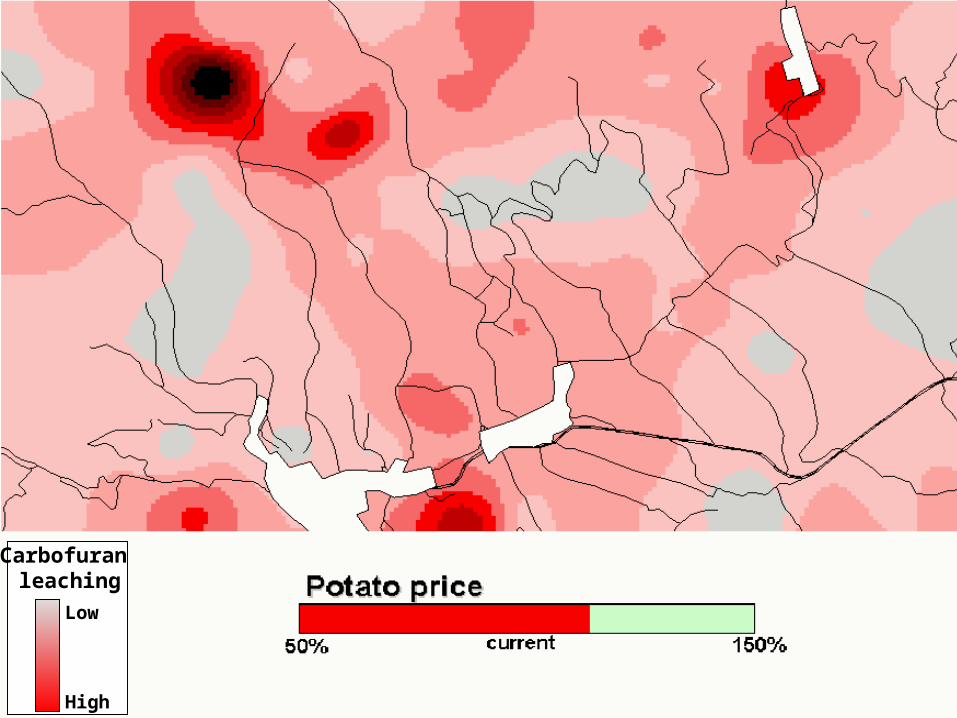
After simulating management decisions we can simulate the environmental impact, for example, in terms of pesticide leaching.
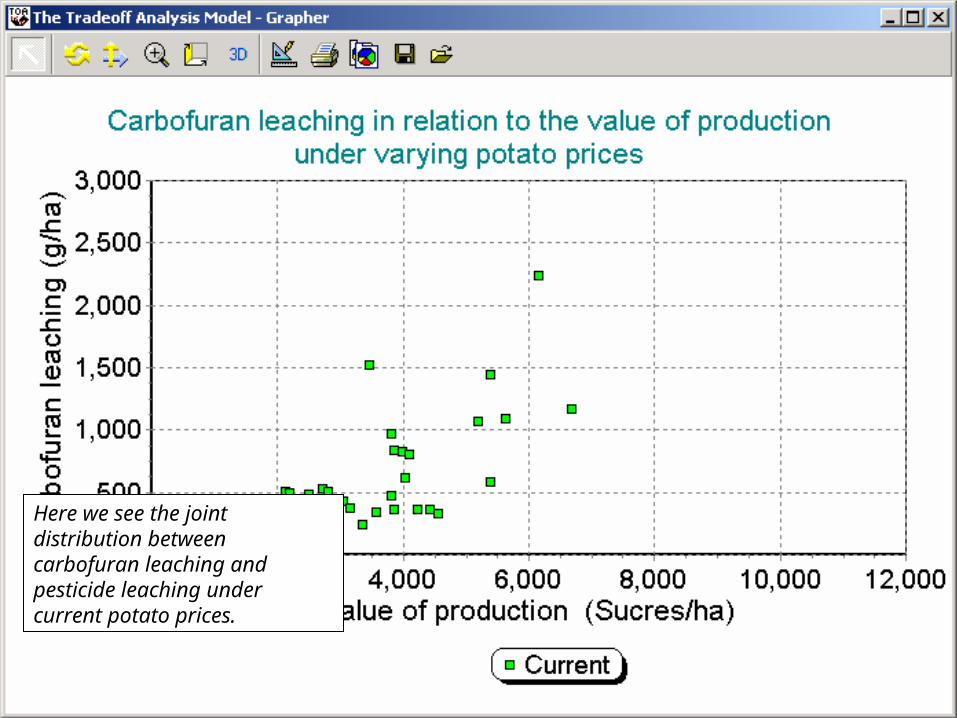
Here we see the joint distribution between carbofuran leaching and pesticide leaching under current potato prices.
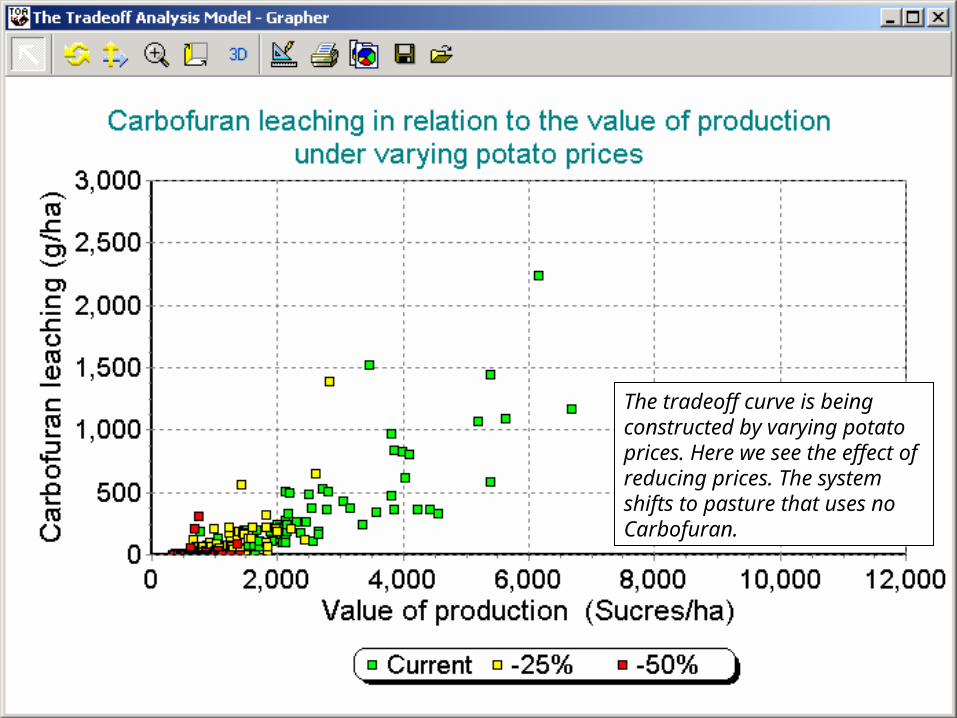
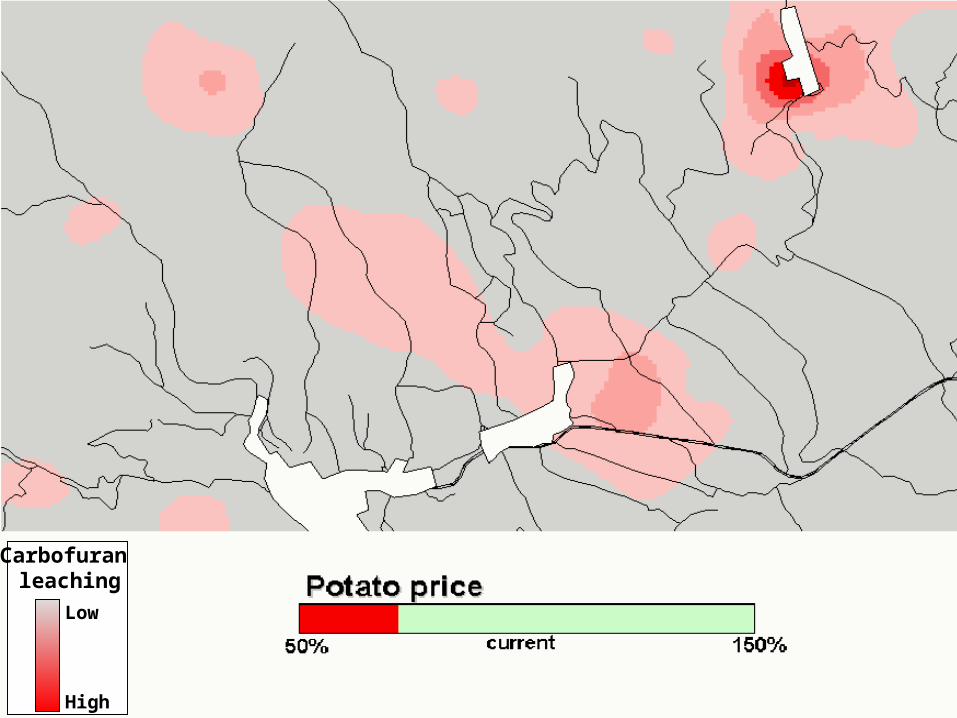
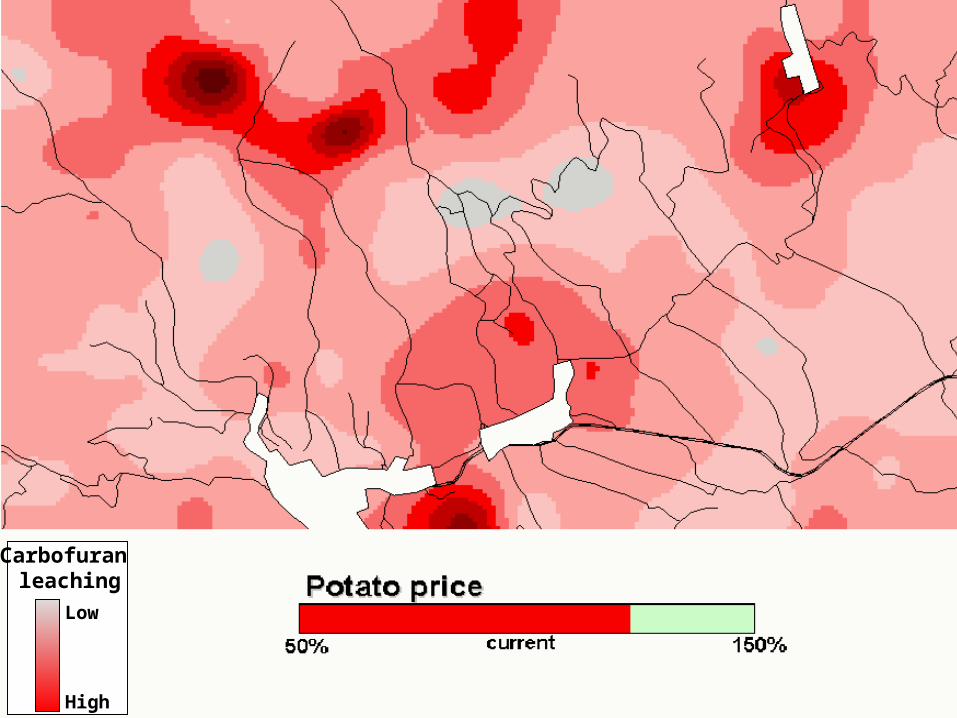
The tradeoff curve is being constructed by varying potato prices. Here we see the effect of reducing prices. The system shifts to pasture that uses no Carbofuran.
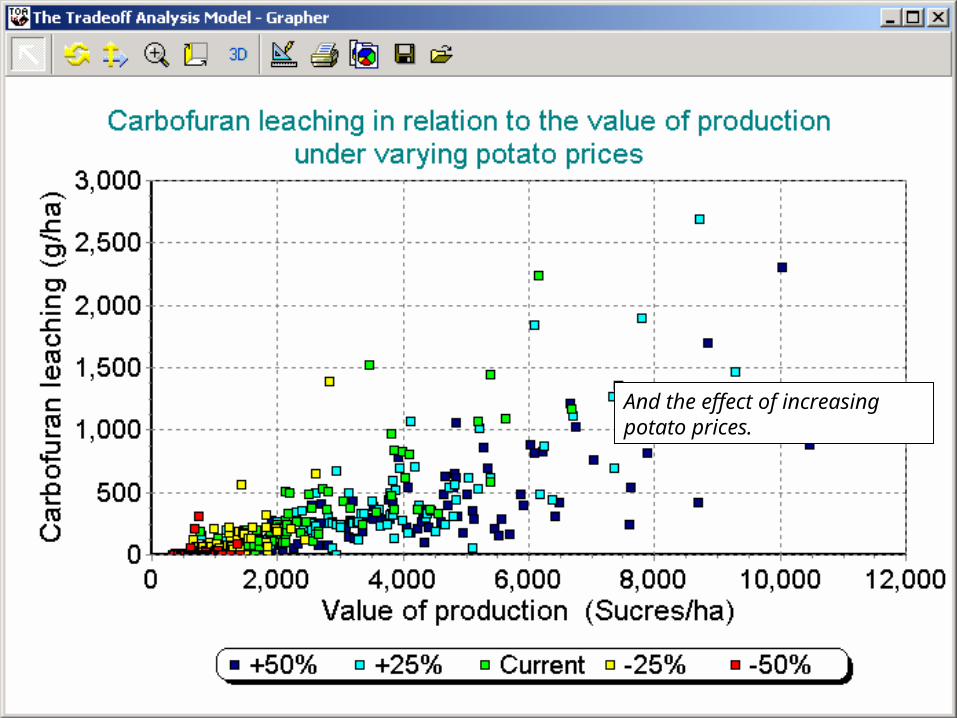
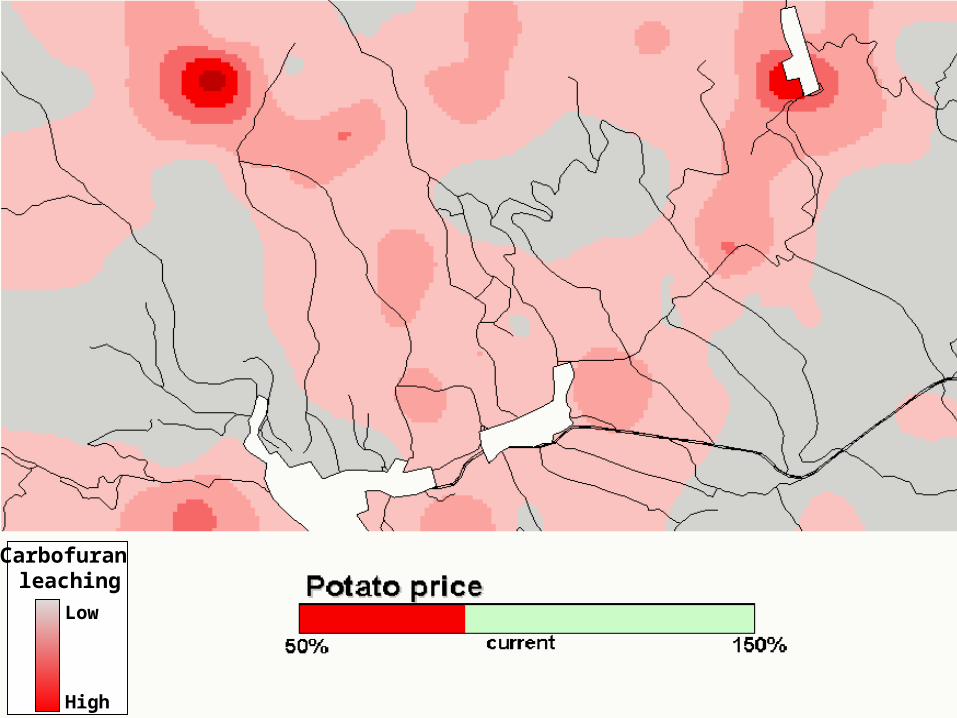
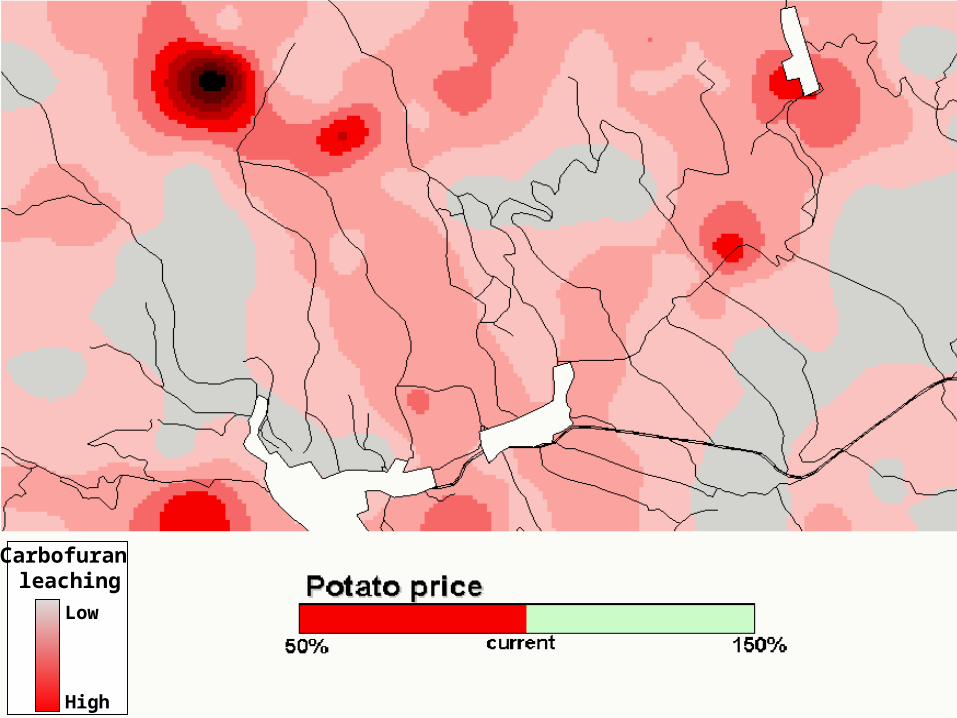
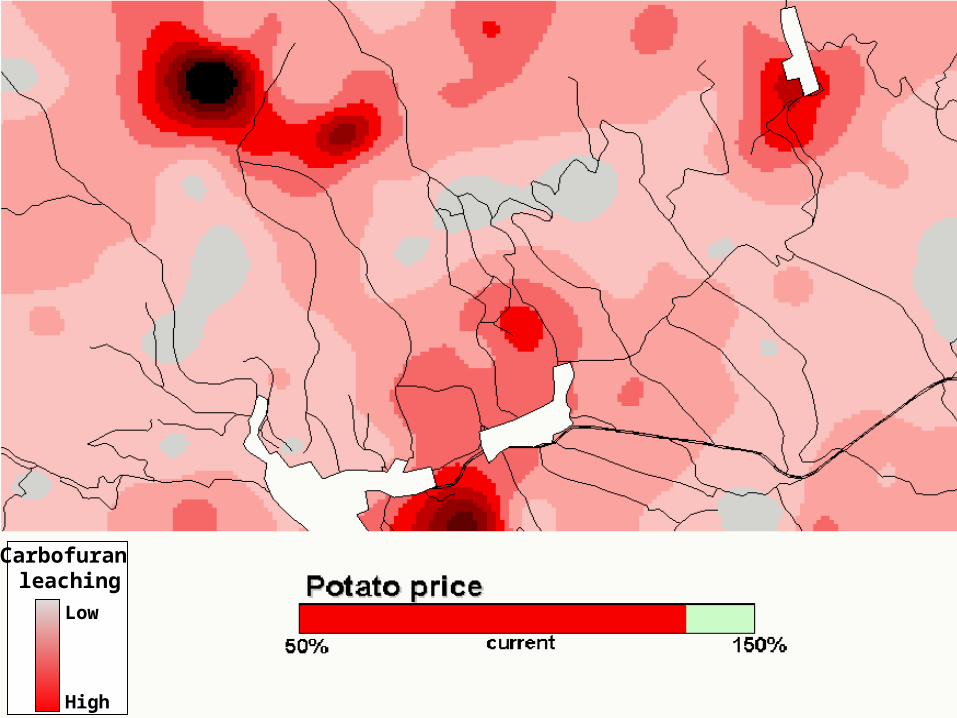
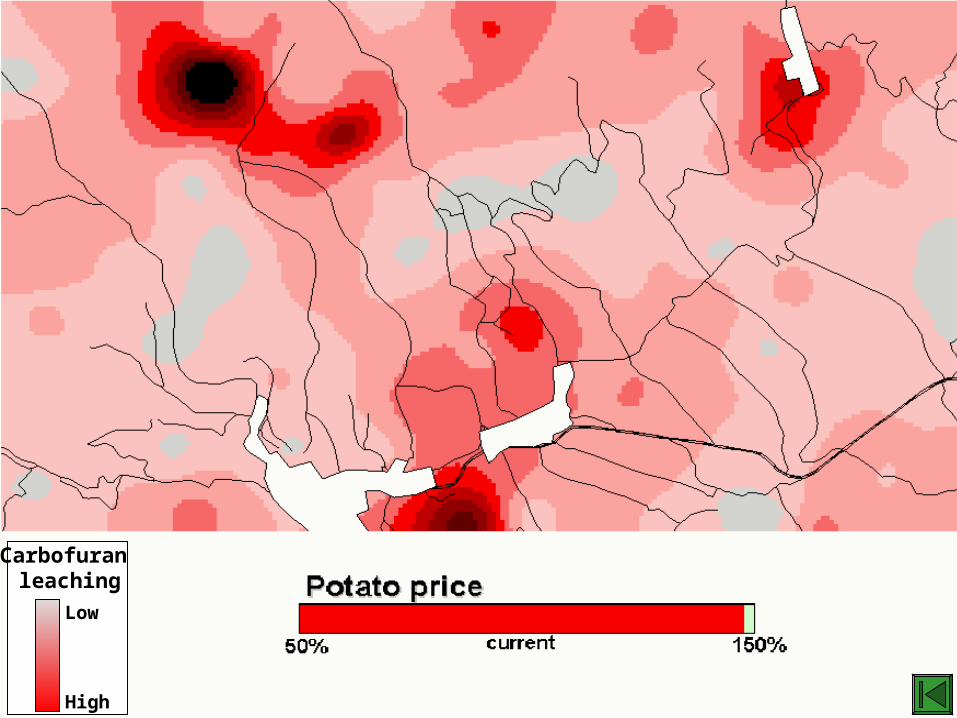
And the effect of increasing potato prices.
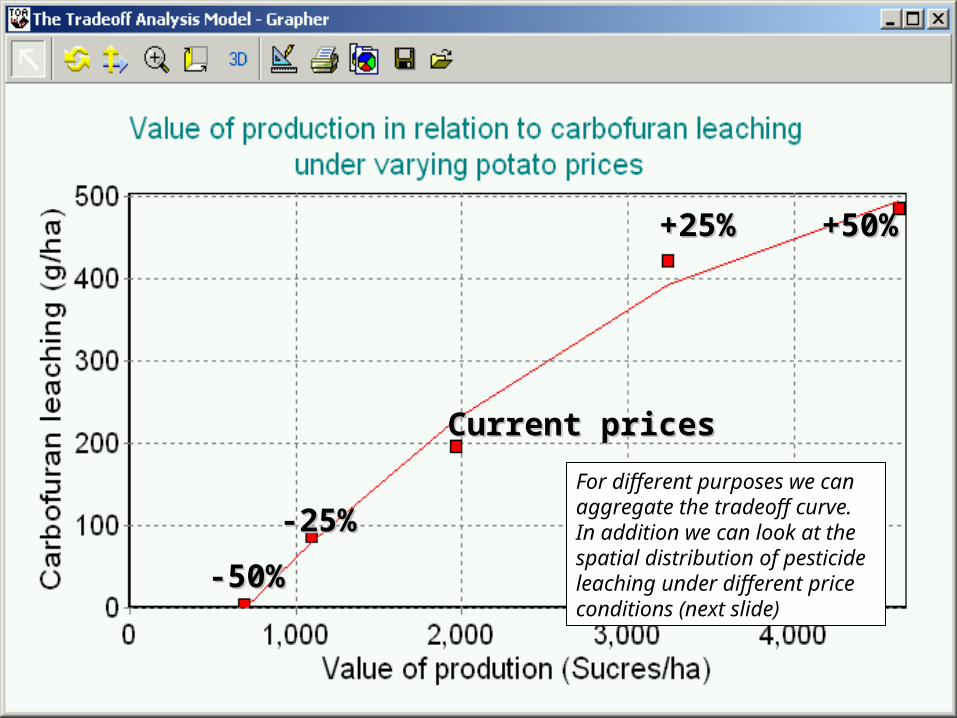
Current pricesCurrent prices
-25%-25%
-50%-50%
+25%+25% +50% +50%
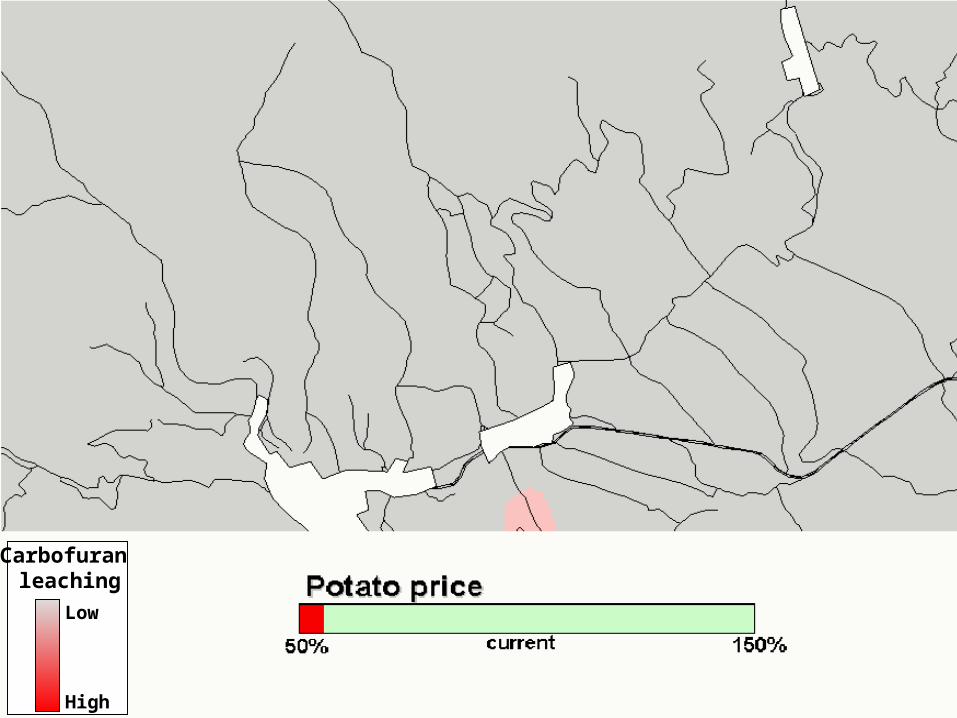
For different purposes we can aggregate the tradeoff curve. In addition we can look at the spatial distribution of pesticide leaching under different price conditions (next slide)
Carbofuran leaching
Low
High
Carbofuran leaching
Low
High
Carbofuran leaching
Low
High
Carbofuran leaching
Low
High
Carbofuran leaching
Low
High
Carbofuran leaching
Low
High
Carbofuran leaching
Low
High
Carbofuran leaching
Low
High
Carbofuran leaching
Low
High
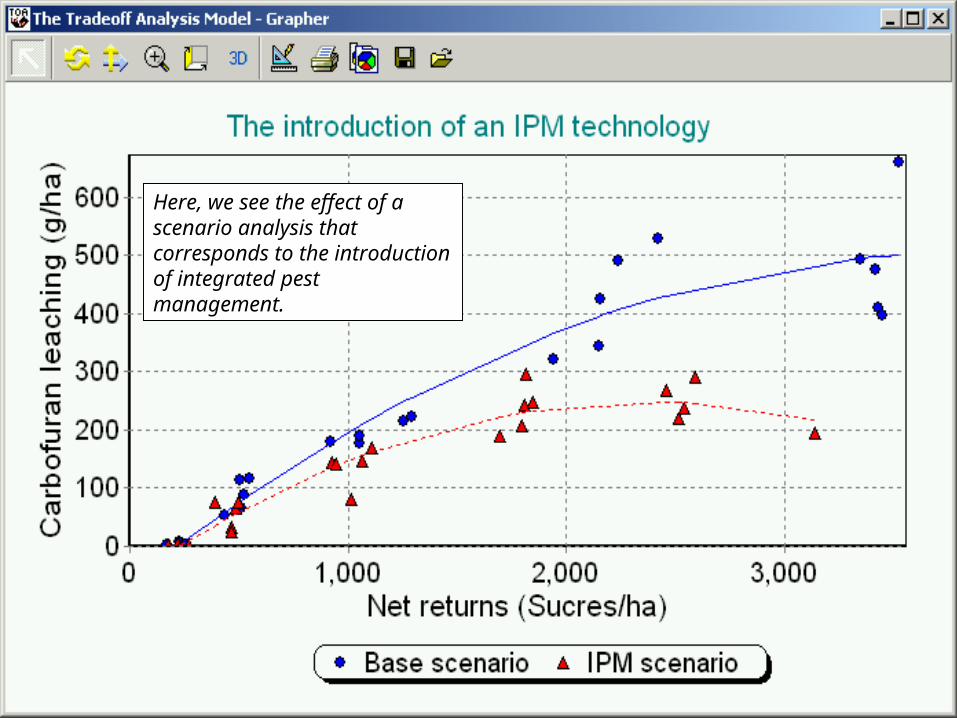
Here, we see the effect of a scenario analysis that corresponds to the introduction of integrated pest management.
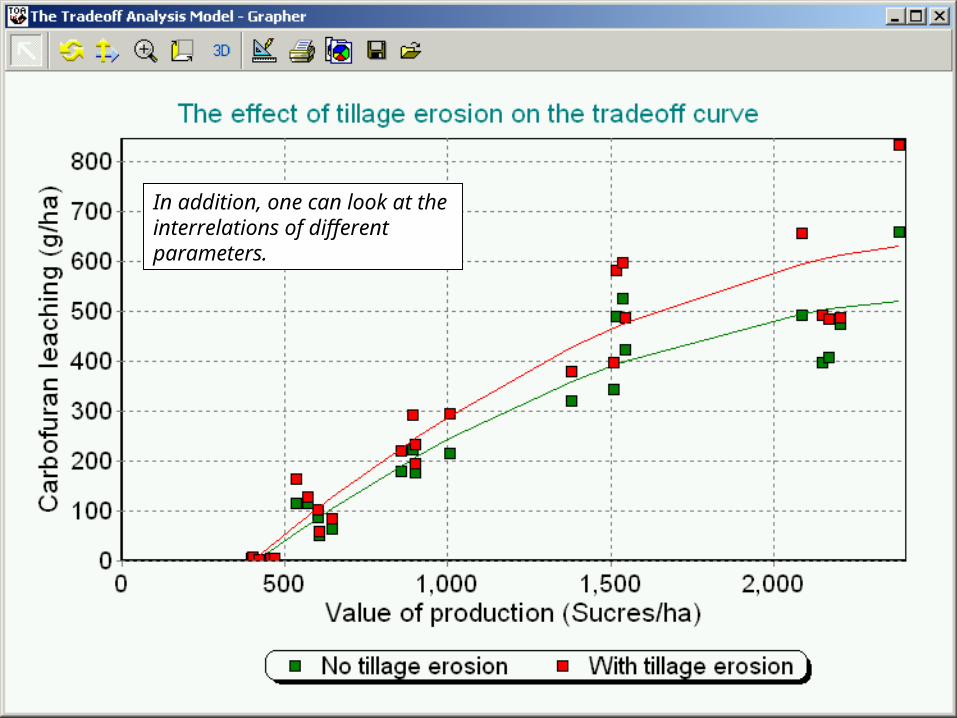
In addition, one can look at the interrelations of different parameters.
0.0
25.0
50.0
75.0
100.0
0 250 500 750 1000 1250 1500
Carbofuran leaching (g/ha)
Cu
mu
lati
ve p
rob
abil
ity
(%)
+50%
+25%
Observed prices
-25%
-50%
EPA limit
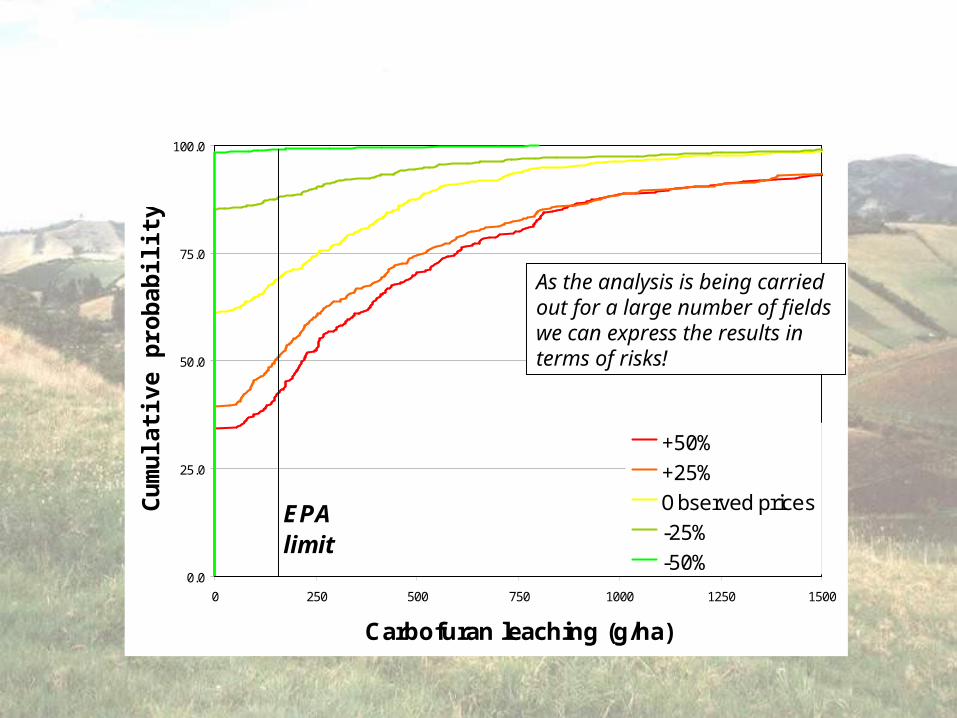
As the analysis is being carried out for a large number of fields we can express the results in terms of risks!
IFDC
The Tradeoff Analysis Model© is a GIS-based system designed to integrate disciplinary data and
models to implement the Tradeoff Analysis approach.
http://www.tradeoffs.montana.eduhttp://www.tradeoffs.nl