methods to achieve large scale change - clinical metrics ... · methods to achieve large scale...
TRANSCRIPT

Alberta’s Strategic Clinical Networks
Methods to Achieve Large Scale Change - Clinical Metrics and Spread to Scale
October 26th, 2015
Presenters: Ms. Tracy Wasylak & Dr. Blair O’Neil
Senior Program Officer & ACMO Strategic Clinical Networks Alberta Health Services

2
Disclosures
•Dr. Blair O’Neill and Ms. Tracy Wasylak, do not have any disclosures or conflicts of interest.
3
Outline • Background • Challenge • Teams • Approach & Objectives • Components • Results • Questions

4
Healthcare in Alberta: The Need for Balance
Patients
Quality all dimensions
Sustainability value for money
Access appropriate and
equitable
Providing care improving the
experience

5
What are Strategic Clinical Networks? • Collaborative provincial clinical groups
– Hosted by Alberta Health Services • Focused on stages of life, diseases/conditions, areas of care
in order to – Improve patient outcomes and satisfaction – Increase access and quality – Build a health care system that is sustainable
2012: Addictions & Mental Health, Bone & Joint, Cancer, Cardiovascular Health & Stroke, Diabetes Obesity & Nutrition, Seniors Health 2013: Critical Care, Emergency, Surgery 2014: Respiratory Health 2015: Maternal Newborn Child & Youth Future: Kidney Health, Primary Health Care, Population, Public & Aboriginal Health

6
Strategic Clinical Networks in Alberta Goal To achieve a sustainable health care system that creates the healthiest population and best health outcomes in Canada Target 100% of Albertans are impacted positively by SCN priorities and plans – with evidence

Scope of SCNs Beyond AHS to involve the whole healthcare system… • Patients & families • Physicians, nurses, allied health • Researchers, institutions,
foundations • Primary care/PCNs • Operational areas, administrators • Government • Not-for-profit and community
groups
8
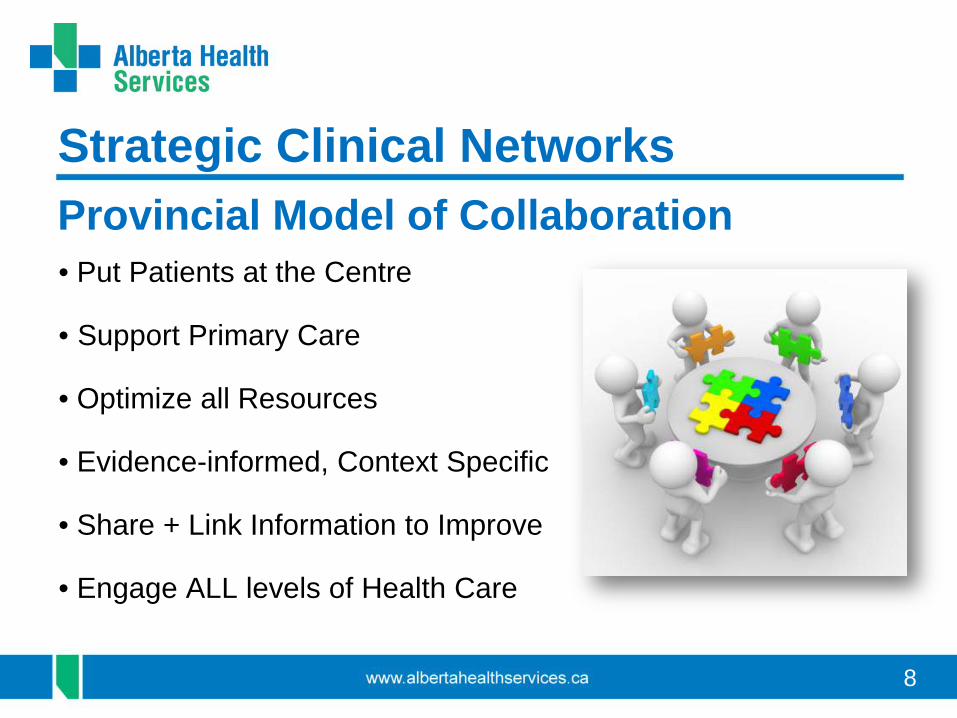
Strategic Clinical Networks Provincial Model of Collaboration • Put Patients at the Centre • Support Primary Care • Optimize all Resources • Evidence-informed, Context Specific • Share + Link Information to Improve
• Engage ALL levels of Health Care

SCNs Use a Common Quality Definition and measure one or more of six dimensions to improve

SCN IMPACTS
Stroke Action Plan - 14 sites Hip & Knee Plan - 12 sites Insulin Pump Program - 11 centers Vascular Risk Reduction Fragility & Stability - 12 Sites Appropriate Use of Antipsychotics Empathy - All Schools in Red Deer E-Referral Lung / Hip & Knee Safe Surgery Checklist - 59 sites Enhanced Recovery After Surgery - 6 Sites
Over 7000 staff and clinicians involved across
5 Zones & Partner Organizations

11
SCNs Further Value-Adds to the System • Internal Experts and Consultants
– AACHT – CVH&S: Cardiac Surgery Wait Times – CVH&S: Expansion of Advanced Cardiac Services – Provincial Surgery Plan – MNCY: Value of Fetal Fibronectin – Province-wide Policies (Seniors, CC, ER, Surgery)
• Innovation and Commercialization (with AIHS) – Alberta SMEs and TEC Edmonton – MEDEC/SCN partnership discussions – RX&D/SCN partnership discussions
12
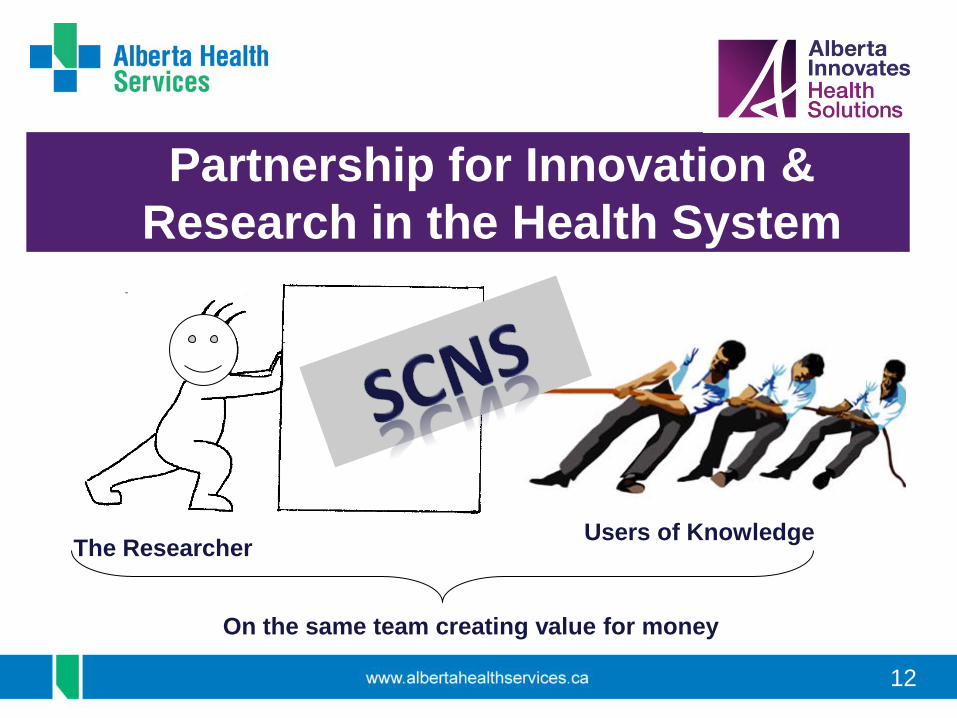
Partnership for Innovation & Research in the Health System
The Researcher
New Knowledge
Users of Knowledge
On the same team creating value for money

13
14
Collaborative Learning
The most intensive front-line improvement work happens in Collaboratives. These 12-month programs are designed for organizations committed to achieving sustainable change within a specific topic area. Through shared learning, teams from a variety of organizations work with each other and faculty to rapidly test and implement changes that lead to lasting improvement. (From Institute of Healthcare Improvement)
15
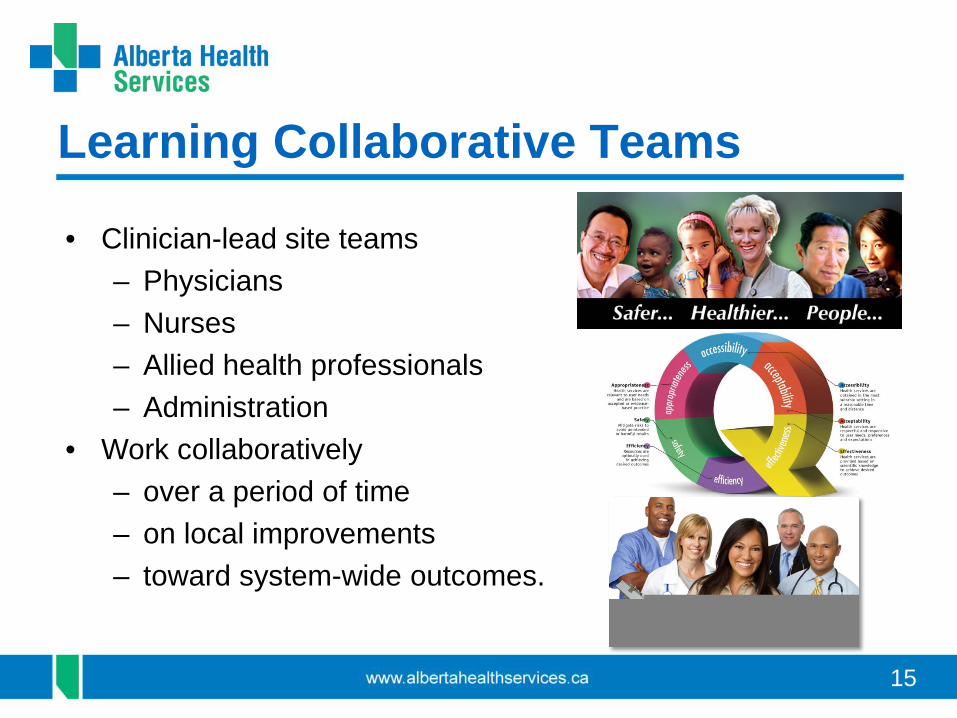
Learning Collaborative Teams
• Clinician-lead site teams – Physicians – Nurses – Allied health professionals – Administration
• Work collaboratively – over a period of time – on local improvements – toward system-wide outcomes.
16
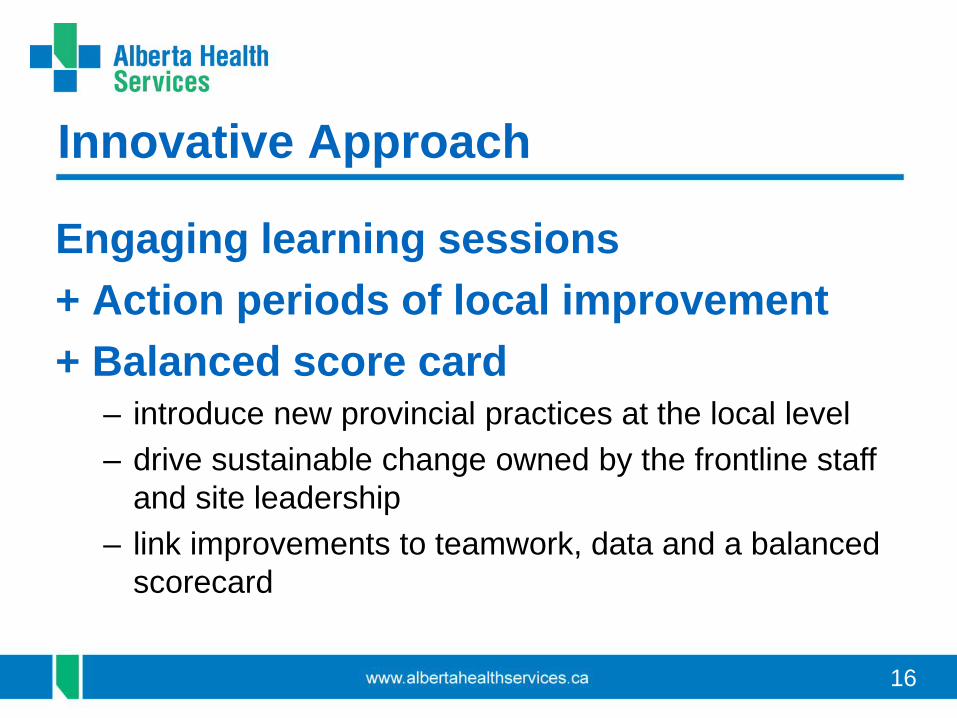
Innovative Approach
Engaging learning sessions + Action periods of local improvement + Balanced score card
– introduce new provincial practices at the local level – drive sustainable change owned by the frontline staff
and site leadership – link improvements to teamwork, data and a balanced
scorecard

There is a ‘formula’ that can help you set priorities
$$$$
To Eliminating Waste Focus first on Appropriateness, Safety and Efficiency

18
A step toward sustainability eliminate waste and reinvest to improve
16 000 bed days
$12 000 000

What are we trying to accomplish?
How will we know that a change is an improvement?
What change can we make that will result in improvement?
Model for Improvement
Act Plan
Study Do
From: Associates in Process Improvement
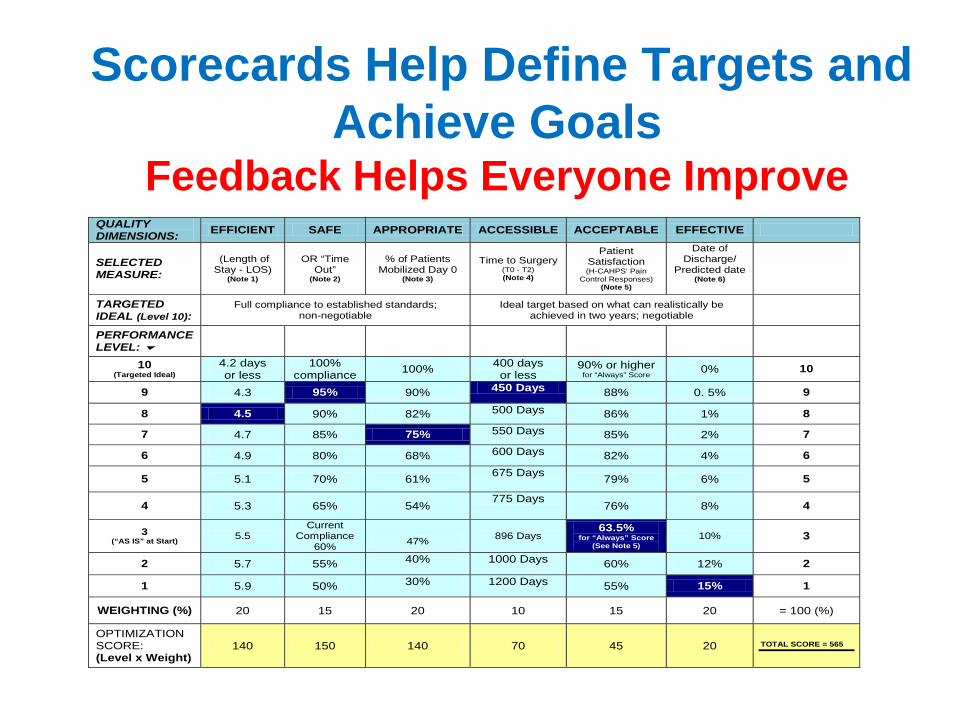
Scorecards Help Define Targets and Achieve Goals
Feedback Helps Everyone Improve
QUALITY DIMENSIONS: EFFICIENT SAFE APPROPRIATE ACCESSIBLE ACCEPTABLE EFFECTIVE
SELECTED MEASURE:
(Length of Stay - LOS)
(Note 1)
OR “Time Out”
(Note 2)
% of Patients Mobilized Day 0
(Note 3)
Time to Surgery (T0 - T2) (Note 4)
Patient Satisfaction (H-CAHPS’ Pain
Control Responses) (Note 5)
Date of Discharge/
Predicted date (Note 6)
TARGETED IDEAL (Level 10):
Full compliance to established standards; non-negotiable
Ideal target based on what can realistically be achieved in two years; negotiable
PERFORMANCE LEVEL:
10 (Targeted Ideal)
4.2 days or less
100% compliance 100% 400 days
or less 90% or higher
for “Always” Score 0% 10
9 4.3 95% 90% 450 Days 88% 0. 5% 9
8 4.5 90% 82% 500 Days 86% 1% 8
7 4.7 85% 75% 550 Days 85% 2% 7
6 4.9 80% 68% 600 Days 82% 4% 6
5 5.1 70% 61% 675 Days 79% 6% 5
4 5.3 65% 54% 775 Days
76% 8% 4
3 (“AS IS” at Start) 5.5
Current Compliance
60%
47% 896 Days
63.5% for “Always” Score
(See Note 5) 10% 3
2 5.7 55% 40% 1000 Days 60% 12% 2
1 5.9 50% 30% 1200 Days 55% 15% 1
WEIGHTING (%) 20 15 20 10 15 20 = 100 (%)
OPTIMIZATION SCORE: (Level x Weight)
140 150 140 70 45 20 TOTAL SCORE = 565

21
SCORE CARD
Collaborative Process
BASELINE
Learning Workshop 1
Plan P D S
A
SC
BASE
Action Period 1
22
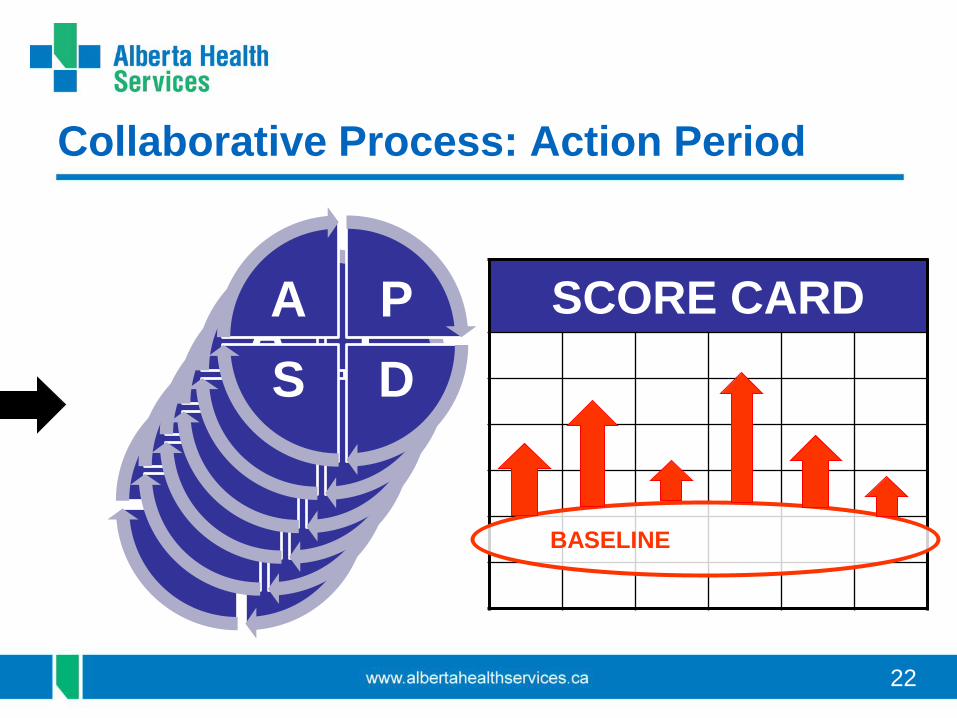
Collaborative Process: Action Period
P D S
A
SCORE CARD
BASELINE
P D S
A P D S
A P D S
A P D S
A P D S
A

23
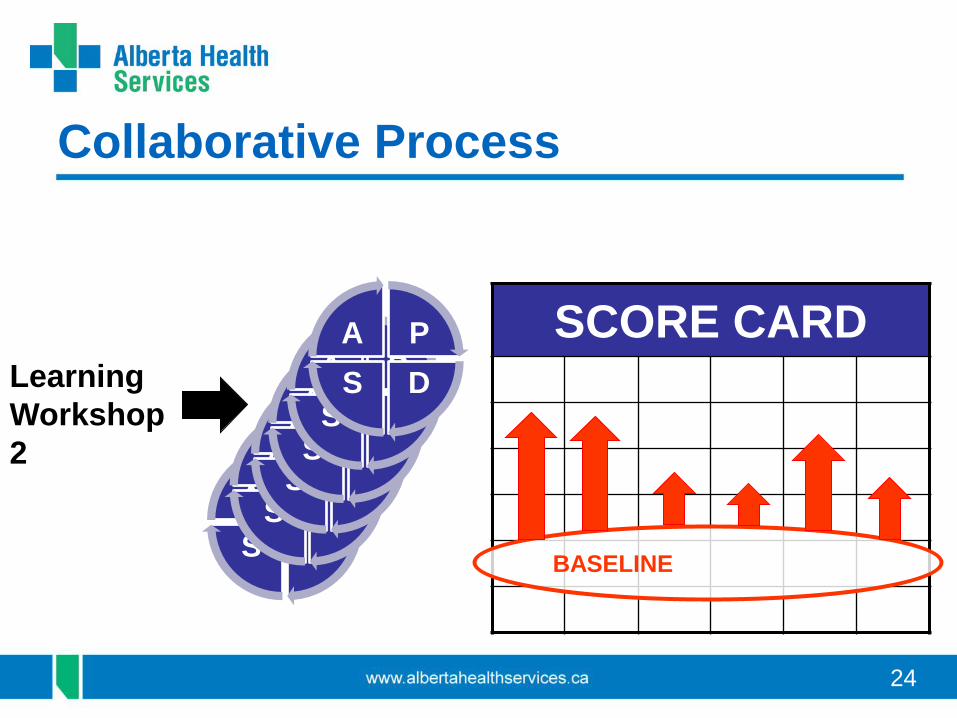
Learning Workshop 2
P D S
A
SCORE CARD
BASELINE
P D S
A P D S
A P D S
A P D S
A P D S
A
Collaborative Process
Action Period 2
24
SCORE CARD
Collaborative Process
Learning Workshop 2
P D S
A
BASELINE
P D S
A P D S
A P D S
A P D S
A P D S
A
25
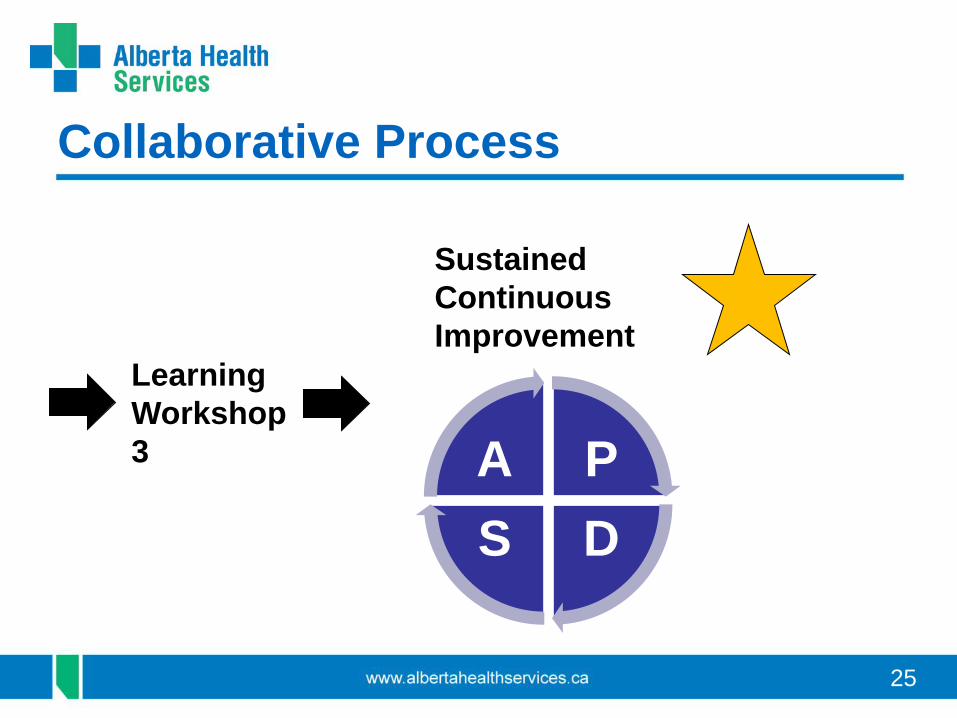
Collaborative Process
Learning Workshop 3 P
D S A
Sustained Continuous Improvement

26
Balanced Scorecard
• STEP 1: Identify an improvement indicator under each quality dimension
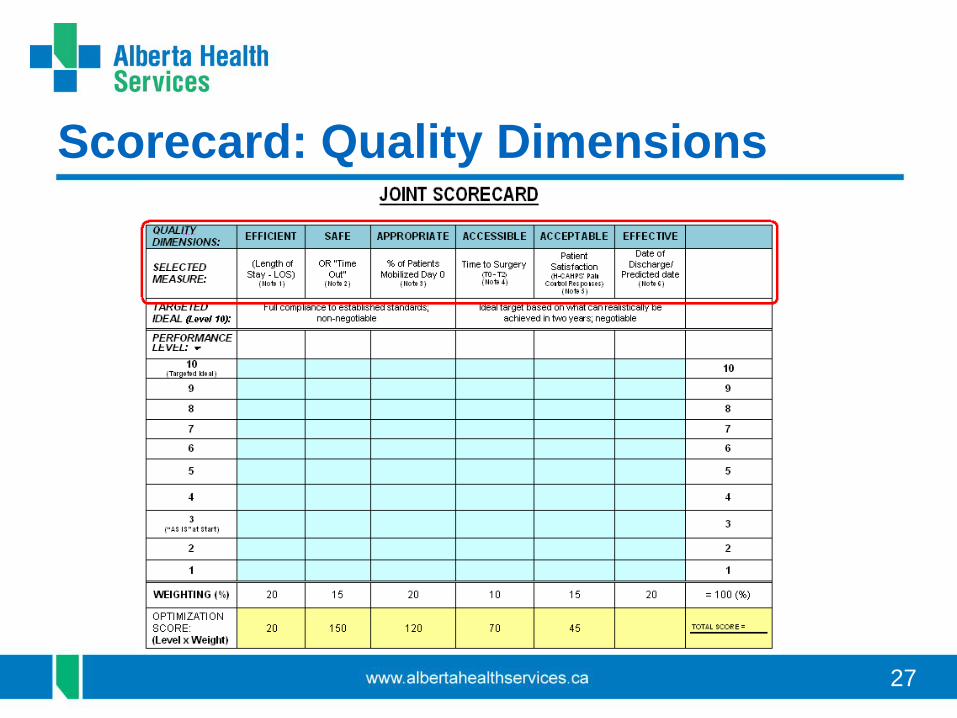
27
Scorecard: Quality Dimensions

28
Scorecard Overview
• STEP 1: Identify an improvement indicator under each quality dimension
• STEP 2: Determine the degree of importance of each improvement indictor

29
Scorecard: Weighting

30
Scorecard Overview
• STEP 1: Identify an improvement indicator under each quality dimension
• STEP 2: Determine the degree of importance of each improvement indictor
• STEP 3: Collect baseline data to populate “as-is” state

31
Scorecard: Setting Targets QUALITY DIMENSION EFFICNT SAFE APPROPT ACCESBLE ACCEPTBLE EFFECTV
SELECTED MEASURE
Avg LOS Time to surgery
TARGETED IDEAL (Level 10):
Full compliance to established standards; non-negotiable
Ideal target negotiable & based on what is/can realistically be achieved in 2 years
PERFORMANCE LEVEL
EXAMPLE ONLY
8 4.0 “Ideal” performance sought in period
7 4.5
6 4.9
5 5.2
4 5.5
3 5.8 Actual performance at start of period
2 6.0
1 > 6.0
Example only for WEIGHTING (%)
25 20 15 15 15 10 = 100 Total
OPTIMIZATION SCORE:
(Level x Weight)
TOTAL SCORE =
BASELINE PERFORMANCE
IDEAL PERFORMANCE
Increasingly Difficult
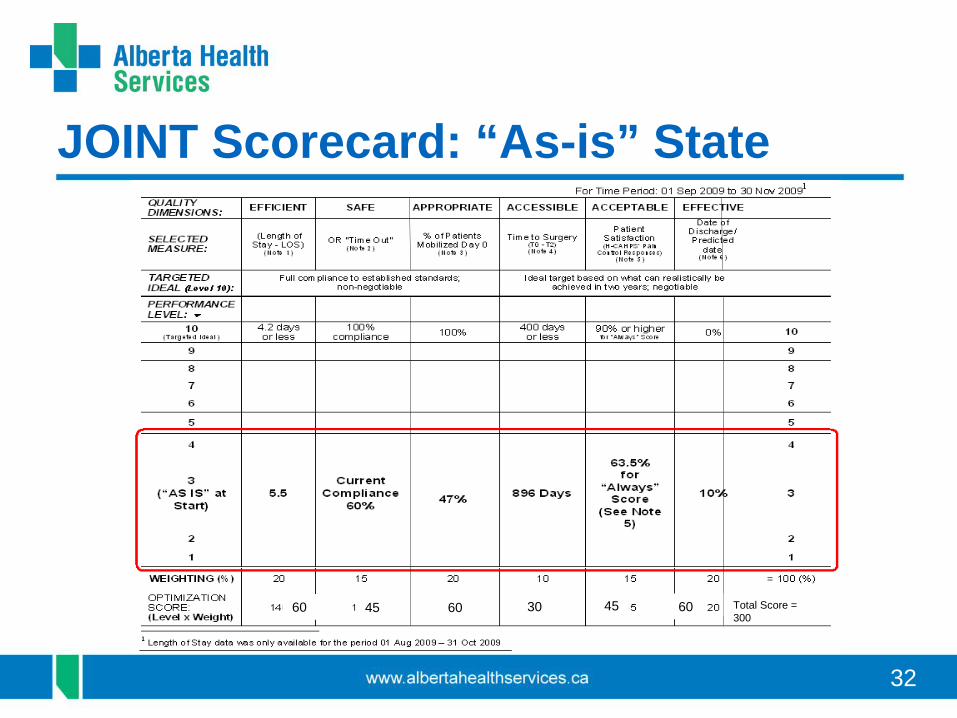
32
JOINT Scorecard: “As-is” State
60 45 60 30 45 60 Total Score = 300
33
Scorecard Overview
• STEP 1: Identify an improvement indicator under each quality dimension
• STEP 2: Determine the degree of importance of each improvement indictor
• STEP 3: Collect baseline data to populate “as-is” state • STEP 4: Identify measurement tools and strategies
(to determine to what extent indictor selected has improved, using a scale of 1-10)
34
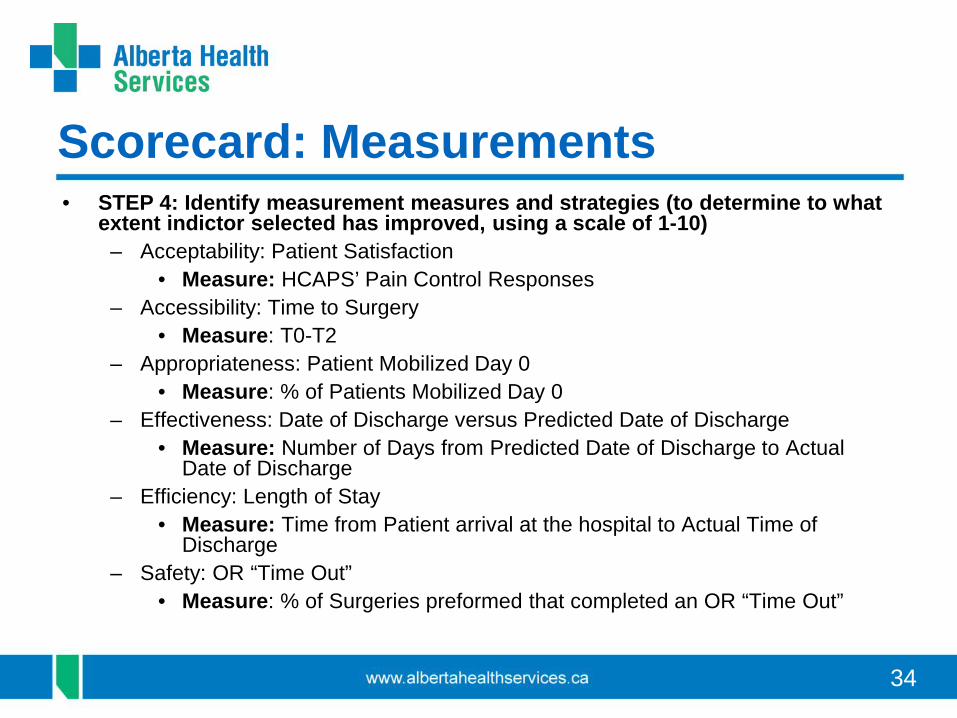
Scorecard: Measurements • STEP 4: Identify measurement measures and strategies (to determine to what
extent indictor selected has improved, using a scale of 1-10) – Acceptability: Patient Satisfaction
• Measure: HCAPS’ Pain Control Responses – Accessibility: Time to Surgery
• Measure: T0-T2 – Appropriateness: Patient Mobilized Day 0
• Measure: % of Patients Mobilized Day 0 – Effectiveness: Date of Discharge versus Predicted Date of Discharge
• Measure: Number of Days from Predicted Date of Discharge to Actual Date of Discharge
– Efficiency: Length of Stay • Measure: Time from Patient arrival at the hospital to Actual Time of
Discharge – Safety: OR “Time Out”
• Measure: % of Surgeries preformed that completed an OR “Time Out”
35
Scorecard Overview
• STEP 1: Identify an improvement indicator under each quality dimension
• STEP 2: Determine the degree of importance of each improvement indictor
• STEP 3: Collect baseline data to populate “as-is” state • STEP 4: Identify measurement tools and strategies (to
determine to what extent indictor selected has improved, using a scale of 1-10)
• STEP 5: Develop strategies to meet each goal

36
JOINT Scorecard
160 135 90 45 Total Score = 590

37
Action Plan Overview
38
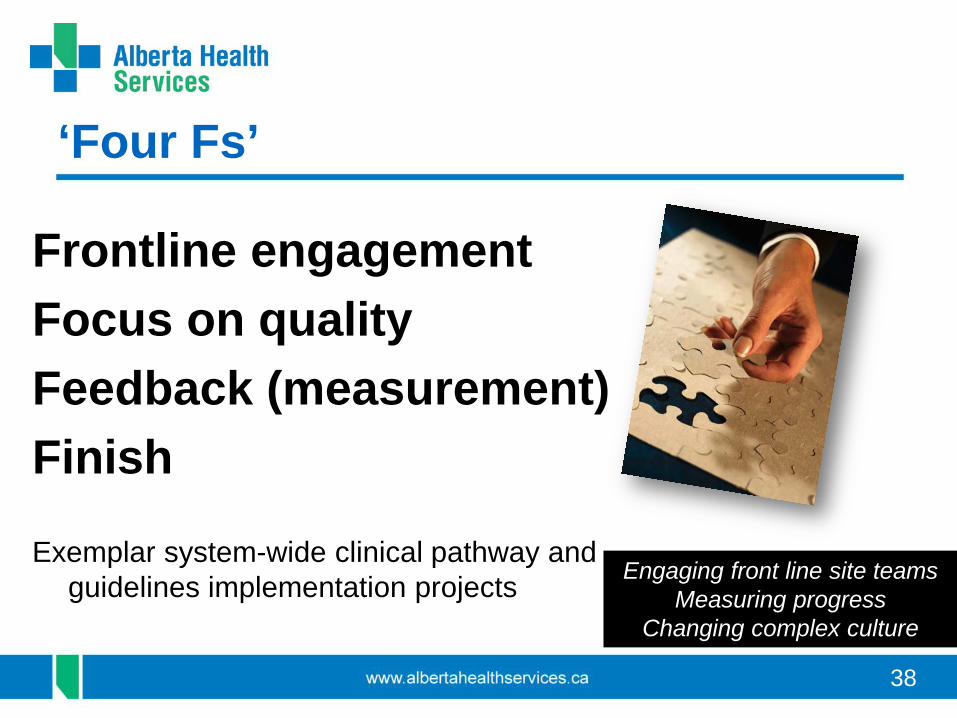
‘Four Fs’
Frontline engagement Focus on quality Feedback (measurement) Finish Exemplar system-wide clinical pathway and
guidelines implementation projects
Engaging front line site teams Measuring progress
Changing complex culture

39
Hip and Knee Arthroplasty
40
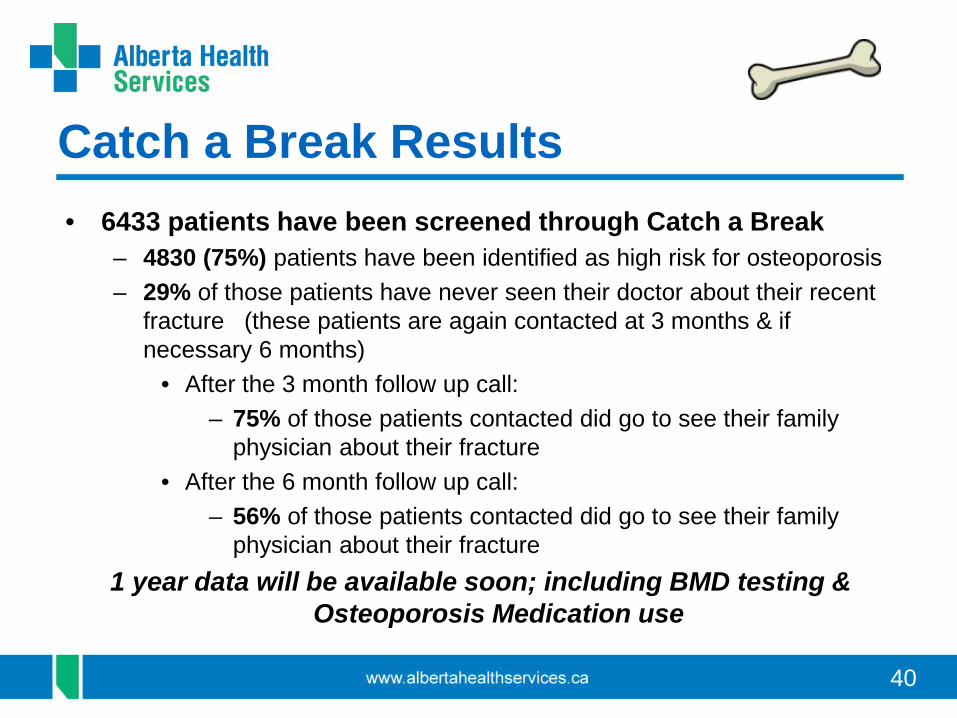
Catch a Break Results • 6433 patients have been screened through Catch a Break
– 4830 (75%) patients have been identified as high risk for osteoporosis – 29% of those patients have never seen their doctor about their recent
fracture (these patients are again contacted at 3 months & if necessary 6 months)
• After the 3 month follow up call: – 75% of those patients contacted did go to see their family
physician about their fracture • After the 6 month follow up call:
– 56% of those patients contacted did go to see their family physician about their fracture
1 year data will be available soon; including BMD testing & Osteoporosis Medication use

41
Fracture Liaison Service Results • ≈ 18% of patients are from out of region & are excluded from
the FLS at this point in time • 50% of those patients enrolled in the FLS were either started,
restarted, continued or had medication changes. Earlier baseline data indicated only 8% patients were being discharged on osteoporosis medication
• 11% of patients are choosing not to take osteoporosis medication during their hospital visit. Early indications on 3 month follow up suggest some patients are re-considering their choice
• 27% of patients are being referred to other programs by FLS (i.e. falls, geriatrics, etc.)

42
Fracture Liaison Service Challenges
• Medication challenges: – Access to infusion options in the hospital/outpatient clinic or
home need to be explored – Need to develop a common approach for patients with
advanced renal disease. These are about 15-25% of patients. Evidence is not conclusive
– Administration of bisphosphonates through Med Assist – a common practice in facilities or Home Care is a concern as bisphosphonates should be given on an empty stomach.
• Future Program Development: – Incorporating the FLS program into a larger ortho-geriatric
program with a patient navigation component would be desirable.

43
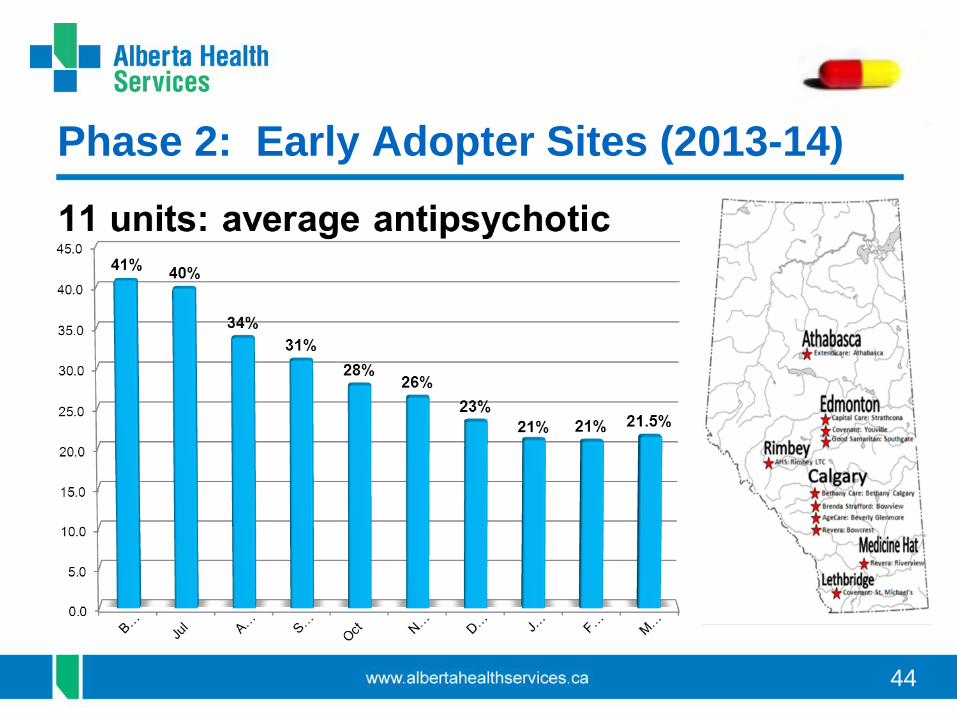
Appropriate Use of Antipsychotics (AUA) AUA Guideline & Web-based Toolkit
Trialed approach with 11 Early Adopter Sites
50% reduction in number of residents on meds over 9 months
170 LTC sites in Alberta Series of 7 Collaboratives offered across province for over 100 sites with ‘higher’ antipsychotic use
Key processes: monthly medication reviews, staff education, family engagement; data submitted to Practice Leads
CIHI public reporting AUA QI
in LTC
44
Phase 2: Early Adopter Sites (2013-14)

45
% Residents on Antipsychotics & With a Monthly Medication Review

46
Phase 3: Provincial Implementation
34.7%
22.0%
34.8%
22.5%
34.5%
25.7%
29.1%
16.3%
26.7%
17.2%
28.8%
19.8%
0.0%
5.0%
10.0%
15.0%
20.0%
25.0%
30.0%
35.0%
40.0%
North Zone EdmontonZone
Central Zone Calgary Zone South Zone Alberta
Perc
enta
ge o
f Res
iden
ts o
n An
tipsy
chot
ics a
s pe
r CIH
I def
initi
on
2013 Q2
2013 Q3
2013 Q4
2014 Q1
2014 Q2
2014 Q3
2014 Q4
2015 Q1
AUA Project resources were shared with all 170 LTC sites in Alberta in 2014/15. Antipsychotic use continues to decline.
19.8% current provincial average (Q1 2015)
47
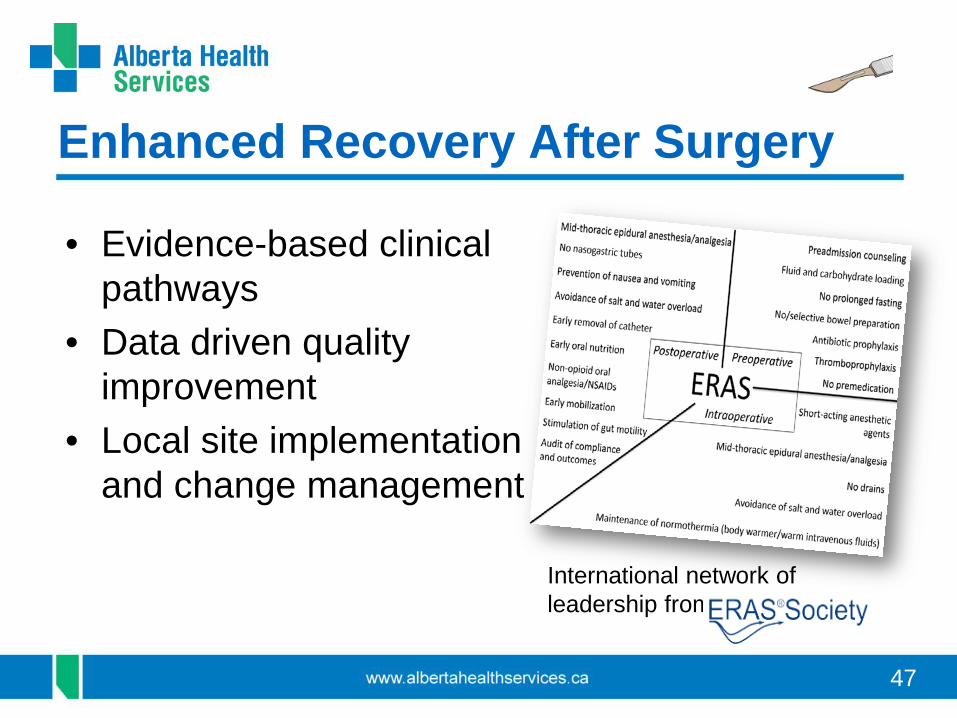
Enhanced Recovery After Surgery
• Evidence-based clinical pathways
• Data driven quality improvement
• Local site implementation and change management
International network of leadership from
48
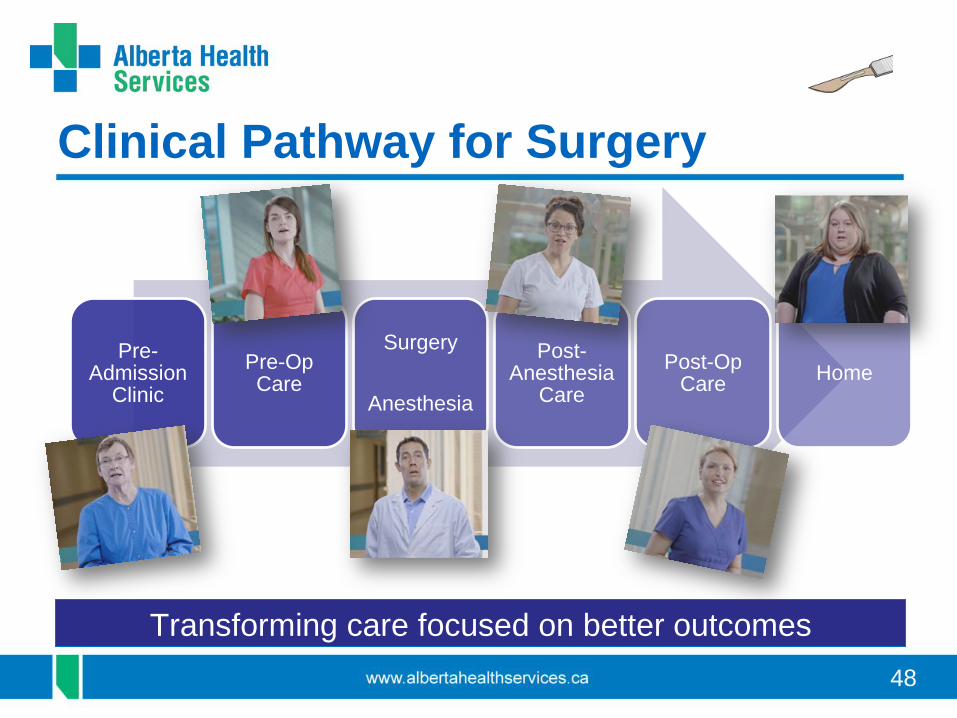
Clinical Pathway for Surgery
Transforming care focused on better outcomes
Pre-Admission
Clinic Pre-Op Care
Surgery
Anesthesia
Post-Anesthesia
Care Post-Op
Care Home

49
ERAS Care Story (to Dec 31, 2014)
Improvement Coeffa Magnitude ∆b
LOS Primary 0.80* -2.0 days Complications (primary)
0.65 -19.9%
Prevented readmissions
0.44* -9.5%
LOS for those ERAS patients admitted
0.62 -4.5 days
Focused on magnitude and direction compared to pre-ERAS baseline * p < .05 a. Coefficients from adjusted multivariate models. b. Calculated using the coefficients from adjusted multivariate models. Source: IHE, April 2015
• Well enough to go home earlier from hospital (possibly due to less complications post op)
• Less risk of being readmitted
to hospital within 30 days (possibly due to less complications post discharge)
• If readmitted, could be discharged earlier (complications experienced may be less severe)

50
ERAS Cost Impact (to Dec 31, 2014) $2.1 to $4.6 million in net costs saved with 690 ERAS patients (PLC & GNH)
$3.1k to $6.6k with 3.5 bed days saved for each ERAS patient
Site Total Magnitude Cost Impact ($ per inpatient day)
Low= $1,114 High= $2,106 LOS Primary (n=690) -1,380 days
(2.0 * 690) $1,537,320 $2,906,280
Prevented Readmissions (n=690)
-66 admissions (9.5%*690)
-780 days in hosp
(66*12c)
$868,548 $1,641,977
LOS for those ERAS patients re-admitted (n=61)
-275 days (4.5*61)
$306,350 $579,150
Total Estimated Savings $2,712,218 $5,127,407
Total Cumulative Intervention Cost of ERAS (PLC and GNH ending Dec 31, 2014)d
$546,492
Net Cost Savings $2,165,726 $4,580,915
Break even point – surgery # 174 82
p < .05 a.Coefficients from adjusted
multivariate models b.Calculated using the coefficients
from adjusted multivariate models c.Mean of 12 days per readmission in
baseline group d.Inclusive of labour/coordination and
licensing fees Source: IHE, April 2015

52
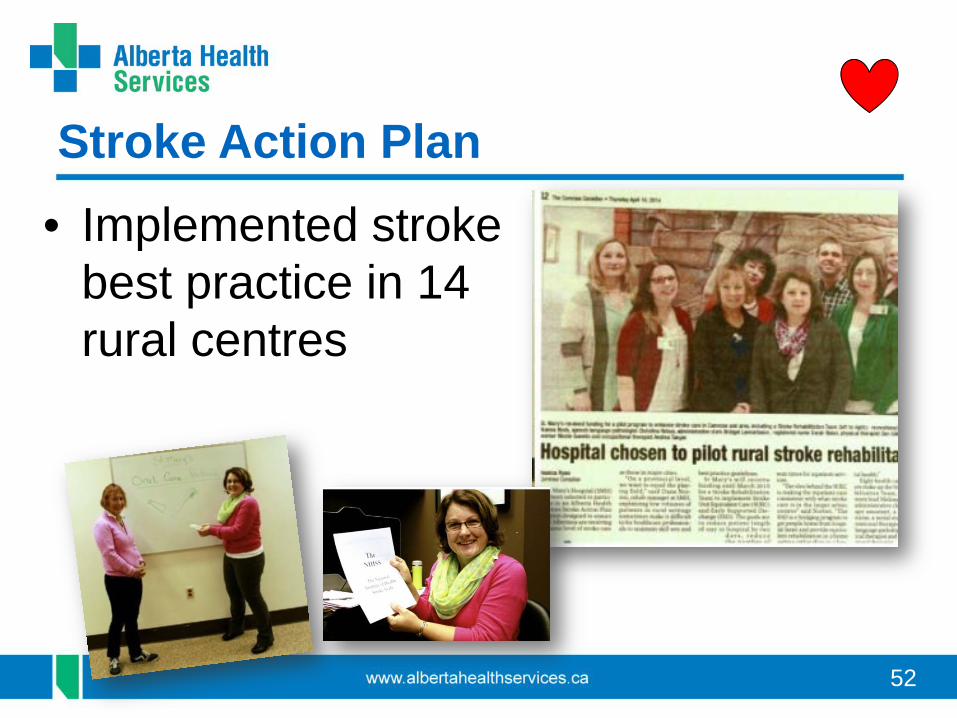
Stroke Action Plan
• Implemented stroke best practice in 14 rural centres
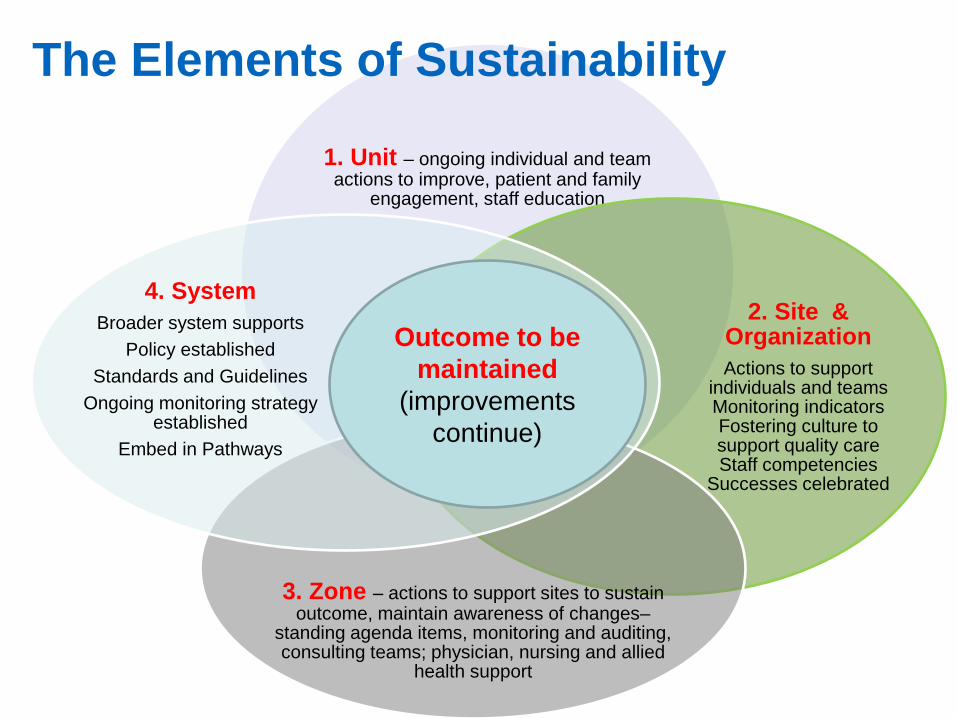
1. Unit – ongoing individual and team actions to improve, patient and family
engagement, staff education
2. Site & Organization Actions to support
individuals and teams Monitoring indicators Fostering culture to support quality care Staff competencies
Successes celebrated
3. Zone – actions to support sites to sustain outcome, maintain awareness of changes–
standing agenda items, monitoring and auditing, consulting teams; physician, nursing and allied
health support
4. System Broader system supports
Policy established Standards and Guidelines
Ongoing monitoring strategy established
Embed in Pathways
Outcome to be maintained
(improvements continue)
The Elements of Sustainability

54
Questions?
55
Additional Resources & References • www.albertahealthservices.ca/scn.asp
• AUA: www.albertahealthservices.ca/auatoolkit.asp
• Stroke Action Plan: www.albertahealthservices.ca/7678.asp • Hip & Knee Arthroplasty: www.albertahealthservices.ca/10780.asp
• ERAS: www.albertahealthservices.ca/10318.asp
• www.ihi.org/engage/collaboratives/
56
Acknowledgements • Mollie Cole, Manager, Seniors Health SCN, Alberta Health Services • Agnes Joyce, Manager, Cardiovascular Health & Stroke SCN, Alberta Health Services • Sheila Kelly, Manager, Bone & Joint Health SCN, Alberta Health Services • Stacy Kozak, Manager, Surgery SCN, Alberta Health Services • Glenda Moore, Manager, Diabetes Obesity & Nutrition SCN, Alberta Health Services • Alison Nelson, Senior Consultant, SCNs, Alberta Health Services • Dennis Cleaver, Executive Director, Seniors Health SCN, Alberta Health Services • Lynn Mansell, Senior Provincial Director, Bone & Joint Health and Seniors Health SCN, Alberta Health
Services • Louise Morrin, Executive Director, Cardiovascular Health & Stroke SCN, Alberta Health Services • Petra O’Connell, Executive Director, Diabetes Obesity & Nutrition SCN, Alberta Health Services • Jill Robert, Acting Senior Provincial Director, Surgery SCN, Alberta Health Services • Shelley Vallaire, Senior Provincial Director, Cardiovascular Health & Stroke SCN, Alberta Health
Services • Michelle Salesse, Acting Executive Director, Surgery SCN, Alberta Health Services • Mel Slomp, Executive Director, Bone & Joint Health SCN, Alberta Health Services