methylene chloride a case study for dose-dependent transitions raymond m. david, ph.d. eastman kodak...
TRANSCRIPT
Methylene Chloride a case study forDose-Dependent
Transitions
Raymond M. David, Ph.D.Eastman Kodak Company
©Eastman Kodak Company, 2005

Overview Methylene chloride (DCM) is a good
case study for risk assessment because it is a classic example of dose-dependent
transition in carcinogenesis there are human data for metabolism
around the inflection point example of species differences in
metabolism and genetic polymorphisms, which impact the quantitation of risk
PBPK modeling has been used for species extrapolation and risk assessment

Carcinogenic Potential National Coffee Association (NCA) study
–0, 60, 125, 185, and 250 mg/kg body in drinking water to F-344 rats and B6C3F1 mice for 2 years
National Toxicology Program (NTP) study –0, 2000, or 4000 ppm by inhalation to F-344 rats and B6C3F1 mice for 2 years

Tumor response Dose
mg/kg/dTumor
IncidenceOrgan Sex/
Strain/Species
Study
0 60125 185 250
24/125 51/20030/10031/9935/125
LiverMale
B6C3F1
NCA;Serota et
al.
0 1582 3162
3/50 16/48 40/48
LiverFemaleB6C3F1 NTP
015823162
3/45 30/4641/46
LungFemaleB6C3F1 NTP

Liver tumor response
0%
10%
20%
30%
40%
50%
60%
70%
80%
90%
10 100 1000 10000
log Dose equivalent (mg/ kg)
Perc
enta
ge

Tumor incidence summary Increased incidence of hepatocellular
adenomas and carcinomas were observed in mice (one sex) at 125 mg/kg/d.
Increased incidence of lung tumors (alveolar/bronchiolar adenomas) were observed in mice exposed to airborne concentrations of 2000 ppm.
F-344 rats showed no evidence of increased liver or lung tumors.

Mode of action At low concentrations, DCM is metabolized
primarily by cytochrome P450 (CYP). Kubic and Anders (1975) and Anders et al.
(1977) demonstrated that DCM was metabolized by CYP to carbon monoxide.
Kim and Kim (1996) later identified CYP2E1 as the isozyme associated with this pathway.
Kubic and Anders (1978) determined the Km (50.1 mM) and Vmax (5.4 nmol CO/mg prot/min).
McKenna et al. (1982) showed that CYP2E1 in laboratory animals was saturated above concentrations of 500 ppm.

Mode of action
CYP 2E1 catalyzed:
CH2Cl2 CHOHCl2 HCOCl CO + CO2
formyl chloride
COHb
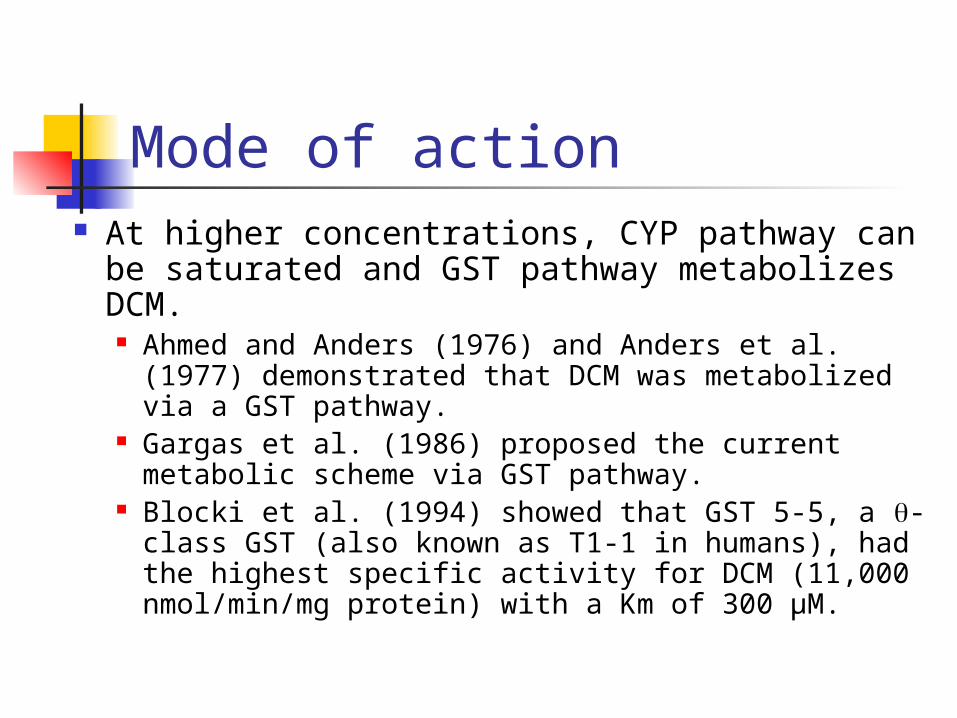
Mode of action At higher concentrations, CYP pathway can
be saturated and GST pathway metabolizes DCM. Ahmed and Anders (1976) and Anders et al.
(1977) demonstrated that DCM was metabolized via a GST pathway.
Gargas et al. (1986) proposed the current metabolic scheme via GST pathway.
Blocki et al. (1994) showed that GST 5-5, a -class GST (also known as T1-1 in humans), had the highest specific activity for DCM (11,000 nmol/min/mg protein) with a Km of 300 µM.
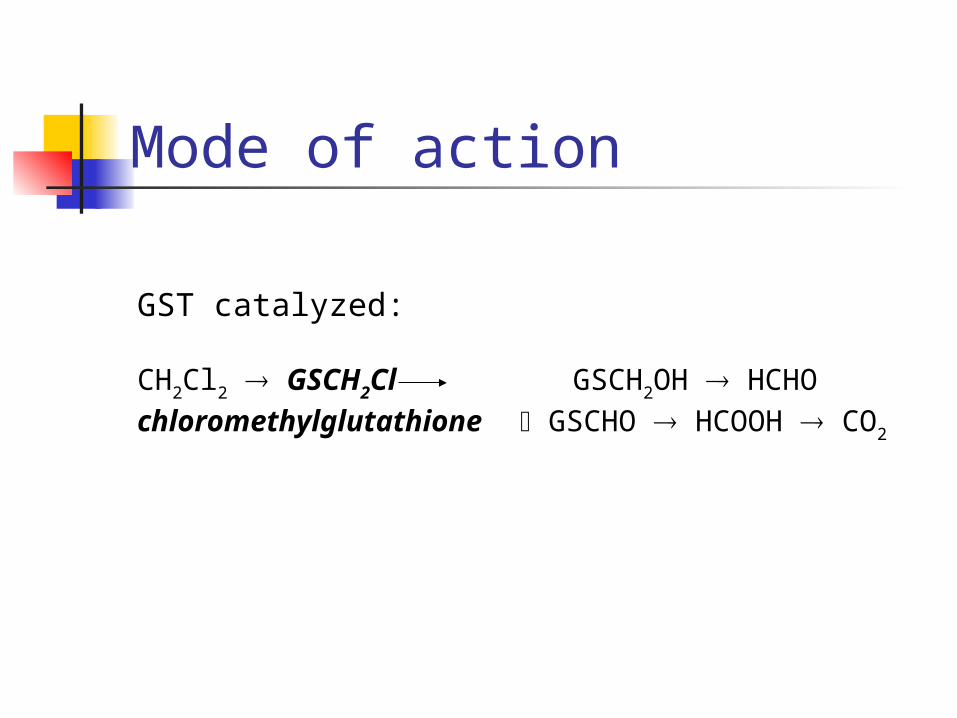
Mode of action
GST catalyzed:
CH2Cl2 GSCH2Cl GSCH2OH HCHOchloromethylglutathione GSCHO HCOOH CO2

MOA – supporting data Reynolds and Yee (1967) and Anders et al.
(1977) showed that 14C-DCM was bound to tissue protein and lipid.
Casanova et al. (1992) demonstrated an increase of DNA-protein cross-links (DPX) in the liver and RNA-formaldehyde adducts (RFA) in the lungs.
DNA adducts may also be formed directly from the chloromethylglutathione intermediate rather than formaldehyde (Marsch et al., 2001, 2004).

MOA – supporting data Graves et al. (1994) and Thier et
al. (1993) linked mutations observed only in S. typhymurium strains TA1535 and TA100 to nascent GST activity.
Other tests for genetic toxicity generally negative.
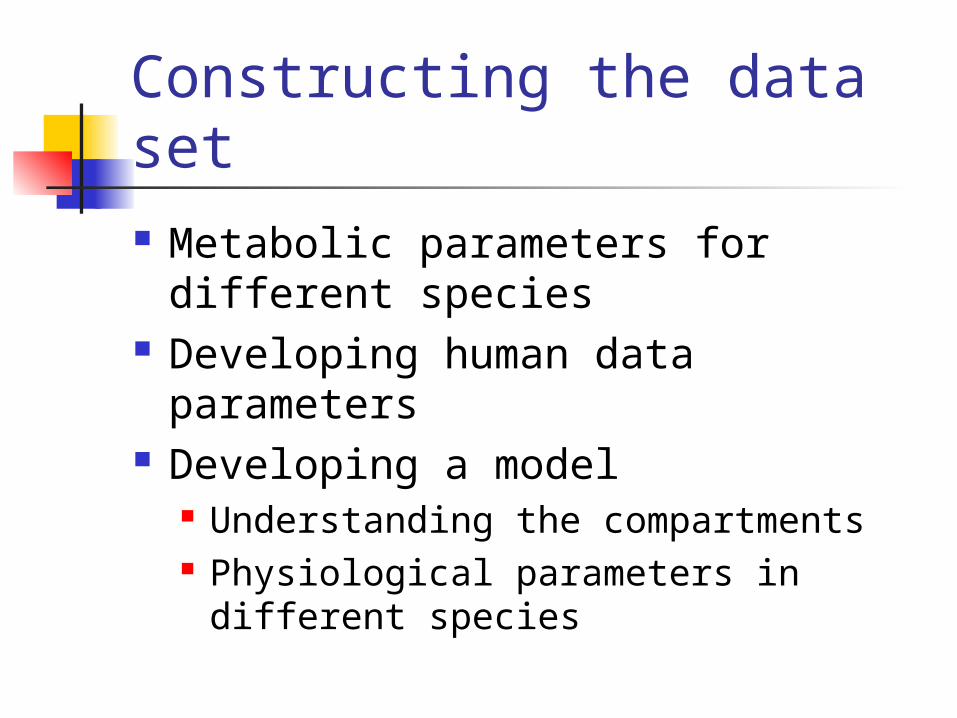
Constructing the data set Metabolic parameters for different
species Developing human data
parameters Developing a model
Understanding the compartments Physiological parameters in different
species

Species metabolic parameters
Species
Km
(mM)
Vmax
(nmol/min/mg prot)
Km
(mM)
Vmax
(nmol/min/mg prot)
mouse 1.84 0.33
15.90 1.10 137 21 118.2 14.4
rat 1.42 0.74
5.39 0.94 nd nd
human 0.92 – 2.82
1.53 – 13.00 43.8 – 44.1 6.04 – 7.05
MFO pathway GST pathway
From Reitz et al., 1988. nd = not determined

Species metabolic parameters
Species
Tissue
MFO GST
Mouse LiverLung
1.760 ± 0.1150.732 ± 0.115
5290 ± 430727 ± 64
Rat LiverLung
0.814 ± 0.1180.111 ± 0.035
1380 ± 11077 ± 5
Human LiverLung
0.418 ± 0.1570.0006 ± 0.0003
1650 ± 480 78 ± 47
Specific activities from Lorenz et al. (1984) in nmol/min/mg protein as reported by Andersen et al. (1987)
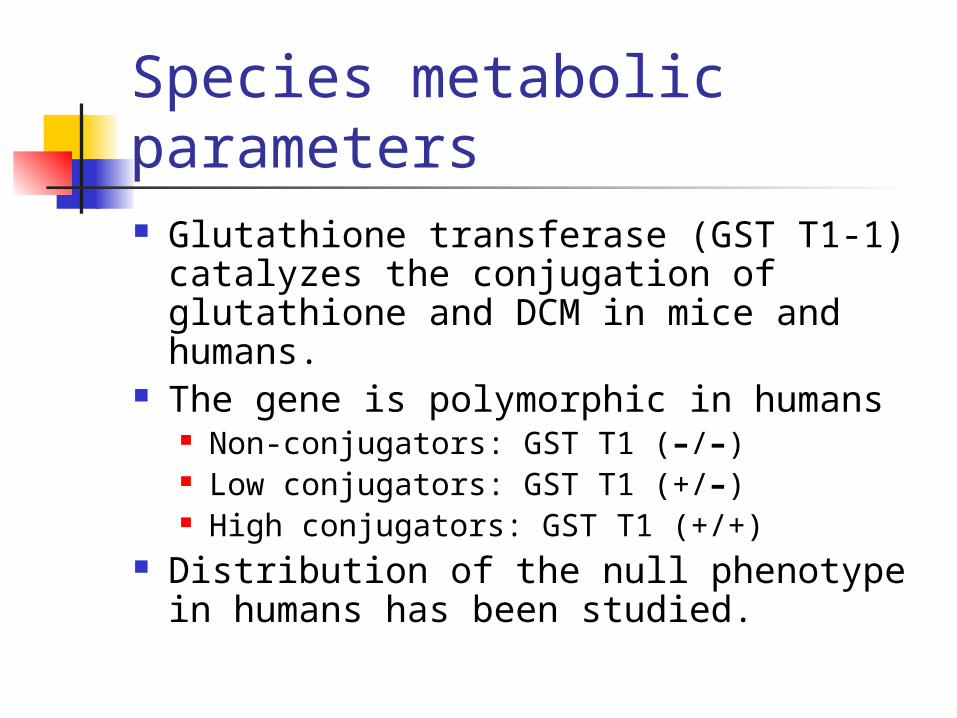
Species metabolic parameters Glutathione transferase (GST T1-1)
catalyzes the conjugation of glutathione and DCM in mice and humans.
The gene is polymorphic in humans Non-conjugators: GST T1 (–/–) Low conjugators: GST T1 (+/–) High conjugators: GST T1 (+/+)
Distribution of the null phenotype in humans has been studied.

GSTT1 -/- DistributionGroup %
Population%
Homozygous
Asian 3.9 62
Caucasian 75.5 19.7
African-American
12.2 21.8
Mexican-American
11.4 9.7
From El-Masri et al., 1999.
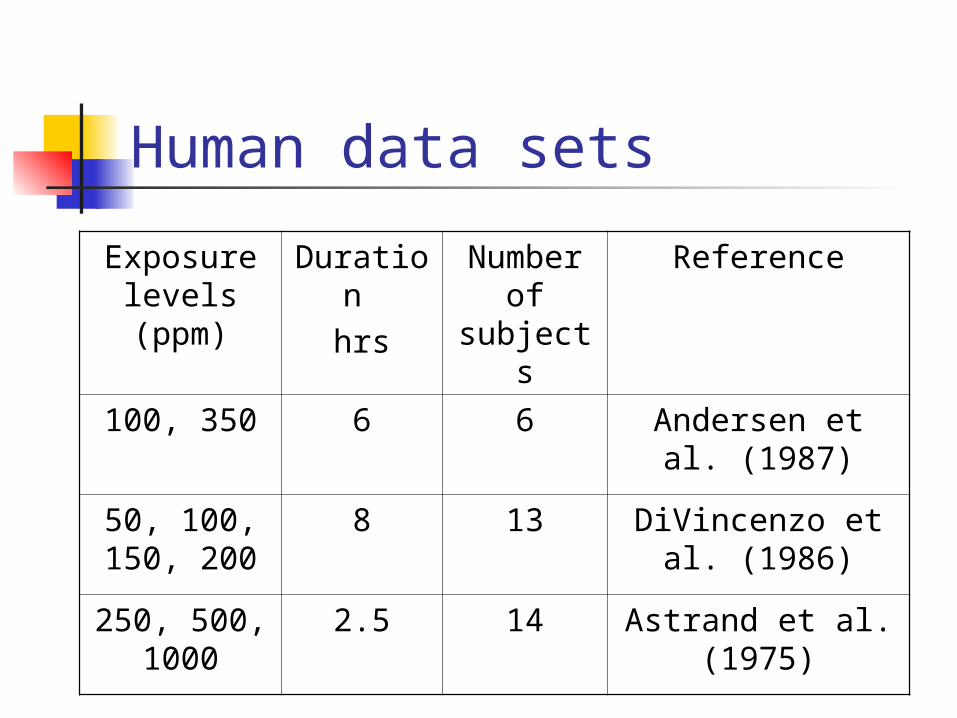
Human data sets
Exposure levels (ppm)
Duration hrs
Number of
subjects
Reference
100, 350 6 6 Andersen et al. (1987)
50, 100, 150, 200
8 13 DiVincenzo et al. (1986)
250, 500, 1000
2.5 14 Astrand et al. (1975)
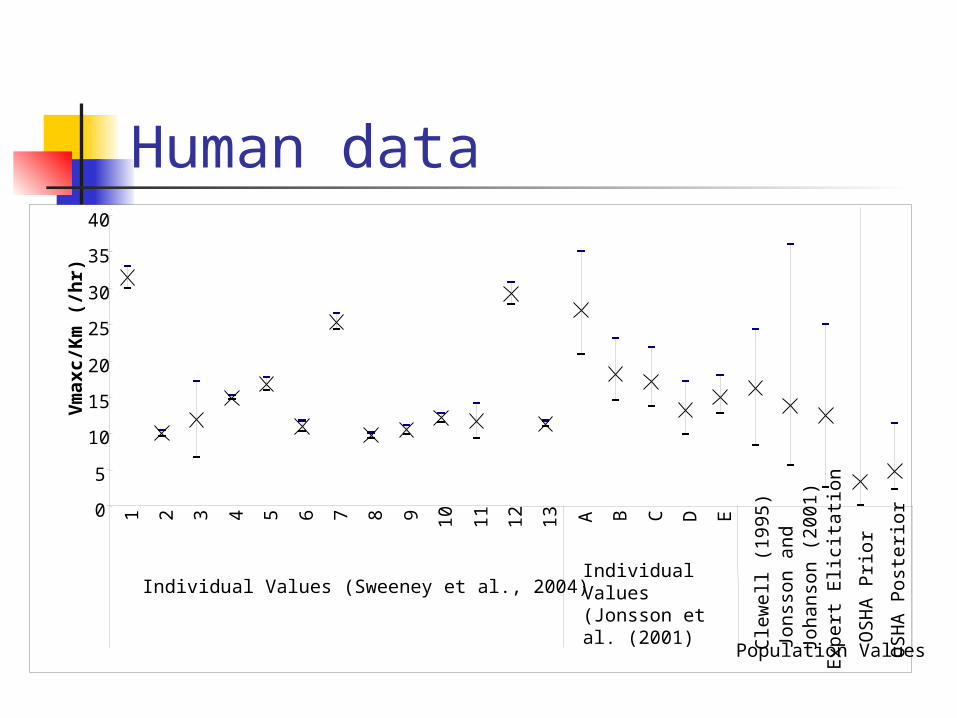
0
5
10
15
20
25
30
35
40
1 2 3 4 5 6 7 8 9 10
11
12
13 A B C D E
Cle
well
(1995
)Jo
nss
on a
nd
Jo
hanso
n (
20
01)
Exp
ert
Elic
itati
on
OS
HA
Pri
or
OS
HA
Post
eri
or
Individual Values (Sweeney et al., 2004)Individual Values (Jonsson et al. (2001)
Population Values
Vm
axc/K
m (
/hr)
Human data
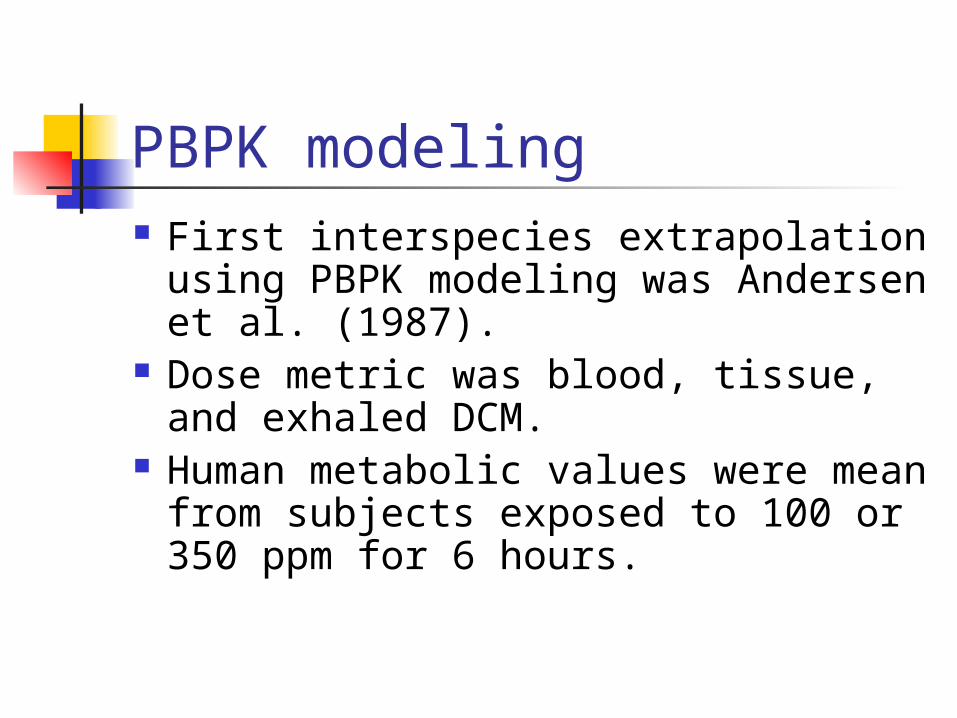
PBPK modeling First interspecies extrapolation
using PBPK modeling was Andersen et al. (1987).
Dose metric was blood, tissue, and exhaled DCM.
Human metabolic values were mean from subjects exposed to 100 or350 ppm for 6 hours.
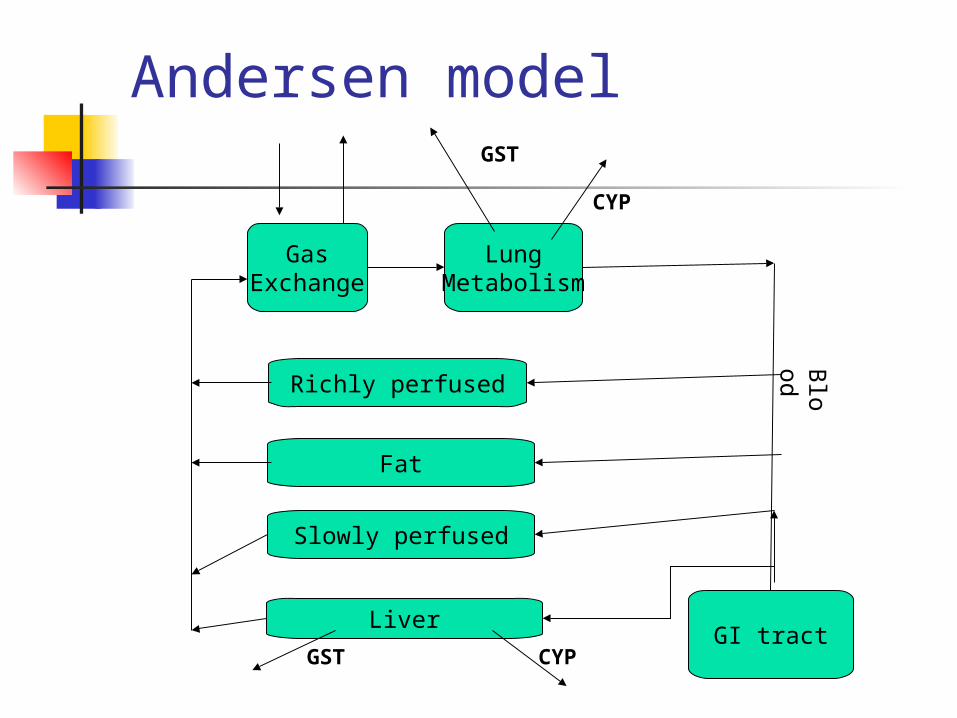
GasExchange
LungMetabolism
Richly perfused
Fat
Slowly perfused
LiverGI tract
GST CYP
Blo
od
CYP
GST
Andersen model

PBPK models for DCM assessment
Citation Remarks
Reitz et al., 1988 Deterministic approach. Andersen et al. (1987) model updated with measured MFO and GST rate constants.
Andersen et al., 1991
Deterministic approach. Blood compartment added to describe carbon monoxide and carboxyhemoglobin kinetics.
Dankovic et al., 1994
Deterministic approach. Mean values for alveolar ventilation, cardiac ouput, and tissue blood flow increased.
Casanova, et al., 1996
Deterministic approach. Liver DNA-protein cross-links from formaldehyde used as the dosimeter of effect.

PBPK models for DCM assessment
Citation Remarks
Bois and Smith, 1995
Probabilistic (Bayesian) approach. Bone marrow compartment added, variance in metabolic rate constants increased.
Thomas et al., 1996
Probabilistic (Bayesian) approach. Variability from MFO induction, GST inhibition, and tissue solubility included.
El-Masri et al., 1999
Probabilistic (Bayesian) approach incorporating GST-T1 polymorphisms and estimating DPX.
Jonsson and Johanson, 2001
Probabilistic (Bayesian) approach. New fat and muscle compartments. Includes population estimates of glutathione transfersase T1 gene frequencies

Changes in unit risk over time
Source Unit risk (per µg/m3)
EPA 1985 1.0 10-6
EPA 1991 4.7 10-7
El Masri et al., 1999 1.9 10-10
Jonsson and Johanson, 2001
1.9 10-10

DCM PBPK model resultsIndividual K2, Blood Carboxyhemoglobin
0
1
2
3
4
5
6
0 10 20 30 40 50
Time (hr)
Blo
od
Carb
oxyh
em
og
lob
in (
perc
en
t)
50 ppm (model)
100 ppm (model)
200 ppm (model)
50 ppm data
100 ppm data
200 ppm data

DCM PBPK model resultsIndividual K2, Exhaled Breath DCM
0.1
1
10
100
0 5 10
Time (hr)
Ex
ha
led
bre
ath
DC
M (
pp
m)
50 ppm (model)
100 ppm (model)
200 ppm (model)
50 ppm data
100 ppm data
200 ppm data
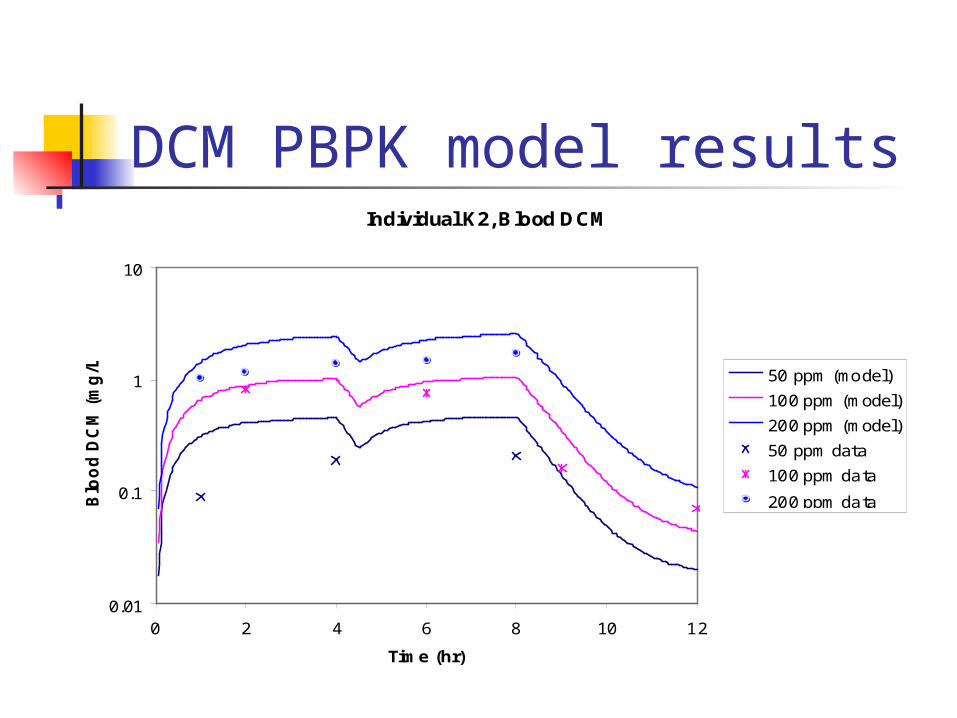
DCM PBPK model resultsIndividual K2, Blood DCM
0.01
0.1
1
10
0 2 4 6 8 10 12
Time (hr)
Blo
od
DC
M (
mg
/L)
50 ppm (model)
100 ppm (model)
200 ppm (model)
50 ppm data
100 ppm data
200 ppm data
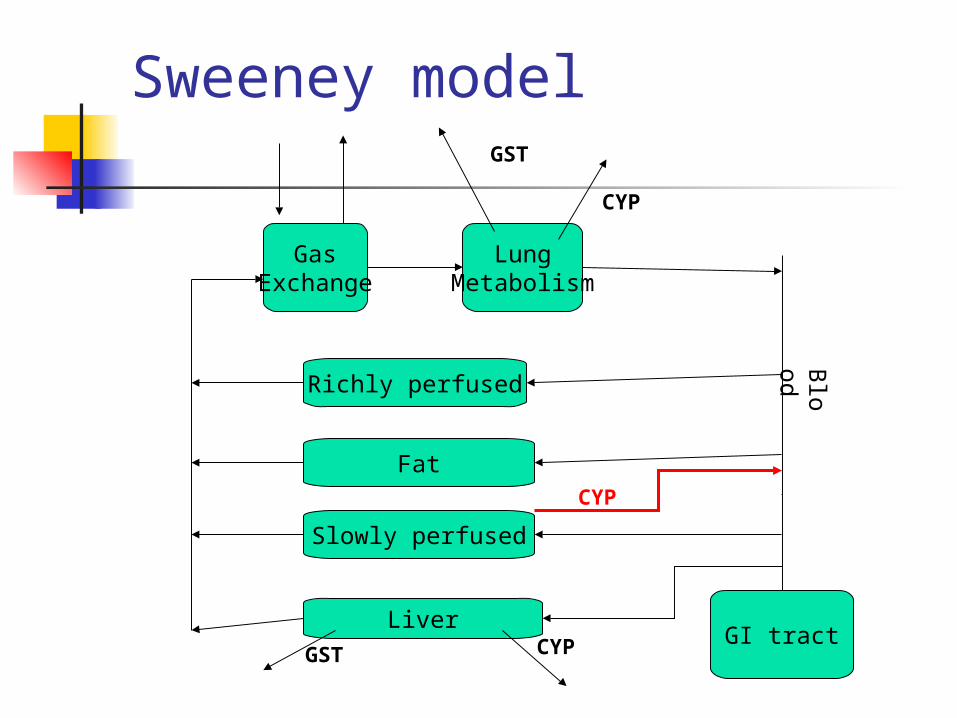
GasExchange
LungMetabolism
Richly perfused
Fat
Slowly perfused
LiverGI tract
GST CYP
Blo
od
CYP
GST
CYP
Sweeney model

Updating the risk assessment
Do the new human data and the model change the calculated unit risk?
Perhaps --- the unit risk is 4.8 x 10⁻⁸ using the Sweeney PBPK model compared with 4.7 x 10⁻⁷ used by the EPA.
Using probabilistic methodology and genetic polymorphisms might also impact the unit risk calculation.

Summary DCM is a good example for quantitative
risk assessment because it demonstrates a dose-dependent transition
from non-carcinogenic pathway to carcinogenic pathway
human data are available genetic polymorphisms in human
populations can be factored into the assessment
PBPK models extrapolating from animal to humans are available