metro vancouver housing data book 2018 · metro vancouver housing data book ... 2.1 housing...
TRANSCRIPT

Metro VancouverHousing Data Book
Revised April 2018

METRO VANCOUVER HOUSING DATA BOOK –Table of Contents
Table of Contents
Theme 1: Household Income 1.1 Median Household Income, 2016 Census
1.1.1 Median Income, Families and Unattached Individuals, 2006 – 2015
1.2 Median Household Income for Renters
1.3 Median Household Income for Owners
1.4 Income Distribution for All Households
1.5 Income Distribution for Renter Households
1.6 Income Distribution for Owner Households
Theme 2: Housing Market Indicators 2.1 Housing Inventory by Structure Type
2.2 Housing Starts
2.3 Housing Starts by Tenure
2.4 Housing Starts by Structure Type
2.5 Housing Completions
2.6 Housing Completions by Tenure
2.7 Housing Completions by Structure Type
2.8 Housing Demolitions
2.9 Average Rents for Purpose Built Rental Apartments
2.10 Average Vacancy Rates for Purpose Built Rental Apartments
2.11 Number of Bedrooms by Dwelling Type and Tenure
Theme 3: Housing Needs 3.1 Households in Core Need
3.2 Households in Core Need and Spending At Least Half on Shelter (INALH)
3.3 INALH Households by Household Type
3.4 INALH Households by Household Maintainer
3.5 BC Housing Social Housing Waitlist
3.6 Expiring Social Housing Agreements
3.7 Homeless Population by Homeless Count
Theme 4: Continuum of Housing Choices ‐ Renters 4.1 Rental Inventory by Structure Type and Age of Building
4.2 Purpose Built Rental Apartment Inventory
4.3 Secondary Suite Inventory
4.4 Private Condominium Rental Inventory
4.5 Social Housing Inventory
4.6 Sources of Rental Supply
4.7 Inventory of Affordable Rental Units by Rent Thresholds
Theme 5: Continuum of Housing Choices ‐ Ownership 5.1 Ownership Inventory by Structure Type and Age of Building
5.2 Ownership by Mortgage Status
5.3 Median Value of Owned Household by Structure Type
5.4 Average House Price and Housing Price Index
5.5 Inventory of Affordable Home Sales by Price Thresholds
METRO VANCOUVER HOUSING DATA BOOK ... Median Household Income 2016 Census
1.1
Description
Housing affordability is a measure of housing costs as well as a
household’s ability to meet these costs. The median household
income can be used as a measure for determining a household’s
ability to find housing in their community at an affordable price.
In moving forward on the strategies and actions proposed in the
Regional Affordable Housing Strategy and the regional growth
strategy, Metro 2040, different income categories or income
thresholds are defined. These income categories are:
very low income (less than 50% of median household income);
low income (between 50% and 80% of median household income);
moderate income (between 80% and 120% of median household income);
above moderate income (between 120% and 150% of median household
income); and high income (more than 150% of median household income).
Key Findings
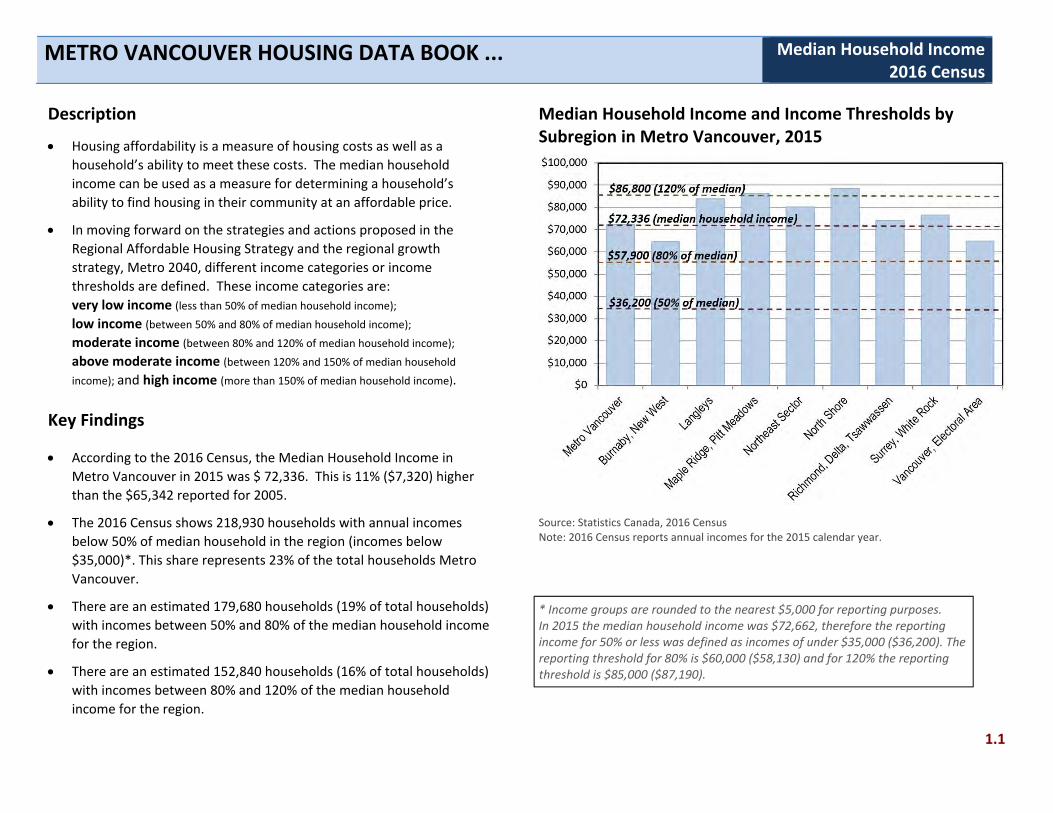
According to the 2016 Census, the Median Household Income in
Metro Vancouver in 2015 was $ 72,336. This is 11% ($7,320) higher
than the $65,342 reported for 2005.
The 2016 Census shows 218,930 households with annual incomes
below 50% of median household in the region (incomes below
$35,000)*. This share represents 23% of the total households Metro
Vancouver.
There are an estimated 179,680 households (19% of total households)
with incomes between 50% and 80% of the median household income
for the region.
There are an estimated 152,840 households (16% of total households)
with incomes between 80% and 120% of the median household
income for the region.
Median Household Income and Income Thresholds by Subregion in Metro Vancouver, 2015
Source: Statistics Canada, 2016 Census Note: 2016 Census reports annual incomes for the 2015 calendar year.
* Income groups are rounded to the nearest $5,000 for reporting purposes. In 2015 the median household income was $72,662, therefore the reporting income for 50% or less was defined as incomes of under $35,000 ($36,200). The reporting threshold for 80% is $60,000 ($58,130) and for 120% the reporting threshold is $85,000 ($87,190).

Housing Data Book Median Household Income
Median Household Income and Income Thresholds for Metro Vancouver Municipalities, 2015Total Median
Hshlds Hshld 50 % of Municipal 80 % of Municipal 120 % of Municipal Municipality # Income Median Income Median Income Median IncomeAnmore 690 $139,469 $69,700 $111,600 $167,400Belcarra 250 $128,256 $64,100 $102,600 $153,900Bowen Island 1,495 $89,856 $44,900 $71,900 $107,800Burnaby 92,200 $64,737 $32,400 $51,800 $77,700Coquitlam 51,325 $74,383 $37,200 $59,500 $89,300Delta 35,760 $92,300 $46,200 $73,800 $110,800Electoral Area A, UBC/UEL 6,100 $46,322 $23,200 $37,100 $55,600Langley City 11,840 $59,452 $29,700 $47,600 $71,300Langley Township 41,980 $90,594 $45,300 $72,500 $108,700Lions Bay 495 $125,082 $62,500 $100,100 $150,100Maple Ridge 30,265 $86,178 $43,100 $68,900 $103,400New Westminster 32,710 $64,695 $32,300 $51,800 $77,600North Vancouver City 24,645 $67,119 $33,600 $53,700 $80,500North Vancouver District 31,120 $103,981 $52,000 $83,200 $124,800Pitt Meadows 7,195 $86,912 $43,500 $69,500 $104,300Port Coquitlam 21,750 $84,096 $42,000 $67,300 $100,900Port Moody 12,975 $92,922 $46,500 $74,300 $111,500Richmond 73,455 $65,241 $32,600 $52,200 $78,300Surrey 169,965 $77,494 $38,700 $62,000 $93,000Tsawwassen First Nation 325 $84,053 $42,000 $67,200 $100,900Vancouver 283,915 $65,327 $32,700 $52,300 $78,400West Vancouver 16,935 $89,808 $44,900 $71,800 $107,800White Rock 10,005 $62,344 $31,200 $49,900 $74,800Metro Vancouver 960,890 $72,662 $36,300 $58,100 $87,200
Source: Statistics Canada, 2016 Census
Note: Values for income thresholds are rounded to nearest 100.
1.1
Income Thresholds

METRO VANCOUVER HOUSING DATA BOOK ... Annual Median Income 2005 ‐ 2015
1.1.1
Description
Statistics Canada taxfiler data is used to present annual figures for
median income. The data is based on tax returns submitted to
Revenue Canada annually (matched for families comprised of 2 or
more persons, and for unattached individuals). The data thus
excludes those families and unattached individuals who do not file a
tax return.
Median income figures from taxfiler data differ from 2016 Census
figures due to the difference in coverage and definitions. The 2016
Census reported median household income of $72,336 for all
households in 2015 (includes non‐family households) compared to
$79,930 reported by Statistics Canada taxfiler data for all families
(excludes unattached individuals).
Key Findings
In the recent 5 year period the median income of all families in Metro
Vancouver increased from $67,090 in 2010 to $79,930 in 2015
(19.1%). Nationally, the median income for all families increased by
15.9%, from $69,860 in 2010 to $80,940 in 2015.
There is a substantial difference between the income of a family
(2+ persons) and unattached individuals. The unattached individuals’
median income of $27,890 is just over a third of a families’ median
income ($79,930 in 2015) in Metro Vancouver.
Unattached individuals in Metro Vancouver show an increase of
13.1% over the 5 year period from 2010 – 2015 (from $25,650 in 2010
to $26,880 in 2015), slightly below the national median income for
unattached individuals’ increase of 15.1 % over the same period. The
2015 median income for unattached individuals in Metro Vancouver is
less than the national rate of $28,410, whereas the regional rate had
exceeded the nation rate prior to 2009.
Annual Median Income in Metro Vancouver for All Families and Unattached Individuals, 2005 ‐ 2015
Source: Statistics Canada Income Statistics Division CANSIM (table 111‐0011 and 111‐0012)
Annual Median Income for Families and Unattached Individuals, 2007 ‐ 2015
Source: Statistics Canada Income Statistics Division CANSIM (table 111‐0011 and 111‐0012)
Note: “All families” consists of couple families and lone parent families.

METRO VANCOUVER HOUSING DATA BOOK ... Renter Households Income and Affordability
1.2
Description
Affordable housing is defined as housing that does not cost more than
30% of a household’s gross income. Different households are affected
by affordability challenges in different ways. Based on the 2016
Census, the median annual household income for renter households
in Metro Vancouver was $48,959.
Key Findings
Metro Vancouver’s median renter household income of $48,959 is
equal to approximately 67% of the median household income for all
households in the region ($72,585).
Based on the median income of $48,959, an “affordable rent” was
$1,224 per month. According to the 2016 Census, the average rent
across all households in the region was $1,054 and the median rent
was $968.
According to the 2016 CMHC rental market report, the median rent
for the region was $1,127 per month for purpose built rental
apartment units. (There is an affordability gap of approximately $97
per month between the rent that paid by the average renter
household and the median income for renter households.)
2016 Census data shows the median household income for renter
households varies across the region, from $45,411 in Burnaby / New
Westminster subregion to $52,695 on the North Shore.
Median Household Income for Renter Households by Subregion in Metro Vancouver, 2016
Median Household Income for Renter Households, Subregions in Metro Vancouver, 2016
Source: Statistics Canada, 2016 Census

Housing Data Book Income Distribution for All Households
Household Income by Income Groups for Metro Vancouver Municipalities, 2016
Total Median Hshld Total Median Hshld Affordable Total Median Hshld Affordable Municipality Dwellings Income # Income Housing Cost * # Income Housing Cost *Anmore 690 $148,582 60 $100,760 $2,519 630 $153,883 $3,847Belcarra 255 $136,112 25 $0 $0 230 $154,863 $3,872Bowen Island 1,495 $88,540 265 $56,791 $1,420 1,230 $97,444 $2,436Burnaby 92,200 $64,899 34,985 $45,839 $1,146 57,220 $80,492 $2,012Coquitlam 51,325 $74,475 14,540 $46,425 $1,161 36,780 $89,265 $2,232Delta 35,760 $92,156 7,575 $56,195 $1,405 28,190 $104,000 $2,600Electoral Area 'A' 6,095 $45,089 3,265 $34,294 $857 2,830 $59,956 $1,499Langley City 11,840 $59,645 4,505 $38,380 $960 7,340 $73,676 $1,842Langley Township 41,980 $90,815 7,345 $54,761 $1,369 34,640 $100,065 $2,502Lions Bay 495 $119,507 40 $73,116 $1,828 450 $130,839 $3,271Maple Ridge 30,255 $86,164 6,095 $44,797 $1,120 24,160 $97,820 $2,446New Westminster 32,710 $64,847 14,370 $44,368 $1,109 18,340 $86,115 $2,153North Vancouver City 24,645 $66,966 11,620 $50,398 $1,260 13,030 $85,991 $2,150North Vancouver District 31,115 $103,889 6,650 $59,344 $1,484 24,460 $119,465 $2,987Pitt Meadows 7,195 $87,017 1,610 $53,268 $1,332 5,580 $98,055 $2,451Port Coquitlam 21,755 $83,918 5,025 $49,432 $1,236 16,730 $95,752 $2,394Port Moody 12,975 $93,521 3,245 $66,690 $1,667 9,725 $105,118 $2,628Richmond 73,455 $65,368 18,910 $48,989 $1,225 54,550 $71,840 $1,796Surrey 169,965 $77,515 49,020 $47,965 $1,199 120,945 $92,614 $2,315Tsawwassen 325 $85,885 30 $61,101 $1,528 290 $96,222 $2,406Vancouver 283,915 $65,423 150,750 $50,251 $1,256 133,170 $88,427 $2,211West Vancouver 16,930 $90,016 4,260 $48,392 $1,210 12,675 $112,697 $2,817White Rock 10,005 $61,865 3,210 $41,790 $1,045 6,795 $73,667 $1,842Metro Vancouver 960,890 $72,585 348,695 $48,959 $1,224 612,005 $90,278 $2,257
* Affordable Housing Cost for a median income household is equal to 30% of household income, shown as a monthly cost.
Source: Statistics Canada, 2016 CensusNote: Total Dwellings includes Band Housing, but Band Housing is not shown/included in either Renter or Owner household sub-groups. Note: Values may not add up to 100% of Metro Vancouver total figures due to rounding, data suppression, and customized data orders.
1.2
All Households Renter Households Owner Households

METRO VANCOUVER HOUSING DATA BOOK ... Owner Households Income and Affordability
1.3
Description
Affordable housing is defined as housing that does not cost more than
30% of a household’s gross income. Different households are affected
by affordability challenges in different ways. Based on the 2016
Census the median annual household income for owner households in
Metro Vancouver was $90,278.
Key Findings
Metro Vancouver’s median household income of $90,278 for owner
households is approximately 19% higher than the median household
income for all households in the region ($75,585).
Based on the median income of $90,278 a monthly “affordable
housing cost” is $2,257 per month (30% of household income).
According to the 2016 Census, the average shelter cost for owners
across all households in the region was $1,622 and the median
shelter cost was $1,376, within the affordability threshold.
Assuming some standard assumptions, an annual household income
of $90,278 may be able to support a home purchase of $400,000 with
a monthly mortgage payment of $1,850. *
2016 Census data shows that the annual median household income
for owner households varies across the region, from $81,857 in
Burnaby / New Westminster subregion to $109,254 on the North
Shore.
* Estimate, assuming a 10% down payment, 25 year amortization period, 3.5% mortgage rate, $2,000 annual property taxes and $250 for monthly strata fees.
Median Household Income for Owner Households, Subregions in Metro Vancouver, 2016
Median Household Income for Owner Households by Subregion in Metro Vancouver, 2016
Source: Statistics Canada, 2016 Census

Housing Data Book Income Distribution for All Households
Household Income by Income Groups for Metro Vancouver Municipalities, 2016
Total Median Hshld Total Median Hshld Affordable Total Median Hshld Affordable Municipality Dwellings Income # Income Housing Cost * # Income Housing Cost *Anmore 690 $148,582 60 $100,760 $2,519 630 $153,883 $3,847Belcarra 255 $136,112 25 $0 $0 230 $154,863 $3,872Bowen Island 1,495 $88,540 265 $56,791 $1,420 1,230 $97,444 $2,436Burnaby 92,200 $64,899 34,985 $45,839 $1,146 57,220 $80,492 $2,012Coquitlam 51,325 $74,475 14,540 $46,425 $1,161 36,780 $89,265 $2,232Delta 35,760 $92,156 7,575 $56,195 $1,405 28,190 $104,000 $2,600Electoral Area 'A' 6,095 $45,089 3,265 $34,294 $857 2,830 $59,956 $1,499Langley City 11,840 $59,645 4,505 $38,380 $960 7,340 $73,676 $1,842Langley Township 41,980 $90,815 7,345 $54,761 $1,369 34,640 $100,065 $2,502Lions Bay 495 $119,507 40 $73,116 $1,828 450 $130,839 $3,271Maple Ridge 30,255 $86,164 6,095 $44,797 $1,120 24,160 $97,820 $2,446New Westminster 32,710 $64,847 14,370 $44,368 $1,109 18,340 $86,115 $2,153North Vancouver City 24,645 $66,966 11,620 $50,398 $1,260 13,030 $85,991 $2,150North Vancouver District 31,115 $103,889 6,650 $59,344 $1,484 24,460 $119,465 $2,987Pitt Meadows 7,195 $87,017 1,610 $53,268 $1,332 5,580 $98,055 $2,451Port Coquitlam 21,755 $83,918 5,025 $49,432 $1,236 16,730 $95,752 $2,394Port Moody 12,975 $93,521 3,245 $66,690 $1,667 9,725 $105,118 $2,628Richmond 73,455 $65,368 18,910 $48,989 $1,225 54,550 $71,840 $1,796Surrey 169,965 $77,515 49,020 $47,965 $1,199 120,945 $92,614 $2,315Tsawwassen 325 $85,885 30 $61,101 $1,528 290 $96,222 $2,406Vancouver 283,915 $65,423 150,750 $50,251 $1,256 133,170 $88,427 $2,211West Vancouver 16,930 $90,016 4,260 $48,392 $1,210 12,675 $112,697 $2,817White Rock 10,005 $61,865 3,210 $41,790 $1,045 6,795 $73,667 $1,842Metro Vancouver 960,890 $72,585 348,695 $48,959 $1,224 612,005 $90,278 $2,257
* Affordable Housing Cost for a median income household is equal to 30% of household income, shown as a monthly cost.
Source: Statistics Canada, 2016 CensusNote: Total Dwellings includes Band Housing, but Band Housing is not shown/included in either Renter or Owner household sub-groups. Note: Values may not add up to 100% of Metro Vancouver total figures due to rounding, data suppression, and customized data orders.
1.3
All Households Renter Households Owner Households

METRO VANCOUVER HOUSING DATA BOOK ... Income Distribution for All Households
1.4
Description
The income distribution for all households is provided, along with
information on the number of households that fit within the different
income categories identified in section 1.1.
Key Findings
Region wide, 23% (218,915) of all households had very low household
incomes (below $35,000, or below 50% of regional median household
income).
Household income data shows that 19% (179,680) of all households
had annual incomes between $35,000 and $60,000. This fits the
general definition of low income (between 50% ‐ %80 of regional
median household income).
The data shows that 16% (152,840) of all households had annual
incomes between $60,000 and $85,000. This fits the general definition
of moderate income (between 80% and 120% of the regional median
household income).
The data shows that 12% (116,730) of all households had annual
incomes between $85,000 and $110,000. This aligns approximately
with the definition of above‐moderate income (between 120% and
150% of the regional median household income).
Municipalities with a higher proportion of households with very low
incomes (27% compared to 23% regionally) include Burnaby, Langley
City, Richmond, Vancouver and White Rock.
Municipalities with a high proportion of households with incomes
above $110,000 include Langley Township (39%), Delta (40%), Port
Moody (41%), West Vancouver (43%) and District of North Vancouver
(48%).
.
Households by Income Group in Metro Vancouver, 2015
Source: Statistics Canada, 2016 Census
* Income groups are rounded to the nearest $5,000 for reporting purposes.In 2015 the median household income was $72,662, therefore the reporting income for 50% or less was defined as incomes of under $35,000 ($36,330). The reporting threshold for 80% is $60,000 ($58,130) and for 120% the reporting threshold is $85,000 ($87,190).

Housing Data Book Income Distribution for All Households
Household Income by Income Groups for Metro Vancouver Municipalities, 2015Total Median
Hshlds Hshld Municipality # Income # % # % # % # % # % # %Anmore 685 $139,469 70 10% 60 9% 65 9% 70 10% 120 18% 310 45%Belcarra 255 $128,256 15 6% 25 10% 30 12% 35 14% 40 16% 110 43%Bowen Island 1,495 $89,856 255 17% 240 16% 230 15% 185 12% 225 15% 375 25%Burnaby 92,205 $64,737 24,880 27% 18,070 20% 14,745 16% 10,565 11% 11,660 13% 12,285 13%Coquitlam 51,325 $74,383 11,220 22% 9,660 19% 7,925 15% 6,155 12% 7,340 14% 9,040 18%Delta 35,755 $92,300 5,070 14% 5,660 16% 5,590 16% 4,980 14% 6,420 18% 8,035 22%Electoral Area 'A' 6,105 $46,322 2,640 43% 890 15% 670 11% 495 8% 540 9% 875 14%Langley City 11,840 $59,452 3,255 27% 2,725 23% 2,145 18% 1,435 12% 1,395 12% 880 7%Langley Township 41,980 $90,594 6,115 15% 6,765 16% 6,705 16% 5,905 14% 7,545 18% 8,960 21%Lions Bay 495 $125,082 35 7% 55 11% 60 12% 60 12% 95 19% 195 39%Maple Ridge 30,260 $86,178 5,175 17% 4,970 16% 4,765 16% 4,310 14% 5,365 18% 5,685 19%New Westminster 32,705 $64,695 8,060 25% 7,075 22% 5,645 17% 4,015 12% 4,100 13% 3,830 12%North Vancouver City 24,645 $67,119 5,930 24% 5,090 21% 4,115 17% 2,890 12% 3,085 13% 3,545 14%North Vancouver District 31,120 $103,981 4,390 14% 4,175 13% 4,130 13% 3,620 12% 4,695 15% 10,115 33%Pitt Meadows 7,195 $86,912 1,095 15% 1,225 17% 1,200 17% 1,100 15% 1,275 18% 1,320 18%Port Coquitlam 21,755 $84,096 3,450 16% 3,850 18% 3,695 17% 3,085 14% 3,950 18% 3,735 17%Port Moody 12,975 $92,922 1,910 15% 1,930 15% 1,995 15% 1,835 14% 2,275 18% 3,035 23%Richmond 73,455 $65,241 19,520 27% 14,505 20% 11,645 16% 8,705 12% 9,435 13% 9,655 13%Surrey 169,965 $77,494 31,620 19% 32,440 19% 29,200 17% 23,375 14% 26,305 15% 27,020 16%Tsawwassen FN 320 $84,053 50 16% 65 20% 45 14% 45 14% 55 17% 60 19%Vancouver 283,915 $65,327 76,855 27% 54,695 19% 44,190 16% 30,995 11% 33,250 12% 43,945 15%West Vancouver 16,935 $89,808 3,555 21% 2,565 15% 2,005 12% 1,500 9% 1,845 11% 5,465 32%White Rock 10,005 $62,344 2,675 27% 2,160 22% 1,580 16% 1,060 11% 1,045 10% 1,485 15%Metro Vancouver 960,895 $72,662 218,915 23% 179,680 19% 152,845 16% 116,730 12% 132,395 14% 160,325 17%
Source: Statistics Canada, 2016 Census
Note: Values may not add up to 100% of Metro Vancouver total figures due to rounding, data suppression, and customized data orders. Note: Household income groups for "Under $35,000", "$35,000 to $59,999" and "$60,000 to $84,999" are created by Metro Vancouver to assist with affordability research.Note: any re-distribution of income groups would be based on the assumption of equal distribution of households within the standard income groups.
* Income groups are rounded to the nearest $5,000 for reporting purposes.The median household income is $72,662. For households earning 50% or less of the regional median hshld income, the income threshold is $35,000 ($36,330). The household income threshold for 80% is $60,000 ($58,130), for 120% the income threshold is $85,000 ($87,190), and for 150% income threshold is $110,000 ($108,990).
1.4
$150,000 and overUnder $35,000 $35,000-$59,999 $60,000-$84,999 $85,000-$109,999 $110,000-$149,999Hshld Income Hshld IncomeHshld Income Hshld Income Hshld Income Hshld Income

METRO VANCOUVER HOUSING DATA BOOK ... Income Distribution for Renter Households
1.5
Description
In 2016, there were 348,695 renter households in Metro Vancouver
representing approximately one‐third (36%) of all households across
the region.
The median income for renter households was $48,959, which is
equal to 67% of the median household income for all households in
the region.
Key Findings
Region wide there were 126,630 households with very low incomes,
earning less than $35,000 per year in 2015, representing 36% of all
renter households.
Household income data shows that 23% (80,755) of renter households
had annual incomes between $35,000 and $60,000. This aligns with
Metro Vancouver’s definition of low income (between 50% ‐ 80% of
regional median household income).
The data shows that 18% (63,450) of all renter households had annual
incomes between $60,000 and $85,000. This range approximates
Metro Vancouver’s definition of moderate income (between 80% and
120% of the regional median household income).
Household income data shows that 24% (62,665) of renter households
had annual incomes over $85,000. This income threshold fits Metro
Vancouver’s definitions of above‐moderate and high income (greater
than 120% of regional median household income), considered the
threshold for entry‐level home ownership. At $85,000 household
income, a household would be able to afford to purchase a home
costing $350,000. 1
1. CMHC Affordability calculator with 10% down, 25 year amortization, 3.45 mortgage interest rate,
$175 monthly property tax, plus $250 for monthly strata fees & heating costs.
Renter Households by Household Income Group in Metro Vancouver, 2015
Source: Statistics Canada, 2016 Census
* Income groups are rounded to the nearest $5,000 for reporting purposes.In 2015 the median household income was $72,662, therefore the reporting income for 50% or less was defined as incomes of under $35,000 ($36,330). The reporting threshold for 80% is $60,000 ($58,130), for 120% the reporting threshold is $85,000 ($87,190) and for 150% it is $110,000 ($108,993).

Housing Data Book Income Distribution for Renter Households
Renter Household Income by Income Groups for Metro Vancouver Municipalities, 2015Total Median
Hshlds Hshld Municipality # Income # % # % # % # % # %Anmore 60 $100,760Belcarra 25 n/aBowen Island 265 $56,791 95 36% 45 17% 65 25% 30 11% 40 15%Burnaby 34,985 $45,839 13,785 39% 7,960 23% 6,385 18% 3,310 9% 4,160 12%Coquitlam 14,540 $46,425 5,375 37% 3,860 27% 2,580 18% 1,355 9% 1,745 12%Delta 7,575 $56,195 2,300 30% 1,790 24% 1,420 19% 930 12% 1,285 17%Electoral Area 'A' 3,265 $34,294 1,655 51% 490 15% 395 12% 270 8% 490 15%Langley City 4,505 $38,380 2,085 46% 1,085 24% 785 17% 325 7% 310 7%Langley Township 7,345 $54,761 2,175 30% 1,870 25% 1,525 21% 865 12% 1,100 15%Lions Bay 40 $73,116Maple Ridge 6,095 $44,797 2,375 39% 1,460 24% 1,055 17% 585 10% 720 12%New Westminster 14,370 $44,368 5,575 39% 3,775 26% 2,670 19% 1,290 9% 1,405 10%North Vancouver City 11,620 $50,398 3,890 33% 2,820 24% 2,170 19% 1,235 11% 1,655 14%North Vancouver District 6,650 $59,344 2,040 31% 1,305 20% 1,190 18% 775 12% 1,420 21%Pitt Meadows 1,610 $53,268 460 29% 480 30% 320 20% 185 11% 230 14%Port Coquitlam 5,025 $49,432 1,750 35% 1,245 25% 990 20% 460 9% 680 14%Port Moody 3,245 $66,690 770 24% 685 21% 665 20% 500 15% 670 21%Richmond 18,910 $48,989 7,010 37% 4,170 22% 3,230 17% 2,020 11% 2,755 15%Surrey 49,020 $47,965 17,460 36% 12,525 26% 9,755 20% 4,705 10% 5,530 11%Tsawwassen FN 30 $61,101Vancouver 150,750 $50,251 54,335 36% 33,250 22% 26,870 18% 15,990 11% 22,700 15%West Vancouver 4,260 $48,392 1,655 39% 825 19% 635 15% 425 10% 775 18%White Rock 3,210 $41,790 1,345 42% 795 25% 545 17% 245 8% 370 12%Metro Vancouver 348,695 $48,959 126,630 36% 80,755 23% 63,450 18% 35,630 10% 48,250 14%
Source: Statistics Canada, 2016 Census
Note: Values may not add up to 100% of Metro Vancouver total figures due to rounding, data suppression, and customized data orders. Note: Household income groups for "Under $35,000", "$35,000 to $59,999" and "$60,000 to $84,999" are created by Metro Vancouver to assist with affordability research.Note: Any re-distribution of income groups would be based on the assumption of equal distribution of households within the standard income groups.
* Income groups are rounded to the nearest $5,000 for reporting purposes.The median household income is $72,662. For households earning 50% or less of the regional median hshld income, the income threshold is $35,000 ($36,330). The household income threshold for 80% is $60,000 ($58,130), for 120% the income threshold is $85,000 ($87,190), and for 150% income threshold is $110,000 ($108,990).
1.5
Hshld Income Hshld Income Hshld Income Hshld Income Hshld IncomeUnder $35,000 $35,000-$59,999 $60,000-$84,999 $85,000-$109,999 $110,000 and over

METRO VANCOUVER HOUSING DATA BOOK ... Income Distribution for Owner Households
1.6
Description
In 2016, there were 612,005 owner households in Metro Vancouver
representing approximately two‐thirds of all households in the region.
The median income for owner households was $90,278, which is
equal to 124% of the median household income for all households in
the region.
Key Findings
Region wide there were 91,975 owner households with very low
incomes, earning less than $35,000 per year in 2015, representing
15% of all owner occupied households.
Household income data shows that 16% (98,325) of owner
households had annual incomes between $35,000 and $60,000. This
aligns with Metro Vancouver’s definition of low income (between 50%
‐ 80% of regional median household income).
Census data shows that 16% (97,695) of all owner households had
annual incomes between $60,000 and $85,000. This range
approximates Metro Vancouver’s definition of moderate income
(between 80% and 120% of the regional median household income).
Household income data shows that 54% (352,500) of owner
households had annual incomes over $85,000. This income threshold
fits Metro Vancouver’s definitions of above‐moderate and high
income (greater than 120% of regional median household income),
considered the threshold for entry‐level home ownership. At $85,000
household income, a household would be able to afford to purchase a
home costing $350,000. . At $110,000 annual income, a household
would be able to afford to purchase a home costing $400,000. 1
1. CMHC Affordability calculator estimate, with 10% down, 25 year amortization, 3.45 mortgage interest
rate, $175 monthly property tax, plus $225 for monthly strata fees & heating costs.
Owner Households by Household Income Group in Metro Vancouver, 2015
Source: Statistics Canada, 2016 Census
* Income groups are rounded to the nearest $5,000 for reporting purposes.In 2015 the median household income was $72,662, therefore the reporting income for 50% or less was defined as incomes of under $35,000 ($36,330). The reporting threshold for 80% is $60,000 ($58,130), for 120% the reporting threshold is $85,000 ($87,190) and for 150% it is $110,000 ($108,993).

Housing Data Book Income Distribution for Owner Households
Owner Household Income by Income Groups for Metro Vancouver Municipalities, 2015Total Median
Hshlds Hshld Municipality # Income # % # % # % # % # %Anmore 630 $153,883 35 6% 50 8% 55 9% 90 14% 380 60%Belcarra 230 $154,863 10 4% 20 9% 25 11% 40 17% 145 63%Bowen Island 1,230 $97,444 180 15% 160 13% 205 17% 170 14% 535 43%Burnaby 57,220 $80,492 10,960 19% 10,080 18% 9,375 16% 7,155 13% 19,925 35%Coquitlam 36,780 $89,265 5,750 16% 5,880 16% 5,840 16% 4,810 13% 14,535 40%Delta 28,190 $104,000 2,780 10% 3,825 14% 4,340 15% 4,050 14% 13,155 47%Electoral Area 'A' 2,830 $59,956 1,010 36% 400 14% 310 11% 260 9% 855 30%Langley City 7,340 $73,676 1,225 17% 1,580 22% 1,520 21% 1,025 14% 2,085 28%Langley Township 34,640 $100,065 3,790 11% 4,965 14% 5,405 16% 5,035 15% 15,435 45%Lions Bay 450 $130,839 30 7% 45 10% 55 12% 75 17% 250 56%Maple Ridge 24,160 $97,820 2,805 12% 3,475 14% 3,710 15% 3,515 15% 10,505 43%New Westminster 18,340 $86,115 2,500 14% 3,275 18% 3,280 18% 2,680 15% 6,630 36%North Vancouver City 13,030 $85,991 2,040 16% 2,250 17% 2,230 17% 1,690 13% 4,895 38%North Vancouver District 24,460 $119,465 2,365 10% 2,835 12% 3,040 12% 3,470 14% 12,765 52%Pitt Meadows 5,580 $98,055 625 11% 840 15% 870 16% 900 16% 2,380 43%Port Coquitlam 16,730 $95,752 1,695 10% 2,625 16% 2,840 17% 2,470 15% 7,110 42%Port Moody 9,725 $105,118 1,115 11% 1,270 13% 1,330 14% 1,430 15% 4,590 47%Richmond 54,550 $71,840 12,465 23% 10,280 19% 9,320 17% 6,425 12% 16,520 30%Surrey 120,945 $92,614 14,370 12% 19,565 16% 20,360 17% 17,960 15% 48,730 40%Tsawwassen FN 290 $96,222 50 17% 65 22% 45 16% 35 12% 125 43%Vancouver 133,170 $88,427 22,425 17% 21,325 16% 20,590 15% 17,120 13% 52,190 39%West Vancouver 12,675 $112,697 1,945 15% 1,715 14% 1,435 11% 1,490 12% 6,130 48%White Rock 6,795 $73,667 1,280 19% 1,420 21% 1,240 18% 840 12% 2,100 31%Metro Vancouver 612,005 $90,278 91,975 15% 98,325 16% 97,695 16% 82,960 14% 242,540 40%
Source: Statistics Canada, 2016 Census
Note: Values may not add up to 100% of Metro Vancouver total figures due to rounding, data suppression, and customized data orders. Note: Household income groups for "Under $35,000", "$35,000 to $59,999" and "$60,000 to $84,999" are created by Metro Vancouver to assist with affordability research.Note: Any re-distribution of income groups would be based on the assumption of equal distribution of households within the standard income groups.
* Income groups are rounded to the nearest $5,000 for reporting purposes.The median household income is $72,662. For households earning 50% or less of the regional median hshld income, the income threshold is $35,000 ($36,330). The household income threshold for 80% is $60,000 ($58,130), for 120% the income threshold is $85,000 ($87,190), and for 150% income threshold is $110,000 ($108,990).
1.6
Hshld Income Hshld Income Hshld Income Hshld Income Hshld IncomeUnder $35,000 $35,000-$59,999 $60,000-$84,999 $85,000-$109,999 $110,000 and over
METRO VANCOUVER HOUSING DATA BOOK ... Dwelling Units by Structure Type, 2016 Census
2.1
Description
The Metro Vancouver Board Strategic Plan recognizes the need for a
diverse supply of housing across the region. This includes different
types and tenures of housing units which can offer improved
affordability across all income levels.
Key Findings
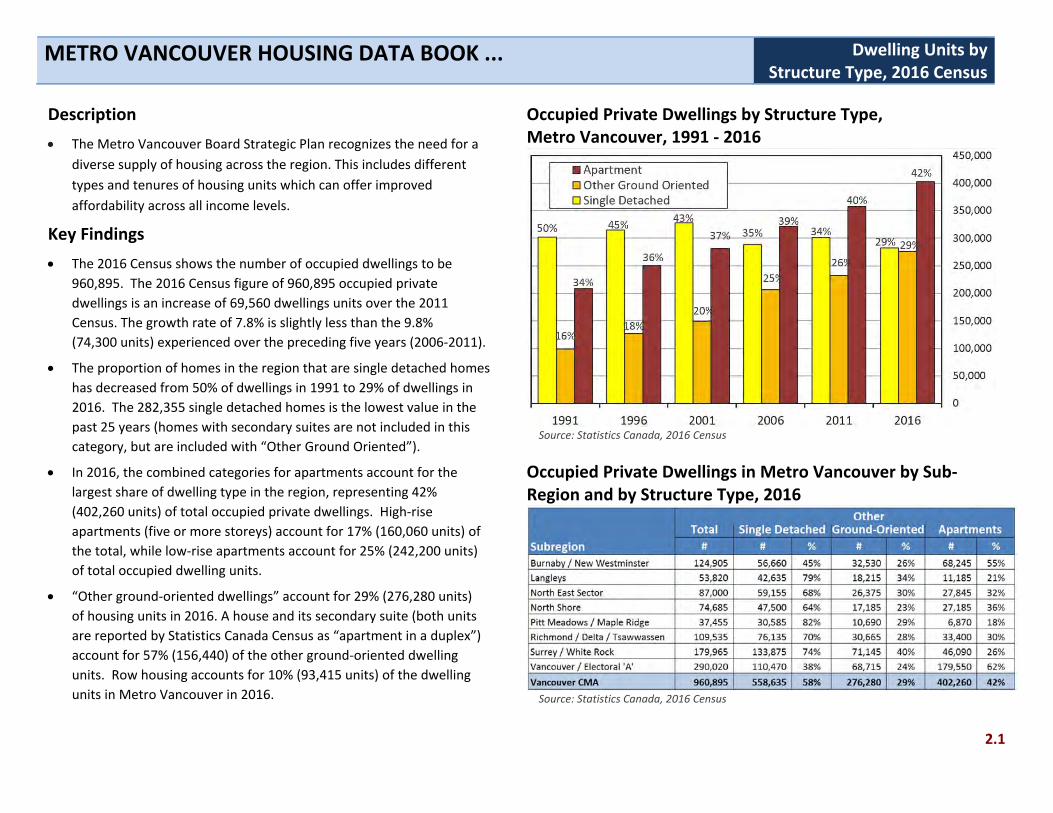
The 2016 Census shows the number of occupied dwellings to be
960,895. The 2016 Census figure of 960,895 occupied private
dwellings is an increase of 69,560 dwellings units over the 2011
Census. The growth rate of 7.8% is slightly less than the 9.8%
(74,300 units) experienced over the preceding five years (2006‐2011).
The proportion of homes in the region that are single detached homes
has decreased from 50% of dwellings in 1991 to 29% of dwellings in
2016. The 282,355 single detached homes is the lowest value in the
past 25 years (homes with secondary suites are not included in this
category, but are included with “Other Ground Oriented”).
In 2016, the combined categories for apartments account for the
largest share of dwelling type in the region, representing 42%
(402,260 units) of total occupied private dwellings. High‐rise
apartments (five or more storeys) account for 17% (160,060 units) of
the total, while low‐rise apartments account for 25% (242,200 units)
of total occupied dwelling units.
“Other ground‐oriented dwellings” account for 29% (276,280 units)
of housing units in 2016. A house and its secondary suite (both units
are reported by Statistics Canada Census as “apartment in a duplex”)
account for 57% (156,440) of the other ground‐oriented dwelling
units. Row housing accounts for 10% (93,415 units) of the dwelling
units in Metro Vancouver in 2016.
Occupied Private Dwellings by Structure Type, Metro Vancouver, 1991 ‐ 2016
Source: Statistics Canada, 2016 Census
Occupied Private Dwellings in Metro Vancouver by Sub‐Region and by Structure Type, 2016
Source: Statistics Canada, 2016 Census

Housing Data Book Housing Inventory by Structure Type
Housing Inventory by Structure Type for Metro Vancouver Municipalities, 2001 - 20162001 2006
Municipality
Total Occupied
HshldsSingle
Detached
Other Ground- Oriented Apartment
Total Occupied
HshldsSingle
Detached
Other Ground- Oriented Apartment
Total Occupied
HshldsSingle
Detached
Other Ground- Oriented Apartment
Total Occupied
HshldsSingle
Detached
Other Ground- Oriented Apartment
Anmore 430 290 140 - 535 355 180 - 620 435 185 - 690 485 205 - Belcarra 260 230 30 - 255 225 30 - 275 225 50 - 255 210 45 - Bowen Island 1,130 1,060 55 15 1,340 1,210 75 55 1,350 1,180 110 60 1,495 1,335 85 75 Burnaby 74,000 26,550 15,230 32,220 78,030 21,280 21,070 35,680 86,845 21,360 23,250 42,235 92,200 19,135 27,215 45,850 Coquitlam 40,220 20,685 8,345 11,190 41,235 19,225 10,050 11,960 45,545 20,155 11,630 13,760 51,325 19,785 14,250 17,290 Delta 32,785 23,360 4,730 4,695 33,550 21,590 6,810 5,150 34,760 22,155 7,585 5,020 35,760 20,940 9,630 5,190 Electoral Area 'A' 2,715 500 770 1,445 4,500 470 790 3,240 5,040 470 825 3,745 6,105 425 765 4,915 Langley City 10,085 3,100 1,755 5,230 10,570 2,790 1,980 5,800 11,320 2,805 2,135 6,380 11,840 2,730 2,280 6,830 Langley Township 29,670 20,890 6,705 2,075 33,320 20,210 10,595 2,515 37,235 21,940 12,380 2,915 41,980 21,690 15,935 4,355 Lions Bay 520 500 15 5 520 455 60 5 505 450 40 15 495 470 25 - Maple Ridge 22,595 14,650 4,390 3,555 24,935 15,250 5,845 3,840 28,040 16,650 6,895 4,495 30,260 16,830 8,340 5,090 New Westminster 26,025 6,170 3,055 16,800 27,045 4,945 4,225 17,875 30,580 5,580 4,320 20,680 32,705 4,995 5,315 22,395 North Vancouver City 20,705 4,105 4,410 12,190 21,345 3,390 4,830 13,125 22,785 3,430 5,100 5,375 24,645 2,955 5,795 15,895 North Vancouver District 29,075 18,455 5,905 4,715 29,745 16,915 7,640 5,190 30,560 17,130 8,055 14,255 31,115 16,200 8,870 6,045 Pitt Meadows 5,305 3,145 1,255 905 5,820 3,070 1,765 985 6,720 3,120 2,250 1,350 7,195 3,065 2,350 1,780 Port Coquitlam 17,755 9,270 5,120 3,365 18,710 8,725 6,185 3,800 20,645 8,625 6,945 5,075 21,755 8,375 7,705 5,675 Port Moody 8,535 3,775 2,820 1,940 10,130 3,840 3,725 2,565 12,620 4,000 4,035 4,585 12,975 3,925 4,170 4,880 Richmond 56,775 26,865 13,100 16,810 61,420 25,255 17,305 18,860 67,980 25,320 19,500 23,160 73,455 24,315 21,015 28,125 Surrey 115,715 64,060 29,220 22,435 131,145 56,790 43,695 30,660 152,850 64,515 53,190 35,145 169,960 60,195 69,155 40,610 Vancouver 236,100 65,390 39,580 131,130 253,215 48,365 55,340 149,510 264,570 47,535 59,340 157,695 283,915 41,330 67,950 174,635 West Vancouver 16,335 10,290 1,375 4,670 16,840 9,725 2,240 4,875 17,085 9,845 2,300 4,940 16,935 9,355 2,410 5,170 White Rock 9,080 3,330 1,070 4,680 9,525 2,685 1,790 5,050 9,865 2,820 1,735 5,310 10,005 2,535 1,990 5,480
Metro Vancouver 758,715 327,655 149,610 281,450 817,035 288,320 206,745 321,970 891,340 301,140 232,360 357,840 960,895 282,355 276,280 402,260 Source: Statistics Canada, 2001, 2006, 2011 and 2016 Census
Note: Metro Vancouver total includes Indian Reserves and Tsawwassen First Nation.Note: "Other Ground-Oriented" includes Semi-detached, Apartment-duplex, Row house, Other single detached and moveable dwellings.Note: In 2006, 'apartment or flat in a duplex' replaces 'apartment or flat in a detached duplex' and includes duplexes attached to other dwellings or buildings. This is a change from the 2001 Census where duplexes attached to other dwellings or buildings were classified as an 'apartment in a building that has fewer than five storeys'. When examining increases and decreases among specific structural types, it cannot be determined how much of the change is a result of the improved enumeration methods, the additional classification instructions, or real increases since the last Census.Note: In 2011 Metro Vancouver staff have identified that some seniors apartment buildings may have been identified as "Collective Dwellings", whereas in 2006 they may have been reported as "apartment" units.Note: Values may not add up to 100% of Metro Vancouver total figures due to rounding, data suppression, and customized data orders.
2.1
20162011

METRO VANCOUVER HOUSING DATA BOOK ... Housing Starts
2.2
Description
The number of housing starts over the past decade reflects economic
patterns and the cyclical nature of the housing market.
The global economic downturn of 2008/09 resulted in a steep drop in
housing starts in 2009, but the past seven years has seen a recovery in
the housing start.
Key Findings
2017 saw 26,204 housing starts in the region. This is the second
highest number of starts in the past 15 years and is a substantial
increase (38%) of more than 7,175 starts over the 19,027 housing
starts reported five years earlier (2012).
For the period from 2008 to 2017 (10 years) the number of annual
housing starts ranged from a low of 8,399 in 2009 to a high of 27,914
in 2016.
The subregion with the highest proportion of the total regional starts
is Vancouver / Electoral Area A with 23% of the regional total,
followed by Burnaby / New Westminster subregion with 21% and
Surrey / White Rock also with 21% of the total regional housing starts
in 2017.
The City of Vancouver saw the most housing starts of the
municipalities in 2017 with 5,617 starts. The second highest number
of starts occurred in the City of Surrey (5,380), following by Burnaby
(4,173), Coquitlam (2,130), and Richmond (2,070).
Housing Starts in Metro Vancouver, 2001 ‐ 2017
Source: CMHC Housing Now – Local Housing Market Data
Housing Starts by Metro Vancouver Subregions, 2012‐2017
Note: Electoral Area A includes UBC/UEL Source: CMHC Housing Now – Local Housing Market Data

Housing Data Book Housing Starts
Housing Starts for Metro Vancouver Municipalities, 2007 - 2017
Municipality 2007 2008 2009 2010 2011 2012 2013 2014 2015 2016 20175 Yr
Average10 Yr
AverageAnmore 17 20 9 28 13 11 10 21 10 24 31 19 18Belcarra 2 3 2 1 2 0 0 5 0 3 2 2 2Bowen Island 26 25 17 27 26 15 7 48 18 29 45 29 26Burnaby 2,268 1,643 852 1,288 1,611 1,528 2,298 1,674 1,918 4,172 4,173 2,847 2,116Coquitlam 628 1,565 475 1,131 1,442 1,802 1,390 1,598 971 1,625 2,130 1,543 1,413Delta 112 313 285 438 378 363 289 537 635 482 567 502 429Electoral Area 'A' 476 272 142 240 370 102 522 211 466 215 460 375 300Langley City 133 119 199 171 224 66 18 114 193 32 155 102 129Langley Township 1,209 763 580 907 1,292 1,050 936 1,187 1,304 1,383 1,928 1,348 1,133Lions Bay 3 2 1 2 1 1 1 3 0 0 3 1 1Maple Ridge 745 419 303 443 474 524 400 547 548 826 716 607 520New Westminster 723 468 209 262 368 809 378 551 920 1,235 1,397 896 660North Vancouver City 740 372 44 270 481 480 521 535 833 879 327 619 474North Vancouver District 108 254 216 247 455 256 378 492 330 816 278 459 372Pitt Meadows 289 195 37 14 75 97 154 88 54 18 105 84 84Port Coquitlam 844 228 90 402 47 371 342 375 460 219 485 376 302Port Moody 1,051 374 7 35 26 310 8 9 26 43 42 26 88Richmond 1,944 1,961 685 1,421 2,636 1,708 1,427 3,036 2,657 2,215 2,070 2,281 1,982Surrey 4,862 5,699 2,439 3,617 3,807 3,275 3,071 3,194 4,561 3,471 5,380 3,935 3,851Vancouver 4,087 4,670 1,576 4,075 3,830 5,498 6,071 4,648 4,616 9,759 5,617 6,142 5,036West Vancouver 159 159 56 104 126 446 257 136 183 254 137 193 186White Rock 310 67 115 94 79 315 218 161 160 178 114 166 150Indian Reserves 104 0 0 42 0 36 42 n/a n/aMetro Vancouver 20,736 19,591 8,339 15,217 17,867 19,027 18,696 19,212 20,863 27,914 26,204 22,578 19,293Source: CMHC Canadian Housing Observer and CMHC regional housing data.Note: While data sources are believed to be reliable, the accuracy of the data cannot be guaranteed. Note: Electoral Area 'A' contains data for UBC/UEL (University of British Columbia / University Endowment Lands).Note: Numbers for individual years and municipalities provided by CMHC may not necessarily equal the column total.
Note: Seniors' independent/assisted living units are included in the count if units are self contained with full kitchen. Units where there is only a microwave and bar fridge are excluded
2.2

METRO VANCOUVER HOUSING DATA BOOK ... Housing Starts By Tenure
2.3
Description
One of the priorities set out in the Metro Vancouver Regional
Affordable Housing Strategy is to expand the supply of rental housing,
including new purpose built market rental housing. Over the past
twenty years there have been very few purpose built rental units in
the region, although in recent years, and in 2016 in particular, there
has been growth in rental starts.
Key Findings
2017 CMHC data shows 4,591 rental housing starts in the region. This
is fewer than the previous year (6,841 rental housing starts in 2016)
but is greater than the 3,810 rental housing starts reported in 2015.
The 4,591 rental starts account for 18% of the total housing starts in
2017. The distribution of the rental starts is as follows: 43% in
Vancouver / Electoral Area A; 26% in Burnaby / New Westminster;
11% in Surrey / White Rock; and 17% in the Langley subregion.
The graph shows that since 2002 an increasing proportion of housing
starts have been strata condominium (apartment or townhouse).
Following the 2009 downturn, the condominium starts continue to
exceed the freehold ownership starts in the region. In 2017 65% of
total housing starts were condominium ownership.
The proportion of ownership starts that are condominium varies
among subregions. In 2017 the proportion of ownership starts that
were condominium ranged from 46% in Maple Ridge / Pitt Meadows
to 79% of the ownership starts in the Burnaby / New Westminster
subregion and 72% in Richmond / Delta.
Of the 4,591 rental starts reported for 2017, 40% (1,811) are purpose‐
built market rental apartment units. 42% (1,950) are secondary
suites, 12% (563) are laneway / coach house rental housing and 6%
(266) are for social housing.
Housing Starts by Tenure Metro Vancouver, 2003 ‐ 2017
Source: Canada Mortgage and Housing Corporation (CMHC)
Note: City of Vancouver had 90 cooperative housing unit starts in 2016 (not shown in graph).
Housing Starts by Tenure by Subregion, 2017
Note: Electoral Area A includes UBC/UEL Source: CMHC Housing Now – Local Housing Market Data

Housing Data Book Housing Starts - Purpose Built Rental
Purpose Built Rental Starts for Metro Vancouver Municipalities, 2007 - 2017
Municipality 2007 2008 2009 2010 2011 2012 2013 2014 2015 * 2016 * 2017 *5 Yr
AverageAnmore 0 0 0 0 1 0 3 1 1 0 1 1Belcarra 0 0 0 0 0 0 0 0 0 0 0 0Bowen Island 0 0 0 2 0 2 1 1 0 4 12 4Burnaby 0 0 5 70 64 6 0 167 231 789 493 336Coquitlam 0 0 0 50 32 175 157 197 149 231 260 199Delta 3 13 9 9 2 41 56 166 89 67 91 94Electoral Area A 233 211 46 0 179 0 281 94 0 212 90 135Langley City 0 0 0 0 0 0 0 0 37 0 5 8Langley Township 8 19 20 20 14 146 188 126 220 175 443 230Lions Bay 0 0 0 0 0 0 0 0 0 0 0 0Maple Ridge 32 0 2 1 52 4 3 3 12 27 68 23New Westminster 0 0 0 0 25 25 0 0 316 974 416 341North Vancouver City 0 0 0 52 80 54 44 209 149 253 97 150North Vancouver District 0 32 0 0 146 43 59 131 146 78 97 102Pitt Meadows 0 0 0 0 71 1 0 0 1 2 2 1Port Coquitlam 0 3 0 0 0 19 19 5 12 16 29 16Port Moody 0 0 0 0 0 0 0 0 0 4 4 2Richmond 7 8 0 92 232 163 76 389 367 123 97 210Surrey 191 193 173 164 114 342 275 477 588 598 458 479Vancouver 139 269 192 594 743 1,088 1,944 1,252 1,456 3,245 1,883 1,956West Vancouver 0 0 0 0 0 271 1 0 1 2 2 1White Rock 2 0 0 0 0 32 42 66 35 37 43 45Metro Vancouver 615 748 447 1,054 1,755 2,412 3,149 3,286 3,810 6,841 4,591 4,335Source: Canada Mortgage and Housing Corporation (CMHC)* Note: 2015/2016/2017 data includes secondary suites and laneway rental housing (single detached rental). Note: While data sources are believed to be reliable, the accuracy of the data cannot be guaranteed. Note: Electoral Area A contains data for UBC/UEL (University of British Columbia and University Endowment Lands).Definition: Rental - A dwelling constructed for rental purposes regardless of who finances the structure.
Note: Some data for 2012 have been restated in the above table, to allow comparison with 2013 and 2014 data. Other CMHC reports do not contain this restated data, therefore figures for2012 may not match the above. Effective January 2013, single-detached houses with an attached accessory suite are recorded as one unit "Ownership, Single" and the accessorysuite as one unit "Rental, Apt + Other". In 2012 and prior years, these structures were recorded as two units, "Ownership, Freehold, Apt + Other" in some markets, includingthe Vancouver CMA. The impact of this adjustment was the 2012 figure for Metro Vancouver changed from 1,277 rental starts to 2,412 rental starts.
2.3

Housing Data Book Housing Starts - Purpose Built Rental
Purpose Built Rental Starts** By Rental Housing Type for Metro Vancouver Municipalities, 2015/2016/2017
Municipality2015 2016 2017 2015 2016 2017 2015 2016 2017 2015 2016 2017 2015 2016 2017
Anmore 0 0 0 1 0 1 0 0 0 0 0 0 1 0 0Belcarra 0 0 0 0 0 0 0 0 0 0 0 0 0 0 0Bowen Island 0 1 7 0 3 1 0 0 4 0 0 0 0 4 11Burnaby 231 261 258 0 1 0 0 405 0 0 122 235 231 789 493Coquitlam 114 215 187 5 14 8 0 2 65 30 0 0 149 231 252Delta 87 67 86 1 0 5 1 0 0 0 0 0 89 67 86Electoral Area A 0 0 0 0 0 0 0 212 90 0 0 0 0 212 90Langley City 0 0 5 0 0 0 37 0 0 0 0 0 37 0 5Langley Township 85 147 146 30 28 34 105 0 263 0 0 0 220 175 409Lions Bay 0 0 0 0 0 0 0 0 0 0 0 0 0 0 0Maple Ridge 3 24 50 3 3 10 6 0 8 0 0 0 12 27 58New Westminster 34 58 79 0 1 1 282 915 336 0 0 0 316 974 415North Vancouver City 12 49 53 7 12 15 130 192 29 0 0 0 149 253 82North Vancouver District 48 73 87 0 5 5 98 0 5 0 0 0 146 78 92Pitt Meadows 1 0 0 0 2 2 0 0 0 0 0 0 1 2 0Port Coquitlam 12 16 28 0 0 1 0 0 0 0 0 0 12 16 28Port Moody 0 4 4 0 0 0 0 0 0 0 0 0 0 4 4Richmond 101 120 93 5 3 4 132 0 0 129 0 0 367 123 93Surrey 509 507 433 8 5 4 0 86 20 71 0 0 588 598 453Vancouver 418 439 391 464 547 471 574 1,845 990 0 414 31 1,456 3,245 1,412West Vancouver 0 0 1 1 2 1 0 0 0 0 0 0 1 2 1White Rock 35 37 42 0 0 0 0 0 1 0 0 0 35 37 43Metro Vancouver 1,690 2,018 1,950 525 630 563 1,365 3,623 1,811 230 536 266 3,810 6,841 4,591Source: Canada Mortgage and Housing Corporation (CMHC), custom data request. Note: While data sources are believed to be reliable, the accuracy of the data cannot be guaranteed. Note: Electoral Area A contains data for UBC/UEL (University of British Columbia and University Endowment Lands).Definition: Rental - A dwelling constructed for rental purposes regardless of who finances the structure.
* Note: Single detached rental is usually laneway / coachhouse rental housing that is non-subsidized.** Note: Rental/Non-rental data is for entire building only. If a building has rental units combined with predominately stratified ownership units, it may not appear in this table.
2.3
Accessory Suites Single Detached Rental * Market Rental (apt & row) Social Hsg Rental Total Rental

Housing Data Book Housing Starts by Ownership Type
Ownership Housing Starts by Ownership Type for Metro Vancouver Municipalities, 2013 - 20172013 2014 2015 2016 2017
Municipality Freehold Condominium Freehold Condominium Freehold Condominium Freehold Condominium Freehold CondominiumAnmore 7 0 20 0 9 0 16 8 27 3Belcarra 0 0 5 0 0 0 3 0 2 0Bowen 6 0 17 0 18 0 24 1 33 0Burnaby 330 1,968 484 1,023 408 1,279 434 2,949 385 3,295Coquitlam 331 902 318 1,083 241 581 363 1,031 265 1,605Delta 175 58 159 212 138 408 122 293 186 290Electoral Area A 2 239 12 105 6 460 3 0 10 360
Langley City 13 5 14 100 9 147 10 22 17 133Langley Township 233 515 238 823 250 834 359 849 333 1,152Lion's Bay 1 0 3 0 0 0 0 0 3 0Maple Ridge 192 205 216 328 339 197 407 392 321 327New West 71 307 65 486 62 542 75 186 113 868North Van City 46 431 63 263 40 644 82 544 86 144North Van District 118 201 113 248 145 39 130 608 167 14Pitt Meadows 4 150 20 68 17 36 16 0 21 82Port Coquitlam 52 271 36 334 28 420 42 161 44 412Port Moody 8 0 9 0 12 14 22 17 16 22Richmond 274 1,077 399 2,248 478 1,812 454 1,638 487 1,486Surrey 723 2,073 917 1,800 994 2,979 1,074 1,799 1,092 3,830Vancouver * 1,052 3,075 1,000 2,396 1,049 2,111 842 5,582 745 2,989West Vancouver 139 117 124 12 146 36 195 57 130 5White Rock 63 113 82 13 65 60 52 89 67 4Metro Vancouver 3,840 11,707 4,354 11,542 4,454 12,599 4,757 16,226 4,566 17,047Source: CMHC - Rental Housing Market Reports & Housing Now Reports* Note: There were zero cooperative housing unit starts in 2017.Definition: Freehold - A residence where the owner owns the dwelling and the lot outright.Definition: Condominium - An individual dwelling which is privately owned, but where the building and/or land are collectively owned by all dwelling unit owners.
Note:Electoral Area A includes UBC/UEL (University of British Columbia / University Endowment Lands).
2.3

METRO VANCOUVER HOUSING DATA BOOK ... Housing Starts by Structure Type
2.4
Description
The composition of housing stock in Metro Vancouver has continued
to evolve over the past decade. Multi‐unit developments account for
an increasing proportion of the total housing starts in the region.
Higher density developments can help to contribute to more efficient
use of the land base.
Key Findings
Data reported by CMHC for the period from 2013 to 2017 (5 years),
there were 112,889 housing starts; 40% (45,091) were ground‐
oriented units (single detached, secondary suites, semi‐detached
duplex or row housing) and 60% (67,798) were apartment units.
In 2017 apartment units accounted for 59% of the total housing starts
and ground‐oriented housing starts accounted for 41%. Apartment
units starts decreased by 8% (5,346) from the 2016 figure of 16,899
apartment unit starts.
For the past 3 years (2015‐2017) apartment starts accounted for 59%
of total housing starts. This is an increasing proportion from ten years
ago (2005‐2006) when apartments accounted for 52% of total starts.
The share of housing starts by structure type varies among the
subregions. The proportion of starts that are ground‐oriented ranged
from 18% of the housing starts in Burnaby / Richmond subregion to
79% on the North Shore.
In 2017 26% of housing starts are in single detached dwelling units or
secondary suites. Single detached dwellings and secondary suites
share of total starts vary across the region, from 13% in Burnaby /
New Westminster to 66% on the North Shore.
Housing Starts by Structure Type, Metro Vancouver, 2002 ‐ 2017
* Secondary suite data was included with Apartment (Apartment & Other) until 2014. Source: CMHC Housing Now – Local Housing Market Data and regional custom data.
Housing Starts by Structure Type, by Subregions Metro Vancouver, 2016 & 2017
Source: CMHC Housing Now – Local Housing Market Data and regional custom data.

Housing Data Book Housing Starts - Single Detached
Single Detached Housing Starts for Metro Vancouver Municipalities, 2008 - 2017
Municipality 2008 2009 2010 2011 2012* 2013* 2014 2015 2016 20175 Yr
Average10 Yr
AverageAnmore 20 9 28 13 11 10 21 10 24 31 19 18Belcarra 3 2 1 2 0 0 5 0 3 2 2 2Bowen Island 21 15 21 20 13 6 17 18 26 30 19 19Burnaby 217 132 273 306 304 268 364 308 357 312 322 284Coquitlam 92 182 164 251 350 301 329 242 342 260 295 251Delta 176 129 167 107 125 128 162 142 146 223 160 151Electoral Area A 2 5 3 3 7 2 12 6 3 10 7 5Langley City 1 3 4 4 3 13 14 9 10 17 13 8Langley Township 245 168 228 232 323 268 240 261 406 389 313 276Lions Bay 2 1 2 1 1 1 3 0 0 3 1 1Maple Ridge 310 197 284 225 193 193 213 334 406 322 294 268New Westminster 36 51 112 59 53 65 63 58 70 98 71 67North Vancouver City 21 13 9 20 58 42 48 41 68 73 54 39North Vancouver District 87 56 76 51 100 118 113 145 135 172 137 105Pitt Meadows 36 17 14 4 15 4 14 13 16 17 13 15Port Coquitlam 19 4 7 9 27 50 26 26 34 46 36 25Port Moody 19 7 14 11 6 8 7 12 32 26 17 14Richmond 213 142 302 340 385 274 399 472 474 488 421 349Surrey 1,356 1,328 1,915 1,091 1,139 769 965 1,009 1,063 1,062 974 1,170Vancouver 638 395 799 800 1,214 1,284 1,106 1,309 1,280 1,116 1,219 994West Vancouver 112 56 102 119 124 138 124 150 189 131 146 125White Rock 8 17 8 17 65 62 87 57 52 67 65 44Metro Vancouver 3,634 2,929 4,533 3,686 4,516 4,004 4,374 4,622 5,169 4,911 4,616 4,238Source: CMHC Canadian Housing Observer and CMHC regional housing data.Note: While data sources are believed to be reliable, the accuracy of the data cannot be guaranteed. Note: Electoral Area A includes UBC/UEL (University of British Columbia / University Endowment Lands)Note: Numbers for individual years and municipalities provided by CMHC may not necessarily equal the column total.
* Some data for 2012 have been restated in the above table, to allow comparison with 2013 data. Other CMHC reports do not contain this restated data, therefore figures for 2012 maynot match the above. Effective January 2013, single-detached houses with an attached accessory suite are recorded as one unit "Ownership, Single" and the accessory suite as one unitRental, Apt + Other. In 2012 and prior years, these structures were recorded as two units, "Ownership, Freehold, Apt + Other" in some markets, including the Vancouver CMA
2.4

Housing Data Book Housing Starts - Secondary Suites
Accessory Suite Housing Starts for Metro Vancouver Municipalities, 2013 - 2017
Municipality 2010 2011 2013 * 2014 2015 2016 20173 Yr
AverageAnmore 0 0 0 0 0 0Belcarra 0 0 0 0 0 0Bowen Island 1 1 0 1 7 3Burnaby 0 167 231 261 258 250Coquitlam 143 191 114 215 187 172Delta 50 99 87 67 86 80Electoral Area A 0 0 0 0 0 0Langley City 0 0 0 0 5 2Langley Township 111 112 85 147 146 126Lions Bay 0 0 0 0 0 0Maple Ridge 0 0 3 24 50 26New Westminster 0 0 34 58 79 57North Vancouver City 17 35 12 49 53 38North Vancouver District 59 50 48 73 87 69Pitt Meadows 0 0 1 0 0 0Port Coquitlam 19 5 12 16 28 19Port Moody 0 0 0 4 4 3Richmond 65 87 101 120 93 105Surrey 227 415 509 507 433 483Vancouver 350 371 418 439 391 416West Vancouver 0 0 0 0 1 0White Rock 41 61 35 37 42 38Metro Vancouver 1,083 1,594 1,690 2,018 1,950 1,886Source: CMHC regional housing data, custom data request by Metro Vancouver.Note: While data sources are believed to be reliable, the accuracy of the data cannot be guaranteed. Note: Electoral Area A includes UBC/UEL (University of British Columbia / University Endowment Lands)Note: Numbers for individual years and municipalities provided by CMHC may not necessarily equal the column total.* Note: not all municipalities record accessory suite permits. In 20013 there is no accessory suite data for Burnaby, New Westminster, Maple Ridge and Pitt Meadows.
2.4
not availablenot availablenot availablenot available
not availablenot availablenot availablenot availablenot available
not available
not available
not availablenot availablenot availablenot available
not availablenot available
not availablenot availablenot availablenot available
not availablenot available

Housing Data Book Housing Starts - Semi-Detached
Semi-Detached Housing Starts for Metro Vancouver Municipalities, 2007 - 2016
Municipality 2008 2009 2010 2011 2012 2013 2014 2015 2016 20175 Yr
Average10 Yr
AverageAnmore 0 0 0 0 0 0 0 0 0 0 0 0Belcarra 0 0 0 0 0 0 0 0 0 0 0 0Bowen Island 0 0 0 0 0 0 0 0 2 4 1 1Burnaby 124 66 106 108 86 62 124 100 78 75 88 93Coquitlam 84 14 38 22 36 68 60 64 54 36 56 48Delta 22 4 14 48 90 98 18 4 4 0 25 30Electoral Area A 2 0 0 0 0 0 0 0 0 0 0 0Langley City 0 0 0 0 0 0 0 0 0 0 0 0Langley Township 6 4 2 2 4 2 24 24 32 8 18 11Lions Bay 0 0 0 0 0 0 0 0 0 0 0 0Maple Ridge 54 8 4 14 0 6 24 18 16 10 15 15New Westminster 6 0 8 2 8 8 2 4 10 16 8 6North Vancouver City 20 8 18 28 18 12 18 6 30 28 19 19North Vancouver District 0 50 2 0 0 0 0 0 0 0 0 5Pitt Meadows 2 12 0 0 2 0 6 4 2 6 4 3Port Coquitlam 2 2 4 0 2 2 10 2 8 4 5 4Port Moody 2 0 0 0 0 0 2 0 0 4 1 1Richmond 56 40 50 74 24 32 36 28 38 30 33 41Surrey 172 42 86 94 66 24 52 66 48 64 51 71Vancouver 141 80 80 108 132 172 132 160 100 118 136 122West Vancouver 14 0 2 2 12 22 0 2 8 2 7 6White Rock 2 0 0 0 0 2 0 4 0 0 1 1Metro Vancouver 709 330 414 504 480 510 508 486 430 409 469 478Source: CMHC Canadian Housing Observer and CMHC regional housing data.Note: While data sources are believed to be reliable, the accuracy of the data cannot be guaranteed. Note: Electoral Area A includes UBC/UEL (University of British Columbia / University Endowment Lands)Note: Numbers for individual years and municipalities provided by CMHC may not necessarily equal the column total.
2.4

Housing Data Book Housing Starts - Row House
Row Housing Starts for Metro Vancouver Municipalities, 2008 - 2017
Municipality 2008 2009 2010 2011 2012 2013 2014 2015 2016 20175 Yr
Average10 Yr
AverageAnmore 0 0 0 0 0 0 0 0 0 0 0 0Belcarra 0 0 0 0 0 0 0 0 0 0 0 0Bowen Island 0 0 0 0 0 0 30 0 0 0 6 3Burnaby 192 95 101 150 45 141 137 62 108 137 117 117Coquitlam 234 135 179 352 231 161 87 96 38 90 94 160Delta 102 92 139 72 18 0 136 21 170 90 83 84Electoral Area A 11 0 7 16 0 0 0 11 0 0 2 5Langley City 0 36 0 0 0 5 33 0 14 63 23 15Langley Township 66 148 381 342 263 265 447 475 730 565 496 368Lions Bay 0 0 0 0 0 0 0 0 0 0 0 0Maple Ridge 10 96 134 154 23 104 166 140 267 213 178 131New Westminster 4 0 13 41 14 109 82 15 127 44 75 45North Vancouver City 31 11 17 21 11 0 42 0 15 9 13 16North Vancouver District 0 63 20 69 8 0 107 39 15 14 35 34Pitt Meadows 13 8 0 0 12 24 4 36 0 0 13 10Port Coquitlam 82 60 42 0 120 107 141 160 33 91 106 84Port Moody 0 0 21 15 13 0 0 14 7 8 6 8Richmond 293 160 224 292 164 246 115 212 260 95 186 206Surrey 1,062 698 874 1,031 1,365 1,089 1,132 1,124 1,386 1,793 1,305 1,155Vancouver 204 53 163 266 92 85 60 80 225 145 119 137West Vancouver 0 0 0 5 0 4 0 23 0 3 6 4White Rock 5 0 9 10 10 26 0 4 0 4 7 7Metro Vancouver 2,309 1,655 2,324 2,836 2,389 2,373 2,719 2,512 3,398 3,386 2,878 2,590Source: CMHC Canadian Housing Observer and CMHC regional housing data.Note: While data sources are believed to be reliable, the accuracy of the data cannot be guaranteed. Note: Electoral Area A includes UBC/UEL (University of British Columbia / University Endowment Lands)Note: Numbers for individual years and municipalities provided by CMHC may not necessarily equal the column total.
Note: Seniors' independent/assisted living units are included in the count if units are self contained with full kitchen. Units where there is only a microwave and bar fridge are excluded
2.4

Housing Data Book Housing Starts - Apartment
Apartment Housing Starts for Metro Vancouver Municipalities, 2007 - 2017
Municipality 2007 2008 2009 2010 2011 2012* 2013* 2014* 2015 2016 20175 Yr
Average10 Yr
AverageAnmore 0 0 0 0 0 0 0 0 0 0 0 0 0Belcarra 0 0 0 0 0 0 0 0 0 0 0 0 0Bowen Island 0 4 2 6 6 2 0 1 0 0 4 1 3Burnaby 1,891 1,110 559 808 1,047 1,093 1,827 1,049 1,217 3,368 3,391 2,170 1,547Coquitlam 472 1,155 144 750 817 1,185 717 1,122 455 976 1,557 965 888Delta 2 13 60 118 151 130 13 221 381 95 168 176 135Electoral Area A 272 257 137 230 351 95 513 199 449 212 450 365 289Langley City 125 118 160 167 220 63 0 67 184 8 70 66 106Langley Township 216 446 260 296 716 460 290 475 459 68 820 422 429Lions Bay 0 0 0 0 0 0 0 0 0 0 0 0 0Maple Ridge 254 45 2 21 81 308 97 144 53 113 121 106 99New Westminster 628 422 158 129 266 734 196 404 809 970 1,160 708 525North Vancouver City 657 300 12 226 412 393 450 427 774 717 164 506 388North Vancouver District 0 167 47 149 335 148 201 272 98 593 5 234 202Pitt Meadows 70 144 0 0 71 68 126 64 0 0 82 54 56Port Coquitlam 740 125 24 349 38 222 164 198 260 128 316 213 182Port Moody 837 353 0 0 0 291 0 0 0 0 0 0 64Richmond 1,413 1,399 343 845 1,930 1,135 810 2,486 1,844 1,323 1,364 1,565 1,348Surrey 2,025 3,109 371 742 1,591 705 962 1,045 1,853 467 2,028 1,271 1,287Vancouver 3,301 3,687 1,048 3,033 2,656 4,060 4,180 3,350 2,649 7,715 3,847 4,348 3,623West Vancouver 8 33 0 0 0 310 93 12 8 57 0 34 51White Rock 301 52 98 77 52 240 87 74 60 89 1 62 83Metro Vancouver 13,212 12,939 3,425 7,946 10,843 11,642 10,726 11,611 11,553 16,899 15,548 13,267 11,313Source: CMHC Canadian Housing Observer and CMHC regional housing data.Note: CMHC's full category title is "apartment & other". Note: While data sources are believed to be reliable, the accuracy of the data cannot be guaranteed. Note: Electoral Area A includes UBC/UEL (University of British Columbia / University Endowment Lands)
Note: Seniors' independent/assisted living units are included in the count if units are self contained with full kitchen. Units where there is only a microwave and bar fridge are excluded
*Some data for 2012 have been restated in the above table, to allow comparison with 2013 data. Other CMHC reports do not contain this restated data, therefore figures for 2012 maynot match the above. Effective January 2013, single-detached houses with an attached accessory suite are recorded as one unit "Ownership, Single" and the accessory suite as one unitRental, Apt + Other. In 2012 and prior years, these structures were recorded as two units, "Ownership, Freehold, Apt + Other" in some markets, including the Vancouver CMA
2.4

METRO VANCOUVER HOUSING DATA BOOK ... Housing Completions
2.5
Description
Housing completions is the most reliable measure of increasing
supply of housing across the region. The number of housing
completions over the past 15 years reflects economic patterns and
the cyclical nature of the housing market.
The global economic downturn of 2008/09 resulted in a steep drop
in housing completions in 2010/11, but the past six years has seen
a recovery in housing completions.
Key Findings
Data reported by CMHC for the period 2008 to 2017 (10 years) shows
175,712 completions, with an annual average of 17,571 completions
per year.
For the period from 2008 to 2017 (10 years) the number of annual
housing completions ranged from a low of 12,919 in 2011 to a high
of 21,806 in 2017.
In 2017 the number of housing completions continued to rebound
from the 2011 figure of 12,919, achieving the highest number of
completions in the past 20 years (21,806).
The distribution of housing completions by subregion varies year over
year. Vancouver/ Electoral Area A (UBC‐UEL) subregion has seen its
proportion of housing completions decrease from 34% in 2014 to 24%
in 2017. Surrey / White Rock has seen its proportion of housing
completions increase from 17% in 2014 to 20% in 2017.
Housing Completions in Metro Vancouver, 2003 ‐ 2017
Source: CMHC Housing Now – Local Housing Market Data
Completions by Metro Vancouver Subregions, 2014‐2017
Source: CMHC Housing Now ‐ Local Housing Market Data
Housing Data Book Housing Completions
Housing Completions for Metro Vancouver Municipalities, 2008 - 2017
Municipality 2008 2009 2010 2011 2012 2013 2014 2015 2016 20175 Yr
Average10 Yr
AverageAnmore 14 16 20 19 15 15 16 15 21 21 18 17Belcarra 3 2 2 0 4 1 1 0 3 2 1 2Bowen Island 27 27 21 31 24 13 12 45 16 26 22 24Burnaby 2,526 1,561 965 740 1,640 1,340 1,460 2,674 1,414 2,079 1,793 1,640Coquitlam 1,103 1,130 1,157 762 1,656 1,832 1,377 1,128 1,134 1,348 1,364 1,263Delta 166 342 337 388 329 294 404 308 465 774 449 381Electoral Area 'A' 646 333 282 312 190 487 243 203 254 347 307 330Langley City 60 323 64 242 156 66 54 78 5 278 96 133Langley Township 1,102 820 782 988 1,183 958 1,179 1,019 1,201 1,602 1,192 1,083Lions Bay 1 4 1 3 1 0 1 3 1 0 1 2Maple Ridge 922 490 486 284 423 532 298 702 757 532 564 543New Westminster 654 532 678 303 397 446 533 314 608 1,127 606 559North Vancouver City 833 124 564 270 506 480 585 450 343 692 510 485North Vancouver District 102 255 230 214 395 312 138 607 524 240 364 302Pitt Meadows 336 132 9 160 76 116 99 162 26 17 84 113Port Coquitlam 764 287 158 104 427 272 380 239 255 434 316 332Port Moody 839 562 7 39 10 320 8 7 36 35 81 186Richmond 1,730 1,535 1,609 1,035 1,748 2,047 1,822 1,968 2,623 2,083 2,109 1,820Surrey 4,104 4,237 4,917 3,856 3,189 3,562 2,932 3,068 3,262 4,121 3,389 3,725Vancouver 3,072 3,909 3,827 3,154 4,369 4,598 5,772 3,844 4,947 5,616 4,955 4,311West Vancouver 165 137 78 98 135 274 268 283 120 185 226 174White Rock 294 68 129 68 84 324 120 216 101 231 198 164Metro Vancouver 19,150 16,788 16,474 12,919 16,958 18,392 17,731 17,346 18,148 21,806 18,685 17,571Source: CMHC Canadian Housing Observer and CMHC regional housing data.Note: While data sources are believed to be reliable, the accuracy of the data cannot be guaranteed. Note: Electoral Area A includes UBC/UEL (University of British Columbia / University Endowment Lands).
Note: Numbers for individual years and municipalities provided by CMHC may not necessarily equal the column total.
2.5

METRO VANCOUVER HOUSING DATA BOOK ... Housing Completions By Tenure
2.6
Description
One of the priorities set out in the Metro Vancouver Regional
Affordable Housing Strategy is to increase the supply of rental
housing. This includes encouraging an adequate supply of rental
housing units.
Over the past 15 years there have been very few new rental housing
units completed in the region.
Key Findings
In 2017 there were 4,800 rental housing completions, 1,287 rental
units more than the previous year. 2016 and 2017 show the greatest
number of rental completions built in the past 10 years (Note:
applying the revised methodology is unlikely to result in a significant
change to the net completions of rental units in years prior to 2012).
The graph shows that since 2005 strata condominium ownership
(apartment or townhouse) has been more prevalent than freehold
ownership. Freehold ownership completions account of 19% of
completions in 2017, compared to 29% of completions in 2007.
The proportion of housing completions that are rental varies among
subregions. In 2017 the proportion of completions that were rental
ranged from 32% in the Vancouver / Electoral Area A subregion, to
8% of housing completions in Pitt Meadows / Maple Ridge.
Of the 4,800 rental housing completions reported for 2016, 46% are
purpose‐built market rental apartment units. 37% (1,769) are
secondary suites, 11% (551) are laneway / coach house rental housing
and 6% (269) are for social housing.
Note: Rental housing units refers to units in purpose built rental apartment buildings, social housing units, secondary suites and rental laneway housing.
Completions by Tenure Metro Vancouver, 2005 ‐ 2017
Source: CMHC Housing Now ‐ Local Housing Market Data
Housing Completions by Tenure by Subregion, 2016/17
Source: CMHC Starts and Completions Survey (CMHC Housing Market Information Portal)

Housing Data Book Housing Completions - Purpose Built Rental
Rental Completions for Metro Vancouver Municipalities *
Municipality 2007 2008 2009 2010 2011 2012 2013 2014 2015 2016 2017Anmore 0 0 0 0 0 0 3 2 0 1 0Belcarra 0 0 0 0 0 0 0 0 0 0 0Bowen Island 0 0 0 2 0 1 0 1 4Burnaby 146 0 0 75 0 64 6 12 161 229 380Coquitlam 0 0 66 0 52 197 187 164 177 173 176Delta 2 3 15 9 2 27 52 71 82 142 73Electoral Area 'A' 197 108 123 0 62 0 281 0 94 0 126Langley City 0 0 0 0 0 0 0 0 0 0 184Langley Township 5 1 0 0 0 149 130 191 147 271 190Lions Bay 0 0 0 0 0 46 0 0 0 0 0Maple Ridge 0 0 8 2 0 0 6 2 78 21 40New Westminster 0 0 0 25 0 24 25 0 1 70 621North Vancouver City 27 0 2 0 0 115 96 29 206 163 150North Vancouver District 0 0 32 0 0 188 45 41 70 229 93Pitt Meadows 0 0 0 0 0 71 2 0 0 2 2Port Coquitlam 0 56 1 0 0 17 19 80 5 48 20Port Moody 0 0 0 6 3 0 0 0 0 0 4Richmond 2 5 7 237 59 298 300 150 382 257 376Surrey 163 199 275 134 72 107 451 342 426 577 526Vancouver 153 166 411 262 505 690 1,346 1,693 1,495 1,284 1,802West Vancouver 16 0 0 0 0 0 129 141 3 2 0White Rock 0 2 0 0 0 25 31 42 53 39 33Metro Vancouver 711 540 940 750 886 2,416 3,109 2,961 3,382 3,513 4,800Source: Canada Mortgage and Housing Corporation (CMHC) * Note that data for 2006 to 2011 is for "Row House" and "Apartment & Other", and does not include purpose-built rental single detached and semi-detached units.Note: While data sources are believed to be reliable, the accuracy of the data cannot be guaranteed. Note: Electoral Area 'A' contains data for UBC/UEL only.Definition: Rental - A dwelling constructed for rental purposes regardless of who finances the structure.
Note: Some data for 2012 have been restated in the above table, to allow comparison with the more recent data. Other CMHC reports do not contain this restated data, therefore figures for2012 may not match the above. Effective January 2013, single-detached houses with an attached accessory suite are recorded as one unit "Ownership, Single" and the accessorysuite as one unit "Rental, Apt + Other". In 2012 and prior years, these structures were recorded as two units, "Ownership, Freehold, Apt + Other" in some markets, includingthe Vancouver CMA. The impact of this adjustment was the 2012 figure for Metro Vancouver changed from 1,277 rental starts to 2,416 rental starts.
2.6

Housing Data Book Housing Starts - Purpose Built Rental
Purpose Built Rental Completions** By Rental Housing Type for Metro Vancouver Municipalities, 2015/2016/2017
Municipality2015 2016 2017 2015 2016 2017 2015 2016 2017 2015 2016 2017 2015 2016 2017
Anmore 0 0 0 0 1 0 0 0 0 0 0 0 0 1 0Belcarra 0 0 0 0 0 0 0 0 0 0 0 0 0 0 0Bowen Island 0 1 2 0 0 1 0 0 1 0 0 0 0 1 4Burnaby 161 229 213 0 0 0 0 0 115 0 0 52 161 229 380Coquitlam 170 168 159 7 5 14 0 0 3 0 0 0 177 173 176Delta 80 74 68 2 3 1 0 65 0 0 0 0 82 142 73Electoral Area 'A' 0 0 0 0 0 0 0 0 126 94 0 0 94 0 126Langley City 0 0 0 0 0 0 0 0 184 0 0 0 0 0 184Langley Township 118 65 153 29 27 35 0 179 2 0 0 0 147 271 190Lions Bay 0 0 0 0 0 0 0 0 0 0 0 0 0 0 0Maple Ridge 0 14 31 3 1 6 75 6 3 0 0 0 78 21 40New Westminster 1 31 61 0 1 2 0 38 558 0 0 0 1 70 621North Vancouver City 26 27 37 9 6 14 171 130 99 0 0 0 206 163 150North Vancouver District 70 49 86 0 2 5 0 178 2 0 0 0 70 229 93Pitt Meadows 0 1 0 0 1 2 0 0 0 0 0 0 0 2 2Port Coquitlam 3 19 20 2 0 0 0 29 0 0 0 0 5 48 20Port Moody 0 0 4 0 0 0 0 0 0 0 0 0 0 0 4Richmond 81 90 112 5 4 3 0 163 132 296 0 129 382 257 376Surrey 391 503 422 25 3 7 0 0 97 0 71 0 426 577 526Vancouver 367 349 368 370 407 461 602 335 885 156 178 88 1,495 1,284 1,802West Vancouver 3 0 0 0 1 0 0 1 0 0 0 0 3 2 0White Rock 52 39 33 1 0 0 0 0 0 0 0 0 53 39 33Metro Vancouver 1,523 1,659 1,769 455 466 551 848 1,124 2,207 546 249 269 3,382 3,513 4,800Source: Canada Mortgage and Housing Corporation (CMHC), custom data request. Note: While data sources are believed to be reliable, the accuracy of the data cannot be guaranteed. Note: Electoral Area 'A' contains data for UBC/UEL only.Definition: Rental - A dwelling constructed for rental purposes regardless of who finances the structure.
* Note: Single detached rental is usually laneway / coachhouse rental housing that is non-subsidized.** Note: Rental/Non-rental data is for entire building only. If a building has rental units combined with predominately stratified ownership units, it may not appear in this table.
2.6
Accessory Suites Single Detached Rental * Market Rental (apt & row) Social Hsg Rental Total Rental

METRO VANCOUVER HOUSING DATA BOOK ... Housing Completions by Structure Type
2.7
Description
Housing completions provide valuable information on the changing
supply of housing across the region. The number of housing
completions over the past decade reflects economic patterns and
the cyclical nature of the housing development industry.
The global economic downturn of 2008/09 resulted in a steep drop
in housing completions in 2011, but the past five years has seen a
recovery in the number of annual housing completions.
Key Findings
Data reported by CMHC for the period from 2012 to 2017 (5 years)
shows there were 93,423 housing completions; 52% (48,890) were
ground‐oriented units and 48% (48,890) were apartment units. In the
past 10 years the highest number of completions occurred in 2008
(19,150) and the lowest number of completions was in 2011 (12,919).
In 2017 apartment completions accounted for 54% of the total
housing completions. Over the past 5 years the proportion of total
completions that are apartment completions varied from 45% in 2012
to 54% in 2017.
The share of housing completions by structure type varies among
subregions. In 2017 the proportion of completions that are ground‐
oriented ranged from 91% of the housing completions in the Pitt
Meadows / Maple Ridge subregion to 29% in Burnaby / New
Westminster and 30% in Vancouver / Electoral Area A.
Note: Apartment refers to the structure type, and not the tenure of ownership. This category includes both condominium apartment buildings and rental apartment buildings as the “apartment” structure type.
Housing Completions in Metro Vancouver, 2004 ‐ 2017
Source: CMHC (*note that prior to 2011, suite units and the house unit containing the suite were both captured in the “apartment & other” category).
Housing Completions by Structure Type, Metro Vancouver Subregions, 2016‐2017
Source: CMHC Housing Now ‐ Local Housing Market Data
Note: Ground‐oriented housing includes single detached, secondary suites, semi‐detached and
duplex and row housing.

Housing Data Book Housing Completions
Housing Completions for Metro Vancouver Municipalities, 2008 - 2017
Municipality 2008 2009 2010 2011 2012 2013 2014 2015 2016 20175 Yr
Average10 Yr
AverageAnmore 14 16 20 19 15 15 16 15 21 21 18 17Belcarra 3 2 2 0 4 1 1 0 3 2 1 2Bowen Island 27 27 21 31 24 13 12 45 16 26 22 24Burnaby 2,526 1,561 965 740 1,640 1,340 1,460 2,674 1,414 2,079 1,793 1,640Coquitlam 1,103 1,130 1,157 762 1,656 1,832 1,377 1,128 1,134 1,348 1,364 1,263Delta 166 342 337 388 329 294 404 308 465 774 449 381Electoral Area 'A' 646 333 282 312 190 487 243 203 254 347 307 330Langley City 60 323 64 242 156 66 54 78 5 278 96 133Langley Township 1,102 820 782 988 1,183 958 1,179 1,019 1,201 1,602 1,192 1,083Lions Bay 1 4 1 3 1 0 1 3 1 0 1 2Maple Ridge 922 490 486 284 423 532 298 702 757 532 564 543New Westminster 654 532 678 303 397 446 533 314 608 1,127 606 559North Vancouver City 833 124 564 270 506 480 585 450 343 692 510 485North Vancouver District 102 255 230 214 395 312 138 607 524 240 364 302Pitt Meadows 336 132 9 160 76 116 99 162 26 17 84 113Port Coquitlam 764 287 158 104 427 272 380 239 255 434 316 332Port Moody 839 562 7 39 10 320 8 7 36 35 81 186Richmond 1,730 1,535 1,609 1,035 1,748 2,047 1,822 1,968 2,623 2,083 2,109 1,820Surrey 4,104 4,237 4,917 3,856 3,189 3,562 2,932 3,068 3,262 4,121 3,389 3,725Vancouver 3,072 3,909 3,827 3,154 4,369 4,598 5,772 3,844 4,947 5,616 4,955 4,311West Vancouver 165 137 78 98 135 274 268 283 120 185 226 174White Rock 294 68 129 68 84 324 120 216 101 231 198 164Metro Vancouver 19,150 16,788 16,474 12,919 16,958 18,392 17,731 17,346 18,148 21,806 18,685 17,571Source: CMHC Canadian Housing Observer and CMHC regional housing data.Note: While data sources are believed to be reliable, the accuracy of the data cannot be guaranteed. Note: Electoral Area A includes UBC/UEL (University of British Columbia / University Endowment Lands).
Note: Numbers for individual years and municipalities provided by CMHC may not necessarily equal the column total.
2.5

Housing Data Book Housing Completions - Single Detached
Single Detached Housing Completions for Metro Vancouver Municipalities, 2008 - 2017
Municipality 2008 2009 2010 2011 2012* 2013* 2014 2015 2016 20175 Yr
Average10 Yr
AverageAnmore 14 16 6 19 15 15 16 15 21 21 18 16Belcarra 3 2 0 0 4 1 1 0 3 2 1 2Bowen Island 25 25 0 26 22 13 11 15 15 21 15 17Burnaby 153 171 9 190 276 292 358 308 303 308 314 237Coquitlam 91 131 0 216 457 361 278 290 291 256 295 237Delta 124 175 11 147 101 137 131 152 130 149 140 126Electoral Area 'A' 3 3 0 3 1 5 4 4 8 7 6 4Langley City 4 2 0 7 4 3 16 11 5 11 9 6Langley Township 434 390 25 343 368 310 262 275 243 420 302 307Lions Bay 1 4 0 3 1 0 1 3 1 0 1 1Maple Ridge 341 259 23 197 206 208 175 288 369 274 263 234New Westminster 64 34 22 90 61 38 60 58 49 93 60 57North Vancouver City 20 20 0 33 62 48 48 46 46 54 48 38North Vancouver District 96 76 3 71 87 90 97 149 122 152 122 94Pitt Meadows 88 27 3 9 5 18 5 16 17 11 13 20Port Coquitlam 32 9 0 28 26 28 54 26 32 38 36 27Port Moody 49 17 1 13 10 6 6 7 15 31 13 16Richmond 231 164 37 338 585 354 344 321 413 437 374 322Surrey 1,359 1,268 126 1,485 1,249 973 855 892 993 933 929 1,013Vancouver 469 436 459 803 1,054 1,518 1,195 1,125 1,058 1,194 1,218 931West Vancouver 108 102 70 90 119 121 106 159 110 173 134 116White Rock 7 7 13 35 49 59 62 72 57 49 60 41Metro Vancouver 3,716 3,338 3,935 4,146 4,763 4,598 4,114 4,245 4,333 4,645 4,387 4,183Source: CMHC Canadian Housing Observer and CMHC regional housing data.Note: While data sources are believed to be reliable, the accuracy of the data cannot be guaranteed. Note: Electoral Area A includes UBC/UEL (University of British Columbia / University Endowment Lands).Note: Numbers for individual years and municipalities provided by CMHC may not necessarily equal the column total.
* Some data for 2012 have been restated in the above table, to allow comparison with 2013 data. Other CMHC reports do not contain this restated data, therefore figures for 2012 maynot match the above. Effective January 2013, single-detached houses with an attached accessory suite are recorded as one unit "Ownership, Single" and the accessory suite as one unitRental, Apt + Other. In 2012 and prior years, these structures were recorded as two units, "Ownership, Freehold, Apt + Other" in some markets, including the Vancouver CMA
2.7

Housing Data Book Housing Completions - Secondary Suites
Secondary Suite Housing Completions for Metro Vancouver Municipalities, 2011 - 2017
Municipality 2008 2009 2010 2011 2012 2013 2014 2015 2106 20173 Yr
AverageAnmore 0 0 0 0 0 0 0 0Belcarra 0 0 0 0 0 0 0 0Bowen Island 3 2 0 1 0 1 2 1Burnaby n/a n/a n/a 4 161 229 213 n/aCoquitlam 90 167 171 138 170 168 159 269Delta 14 27 45 50 80 74 68 106Electoral Area 'A' 0 0 0 0 0 0 0 0Langley City 0 0 0Langley Township 144 149 111 116 118 65 153 188Lions Bay 0 0 0 0 0 0 0 0Maple Ridge 0 14 31 n/aNew Westminster 1 31 61 n/aNorth Vancouver City 16 39 31 23 26 27 37 48North Vancouver District 10 28 45 38 70 49 86 96Pitt Meadows 0 1 0 n/aPort Coquitlam 19 17 19 19 3 19 20 27Port Moody 0 0 4 1Richmond 100 172 93 88 81 90 112 94Surrey 90 262 254 252 391 503 422 607Vancouver 158 321 378 375 367 349 368 612West Vancouver 3 0 0 n/aWhite Rock 24 25 31 32 52 39 33 62Metro Vancouver 668 1,209 1,178 1,133 1,523 1,659 1,769 1,650Source: CMHC regional housing data, custom data request by Metro Vancouver.Note: While data sources are believed to be reliable, the accuracy of the data cannot be guaranteed. Note: Electoral Area A includes UBC/UEL (University of British Columbia / University Endowment Lands).Note: Numbers for individual years and municipalities provided by CMHC may not necessarily equal the column total.
Note: No secondary suite completions were reported for the City of Langley.
2.7

Housing Data Book Housing Completions - Semi-Detached
Semi-Detached Housing Completions for Metro Vancouver Municipalities, 2008 - 2017
Municipality 2008 2009 2010 2011 2012 2013 2014 2015 2016 20175 Yr
Average10 Yr
AverageAnmore 0 0 0 0 0 0 0 0 0 0 0 0Belcarra 0 0 0 0 0 0 0 0 0 0 0 0Bowen Island 0 0 0 0 0 0 0 0 0 2 0 0Burnaby 128 80 110 56 68 68 138 116 98 70 98 93Coquitlam 32 76 12 46 18 56 64 74 40 72 61 49Delta 8 20 8 20 60 76 84 2 4 2 34 28Electoral Area 'A' 2 14 4 0 0 0 0 0 0 0 0 2Langley City 0 0 0 0 0 0 0 0 0 0 0 0Langley Township 68 18 12 2 2 4 18 14 20 34 18 19Lions Bay 0 0 0 0 0 0 0 0 0 0 0 0Maple Ridge 58 12 26 6 12 2 4 36 8 20 14 18New Westminster 4 4 2 8 2 6 4 4 6 16 7 6North Vancouver City 20 8 32 8 30 16 6 18 8 28 15 17North Vancouver District 2 12 40 0 2 0 0 0 0 0 0 6Pitt Meadows 0 14 0 0 0 2 2 4 4 6 4 3Port Coquitlam 0 2 2 4 0 2 6 2 4 6 4 3Port Moody 2 0 0 0 0 0 2 0 0 0 0 0Richmond 52 54 66 32 68 26 22 40 20 40 30 42Surrey 70 82 126 124 94 48 50 52 56 56 52 76Vancouver 86 119 92 70 104 126 178 166 120 100 138 116West Vancouver 28 2 0 8 8 6 0 24 0 4 7 8White Rock 2 2 0 0 0 2 0 2 2 0 1 1Metro Vancouver 562 519 532 384 468 440 578 554 390 456 484 488Source: CMHC Canadian Housing Observer and CMHC regional housing data.Note: While data sources are believed to be reliable, the accuracy of the data cannot be guaranteed. Note: Electoral Area A includes UBC/UEL (University of British Columbia / University Endowment Lands).Note: Numbers for individual years and municipalities provided by CMHC may not necessarily equal the column total.
2.7

Housing Data Book Housing Completions - Row House
Row Housing Completions for Metro Vancouver Municipalities, 2008 - 2017
Municipality 2008 2009 2010 2011 2012 2013 2014 2015 2016 20175 Yr
Average10 Yr
AverageAnmore 0 0 0 0 0 0 0 0 0 0 0 0Belcarra 0 0 0 0 0 0 0 0 0 0 0 0Bowen Island 0 0 0 0 0 0 0 30 0 0 6 3Burnaby 84 214 59 74 166 50 102 83 74 93 80 100Coquitlam 102 205 145 254 315 241 84 103 73 44 109 157Delta 31 132 109 96 68 0 24 74 74 208 76 82Electoral Area 'A' 8 62 0 7 0 16 7 0 11 0 7 11Langley City 0 36 0 0 0 0 38 0 0 13 10 9Langley Township 261 76 244 391 348 201 384 459 500 713 451 358Lions Bay 0 0 0 0 0 0 0 0 0 0 0 0Maple Ridge 95 16 120 81 159 30 68 177 320 157 150 122New Westminster 4 4 0 3 71 43 90 55 32 89 62 39North Vancouver City 58 17 35 20 11 23 4 24 0 18 14 21North Vancouver District 4 0 79 4 38 37 0 46 100 0 37 31Pitt Meadows 31 21 0 0 0 28 8 36 4 0 15 13Port Coquitlam 105 60 60 35 47 94 128 83 137 68 102 82Port Moody 92 0 0 26 0 23 0 0 21 0 9 16Richmond 217 179 306 273 205 144 206 90 206 288 187 211Surrey 975 1,030 948 938 1,136 1,134 1,245 982 1,155 1,309 1,165 1,085Vancouver 158 137 187 68 315 132 95 35 102 99 93 133West Vancouver 12 8 0 0 8 0 0 4 9 0 3 4White Rock 0 5 0 9 10 15 21 0 0 0 7 6Metro Vancouver 2,237 2,202 2,292 2,279 2,897 2,211 2,504 2,281 2,818 3,104 2,584 2,483Source: CMHC Canadian Housing Observer and CMHC regional housing data.Note: While data sources are believed to be reliable, the accuracy of the data cannot be guaranteed. Note: Electoral Area A includes UBC/UEL (University of British Columbia / University Endowment Lands).Note: Numbers for individual years and municipalities provided by CMHC may not necessarily equal the column total.
2.7

Housing Data Book Housing Completions - Apartment
Apartment Housing Completions for Metro Vancouver Municipalities, 2007 - 2017Apartment & "Other" Category 3 Year
2007 2008 2009 2010 2011* 2012* 2013 2014 2015 2016 2017 AverageAnmore 0 0 0 0 0 0 0 0 0 0 0 0Belcarra 0 0 0 0 0 0 0 0 0 0 0 0Bowen Island 0 2 2 4 2 0 0 0 0 0 1 0Burnaby 1,382 2,161 1,096 621 420 1,130 930 858 2,006 710 1,395 1,370Coquitlam 357 878 718 808 156 699 1,003 813 491 562 817 623Delta 50 3 15 60 111 73 36 115 0 183 347 177Electoral Area 'A' 426 320 216 271 302 189 466 232 199 235 340 258Langley City 251 56 285 62 235 152 63 0 67 0 254 107Langley Township 21 339 336 308 108 316 332 399 153 373 282 269Lions Bay 0 0 0 0 0 0 0 0 0 0 0 0Maple Ridge 166 428 203 23 0 46 292 51 201 46 50 99New Westminster 606 582 490 592 202 263 359 379 196 490 868 518North Vancouver City 182 735 79 488 193 364 362 504 336 262 555 384North Vancouver District 42 0 167 47 129 240 140 3 342 253 2 199Pitt Meadows 136 217 70 144 0 71 68 84 106 0 0 35Port Coquitlam 116 627 216 92 18 337 129 129 125 63 302 163Port Moody 396 696 545 0 0 0 291 291 0 0 0 0Richmond 1,126 1,230 1,138 1,078 292 718 1,430 1,430 1,436 1,894 1,206 1,512Surrey 499 1,700 1,857 1,904 1,219 448 1,153 1,153 751 555 1,401 902Vancouver 3,630 2,359 3,217 3,089 2,055 2,575 2,444 2,443 2,151 3,318 3,855 3,108West Vancouver 109 17 25 8 0 0 147 147 93 1 8 34White Rock 171 285 54 116 0 0 217 5 90 3 149 81Metro Vancouver 9,666 12,635 10,729 9,715 5,442 7,621 9,965 9,402 8,743 8,948 11,832 9,841Source: CMHC Canadian Housing Observer and CMHC regional housing data - custom data request for Metro Vancouver.Note: CMHC's full category title is most publications is "apartment & other". Note: While data sources are believed to be reliable, the accuracy of the data cannot be guaranteed. Note: Electoral Area A includes UBC/UEL (University of British Columbia / University Endowment Lands).Note: Numbers for individual years and municipalities provided by CMHC may not necessarily equal the column total.
Note: * Some data for 2012 have been restated in the above table, to allow comparison with 2013 data. Other CMHC reports do not contain this restated data, therefore figures for 2012 may not match the above. Effective January 2013, single-detached houses with an attached accessory suite are recorded as one unit "Ownership, Single" and the accessory suite as one unit Rental, Apt + Other. In 2012 and prior years, these structures were recorded as two units, "Ownership, Freehold, Apt + Other" in some markets, including the Vancouver CMA. 2011 data is sourced to a CMHC custom data request, which aligns the data collection methodolgy of 2012 and 2013.
2.7
MunicipalityApartment Only

METRO VANCOUVER HOUSING DATA BOOK ... Housing Demolitions
2.8
Description
As the housing stock ages it is renewed and this may result in
demolitions. It is important to monitor the number of demolitions as
they affect the net additions to the housing stock. The existing stock
of purpose‐built apartment units provides for an important supply of
rental options for residents of Metro Vancouver. There is concern
about the loss of affordable rental units through the demolition and
redevelopment of older apartment buildings.
Key Findings
In 2017 there were 3,904 residential unit demolitions in the region.
This is record number of residential units demolished in Metro
Vancouver.
Data reported by Statistics Canada and local municipalities for the
period from 2008 to 2017 (10 years) shows 28,955 residential units
were demolished with an annual average of 2,895 demolitions.
The demolition of 826 apartment units in 2017 was the most
apartment units demolished in a single year in the past 15 years.
Apartment units accounted for 21% of residential unit demolitions in
2017.
Single detached houses and other ground oriented dwellings account
for 89% (25,814 units) of the residential demolitions that occurred
from 2008 to 2017. Apartment demolitions account for 11% (3,141
apartment units) of the total residential demolitions over the same
10 year period.
Housing Demolitions in Metro Vancouver, 2002 ‐ 2017
Source: Statistics Canada Note: Apartment includes rental and strata tenure types.
Demolitions by Metro Vancouver Subregions, 2016 ‐ 2017
Source: Statistics Canada

Housing Data Book Housing Demolitions
All Housing Demolitions for Metro Vancouver Municipalities, 2007 - 2017
Municipality 2007 2008 2009 2010 2011 2012 2013 2014 2015 2016 20175 Yr
Average10 Yr
AverageAnmore 0 0 0 0 0 6 1 5 4 0 2 2 2Belcarra 4 0 0 1 4 1 2 1 1 1 4 2 2Bowen Island 2 1 5 2 0 0 1 3 4 7 4 4 3Burnaby 325 295 205 341 390 434 419 556 481 781 525 552 443Coquitlam 90 90 51 77 105 154 111 45 113 60 102 86 91Delta 55 67 73 53 63 94 97 99 131 161 175 133 101UBC, UEL 0 0 0 0 0 0 0 0 0 0 0 0 0Langley City 7 13 5 12 10 3 12 10 16 61 36 27 18Langley Township 78 109 71 59 79 83 73 79 115 125 129 104 92Lions Bay 0 1 1 0 0 0 0 0 0 0 0 0 0Maple Ridge 49 54 91 24 59 60 41 44 62 131 61 68 63New Westminster 46 29 28 43 101 106 46 70 68 57 54 59 60North Vancouver City 45 45 68 63 55 112 35 58 84 69 154 80 74North Vancouver District 93 70 69 84 74 109 127 152 154 165 111 142 112Pitt Meadows 11 10 3 5 8 6 8 8 2 14 10 8 7Port Coquitlam 39 41 13 48 24 27 26 38 35 31 45 35 33Port Moody 1 0 6 1 4 3 5 8 12 18 15 12 7Richmond 309 309 234 294 86 184 60 203 450 509 388 322 272Surrey 674 393 256 390 475 453 432 464 506 604 637 529 461Vancouver 836 758 897 826 954 1,034 606 813 1,030 886 1,291 925 910West Vancouver 164 86 47 83 97 116 121 99 124 165 101 122 104White Rock 0 16 25 34 38 29 52 68 52 49 60 56 42Metro Vancouver 2,828 2,387 2,148 2,440 2,626 3,014 2,275 2,823 3,444 3,894 3,904 3,268 2,896Source: Statistics Canada (except for City of Richmond data from 2005 - 2009, Burnaby 2012)Source: City of Richmond (municipal website) 2005 - 2009; Maple Ridge (apartment demolition data) 2009; Port Coquitlam (apartment demolition data) 2009.Note: While data sources are believed to be reliable, the accuracy of the data cannot be guaranteed. "UBC, UEL" = University of British Columbia, University Endowment Lands
2.8

Housing Data Book Apartment Unit Demolitions
Apartment Demolitions for Metro Vancouver Municipalities, 2007 - 2017
Municipality 2007 2008 2009 2010 2011 2012 2013 2014 2015 2016 20175 Yr
Average10 Yr
AverageAnmore 0 0 0 0 0 0 0 0 0 0 0 0 0Belcarra 0 0 0 0 0 0 0 0 0 0 0 0 0Bowen Island 0 0 0 0 0 0 0 0 0 0 0 0 0Burnaby 20 0 11 10 0 52 111 137 60 377 165 170 92Coquitlam 0 0 0 0 0 0 0 0 0 0 0 0 0Delta 0 2 2 0 0 0 0 0 0 1 0 0 1UBC, UEL 0 0 0 0 0 0 0 0 0 0 0 0 0Langley City 0 0 0 0 0 0 0 0 0 45 2 9 5Langley Township 0 0 4 2 2 0 2 4 2 4 2 3 2Lions Bay 0 0 0 0 0 0 0 0 0 0 0 0 0Maple Ridge 0 0 52 0 2 0 0 0 0 54 0 11 11New Westminster 0 0 0 2 55 58 0 29 5 0 0 7 15North Vancouver City 0 0 48 24 4 66 0 0 31 13 16 12 20North Vancouver District 0 0 0 0 0 0 0 0 2 2 0 1 0Pitt Meadows 0 0 0 0 0 0 0 0 0 0 0 0 0Port Coquitlam 0 8 0 12 0 0 0 0 0 1 0 0 2Port Moody 0 0 0 0 0 0 0 0 0 0 0 0 0Richmond 0 0 0 6 4 0 0 0 6 0 0 1 2Surrey 0 0 0 0 0 0 0 0 0 1 1 0 0Vancouver 74 98 382 38 22 134 76 58 61 123 638 191 163West Vancouver 0 0 0 0 0 0 0 0 0 2 0 0 0White Rock 0 0 0 2 0 0 3 0 0 0 2 1 1Metro Vancouver 94 108 499 96 89 310 192 229 168 623 826 539 314Source: Statistics Canada (except for City of Richmond data from 2007 - 2009, Burnaby 2012)Source: City of Richmond (municipal website) 2005 - 2009; Maple Ridge (apartment demolition data) 2009; Port Coquitlam (apartment demolition data) 2009.Note: While data sources are believed to be reliable, the accuracy of the data cannot be guaranteed. "UBC, UEL" = University of British Columbia, University Endowment Lands
2.8

Housing Data Book Ground Oriented Unit Demolitions
Ground Oriented Dwelling Demolitions for Metro Vancouver Municipalities, 2007 - 2017
Municipality 2007 2008 2009 2010 2011 2012 2013 2014 2015 2016 20175 Yr
Average10 Yr
AverageAnmore 0 0 0 0 0 6 1 5 4 0 2 2 2Belcarra 4 0 0 1 4 1 2 1 1 1 4 2 2Bowen Island 3 5 5 2 0 0 1 3 4 7 4 4 n/aBurnaby 305 295 194 331 390 382 308 419 421 404 360 382 350Coquitlam 90 90 51 77 105 154 111 45 113 60 102 86 91Delta 55 65 71 53 63 94 97 99 131 160 175 132 101UBC, UEL 0 0 0 0 0 0 0 0 0 0 0 0 0Langley City 7 13 5 12 10 3 12 10 16 16 34 18 13Langley Township 78 109 67 57 77 83 71 75 113 121 127 101 90Lions Bay 0 1 1 0 0 0 0 0 0 0 0 0 0Maple Ridge 49 54 39 24 57 60 41 44 62 77 61 57 52New Westminster 46 29 28 41 46 48 46 41 63 57 54 52 45North Vancouver City 45 45 20 39 51 46 35 58 53 56 138 68 54North Vancouver District 93 70 69 84 74 109 127 152 152 163 111 141 111Pitt Meadows 11 10 3 5 8 6 8 8 2 14 10 8 7Port Coquitlam 39 33 13 36 24 27 26 38 35 30 45 35 31Port Moody 1 0 6 1 4 3 5 8 12 18 15 12 7Richmond 309 309 234 288 82 184 60 203 444 509 388 321 270Surrey 674 393 256 390 475 453 432 464 506 603 636 528 461Vancouver 762 660 515 788 932 900 530 755 969 763 653 734 747West Vancouver 164 86 47 83 97 116 121 99 124 163 101 122 104White Rock 0 16 25 32 38 29 49 68 52 49 58 55 42Metro Vancouver 2,734 2,279 1,649 2,344 2,537 2,704 2,083 2,594 3,276 3,271 3,078 2,860 2,582Source: Statistics Canada (except for City of Richmond data from 2007 - 2009, Burnaby 2012)Source: City of Richmond (municipal website) 2007 - 2009; Maple Ridge (apartment demolition data) 2009; Port Coquitlam (apartment demolition data) 2009.Note: Ground Oriented Dwellings include Single Detached, Cottages, Mobiles, Duplexes, Semi-detached, and Row House.
Note: 93% of Ground Oriented Dwelling demolitions over the past 10 years have been single detached dwellings.Note: While data sources are believed to be reliable, the accuracy of the data cannot be guaranteed. "UBC, UEL" = University of British Columbia, University Endowment Lands
2.8

METRO VANCOUVER HOUSING DATA BOOK ... Median Purpose Built Apartment Rents
2.9
Description
Median rents, when compared to changes in inflation measures and
incomes, provide a good indicator of affordability. When rents grow at
a faster rate than incomes, affordability pressures increase, particularly
for households with lower incomes.
The purpose built rental apartment universe, as reported in the CMHC
Rental Market Report, accounts for approximately 108,496 units or
32% of the estimated 330,000 rental dwelling units in 2016. The
remainder of the rental stock is mostly secondary suites, non‐market
rental units and privately rented condominium units (not included in
the rents data provided here).
Key Findings
CMHC data shows that for Metro Vancouver for the period from 2007
to 2017 (10 years), median apartment rents increased from $830 to
$1,200 per month, an increase of 45% (an average of 4.5% per year
over ten years).
According to the Consumer Price Index (2006 – 2016), Metro
Vancouver’s prices have increased by 15.3% or 1.5% per year on
average for the last 10 year period. During this same 10 year period for
British Columbia, according to BC Stats, average wages increased by
about 26.6% or 2.7% per year on average.
Median apartment rents have increased at a rate greater than the
average wage increase and the increase in the general price index
(inflation). Recent construction of new purpose‐built rental has added
more high priced units, therefore raising median rent in the region.
Since 2013 the median rent for 3‐bedroom units has increased by 15%;
2‐bedroom units median rent has increased by 20%; 1‐bedroom units
median rent has increased by 23%; and bachelor units by 15%.
Median Purpose Built Apartment Rents Metro Vancouver, 2006 ‐ 2017
Source: CMHC Rental Market Reports
Inflation Rates by Select Sectors, 2002 – 2016
Source: BC Stats (inflation & wage, based on 11 month y‐t‐d average) and CMHC (rents).

Housing Data Book Median Purpose Built Apartment Rents
Median Purpose Built Apartment Rents for Metro Vancouver Municipalities, 2007-2017
Municipality 2007 2008 2009 2010 2011 2012 2013 2014 2015 2016 2017
5 Year Increase
(2012-2017)
10 Year Increase
(2007-2017)Burnaby $785 $825 $850 $869 $880 $900 $900 $930 $950 $1,010 $1,100 $200 $315Coquitlam $745 $800 $814 $820 $840 $850 $850 $875 $915 $965 $1,075 $225 $330Delta $745 $795 $782 $790 $800 $820 $842 $863 $875 $895 $925 $105 $180Electoral Area A (UBC/UEL) $1,321 $1,349 $1,376 $1,439 $1,540 $1,465 $1,500 $1,560 $1,605 $1,651 $1,750 $285 $429Langley City $800 $800 $800 $800 $820 $825 $840 $850 $879 $970 $1,050 $225 $250Langley Township ** ** ** $887 $950 $875 $925 $825 $900 $920 $1,413 $538 n/aMaple Ridge $650 $700 $725 $725 $740 $750 $750 $750 $788 $825 $840 $90 $190New Westminster $730 $750 $775 $800 $800 $815 $840 $863 $875 $936 $1,005 $190 $275North Vancouver City $850 $900 $930 $950 $957 $975 $1,031 $1,035 $1,100 $1,200 $1,258 $283 $408North Vancouver District $925 $950 $1,022 $1,020 $1,047 $1,116 $1,150 $1,175 $1,206 $1,313 $1,439 $323 $514Pitt Meadows $795 $770 $770 $795 $850 $900 $865 $925 $909 $908 $1,100 $200 $305Port Coquitlam $745 $765 $775 $800 $800 $800 $825 $850 $878 $915 $1,020 $220 $275Port Moody $800 ** $819 $950 $875 $900 $900 $890 $919 $944 $1,075 $175 $275Richmond $925 $975 $950 $951 $970 $1,000 $1,000 $1,050 $1,100 $1,200 $1,227 $227 $302Surrey $725 $795 $785 $800 $800 $800 $850 $850 $863 $925 $986 #NAME? $261Vancouver $880 $904 $960 $1,000 $1,000 $1,050 $1,075 $1,115 $1,163 $1,237 $1,313 $263 $433West Vancouver $1,195 $1,250 $1,250 $1,325 $1,300 $1,400 $1,300 $1,458 $1,480 $1,581 $1,650 $250 $455White Rock $765 $800 $820 $825 $835 $850 $850 $842 $860 $900 $975 $125 $210
Metro Vancouver $830 $875 $900 $925 $950 $965 $1,000 $1,023 $1,055 $1,127 $1,200 $235 $370Source: CMHC regional housing data.Note: Data not available for small municipalities (Anmore, Belcarra, Bowen Is., Lions Bay)Note: "n/a" indicates data suppressed for confidentiality or data is not avialable.CHMC rental universe consists of 108,496 rental apartment units in Metro Vancouver (2017). This excludes secondary suites, non‐market rental units and privately rented condominium units
2.9

Housing Data Book Median Rent in Purpose Built Apartment by Unit Size
Median Rent for Purpose Built Apartment Units by Unit Size for Metro Vancouver, 2013-2017
Municipality Bachelor 1 Bdrm 2 Bdrm 3+ Bdrm Bachelor 1 Bdrm 2 Bdrm 3+ Bdrm Bachelor 1 Bdrm 2 Bdrm 3+ Bdrm Bachelor 1 Bdrm 2 Bdrm 3+ Bdrm Bachelor 1 Bdrm 2 Bdrm 3+ BdrmBurnaby $720 $870 $1,120 $1,250 $720 $880 $1,125 $1,200 $750 $899 $1,170 $1,360 $800 $950 $1,250 $1,314 $875 $1,025 $1,311 $1,400Coquitlam $720 $800 $975 $1,150 $720 $805 $1,000 $1,150 $720 $849 $1,070 $1,200 $775 $900 $1,125 $1,220 $827 $994 $1,246 $1,350Delta $641 $800 $1,040 $1,065 $659 $820 $1,050 $1,073 $685 $825 $1,078 $1,100 $680 $865 $1,135 ** $725 $875 $1,165 $1,145Electoral Area A (UBC/UEL) $925 $1,313 $2,000 $2,500 $1,240 $1,470 $2,050 $2,500 $1,300 $1,520 $2,150 $2,700 $1,360 $1,600 $2,178 $2,608 $1,370 $1,660 $2,330 $2,906Langley City $625 $740 $885 $1,100 $650 $750 $900 $1,145 $695 $795 $920 $1,100 $715 $900 $1,100 $1,146 $775 $979 $1,194 $1,475Langley Township ** $925 $1,050 ** ** $725 $1,050 ** ** $750 $1,500 ** ** $920 ** ** ** $1,150 $1,841 **Maple Ridge $600 $715 $875 $1,085 $600 $710 $850 $1,120 $600 $733 $940 $1,000 $600 $713 $938 $1,300 $632 $784 $945 $1,300New Westminster $680 $815 $1,065 $1,350 $711 $830 $1,120 $1,400 $715 $850 $1,130 $1,475 $750 $900 $1,200 $1,400 $805 $950 $1,295 $1,650North Vancouver City $850 $970 $1,200 $1,450 $865 $981 $1,250 $1,550 $900 $1,020 $1,300 $1,500 $980 $1,115 $1,377 $1,600 $966 $1,175 $1,475 $1,925North Vancouver District $901 $1,108 $1,300 $1,500 $924 $1,130 $1,350 $1,520 $953 $1,173 $1,348 $1,560 $992 $1,220 $1,375 $1,600 $1,049 $1,296 $1,731 $1,638Pitt Meadows ** $775 $950 $1,100 ** $783 $960 ** ** $784 $988 $1,175 ** $825 $933 ** ** $991 $1,200 **Port Coquitlam $600 $775 $900 $1,280 $610 $800 $930 $1,290 $600 $780 $925 $1,280 $650 $835 $953 $1,310 $670 $900 $1,075 $1,340Port Moody ** $850 $1,125 ** ** $850 ** ** ** $875 $1,200 ** ** $908 $1,100 ** ** $1,000 $1,150 **Richmond $806 $925 $1,150 $1,300 $830 $935 $1,150 $1,263 $851 $980 $1,230 $1,410 $922 $1,050 $1,278 $1,471 $962 $1,095 $1,291 $1,525Surrey $650 $750 $900 $1,100 $780 $750 $900 $1,100 $687 $765 $915 $1,106 $765 $850 $975 $1,150 $866 $885 $1,050 $1,175Vancouver $900 $1,063 $1,500 $1,800 $930 $1,100 $1,538 $1,850 $960 $1,150 $1,575 $1,850 $1,010 $1,200 $1,661 $1,850 $1,050 $1,300 $1,777 $2,200West Vancouver $950 $1,300 $2,013 $2,650 $1,000 $1,330 $2,050 $3,750 $1,000 $1,400 $2,200 $3,150 $1,300 $1,500 $2,200 $3,500 $1,248 $1,600 $2,500 $3,350White Rock $715 $850 $1,020 $1,450 $715 $825 $1,019 ** $775 $845 $1,045 $1,850 $800 $875 $1,050 ** $810 $940 $1,181 **Metro Vancouver $875 $950 $1,170 $1,300 $897 $995 $1,200 $1,280 $920 $1,010 $1,238 $1,350 $975 $1,086 $1,300 $1,356 $1,007 $1,165 $1,400 $1,500Source: CMHC Canadian Housing Observer and CMHC regional housing data.
Note: Data not available for small municipalities (Anmore, Belcarra, Bowen Is., Lions Bay)Note: ** indicates data suppressed for confidentiality or data is not available.Note: CMHC rental universe excludes secondary suites, non ‐market rental units, condominium apartment rental units.
2.9
20172015 20162013 2014

METRO VANCOUVER HOUSING DATA BOOK ... Average Purpose Built Apartment Vacancy Rate
2.10
Description
The purpose built apartment vacancy rate is an indication of the
health of the residential rental market. A residential vacancy rate of
2.0%‐3.0% is generally considered a balanced market. Low vacancy
rates lead to challenges for many households, particularly those with
low incomes, in finding suitable and affordable rental housing.
The purpose built rental apartment universe, as reported in the CMHC
Rental Market Report, accounts for approximately 108,700 units, or
34% of the estimated 340,000 rental dwelling units in 2016. The
remainder of the rental market is mostly secondary suites, non‐
market rental units and privately rented condominium units and are
not included in vacancy rate estimates provided here.
Key Findings
Data reported by CMHC for Fall 2017 shows that for the 108,496
purpose built rental apartments in Metro Vancouver, the vacancy rate
was 1.5%, which is slightly above the ten year average of 1.3% for the
region (2007 ‐ 2017).
Average vacancy rates vary by unit type and location. The average
vacancy rate for bachelor units was 0.7% compared to 1.4% for 3+
bedroom units. The lowest average vacancy rates were found on the
North Shore and Surrey / White Rock (0.3%), while the highest
average vacancy rate of 2.1% was found in the Langleys.
The demand for rental housing is expected to continue, as growth in
the region is largely attributed to immigration, noting that immigrants
tend to rent before purchasing a residence.
Nearly every municipality experienced an increase in vacancy rates in
2017 over the previous two years noting that some municipalities
having 0.0% vacancy rate in 2016.
Average Purpose Built Apartment Vacancy Rate in Metro Vancouver, 2006 ‐ 2017
Source: CMHC Rental Market Reports
Sub‐Regional Vacancy Rates by Bedroom Type, 2017
Source: CMHC Rental Market Reports

Housing Data Book Average Purpose Built Apartment Vacancy Rates
Average Purpose Built Apartment Vacancy Rates for Metro Vancouver Municipalities, 2006-2017
Municipality 2006 2007 2008 2009 2010 2011 2012 2013 2014 2015 2016 2017
5 Year Average
(2013-2017)
10 Year Average
(2008-2017)Burnaby 0.8% 0.5% 0.5% 3.4% 2.6% 2.0% 2.1% 2.0% 1.3% 1.2% 0.8% 1.3% 1.3% 1.7%Coquitlam, Port Moody and Port Coquitlam 0.7% 1.8% 0.7% 3.4% 3.2% 3.0% 3.2% 3.2% 1.5% 1.2% 1.6% 2.0% 1.9% 2.3%
Delta 1.8% 1.3% 0.8% 3.8% 1.2% 1.5% 1.8% 2.6% 3.6% 0.6% 0.0% 1.7% 1.7% 1.8%Langley City and Langley Township 2.1% 1.4% 1.3% 3.4% 3.9% 3.5% 4.4% 2.1% 2.4% 1.5% 1.0% 2.1% 1.8% 2.6%Maple Ridge and Pitt Meadows 2.1% 2.4% 2.0% 5.1% 3.2% 4.0% 4.9% 3.9% 2.6% 1.6% 0.4% 1.0% 1.9% 2.9%New Westminster 0.9% 1.3% 1.0% 3.3% 3.2% 2.9% 2.3% 2.2% 1.4% 0.9% 0.4% 1.5% 1.3% 1.9%North Van City 0.5% 0.3% 0.2% 0.9% 1.1% 0.5% 0.8% 0.9% 0.5% 0.4% 0.3% 2.1% 0.8% 0.8%North Van District 0.3% 0.3% 0.2% 0.9% 1.6% 0.4% 0.9% 1.3% 0.7% 0.5% 0.3% 1.8% 0.9% 0.9%Richmond 2.4% 0.7% 0.5% 2.7% 1.5% 1.2% 1.5% 2.7% 1.6% 0.9% 0.9% 1.2% 1.5% 1.5%Surrey 2.9% 2.4% 2.1% 6.1% 4.2% 3.7% 5.9% 4.4% 2.4% 1.9% 0.4% 1.0% 2.0% 3.2%University Endowment Lands 0.2% 0.0% 0.3% 0.2% 0.6% 0.3% 0.4% 0.5% 0.2% 0.1% 0.0% 0.4% 0.2% 0.3%Vancouver 0.3% 0.5% 0.3% 1.2% 1.3% 0.7% 1.1% 1.0% 1.0% 0.6% 0.8% 1.5% 1.0% 1.0%West Vancouver 0.1% 0.1% 0.4% 1.4% 0.6% 0.2% 0.9% 0.8% 0.7% 0.5% 0.2% 0.5% 0.5% 0.6%White Rock 0.5% 1.2% 0.5% 1.6% 1.8% 0.7% 3.3% 3.9% 1.5% 0.8% 0.1% 1.1% 1.5% 1.5%
Metro Vancouver 0.7% 0.7% 0.5% 2.1% 1.9% 1.4% 1.8% 1.7% 1.0% 0.8% 0.7% 1.5% 1.1% 1.3%Source: CMHC Canadian Housing Observer and CMHC regional housing data.Note: Data not available for small municipalities (Anmore, Belcarra, Bowen Is., Lions Bay). Electoral Area A data is not available, except for the University Endowment Lands (U.E.L.)Note: "n/a" indicates data suppressed for confidentiality or data is not available.Note: CMHC rental universe excludes condominium apartment rental units.CHMC rental universe consists of 107,867 rental apartment units in Metro Vancouver (2016).
2.10

Housing Data Book Average Purpose Built Apartment Vacancy Rates by Unit Size
Average Purpose Built Apartment Vacancy Rates by Unit Size for Metro Vancouver Municipalities, 2013-20172013 2014 2015
Municipality Bachelor 1 Bdrm 2 Bdrm 3+ Bdrm Bachelor 1 Bdrm 2 Bdrm 3+ Bdrm Bachelor 1 Bdrm 2 Bdrm 3+ Bdrm Bachelor 1 Bdrm 2 Bdrm 3+ Bdrm Bachelor 1 Bdrm 2 Bdrm 3+ BdrmBurnaby 1.4% 2.1% 1.5% 3.9% 0.7% 1.3% 1.2% 2.0% 0.7% 1.1% 1.3% 2.3% 0.5% 0.8% 0.9% 1.5% 0.7% 1.1% 2.0% 1.0%Coquitlam, Port Coq., and Port 2.2% 2.7% 3.7% 5.0% 1.2% 1.3% 2.0% 0.6% 0.6% 0.8% 1.3% 5.6% 1.1% 0.8% 2.3% 2.9% 1.7% 1.8% 2.5% 1.7%Delta 0.0% 2.1% 2.7% 2.8% 4.2% 5.1% 2.0% n/a 1.6% 0.6% 0.5% 0.0% 0.0% 0.0% 0.0% 0.0% 1.5% 1.5% 1.7% n/aLangley City and Township 10.3% 2.1% 2.0% 0.0% 5.9% 2.5% 2.4% 0.8% 1.2% 1.9% 1.1% 0.0% 2.4% 1.4% 0.5% 1.0% 5.1% 1.3% 2.3% n/aMaple Ridge and Pitt Meadows 0.0% 3.3% 4.9% 0.0% 0.0% 2.4% 3.3% 1.6% n/a 1.6% 1.6% 2.0% 0.0% 0.7% 0.2% 0.4% n/a 0.9% 1.3% n/aNew Westminster 1.3% 2.4% 2.3% 1.6% 1.8% 1.4% 1.4% 0.0% 1.4% 0.8% 0.8% 0.0% 0.4% 0.5% 0.1% 0.0% 1.1% 1.5% 1.2% n/aNorth Van City 0.4% 1.2% 0.7% 0.0% 0.2% 0.6% 0.4% 1.6% 0.0% 0.4% 0.5% 0.0% 0.6% 0.3% 0.3% 0.0% 0.9% 2.4% 1.8% n/aNorth Van District 0.6% 0.0% 2.9% 3.5% 0.0% 0.3% 1.0% 1.2% 0.0% 0.9% 0.6% 0.0% 0.0% 0.0% 0.2% 0.0% 1.7% 1.3% 2.5% 1.0%Richmond 0.0% 2.9% 2.6% 1.3% 0.0% 3.3% 0.8% 0.6% 0.4% 1.4% 0.5% 0.7% 2.5% 1.0% 0.7% 0.9% 0.6% 1.2% 1.3% 2.2%Surrey 3.5% 5.1% 3.5% 5.4% 0.8% 2.3% 2.4% 3.6% 3.9% 1.6% 2.0% 1.9% 0.0% 0.5% 0.4% 0.3% 2.3% 0.8% 1.1% 0.3%University Endowment Lands 0.0% 0.4% 0.7% 0.0% n/a 0.1% 0.4% n/a n/a 0.0% 0.0% 1.5% n/a 0.0% 0.0% n/a n/a 0.5% 0.4% n/aVancouver 0.9% 1.1% 1.0% 0.6% 0.8% 0.9% 1.1% 1.4% 0.6% 0.8% 0.9% 1.4% 0.8% 0.8% 0.9% 1.2% 1.5% 1.4% 1.7% 2.4%West Vancouver 0.6% 0.4% 1.2% 1.1% 2.8% 0.4% 0.7% n/a 1.2% 0.4% 0.5% n/a 0.4% 0.2% 0.0% 0.2% 1.1% 0.3% 0.8% n/aWhite Rock 2.6% 4.4% 2.8% 0.0% 4.1% 1.4% 1.2% n/a 3.0% 0.8% 0.3% 0.0% 0.0% 0.1% n/a 0.1% n/a 0.8% 1.2% n/aMetro Vancouver 1.1% 1.6% 1.9% 2.7% 0.8% 0.9% 1.1% 1.7% 0.6% 0.8% 0.9% 1.4% 0.7% 0.7% 0.7% 1.4% 0.7% 0.7% 0.7% 1.4%Source: CMHC Canadian Housing Observer and CMHC Rental Market Reports.Note: Data not available for small municipalities (Anmore, Belcarra, Bowen Is., Lions Bay)
Note: "n/a" indicates data suppressed for confidentiality or data is not statistically reliable
2.10
2016 2017
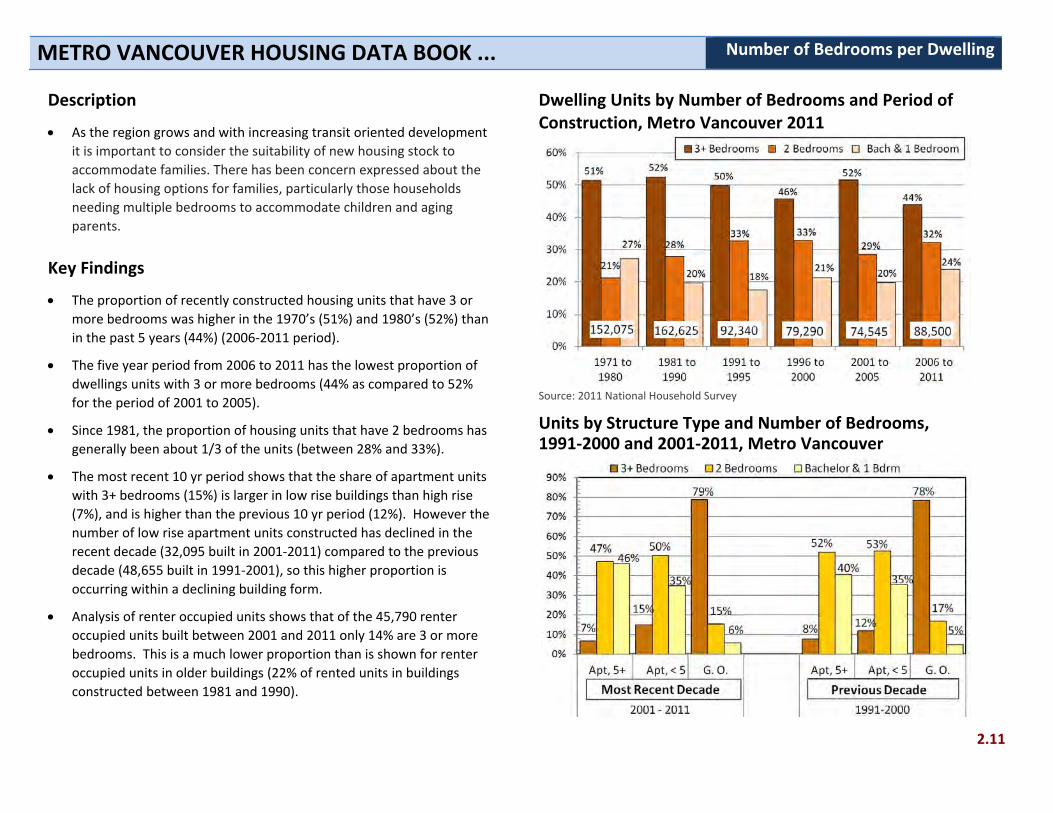
METRO VANCOUVER HOUSING DATA BOOK ... Number of Bedrooms per Dwelling
2.11
Description
As the region grows and with increasing transit oriented development it is important to consider the suitability of new housing stock to accommodate families. There has been concern expressed about the lack of housing options for families, particularly those households needing multiple bedrooms to accommodate children and aging parents.
Key Findings
The proportion of recently constructed housing units that have 3 or more bedrooms was higher in the 1970’s (51%) and 1980’s (52%) than in the past 5 years (44%) (2006‐2011 period).
The five year period from 2006 to 2011 has the lowest proportion of dwellings units with 3 or more bedrooms (44% as compared to 52% for the period of 2001 to 2005).
Since 1981, the proportion of housing units that have 2 bedrooms has generally been about 1/3 of the units (between 28% and 33%).
The most recent 10 yr period shows that the share of apartment units with 3+ bedrooms (15%) is larger in low rise buildings than high rise (7%), and is higher than the previous 10 yr period (12%). However the number of low rise apartment units constructed has declined in the recent decade (32,095 built in 2001‐2011) compared to the previous decade (48,655 built in 1991‐2001), so this higher proportion is occurring within a declining building form.
Analysis of renter occupied units shows that of the 45,790 renter occupied units built between 2001 and 2011 only 14% are 3 or more bedrooms. This is a much lower proportion than is shown for renter occupied units in older buildings (22% of rented units in buildings constructed between 1981 and 1990).
Dwelling Units by Number of Bedrooms and Period of Construction, Metro Vancouver 2011
Source: 2011 National Household Survey
Units by Structure Type and Number of Bedrooms, 1991‐2000 and 2001‐2011, Metro Vancouver

Housing Data Book Households by Number of Bedrooms
Dwelling Units by Number of Bedrooms by Period of Construction for Metro Vancouver, 2011 TOTAL DWELLING UNITS Total ALL PERIODS OF CONSTRUCTION Hshlds 1 Bedroom 2 Bedroom Units 3 Bedroom Units Bedroom Units
Bachelor & 4 or More ALL PERIODS OF CONSTRUCTION Hshlds
# # % # % # % # %Total - All Structural types 891,305 210,240 24% 232,155 26% 211,260 24% 237,645 27% Apartment, five or more storeys 128,815 70,795 55% 51,675 40% 5,970 5% 380 0% Apartment, fewer than five storeys 228,405 110,765 48% 92,855 41% 16,055 7% 8,730 4% Row house 82,580 3,495 4% 23,930 29% 46,145 56% 9,015 11%
S i d t h d h 19 710 830 4% 4 690 24% 9 640 49% 4 545 23%
1 Bedroom 2 Bedroom Units 3 Bedroom Units Bedroom Units
Semi-detached house 19,710 830 4% 4,690 24% 9,640 49% 4,545 23% Apartment, duplex 124,630 16,170 13% 27,365 22% 27,140 22% 53,955 43% Single-detached house 301,025 6,770 2% 28,210 9% 105,235 35% 160,810 53%Source: Statistics Canada, 2011 National Household SurveyNote: Structure types "movable dwelling" and "other single-attached house" are included in total, but not shown individually.
DWELLING UNITS IN STRUCTURE Total BUILT IN THE MOST RECENT DECADE Hshlds ( 2001 - 2011 ) # # % # % # % # %Total - All Structural types 163,045 35,890 22% 49,880 31% 32,195 20% 45,075 28% Apartment, five or more storeys 42,625 19,655 46% 20,140 47% 2,690 6% 135 0% Apartment, fewer than five storeys 32,095 11,150 35% 16,105 50% 2,990 9% 1,850 6%
Bachelor & 4 or More1 Bedroom 2 Bedroom Units 3 Bedroom Units Bedroom Units
Apartment, fewer than five storeys 32,095 11,150 35% 16,105 50% 2,990 9% 1,850 6% Row house 24,385 1,000 4% 6,535 27% 13,245 54% 3,610 15% Semi-detached house 4,285 120 3% 625 15% 1,945 45% 1,605 37% Apartment, duplex 16,915 2,345 14% 3,770 22% 2,430 14% 8,360 49% Single-detached house 42,090 1,410 3% 2,410 6% 8,770 21% 29,495 70%Source: Statistics Canada, 2011 National Household Survey
Note: Structure types "movable dwelling" and "other single-attached house" are included in total, but not shown individually.
2.11

Housing Data Book Households by Number of Bedrooms
Renter Occupied Units by Number of Bedrooms by Period of Construction for Metro Vancouver, 2011 TOTAL RENTAL UNITS Total ALL PERIODS OF CONSTRUCTION Hshlds
Bachelor & 4 or More1 Bedroom 2 Bedroom Units 3 Bedroom Units Bedroom Units ALL PERIODS OF CONSTRUCTION Hshlds
# # % # % # % # %Total - All Structural types 307,555 151,605 49% 98,325 32% 39,615 13% 18,010 6% Apartment, five or more storeys 70,050 49,110 70% 18,825 27% 2,010 3% 110 0% Apartment, fewer than five storeys 131,480 81,105 62% 41,065 31% 7,675 6% 1,630 1% Row house 19,975 2,125 11% 7,050 35% 9,170 46% 1,625 8%
S i d t h d h 4 405 565 13% 1 535 35% 1 770 40% 540 12%
1 Bedroom 2 Bedroom Units 3 Bedroom Units Bedroom Units
Semi-detached house 4,405 565 13% 1,535 35% 1,770 40% 540 12% Apartment, duplex 49,230 14,135 29% 21,150 43% 9,250 19% 4,700 10% Single-detached house 30,870 4,140 13% 7,920 26% 9,455 31% 9,355 30%Source: Statistics Canada, 2011 National Household SurveyNote: Structure types "movable dwelling" and "other single-attached house" are included in total, but not shown individually.
RENTAL UNITS IN STRUCTURE Total BUILT IN THE MOST RECENT DECADE Hshlds ( 2001 - 2011 ) # # % # % # % # %Total - All Structural types 45,790 20,570 45% 18,595 41% 4,575 10% 2,055 4% Apartment, five or more storeys 19,505 11,065 57% 7,615 39% 795 4% 25 0% Apartment, fewer than five storeys 12,405 5,665 46% 5,745 46% 770 6% 220 2%
Bachelor & 4 or More1 Bedroom 2 Bedroom Units 3 Bedroom Units Bedroom Units
Apartment, fewer than five storeys 12,405 5,665 46% 5,745 46% 770 6% 220 2% Row house 3,195 530 17% 945 30% 1,380 43% 335 10% Semi-detached house 475 35 7% 160 34% 185 39% 85 18% Apartment, duplex 6,370 2,105 33% 3,030 48% 715 11% 520 8% Single-detached house 3,695 1,095 30% 1,045 28% 720 19% 850 23%Source: Statistics Canada, 2011 National Household Survey
Note: Structure types "movable dwelling" and "other single-attached house" are included in total, but not shown individually.
2.11

Housing Data Book Households by Number of Bedrooms
Owner Occupied Units by Number of Bedrooms by Period of Construction for Metro Vancouver, 2011 TOTAL OWNER OCCUPIED UNITS Total ALL PERIODS OF CONSTRUCTION Hshlds
Bachelor & 4 or More1 Bedroom 2 Bedroom Units 3 Bedroom Units Bedroom Units ALL PERIODS OF CONSTRUCTION Hshlds
# # % # % # % # %
Total - All Structural types 583,420 58,625 10% 133,770 23% 171,535 29% 219,490 38% Apartment, five or more storeys 58,765 21,690 37% 32,845 56% 3,960 7% 270 0% Apartment, fewer than five storeys 96,925 29,655 31% 51,790 53% 8,375 9% 7,095 7% Row house 62,555 1,370 2% 16,865 27% 36,960 59% 7,370 12%
S i d t h d h 15 290 270 2% 3 150 21% 7 865 51% 4 005 26%
1 Bedroom 2 Bedroom Units 3 Bedroom Units Bedroom Units
Semi-detached house 15,290 270 2% 3,150 21% 7,865 51% 4,005 26% Apartment, duplex 75,390 2,035 3% 6,215 8% 17,885 24% 49,255 65% Single-detached house 269,885 2,620 1% 20,235 7% 95,690 35% 151,335 56%Source: Statistics Canada, 2011 National Household SurveyNote: Structure types "movable dwelling" and "other single-attached house" are included in total, but not shown individually.
OWNER OCCUPIED UNITS BUILT Total IN THE MOST RECENT DECADE Hshlds ( 2001 - 2011 ) # # % # % # % # %Total - All Structural types 117,155 15,320 13% 31,260 27% 27,590 24% 42,990 37% Apartment, five or more storeys 23,115 8,600 37% 12,530 54% 1,895 8% 80 0% Apartment, fewer than five storeys 19,685 5,475 28% 10,360 53% 2,225 11% 1,630 8%
Bachelor & 4 or More1 Bedroom 2 Bedroom Units 3 Bedroom Units Bedroom Units
Apartment, fewer than five storeys 19,685 5,475 28% 10,360 53% 2,225 11% 1,630 8% Row house 21,185 460 2% 5,590 26% 11,865 56% 3,270 15% Semi-detached house 3,795 80 2% 455 12% 1,755 46% 1,520 40% Apartment, duplex 10,540 245 2% 740 7% 1,720 16% 7,830 74% Single-detached house 38,300 315 1% 1,345 4% 8,020 21% 28,610 75%Source: Statistics Canada, 2011 National Household Survey
Note: Structure types "movable dwelling" and "other single-attached house" are included in total, but not shown individually.
2.11
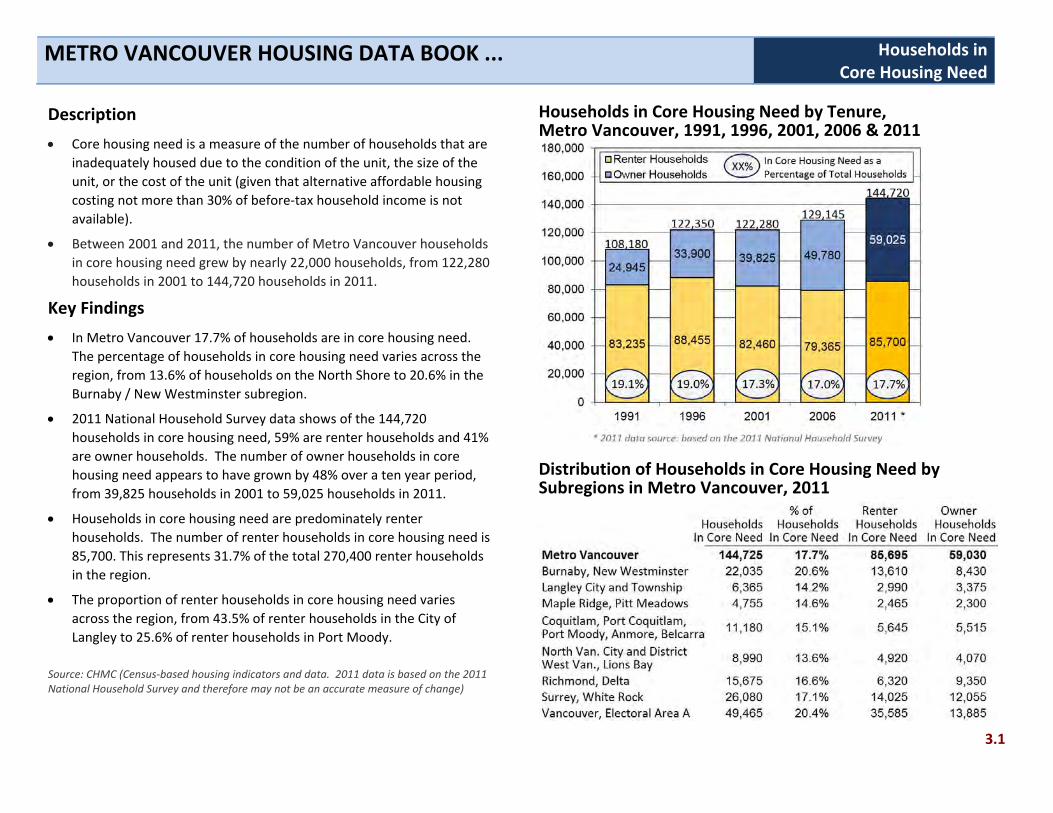
METRO VANCOUVER HOUSING DATA BOOK ... Households in Core Housing Need
3.1
Description
Core housing need is a measure of the number of households that are
inadequately housed due to the condition of the unit, the size of the
unit, or the cost of the unit (given that alternative affordable housing
costing not more than 30% of before‐tax household income is not
available).
Between 2001 and 2011, the number of Metro Vancouver households
in core housing need grew by nearly 22,000 households, from 122,280
households in 2001 to 144,720 households in 2011.
Key Findings
In Metro Vancouver 17.7% of households are in core housing need.
The percentage of households in core housing need varies across the
region, from 13.6% of households on the North Shore to 20.6% in the
Burnaby / New Westminster subregion.
2011 National Household Survey data shows of the 144,720
households in core housing need, 59% are renter households and 41%
are owner households. The number of owner households in core
housing need appears to have grown by 48% over a ten year period,
from 39,825 households in 2001 to 59,025 households in 2011.
Households in core housing need are predominately renter
households. The number of renter households in core housing need is
85,700. This represents 31.7% of the total 270,400 renter households
in the region.
The proportion of renter households in core housing need varies
across the region, from 43.5% of renter households in the City of
Langley to 25.6% of renter households in Port Moody.
Source: CHMC (Census‐based housing indicators and data. 2011 data is based on the 2011 National Household Survey and therefore may not be an accurate measure of change)
Households in Core Housing Need by Tenure, Metro Vancouver, 1991, 1996, 2001, 2006 & 2011
Distribution of Households in Core Housing Need by Subregions in Metro Vancouver, 2011

Housing Data Book Households in Core Housing Need
Households in Core Housing Need for Metro Vancouver Municipalities, 2011
Total Total Total Municipality Hshlds # % (Renter) # % (Owner) # %Anmore 610 35 5.7% 45 0 0.0% 560 35 6.3%Belcarra 260 10 3.8% 15 0 0.0% 245 0 0.0%Burnaby 78,415 16,060 20.5% 27,315 9,410 34.4% 51,100 6,650 13.0%Coquitlam 41,935 6,940 16.5% 10,050 3,585 35.7% 31,885 3,350 10.5%Delta 33,200 3,745 11.3% 6,100 1,835 30.1% 27,105 1,910 7.0%Electoral Area 'A' 3,580 820 22.9% 1,595 510 32.0% 1,990 310 15.6%Langley City 10,510 2,350 22.4% 3,595 1,565 43.5% 6,915 785 11.4%Langley Township 34,450 4,015 11.7% 5,060 1,425 28.2% 29,385 2,590 8.8%Lions Bay 490 25 5.1% 60 0 0.0% 425 15 3.5%Maple Ridge 26,365 3,885 14.7% 5,095 2,100 41.2% 21,270 1,795 8.4%New Westminster 28,365 5,975 21.1% 11,900 4,200 35.3% 16,465 1,780 10.8%North Vancouver City 21,115 3,660 17.3% 9,330 2,555 27.4% 11,780 1,110 9.4%North Vancouver District 28,915 3,320 11.5% 5,250 1,490 28.4% 23,660 1,835 7.8%Pitt Meadows 6,270 870 13.9% 1,395 365 26.2% 4,875 505 10.4%Port Coquitlam 19,475 2,830 14.5% 4,130 1,380 33.4% 15,340 1,445 9.4%Port Moody 11,790 1,365 11.6% 2,655 680 25.6% 9,135 685 7.5%Richmond 61,340 11,930 19.4% 13,455 4,485 33.3% 47,885 7,440 15.5%Surrey 143,575 24,450 17.0% 37,595 13,035 34.7% 105,980 11,415 10.8%Vancouver 238,620 48,645 20.4% 119,345 35,075 29.4% 119,275 13,575 11.4%West Vancouver 15,590 1,985 12.7% 3,195 875 27.4% 12,390 1,110 9.0%White Rock 9,250 1,630 17.6% 2,860 990 34.6% 6,390 640 10.0%Vancouver CMA 815,405 144,725 17.7% 270,400 85,695 31.7% 545,000 59,030 10.8%Source: CMHC (based on 2011 National Household Survey - All households incomes greater than zero and shelter-cost-to-income ratios (STIRs) less than 100%)
A household is said to be in Core Housing Need if its housing falls below at least one of the adequacy, suitability, or affordability standards and it would have to spend 30% or more of its total before-tax income to pay the median rent of alternative local housing that is acceptable (meets all three standards). · Adequate dwellings are those reported by their residents as not requiring any major repairs.
· Suitable dwellings have enough bedrooms for the size and make-up of resident households, according to National Occupancy Standard (NOS) requirements. · Affordable dwellings cost less than 30% of total before-tax household income
Note: Non-family households with at least one maintainer aged 15 to 29 attending school full-time are considered not to be in Core Housing Need (considered a transitional phase).
3.1
All Households Renter Households Owner HouseholdsHshlds in Core Need Hshlds in Core Need Hshlds in Core Need

METRO VANCOUVER HOUSING DATA BOOK ... Households in Core Housing Need and Spending At Least Half (INALH)
3.2
Description
Households in core housing need and spending at least half (INALH1)
of household income on shelter are considered to have dire housing
circumstances. In Metro Vancouver the INALH data is considered to
be a measure of households at risk of homelessness.
Between 2001 and 2011, the number of INALH households grew by
approximately 6,000 households, from 56,220 households in 2001 to
62,355 households in 2011.
Key Findings
In Metro Vancouver 7.6% of households are in core housing need and
spending at least half of household income on shelter. The proportion
of INALH households that are in rental housing is 55%, while the
remaining 45% are owner households.
The percentage of households that are INALH households varies
across the region, from 6.0% of households in Langley subregion to
9.0% in the Vancouver / Electoral Area (UBC/UEL) subregion.
INALH households are predominately renter households. The number
of renter households 34,065. This represents 12.6% of the total
270,400 renter households in the region.
The proportion of renter households that are INALH households varies
by municipality across the region, from 18.3% of renter households in
the city of West Vancouver to 6.2% in Port Moody.
1 INALH (In Need, At Least Half) * Source: CHMC (Census‐based housing indicators and data. 2011 data is based on the 2011 National Household Survey and therefore may not be an accurate measure of change). Data is for non‐farm, non‐band, non‐reserve households only.
INALH Households by Tenure, Metro Vancouver, 1991, 1996, 2001, 2006 & 2011
Distribution of INALH Households by Subregions in Metro Vancouver, 2011

Housing Data Book Households in Core Housing Need and Spending At Least Half (INALH)Households In Core Housing Need and Spending At Least Half (INALH) of Household Income on Shelter Costs for Metro Vancouver Municipalities, 2011
Total Total Total Municipality Hshlds # % (Renter) # % (Owner) # %Anmore 610 n/a n/a 45 n/a n/a 560 n/a n/aBelcarra 260 n/a n/a 15 n/a n/a 245 n/a n/aBurnaby 78,415 6,270 8.0% 27,315 3,455 12.6% 51,100 2,820 5.5%Coquitlam 41,935 3,175 7.6% 10,050 1,355 13.5% 31,885 1,820 5.7%Delta 33,200 1,500 4.5% 6,100 610 10.0% 27,105 890 3.3%Electoral Area 'A' 3,580 510 14.2% 1,595 330 20.7% 1,990 185 9.3%Langley City 10,510 940 8.9% 3,595 625 17.4% 6,915 320 4.6%Langley Township 34,450 1,765 5.1% 5,060 515 10.2% 29,385 1,250 4.3%Lions Bay 490 n/a n/a 60 n/a n/a 425 n/a n/aMaple Ridge 26,365 1,655 6.3% 5,095 805 15.8% 21,270 855 4.0%New Westminster 28,365 2,400 8.5% 11,900 1,645 13.8% 16,465 760 4.6%North Vancouver City 21,115 1,795 8.5% 9,330 1,185 12.7% 11,780 610 5.2%North Vancouver District 28,915 1,520 5.3% 5,250 680 13.0% 23,660 840 3.6%Pitt Meadows 6,270 375 6.0% 1,395 130 9.3% 4,875 245 5.0%Port Coquitlam 19,475 1,240 6.4% 4,130 460 11.1% 15,340 785 5.1%Port Moody 11,790 745 6.3% 2,655 265 10.0% 9,135 480 5.3%Richmond 61,340 5,320 8.7% 13,455 1,805 13.4% 47,885 3,515 7.3%Surrey 143,575 9,950 6.9% 37,595 4,285 11.4% 105,980 5,670 5.4%Vancouver 238,620 21,305 8.9% 119,345 14,760 12.4% 119,275 6,540 5.5%West Vancouver 15,590 995 6.4% 3,195 560 17.5% 12,390 435 3.5%White Rock 9,250 790 8.5% 2,860 545 19.1% 6,390 240 3.8%Vancouver CMA 815,405 62,355 7.6% 270,400 34,065 12.6% 545,000 28,285 5.2%Source: CMHC (based on 2011 NHS - All households with incomes greater than zero and shelter-cost-to-income ratios (STIRs) is greater or equal to 50% but lower than 100%.
A household is said to be in core housing need if its housing falls below at least one of the adequacy, suitability, or affordability standards and it would have to spend 30% or more of its total before-tax income to pay the median rent of alternative local housing that is acceptable (meets all three standards).· Adequate dwellings are those reported by their residents as not requiring any major repairs.
· Suitable dwellings have enough bedrooms for the size and make-up of resident households, according to National Occupancy Standard (NOS) requirements.· Affordable dwellings cost less than 30% of total before-tax household income
Note: Non-family households with at least one maintainer aged 15 to 29 attending school full-time are considered not to be in Core Housing Need (considered a transitional phase).Note: Data includes Non-Reserve Aboriginal Households. Aboriginal Households are defined as having one of the following: - a non-family household in which at least 50 per cent of household members self-identified as Aboriginal people, or - a family household that meets at least one of the two criteria: - at least one spouse, common-law partner, or lone parent self-identified as an Aboriginal person; or - at least 50 per cent of household members self-identified as Aboriginal people
3.2
All Households Renter Households Owner HouseholdsINALH Households INALH Households INALH Households

Housing Data Book Households in Core Housing Need and Spending At Least Half (INALH)Households In Core Need and Spending At Least Half (INALH) of Household Income on Shelter Costs in Metro Vancouver Municipalities, 1996, 2001, 2006, 2011
1996 2001INALH INALH INALH INALH
Municipality Hshlds Renters Owners Hshlds Renters Owners Hshlds Renters Owners Hshlds Renters OwnersAnmore n/a n/a n/a n/a n/a n/a n/a n/a n/a n/a n/a n/aBelcarra n/a n/a n/a n/a n/a n/a n/a n/a n/a n/a n/a n/aBurnaby 5,915 4,155 1,755 5,610 3,710 1,900 5,770 3,310 2,460 6,270 3,455 2,820Coquitlam 2,625 1,570 1,050 2,835 1,365 1,470 2,585 1,025 1,560 3,175 1,355 1,820Delta 1,780 920 860 1,480 645 835 1,600 730 870 1,500 610 890Electoral Area 'A' 220 190 30 160 145 20 330 210 125 510 330 185Langley City 855 645 210 855 615 240 790 495 295 940 625 320Langley Township 1,130 435 690 1,565 515 1,050 1,445 415 1,030 1,765 515 1,250Lions Bay n/a n/a n/a n/a n/a n/a n/a n/a n/a 15 0 0Maple Ridge 1,340 775 570 1,490 705 780 1,510 660 850 1,655 805 855New Westminster 2,235 1,835 400 2,295 1,750 540 2,005 1,455 545 2,400 1,645 760North Vancouver City 1,805 1,515 290 1,615 1,165 450 1,740 1,200 535 1,795 1,185 610North Vancouver District 1,285 585 700 1,465 675 785 1,280 555 725 1,520 680 840Pitt Meadows 315 115 200 280 115 165 265 100 165 375 130 245Port Coquitlam 1,050 595 460 1,170 570 600 1,190 485 700 1,240 460 785Port Moody 400 220 180 365 135 225 380 165 215 745 265 480Richmond 3,630 1,680 1,945 4,415 1,995 2,415 4,695 1,675 3,020 5,320 1,805 3,515Surrey 8,535 4,975 3,565 8,195 4,085 4,115 8,185 3,495 4,690 9,950 4,285 5,670Vancouver 22,965 18,800 4,165 20,740 15,945 4,795 20,120 14,220 5,900 21,305 14,760 6,540West Vancouver 805 500 300 805 490 315 1,035 585 450 995 560 435White Rock 680 485 195 775 560 210 680 440 240 790 545 240Vancouver CMA 57,685 40,025 17,665 56,215 35,220 21,000 55,765 31,290 24,470 62,355 34,065 28,285Source: CMHC (based on 2006 Census - All households with incomes greater than zero and shelter-cost-to-income ratios (STIRs) is greater or equal to 50% but lower than 100%)* 2011 Source: CMHC (based on 2011 National Household Survey. Direct measure of change is not recommended as the methodology differ.
A household is said to be in core housing need if its housing falls below at least one of the adequacy, suitability, or affordability standards and it would have to spend 30% or more of its total before-tax income to pay the median rent of alternative local housing that is acceptable (meets all three standards).· Adequate dwellings are those reported by their residents as not requiring any major repairs.
· Suitable dwellings have enough bedrooms for the size and make-up of resident households, according to National Occupancy Standard (NOS) requirements.· Affordable dwellings cost less than 30% of total before-tax household income
Note: Non-family households with at least one maintainer aged 15 to 29 attending school full-time are considered not to be in Core Housing Need (considered a transitional phase).
3.2
2006INALH Households INALH Households
2011 *INALH Households INALH Households

METRO VANCOUVER HOUSING DATA BOOK ... Households in Core Housing Need and Spending At Least Half (INALH)
3.3
Description
Households in core housing need and spending at least half (INALH1)
of household income on shelter are considered at economic risk of
homelessness.
Non‐family households have different housing needs than families
with children. Of the 62,350 INALH households in the region, 53.5%
(33,320) are family households. Non‐family households account for
nearly half (46.5%) of the INALH households in the region.
Key Findings
CMHC data shows that of the 33,320 INALH family households in
Metro Vancouver, 22% (7,370) are couples without children; 48%
(15,840) are couples with children; and 30% (10,110) are lone‐parent
families.
The proportion of INALH households with children living at home
increased by 18% over a ten year period, from 22,040 in 2001 to
25,950 in 2011.
Non‐family INALH households (single person or 2+ persons) increased
by 8% over a ten year period, from 26,785 in 2001 to 29,030 in 2011.
The proportion of INALH households with children varies across the
region, from 39% of all INALH households in Maple Ridge / Pitt
Meadows subregion to 60% in the Northeast sector.
The proportion of INALH households that are non‐family also varies
across the region. In Vancouver / UBC, UEL 59% of INALH households
are non‐family, whereas only 29% of INALH households are non‐family
in the Richmond / Delta subregion.
1 INALH (In Need, At Least Half) * Source: CHMC (Census‐based housing indicators and data. 2011 data is based on the 2011 National Household Survey and therefore may not be an accurate measure of change). Data is for non‐farm, non‐band, non‐reserve households only.
INALH Households by Household Type, Metro Vancouver, 2001 and 2011
Distribution of INALH Households by Subregion, Metro Vancouver, 2011
Source: CMHC (based on Statistics Canada 2011 NHS)

Housing Data Book Household Types in Core Housing Need and Spending At Least Half (INALH)Households In Core Housing Need and Spending At Least Half (INALH) of Household Income on Shelter Costs in Metro Vancouver Municipalities, 2011
Total INALH
Municipality Hshlds # % # % # % # % # %Anmore 10 n/a n/a n/a n/a n/a n/a n/a n/a n/a n/aBelcarra 10 n/a n/a n/a n/a n/a n/a n/a n/a n/a n/aBurnaby 6,280 850 14% 1,840 29% 1,030 16% 2,390 38% 170 3%Coquitlam 3,170 290 9% 1,165 37% 700 22% 955 30% 60 2%Delta 1,445 140 10% 425 29% 320 22% 560 39% 0 0%UBC, UEL 480 55 11% 300 63% 65 14% 60 13% 0 0%Langley City 930 75 8% 65 7% 175 19% 615 66% 0 0%Langley Township 1,745 250 14% 545 31% 345 20% 525 30% 80 5%Lions Bay 0 0 n/a 0 n/a 0 n/a 0 n/a 0 n/aMaple Ridge 1,615 150 9% 265 16% 360 22% 715 44% 125 8%New Westminster 2,385 280 12% 325 14% 235 10% 1,485 62% 60 3%North Vancouver City 1,785 160 9% 295 17% 300 17% 950 53% 80 4%North Vancouver District 1,520 130 9% 520 34% 340 22% 495 33% 35 2%Pitt Meadows 350 35 10% 55 16% 90 26% 170 49% 0 0%Port Coquitlam 1,175 90 8% 425 36% 315 27% 345 29% 0 0%Port Moody 705 65 9% 280 40% 180 26% 180 26% 0 0%Richmond 5,330 660 12% 2,295 43% 965 18% 1,335 25% 75 1%Surrey 9,950 1,080 11% 3,365 34% 2,110 21% 3,065 31% 330 3%Vancouver 21,300 2,770 13% 3,280 15% 2,410 11% 11,910 56% 930 4%West Vancouver 940 105 11% 200 21% 75 8% 560 60% 0 0%White Rock 770 50 6% 85 11% 35 5% 600 78% 0 0%Vancouver CMA 62,350 7,370 12% 15,840 25% 10,110 16% 26,960 43% 2,070 3%Source: CMHC (based on 2011 NHS - All households with incomes greater than zero and shelter-cost-to-income ratios (STIRs) less than 100% )
A household is said to be in core housing need if its housing falls below at least one of the adequacy, suitability, or affordability standards and it would have to spend 30% or more of its total before-tax income to pay the median rent of alternative local housing that is acceptable (meets all three standards).· Adequate dwellings are those reported by their residents as not requiring any major repairs.
· Suitable dwellings have enough bedrooms for the size and make-up of resident households, according to National Occupancy Standard (NOS) requirements.· Affordable dwellings cost less than 30% of total before-tax household income
Note: Non-family households with at least one maintainer aged 15 to 29 attending school full-time are considered not to be in Core Housing Need (considered a transitional phase).Note: Household type values may not add up to total INALH households. There are 870 multi-family households INALH reported in the region in 2006. "UBC, UEL" = University of British Columbia, University Endowment Lands
3.3
Couple Family Without Children
Couple Family With Children Lone Parent Family
Non-Family Hshld (Single Person)
Non-Family Hshld (2+ Persons)
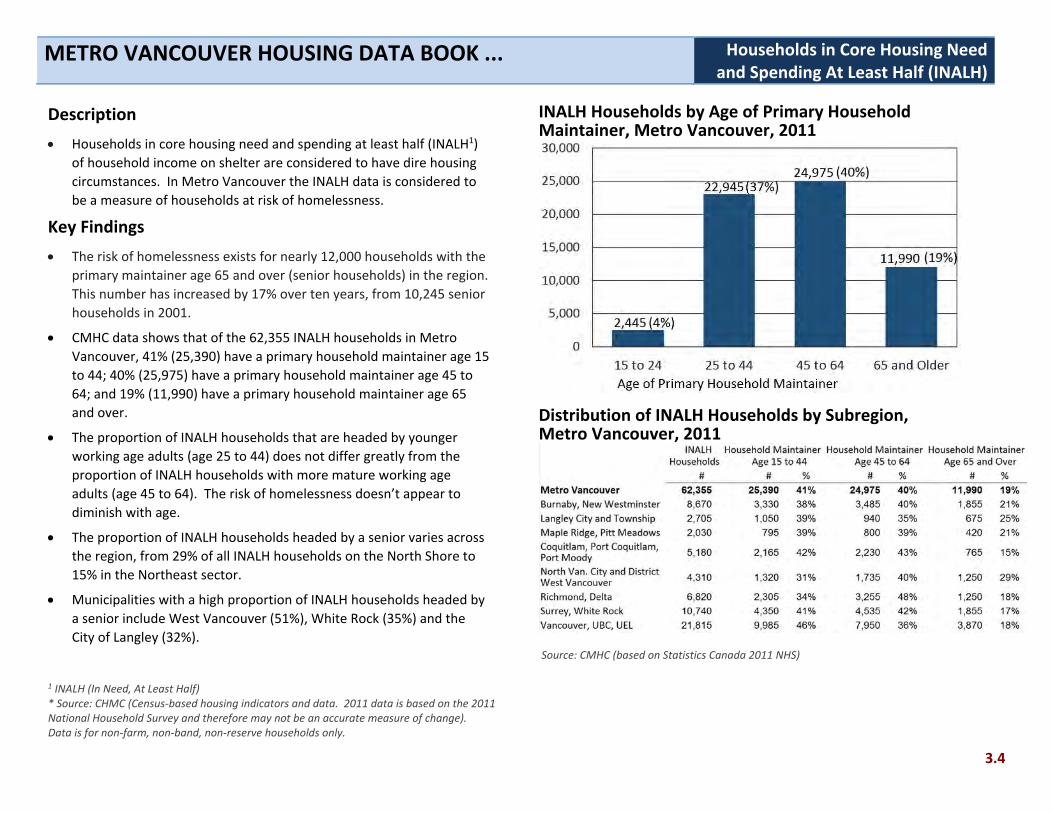
METRO VANCOUVER HOUSING DATA BOOK ... Households in Core Housing Need and Spending At Least Half (INALH)
3.4
Description
Households in core housing need and spending at least half (INALH1)
of household income on shelter are considered to have dire housing
circumstances. In Metro Vancouver the INALH data is considered to
be a measure of households at risk of homelessness.
Key Findings
The risk of homelessness exists for nearly 12,000 households with the
primary maintainer age 65 and over (senior households) in the region.
This number has increased by 17% over ten years, from 10,245 senior
households in 2001.
CMHC data shows that of the 62,355 INALH households in Metro
Vancouver, 41% (25,390) have a primary household maintainer age 15
to 44; 40% (25,975) have a primary household maintainer age 45 to
64; and 19% (11,990) have a primary household maintainer age 65
and over.
The proportion of INALH households that are headed by younger
working age adults (age 25 to 44) does not differ greatly from the
proportion of INALH households with more mature working age
adults (age 45 to 64). The risk of homelessness doesn’t appear to
diminish with age.
The proportion of INALH households headed by a senior varies across
the region, from 29% of all INALH households on the North Shore to
15% in the Northeast sector.
Municipalities with a high proportion of INALH households headed by
a senior include West Vancouver (51%), White Rock (35%) and the
City of Langley (32%).
1 INALH (In Need, At Least Half) * Source: CHMC (Census‐based housing indicators and data. 2011 data is based on the 2011 National Household Survey and therefore may not be an accurate measure of change). Data is for non‐farm, non‐band, non‐reserve households only.
INALH Households by Age of Primary Household Maintainer, Metro Vancouver, 2011
Distribution of INALH Households by Subregion, Metro Vancouver, 2011
Source: CMHC (based on Statistics Canada 2011 NHS)

Housing Data Book Household Types in Core Housing Need and Spending At Least Half (INALH)Households In Core Housing Need and Spending At Least Half (INALH) of Household Income on Shelter Costs by Age of Primary Household Maintainer, 2011
Total INALH
Municipality Hshlds # % # % # % # %Burnaby 6,270 1,390 22% 245 4% 2,180 35% 2,455 39%Coquitlam 3,175 465 15% 95 3% 1,225 39% 1,395 44%Delta 1,500 350 23% 20 1% 420 28% 700 47%UBC, UEL 510 0 0% 25 5% 315 62% 165 32%Langley City 940 300 32% 45 5% 330 35% 260 28%Langley Township 1,765 375 21% 0 0% 675 38% 680 39%Maple Ridge 1,655 365 22% 85 5% 545 33% 655 40%New Westminster 2,400 465 19% 80 3% 825 34% 1,030 43%North Vancouver City 1,795 395 22% 90 5% 600 33% 705 39%North Vancouver District 1,520 350 23% 35 2% 490 32% 650 43%Pitt Meadows 375 55 15% 0 0% 165 44% 145 39%Port Coquitlam 1,240 195 16% 25 2% 470 38% 555 45%Port Moody 745 105 14% 0 0% 350 47% 280 38%Richmond 5,320 900 17% 95 2% 1,770 33% 2,555 48%Surrey 9,950 1,575 16% 390 4% 3,790 38% 4,200 42%Vancouver 21,305 3,870 18% 1,145 5% 8,500 40% 7,785 37%West Vancouver 995 505 51% 0 0% 105 11% 380 38%White Rock 790 280 35% 0 0% 170 22% 335 42%Vancouver CMA 62,355 11,990 19% 2,445 4% 22,945 37% 24,975 40%Source: CMHC (based on 2011 NHS - All households with incomes greater than zero and shelter-cost-to-income ratios (STIRs) less than 100% )
Note: Anmore, Belcarra and Lions Bay are absent due to small sample size."UBC, UEL" = University of British Columbia, University Endowment LandsA household is said to be in core housing need if its housing falls below at least one of the adequacy, suitability, or affordability standards and it would have to spend 30% or more of its total before-tax income to pay the median rent of alternative local housing that is acceptable (meets all three standards).· Adequate dwellings are those reported by their residents as not requiring any major repairs.
· Suitable dwellings have enough bedrooms for the size and make-up of resident households, according to National Occupancy Standard (NOS) requirements.· Affordable dwellings cost less than 30% of total before-tax household income
Note: Non-family households with at least one maintainer aged 15 to 29 attending school full-time are considered not to be in Core Housing Need (considered a transitional phase).
3.4
Maintainer Age 65 and Older
Primary Hshld Maintainer Age 15 - 24
Primary Hshld Maintainer Age 25 - 44
Primary Hshld Maintainer Age 45 -64

METRO VANCOUVER HOUSING DATA BOOK ... Social Housing Waitlists
3.5
Description
BC Housing collects data on households that have applied for social housing in Metro Vancouver through the Housing Registry, a centralized database for those non‐profit housing providers that have chosen to participate. The waitlist tracks applicant households by municipality across the region, as well as by specific characteristics including family or single person households, seniors, persons with disabilities and households needing wheelchair access.
Key Findings
Over the past five years the number of households in Metro Vancouver waiting for social housing increased by 23%, from 8,955 in 2012 to 11,007 in 2017.
The social housing waitlist for seniors’ housing in the region has increased by over 100% in just 7 years, from 1,949 in 2010 to 3,969 in 2017. Seniors represent the largest component of the social housing waitlist in the region in 2017 at 36% of households.
Social housing for families represents the second largest component of the waitlist in 2017 with 34% (3,674) of the waitlist households.
Persons with disabilities account for 19% (2,131 households) of the 2017 social housing waitlist in the region.
The Surrey/White Rock subregion has seen a significant increase in social housing waitlist over the previous year, increasing 21% (369 units) from June 2016 to June 2017. The overall population growth rate for the Surrey/White Rock subregion is between 2% and 3% annually.
The municipalities with the greatest number of households waiting for social housing are the City of Vancouver (4,008), followed by Surrey (2,046), Burnaby (1,317) and Richmond (657). Surrey‘s waitlist has increased by 57% in the past five years, from 1,305 in 2012 to 2,046 households in 2017, whereas the overall population growth rate for Surrey is 11% over five years (2016 Census).
Social Housing Waitlist, by Household Characteristics, Metro Vancouver, 2008 ‐ 2017
Social Housing Waitlist by Sub‐regions, 2011 ‐ 2017

Housing Data Book Social Housing Waitlists ( BC Housing )Households on the BC Housing Waiting List byHousehold Type for Metro Vancouver Municipalities, 2011 - 2017
Geographic Area * 2011 2012 2013 2014 2015 2016 2017 2011 2012 2013 2014 2015 2016 2017 2011 2012 2013 2014 2015 2016 2017Aldergrove 28 24 32 25 20 31 25 17 14 17 11 11 20 16 4 2 1 2 1 - - Burnaby 1,115 1,182 1,202 1,171 1,199 1,239 1,317 564 525 518 481 482 503 515 95 94 82 83 101 112 111 Coquitlam 450 482 517 526 584 654 662 231 218 257 243 274 307 287 35 35 35 32 56 56 46 Delta 129 121 130 108 124 140 184 56 48 64 52 53 62 79 8 7 8 3 5 2 7 Langley 126 153 156 142 151 154 209 60 74 60 58 55 47 71 8 5 4 12 10 6 11 Maple Ridge 168 182 196 137 227 263 275 79 72 83 81 73 95 84 10 6 8 7 7 19 27 New Westminster 440 463 462 460 435 454 470 148 165 157 145 138 146 158 40 40 46 42 44 32 29 North Vancouver 441 440 503 533 606 615 610 161 152 155 173 194 211 176 25 22 34 28 30 25 32 Pitt Meadows 13 28 25 26 38 31 36 7 15 8 15 19 12 17 2 1 1 1 2 2 - Port Coquitlam 179 168 156 170 176 191 226 88 77 66 63 71 73 88 15 11 3 9 8 8 12 Port Moody 52 55 56 42 70 74 87 23 25 22 22 33 32 38 4 2 4 4 7 8 1 Richmond 540 599 611 636 641 657 680 236 224 206 203 234 237 235 39 40 33 37 35 37 30 Surrey 1,268 1,305 1,321 1,290 1,360 1,688 2,046 652 664 631 615 650 828 992 105 88 86 75 70 81 130 Vancouver 3,509 3,632 3,879 3,984 3,897 4,152 4,008 941 905 871 829 822 900 885 413 359 353 408 389 426 391 West Vancouver 72 81 104 86 97 96 104 23 13 27 16 19 23 22 3 5 4 9 5 1 1 White Rock 49 37 34 38 46 51 62 16 12 6 6 12 12 10 3 1 1 4 2 - 3 Vancouver CMA 8,587 8,955 9,391 9,489 9,671 10,496 11,007 3,304 3,203 3,150 3,014 3,140 3,509 3,674 808 718 703 757 772 815 831 Source: BC Housing (July 2011, July 2012, July 2013, June 2014, June 2015, June 2016, June 2017) (Note: Rent Supplements, Transfers, and Pending Applications are not inlcuded in totals) * Geographic areas as reported by BC Housing. Langleys and North Vancouver municipalities are grouped together. Aldergrove (in the Township of Langley) is reported separately. Anmore, Bowen Island, Lions Bay and Tsawwassen are not shown.
3.5
Family Households Single Person HouseholdsWait List - All

Housing Data Book Social Housing Waitlists ( BC Housing )Households on the BC Housing Waiting List byHousehold Type for Metro Vancouver Municipalities, 2011 - 2017
Geographic Area * 2011 2012 2013 2014 2015 2016 2017 2011 2012 2013 2014 2015 2016 2017 2011 2012 2013 2014 2015 2016 2017Aldergrove 3 5 8 7 5 6 7 4 3 5 5 2 4 1 0 0 1 0 1 1 1Burnaby 244 314 327 333 365 389 453 180 211 229 223 207 194 197 32 38 46 51 44 41 41Coquitlam 103 135 142 164 154 163 196 72 84 73 74 87 113 115 9 13 10 13 13 15 18Delta 36 33 28 24 30 48 59 27 28 23 26 28 25 28 2 5 7 3 8 3 11Langley 18 17 35 31 42 53 72 25 46 47 41 39 44 48 15 11 10 8 5 4 7Maple Ridge 45 57 62 70 81 77 88 30 38 36 48 51 57 60 4 9 7 12 15 15 16New Westminster 121 120 125 146 138 149 164 116 120 117 109 101 113 101 15 18 17 18 14 14 18North Vancouver 149 90 187 187 242 263 273 94 90 111 128 126 103 116 12 11 16 17 14 13 13Pitt Meadows 3 3 6 7 9 10 12 3 6 7 8 4 3 6 0 3 3 4 4 4 1Port Coquitlam 35 35 43 58 57 57 69 35 37 38 37 34 40 42 6 8 6 3 6 13 15Port Moody 13 16 17 14 14 21 24 10 12 11 11 14 9 18 2 0 2 2 2 4 6Richmond 211 258 273 295 274 282 333 37 58 71 75 73 77 66 17 19 28 26 25 24 16Surrey 226 227 266 285 316 413 509 233 261 276 248 266 281 312 52 65 62 67 58 85 103Vancouver 1,116 1,220 1,405 1,491 1,501 1,608 1,607 937 1,004 1,097 1,092 1,015 1,065 993 102 144 153 164 170 153 132West Vancouver 34 46 53 44 49 50 60 12 15 16 15 21 20 19 0 2 4 2 3 2 2White Rock 14 13 18 20 26 24 38 16 9 6 7 5 13 9 0 2 3 1 1 2 2Vancouver CMA 2,373 2,666 2,997 3,176 3,303 3,617 3,969 1,834 2,020 2,166 2,147 2,073 2,162 2,131 268 348 375 391 383 393 402Source: BC Housing (July 2011, July 2012, July 2013, June 2014, June 2015, June 2016, June 2017) (Note: Rent Supplements, Transfers, and Pending Applications are not inlcuded in totals) * Geographic areas as reported by BC Housing. Langleys and North Vancouver municipalities are grouped together. Aldergrove (in the Township of Langley) is reported separately. Anmore, Bowen Island, Lions Bay and Tsawwassen are not shown.
3.5
Seniors Wheelchair Accessible UnitPersons with Disabilities

METRO VANCOUVER HOUSING DATA BOOK ... Expiring Operating Agreements, 2015 ‐ 2045
3.6
Description
There are approximately 19,050 social housing units and 12,430
cooperative housing units in Metro Vancouver that currently have
operating agreements with the provincial or federal government.
This includes non‐profit housing, co‐ops, independent seniors
housing, group homes, transition homes and other housing with
supports, as well as some units receiving rent supplements.
Housing units with expiring agreements account for 63% of the
estimated 50,350 social housing units in the region.
Key Findings
By the year 2031 nearly all of the 19,050 social housing units the
operating agreements will have expired, and 91% of the 12,430
housing cooperative agreements will have expired.
The population groups served by affected expiring agreements
within the 19,050 social housing units include low‐income
families (6,436 units), independent seniors (9,056 units), frail
seniors (365 units), and special needs clients (953 units). There
are 1,173 units for homelessness with expiring operating
agreements, and these are all located in the City of Vancouver.
47% of the 19,050 social housing units with expiring operating
agreements are in the City of Vancouver. Other municipalities
with a large number of units include Burnaby (2,177 units), Surrey
(1,859 units), and Richmond (1,276 units).
47% of the 12,430 cooperative housing units with expiring
operating agreements are in the City of Vancouver (5,800 units) and
17% are in the City of Burnaby (2,145 units).
Social Housing Units with Expiring Operating Agreements by Population Group Served, Metro Vancouver 2015 – 2045
Note: Cooperative Housing is excluded. Source: BC Housing
Distribution of Social Housing Units with Expiring Operating Agreements, Metro Vancouver, 2015 – 2045
Source: BC Housing
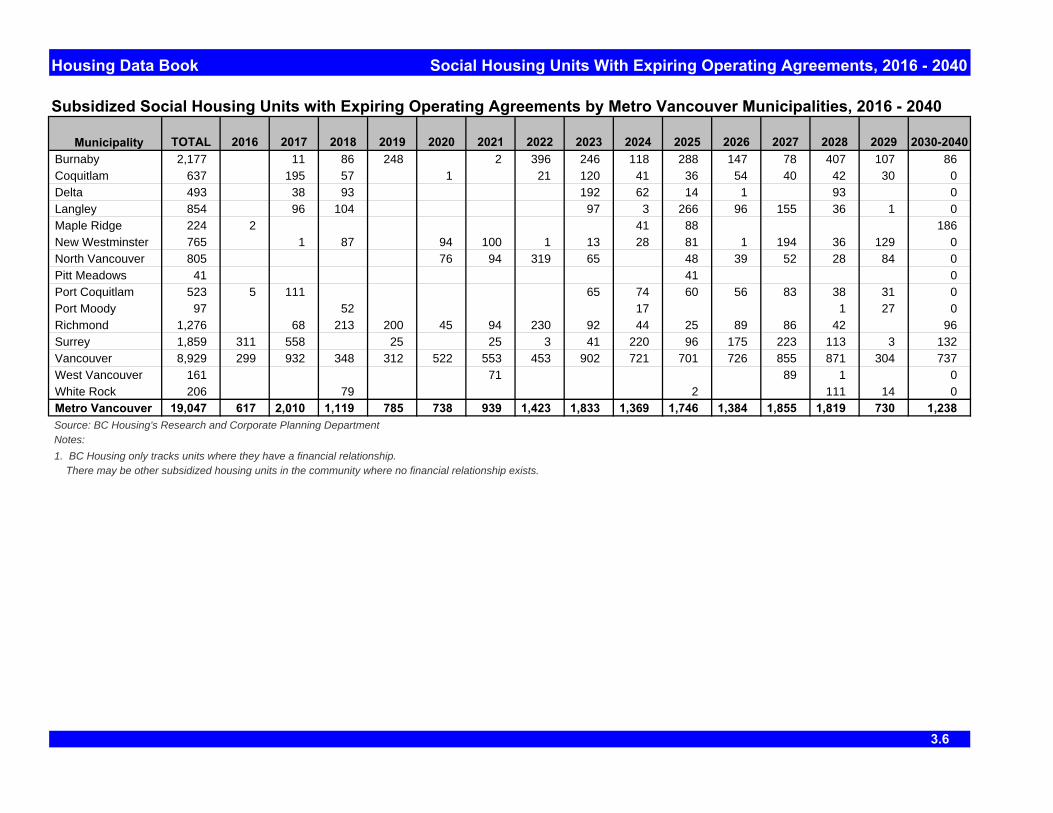
Housing Data Book Social Housing Units With Expiring Operating Agreements, 2016 - 2040
Subsidized Social Housing Units with Expiring Operating Agreements by Metro Vancouver Municipalities, 2016 - 2040
Municipality TOTAL 2016 2017 2018 2019 2020 2021 2022 2023 2024 2025 2026 2027 2028 2029 2030-2040Burnaby 2,177 11 86 248 2 396 246 118 288 147 78 407 107 86Coquitlam 637 195 57 1 21 120 41 36 54 40 42 30 0Delta 493 38 93 192 62 14 1 93 0Langley 854 96 104 97 3 266 96 155 36 1 0Maple Ridge 224 2 41 88 186New Westminster 765 1 87 94 100 1 13 28 81 1 194 36 129 0North Vancouver 805 76 94 319 65 48 39 52 28 84 0Pitt Meadows 41 41 0Port Coquitlam 523 5 111 65 74 60 56 83 38 31 0Port Moody 97 52 17 1 27 0Richmond 1,276 68 213 200 45 94 230 92 44 25 89 86 42 96Surrey 1,859 311 558 25 25 3 41 220 96 175 223 113 3 132Vancouver 8,929 299 932 348 312 522 553 453 902 721 701 726 855 871 304 737West Vancouver 161 71 89 1 0White Rock 206 79 2 111 14 0Metro Vancouver 19,047 617 2,010 1,119 785 738 939 1,423 1,833 1,369 1,746 1,384 1,855 1,819 730 1,238Source: BC Housing's Research and Corporate Planning Department Notes:1. BC Housing only tracks units where they have a financial relationship. There may be other subsidized housing units in the community where no financial relationship exists.
3.6

Housing Data Book Cooperative Housing Units With Expiring Operating Agreements
Cooperatives with Expiring Operating Agreements by Metro Vancouver Municipalities, 2001 - 2061
Municipality TOTALPre-2016 2016 2017 2018 2019 2020 2021 2022 2023 2024 2025 2026 2027 2028 2029
2030-2040 2040+
Bowen Island 19 19Burnaby 2,144 24 660 372 240 73 146 133 70 218 56 152Coquitlam 689 65 157 291 65 37 74Delta 150 24 44 44 38Langley 40 40Maple Ridge 162 84 31 47New Westminste 415 42 49 84 116 31 42 51North Vancouver 465 65 173 43 67 67 50Pitt Meadows 314 64 250Port Coquitlam 25 25Port Moody 336 219 60 57Richmond 989 70 72 94 64 122 195 107 192 73Surrey 879 190 198 232 96 34 49 40 40Vancouver 5,799 634 253 781 233 496 805 487 474 87 257 21 320 110 61 696
Metro Vancouver 12,426 1,090 555 2,191 1,368 763 1,236 865 978 450 767 311 96 320 256 61 0 1,035Source: Co-operative Housing Federation of BCNote: While data sources are believed to be reliable, the accuracy of the data cannot be guaranteed. Note: - Athlete’s Village Coop in the city of Vancouver has no program or dates as it was a one-off deal with the City.
3.6

Housing Data Book Social Housing Units With Expiring Operating Agreements, 2016 - 2040
Subsidized Social Housing Units with Expiring Operating Agreements for Low Income Families, 2016 - 2040
Municipality TOTAL 2016 2017 2018 2019 2020 2021 2022 2023 2024 2025 2026 2027 2028 2029 2030-2040Burnaby 705 86 248 1 1 92 65 86 83 43Coquitlam 450 102 57 1 49 40 36 54 40 41 30 0Delta 131 38 51 40 1 1 0Langley 199 33 1 154 10 1 0Maple Ridge 86 35 51 0New Westminster 176 48 94 34 0North Vancouver 284 76 94 1 1 47 19 46 0Pitt Meadows 41 41 0Port Coquitlam 322 107 22 40 56 41 38 18 0Port Moody 79 52 27 0Richmond 591 68 130 184 42 1 1 2 1 74 40 48Surrey 1,291 253 494 1 41 133 23 158 30 91 1 66Vancouver 2,047 198 82 203 210 207 177 110 50 80 211 221 104 51 143West Vancouver 33 32 1 0White Rock 1 1 0Metro Vancouver 6,436 253 1,007 506 635 381 343 181 243 281 446 566 638 445 211 300Source: BC Housing's Research and Corporate Planning Department Notes:1. BC Housing only tracks units where they have a financial relationship. There may be other subsidized housing units in the community where no financial relationship exists.
3.6

Housing Data Book Social Housing Units With Expiring Operating Agreements, 2016 - 2040
Subsidized Social Housing Units with Expiring Operating Agreements for Seniors1, 2016 - 2040
Municipality TOTAL 2016 2017 2018 2019 2020 2021 2022 2023 2024 2025 2026 2027 2028 2029 2030-2040Burnaby 1,224 0 0 0 0 0 0 348 204 96 119 80 63 290 24 0Coquitlam 147 0 93 0 0 0 0 0 54 0 0 0 0 0 0 0Delta 319 0 0 42 0 0 0 0 136 48 0 0 0 93 0 0Langley 650 0 96 104 0 0 0 0 97 0 232 95 0 26 0 0Maple Ridge 93 0 0 0 0 0 0 0 0 0 0 0 0 0 0 93New Westminster 542 0 0 39 0 0 100 0 0 0 81 0 193 0 129 0North Vancouver 431 0 0 0 0 0 0 270 64 0 0 15 0 0 82 0Pitt Meadows 0 0 0 0 0 0 0 0 0 0 0 0 0 0 0 0Port Coquitlam 176 0 4 0 0 0 0 0 65 52 0 0 42 0 13 0Port Moody 0 0 0 0 0 0 0 0 0 0 0 0 0 0 0 0Richmond 483 0 0 83 16 45 52 171 40 0 0 64 12 0 0 0Surrey 465 50 64 0 25 0 25 0 0 51 60 1 189 0 0 0Vancouver 4,574 63 153 78 109 178 40 186 754 496 570 438 524 628 191 166West Vancouver 127 0 0 0 0 0 71 0 0 0 0 0 56 0 0 0White Rock 190 0 0 79 0 0 0 0 0 0 1 0 0 110 0 0Metro Vancouver 9,421 113 410 425 150 223 288 975 1,414 743 1,063 693 1,079 1,147 439 259Source: BC Housing's Research and Corporate Planning Department Notes:1. BC Housing only tracks units where they have a financial relationship. There may be other subsidized housing units in the community where no financial relationship exists.
3.6

Housing Data Book Social Housing Units With Expiring Operating Agreements, 2016 - 2040
Subsidized Social Housing Units with Expiring Operating Agreements for Special Needs, 2016 - 2040
Municipality TOTAL 2016 2017 2018 2019 2020 2021 2022 2023 2024 2025 2026 2027 2028 2029 2030-2040
Burnaby 39 11 2 1 1 4 2 15 3 0Coquitlam 3 1 1 1 0Delta 0Langley 5 3 1 1 0Maple Ridge 20 2 6 12 0New Westminster 19 1 1 13 1 1 2 0North Vancouver 17 1 5 6 3 2 0Pitt Meadows 0Port Coquitlam 25 5 20 0Port Moody 1 1 0Richmond 51 2 23 24 2 0Surrey 23 8 2 1 3 1 4 2 2 0Vancouver 734 50 21 84 103 85 23 12 53 51 77 40 67 1 67West Vancouver 1 1 0White Rock 15 1 14 0Metro Vancouver 953 65 33 84 103 87 27 13 80 115 110 68 82 19 67Source: BC Housing's Research and Corporate Planning Department Notes:1. BC Housing only tracks units where they have a financial relationship. There may be other subsidized housing units in the community where no financial relationship exists.
3.6

Housing Data Book Social Housing Units With Expiring Operating Agreements, 2016 - 2040
Subsidized Social Housing Units with Expiring Operating Agreements for Homeless Housed & Sheltered1, 2016 - 2040
Municipality TOTAL 2016 2017 2018 2019 2020 2021 2022 2023 2024 2025 2026 2027 2028 2029 2030-2040
Burnaby 0Coquitlam 0Delta 0Langley 0Maple Ridge 0New Westminster 0North Vancouver 0Pitt Meadows 0Port Coquitlam 0Port Moody 0Richmond 0Surrey 0Vancouver 1,173 186 560 104 0 31 221 0 0 0 0 0 0 17 0 54West Vancouver 0White Rock 0Metro Vancouver 1,173 186 560 104 0 31 221 0 0 0 0 0 0 17 0 54Source: BC Housing's Research and Corporate Planning Department Notes:1. BC Housing only tracks units where they have a financial relationship. There may be other subsidized housing units in the community where no financial relationship exists.
3.6

METRO VANCOUVER HOUSING DATA BOOK Homeless Population
3.7
Description
Homeless counts in Metro Vancouver occur every three years.
The homeless count results should not be viewed as a precise
measure of the number of homeless persons. It is however a
good indicator of magnitude of need. It can also provide a profile
of the homeless population, and show trends over time.
The 2011, 2014 and 2017 homeless count included hospitals, jails
and detox facilities contributing data about persons who would
be homeless when leaving the facility.
Key Findings
A total of 3,605 homeless people were counted in the Metro
Vancouver region on March 8, 2017. Of those 1,032 were
unsheltered and 2,573 sheltered. The 2017 homeless count
includes 267 individuals with no fixed address (staying in either a
detox facility, hospital, or were in jail).
The homeless population grew by 30% (828 people) since 2014.
This increase comes after a fairly stable count of about 2,700
persons (+/‐ 100) over the previous 3 counts (2008, 2011, 2014).
Homelessness increased in all communities except on the North
Shore, between 19% (Burnaby) and 142% (Delta/White Rock).
The largest homeless population can be found in Vancouver, with
2,138 people, followed by Surrey with 602 people.
The 2017 Count found 746 individuals who identified as
Indigenous/ Aboriginal.
More comprehensive data from regional homeless counts and a
detailed analysis of the data is available at
www.endhomelessnessnow.ca.
Metro Vancouver Homeless Count, 2002 ‐ 2017
Source: Greater Vancouver Regional Steering Committee on Homelessness.
Metro Vancouver Homeless Count Results by Subregion, 2017
Source: Greater Vancouver Regional Steering Committee on Homelessness.

Housing Data Book Regional Homelessness Count
Homeless Count Results for Metro Vancouver, 2002, 2005, 2008, 2011, 2014, 20172011 *200820052002 2017 *2014 *
Municipality Street
Sheltered
TotalStre
etSheltered
TotalStre
etSheltered
TotalStre
etSheltered
Total *Stre
etSheltered
Total *Stre
etSheltered
Total *
Burnaby n/a n/a 18 38 2 42 77 9 86 70 8 78 44 13 58 49 19 69Langley n/a n/a 18 52 2 57 74 12 86 60 42 103 54 35 92 79 123 206Maple Ridge / Pitt Meadows n/a n/a 66 30 12 44 40 50 90 63 46 110 39 43 84 30 88 124
New Westminster n/a n/a 74 47 45 97 72 52 124 41 88 132 34 70 106 30 93 133North Vancouver n/a n/a 47 27 58 90 67 60 127 55 67 122 60 54 119 11 77 100
Richmond n/a n/a 31 24 9 35 37 19 56 34 15 49 22 11 38 29 36 70
Surrey n/a n/a 171 263 108 392 307 95 402 230 159 400 140 210 403 203 330 602
Tri-Cities n/a n/a 14 30 8 40 76 18 94 28 19 48 23 31 55 41 73 117
Vancouver n/a n/a 670 591 700 1,364 811 765 1,576 154 1,336 1,581 536 1,143 1,803 537 1,445 2,138
Delta / White Rock n/a n/a 12 3 8 13 13 6 19 13 0 19 5 10 19 23 22 46Metro Vancouver 333 788 1,121 1,127 1,047 2,174 1,574 1,086 2,660 758 1,780 2,650 957 1,620 2,777 1,032 1,620 3,605Source: Greater Vancouver Regional Steering Committee on Homelessness. Results of the 2017 Homeless Count in the Metro Vancouver Region.
Note: The increase in numbers from 2002 and 2005 could, to some extent, be a function of an improved count methodology, including more volunteers.
* Note: Total include those found in detox facilities, hospitals and Jail who identify as homeless. This inclusion is unique to the 2011, 2014 and 2017 homeless counts.
3.7
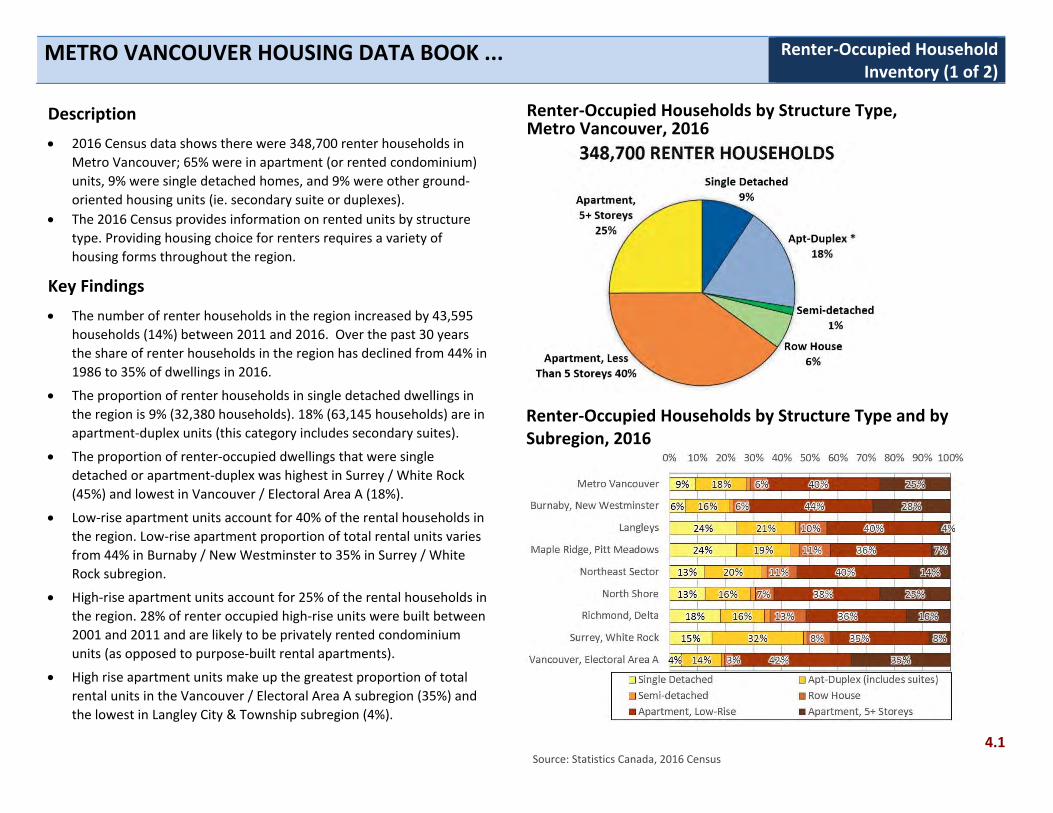
METRO VANCOUVER HOUSING DATA BOOK ... Renter‐Occupied Household Inventory (1 of 2)
4.1 Source: Statistics Canada, 2016 Census
Description
2016 Census data shows there were 348,700 renter households in
Metro Vancouver; 65% were in apartment (or rented condominium)
units, 9% were single detached homes, and 9% were other ground‐
oriented housing units (ie. secondary suite or duplexes).
The 2016 Census provides information on rented units by structure
type. Providing housing choice for renters requires a variety of
housing forms throughout the region.
Key Findings
The number of renter households in the region increased by 43,595
households (14%) between 2011 and 2016. Over the past 30 years
the share of renter households in the region has declined from 44% in
1986 to 35% of dwellings in 2016.
The proportion of renter households in single detached dwellings in
the region is 9% (32,380 households). 18% (63,145 households) are in
apartment‐duplex units (this category includes secondary suites).
The proportion of renter‐occupied dwellings that were single
detached or apartment‐duplex was highest in Surrey / White Rock
(45%) and lowest in Vancouver / Electoral Area A (18%).
Low‐rise apartment units account for 40% of the rental households in
the region. Low‐rise apartment proportion of total rental units varies
from 44% in Burnaby / New Westminster to 35% in Surrey / White
Rock subregion.
High‐rise apartment units account for 25% of the rental households in
the region. 28% of renter occupied high‐rise units were built between
2001 and 2011 and are likely to be privately rented condominium
units (as opposed to purpose‐built rental apartments).
High rise apartment units make up the greatest proportion of total
rental units in the Vancouver / Electoral Area A subregion (35%) and
the lowest in Langley City & Township subregion (4%).
Renter‐Occupied Households by Structure Type, Metro Vancouver, 2016
Renter‐Occupied Households by Structure Type and by Subregion, 2016

METRO VANCOUVER HOUSING DATA BOOK ... Renter‐Occupied Household Inventory (2 of 2)
4.1
Description
2016 Census data shows there were 348,780 renter households in
Metro Vancouver; 23% were in units built since 2000, 27% were built
in the 1980’s and 1990’s, and 24% were built in the 50’s and 60’s.
The 2016 Census provides information on rented units by structure
type as well as age. Providing housing choice for renters requires both
adding new rental housing units as well as understanding the existing
rental supply.
Key Findings
The share of renter households in the region has declined from 44% in
1986 to 35% of dwellings in 2016.
23% (79,680 households) of all renter households live in units built in
the past 16 years (2001 to 2016). The age composition of rental
housing units varies across the region. 33% of renter household’s in
Surrey / White Rock and Richmond / Delta / Tsawwassen live in
structures built since 2000, whereas in Pitt Meadows / Maple Ridge
only 20% of renter household structures were built since 2000.
The proportion of renter‐occupied units that were built prior to 1961
was highest in Vancouver / Electoral Area A (23%) and lowest in
Richmond/ Delta / Tsawwassen (7%) and Surrey / White Rock (7%).
With respect to differing structure types, low‐rise apartment units
account for 43% of the rental households in the region. 9% of low‐rise
units were built between 2001 and 2011. Most renter occupied low
rise units were built prior to 1981 (61%).
High‐rise apartment units account for 23% of the rental households in
the region. 28% of renter occupied high‐rise units were built between
2001 and 2011 and are likely to be privately rented condominium
units (as opposed to purpose‐built rental apartments).
Renter Households by Age of Housing Structure in Metro Vancouver, 2016
Source: Statistics Canada, 2016 Census Renter Households in Metro Vancouver by Housing Structure Age and by Subregion, 2016

Housing Data Book Renter Occupied Household Inventory (2016)Renter-Occupied Households in Metro Vancouver Municipalities, 2016
Total Rental Municipality No. No. % No. % No. % No. % No. % No. %Anmore 60 Belcarra 25 Bowen Island 265 200 75% 35 13%Burnaby 34,985 2,255 6% 6,535 19% 575 2% 2,310 7% 14,395 41% 8,850 25%Coquitlam 14,545 1,835 13% 2,690 18% 250 2% 1,145 8% 5,980 41% 2,590 18%Delta 7,570 2,170 29% 2,340 31% 180 2% 320 4% 2,475 33% 70 1%Electoral Area A 3,265 75 2% 15 0% 10 0% 360 11% 1,685 52% 1,110 34%Langley City 4,500 250 6% 280 6% 30 1% 360 8% 3,575 79% 0 0%Langley Township 7,345 2,495 34% 2,105 29% 125 2% 775 11% 995 14% 460 6%Lions Bay 45 Maple Ridge 6,095 1,590 26% 1,225 20% 200 3% 485 8% 2,115 35% 440 7%New Westminster 14,370 555 4% 1,245 9% 115 1% 505 4% 7,140 50% 4,780 33%North Vancouver City 11,620 420 4% 1,230 11% 230 2% 545 5% 6,355 55% 2,835 24%North Vancouver District 6,650 1,195 18% 2,035 31% 95 1% 920 14% 1,475 22% 915 14%Pitt Meadows 1,615 230 14% 265 16% 25 2% 370 23% 635 39% 85 5%Port Coquitlam 5,025 760 15% 1,510 30% 110 2% 625 12% 1,975 39% 45 1%Port Moody 3,250 235 7% 390 12% 55 2% 670 21% 1,230 38% 660 20%Richmond 18,910 2,595 14% 1,820 10% 365 2% 3,075 16% 6,955 37% 4,080 22%Surrey 49,020 7,405 15% 16,145 33% 660 1% 4,230 9% 16,820 34% 3,490 7%Vancouver 150,750 6,395 4% 22,120 15% 1,410 1% 4,430 3% 62,855 42% 53,075 35%West Vancouver 4,260 1,055 25% 385 9% 55 1% 60 1% 705 17% 2,000 47%White Rock 3,215 490 15% 715 22% 35 1% 20 1% 1,495 47% 445 14%Vancouver CMA 348,700 32,380 9% 63,145 18% 4,540 1% 21,290 6% 138,980 40% 86,940 25%Source: Statistics Canada, 2016 Census (Custom Cross-tabulations)Note: Structure Type "Apartment, Duplex" would include up-down duplexes as well as houses with secondary suites. With respect to the house with a secondary suite, the primary unit may also be included if it is also rented and not owner-occupied (in addition to the rented suite).Note: Values may not add up to 100% of Metro Vancouver total figures due to rounding, data suppression, and customized data orders.Electoral Area A includes UBC/UEL (University of British Columbia / University Endowment Lands)
4.1
Apartment, 5 or more storeysSingle Detached
Apartment, Duplex * Semi-detached Row House
Apartment, Less Than 5 Storeys

Housing Data Book Renter Occupied Units - All Building Types - Age of BuildingRenter Occupied Dwelling Units by Age of Structure in Metro Vancouver Municipalities, 2016
All Units Municipality No. No. % No. % No. % No. % No. % No. % No. % No. %Anmore 60 0 0% 25 0% 10 0% 10 0% 0 0% 10 0% 0 0% 10 0%Belcarra 25 0 0% 20 0% 0 0% 10 0% 0 0% 0 0% 0 0% 0 0%Bowen Island 265 10 4% 45 60 45 70 10 15 30Burnaby 34,985 2,295 7% 4,650 13% 4,215 12% 6,175 18% 7,870 22% 5,460 16% 3,185 9% 1,130 3%Coquitlam 14,545 1,850 13% 2,110 15% 2,260 16% 2,290 16% 2,990 21% 1,825 13% 940 6% 275 2%Delta 7,570 300 4% 400 5% 665 9% 1,450 19% 2,440 32% 1,545 20% 520 7% 245 3%Electoral Area A 3,265 770 24% 1,120 34% 535 16% 345 11% 190 6% 125 4% 130 4% 50 2%Langley City 4,500 275 6% 610 14% 655 15% 730 16% 1,240 28% 670 15% 215 5% 110 2%Langley Township 7,345 1,040 14% 1,540 21% 1,080 15% 925 13% 1,310 18% 675 9% 475 6% 310 0%Lions Bay 45 0 0% 0 0% 10 0% 0 0% 25 0% 0 0% 0 0% 10 0%Maple Ridge 6,095 405 7% 1,000 16% 905 15% 900 15% 1,235 20% 790 13% 595 10% 260 4%New Westminster 14,370 765 5% 1,535 11% 1,240 9% 1,805 13% 3,135 22% 3,080 21% 1,725 12% 1,080 8%North Vancouver City 11,620 825 7% 1,255 11% 810 7% 1,400 12% 2,905 25% 2,530 22% 1,375 12% 525 5%North Vancouver Dist. 6,650 385 6% 385 6% 600 9% 955 14% 1,955 29% 1,345 20% 785 12% 245 4%Pitt Meadows 1,615 80 5% 320 20% 295 18% 350 22% 370 23% 115 7% 35 2% 50 0%Port Coquitlam 5,025 350 7% 750 15% 920 18% 785 16% 1,110 22% 685 14% 350 7% 80 0%Port Moody 3,250 120 4% 1,080 33% 460 14% 360 11% 530 16% 465 14% 185 6% 55 2%Richmond 18,910 2,515 13% 2,960 16% 2,935 16% 3,570 19% 4,055 21% 1,725 9% 865 5% 280 1%Surrey 49,020 5,220 11% 12,050 25% 8,215 17% 8,050 16% 7,875 16% 4,470 9% 2,405 5% 740 2%Vancouver 150,750 9,900 7% 19,630 13% 18,010 12% 17,875 12% 24,980 17% 25,155 17% 16,760 11% 18,435 12%West Vancouver 4,260 220 5% 245 6% 345 8% 430 10% 980 23% 1,270 30% 515 12% 255 6%White Rock 3,215 115 4% 360 11% 345 11% 400 12% 830 26% 700 22% 300 9% 155 5%Vancouver CMA 348,700 27,470 8% 52,210 15% 44,715 13% 48,995 14% 66,450 19% 53,010 15% 31,505 9% 24,340 7%Source: Statistics Canada, 2016 Census (Custom Cross-tabulations)Note: Values may not add up to 100% of Metro Vancouver total figures due to rounding, data suppression, and customized data orders.Note: "n/a" indicates data suppression due to low values reported (the value is greater than zero but less than 25).Note: Electoral Area A includes UBC/UEL (University of British Columbia / University Endowment Lands)
4.1
2011 - 2016 Pre- 19462001 - 2010 1991 - 2000 1981 - 1990 1971 - 1980 1961 - 1970 1946 - 1960

Housing Data Book Renter Occupied Single Detached House - Age of BuildingRenter Occupied Single Detached House by Age of Structure in Metro Vancouver Municipalities, 2016
Single Detached Municipality House No. % No. % No. % No. % No. % No. %Anmore 25Belcarra 10Bowen Island 200Burnaby 2,255 75 3% 120 5% 165 7% 210 9% 405 18% 455 20% 810 36%Coquitlam 1,835 100 5% 120 7% 265 14% 330 18% 385 21% 315 17% 325 18%Delta 2,170 85 4% 90 4% 110 5% 300 14% 665 31% 520 24% 390 18%Electoral Area A 75Langley City 250 0 0% 10 4% 25 10% 50 20% 90 36% 50 20% 35 14%Langley Township 2,495 85 3% 205 8% 345 14% 315 13% 575 23% 385 15% 585 0%Lions Bay 40Maple Ridge 1,590 45 3% 195 12% 150 9% 215 14% 290 18% 290 18% 400 25%New Westminster 555 20 4% 50 9% 10 2% 20 4% 55 10% 35 6% 350 63%North Vancouver City 420 15 4% 15 4% 10 2% 35 8% 30 7% 80 19% 230 55%North Vancouver Distric 1,195 40 3% 50 4% 95 8% 85 7% 220 18% 290 24% 420 35%Pitt Meadows 230 0 0% 10 4% 25 11% 45 20% 60 26% 40 17% 50 0%Port Coquitlam 760 0 0% 65 9% 70 9% 105 14% 225 30% 160 21% 145 0%Port Moody 235 0 0% 10 4% 35 15% 20 9% 70 30% 35 15% 75 32%Richmond 2,595 65 3% 235 9% 335 13% 465 18% 630 24% 400 15% 480 18%Surrey 7,405 555 7% 1,190 16% 690 9% 1,135 15% 1,555 21% 1,080 15% 1,200 16%Vancouver 6,395 995 16% 445 7% 430 7% 430 7% 575 9% 595 9% 2,925 46%West Vancouver 1,055 20 2% 50 5% 90 9% 125 12% 190 18% 275 26% 310 29%White Rock 490 10 2% 45 9% 15 3% 30 6% 140 29% 105 21% 145 30%Vancouver CMA 32,380 2,125 7% 2,970 9% 2,940 9% 3,985 12% 6,285 19% 5,135 16% 8,935 28%Source: Statistics Canada, 2016 CensusNote: Values may not add up to 100% of Metro Vancouver total figures due to rounding, data suppression, and customized data orders.Note: "n/a" indicates data suppression due to low values reported (the value is greater than zero but less than 20).Note: Electoral Area A includes UBC/UEL (University of British Columbia / University Endowment Lands)
4.1
Pre- 19612011 - 2016 2001 - 2010 1991 - 2000 1981 - 1990 1971 - 1980 1961 - 1970

Housing Data Book Renter Occupied "Apartment, Duplex" - Age of BuildingRenter "Apartment, Duplex" (primarily secondary suites) by Age of Structure in Metro Vancouver Municipalities, 2016
Apartment, Duplex
Municipality (includes suites) No. % No. % No. % No. % No. % No. %Anmore 35Belcarra 20Bowen Island 35Burnaby 6,535 315 5% 790 12% 1,025 16% 1,075 16% 1,335 20% 965 15% 1,020 16%Coquitlam 2,690 140 5% 465 17% 680 25% 380 14% 430 16% 320 12% 285 11%Delta 2,340 105 4% 190 8% 185 8% 380 16% 870 37% 425 18% 195 8%Electoral Area A 15 0 10 0 10Langley City 280 0 0% 10 4% 20 7% 50 18% 110 39% 65 23% 25 9%Langley Township 2,105 330 16% 520 25% 340 16% 290 14% 420 20% 125 6% 90 0%Lions Bay 0Maple Ridge 1,225 40 3% 250 20% 300 24% 230 19% 210 17% 115 9% 70 6%New Westminster 1,245 95 8% 75 6% 190 15% 130 10% 180 14% 140 11% 430 35%North Vancouver City 1,230 85 7% 100 8% 100 8% 105 9% 230 19% 240 20% 370 30%North Vancouver Distric 2,035 40 2% 155 8% 190 9% 330 16% 565 28% 400 20% 350 17%Pitt Meadows 265 0 0% 10 4% 95 36% 45 17% 85 32% 15 6% 30 0%Port Coquitlam 1,510 35 2% 115 8% 350 23% 305 20% 305 20% 255 17% 140 0%Port Moody 390 10 3% 30 8% 80 21% 80 21% 65 17% 65 17% 60 15%Richmond 1,820 65 4% 140 8% 215 12% 300 16% 585 32% 325 18% 195 11%Surrey 16,145 1,640 10% 4,575 28% 3,135 19% 2,525 16% 2,220 14% 1,315 8% 735 5%Vancouver 22,120 1,345 6% 2,610 12% 2,535 11% 2,580 12% 3,275 15% 2,880 13% 6,895 31%West Vancouver 385 15 4% 10 3% 45 12% 50 13% 65 17% 40 10% 145 38%White Rock 715 45 6% 125 17% 135 19% 90 13% 130 18% 100 14% 95 13%Vancouver CMA 63,145 4,300 7% 10,215 16% 9,635 15% 8,970 14% 11,085 18% 7,815 12% 11,125 18%Source: Statistics Canada, 2016 CensusNote: Values may not add up to 100% of Metro Vancouver total figures due to rounding, data suppression, and customized data orders.Note: "n/a" indicates data suppression due to low values reported (the value is greater than zero but less than 20).Note: Electoral Area A includes UBC/UEL (University of British Columbia / University Endowment Lands)
4.1
Pre- 19612011 - 2016 2001 - 2010 1991 - 2000 1981 - 1990 1971 - 1980 1961 - 1970

Housing Data Book Renter Occupied Semi-Detached Units - Age of BuildingRenter Occupied Semi-Detached (Side-by-Side Duplex) Units by Age of Structure in Metro Vancouver Municipalities, 2016
Semi-detached
Municipality No. No. % No. % No. % No. % No. % No. %Anmore 0Belcarra 0Bowen Island 0Burnaby 575 75 13% 85 15% 45 8% 90 16% 95 17% 80 14% 115 20%Coquitlam 250 95 38% 25 10% 75 30% 50 20% 60 24% 15 6% 25 10%Delta 180 15 8% 0 0% 35 19% 35 19% 45 25% 40 22% 15 8%Electoral Area A 10Langley City 30Langley Township 125 160 128% 25 20% 20 16% 25 20% 40 32% 0 0% 35 28%Lions Bay 0Maple Ridge 200 20 10% 0 0% 30 15% 30 15% 55 28% 30 15% 40 20%New Westminster 115 45 39% 25 22% 0 0% 0 0% 0 0% 20 17% 25 22%North Vancouver City 230 25 11% 65 28% 15 7% 30 13% 30 13% 35 15% 20 9%North Vancouver District 95 60 63% 15 16% 20 21% 25 26% 10 11% 0 0% 10 11%Pitt Meadows 25Port Coquitlam 110 30 27% 0 0% 0 0% 10 9% 75 68% 15 14% 10 9%Port Moody 55Richmond 365 170 47% 40 11% 40 11% 45 12% 105 29% 80 22% 50 14%Surrey 660 540 82% 100 15% 55 8% 100 15% 125 19% 120 18% 115 17%Vancouver 1,410 150 11% 205 15% 125 9% 235 17% 190 13% 150 11% 415 29%West Vancouver 55White Rock 35Vancouver CMA 4,540 1,425 31% 625 14% 490 11% 730 16% 875 19% 645 14% 900 20%Source: Statistics Canada, 2016 CensusNote: Values may not add up to 100% of Metro Vancouver total figures due to rounding, data suppression, and customized data orders.Note: "n/a" indicates data suppression due to low values reported (the value is greater than zero but less than 20).Note: Electoral Area A includes UBC/UEL (University of British Columbia / University Endowment Lands)
4.1
Pre- 19612011 - 2016 2001 - 2010 1991 - 2000 1981 - 1990 1971 - 1980 1961 - 1970

Housing Data Book Renter Occupied Row House Units - Age of BuildingRenter Occupied Row House Units by Age of Structure in Metro Vancouver Municipalities, 2016
Row house Municipality No. No. % No. % No. % No. % No. % No. %Anmore 0Belcarra 0Bowen Island 0Burnaby 2,310 75 3% 300 13% 470 20% 780 34% 505 22% 130 6% 50 2%Coquitlam 1,145 95 8% 145 13% 180 16% 350 31% 255 22% 85 7% 35 3%Delta 320 15 5% 15 5% 35 11% 170 53% 45 14% 30 9% 10 3%Electoral Area A 360 10 3% 25 7% 85 24% 120 33% 55 15% 35 10% 25 7%Langley City 360 10 3% 25 n/a 40 11% 75 21% 160 44% 35 10% 15 4%Langley Township 775 160 21% 245 32% 115 15% 135 17% 85 11% 35 5% 10 1%Lions Bay 10Maple Ridge 485 20 4% 50 10% 115 24% 90 19% 150 31% 50 10% 10 2%New Westminster 505 45 9% 45 9% 35 7% 240 48% 90 18% 40 8% 0 0%North Vancouver City 545 25 5% 50 9% 65 12% 160 29% 125 23% 85 16% 40 7%North Vancouver District 920 60 7% 35 4% 85 9% 235 26% 300 33% 155 17% 45 5%Pitt Meadows 370 10 3% 70 19% 45 12% 145 39% 90 24% 0 0% 0 0%Port Coquitlam 625 30 5% 140 22% 150 24% 100 16% 140 22% 45 7% 25 4%Port Moody 670 0 0% 115 17% 105 16% 105 16% 150 22% 165 25% 35 5%Richmond 3,075 170 6% 410 13% 680 22% 960 31% 585 19% 215 7% 50 2%Surrey 4,230 540 13% 1,195 28% 805 19% 870 21% 565 13% 175 4% 90 2%Vancouver 4,430 150 3% 380 9% 500 11% 1,235 28% 1,200 27% 460 10% 505 11%West Vancouver 60White Rock 20Vancouver CMA 21,290 1,425 7% 3,280 15% 3,520 17% 5,785 27% 4,555 21% 1,750 8% 980 5%Source: Statistics Canada, 2016 CensusNote: Values may not add up to 100% of Metro Vancouver total figures due to rounding, data suppression, and customized data orders.Note: "n/a" indicates data suppression due to low values reported (the value is greater than zero but less than 20).Note: Electoral Area A includes UBC/UEL (University of British Columbia / University Endowment Lands)
4.1
Pre- 19612011 - 2016 2001 - 2010 1991 - 2000 1981 - 1990 1971 - 1980 1961 - 1970

Housing Data Book Renter Apartment (Less Than 5 Storeys) Units - Age of BuildingRenter Apartment Units (Less Than 5 Storeys) by Age of Structure in Metro Vancouver Municipalities, 2016
Low-rise Apartment
Municipality No. No. % No. % No. % No. % No. % No. %Anmore 0Belcarra 0Bowen Island 25Burnaby 14,395 530 4% 1,320 9% 1,665 12% 2,375 16% 3,485 24% 3,100 22% 1,915 13%Coquitlam 5,980 405 7% 395 7% 840 14% 1,070 18% 1,695 28% 1,025 17% 550 9%Delta 2,475 75 3% 90 4% 290 12% 535 22% 810 33% 520 21% 155 n/aElectoral Area A 1,685 220 13% 770 46% 350 21% 165 10% 35 2% 45 3% 110 7%Langley City 3,575 260 7% 570 16% 565 16% 555 16% 870 24% 520 15% 240 7%Langley Township 995 180 18% 320 32% 165 17% 95 10% 90 9% 95 10% 50 5%Lions Bay 0Maple Ridge 2,115 285 13% 490 23% 200 9% 215 10% 425 20% 260 12% 240 11%New Westminster 7,140 245 3% 330 5% 555 8% 825 12% 1,660 23% 1,975 28% 1,555 22%North Vancouver City 6,355 235 4% 270 4% 450 7% 700 11% 1,920 30% 1,715 27% 1,060 17%North Vancouver District 1,475 95 6% 105 7% 155 11% 225 15% 360 24% 370 25% 165 11%Pitt Meadows 635 40 6% 160 25% 125 20% 100 16% 130 20% 50 8% 10 2%Port Coquitlam 1,975 245 12% 435 22% 340 17% 265 13% 365 18% 200 10% 105 5%Port Moody 1,230 40 3% 405 33% 185 15% 135 11% 205 17% 190 15% 55 4%Richmond 6,955 600 9% 740 11% 1,065 15% 1,670 24% 1,935 28% 625 9% 315 5%Surrey 16,820 1,200 7% 3,880 23% 3,180 19% 3,060 18% 2,925 17% 1,630 10% 940 6%Vancouver 62,855 1,720 3% 4,085 6% 6,005 10% 8,360 13% 12,500 20% 11,535 18% 18,640 30%West Vancouver 705 160 23% 85 12% 110 16% 75 11% 145 21% 85 12% 50 7%White Rock 1,495 10 1% 65 4% 180 12% 150 10% 465 31% 430 29% 200 13%Vancouver CMA 138,980 6,535 5% 14,540 10% 16,475 12% 20,615 15% 30,030 22% 24,385 18% 26,395 19%Source: Statistics Canada, 2016 CensusNote: Values may not add up to 100% of Metro Vancouver total figures due to rounding, data suppression, and customized data orders.Note: "n/a" indicates data suppression due to low values reported (the value is greater than zero but less than 20).Note: Electoral Area A includes UBC/UEL (University of British Columbia / University Endowment Lands)
4.1
2001 - 20102011 - 2016 1971 - 1980 Pre- 19611981 - 19901991 - 2000 1961 - 1970

Housing Data Book Renter Apartment Units (5 Storeys or More) - Age of BuildingRenter Apartment Units (5 Storeys or More) by Age of Structure in Metro Vancouver Municipalities, 2016
Apartment, 5+ Storeys
Municipality No. No. % No. % No. % No. % No. % No. %Anmore 0Belcarra 0Bowen Island 0Burnaby 8,850 1,250 14% 2,005 23% 830 9% 1,645 19% 2,025 23% 705 8% 380 4%Coquitlam 2,590 1,095 42% 955 37% 225 9% 105 4% 145 0% 55 2% 10 0%Delta 70Electoral Area A 1,110 535 48% 320 29% 80 7% 40 4% 90 8% 35 3% 0 0%Langley City 0Langley Township 460 265 0% 180 0% 20 0% 0 0% 0 0% 0 0% 0 0%Lions Bay 0Maple Ridge 440 10 2% 10 2% 100 23% 125 28% 95 22% 40 9% 70 16%New Westminster 4,780 330 7% 1,005 21% 445 9% 575 12% 1,145 24% 865 18% 415 9%North Vancouver City 2,835 445 16% 755 27% 160 6% 365 13% 575 20% 365 13% 170 6%North Vancouver District 915 125 14% 10 1% 70 8% 55 6% 490 54% 125 14% 65 7%Pitt Meadows 85Port Coquitlam 45Port Moody 660 65 10% 515 78% 40 6% 0 0% 30 5% 10 2% 0 0%Richmond 4,080 1,605 39% 1,395 34% 605 15% 135 3% 220 5% 75 2% 45 1%Surrey 3,490 1,215 35% 1,085 31% 305 9% 315 9% 410 12% 145 4% 30 1%Vancouver 53,075 5,590 11% 11,870 22% 8,360 16% 4,990 9% 7,150 13% 9,435 18% 5,675 11%West Vancouver 2,000 30 2% 80 4% 80 4% 150 8% 550 28% 855 43% 255 13%White Rock 445 50 11% 115 26% 0 0% 110 25% 90 20% 55 12% 15 3%Vancouver CMA 86,940 12,720 15% 20,410 23% 11,435 13% 8,725 10% 13,305 15% 13,100 15% 7,255 8%Source: Statistics Canada, 2016 CensusNote: Values may not add up to 100% of Metro Vancouver total figures due to rounding, data suppression, and customized data orders.Note: n/a indicates data suppression due to low values reported (the value is greater than zero but less than 25).Note: Electoral Area A includes UBC/UEL (University of British Columbia / University Endowment Lands)
4.1
2001 - 20102011 - 2016 1971 - 1980 Pre- 19611981 - 19901991 - 2000 1961 - 1970

METRO VANCOUVER HOUSING DATA BOOK ... Purpose Built Rental Apartment Inventory
4.2
Description
Private purpose built rental apartment units represent about 1/3 of the
total rental stock in Metro Vancouver. These units provide an
important supply of affordable rental housing. Over the course of the
past decade, the inventory of purpose built rental apartment units
fluctuated from a low of 103,300 to the high of 108,496 in 2017.
Expanding the supply of purpose built rental apartment units, including
a variety of unit types/sizes located throughout the region, increases
the diversity of housing options available.
Key Findings
The number of purpose built rental apartments has been slowly
increasing from a low of 103,300 units in 2008 to 108,496 in 2017.
The City of Vancouver accounted for 53% of purpose built rental
apartment units in Metro Vancouver in 2017.
One bedroom and bachelor apartments account for 74% of the total
purpose built rental apartment stock in 2017. These types of units
make up a high proportion (82%) of the rental units in Vancouver /
UBC‐UEL, and a lower proportion in the Langleys (48%) and Richmond /
Delta (56%) and Surrey / White Rock (53%).
The proportion of family units (2 or 3+ bedrooms rental apartments)
varies across the region. The Langleys subregion has the highest
proportion of purpose built family rental units (52%). Vancouver /
UBC‐UEL has the lowest proportion (18%) of purpose built rental
apartment units that are family units.
Over the past 10 years Burnaby’s inventory of purpose built rental
apartment units declined by 685 units. The City of Vancouver
inventory of purpose built rental apartment units increased by 2,201
units over the past 10 years.
Purpose Built Rental Apartment Inventory, Metro Vancouver, 2003 – 2017
Source: CMHC Rental Market Reports
Purpose Built Rental Apartment Inventory by Sub‐regions in Metro Vancouver, 2017
Source: CMHC Rental Market Reports

Housing Data Book Purpose Built Rental Apartment Inventory
Purpose Built Rental Apartment Inventory for Metro Vancouver, 2006-2017 10 Yr ChangeMunicipality 2006 2007 2008 2009 2010 2011 2012 2013 2014 2015 2016 2017 2007-2017Burnaby 12,756 12,727 12,740 12,730 12,754 12,725 12,689 12,624 12,357 12,384 12,276 12,042 -685Coquitlam, Port Moody and Port Coquitlam 4,312 4,346 4,345 4,393 4,440 4,418 4,418 4,533 4,562 4,668 4,567 4,346 0
Delta 1,735 1,735 1,711 1,713 1,634 1,590 1,580 1,640 1,724 1,724 1,727 1,726 -9Langley City and Langley Township 2,077 2,074 1,999 1,982 2,027 2,002 2,063 2,083 2,091 2,150 2,157 2,425 351Maple Ridge and Pitt Meadows 1,463 1,466 1,449 1,449 1,468 1,464 1,449 1,416 1,431 1,475 1,566 1,547 81New Westminster 8,182 8,151 7,900 7,975 7,953 7,944 8,001 7,932 7,959 8,018 8,060 8,275 124North Van City 5,929 5,851 5,878 5,864 5,827 5,828 5,813 5,782 5,864 6,014 6,006 6,150 299North Van District 989 982 968 953 955 953 953 969 968 948 1,131 1,074 92Richmond 2,244 2,249 2,250 2,489 2,488 2,490 2,573 2,674 2,812 2,806 2,795 3,091 842Surrey 5,504 5,279 5,206 5,470 5,419 5,453 5,578 5,564 5,493 5,584 5,581 5,582 303University Endowment Lands 801 725 725 830 970 1,042 996 997 1,279 1,277 1,277 1,277 552Vancouver 55,276 55,042 54,442 54,810 54,791 55,063 55,228 55,611 55,848 56,190 57,018 57,243 2,201West Vancouver 2,332 2,332 2,329 2,330 2,329 2,328 2,329 2,329 2,328 2,329 2,329 2,330 -2White Rock 1,352 1,356 1,358 1,347 1,402 1,381 1,397 1,393 1,395 1,378 1,377 1,388 32
Metro Vancouver 104,952 104,315 103,300 104,335 104,457 104,681 105,067 105,547 106,111 106,945 107,867 108,496 4,181Source: CMHC Canadian Housing Observer and CMHC regional housing data.Note: Data not available for small municipalities (Anmore, Belcarra, Bowen Is., Lions Bay). Electoral Area A data is not available, except for the University Endowment Lands (U.E.L.)Note: "n/a" indicates data suppressed for confidentiality or data is not available.Note: CMHC rental universe excludes secondary suites, non‐market rental units and privately rented condominium units.
4.2

Housing Data Book Purpose Built Rental Apartment Inventory by Unit Type
CMHC Purpose Built Rental Apartment Inventory by Unit Size for Metro Vancouver, 2013-20172013 2014 2015 2016 2017
Municipality Bachelor 1 Bdrm 2 Bdrm 3+ Bdrm Bachelor 1 Bdrm 2 Bdrm 3+ Bdrm Bachelor 1 Bdrm 2 Bdrm 3+ Bdrm Bachelor 1 Bdrm 2 Bdrm 3+ Bdrm Bachelor 1 Bdrm 2 Bdrm 3+ Bdrm
Burnaby 807 7,967 3,455 395 790 7,799 3,373 395 795 7,802 3,401 386 781 7,742 3,364 389 770 7,561 3,318 393qCoq., and Port Moody 192 2,464 1,677 200 190 2,501 1,706 165 192 2,572 1,717 187 191 2,483 1,706 187 192 2,494 1,550 110Delta 67 806 731 36 71 860 757 36 74 858 756 36 74 860 757 36 71 857 762 36Langley City and Township 87 1,015 929 52 85 1,021 933 52 88 1,043 970 49 88 1,015 1,005 49 88 1,070 1,205 62Maple Ridge and Pitt Meadows 14 802 545 55 14 806 556 55 14 854 558 49 25 918 574 49 25 901 572 49New Westminster 774 5,021 2,011 126 765 5,029 2,034 131 769 5,072 2,047 130 761 5,093 2,074 132 774 5,250 2,116 135North Van City 491 3,542 1,717 32 499 3,560 1,772 33 487 3,662 1,832 33 495 3,620 1,858 33 497 3,705 1,905 43North Van District 180 358 315 116 180 358 315 115 180 341 312 115 180 355 454 142 180 333 448 113Richmond 219 1,166 1,140 149 243 1,231 1,189 149 238 1,254 1,165 149 237 1,253 1,161 144 331 1,427 1,188 145Surrey 85 2,646 2,448 385 129 2,547 2,453 364 132 2,597 2,470 385 133 2,593 2,470 385 130 2,585 2,483 384University Endowment Lands 12 485 445 55 71 675 475 58 81 665 466 65 81 665 466 65 70 676 466 65Vancouver 8,490 37,648 8,935 538 8,582 37,731 9,005 530 8,597 37,940 9,125 528 8,625 38,464 9,406 523 8,907 38,507 9,294 535West Vancouver 232 1,315 688 94 232 1,315 687 94 233 1,314 688 94 233 1,314 688 94 236 1,305 695 94White Rock 76 934 374 9 78 935 373 9 78 927 365 8 77 927 366 7 72 936 373 7Vancouver CMA 11,726 66,169 25,410 2,242 11,929 66,368 25,628 2,186 11,958 66,901 25,872 2,214 11,981 67,302 26,349 2,235 12,343 67,607 26,375 2,171Source: CMHC Canadian Housing Observer and CMHC regional housing data.
Note: Data not available for small municipalities (Anmore, Belcarra, Bowen Is., Lions Bay)
Note: "n/a" indicates data suppressed for confidentiality or data is not statistically reliable
Note: CMHC rental universe excludes secondary suites, non ‐market rental units and privately rented condominium units.
4.2

METRO VANCOUVER HOUSING DATA BOOK ... Secondary Suites Inventory
4.3
Description
Secondary suites represent a significant portion of the rental housing
stock in Metro Vancouver. On average secondary suites have
significantly lower rents than purpose‐built rental apartments and
therefore play an important role in providing affordable housing.
Secondary suites also play a role in affordable home ownership.
Home owners in single family dwellings often rely on rental income
from secondary suites to make ownership possible.
Key Findings
Metro Vancouver estimates that there are 77,360 – 85,640 secondary
suites in the region. This represents approximately 23% to 25% of the
estimated 328,000 rental households in the region.
The average rent for a one bedroom secondary suite was $ 762, 26%
($ 276) less than the average rent in a conventional apartment
building. The average rent for a two bedroom secondary suite was $
1,017, 22% ($ 294 less than the average rent in a conventional
apartment building
The proportion of total rental housing that is attributed to secondary
suites varies across the region. In Vancouver & UBC/UEL, between
17% and 20% of total rental households are estimated to be in
secondary suites. In Surrey / White Rock, 38% of total rental
households are estimated to be in secondary suites.
As of 2014, all of the largest municipalities have policies that allow
secondary suites in single family neighbourhoods, providing certain
conditions are met.
The 2014 estimate of 77,360 – 85,640 secondary suites is higher than
the 2010 estimate of 69,200 – 75,500.
Average Rents ($) by Unit Size by Market Source, Metro Vancouver, 2014
Source: CMHC Rental Market Reports
Proportion of Rental Households Estimated to be Secondary Suites in Metro Vancouver, 2014
Source: Metro Vancouver (based on 2011 Census and 2011 NHS) and member municipalities

Housing Data Book Rental Housing - Secondary Suites
Secondary Suite Estimates for Metro Vancouver Municipalities, 2014 12014 2014 Municipal 2012 BCAA 2011 NHS
Metro Vancouver Estimates Secondary Proxy-based Municipality Estimate 2 or Counts 3 Suites Estimate 4
Anmore 50 49 0Belcarra 60 57 0Burnaby 7,200 7,214 6,049 4,815Coquitlam 2,670 - 3,200 2,670 3,275 2,045Delta 4,000 4,000 1,841 1,850Electoral Area 'A' 20 - 70 15 40Langley City 500 500 325 305Langley Township 1,650 - 2,150 1,650 - 2,151 1,237 1,335Lions Bay 50 48 15Maple Ridge 1,100 - 2,600 1,079 845New Westminster 2,830 2,832 1,844 965North Vancouver City 1,700 1,700 1,611 960North Vancouver District 4,200 4,198 3,592 1,585Pitt Meadows 300 - 500 288 170Port Coquitlam 2,820 2,818 2,262 1,125Port Moody 380 378 406 255Richmond 1,500 - 2,600 812 1,523 1,570Surrey 17,920 17,922 17,013 11,560Vancouver 26,600 - 30,800 26,600 30,843 18,750West Vancouver 725 724 773 315White Rock 1,040 1,040 1,086 645Metro Vancouver 77,360 - 85,640 74,944 75,216 49,230
Note 1: BCAA secondary suites data and 2011 NHS dwelling count of renter-occupied "Apartment, Duplex" units provide stable estimates, although both sources are likely to under-represent the actual number of secondary suites.Note 2: Metro Vancouver staff derived values based on the three sources shown, or based on previous estimates with municipal input.Note 3: Municipal estimates or counts. May includes the 2012 BCAA values where no other municipal data is available.Note 4: Renter-occupied "Apartment or flat in a duplex" identified by the 2011 NHS, which is a reasonable proxy for secondary suites (if no other source is available).
4.3
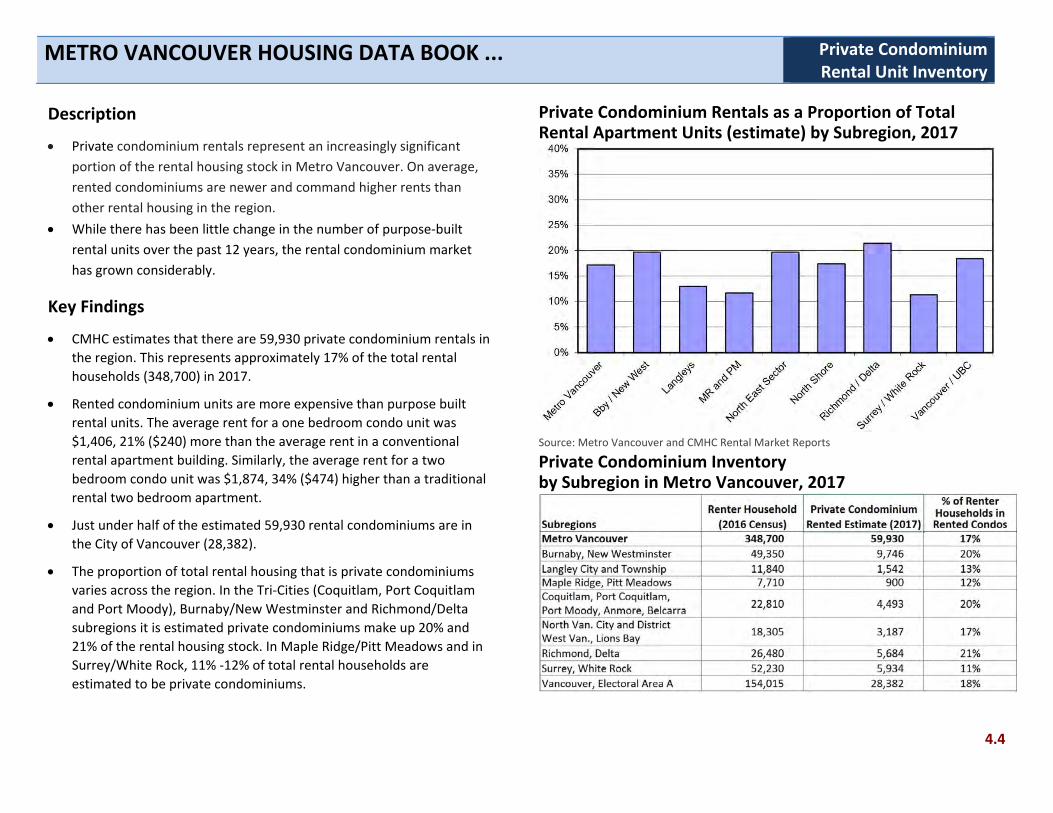
METRO VANCOUVER HOUSING DATA BOOK ... Private Condominium Rental Unit Inventory
4.4
Description
Private condominium rentals represent an increasingly significant
portion of the rental housing stock in Metro Vancouver. On average,
rented condominiums are newer and command higher rents than
other rental housing in the region.
While there has been little change in the number of purpose‐built
rental units over the past 12 years, the rental condominium market
has grown considerably.
Key Findings
CMHC estimates that there are 59,930 private condominium rentals in
the region. This represents approximately 17% of the total rental
households (348,700) in 2017.
Rented condominium units are more expensive than purpose built
rental units. The average rent for a one bedroom condo unit was
$1,406, 21% ($240) more than the average rent in a conventional
rental apartment building. Similarly, the average rent for a two
bedroom condo unit was $1,874, 34% ($474) higher than a traditional
rental two bedroom apartment.
Just under half of the estimated 59,930 rental condominiums are in
the City of Vancouver (28,382).
The proportion of total rental housing that is private condominiums
varies across the region. In the Tri‐Cities (Coquitlam, Port Coquitlam
and Port Moody), Burnaby/New Westminster and Richmond/Delta
subregions it is estimated private condominiums make up 20% and
21% of the rental housing stock. In Maple Ridge/Pitt Meadows and in
Surrey/White Rock, 11% ‐12% of total rental households are
estimated to be private condominiums.
Private Condominium Rentals as a Proportion of Total Rental Apartment Units (estimate) by Subregion, 2017
Source: Metro Vancouver and CMHC Rental Market Reports
Private Condominium Inventory by Subregion in Metro Vancouver, 2017

Estimated Private Condominium Rental Units
Estimated Rental Condominium Apartment Units for Metro Vancouver Municipalities, 2017
CMHC Condominium Subregional Area
October 2017 Municipality
Estimated Distribution of Renter-Occupied
Condominiums.Subregional Estimates.
Vancouver City Vancouver 27,406 97%University Endowment Lands 976 3%
Suburban Vancouver Burnaby 6,637 34%New Westminster 3,109 16%Coquitlam, 2,550 13%Port Coquitlam, 1,084 6%and Port Moody 859 4%Richmond 5,016 26%
Fraser Valley Delta 667 7%Surrey 5,046 56%White Rock 888 10%Langley City 810 9%and Langley Township 732 8%Maple Ridge 637 7%and Pitt Meadows 263 3%
North Shore North Van City 1,658 52%North Van District 911 29%West Vancouver 617 19%
Metro Vancouver 59,930 Metro Vancouver 59,930 59,930
Source: CMHC Rental Market Report - October 2017Note: Totals for columns may not equal sum of values due to (a) rounding and (b) data supression.Note: CMHC reports data for 4 sub-areas in Metro Vancouver. An estimated distribution ratio for municipalities is based on 2016 Census data - distribution of owner- occupied apartments (2016).
Estimated Private Condominium Rental Units4.4
19,255 100%
9,746
4,493
5,684
9,043 100%
5,934
1,542
900
3,187 100% 3,187
Estimated distrib ratio
28,382 100% 28,382

METRO VANCOUVER HOUSING DATA BOOK ... Social Housing Inventory
4.5
Description
Social Housing units are an important part of the rental housing stock
in Metro Vancouver. Social housing is government supported rental
housing that is affordable to low and moderate income individuals
and families. Some social housing is targeted to seniors, aboriginal
people, people with disabilities and/or mental health issues, or other
vulnerable people.
Social housing providers include BC Housing and non‐profit housing
providers. BC Housing provides housing for low income households
that is geared to income (RGI). Non‐profit housing providers usually
provide a mix of RGI and low end rental or market rental housing.
Key Findings
Metro Vancouver estimates that there are 50,349 social housing units
in the region. This represents 15% of the estimated 328,000 renter
occupied households in the region.
BC Housing (provincial government), non‐profit organizations manage
76% (38,173) of the social housing units in the region. The remaining
24% (12,176 units) are housing cooperatives.
Nearly half (46%, or 23,507) of the social housing units in the region
are within the City of Vancouver.
Social housing as a proportion of total rental housing stock varies
across the region. In Coquitlam/ Port Coquitlam/ Port Moody
subregion about 17% of the total rental households are social
housing. On the North Shore the proportion is 12%; and in Maple
Ridge/ Pitt Meadow it is 11%.
Estimated Number of Social Housing Units, Metro Vancouver, December 2014
Proportion of Rental Households Estimated to be Social Housing Units in Metro Vancouver, 2014
Source: Metro Vancouver (based on BC Housing & BCNPHA data) and member municipalities

Housing Data Book Social HousingSocial Housing (Built Housing Stock) 1 Estimates for Metro Vancouver Municipalities, December 2014
Social Housing TOTAL Social Municipality 2 Units (2015) 1 Co-ops 3 Housing Stock
Estimate EstimateAnmore 0 0 0Belcarra 0 0 0Burnaby 4,069 1,900 5,969Coquitlam 1,312 689 2,001Delta 672 150 822Electoral Area 'A' 0 0 0Langley City 778 0 778Langley Township 657 40 697Lions Bay 0 0 0Maple Ridge 355 162 517New Westminster 1,069 415 1,484North Vancouver City 873 177 1,050
North Vancouver District 614 288 902Pitt Meadows 20 314 334Port Coquitlam 951 25 976Port Moody 221 336 557Richmond 2,165 979 3,144Surrey 5,667 879 6,546Vancouver 17,727 5,780 23,507
West Vancouver 579 42 621 White Rock 444 0 444Metro Vancouver 38,173 12,176 50,349
Note 1: Shelter beds & transitional housing are not included as "Social Housing" for this data table. Not all municipal estimates include small projects (less than 10 units) operated by ‘health or social support service societies’. Assisted Living and Supportive Housing were generally excluded. Users of the data may wish to consult local municipal staff for further details.Note 2: Source: Municipalities, BC Housing (2010), and BCNPHA Some municipal values may have changed over time due to demolition of buildings and with new stock under construction.
Note 3: Canadian Federation of Cooperatives reports only 1 new Co-op project since 2010 - Olympic Village (88 units) in the City of Vancouver.
4.5

METRO VANCOUVER HOUSING DATA BOOK ... Renter Household Inventory
4.6
Description
The total estimated rental housing supply in 2014 was about 328,000.
Purpose‐built rental units (market rental units and social housing
units) make up the largest proportion of the rental supply (46%),
followed by secondary suites (25%‐27%) and private condominium
rentals (15%).
Housing affordability for rental units varies by source, age, and
location. The more affordable rental housing tends to be in secondary
suites and older purpose‐built rental while condo rentals tend to be
more expensive.
Key Findings
Purpose built rental units (market rental and social housing rental
units) account for the highest proportion of rental units in the region.
About 1,000 to 1,400 purpose built rental units per year have been
built in the past 3 years, which is below the estimated demand.
Increased demand for rental housing is predominately being met
through secondary suites and private condominium rentals.
Sub‐regions such as Vancouver / Electoral Area A (UBC‐UEL) and
Burnaby / New Westminster have the highest proportions of their
rental supply from purpose built market rental units (41% and 44%
respectively). Surrey / White Rock has the lowest proportion of rental
housing stock that is purpose built market rental at 13%.
Social housing as a proportion of rental housing was highest in the
sub‐regions Vancouver / UBC‐UEL, the Northeast Sector (tri‐cities),
and Burnaby / New Westminster (16% each) and lowest in the North
Shore sub‐region (10%).
The proportion of rental housing in secondary suites was highest in
the Surrey / White Rock sub‐region (47%) and lowest in Burnaby /
New Westminster sub‐region (20%).
.
Estimated Distribution of Renter Households by Source of Rental Units, Metro Vancouver, 2014
Distribution of Renter Households by Sub‐regions, 2014

METRO VANCOUVER HOUSING DATA BOOK ... Apartment Rents Below Rent Thresholds
4.7
Description
Affordability is a function of high housing costs relative to incomes and it can be made worse if rents grow at a faster rate than incomes. Affordability pressures can also be more severe for households falling at the lower end of the income distribution.
Units that rent for $815 per month or less are deemed to be affordable (cost 30% or less of household income) for households earning $33,000 per year (approximately 50% of the 2015 regional median household income).
Key Findings
Data reported from CMHC shows from 2012 to 2015 the number of apartment units in Metro Vancouver that rent for $815 or less fell from 23,119 in 2012 to 14,624 in 2015, a decrease of 37% (8,495 units).
72% of the units that rent for $815 or less in 2015 are one bedroom units. The number of one bedroom units that rent for $815 or less declined by 39% over the past four years, from 17,319 units in 2012 to 10,573 units in 2015.
The proportion of units that rent for over $1,300 per month increased from 18% of the CMHC purpose built rental units in 2012 to 27% in 2015.
The lowest rate of change in units renting for $815 or less was in the Langleys and the Maple Ridge / Pitt Meadows subregions, where the number of units renting for $815 or less declined by 21%‐22% over the past four years.
Note: Rent thresholds are established for households earning 50% of median household income, 80% of median household income, and 120% of median household income. Affordability is based on a household spending 30% of household income on shelter. The regional median household income estimate for 2015 is $66,000.
Rental Units Renting for Less than $815 per Month in Metro Vancouver, 2012 ‐ 2015
Source: CMHC (Rental Market Report)
Rental Units That Rent Below Rent Thresholds in Metro Vancouver, 2012 ‐ 2015
Source: CMHC (Rental Market Report)

Housing Data Book Affordable Rent by Rent Thresholds
Rental Units by Rent Thresholds ($) by Unit Size for Metro Vancouver, 2012‐2015CMHC RENTAL UNIVERSE(Rental Row and Apartment)
Total Rental Units 108,146 100% 108,666 100% 109,217 100% 110,024 100%
Less than $815 23,119 21% 20,176 19% 16,990 16% 14,624 13%
$815 ‐ $1,300 66,224 61% 68,063 63% 66,831 61% 65,081 59%
$1,300 ‐ $1,615 10,578 10% 11,698 11% 14,125 13% 17,850 16%
Bachelor Units 11,668 100% 11,785 100% 11,988 100% 12,017 100%
Less than $815 4,512 39% 3,755 32% 3,755 31% 3,624 30%
$815 ‐ $1,300 6,443 55% 7,453 63% 7,453 62% 7,176 60%
$1,300 ‐ $1,615 131 1% 359 3% 359 3% 766 6%
1 Bedroom Units 65,995 100% 66,255 100% 66,455 100% 66,988 100%
Less than $815 17,319 26% 12,648 19% 12,648 19% 10,573 16%
$815 ‐ $1,300 42,241 64% 42,798 65% 42,798 64% 42,428 63%
$1,300 ‐ $1,615 4,755 7% 7,546 11% 7,546 11% 10,227 15%
2 Bedroom Units 26,240 100% 26,327 100% 26,543 100% 26,786 100%
Less than $815 1,278 5% 573 2% 573 2% 415 2%
$815 ‐ $1,300 15,596 59% 14,878 57% 14,878 56% 14,257 53%
$1,300 ‐ $1,615 4,501 17% 4,937 19% 4,937 19% 5,462 20%
3+ Bedroom Units 4,243 100% 4,299 100% 4,231 100% 4,233 100%
Less than $815 n/a n/a n/a n/a n/a n/a n/a n/a
$815 ‐ $1,300 n/a n/a n/a n/a n/a n/a n/a n/a
$1,300 ‐ $1,615 1,191 28% 1,271 30% 1,282 30% 1,394 33%
Source: CMHC (Rental Market Survey)
Note: An estimated 2015 household income estimate of $66,000 is used to set rent thresholds. Monthly rent of approximately $815 represents 30% of household income for a household earning 50% of $66,000 Monthly rent of approximately $1,300 represents 30% of household income for a household earning 80% of $66,000 Monthly rent of approximately $1,615 represents 30% of household income for a household earning $66,000
4.7
2015201420132012

Housing Data Book Affordable Units by Rent Thresholds
Rental Units by Rent Thresholds ($) by Unit Size for Metro Vancouver, 2012‐20152012 2015
Total RentalTotal
Rental Municipality Hshlds * # % # % Hshlds # % # %Burnaby 12,954 2,962 23% 8,871 68% 12,645 1,747 14% 8,657 68%Coquitlam 3,908 1,603 41% 2,063 53% 4,082 925 23% 2,840 70%Delta 1,580 765 48% 786 50% 1,724 488 28% 1,206 70%UBC, UEL 1,122 ** ** 1,403 ** **Langley City 2,177 867 40% 1,212 56% 2,188 712 33% 1,267 58%Langley Township 149 ** ** 208 ** **Maple Ridge 1,196 728 61% 389 33% 1,229 629 51% 446 36%New Westminster 8,051 4,019 50% 3,598 45% 8,068 2,507 31% 4,886 61%North Vancouver City 5,858 494 8% 4,867 83% 6,059 309 5% 4,127 68%North Vancouver District 1,372 ** ** 1,368 ** **Pitt Meadows 327 ** ** 326 105 32% 202 62%Port Coquitlam 505 237 47% 207 41% 577 ** **Port Moody 528 105 20% 213 40% 532 ** **Richmond 3,218 302 9% 2,192 68% 3,477 151 4% 2,133 61%Surrey 5,907 3,129 53% 2,593 44% 5,901 2,229 38% 3,284 56%Vancouver 55,556 7,280 13% 35,833 64% 56,518 4,162 7% 32,877 58%West Vancouver 2,329 ** ** 2,329 11 0% 674 29%White Rock 1,397 411 29% 955 68% 1,378 317 23% 995 72%Vancouver CMA 108,146 23,119 21% 66,224 61% 110,024 14,624 13% 65,081 59%Source: CMHC (CMHC Rental Market Report - custom data request )
Note: Data may be suppressed due to the small sample survey."UBC, UEL" = University of British Columbia, University Endowment Lands (in 2012, 322 units rented below $1,300; in 2015, 255 units rented below $1,300).West Vancouver, in 2012 1,046 units rented below $1,300; in 2015, 685 units rented below $1,300.North Vancouver District in 2012 825 units rented below $1,300; in 2015, 686 units rented below $1,300.* Purpose Built Rental Apartment and Row Units within the CMHC data set.** Data suppressed to protect confidentiality or data not statistically reliable.
4.7
Units Renting for $815 or Less per Month
Units Rent Between $815 and $1,300
Units Renting for $815 or Less per Month
Units Rent Between $815 and $1,300
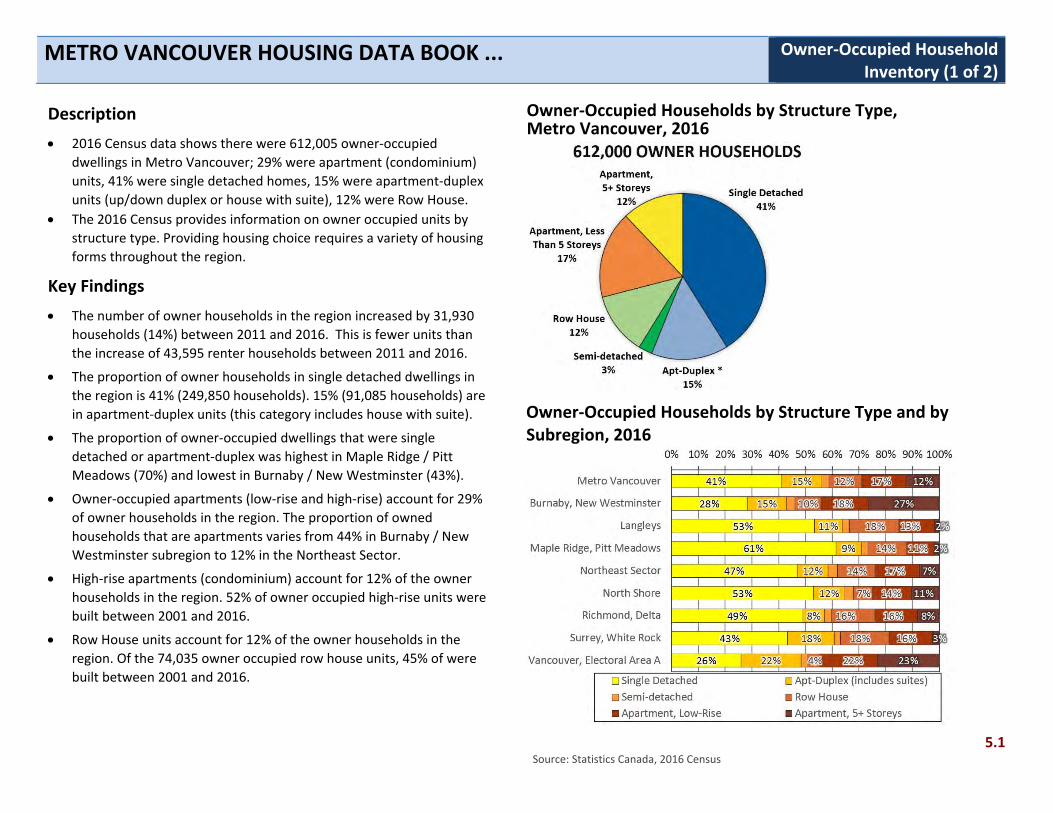
METRO VANCOUVER HOUSING DATA BOOK ... Owner‐Occupied Household Inventory (1 of 2)
5.1 Source: Statistics Canada, 2016 Census
Description
2016 Census data shows there were 612,005 owner‐occupied
dwellings in Metro Vancouver; 29% were apartment (condominium)
units, 41% were single detached homes, 15% were apartment‐duplex
units (up/down duplex or house with suite), 12% were Row House.
The 2016 Census provides information on owner occupied units by
structure type. Providing housing choice requires a variety of housing
forms throughout the region.
Key Findings
The number of owner households in the region increased by 31,930
households (14%) between 2011 and 2016. This is fewer units than
the increase of 43,595 renter households between 2011 and 2016.
The proportion of owner households in single detached dwellings in
the region is 41% (249,850 households). 15% (91,085 households) are
in apartment‐duplex units (this category includes house with suite).
The proportion of owner‐occupied dwellings that were single
detached or apartment‐duplex was highest in Maple Ridge / Pitt
Meadows (70%) and lowest in Burnaby / New Westminster (43%).
Owner‐occupied apartments (low‐rise and high‐rise) account for 29%
of owner households in the region. The proportion of owned
households that are apartments varies from 44% in Burnaby / New
Westminster subregion to 12% in the Northeast Sector.
High‐rise apartments (condominium) account for 12% of the owner
households in the region. 52% of owner occupied high‐rise units were
built between 2001 and 2016.
Row House units account for 12% of the owner households in the
region. Of the 74,035 owner occupied row house units, 45% of were
built between 2001 and 2016.
Owner‐Occupied Households by Structure Type, Metro Vancouver, 2016
Owner‐Occupied Households by Structure Type and by Subregion, 2016

METRO VANCOUVER HOUSING DATA BOOK ... Owner‐Occupied Household Inventory (2 of 2)
5.1
Description
2016 Census data shows there were 612,000 owner occupied
households in Metro Vancouver; 30% units were built since 2000,
38% were built in the 1980’s and 1990’s, and 23% were built in the
1960’s and 1970’s.
The 2016 Census provides information on rented units by structure
type as well as age. Providing housing choice for owners requires both
adding new housing units as well as understanding possible changes
to the existing housing supply available for ownership.
Key Findings
The share of owner households in the region has declined from 44% in
1986 to 35% of dwellings in 2016.
38% (175,295 households) of all owner households live in units built in
the past 16 years (2001 to 2016). The age composition of ownership
housing varies across the region. 43% of owner household’s in
Vancouver / UBC‐UEL and on the North Shore live in structures built
since 2000, whereas in Richmond/ Delta / Tsawwassen only 27% of
owner occupied housing units were built since 2000.
The proportion of owner‐occupied units that were built prior to 1961
was highest in Richmond/ Delta / Tsawwassen (23%) and lowest in the
Northeast Sector (3%).
With respect to differing structure types, single detached housing
account for 41% of the ownership households in the region. The data
shows that 18% of the single detached homes were built between
2001 and 2016. 47% (117,290) of owner‐occupied single detached
homes were built prior to 1981.
Low‐rise apartment units account for 17% (103,200 units) of owner‐
occupied households in the region. 60% of owner‐occupied low‐rise
units were built between 1991 and 2016.
Owner Households by Age of Housing Structure in Metro Vancouver, 2016
Source: Statistics Canada, 2016 Census Owner Households in Metro Vancouver by Age of Structure and by Subregion, 2016
Source: Statistics Canada, 2016 Census (custom tables)

Housing Data Book Owner Occupied Household Inventory (2016)Owner-Occupied Households in Metro Vancouver Municipalities, 2016
Total Owner Municipality No. No. % No. % No. % No. % No. % No. %Anmore 625 460 74%Belcarra 230 195 85%Bowen Island 1,230 1,145 93%Burnaby 57,220 16,870 29% 9,095 16% 2,160 4% 6,250 11% 8,550 15% 14,135 25%Coquitlam 36,780 17,945 49% 4,615 13% 1,370 4% 3,880 11% 5,410 15% 3,305 9%Delta 28,190 18,800 67% 4,100 15% 830 3% 1,655 6% 2,285 8% 380 1% Electoral Area A 2,830 355 13% 50 2% 55 2% 275 10% 1,000 35% 1,090 39%Langley City 7,340 2,480 34% 560 8% 260 4% 780 11% 3,210 44% 30 0%Langley Township 34,640 19,190 55% 3,745 11% 790 2% 6,675 19% 2,270 7% 650 2%Lions Bay 455 425 93%Maple Ridge 24,160 15,230 63% 2,310 10% 595 2% 3,285 14% 2,115 9% 430 2%New Westminster 18,340 4,445 24% 2,020 11% 110 1% 1,125 6% 4,775 26% 5,855 32%North Vancouver City 13,030 2,525 19% 1,660 13% 660 5% 1,485 11% 3,850 30% 2,805 22%North Vancouver District 24,465 15,000 61% 3,340 14% 475 2% 1,980 8% 2,555 10% 1,105 5%Pitt Meadows 5,585 2,835 51% 440 8% 145 3% 965 17% 990 18% 50 1%Port Coquitlam 16,730 7,615 46% 2,045 12% 495 3% 2,875 17% 3,500 21% 205 1%Port Moody 9,725 3,685 38% 660 7% 340 3% 2,100 22% 1,735 18% 1,195 12%Richmond 54,550 21,725 40% 2,625 5% 1,235 2% 11,760 22% 10,770 20% 6,370 12%Surrey 120,945 52,745 44% 21,180 18% 2,890 2% 22,655 19% 17,695 15% 2,460 2%Vancouver 133,165 34,915 26% 30,360 23% 3,335 3% 5,770 4% 28,545 21% 30,125 23%West Vancouver 12,675 8,325 66% 1,100 9% 440 3% 315 2% 935 7% 1,545 12%White Rock 6,795 2,040 30% 960 14% 55 1% 170 3% 2,715 40% 830 12%Vancouver CMA 612,005 249,850 41% 91,085 15% 16,345 3% 74,035 12% 103,200 17% 73,180 12%Source: Statistics Canada, 2016 Census (Custom Cross-tabulations)Note: Structure Type "Apartment, Duplex" would include up-down duplexes as well as houses with secondary suites (excludes the rented suite unit)
Note: Values may not add up to 100% of Metro Vancouver total figures due to rounding, data suppression, and customized data orders.Electoral Area A includes University of British Columbia and University Endowment Lands
5.1
Apartment, 5 or more storeysSingle Detached
Apartment, Duplex * Semi-detached Row House
Apartment, Less Than 5 Storeys

Housing Data Book Owner Occupied Units - All Building Types - Age of BuildingOwner Occupied Dwelling Units by Age of Structure in Metro Vancouver Municipalities, 2016
All Units Municipality No. No. % No. % No. % No. % No. % No. % No. % No. %Anmore 625Belcarra 230Bowen Island 1,230 105 9% 240 20% 250 20% 210 17% 180 15% 125 10% 60 5% 65 5%Burnaby 57,220 6,170 11% 11,895 21% 10,295 18% 8,230 14% 8,455 15% 4,120 7% 6,465 11% 1,590 3%Coquitlam 36,780 4,635 13% 4,395 12% 8,895 24% 6,975 19% 4,810 13% 4,410 12% 2,265 6% 395 1%Delta 28,190 1,455 5% 1,985 7% 3,290 12% 5,205 18% 9,040 32% 5,260 19% 1,590 6% 370 1%Electoral Area 'A' 2,830 535 19% 1,260 45% 695 25% 55 2% 50 2% 20 1% 105 4% 110 4%Langley City 7,340 380 5% 850 12% 2,045 28% 1,240 17% 2,300 31% 345 5% 115 2% 70 1%Langley Township 34,640 4,580 13% 6,965 20% 8,080 23% 6,140 18% 6,260 18% 1,375 4% 750 2% 485 1%Lions Bay 455Maple Ridge 24,160 2,190 9% 4,840 20% 5,490 23% 4,765 20% 3,205 13% 1,720 7% 1,290 5% 660 3%New Westminster 18,340 1,860 10% 3,690 20% 3,915 21% 2,490 14% 1,565 9% 625 3% 1,450 8% 2,735 15%North Vancouver City 13,030 1,425 11% 1,975 15% 2,225 17% 2,025 16% 2,175 17% 975 7% 1,240 10% 985 8%North Vancouver Dist. 24,465 1,360 6% 1,695 7% 2,460 10% 3,525 14% 4,835 20% 4,145 17% 5,290 22% 1,150 5%Pitt Meadows 5,585 425 8% 1,260 23% 1,455 26% 1,145 21% 970 17% 170 3% 100 2% 55 1%Port Coquitlam 16,730 1,125 7% 2,435 15% 4,630 28% 2,970 18% 2,845 17% 1,850 11% 720 4% 160 1%Port Moody 9,725 445 5% 3,010 31% 1,890 19% 1,220 13% 1,690 17% 805 8% 510 5% 155 2%Richmond 54,550 5,930 11% 10,900 20% 12,475 23% 9,680 18% 10,755 20% 2,835 5% 1,470 3% 495 1%Surrey 120,945 14,330 12% 30,460 25% 27,920 23% 24,295 20% 13,860 11% 4,880 4% 4,210 3% 985 1%Vancouver 133,165 11,755 9% 23,910 18% 27,195 20% 18,445 14% 13,855 10% 7,160 5% 10,740 8% 20,110 15%West Vancouver 12,675 655 5% 1,515 12% 1,625 13% 1,915 15% 1,670 13% 2,050 16% 2,295 18% 950 7%White Rock 6,795 660 10% 890 13% 1,155 17% 1,565 23% 1,375 20% 570 8% 320 5% 250 4%Vancouver CMA 612,005 60,370 10% 114,925 19% 126,800 21% 102,730 17% 90,565 15% 43,760 7% 41,055 7% 31,800 5%Source: Statistics Canada, 2016 Census (Custom Cross-tabulations)Note: Values may not add up to 100% of Metro Vancouver total figures due to rounding, data suppression, and customized data orders.
5.1
Pre- 19462001 - 2010 1991 - 2000 1981 - 1990 1971 - 1980 1961 - 1970 1946 - 19602011 - 2016

Housing Data Book Owner Occupied Single Detached House - Age of BuildingOwner Occupied Single Detached House by Age of Structure in Metro Vancouver Municipalities, 2016
Single Detached Municipality House No. % No. % No. % No. % No. % No. %Anmore 460 65 14% 155 34% 160 35% 30 7% 20 4% 20 4% 10 2%Belcarra 195 15 8% 20 10% 35 18% 35 18% 55 28% 20 10% 10 5%Bowen Island 1,145 80 7% 225 20% 235 21% 200 17% 165 14% 120 10% 120 10%Burnaby 16,870 1,240 7% 1,600 9% 1,940 11% 1,945 12% 2,535 15% 2,315 14% 5,300 31%Coquitlam 17,945 1,310 7% 1,330 7% 3,070 17% 3,995 22% 2,890 16% 3,335 19% 2,020 11%Delta 18,800 575 3% 1,055 6% 1,410 8% 3,650 19% 6,545 35% 3,980 21% 1,575 8%Electoral Area 'A' 355 20 6% 25 7% 55 15% 15 4% 20 6% 20 6% 205 58%Langley City 2,480 30 1% 45 2% 140 6% 490 20% 1,405 57% 240 10% 135 5%Langley Township 19,190 1,055 5% 3,375 18% 3,720 19% 4,225 22% 4,720 25% 1,080 6% 1,025 5%Lions Bay 425 15 4% 30 7% 50 12% 75 18% 200 47% 50 12% 10 2%Maple Ridge 15,230 1,195 8% 3,200 21% 2,205 14% 3,045 20% 2,440 16% 1,390 9% 1,750 11%New Westminster 4,445 195 4% 375 8% 370 8% 255 6% 125 3% 245 6% 2,890 65%North Vancouver City 2,525 140 6% 215 9% 135 5% 315 12% 180 7% 305 12% 1,245 49%North Vancouver Distric 15,000 610 4% 615 4% 820 5% 2,105 14% 2,585 17% 2,980 20% 5,285 35%Pitt Meadows 2,835 60 2% 600 21% 450 16% 775 27% 700 25% 125 4% 120 4%Port Coquitlam 7,615 140 2% 615 8% 1,350 18% 1,730 23% 1,875 25% 1,275 17% 630 8%Port Moody 3,685 50 1% 535 15% 645 18% 710 19% 715 19% 505 14% 515 14%Richmond 21,725 1,605 7% 2,815 13% 4,550 21% 4,435 20% 5,165 24% 1,770 8% 1,385 6%Surrey 52,745 3,690 7% 9,965 19% 10,340 20% 14,435 27% 7,605 14% 2,860 5% 3,855 7%Vancouver 34,915 2,455 7% 3,120 9% 4,955 14% 4,045 12% 2,720 8% 2,705 8% 14,915 43%West Vancouver 8,325 445 5% 920 11% 940 11% 1,085 13% 915 11% 1,430 17% 2,580 31%White Rock 2,040 260 13% 245 12% 205 10% 250 12% 330 16% 365 18% 400 20%Vancouver CMA 249,850 15,345 6% 31,230 12% 37,945 15% 48,050 19% 44,065 18% 27,235 11% 45,990 18%Source: Statistics Canada, 2016 CensusNote: Values may not add up to 100% of Metro Vancouver total figures due to rounding, data suppression, and customized data orders.Note: "n/a" indicates data suppression due to low values reported (the value is greater than zero but less than 20).
5.1
Pre- 19612011 - 2016 2001 - 2010 1991 - 2000 1981 - 1990 1971 - 1980 1961 - 1970

Housing Data Book Owner Occupied "Apartment, Duplex" - Age of BuildingOwner "Apartment, Duplex" (Up/Down Duplex or House w Suite) by Age of Structure in Metro Vancouver Municipalities, 2016
Apartment, Duplex *
Municipality (not rented suite) No. % No. % No. % No. % No. % No. %Anmore 55Belcarra 40Bowen Island 30Burnaby 9,095 505 6% 995 11% 1,710 19% 1,380 15% 1,195 13% 1,050 12% 2,255 25%Coquitlam 4,615 265 6% 560 12% 1,210 26% 655 14% 555 12% 820 18% 555 12%Delta 4,100 235 6% 190 5% 275 7% 475 12% 1,540 38% 1,050 26% 340 8%Electoral Area 'A' 50 0 10 10 0 0 0 20Langley City 560 10 2% 0 0% 30 5% 75 13% 350 63% 55 10% 35 6%Langley Township 3,745 600 16% 835 22% 760 20% 560 15% 750 20% 155 4% 95 0%Lions Bay 0 0 0Maple Ridge 2,310 120 5% 475 21% 720 31% 390 17% 300 13% 145 6% 160 7%New Westminster 2,020 100 5% 220 11% 270 13% 140 7% 100 5% 125 6% 1,065 53%North Vancouver City 1,660 90 5% 160 10% 90 5% 155 9% 160 10% 225 14% 775 47%North Vancouver Distric 3,340 80 2% 210 6% 325 10% 365 11% 605 18% 775 23% 985 29%Pitt Meadows 440 0 0% 70 16% 115 26% 70 16% 145 33% 20 5% 10 0%Port Coquitlam 2,045 20 1% 100 5% 510 25% 405 20% 425 21% 390 19% 195 0%Port Moody 660 10 2% 40 6% 200 30% 85 13% 110 17% 115 17% 110 17%Richmond 2,625 230 9% 370 14% 215 8% 300 11% 785 30% 420 16% 300 11%Surrey 21,180 2,195 10% 6,310 30% 4,210 20% 3,280 15% 2,845 13% 1,280 6% 1,065 5%Vancouver 30,360 2,040 7% 3,220 11% 4,160 14% 3,790 12% 3,045 10% 2,610 9% 11,500 38%West Vancouver 1,100 50 5% 160 15% 140 13% 110 10% 60 5% 85 8% 490 45%White Rock 960 85 9% 190 20% 200 21% 140 15% 180 19% 75 8% 110 11%Vancouver CMA 91,085 6,635 7% 14,195 16% 15,185 17% 12,425 14% 13,205 14% 9,405 10% 20,035 22%Source: Statistics Canada, 2016 CensusNote: Values may not add up to 100% of Metro Vancouver total figures due to rounding, data suppression, and customized data orders.Note: "n/a" indicates data suppression due to low values reported (the value is greater than zero but less than 20). * Note: includes up/down duplex units occupied by owner, and single detached house with a secondary suite (only the unit occupied by an owner)
5.1
Pre- 19612011 - 2016 2001 - 2010 1991 - 2000 1981 - 1990 1971 - 1980 1961 - 1970

Housing Data Book Owner Occupied Row House Units - Age of BuildingOwner Occupied Semi-Detached (Side-by-Side Duplex) Units by Age of Structure in Metro Vancouver Municipalities, 2016
Semi-detached
Municipality No. No. % No. % No. % No. % No. % No. %Anmore 35Belcarra 0Bowen Island 0Burnaby 2,160 255 12% 870 40% 390 18% 200 9% 230 11% 85 4% 130 6%Coquitlam 1,370 230 17% 255 19% 450 33% 165 12% 200 15% 35 3% 25 2%Delta 830 145 17% 140 17% 250 30% 80 10% 155 19% 50 6% 10 1%Electoral Area 'A' 55Langley City 260 0 0 90 85 75 0 20Langley Township 790 40 5% 125 16% 475 60% 100 13% 40 5% 10 1% 10 1%Lions Bay 10Maple Ridge 595 160 27% 105 18% 145 24% 135 23% 20 3% 15 3% 20 3%New Westminster 110 35 32% 30 27% 10 9% 10 9% 0 0% 0 0% 30 27%North Vancouver City 660 105 16% 185 28% 170 26% 125 19% 35 5% 15 2% 30 5%North Vancouver District 475 10 2% 50 11% 155 33% 135 28% 90 19% 10 2% 35 7%Pitt Meadows 145 10 55 45 30 10 0 0Port Coquitlam 495 25 5% 25 5% 245 49% 60 12% 90 18% 15 3% 20 4%Port Moody 340 0 110 180 25 15 0 10Richmond 1,235 70 6% 290 23% 335 27% 155 13% 260 21% 85 7% 45 4%Surrey 2,890 355 12% 750 26% 900 31% 500 17% 325 11% 45 2% 15 1%Vancouver 3,335 405 12% 790 24% 770 23% 895 27% 160 5% 75 2% 255 8%West Vancouver 440 40 60 135 150 30 25 20White Rock 55Vancouver CMA 16,345 1,895 12% 3,935 24% 4,795 29% 2,870 18% 1,735 11% 465 3% 665 4%Source: Statistics Canada, 2016 CensusNote: Values may not add up to 100% of Metro Vancouver total figures due to rounding, data suppression, and customized data orders.Note: "n/a" indicates data suppression due to low values reported (the value is greater than zero but less than 20).
5.1
Pre- 19612011 - 2016 2001 - 2010 1991 - 2000 1981 - 1990 1971 - 1980 1961 - 1970

Housing Data Book Owner Occupied Row House Units - Age of BuildingOwner Occupied Row House Units by Age of Structure in Metro Vancouver Municipalities, 2016
Row house Municipality No. No. % No. % No. % No. % No. % No. %Anmore 0Belcarra 0Bowen Island 0Burnaby 6,250 565 9% 1,585 25% 1,490 24% 840 13% 1,555 25% 165 3% 55 1%Coquitlam 3,880 975 25% 730 19% 780 20% 885 23% 455 12% 35 1% 10 0%Delta 1,655 265 16% 280 17% 330 20% 265 16% 405 24% 100 6% 0 0%Electoral Area 'A' 275 0 0% 155 56% 120 44% 0 0% 0 0% 0 0% 0 0%Langley City 780 35 4% 110 n/a 150 19% 170 22% 300 38% 20 3% 0 0%Langley Township 6,675 1,815 27% 2,125 32% 1,810 27% 675 10% 220 3% 15 0% 10 0%Lions Bay 20Maple Ridge 3,285 420 13% 585 18% 1,450 44% 570 17% 180 5% 60 2% 15 0%New Westminster 1,125 265 24% 475 42% 310 28% 65 6% 0 0% 0 0% 0 0%North Vancouver City 1,485 25 2% 190 13% 375 25% 585 39% 245 16% 55 4% 10 1%North Vancouver District 1,980 160 8% 280 14% 295 15% 390 20% 665 34% 165 8% 35 2%Pitt Meadows 965 65 7% 265 27% 390 40% 200 21% 40 4% 10 1% 0 0%Port Coquitlam 2,875 385 13% 640 22% 1,045 36% 510 18% 180 6% 115 4% 0 0%Port Moody 2,100 30 1% 755 36% 320 15% 300 14% 625 30% 65 3% 0 0%Richmond 11,760 1,120 10% 3,325 28% 3,145 27% 1,875 16% 1,995 17% 240 2% 55 0%Surrey 22,655 5,330 24% 8,560 38% 4,470 20% 2,335 10% 1,560 7% 340 2% 55 0%Vancouver 5,770 560 10% 1,480 26% 1,015 18% 1,265 22% 1,150 20% 110 2% 170 3%West Vancouver 315 20 6% 100 32% 60 19% 60 19% 50 16% 10 3% 10 3%White Rock 170 45 26% 10 6% 25 15% 20 12% 55 32% 10 6% 0 0%Vancouver CMA 74,035 12,065 16% 21,665 29% 17,605 24% 11,030 15% 9,705 13% 1,515 2% 450 1%Source: Statistics Canada, 2016 CensusNote: Values may not add up to 100% of Metro Vancouver total figures due to rounding, data suppression, and customized data orders.Note: "n/a" indicates data suppression due to low values reported (the value is greater than zero but less than 20).
5.1
Pre- 19612011 - 2016 2001 - 2010 1991 - 2000 1981 - 1990 1971 - 1980 1961 - 1970

Housing Data Book Owner-Occupied Apartment (Less Than 5 Storeys) Units - Age of BuildingOwner-Occupied Apartment Units (Less Than 5 Storeys) by Age of Structure in Metro Vancouver Municipalities, 2016
Low-rise Apartment
Municipality No. No. % No. % No. % No. % No. % No. %Anmore 0Belcarra 0Bowen Island 30 30Burnaby 8,550 1,125 13% 2,020 24% 1,880 22% 1,330 16% 1,590 19% 365 4% 235 3%Coquitlam 5,410 820 15% 600 11% 2,270 42% 930 17% 590 11% 145 3% 50 1%Delta 2,285 185 8% 290 13% 915 40% 470 21% 315 14% 80 4% 20 1%Electoral Area 'A' 1,000 60 6% 645 65% 250 25% 30 3% 15 2% 0 0% 0 0%Langley City 3,210 315 10% 645 20% 1,635 51% 415 13% 170 5% 20 1% 20 1%Langley Township 2,270 500 22% 300 13% 1,105 49% 295 13% 45 2% 10 0% 30 1%Lions Bay 10 0 0Maple Ridge 2,115 290 14% 415 20% 655 31% 510 24% 185 9% 55 3% 15 1%New Westminster 4,775 605 13% 685 14% 1,125 24% 1,140 24% 845 18% 205 4% 175 4%North Vancouver City 3,850 395 10% 380 10% 920 24% 445 12% 1,230 32% 325 8% 155 4%North Vancouver District 2,555 325 13% 535 21% 625 24% 430 17% 420 16% 150 6% 65 3%Pitt Meadows 990 245 25% 225 23% 430 43% 60 6% 15 2% 10 1% 10 1%Port Coquitlam 3,500 360 10% 1,040 30% 1,480 42% 255 7% 275 8% 55 2% 35 1%Port Moody 1,735 155 9% 810 47% 335 19% 70 4% 215 12% 120 7% 40 2%Richmond 10,770 1,035 10% 1,795 17% 2,805 26% 2,690 25% 2,060 19% 260 2% 110 1%Surrey 17,695 2,020 11% 4,290 24% 6,920 39% 3,205 18% 960 5% 165 1% 135 1%Vancouver 28,545 1,915 7% 4,445 16% 7,755 27% 5,915 21% 4,865 17% 740 3% 2,915 10%West Vancouver 935 30 3% 160 17% 75 8% 305 33% 180 19% 130 14% 45 5%White Rock 2,715 150 6% 140 5% 555 20% 960 35% 750 28% 110 4% 60 2%Vancouver CMA 103,200 10,550 10% 19,460 19% 31,830 31% 19,490 19% 14,760 14% 2,990 3% 4,120 4%Source: Statistics Canada, 2016 CensusNote: Values may not add up to 100% of Metro Vancouver total figures due to rounding, data suppression, and customized data orders.Note: "n/a" indicates data suppression due to low values reported (the value is greater than zero but less than 20).
5.1
2001 - 20102011 - 2016 1971 - 1980 Pre- 19611981 - 19901991 - 2000 1961 - 1970

Housing Data Book Owner-Occupied Apartment Units (5 Storeys or More) - Age of BuildingOwner-Occupied Apartment Units (5 Storeys or More) by Age of Structure in Metro Vancouver Municipalities, 2016
Apartment, 5+ Storeys
Municipality No. No. % No. % No. % No. % No. % No. %Anmore 0Belcarra 0Bowen Island 0Burnaby 14,135 2,465 17% 4,750 34% 2,835 20% 2,525 18% 1,350 10% 140 1% 60 0%Coquitlam 3,305 1,035 31% 915 28% 1,100 33% 190 6% 55 0% 10 0% 0 0%Delta 380 45 0 90 215 30 0 0Electoral Area 'A' 1,090 455 42% 370 34% 250 23% 20 2% 0 0% 0 0% 0 0%Langley City 30 0 30 0 0 0Langley Township 650 535 0% 110 0% 0 0% 0 0% 0 0% 0 0% 0 0%Lions Bay 0 0 0 0 0Maple Ridge 430 10 2% 60 14% 290 67% 75 17% 0 0% 0 0% 0 0%New Westminster 5,855 660 11% 1,910 33% 1,835 31% 880 15% 485 8% 50 1% 40 1%North Vancouver City 2,805 650 23% 840 30% 535 19% 395 14% 320 11% 55 2% 10 0%North Vancouver District 1,105 175 16% 10 1% 240 22% 105 10% 470 43% 70 6% 40 4%Pitt Meadows 50 35 20 0 0 0 0 0Port Coquitlam 205 195 10 0 0 0 0 0Port Moody 1,195 195 16% 760 64% 215 18% 20 0% 0 0% 0 0% 0 0%Richmond 6,370 1,870 29% 2,305 36% 1,415 22% 225 4% 465 7% 60 1% 40 1%Surrey 2,460 690 28% 470 19% 955 39% 285 12% 55 2% 0 0% 10 0%Vancouver 30,125 4,375 15% 10,840 36% 8,530 28% 2,525 8% 1,885 6% 915 3% 1,065 4%West Vancouver 1,545 70 5% 115 7% 260 17% 200 13% 435 28% 370 24% 105 7%White Rock 830 115 14% 305 37% 150 18% 175 21% 70 8% 15 2% 20 2%Vancouver CMA 73,180 13,680 19% 24,065 33% 18,945 26% 7,825 11% 5,630 8% 1,665 2% 1,370 2%Source: Statistics Canada, 2016 CensusNote: Values may not add up to 100% of Metro Vancouver total figures due to rounding, data suppression, and customized data orders.Note: n/a indicates data suppression due to low values reported (the value is greater than zero but less than 25).
5.1
2001 - 20102011 - 2016 1971 - 1980 Pre- 19611981 - 19901991 - 2000 1961 - 1970

METRO VANCOUVER HOUSING DATA BOOK ... Ownership By Mortgage Status Inventory
5.2
Description
Mortgage expense is typically the largest household expense for
owners and entry into homeownership is challenging due to
persistently high housing prices in the region. Analysis of the
presence of a mortgage by the age of homeowners and types of
dwellings provides helpful information for policies directed at
enabling entry into homeownership, and provides insight into the
mortgage burden in the senior years.
Key Findings
In 2016, 366,585 (60%) of all owner households had mortgages and
241,490 (40%) were mortgage free. The presence of a mortgage varies
significantly by housing type and by age of the primary household
maintainer.
Multi‐unit housing forms such as condominium apartments and row
houses, which are likely to be newer housing stock, were more likely
to have a mortgage than single detached housing.
14.5% (53,265) of owners with mortgages were under the age of 35.
With older homeowners the data shows 11.6% (42,565) of owners
with mortgages were age 65 or older. The majority of mortgage
owner households were aged 35 to 64.
Senior households (household maintainer age 65 or older) account for
27% (165,390 households) of total owner‐occupied households. Only
26% of senior owner‐occupied households had mortgages while 74%
were without a mortgage. For the younger seniors age 65 to 74, 31%
had mortgages, whereas only 17% of owners aged 75 and older had a
mortgage.
The sub‐region with the highest proportion of homeowners having a
mortgage was Pitt Meadows/Maple Ridge (70% with mortgage).
Owner Households by Presence of a Mortgage and by Age of Primary Household Maintainer, Metro Vancouver, 2016
Owner Households by Presence of a Mortgage and by Sub‐region, Metro Vancouver, 2016
Source: Statistics Canada, 2016 Census

Housing Data Book Ownership Household by Presence of MortgageOwner-Occupied Households by Presence of Mortgage in Metro Vancouver Municipalities, 2016
Municipality No.with Mrtg
without Mrtg No.
with Mrtg
without Mrtg No.
with Mrtg
without Mrtg No.
with Mrtg
without Mrtg No.
with Mrtg
without Mrtg No.
with Mrtg
without Mrtg
Anmore 625 61% 39% 460 60% 41% 60 58% 33% - - - - - - - - -Belcarra 230 28% 74% 195 28% 69% 35 0% 86% - - - - - - - - -Burnaby 57,210 55% 45% 16,860 42% 58% 9,095 53% 47% 6,250 69% 31% 8,550 69% 31% 14,135 57% 43%Coquitlam 36,780 62% 38% 17,940 55% 45% 4,610 67% 33% 3,880 77% 23% 5,405 69% 31% 3,305 65% 36%Delta 28,080 57% 43% 18,710 54% 46% 4,080 72% 28% 1,650 69% 31% 2,280 57% 43% 385 35% 65%Electoral Area A 2,825 52% 48% 355 35% 63% 50 40% 60% 275 51% 47% 995 57% 44% 1,090 53% 47%Langley City 7,335 70% 30% 2,485 68% 32% 560 78% 22% 785 75% 25% 3,210 72% 28% 30 67% 0%Langley Township 33,800 66% 34% 18,510 64% 36% 3,645 75% 25% 6,675 78% 22% 2,270 56% 44% 650 65% 35%Lions Bay 455 55% 45% 425 54% 46% - - - 15 - - 10 - - - - -Maple Ridge 23,980 71% 29% 15,065 71% 29% 2,290 76% 24% 3,285 78% 22% 2,115 63% 37% 425 48% 54%New Westminster 18,330 67% 33% 4,435 58% 42% 2,020 70% 30% 1,125 79% 22% 4,775 73% 27% 5,855 65% 34%North Vancouver City 13,025 61% 39% 2,520 49% 51% 1,660 67% 34% 1,485 69% 31% 3,850 69% 31% 2,805 54% 46%North Vancouver Distric 24,455 56% 44% 14,995 51% 49% 3,345 66% 34% 1,985 66% 34% 2,555 60% 40% 1,105 52% 48%Pitt Meadows 5,500 67% 33% 2,785 68% 32% 420 71% 27% 965 73% 27% 985 63% 37% 50 70% 30%Port Coquitlam 16,705 70% 30% 7,595 62% 38% 2,030 73% 27% 2,870 79% 21% 3,500 80% 20% 210 81% 17%Port Moody 9,730 66% 34% 3,690 55% 45% 655 63% 38% 2,105 81% 19% 1,735 79% 21% 1,195 62% 38%Richmond 54,475 57% 43% 21,665 50% 50% 2,615 55% 45% 11,760 65% 35% 10,770 62% 38% 6,370 57% 43%Surrey 120,690 68% 32% 52,535 62% 38% 21,140 77% 23% 22,655 75% 25% 17,690 70% 30% 2,460 73% 27%Vancouver 133,160 53% 47% 34,915 40% 60% 30,350 50% 50% 5,770 63% 37% 28,540 62% 38% 30,130 61% 39%West Vancouver 12,675 44% 56% 8,325 46% 54% 1,105 53% 47% 315 49% 52% 935 35% 65% 1,545 30% 70%White Rock 6,790 49% 51% 2,040 50% 50% 960 57% 43% 170 56% 44% 2,715 49% 51% 830 36% 65%Vancouver CMA 608,080 60% 40% 247,645 54% 46% 90,765 63% 37% 74,020 72% 28% 102,930 66% 34% 72,565 59% 41%Source: Statistics Canada, 2016 CensusElectoral Area A includes University of British Columbia, University Endowment LandsNote: Structure Type "Apartment, Duplex" would include up-down duplexes as well as houses with secondary suites. With respect to the house with a secondary suite, only the owner-occupied unit would be included in this count (excludes the rented suite).Note: Values may not add up to 100% of Metro Vancouver total figures due to rounding, data suppression, and customized data orders.
5.2
Apartment, 5 or More Storeys
Apartment, Less Than 5 StoreysRow House
All Owned Dwelling Units Single Detached Apartment, Duplex *
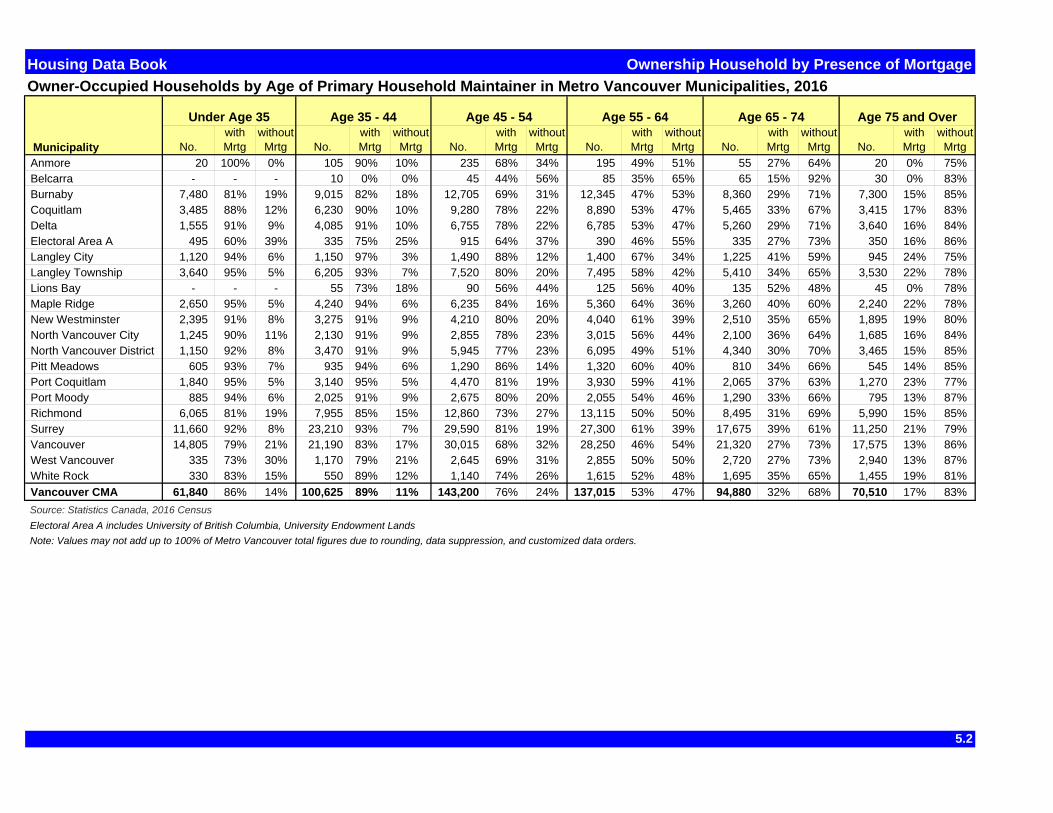
Housing Data Book Ownership Household by Presence of MortgageOwner-Occupied Households by Age of Primary Household Maintainer in Metro Vancouver Municipalities, 2016
Municipality No.with Mrtg
without Mrtg No.
with Mrtg
without Mrtg No.
with Mrtg
without Mrtg No.
with Mrtg
without Mrtg No.
with Mrtg
without Mrtg No.
with Mrtg
without Mrtg
Anmore 20 100% 0% 105 90% 10% 235 68% 34% 195 49% 51% 55 27% 64% 20 0% 75%Belcarra - - - 10 0% 0% 45 44% 56% 85 35% 65% 65 15% 92% 30 0% 83%Burnaby 7,480 81% 19% 9,015 82% 18% 12,705 69% 31% 12,345 47% 53% 8,360 29% 71% 7,300 15% 85%Coquitlam 3,485 88% 12% 6,230 90% 10% 9,280 78% 22% 8,890 53% 47% 5,465 33% 67% 3,415 17% 83%Delta 1,555 91% 9% 4,085 91% 10% 6,755 78% 22% 6,785 53% 47% 5,260 29% 71% 3,640 16% 84%Electoral Area A 495 60% 39% 335 75% 25% 915 64% 37% 390 46% 55% 335 27% 73% 350 16% 86%Langley City 1,120 94% 6% 1,150 97% 3% 1,490 88% 12% 1,400 67% 34% 1,225 41% 59% 945 24% 75%Langley Township 3,640 95% 5% 6,205 93% 7% 7,520 80% 20% 7,495 58% 42% 5,410 34% 65% 3,530 22% 78%Lions Bay - - - 55 73% 18% 90 56% 44% 125 56% 40% 135 52% 48% 45 0% 78%Maple Ridge 2,650 95% 5% 4,240 94% 6% 6,235 84% 16% 5,360 64% 36% 3,260 40% 60% 2,240 22% 78%New Westminster 2,395 91% 8% 3,275 91% 9% 4,210 80% 20% 4,040 61% 39% 2,510 35% 65% 1,895 19% 80%North Vancouver City 1,245 90% 11% 2,130 91% 9% 2,855 78% 23% 3,015 56% 44% 2,100 36% 64% 1,685 16% 84%North Vancouver District 1,150 92% 8% 3,470 91% 9% 5,945 77% 23% 6,095 49% 51% 4,340 30% 70% 3,465 15% 85%Pitt Meadows 605 93% 7% 935 94% 6% 1,290 86% 14% 1,320 60% 40% 810 34% 66% 545 14% 85%Port Coquitlam 1,840 95% 5% 3,140 95% 5% 4,470 81% 19% 3,930 59% 41% 2,065 37% 63% 1,270 23% 77%Port Moody 885 94% 6% 2,025 91% 9% 2,675 80% 20% 2,055 54% 46% 1,290 33% 66% 795 13% 87%Richmond 6,065 81% 19% 7,955 85% 15% 12,860 73% 27% 13,115 50% 50% 8,495 31% 69% 5,990 15% 85%Surrey 11,660 92% 8% 23,210 93% 7% 29,590 81% 19% 27,300 61% 39% 17,675 39% 61% 11,250 21% 79%Vancouver 14,805 79% 21% 21,190 83% 17% 30,015 68% 32% 28,250 46% 54% 21,320 27% 73% 17,575 13% 86%West Vancouver 335 73% 30% 1,170 79% 21% 2,645 69% 31% 2,855 50% 50% 2,720 27% 73% 2,940 13% 87%White Rock 330 83% 15% 550 89% 12% 1,140 74% 26% 1,615 52% 48% 1,695 35% 65% 1,455 19% 81%Vancouver CMA 61,840 86% 14% 100,625 89% 11% 143,200 76% 24% 137,015 53% 47% 94,880 32% 68% 70,510 17% 83%Source: Statistics Canada, 2016 CensusElectoral Area A includes University of British Columbia, University Endowment LandsNote: Values may not add up to 100% of Metro Vancouver total figures due to rounding, data suppression, and customized data orders.
5.2
Age 65 - 74 Age 75 and OverUnder Age 35 Age 45 - 54Age 35 - 44 Age 55 - 64

METRO VANCOUVER HOUSING DATA BOOK ... Median Value of Owner Occupied‐Dwellings
5.3
Description
Analysis of home values, and subsequent costs of home ownership,
provide important information for housing policy research and
planning. Metro Vancouver housing values are the highest of the
select metropolitan areas, whether the form is apartment‐
condominium, row house, or single detached homes.
These are owner reported estimates of the value of the owned
housing unit at the time of the 2011 NHS. The values do not reflect
current market housing values, but do indicate the relative differences
among select metropolitan areas.
Key Findings
The median value for owner‐occupied single detached houses in Metro Vancouver in 2011 is shown to be $700,188. Single detached homes in the Abbotsford – Mission CMA have a median value that is 61% of that amount ($424,457). In Calgary, a single detached home is valued at is 64% of the Vancouver median value for a single detached home ($448,709).
The median value for owner‐occupied row house units in Metro Vancouver in 2011 is $400,188. Owner‐occupied row house units in Abbotsford – Mission CMA have a median value that is 70% of that amount ($280,164).
The median value for low‐rise owner‐occupied apartment units in Abbotsford – Mission ($175,025) and in Winnipeg ($175,056) are valued at 53% of median value of a Metro Vancouver low‐rise unit ($330,572).
Median value for owner‐occupied high‐rise apartment units in Calgary ($323,637) is 80% of the median value of a Metro Vancouver high‐rise unit, and in Toronto high‐rise units have a median value of 69% of the Metro Vancouver high‐rise unit.
Median Value of Owner‐Occupied Dwelling Units by Structure Type for Select Canadian CMA’s, 2011
Median Value of Owner‐Occupied Dwelling Units by Structure Type for Select Canadian CMA’s, 2011
Source: Statistics Canada, 2011 National Household Survey

METRO VANCOUVER HOUSING DATA BOOK ... Average Home Price
5.4 Source: The Real Estate Board of Greater Vancouver (REBGV) and the Fraser Valley Real Estate Board (FVREB). Note: The Real Estate Board of Greater Vancouver (REBGV) has a functional definition of “Greater Vancouver” that includes Vancouver city, Richmond, New Westminster, North Shore, Tri‐Cities, Maple Ridge and Pitt Meadows, as well as Whistler, Squamish and the Sunshine Coast. The Fraser Valley Real Estate Board includes Abbotsford, Mission, Langley City and Township, Surrey White Rock and Delta.
Description
The sale price of homes in Metro Vancouver is a key indicator of affordability in the ownership market. Data is presented separately for the Real Estate Board areas of Greater Vancouver and the Fraser Valley recognizing the wide variation in sale price both by location and by structure type. It uses the “benchmark” price of a typical home, rather than actual sales prices.
Key Findings
The average sale price of a single detached home in Greater Vancouver has increased 65% over the past 5 years, from $961,600 in 2012 to $1,587,900 in 2016. The Fraser Valley real estate area saw the average sale price of a single detached increase by 70% over the past 5 years ($550,100 in 2012 to $934,600 in 2017), with a one year increase of $73,000 (8%).
The average sale price of an attached home (semi‐detached, row or townhouse) in Greater Vancouver has increased by 59% over the past 5 years, from $468,400 in 2012 to $745,700 in 2017. The Fraser Valley real estate area saw the average sale price of an attached home increase by 53% over the past 5 years ($305,000 in 2012 to $467,000 in 2017).
The average sale price of an apartment unit in Greater Vancouver has increased 60% over the past 5 years, from $376,200 in 2012 to $600,700 in 2017. The Fraser Valley real estate area saw the average sale price of an apartment unit increase by 59% over the past 5 years ($204,200 in 2012 to $325,300 in 2017).
At the municipal level, the greatest five year increase (2012 – 2017) in average apartment price occurred in West Vancouver (85% increase), Delta and Port Moody (75% increase). In contrast, Maple Ridge White Rock saw five year increase in the benchmark apartment price of 30% and Ladner – South Delta increased by 23% over the five year period.
Benchmark Price (HPI) For Single Detached Homes in the Greater Vancouver Area and the Fraser Valley Real Estate Area
Benchmark Price (HPI) For Multi‐Family Homes in the Greater Vancouver Area and the Fraser Valley Real Estate Area
The MLSLink® Housing Price Index (HPI), is modeled on the Consumer Price Index (CPI). More information and methodology at: www.homepriceindex.ca

Housing Data Book Housing Price Index
Single Detached Housing Price Index ($) for Metro Vancouver Municipalities, June 2008 - 2017
(No.) (%)Burnaby ** 766,644 693,171 789,405 859,300 902,300 877,500 932,700 1,076,633 1,518,600 1,518,300 616,000 68%Coquitlam 672,246 597,539 686,612 686,100 720,533 706,900 748,800 861,200 1,217,300 1,256,700 536,167 74%Ladner - Delta (South) 674,211 610,150 676,820 618,300 644,700 611,400 634,100 726,500 1,042,800 975,700 331,000 51%Delta (North) 495,189 475,849 525,200 548,817 525,267 523,100 557,100 612,300 843,300 877,600 352,333 67%Langley 521,247 479,960 523,327 523,618 543,600 560,000 577,200 612,900 905,700 950,800 407,200 75%Maple Ridge 459,439 411,974 465,019 470,400 465,133 461,500 472,500 505,100 692,500 776,100 310,967 67%New Westminster 597,999 542,859 603,589 659,500 682,167 665,800 693,300 789,300 1,095,600 1,125,200 443,033 65%North Vancouver 910,821 792,033 920,633 914,800 974,700 947,600 1,010,000 1,176,600 1,664,100 1,690,600 715,900 73%Pitt Meadows 493,347 485,378 525,291 506,300 501,800 503,100 513,500 560,500 760,600 840,700 338,900 68%Port Coquitlam 539,546 491,372 565,666 551,500 563,233 548,100 572,500 662,100 916,300 990,500 427,267 76%Port Moody 798,222 706,213 798,314 821,400 845,733 829,500 895,400 1,005,600 1,379,700 1,444,700 598,967 71%Richmond 781,881 695,960 901,706 1,026,000 999,200 941,933 979,300 1,144,700 1,700,200 1,650,100 650,900 65%Surrey * 520,354 484,997 530,763 546,694 564,300 579,450 714,814 689,700 981,700 1,043,400 479,100 85%Vancouver West 1,439,026 1,277,018 1,648,096 2,135,400 2,207,433 2,069,200 2,257,100 2,599,700 3,547,300 3,627,200 1,419,767 64%Vancouver East 693,202 628,128 745,497 807,400 863,467 842,800 918,900 1,093,900 1,511,500 1,534,100 670,633 78%West Vancouver 1,506,302 1,179,133 1,410,756 1,770,700 1,934,567 1,849,200 2,053,300 2,320,400 3,261,600 3,127,100 1,192,533 62%South Surrey & White Rock 741,139 662,581 751,532 815,398 881,800 851,100 902,400 983,900 1,437,600 1,493,300 611,500 69%Greater Vancouver 769,408 685,657 807,868 931,300 961,600 919,200 976,700 1,123,900 1,561,500 1,587,900 626,300 65% Fraser Valley 512,850 471,788 518,355 528,060 551,000 552,200 568,600 609,900 861,600 934,600 383,600 70%Source: Real Estate Board of Greater Vancouver and Fraser Valley Real Estate Board (FVREB)
Notes: "Greater Vancouver" as defined by REBGV has a different geographic area than the regionally defined "Metro Vancouver" region.Homes sales in Greater Vancouver are tracked through the MLSLink Housing Price Index® (MLSLink HPI®) which measures benchmark or typical home prices.The MLSLink® Housing Price Index (HPI), established in 1995, is modeled on the Consumer Price Index (CPI).Instead of measuring goods and services, the HPI measures the change in the price of housing features. Thus, the HPI measures typical, pure price change (inflation or deflation).The HPI benchmarks represent the price of a typical property within each market. The HPI takes into consideration what averages and medians do not – items such as lot size, age, number of rooms, etc. These features become the composite of the ‘typical house’ in a given area.Each month’s sales determine the current prices paid for bedrooms, bathrooms, fireplaces, etc. and apply those new values to the ‘typical’ house model.
* Surrey does not include "South Surrey", which is reported below in the group "South Surrey & White Rock".** For 2012-2016 Burnaby data is reported for 3 sub-areas of Burnaby. For purposes of this table, a non-weighted average of the 3 sub-areas is used.
5.4
2017(2012 - 2017)
2015 Municipality 2010 2011 2012
5 Yr Increase
2008 2009 20142013 2016

Housing Data Book Housing Price IndexSemi-detached and Rowhouse Housing Price Index ($) for Metro Vancouver Municipalities, June 2008 - 2017
(No.) (%)Burnaby ** 461,602 433,780 492,510 423,600 414,333 403,100 422,067 442,867 517,400 681,033 266,700 64%Coquitlam 430,890 380,251 447,025 386,600 382,867 382,800 389,000 414,200 527,500 617,400 234,533 61%Ladner - Delta (South) 464,623 449,342 468,499 459,600 450,767 446,500 461,800 493,100 628,300 731,300 280,533 62%Delta (North) n/a n/a n/a n/a 297,267 292,700 312,000 323,000 447,600 553,800 256,533 86%Langley 331,097 300,791 328,117 324,844 292,767 291,500 291,300 298,300 408,400 449,600 156,833 54%Maple Ridge 320,094 290,895 314,522 285,500 276,233 269,400 271,300 282,400 373,500 471,300 195,067 71%New Westminster n/a n/a n/a 394,500 398,633 393,900 408,900 441,900 543,000 640,600 241,967 61%North Vancouver 604,364 541,744 618,998 579,900 598,467 580,500 605,400 650,100 850,200 938,300 339,833 57%Pitt Meadows n/a n/a n/a 336,700 321,633 317,800 322,200 363,100 447,400 535,900 214,267 67%Port Coquitlam 396,996 369,101 400,914 375,400 374,733 365,100 372,200 397,400 515,300 591,400 216,667 58%Port Moody 413,385 361,181 413,309 419,600 409,933 402,100 416,100 447,400 547,400 584,400 174,467 43%Richmond 470,075 435,097 517,348 590,800 506,600 493,900 507,900 546,900 709,800 766,200 259,600 51%Surrey * 331,487 304,675 330,194 335,567 306,833 320,613 379,416 324,200 409,800 507,800 200,967 65%Vancouver West 730,928 655,001 765,336 680,400 711,333 703,600 748,000 805,500 1,092,900 1,211,600 500,267 70%Vancouver East 522,994 480,259 535,723 495,300 522,733 517,700 532,300 562,100 765,500 813,400 290,667 56%West Vancouver n/a n/a n/a n/a n/a n/a n/a n/a n/a n/a n/aSouth Surrey & White Rock 442,320 418,646 481,048 472,458 469,400 458,200 463,100 429,900 521,000 619,000 149,600 32%Greater Vancouver 477,805 436,409 498,533 468,700 468,400 456,200 471,200 506,900 656,900 745,700 277,300 59% Fraser Valley 335,090 301,103 328,080 327,457 305,000 298,700 297,800 302,600 387,100 467,000 162,000 53%Source: Real Estate Board of Greater Vancouver and Fraser Valley Real Estate Board
Notes: Maple Ridge and Pitt Meadows were reported as a singular geographic area prior to 2012."Greater Vancouver" as defined by REBGV has a different geographic area than the regionally defined "Metro Vancouver" region.Homes sales in Greater Vancouver are tracked through the MLSLink Housing Price Index® (MLSLink HPI®) which measures benchmark or typical home prices.The MLSLink® Housing Price Index (HPI), established in 1995, is modeled on the Consumer Price Index (CPI).Instead of measuring goods and services, the HPI measures the change in the price of housing features. Thus, the HPI measures typical, pure price change (inflation or deflation).The HPI benchmarks represent the price of a typical property within each market. The HPI takes into consideration what averages and medians do not – items such as lot size, age, number of rooms, etc. These features become the composite of the ‘typical house’ in a given area.Each month’s sales determine the current prices paid for bedrooms, bathrooms, fireplaces, etc. and apply those new values to the ‘typical’ house model. Note: For 2007-2013 Surrey does not have a "benchmark price" for apartments, therefore "average price" data is shown in this table.
* Surrey does not include "South Surrey", which is reported below in the group "South Surrey & White Rock".** For 2012-2016 Burnaby data is reported for 3 sub-areas of Burnaby. For purposes of this table, a non-weighted average of the 3 sub-areas is used.
5.4
2012 Municipality 2008 2009 2010 2011 20142013 2017
5 Yr Increase
2015(2012 - 2017)
2016

Housing Data Book Housing Price Index
Apartment Housing Price Index ($) for Metro Vancouver Municipalities, June 2008 - 2017
2008 2009 2010 2011 2012 2013 2014 2015 2016 2017(No.) (%)
Burnaby ** 348,053 314,704 354,100 368,700 362,378 359,600 382,330 382,330 497,300 588,900 226,522 63%Coquitlam 298,262 258,533 295,670 263,800 257,467 248,000 255,000 397,500 336,100 442,600 185,133 72%Ladner - Delta (South) 359,243 322,679 366,686 315,800 324,333 301,600 313,900 272,700 416,100 397,500 73,167 23%Delta (North) n/a n/a n/a n/a 177,333 161,800 158,400 160,200 195,500 309,900 132,567 75%Langley 245,537 224,920 241,491 239,684 214,200 211,900 213,700 197,100 238,800 328,700 114,500 53%Maple Ridge 265,744 236,321 251,808 187,600 178,967 170,800 169,800 172,300 190,000 232,600 53,633 30%New Westminster 301,500 268,364 300,034 270,300 274,700 272,100 277,800 288,000 347,200 440,900 166,200 61%North Vancouver 393,451 346,657 395,053 344,000 351,700 353,500 352,700 370,600 444,200 528,200 176,500 50%Pitt Meadows n/a n/a n/a 226,600 217,600 231,500 245,300 255,500 285,100 348,700 131,100 60%Port Coquitlam 263,542 231,142 252,880 239,500 228,067 217,300 225,200 236,300 287,300 386,900 158,833 70%Port Moody 309,042 283,818 309,186 300,500 317,600 322,800 331,900 354,900 445,700 554,500 236,900 75%Richmond 323,322 294,271 339,497 349,100 350,400 346,500 354,000 362,600 424,100 572,600 222,200 63%Surrey * 238,563 221,886 216,661 211,506 197,859 208,369 210,500 201,500 239,000 340,200 142,341 72%Vancouver West 493,218 444,161 508,628 477,300 480,533 474,600 491,200 528,000 696,200 772,900 292,367 61%Vancouver East 333,346 303,992 336,472 304,500 311,733 306,800 321,000 330,300 418,400 507,700 195,967 63%West Vancouver 673,523 560,814 661,505 630,300 632,533 601,400 610,100 646,300 846,300 1,168,000 535,467 85%South Surrey & White Rock 344,670 310,978 315,388 323,094 250,900 241,000 240,600 243,600 310,600 420,200 169,300 67%Greater Vancouver 388,722 356,880 396,030 375,000 376,200 367,700 378,000 400,200 501,100 600,700 224,500 60% Fraser Valley 255,670 231,014 246,351 249,537 204,200 202,500 197,000 191,900 231,900 325,300 121,100 59%Source: Real Estate Board of Greater Vancouver and Fraser Valley Real Estate Board
Notes: Maple Ridge and Pitt Meadows were reported as a singular geographic area prior to 2012."Greater Vancouver" as defined by REBGV has a different geographic area than the regionally defined "Metro Vancouver" region.Homes sales in Greater Vancouver are tracked through the MLSLink Housing Price Index® (MLSLink HPI®) which measures benchmark or typical home prices.The MLSLink® Housing Price Index (HPI), established in 1995, is modeled on the Consumer Price Index (CPI).Instead of measuring goods and services, the HPI measures the change in the price of housing features. Thus, the HPI measures typical, pure price change (inflation or deflation).The HPI benchmarks represent the price of a typical property within each market. The HPI takes into consideration what averages and medians do not – items such as lot size, age, number of rooms, etc. These features become the composite of the ‘typical house’ in a given area.Each month’s sales determine the current prices paid for bedrooms, bathrooms, fireplaces, etc. and apply those new values to the ‘typical’ house model.
* Surrey does not include "South Surrey", which is reported below in the group "South Surrey & White Rock".** For 2012-2016 Burnaby data is reported for 3 sub-areas of Burnaby. For purposes of this table, a non-weighted average of the 3 sub-areas is used.
5.4
5 Yr Increase(2012 - 2017)
Municipality

METRO VANCOUVER HOUSING DATA BOOK ... Affordable Sales Based on Price Thresholds
5.5 Note: Real Estate Board of Greater Vancouver data represents approximately 80% of all sales in the Board’s area. The other 20% of sales are new homes that are not listed on the MLS® system, usually sold directly from the developer. The 20% not captured may also include private sales.
Description
Metro Vancouver is often identified as having the highest home prices
relative to household income in North America. Factors such as sale
price, household income and mortgage rates impact affordability
within the ownership market.
Ownership units are considered to be affordable if households with
median household income can purchase the unit, with 10% down, 25
year amortization period and pay no more than 30% of their income.
Based on these considerations the estimated affordable price in
recent years is set at $385,000.
Key Findings
Real Estate Board data for Metro Vancouver showed that in 2016,
22% of sales (all unit types) were considered affordable on average
(11,887 affordable sales of the 53,330 total sales). The proportion of
total sales that are deemed affordable has declined from 32% in 2010.
In the past 7 years the number of affordable sales in the region has
varied from 13,869 sales in 2015 to 10,454 affordable sales in 2012.
Municipalities with a higher proportion of affordable sales in 2016 are
New Westminster (41%), Langley (41%), Pitt Meadows (40%) and Port
Coquitlam (39%). The greatest number of actual affordable sales in
2016 occurred in the Surrey / White Rock sub‐region with 3,692
affordable sales (31% of all affordable sales in the region).
The majority of affordable sales are in apartment / condominium
building form, accounting for 72% of affordable sales in 2016. Row
house / townhouse units made up 17% of the affordable sales in
2014. Single detached houses have declined to 1% in 2016 from 6% of
affordable sales in 2010.
Estimated Real Estate Sales, Total and Affordable, Metro Vancouver, 2010 ‐ 2016
Source: Fraser Valley Real Estate Board (FVREB) and the Real Estate Board of Greater Vancouver (REBGV)
Affordable Sales by Building Type, 2010 ‐ 2016
Source: Fraser Valley Real Estate Board (FVREB) and the Real Estate Board of Greater Vancouver (REBGV)

Housing Data Book Income & Affordability
Estimated Real Estate Sales Deemed "Affordable" in the Greater Vancouver Area, 2009 to 2016
Greater Vancouver * 2009 2010 2011 2012 2013 2014 2015 20165 - Year Total (2012 - 2016)
Total Units Sold 34,395 29,345 31,135 23,646 27,038 31,118 39,694 36,953 218,929
Affordable Units Sold 11,963 8,580 8,158 6,807 7,557 7,939 9,095 6,728 54,864
% Deemed Affordable 35% 29% 26% 29% 28% 26% 23% 18% 25%
Fraser Valley ** 2009 2010 2011 2012 2013 2014 2015 20165 - Year Total (2012 - 2016)
Total Units Sold 14,589 13,043 13,562 12,100 12,050 13,825 18,485 21,354 104,419
Affordable Units Sold 6,790 5,863 5,424 5,118 5,193 5,515 6,558 6,752 40,423
% Deemed Affordable 47% 45% 40% 42% 43% 40% 35% 32% 39%
Notes: 1. Affordable Housing estimates: 30% of household income for an above moderate income household. Assumes 10% down, and 25 yr mortgage (5 year fixed term)2. Above moderate income (120% or more of Median Household Income) is an estimated annually, based on 2006 Census & 2011 National Household Survey (NHS). (Statistics Canada) and Taxfiler data (Statistics Canada). (non-census year adjusted) 2011 NHS median household Income for Metro Vancouver $63,347. Metro Vancouver estimates the median household income to be $69,000 in 2016.3. Fluctuations in interest rates and in estimates of household incomes affect the accuracy of these estimates. Figures shown should be used as an indicator of change and should not be relied upon as an accurate unit count.4. Affordable Price Thresholds for this data collection are: $385,0005. Geographic areas used by the Real Estate Boards are not reflective of the regional government boundaries.
* Real Estate Board of Greater Vancouver: Vancouver, Richmond, Burnaby, New Westminster, North Shore, Tri-Cities, Maple Ridge, Pitt Meadows and Ladner (Delta)** Fraser Valley Real Estate Board includes Abbotsford, Mission, Langleys, Surrey, White Rock, Delta (excluding Ladner)
5.5

Housing Data Book Affordable Sales
Affordable Sales in Metro Vancouver, 2012 - 20162012 2013 2014 2015 2016Total Total Total Total TotalSales No. % Sales No. % Sales No. % Sales No. % Sales No. %
Burnaby 2,920 969 33% 3,434 1,119 33% 3,745 1,116 30% 5,099 1,345 26% 4,496 986 22%Coquitlam 2,104 728 35% 2,307 839 36% 2,618 808 31% 3,400 1,048 31% 3,394 842 25%Ladner - Delta 278 49 18% 314 67 21% 427 85 20% 442 81 18% 427 28 7%Delta (except Ladner)* 569 47 8% 582 66 11% 583 67 11% 971 77 8% 2,850 765 27%Langley * 2,224 956 43% 2,263 958 42% 2,529 1,137 45% 3,205 1,297 40% 1,715 704 41%Maple Ridge 1,379 618 45% 1,414 612 43% 1,765 712 40% 2,413 872 36% 2,850 765 27%New Westminster 1,146 654 57% 1,130 645 57% 1,237 677 55% 1,644 873 53% 1,715 704 41%North Vancouver City 388 90 23% 435 81 19% 488 99 20% 639 150 23% 616 87 14%North Vancouver District 1,600 331 21% 1,789 355 20% 2,046 371 18% 2,700 454 17% 2,389 286 12%Pitt Meadows 335 185 55% 431 253 59% 425 250 59% 527 212 40% 454 180 40%Port Coquitlam 902 408 45% 942 436 46% 1,178 523 44% 1,499 628 42% 1,608 627 39%Port Moody 574 214 37% 651 242 37% 738 240 33% 803 213 27% 872 154 18%Richmond 2,815 815 29% 3,624 1,035 29% 4,270 1,006 24% 5,740 1,271 22% 5,271 1,114 21%Surrey (less South Surrey)* 5,139 2,123 41% 4,787 2,075 43% 4,931 2,145 44%City of Surrey (total) 10,061 3,124 31% 11,087 3,413 31%Vancouver 7,722 1,632 21% 8,847 1,769 20% 10,236 1,926 19% 12,287 1,822 15% 10,641 886 8%West Vancouver 783 30 4% 960 32 3% 1,038 35 3% 1,309 30 2% 1,067 28 3%White Rock 791 290 37% 833 279 33%South Surrey & White Rock* 1,860 521 28% 2,012 562 28% 2,234 669 30% 3,258 752 23% 3,455 782 23%Metro Vancouver 33,438 10,454 31% 36,682 11,218 31% 41,395 11,957 29% 54,606 13,869 25% 53,330 11,887 22%Source: Real Estate Board of Greater Vancouver and Fraser Valley Real Estate Board
Note: Metro Vancouver includes Lions Bay, Anmore, Belcarra, UBC-UEL, Tsawwassen.
Notes: 1. Affordable Housing estimates: 30% of household income, based on the median household income in Metro Vancouver. Assumes 10% down, and 25 yr mortgage (5 year fixed term2. Median household income is an estimated annually, based on 2006 Census & 2011 National Household Survey (NHS). 2011 NHS median household Income for Metro Vancouver $63,347. Metro Vancouver estimates the median household income to be $69,000 in 2016.3. Fluctuations in interest rates and in estimates of household incomes affect the accuracy of these estimates. Figures shown should be used as an indicator of change and should not be relied upon as an accurate unit count.4. Affordable Price Thresholds for this data collection are: $385,0005. Geographic areas used by the Real Estate Boards are not reflective of the regional government boundaries. ie, REBGV distinction for the City of North Vancouver and the District of North Vancouver may not be entirely accurate.
* Real Estate Board of Greater Vancouver: Vancouver, Richmond, Burnaby, New Westminster, North Shore, Tri-Cities, Maple Ridge, Pitt Meadows and Ladner (Delta)** Fraser Valley Real Estate Board includes Abbotsford, Mission, Langleys, Surrey, White Rock, Delta (excluding Ladner)
5.5
MunicipalityAffordable SalesAffordable SalesAffordable SalesAffordable SalesAffordable Sales

Housing Data Book Affordable Sales
Affordable SINGLE DETACHED Sales in Metro Vancouver, 2011 - 20162011 2012 2013 2014 2015 2016Total Total Total Total Total TotalSales No. % Sales No. % Sales No. % Sales No. % Sales No. % Sales No. %
Burnaby 1,283 0 0% 818 0 0% 980 0 0% 1,201 0 0% 1,599 0 0% 1,151 0 0%Coquitlam 1,337 56 4% 1,068 39 4% 1,113 46 4% 1,334 52 4% 1,613 33 2% 1,389 47 3%Ladner - Delta 252 10 4% 192 4 2% 206 4 2% 282 4 1% 281 5 2% 254 3 1%Delta (except Ladner)* 596 14 2% 479 3 1% 463 1 0% 463 1 0% 783 1 0% 698 0 0%Langley * 1,236 75 6% 1,224 86 7% 1,251 58 5% 1,251 71 6% 1,692 42 2% 1,790 7 0%Maple Ridge 981 168 17% 908 170 19% 935 158 17% 1,196 186 16% 1,551 126 8% 1,739 27 2%New Westminster 330 4 1% 268 3 1% 271 3 1% 338 1 0% 386 0 0% 375 3 1%North Vancouver City 140 0 0% 99 0 0% 118 0 0% 123 1 1% 145 0 0% 146 0 0%North Vancouver District 1,051 3 0% 821 2 0% 974 4 0% 1,113 2 0% 1,334 4 0% 1,097 6 1%Pitt Meadows 166 19 11% 142 8 6% 179 21 12% 166 10 6% 254 5 2% 174 5 3%Port Coquitlam 454 25 6% 390 11 3% 390 14 4% 476 11 2% 586 6 1% 578 1 0%Port Moody 207 2 1% 159 0 0% 204 0 0% 228 0 0% 258 0 0% 228 0 0%Richmond 1,704 2 0% 978 6 1% 1,319 9 1% 1,692 6 0% 2,360 2 0% 1,664 11 1%Surrey* (excludes South Surre 3,394 232 7% 2,936 115 4% 2,624 82 3% 2,624 76 3%City of Surrey (total) 5,978 47 1% 5,233 7 0%Vancouver 3,763 3 0% 2,475 1 0% 3,063 2 0% 3,499 1 0% 3,942 1 0% 3,044 2 0%West Vancouver 1,137 4 0% 571 6 1% 730 12 2% 796 8 1% 1,019 2 0% 786 4 1%White Rock 371 1 0% 348 0 0%South Surrey & White Rock* 1,579 7 0% 980 9 1% 1,080 8 1% 1,080 7 1% 1,785 4 0% 1,586 3 0%Metro Vancouver 20,090 626 3% 14,881 471 3% 16,282 429 3% 18,383 457 2% 24,606 268 1% 21,132 123 1%Source: Real Estate Board of Greater Vancouver and Fraser Valley Real Estate Board
Note: Metro Vancouver includes Lions Bay, Anmore, Belcarra, UBC-UEL, Tsawwassen.
Notes: 1. Affordable Housing estimates: 30% of household income, based on the median household income in Metro Vancouver. Assumes 10% down, and 25 yr mortgage (5 year fixed term)2. Median household income is an estimated annually, based on 2006 Census & 2011 National Household Survey (NHS). 2011 NHS median household Income for Metro Vancouver $63,347. Metro Vancouver estimates the median household income to be $69,000 in 2016.3. Fluctuations in interest rates and in estimates of household incomes affect the accuracy of these estimates. Figures shown should be used as an indicator of change and should not be relied upon as an accurate unit count.4. Affordable Price Thresholds for this data collection are: $385,0005. Geographic areas used by the Real Estate Boards are not reflective of the regional government boundaries. ie, REBGV distinction for the City of North Vancouver and the District of North Vancouver may not be entirely accurate.
* Real Estate Board of Greater Vancouver: Vancouver, Richmond, Burnaby, New Westminster, North Shore, Tri-Cities, Maple Ridge, Pitt Meadows and Ladner (Delta)** Fraser Valley Real Estate Board includes Abbotsford, Mission, Langleys, Surrey, White Rock, Delta (excluding Ladner)
5.5
Municipality
Affordable Sales
Affordable Sales
Affordable Sales
Affordable Sales
Affordable Sales
Affordable Sales

Housing Data Book Affordable Sales
Affordable TOWNHOUSE Sales in Metro Vancouver, 2011 - 20162011 2012 2013 2014 2015 2016Total Total Total Total Total TotalSales No. % Sales No. % Sales No. % Sales No. % Sales No. % Sales No. %
Burnaby 860 204 24% 666 159 24% 768 172 22% 764 159 21% 1,058 198 19% 757 78 10%Coquitlam 523 144 28% 374 103 28% 461 135 29% 501 113 23% 609 141 23% 541 48 9%Ladner - Delta 65 20 31% 43 16 37% 55 24 44% 69 20 29% 65 10 15% 107 3 3%Delta (except Ladner)* 78 34 44% 62 17 27% 80 26 33% 87 34 39% 783 1 0% 121 28 23%Langley * 604 477 79% 613 487 79% 623 517 83% 800 601 75% 1,692 42 2% 1,057 335 32%Maple Ridge 407 343 84% 289 266 92% 295 270 92% 364 321 88% 588 474 81% 647 287 44%New Westminster 132 39 30% 127 37 29% 130 33 25% 100 23 23% 163 23 14% 143 19 13%North Vancouver City 120 2 2% 105 1 1% 128 3 2% 130 2 2% 156 2 1% 145 0 0%North Vancouver District 268 11 4% 202 16 8% 227 15 7% 268 8 3% 366 9 2% 318 6 2%Pitt Meadows 78 66 85% 77 61 79% 98 79 81% 102 85 83% 165 99 60% 118 33 28%Port Coquitlam 237 111 47% 223 111 50% 290 161 56% 345 164 48% 386 121 31% 330 24 7%Port Moody 245 91 37% 196 66 34% 192 65 34% 221 63 29% 210 54 26% 229 22 10%Richmond 1,011 65 6% 734 81 11% 892 105 12% 1,079 100 9% 1,325 80 6% 1,042 28 3%Surrey* (excludes South Surre 1,304 1,098 84% 1,264 1,076 85% 1,297 1,147 88% 1,470 1,245 85%City of Surrey (total) 2,618 1,714 65% 3,319 1,080 33%Vancouver 1,086 51 5% 868 33 4% 1,046 50 5% 1,138 40 4% 1,402 38 3% 1,110 10 1%West Vancouver 49 0 0% 53 0 0% 72 1 1% 61 1 2% 83 2 2% 58 0 0%White Rock 39 3 8% 38 5 13%South Surrey & White Rock* 402 126 31% 413 137 33% 413 145 35% 523 173 33% 1,785 4 0% 841 63 7%Metro Vancouver 7,551 2,889 38% 6,364 2,672 42% 7,136 2,958 41% 8,069 3,154 39% 11,806 3,017 26% 10,154 2,007 20%Source: Real Estate Board of Greater Vancouver and Fraser Valley Real Estate Board
Note: Metro Vancouver includes Lions Bay, Anmore, Belcarra, UBC-UEL, Tsawwassen.
Notes: 1. Affordable Housing estimates: 30% of household income, based on the median household income in Metro Vancouver. Assumes 10% down, and 25 yr mortgage (5 year fixed term)2. Median household income is an estimated annually, based on 2006 Census & 2011 National Household Survey (NHS). 2011 NHS median household Income for Metro Vancouver $63,347. Metro Vancouver estimates the median household income to be $69,000 in 2016.3. Fluctuations in interest rates and in estimates of household incomes affect the accuracy of these estimates. Figures shown should be used as an indicator of change and should not be relied upon as an accurate unit count.4. Affordable Price Thresholds for this data collection are: $385,0005. Geographic areas used by the Real Estate Boards are not reflective of the regional government boundaries. ie, REBGV distinction for the City of North Vancouver and the District of North Vancouver may not be entirely accurate.
* Real Estate Board of Greater Vancouver: Vancouver, Richmond, Burnaby, New Westminster, North Shore, Tri-Cities, Maple Ridge, Pitt Meadows and Ladner (Delta)** Fraser Valley Real Estate Board includes Abbotsford, Mission, Langleys, Surrey, White Rock, Delta (excluding Ladner)
5.5
Municipality
Affordable Sales
Affordable Sales
Affordable Sales
Affordable Sales
Affordable Sales
Affordable Sales

Housing Data Book Affordable Sales
Affordable APARTMENT / CONDOMINIUM Sales in Metro Vancouver, 2011 - 20162011 2012 2013 2014 2015 2016Total Total Total Total Total TotalSales No. % Sales No. % Sales No. % Sales No. % Sales No. % Sales No. %
Burnaby 1,825 1,082 59% 1,436 810 56% 1,686 947 56% 1,780 957 54% 2,442 1,147 47% 2,588 908 35%Coquitlam 715 636 89% 662 586 89% 733 658 90% 783 643 82% 1,178 874 74% 1,464 747 51%Ladner - Delta 53 42 79% 43 29 67% 53 39 74% 76 61 80% 96 66 69% 66 22 33%Delta (except Ladner)* 34 34 100% 28 27 96% 39 39 100% 33 32 97% 44 44 100% 182 129 71%Langley * 392 388 99% 387 383 99% 389 383 98% 478 465 97% 579 564 97% 918 854 93%Maple Ridge 204 204 100% 182 182 100% 184 184 100% 205 205 100% 274 272 99% 464 451 97%New Westminster 886 742 84% 751 614 82% 729 609 84% 799 653 82% 1,095 850 78% 1,197 682 57%North Vancouver City 207 111 54% 184 89 48% 189 78 41% 235 96 41% 338 148 44% 325 87 27%North Vancouver District 688 401 58% 577 313 54% 588 336 57% 665 361 54% 1,000 441 44% 974 274 28%Pitt Meadows 109 107 98% 116 116 100% 154 153 99% 157 155 99% 108 108 100% 162 142 88%Port Coquitlam 294 292 99% 289 286 99% 262 261 100% 357 348 97% 527 501 95% 700 602 86%Port Moody 279 207 74% 219 148 68% 255 177 69% 289 177 61% 335 159 47% 415 132 32%Richmond 1,542 939 61% 1,103 728 66% 1,413 921 65% 1,499 900 60% 2,055 1,189 58% 2,565 1,075 42%Surrey* (excludes South Surre 1,023 1,002 98% 939 932 99% 866 846 98% 837 824 98%City of Surrey (total) 1,465 1,363 93% 2,535 2,326 92%Vancouver 5,329 1,864 35% 4,379 1,598 36% 4,738 1,717 36% 5,599 1,885 34% 6,943 1,783 26% 6,487 874 13%West Vancouver 209 27 13% 159 24 15% 158 19 12% 181 26 14% 207 26 13% 223 24 11%White Rock 381 286 75% 447 274 61%South Surrey & White Rock* 528 432 82% 467 375 80% 519 409 79% 631 489 77% 742 571 77% 1,028 716 70%Metro Vancouver 14,664 8,562 58% 12,193 7,311 60% 13,264 7,831 59% 14,944 8,346 56% 19,165 9,827 51% 22,245 9,641 43%Source: Real Estate Board of Greater Vancouver and Fraser Valley Real Estate Board
Note: Metro Vancouver includes Lions Bay, Anmore, Belcarra, UBC-UEL, Tsawwassen.
Notes: 1. Affordable Housing estimates: 30% of household income, based on the median household income in Metro Vancouver. Assumes 10% down, and 25 yr mortgage (5 year fixed term)2. Median household income is an estimated annually, based on 2006 Census & 2011 National Household Survey (NHS). 2011 NHS median household Income for Metro Vancouver $63,347. Metro Vancouver estimates the median household income to be $69,000 in 2016.3. Fluctuations in interest rates and in estimates of household incomes affect the accuracy of these estimates. Figures shown should be used as an indicator of change and should not be relied upon as an accurate unit count.4. Affordable Price Thresholds for this data collection are: $385,0005. Geographic areas used by the Real Estate Boards are not reflective of the regional government boundaries. ie, REBGV distinction for the City of North Vancouver and the District of North Vancouver may not be entirely accurate.
* Real Estate Board of Greater Vancouver: Vancouver, Richmond, Burnaby, New Westminster, North Shore, Tri-Cities, Maple Ridge, Pitt Meadows and Ladner (Delta)** Fraser Valley Real Estate Board includes Abbotsford, Mission, Langleys, Surrey, White Rock, Delta (excluding Ladner)
5.5
Municipality
Affordable Sales
Affordable Sales
Affordable Sales
Affordable Sales
Affordable Sales
Affordable Sales

METRO VANCOUVER HOUSING DATA BOOK ...
Glossary
Affordable Housing – Housing that does not cost more than 30% of a
household’s gross income regardless of where they live.
Core Housing Need ‐ the number of households in a community who are
unable to find housing that is suitable in size and in good repair without
spending 30% or more of their gross household income on their housing
costs
Housing Action Plans ‐ Plans prepared by municipalities that identify
specific housing objectives and actions for increasing housing supply,
diversity and affordability at the municipal level.
INALH (In Need At Least Half) ‐ Refers to households who are in core
housing need and who are spending at least half of their income on
housing. These are households who face extreme affordability challenges
and who are considered to be at increased risk of homelessness.
Very Low Income Households ‐ Refers to households with incomes which
are below 50% of the median income for the region.
Low Income Households ‐ Refers to households with incomes which are
between 50% and 80% of the median income for the region
Moderate Income Households ‐ Refers to households with incomes which
are between 80% and 120% of the median income for the region
Above‐Moderate Income Households ‐ Refers to households with
incomes which are between 120% and 150% of the median income for
the region
High Income Households ‐ Refers to households with incomes which are
above 150% of the median household income for the region
Private Market Housing – The private rental market provides the majority
of rental housing affordable to households with low and low to moderate
incomes. This can include purpose‐built rental housing as well as housing
supplied through the secondary rental market including basement
apartments. Rented condo apartments also represent an important
source of rental housing stock.
Social Housing ‐ Social housing refers to housing built under Federal,
Federal / Provincial or Provincial programs and is designed to provide
housing for households in core housing need. It includes public housing as
well as non‐profit and co‐op housing.

SERVICES AND SOLUTIONS FOR A LIVABLE REGION