metrology in spectrochemical...
TRANSCRIPT

METROLOGY IN METROLOGY IN SPECTROCHEMICAL SPECTROCHEMICAL
ANALYSISANALYSISV. KmetovV. Kmetov
University of Plovdiv, BULGARIAUniversity of Plovdiv, BULGARIA
Academic exchangeAcademic exchangeUniversity of Alicante,University of Alicante,
March 2007March 2007
Slide 2Dr. V. Kmetov Alicante 2007
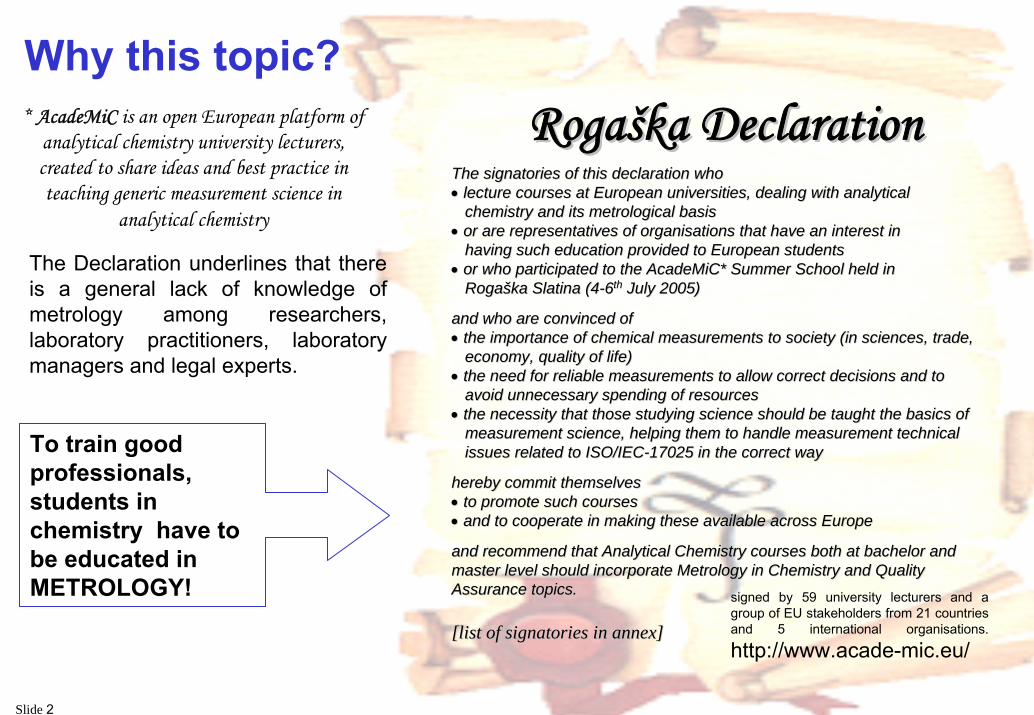
RogaRogašškaka DeclarationDeclarationThe signatories of this declaration who The signatories of this declaration who •• lecture courses at European universities, dealing with analyticlecture courses at European universities, dealing with analytical al
chemistry and its metrological basischemistry and its metrological basis•• or are representatives of organisations that have an interest ior are representatives of organisations that have an interest in n
having such education provided to European studentshaving such education provided to European students•• or who participated to the AcadeMiC* Summer School held in or who participated to the AcadeMiC* Summer School held in
RogaRogašškaka SlatinaSlatina (4(4--66thth July 2005)July 2005)
and who are convinced of and who are convinced of •• the importance of chemical measurements to society (in sciencesthe importance of chemical measurements to society (in sciences, trade, , trade,
economy, quality of life)economy, quality of life)•• the need for reliable measurements to allow correct decisions athe need for reliable measurements to allow correct decisions and to nd to
avoid unnecessary spending of resourcesavoid unnecessary spending of resources•• the necessity that those studying science should be taught the the necessity that those studying science should be taught the basics of basics of
measurement science, helping them to handle measurement technmeasurement science, helping them to handle measurement technical ical issues related to ISO/IECissues related to ISO/IEC--17025 in the correct way17025 in the correct way
hereby commit themselves hereby commit themselves •• to promote such courses to promote such courses •• and to cooperate in making these available across Europeand to cooperate in making these available across Europe
and recommend that Analytical Chemistry courses both at bachelorand recommend that Analytical Chemistry courses both at bachelor and and master level should incorporate Metrology in Chemistry and Qualimaster level should incorporate Metrology in Chemistry and Quality ty Assurance topics.Assurance topics.
[list of signatories in annex][list of signatories in annex]
* AcadeMiC is an open European platform of analytical chemistry university lecturers, created to share ideas and best practice in teaching generic measurement science in
analytical chemistry
Why this topic?
The Declaration underlines that there is a general lack of knowledge of metrology among researchers, laboratory practitioners, laboratory managers and legal experts.
signed by 59 university lecturers and a group of EU stakeholders from 21 countries and 5 international organisations.
http://www.acade-mic.eu/
To train good professionals, students in chemistry have to be educated in METROLOGY!

Slide 3Dr. V. Kmetov Alicante 2007
TrainMiCTra in in g in Me t ro log y in Ch e m is t ry
TrainMiC is organised and conducted by JRC-IRMM as a common international information platform to be used as a tool for the education in metrology in chemistry.

Slide 4Dr. V. Kmetov Alicante 2007
1. The new trends and the politics of the European Union concerning the Metrology in ChemistryBasic statistic needed for spectrochemical measurements
2. Uncertainty budget calculation in spectrochemical measurementsKragten approach
3. Validation of the measurement procedure Inter Laboratory comparison
4. Traceability of the measurement results,
5. Determination of gold in jewellery gold alloys by Flame Atomic Absorption Spectrometry - evaluation of the measurement procedure,
TranMiC – example
HEADLINES four lectures + one practice

Slide 5Dr. V. Kmetov Alicante 2007
TrainMiC – Training Metrology in Chemistry - EUR Report 20841 ENOffice for Official Publications of the European Communities ISBN 92-894-6238-8
GUM-Guide to Expression of Uncertainty in Measurement, ISO, 1995
Eurachem/CITAC Guide: Quantifying Uncertainty in Analytical Measurement,
2nd Edition, 2000 http://www.eurachem.ul.pt/guides/QUAM2000-1.pdf
ISO/IEC 17025: General Requirements for the Competence of Testing and Calibration Laboratories, 1999
VIM - International Vocabulary of Basic and General Terms in Metrology, ISO, 1993 (2004)
J.C. Miller, J.N. Miller, Statistics for Analytical Chemistry, Ellis & Horwood, Chichester (ISBN 0-13-845421-3)Kragten, J., The Analyst 119 (1994), 2161-2165
REFERENCES

Slide 6Dr. V. Kmetov Alicante 2007
The topics today are :
1. Metrоlogy - way to study it ?
2. How to present the measurement result?
3. Just to refresh the Basic statistics knowledge we need.
3. Confidence interval is this enough?
4. Single laboratory validation – some examples

Metrology is the science of measurementis about understanding the measurement procedure
(not about measuring with the smallest achievable uncertainty)
Metrological aspects are part of any measurement even the simplest one
Metrology in chemistry (MiC)is metrology applied to chemical analysis
The main goal of metrology is to prevent the problems between people in the process of quantity characterization !!
VIM (2004) (2.2) metrology - field of knowledge concerned with measurementincludes all theoretical and practical aspects of measurement, whichever the measurement uncertainty and field of application.

Slide 8Dr. V. Kmetov Alicante 2007
The modern societies use measurementsacount for 4 to 6 % of GDP
The importance of chemical measurements is enormous:• in science • in technology • in trade• when making regulation
(about 40% EU directives involve measurements)
Between 5 and 30 % of chemical measurements are unsatisfactory!
Taylor, Leito, Majcen, Galdikas, Vassileva, Duta, Bulska “A strategy for a national metrology institute ...” Accred. Qual. Assur., 2004
Metrology is important and the EC supports it!

Slide 9Dr. V. Kmetov Alicante 2007
Directives requiring of measurements implementation
National
National
EC
EU & National
Design
Implement equivalentlyacross EU
Adopt
measurements
Crucial link between directive and implementation
uniform across EU
• Competent labs in the member states• Competent national accreditation body• Competent national reference labs
Miglena KunevaEuropean Commissionerfor Consumers

Slide 10Dr. V. Kmetov Alicante 2007
Decision makers affects - what is needed?

Slide 11Dr. V. Kmetov Alicante 2007
Dependence of leaving place on the Pb content in blood of workers (melting sector) from Non-Ferrous Factory KCM-Plovdiv
Workers in Pb melting
350
400
450
500
550
Plovdiv
Aseno
vgrad
Kuklen
Dolni V
oden
Krumov
o
Ave
rage
Pbμg
/Lin
blo
od
mea
sure
d by
AA
S
Decision makers affects - what is needed?
Pb in blood = 480 ± 160 µg/L; k=2
?
Slide 12Dr. V. Kmetov Alicante 2007
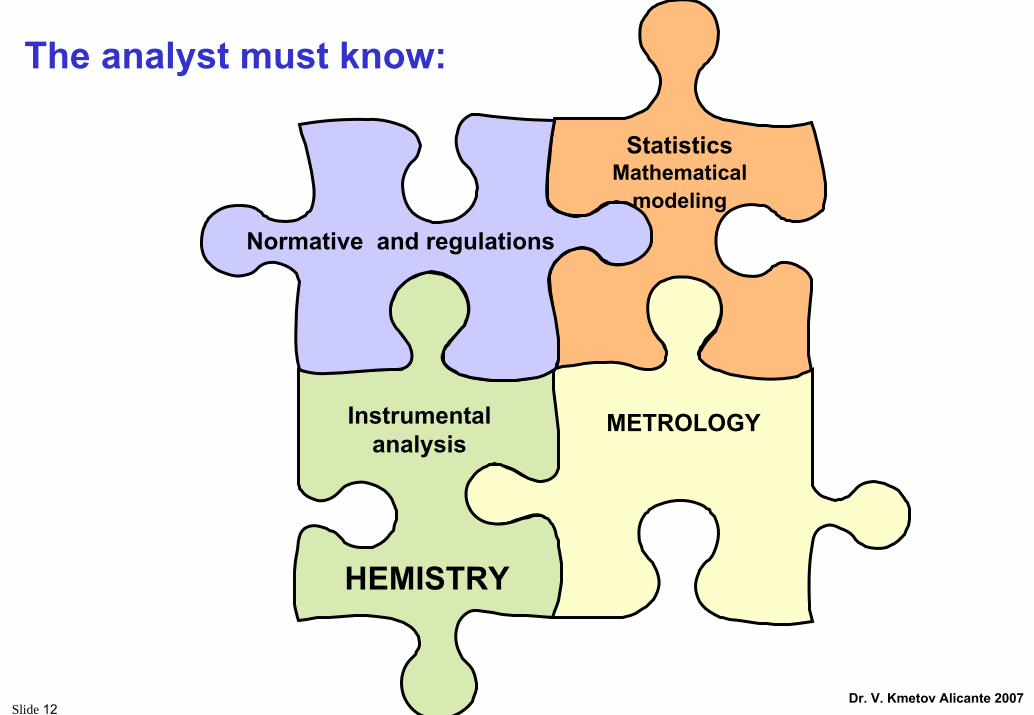
The analyst must know:
HEMISTRY
Normative and regulations
StatisticsMathematical
modeling
METROLOGYInstrumental analysis

Slide 13Dr. V. Kmetov Alicante 2007
“LEGISLATORS VERSUS ANALYSTS –THE DEMANDS OF CURRENT AND EMERGING FOOD
LEGISLATION ON THE ANALYTICAL COMMUNITY”Roger Wood, Food Standards Agency, c/o Institute of Food Research, Norwich Research Park, Colney. Norwich NR4 7UA
CONCLUSIONS
The analyst is increasingly being given more “freedom”,
Is coming at an increasing cost to him?
It will be essential for him to develop and appreciate statistical skills in order to be able to use this new-found freedom effectively.

Slide 14Dr. V. Kmetov Alicante 2007
From Wikipedia, the free encyclopedia
StatisticsStatistics is a mathematical sciencepertaining to the collection, analysis, interpretation, and presentation of data.
Statistic may also refer to:
Statistic, the result of applying a statistical algorithm to a setof data
Statistics (role-playng games), a piece of data whichrepresents a particular aspect of a fictional character
Definitions:
Statistics is like bikini – shows very much and interesting things, but the most important remains covered Probability is the extent to which something
is likely to happen or be the case
May we predict the result of analytical measurement ?
Slide 15Dr. V. Kmetov Alicante 2007
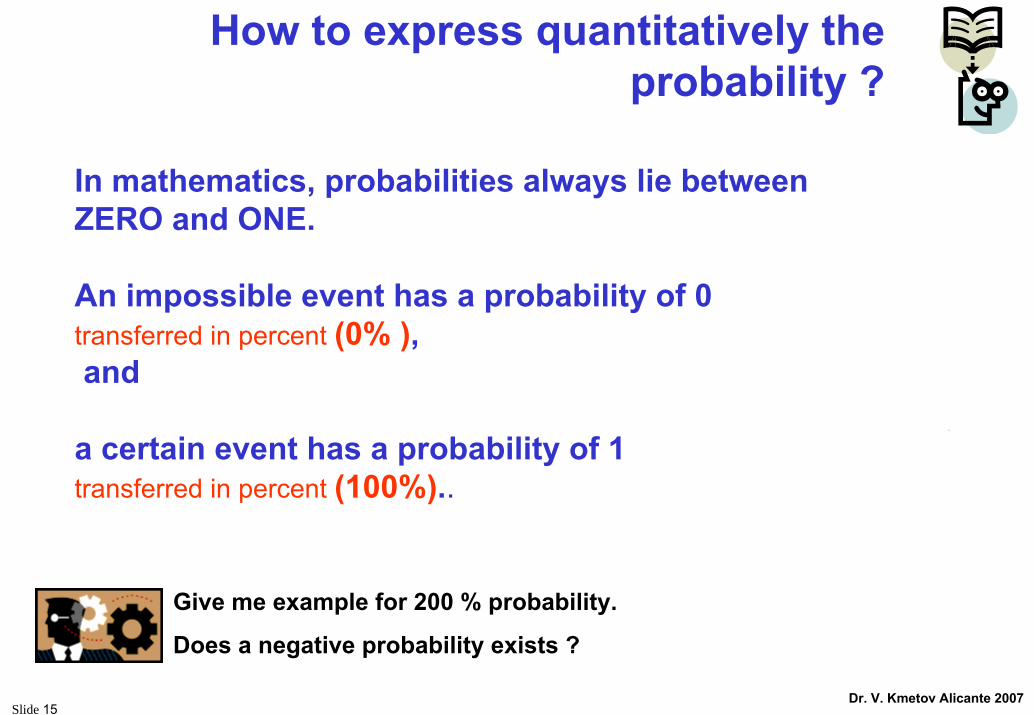
In mathematics, probabilities always lie betweenZERO and ONE.
An impossible event has a probability of 0transferred in percent (0% ),and
a certain event has a probability of 1 transferred in percent (100%)..
How to express quantitatively the probability ?
Give me example for 200 % probability.
Does a negative probability exists ?
Slide 16Dr. V. Kmetov Alicante 2007
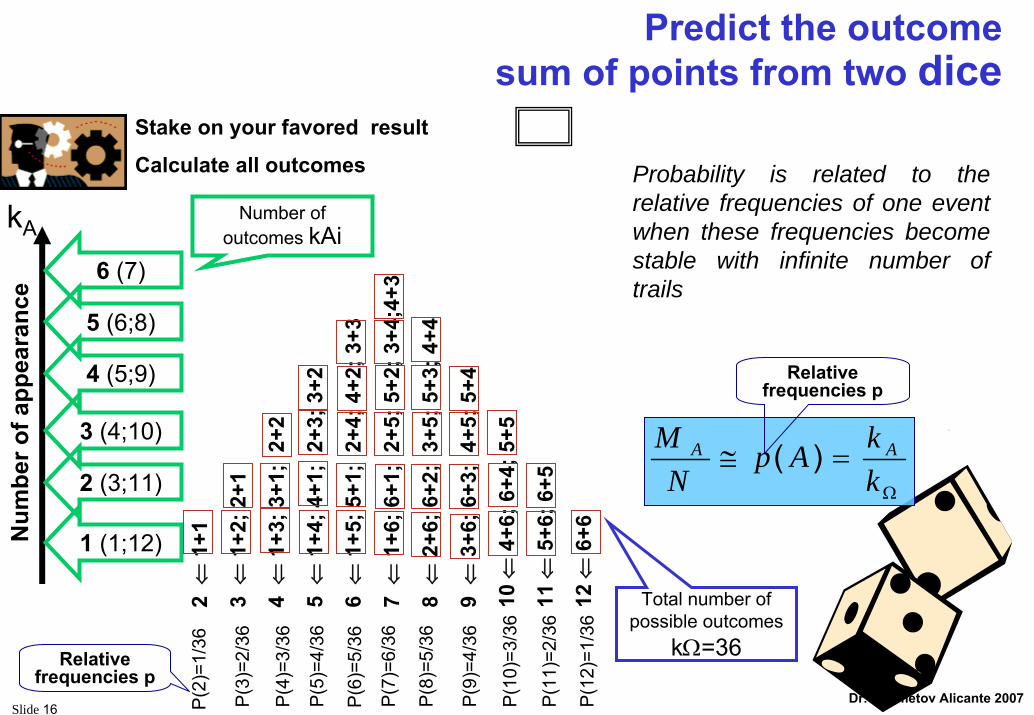
Predict the outcomesum of points from two dice
Calculate all outcomes
2 ⇐ 1+1
3 ⇐ 1+2; 2+1
4 ⇐ 1+3; 3+1; 2+2
5 ⇐ 1+4; 4+1; 2+3; 3+2
6 ⇐ 1+5; 5+1; 2+4; 4+2; 3+3
7 ⇐ 1+6; 6+1; 2+5; 5+2; 3+4; 4+3
8 ⇐ 2+6; 6+2; 3+5; 5+3; 4+4
9 ⇐ 3+6; 6+3; 4+5; 5+4
10 ⇐ 4+6; 6+4; 5+5
11 ⇐ 5+6; 6+5
12 ⇐ 6+6
Stake on your favored result
2 ⇐
1+1
3 ⇐
1+2;
2+1
4 ⇐
1+3;
3+1
; 2+
2
5 ⇐
1+4;
4+1
; 2+
3; 3
+2
6 ⇐
1+5;
5+1
; 2+
4; 4
+2; 3
+3
7 ⇐
1+6;
6+1
; 2+
5; 5
+2; 3
+4;4
+3
8 ⇐
2+6;
6+2
; 3+
5; 5
+3; 4
+4
9 ⇐
3+6;
6+3
; 4+
5; 5
+4
10 ⇐
4+6;
6+4
; 5+5
11 ⇐
5+6;
6+5
12 ⇐
6+6
1 (1;12)
2 (3;11)
3 (4;10)
4 (5;9)
5 (6;8)
6 (7)
Number of outcomes kAi
Total number of possible outcomes
kΩ=36
Ω
=≅kkAp
NM AA )(
kA
Num
ber o
f app
eara
nce
P(2
)=1/
36
P(3
)=2/
36
P(4
)=3/
36
P(5
)=4/
36
P(6
)=5/
36
P(7
)=6/
36
P(8
)=5/
36
P(9
)=4/
36
P(1
0)=3
/36
P(1
1)=2
/36
P(1
2)=1
/36
Relative frequencies p
Relative frequencies p
Probability is related to the relative frequencies of one event when these frequencies become stable with infinite number of trails

Slide 17Dr. V. Kmetov Alicante 2007
Aerosol dimensions
Probability density function р(Х)The curve of the relative frequency
number of counts normalized by the total number of events
Cumulative distribution function(probability function) x→ FX(x) = P (X≤ x)
∫+∞
∞−
==+∞−∞ 1)(.);( dXxpCP
∫∞−
=x
dXxpXF )()(
p(X) in %
p(X) in %
p(X) in %

Slide 18Dr. V. Kmetov Alicante 2007
dddpd
dddpdd
ii
ii
∫
∫∞
∞
=
0
2
0
3
23
)(
)(
,
Definitions for mathematical expectation and the dispersion:
Variable Mathematicalexpectation
Dispersion
Discrete M X p X Xk kk
( ) ( ) .==
∞
∑1
[ ]D X M X M X( ) ( )= − 2
Non discrete M X X p X dX( ) . ( )=−∞
+∞
∫ [ ]D X p X X M X dX( ) ( ) . ( )= −−∞
+∞
∫2
The dispersion (variance) of a variable is defined as the mathematical expectation of the squared difference of the variable’s value and its mathematical expectation
M(d) = 12,5 µm
D(d) = 1296 µm2
D(d)1/2 = 36 µm
Mo(d) = 18,5 µm

Slide 19Dr. V. Kmetov Alicante 2007
Variable characteristicsЕDTA treatment should be implemented to workers with Pb content in blood between 600 - 800 µg/L.
You have tested the lead content in blood in 1763 workers
Define the probability one worker in the factory like this, to need a treatment with ЕDTA
0
0,02
0,04
0,06
0,08
0,1
0,12
0,14
0,16
50 100
150
200
250
300
350
400
450
500
550
600
650
700
750
800
850
900
950
1000
1050
1100
0,00
0,20
0,40
0,60
0,80
1,00
1,20Series1p(X)
F(X)
Pb ug/L in whole blood
099,0)600()800()()800;600(800
600
=−== ∫ FFdXXpP
M(X) =
D(X) =
Mo(X) =
Md(X) =

Slide 20Dr. V. Kmetov Alicante 2007
Rectangular distribution
Плътност на вероятността на равномерното разпределение
0
0.25
0.5
0.75
1
0 2 4 6 X
p(X)
Графично представяне на равномерното разпределение
C=0,5a=2b=4
0
0.5
1
1.5
2
0 2 4 6X
F(X)
⎩⎨⎧
><≤≤
=bXaX
bXaCXp
,::
)(0
∫∫∫∫∫ =++=+∞
∞−
+∞
∞−
b
ab
b
a
a
CdxdxCdxdxdxXp 00)(
Density
Distribution function
2abXM −
=)(
abXp
−=
1)(
12
2)()( abXD −=
Particulars:
• All possible outcomes are with the same relative frequency, and densitykϖi=const, p(ϖi)=const
• The population Ω is defined between a and b
32abSus
−==
Density distribution functionCumulative distribution
function

Slide 21Dr. V. Kmetov Alicante 2007
RESULTS DESTRIBUTIONDistribution of distance measurements for proje
0
1
2
3
4
5
6
7
8
9
10
198.0
198.4
198.8
199.2
199.6
200.0
200.4
200.8
201.2
201.6
202.0
202.4
202.8
203.2
203.6
204.0
204.4
204.8
205.2
205.6
206.0
206.4
206.8
207.2
207.6
208.0
208.4
208.8
209.2
209.6
210.0
Distance (cm
Distribution of distance measurements for proje
0
1
2
3
4
5
6
7
8
9
10
11
12
13
14
15
198.0
198.4
198.8
199.2
199.6
200.0
200.4
200.8
201.2
201.6
202.0
202.4
202.8
203.2
203.6
204.0
204.4
204.8
205.2
205.6
206.0
206.4
206.8
207.2
207.6
208.0
208.4
208.8
209.2
209.6
210.0
Distance (cm
Distribution of distance measurements for proje
0
1
2
3
4
5
6
7
8
9
10
11
12
13
14
15
198.0
198.4
198.8
199.2
199.6
200.0
200.4
200.8
201.2
201.6
202.0
202.4
202.8
203.2
203.6
204.0
204.4
204.8
205.2
205.6
206.0
206.4
206.8
207.2
207.6
208.0
208.4
208.8
209.2
209.6
210.0
Distance (cm
Distribution of distance measurements for proje
0
5
10
15
20
25
30
35
198.0
198.4
198.8
199.2
199.6
200.0
200.4
200.8
201.2
201.6
202.0
202.4
202.8
203.2
203.6
204.0
204.4
204.8
205.2
205.6
206.0
206.4
206.8
207.2
207.6
208.0
208.4
208.8
209.2
209.6
210.0
Distance (cm
Distribution of distance measurements for proje
0
5
10
15
20
25
30
35
40
45
50
55
60
65
198.0
198.4
198.8
199.2
199.6
200.0
200.4
200.8
201.2
201.6
202.0
202.4
202.8
203.2
203.6
204.0
204.4
204.8
205.2
205.6
206.0
206.4
206.8
207.2
207.6
208.0
208.4
208.8
209.2
209.6
210.0
Distance (cm
Distribution of distance measurements for proje
0
50
100
150
200
250
300
198.0
198.4
198.8
199.2
199.6
200.0
200.4
200.8
201.2
201.6
202.0
202.4
202.8
203.2
203.6
204.0
204.4
204.8
205.2
205.6
206.0
206.4
206.8
207.2
207.6
208.0
208.4
208.8
209.2
209.6
210.0
Distance (cm
N = 50
N = 20 N = 100
N = 300
N = 200
N = 500
UNIVERSAL MODEL
Slide 22Dr. V. Kmetov Alicante 2007
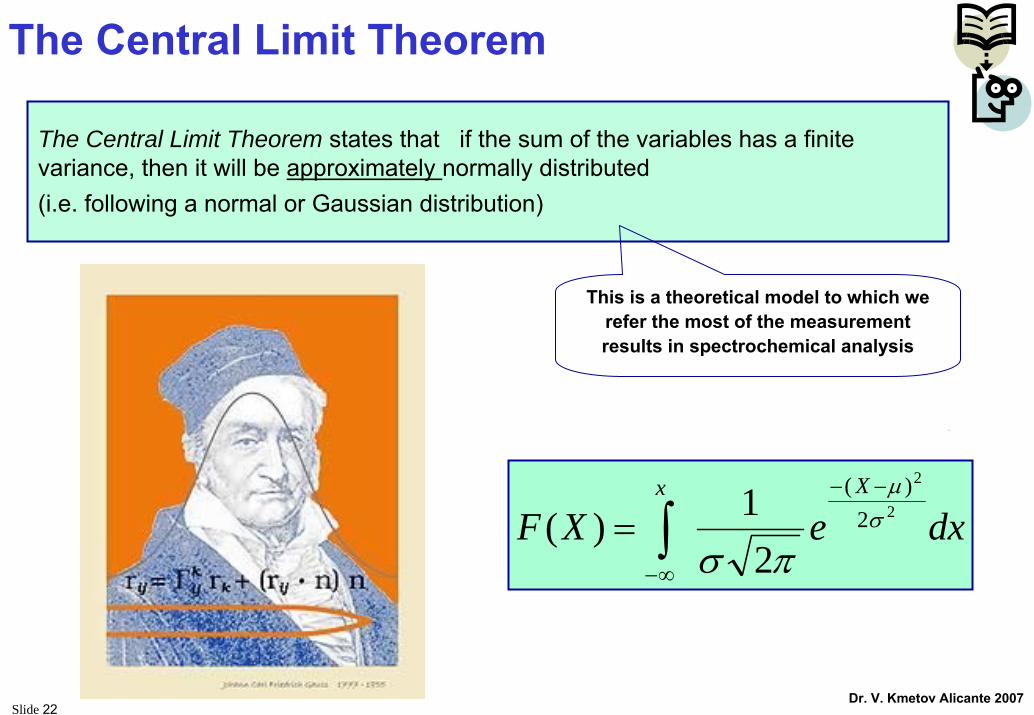
The Central Limit Theorem
The Central Limit Theorem states that if the sum of the variables has a finitevariance, then it will be approximately normally distributed(i.e. following a normal or Gaussian distribution)
dxeXFXx
2
2
2)(
21)( σ
μ
πσ
−−
∞−∫=
This is a theoretical model to which we refer the most of the measurement results in spectrochemical analysis
Slide 23Dr. V. Kmetov Alicante 2007
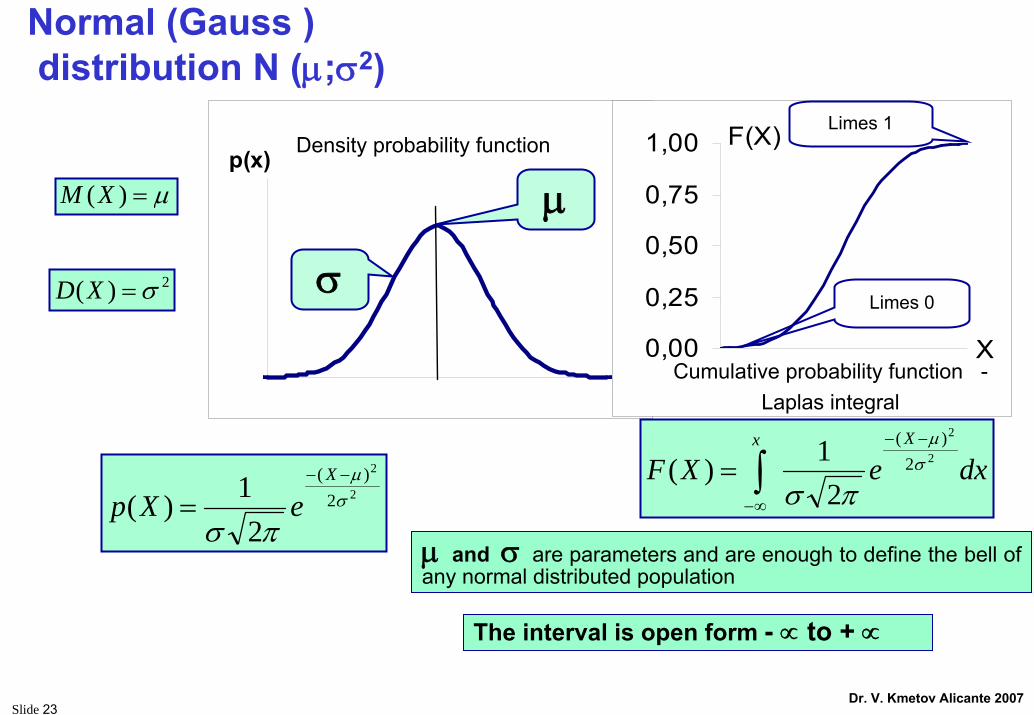
Normal (Gauss )distribution N (μ;σ2)
μ=)(XM
2)( σ=XD
Плътност на нормалното разпределение
X
p(x)
0,00
0,25
0,50
0,75
1,00
X
F(X)
2
2
2)(
21)( σ
μ
πσ
−−
=X
eXpdxeXF
Xx2
2
2)(
21)( σ
μ
πσ
−−
∞−∫=
Cumulative probability function -Laplas integral
σ
μ and σ are parameters and are enough to define the bell of any normal distributed population
Limes 0
Limes 1
The interval is open form - ∝ to + ∝
Density probability function
μ
Slide 24Dr. V. Kmetov Alicante 2007
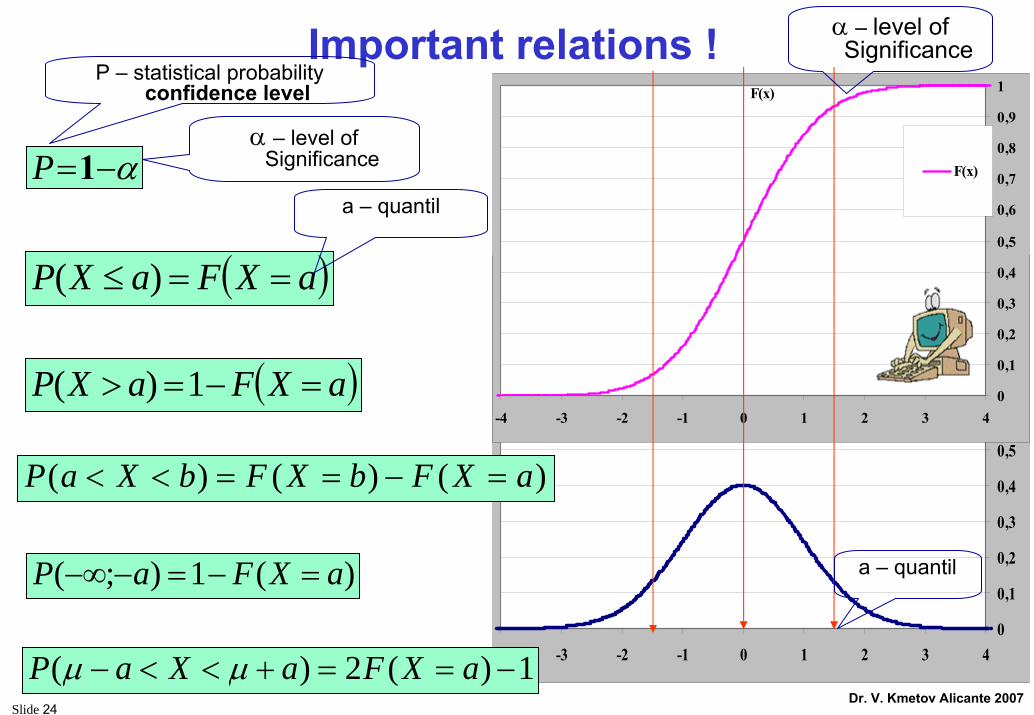
Important relations !
)(1);( aXFaP =−=−−∞
( )aXFaXP ==≤ )(
( )aXFaXP =−=> 1)(
α−=1P
P(x)
0
0,1
0,2
0,3
0,4
0,5
0,6
0,7
0,8
0,9
1
-4 -3 -2 -1 0 1 2 3 4
F(x)
0
0,1
0,2
0,3
0,4
0,5
0,6
0,7
0,8
0,9
1
-4 -3 -2 -1 0 1 2 3 4
F(x)
)()()( aXFbXFbXaP =−==<<
1)(2)( −==+<<− aXFaXaP μμ
Р – statistical probabilityconfidence level
α – level of Significance
а – quantil
а – quantil
α – level of Significance
Slide 25Dr. V. Kmetov Alicante 2007
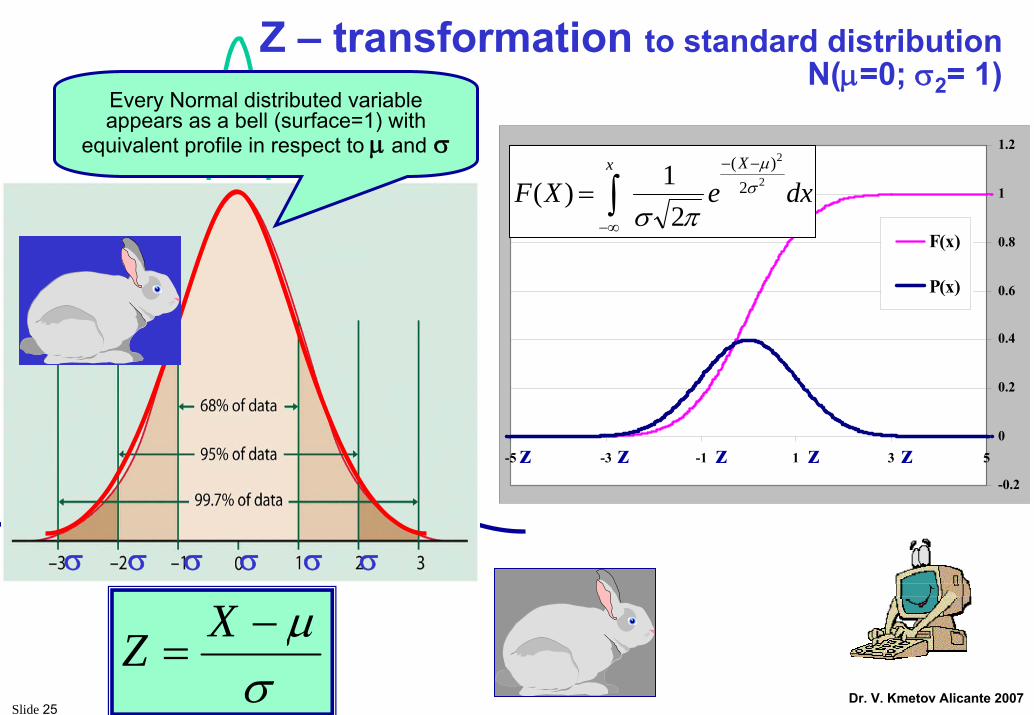
Z – transformation to standard distributionN(μ=0; σ2= 1)
-0.2
0
0.2
0.4
0.6
0.8
1
1.2
-5 -3 -1 1 3 5
F(x)
P(x)
dxeXFXx
2
2
2)(
21)( σ
μ
πσ
−−
∞−∫=
σ σ σ σ σ σ
σμ−
=XZ
zzzzz
Every Normal distributed variable appears as a bell (surface=1) with
equivalent profile in respect to μ and σ

Slide 26Dr. V. Kmetov Alicante 2007
STATISTICS ESTIMATIONS (unbiesed and consistent)
Parameters of the general
population
Mathematicestimation
Dispersion
μ
σ2
Parameters of the normal
distribution
X
S2
Statistical estimations of a sample
( )∑=
=n
iix
nX
1
1
Arithmeticmean
( )( )1
2
−
−=∑
N
XXS i
Sample Standard Deviation
M(X)
D(X)
With Р = (1-α) the true value lies in the interval :
( ) ( )N
SftXN
SftX .,., αμα+<<−

Slide 27Dr. V. Kmetov Alicante 2007
t-distribution William Sealey Gosset
1908
Slide 28Dr. V. Kmetov Alicante 2007
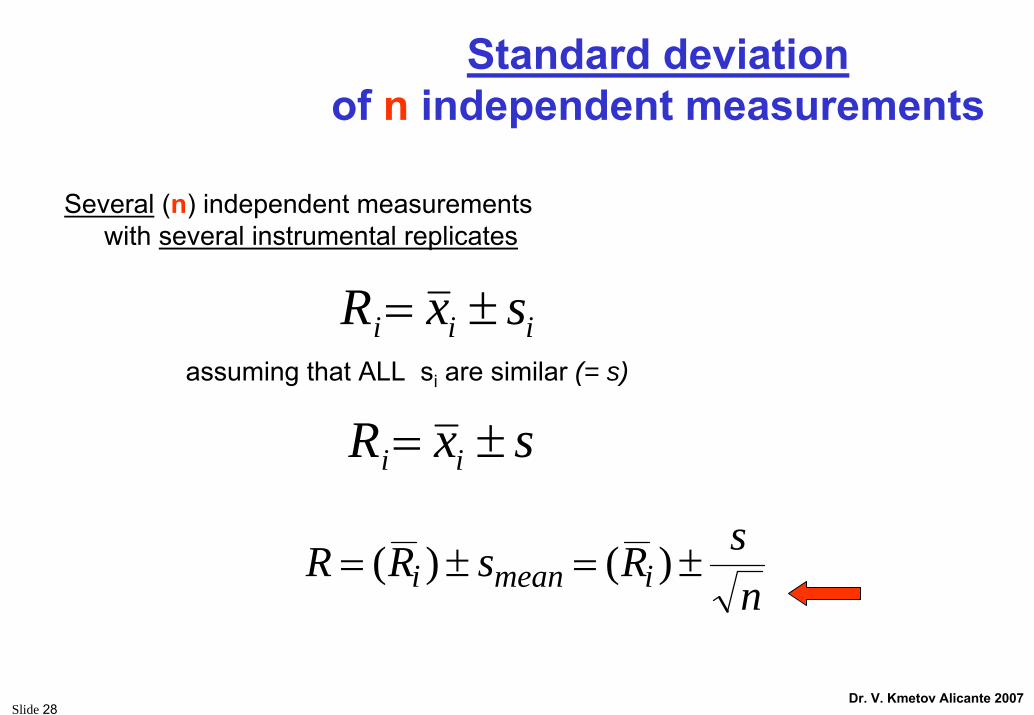
iii sxR ±=
Several (n) independent measurements with several instrumental replicates
Standard deviationof n independent measurements
assuming that ALL si are similar (= s)
sxR ii ±=
nsRsRR imeani ±=±= )()(
Slide 29Dr. V. Kmetov Alicante 2007
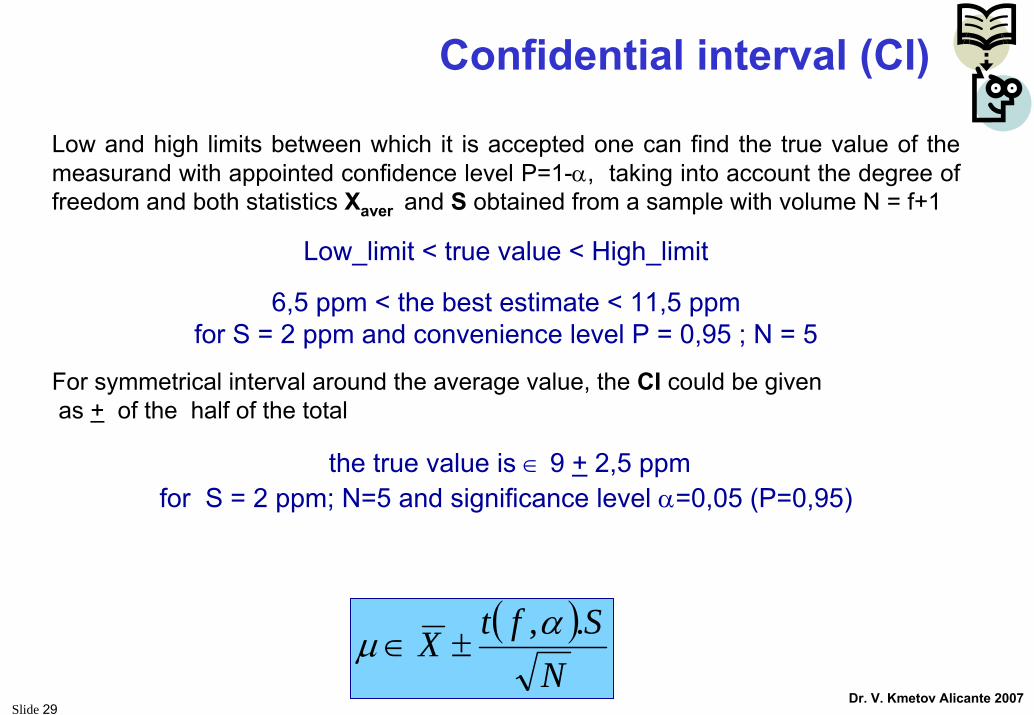
Confidential interval (CI)
Low and high limits between which it is accepted one can find the true value of the measurand with appointed confidence level P=1-α, taking into account the degree of freedom and both statistics Xaver and S obtained from a sample with volume N = f+1
Low_limit < true value < High_limit
6,5 ppm < the best estimate < 11,5 ppm for S = 2 ppm and convenience level P = 0,95 ; N = 5
For symmetrical interval around the average value, the CI could be givenas + of the half of the total
the true value is ∈ 9 + 2,5 ppm for S = 2 ppm; N=5 and significance level α=0,05 (P=0,95)
( )N
SftX .,αμ ±∈

Slide 30Dr. V. Kmetov Alicante 2007
Define the measurand interval
ppm
Content of Au in gold ore in ppm
?(μ - 3σ < x < μ + 3σ)
(Ẍ - U < x < Ẍ + U) ; k=2
Limit value
Confidence levelР
significanceα
( ) ( )N
SftXN
SftX .,., αμα+<<−
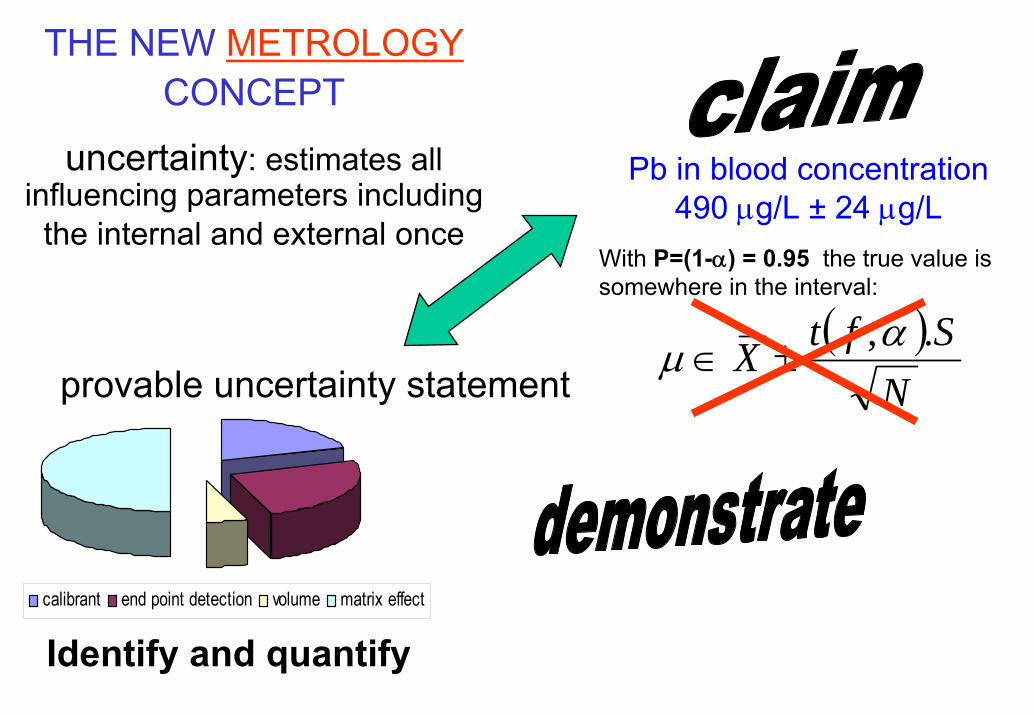
THE NEW METROLOGYCONCEPT
uncertainty: estimates all influencing parameters including
the internal and external onceWith Р=(1-α) = 0.95 the true value is somewhere in the interval:
( )N
SftX .,αμ ±∈
Pb in blood concentration490 μg/L ± 24 μg/L
calibrant end point detection volume matrix effect
Identify and quantify
provable uncertainty statement

Uncertainty of Uncertainty of Measurement Results Measurement Results
Quality of measurement
result
Validation ( method fit-for-purpose )
Uncertainty Budget(How well I know the result )
Traceability(my result is comparable- common reference)

Slide 33Dr. V. Kmetov Alicante 2007
Overview
• Definitions
• Uncertainty - what for?
• GUM procedure for uncertainty evaluation
• 10 Steps of uncertainty budgeting
• Kragten spread-sheet approach
• Examples

Slide 34Dr. V. Kmetov Alicante 2007
The GUM approach -difference between error and uncertainty
+U-U
YA
YA
Ytrue value
E error
Ycor.
• GUM is guide for a transparent, simple and standardised documentation of the measurement procedure
• Use uncertainty evaluations, such as type A (measured in the lab) and type B
(other)
Do NOT use random & systematic errors !
⌧The uncertainty cannot be used to correct a measurement result !
Before the GUM reliability of the measurements - by inconsistent or not generally accepted methods most
based on an error-centered view.
In the GUM, a value of the measurand only exists as a result of an estimation process, usually called experiment, measurement or chemical analysis
The error - the difference between the unknown true value and the the actual measurement result.
It is a single value, so the known error can be applied as a correction to the result

Slide 35Dr. V. Kmetov Alicante 2007
TOTAL UNCERTAINTY
Every PROCESS predetermines a PRODUCT
Every PRODUCT possess characteristics – qualities
Every quantitatively defined characteristics can be measured
the total uncertainty:
Dispersion of the product characteristics+
Dispersion of the measurement procedure_____________________________________________________
= total dispersion -> UNCERTAINTY
Slide 36Dr. V. Kmetov Alicante 2007
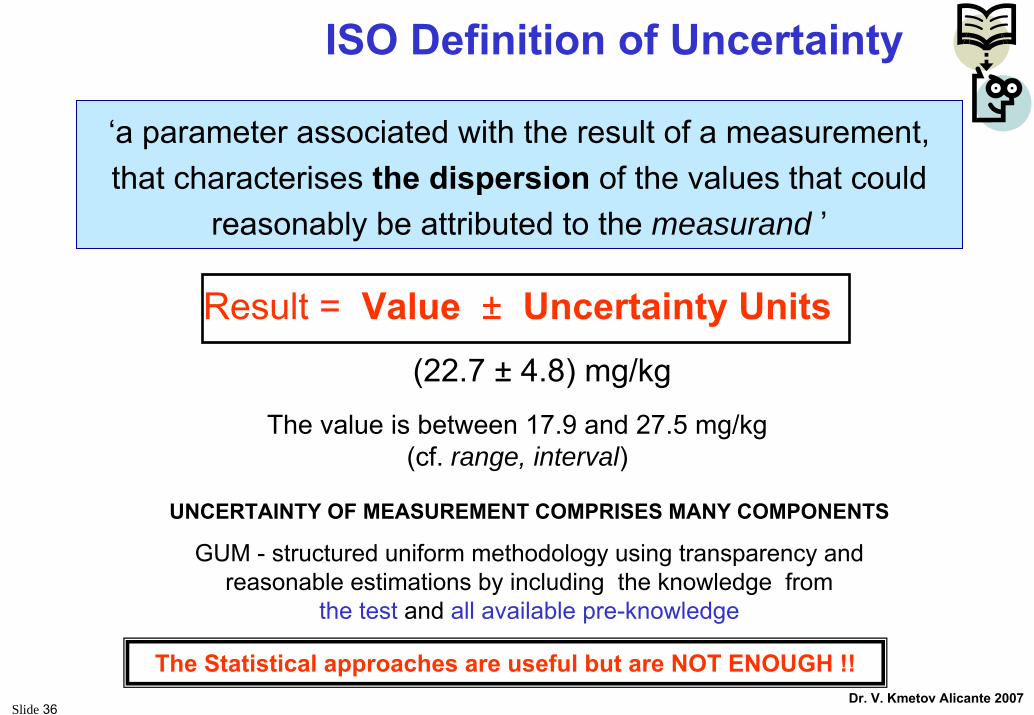
ISO Definition of Uncertainty
Result = Value ± Uncertainty Units(22.7 ± 4.8) mg/kg
The value is between 17.9 and 27.5 mg/kg (cf. range, interval)
UNCERTAINTY OF MEASUREMENT COMPRISES MANY COMPONENTS
GUM - structured uniform methodology using transparency and reasonable estimations by including the knowledge from
the test and all available pre-knowledge
The Statistical approaches are useful but are NOT ENOUGH !!
‘a parameter associated with the result of a measurement, that characterises the dispersion of the values that could
reasonably be attributed to the measurand ’

Slide 37Dr. V. Kmetov Alicante 2007
GUM (1995) amended (1995): ISO Guide on the expression of Uncertainty in Measurements
EURACHEM/CITAC
http://www.eurachem.ul.pt/guides/QUAM2000-1.pdf
Guide Quantifying Uncertainty in Analytical Measurement, 2000
Slide 38Dr. V. Kmetov Alicante 2007
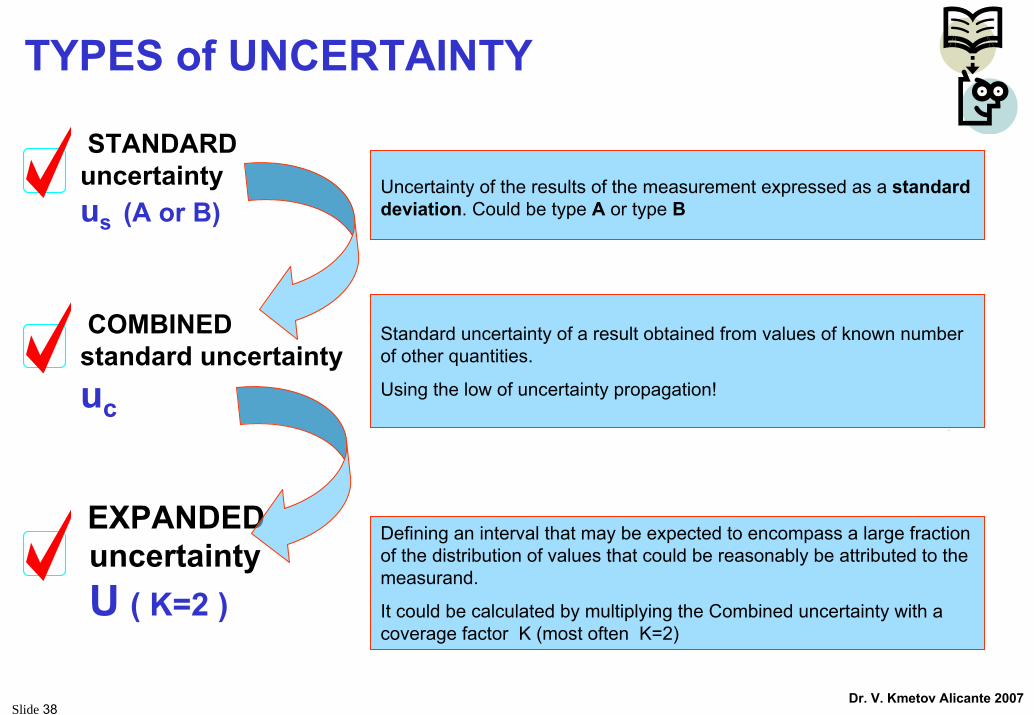
TYPES of UNCERTAINTY
STANDARDuncertainty us (A or B)
COMBINED standard uncertainty uc
EXPANDED uncertaintyU ( K=2 )
Uncertainty of the results of the measurement expressed as a standard deviation. Could be type A or type B
Standard uncertainty of a result obtained from values of known number of other quantities.
Using the low of uncertainty propagation!
Defining an interval that may be expected to encompass a large fraction of the distribution of values that could be reasonably be attributed to the measurand.
It could be calculated by multiplying the Combined uncertainty with a coverage factor K (most often K=2)
Slide 39Dr. V. Kmetov Alicante 2007
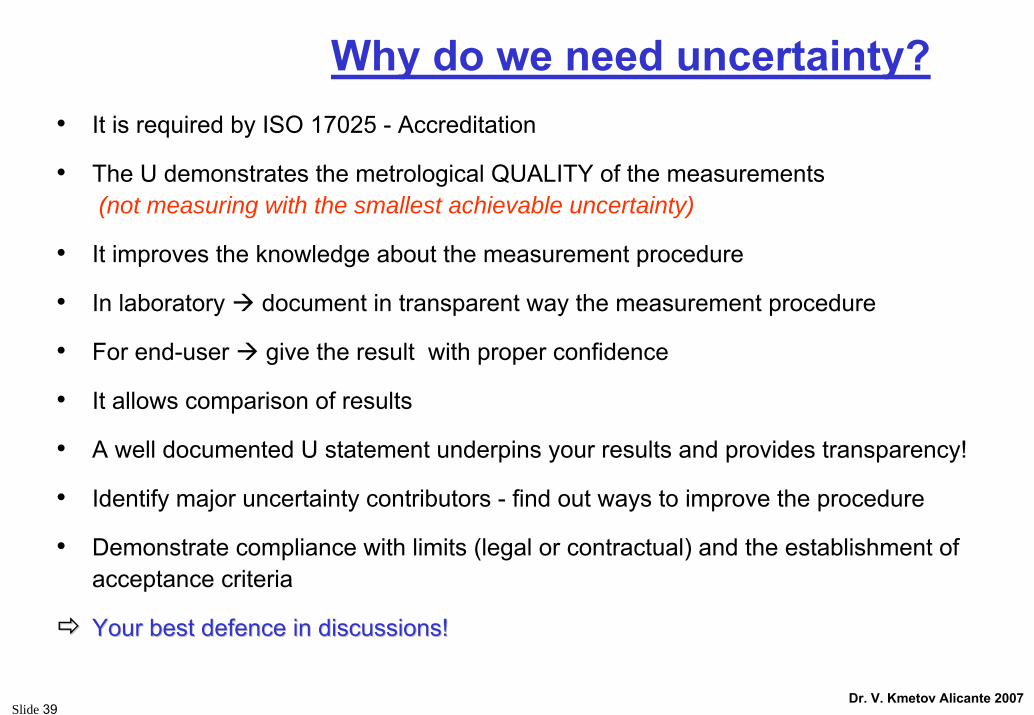
Why do we need uncertainty?• It is required by ISO 17025 - Accreditation
• The U demonstrates the metrological QUALITY of the measurements(not measuring with the smallest achievable uncertainty)
• It improves the knowledge about the measurement procedure
• In laboratory document in transparent way the measurement procedure
• For end-user give the result with proper confidence
• It allows comparison of results
• A well documented U statement underpins your results and provides transparency!
• Identify major uncertainty contributors - find out ways to improve the procedure
• Demonstrate compliance with limits (legal or contractual) and the establishment of acceptance criteria
Your best defence in discussions!Your best defence in discussions!

Slide 40Dr. V. Kmetov Alicante 2007
When should you evaluate uncertainties of measurement results ?
• When a procedure is introduced inside your laboratory
• When a critical factor changes in the procedure (instrument, operator, …)
• During / together with procedure validation
An individual evaluation process is NOT needed for every individual result produced !
Repeating the measurement 2, 10 or 100 times does not giveyou all information to have reliable results!

Slide 41Dr. V. Kmetov Alicante 2007
Sr
Be
Pb
Cr
Fe
Co
Ni
Bi
U
Mg
Ba
V
Ti
Cd
Zn
As
MnAl
Ca
Na
Cu
0.1
1.0
10.0
100.0
1000.0
10000.0
100000.0
Elem
ent c
once
ntra
tion
(mg/
kg)
IS Ge IS Rh IS Er
V. Kmetov, V. Stefanova, D. Hristozov, D. Georgieva, A. Canals+Talanta Volume 59, 1 (2003) 123-136Determination of calcium, iron and manganese in moss by automated discrete samplingFAAS as an alternative to the ICP-MS analysis 62 moss samples 21 elements

Slide 42Dr. V. Kmetov Alicante 2007
Are results different?
No results without uncertainty !R1 = 20.6 mg/kgR2 = 21.6 mg/kg
• Traditional approach: precisionR1 = (20.6 ± 0.6) mg/kgR2 = (21.6 ± 0.7) mg/kg
• GUM approach: uncertainty propagation (combined unc.)to take into account the contribution of all components
R1 = (20.6 ± 2.1) mg/kgR2 = (21.6 ± 2.3) mg/kg
No statistical tests required by GUM (almost) …/…
cf. Visual comparison overlapping ranges Y/N ?

Slide 43Dr. V. Kmetov Alicante 2007
Lab A Lab B
After uncertainty evaluation
Lab A Lab B
No uncertainty evaluation(only precision)
Lab A Lab B
20.5
21.5
21.0
22.0
22.5
mg
kg-1
value
Are these results different?

Slide 44Dr. V. Kmetov Alicante 2007
GUM does not require statistical tests unless you need it …
“…The evaluation of uncertainty is neither a routine task nor a purely mathematical one; it depends on detailed knowledge of the nature of the measurand and of measurement…”
[GUM § 3.4.8]
Understanding the measurement !
What do you need to know ?
some basic statistics• average of the set of data;• standard deviation;• law of propagation; • distribution (normal, rectangular, triangular…)

Slide 45Dr. V. Kmetov Alicante 2007
Type A standard uncertainty is measured from repeatability experiments and is quantified in terms of the standard deviation of the measured values
Type B evaluation of uncertainty: by other means than statistical analysis
[GUM, 1993]
Uncertainty “Type”
“…The pool of information may include:previous measurement data;validation dataexperience with or general knowledge of the behaviour and properties of relevant materials and instruments;manufacturer’s specificationsdata provided in calibration and other certificates;uncertainty assigned to reference data taken from handbooks”
[GUM § 4.3.1]

Slide 46Dr. V. Kmetov Alicante 2007
The 10-steps GUM Sequence
1 - Define the Measurand
2 - Describe the Model Equation (for the measurement procedure)
3 - Identify (all possible) sources of uncertainty
4 - Evaluate all input quantities
5 - Evaluate the standard uncertainty (1s) of each input quantities
6 - Calculate the value of the measurand (using the equation model)
7 - Calculate the combined standard uncertainty of the result
8 - Calculate the expanded uncertainty (with a selected k)
9 - Analyse the uncertainty contribution index (THINK !!)10- Document all steps in a Report.

Slide 47Dr. V. Kmetov Alicante 2007
Determination of Nitrate (mg/g)by UV-VIS Spectrometry
in Plant material
Sample treatment
• Sample weighing, m• Extraction, R
• Preparing the sample solution, VNO3-
• Dilution of the sample solution, fdi
Preparing the standard solution, Cst
Instrumental measurement, ANO3-
Instrumental measurement, Ast
Calculation of the result, QNO3-
Experimental Protocol

Slide 48Dr. V. Kmetov Alicante 2007
Step 1 - Definition of “Measurand”
In this example: content of NO3- in (mg/g) in fresh
plant material (lettuces)
Analyte: Article that is the subject of a measurement (GLP)e.g. cholesterol; Au ;Pb
Measurand: Particular quantity subject to measurement (VIM,2.6)
e.g. concentration of cholesterol in serum; Au in gold alloy; Pb in whole blood
Slide 49Dr. V. Kmetov Alicante 2007
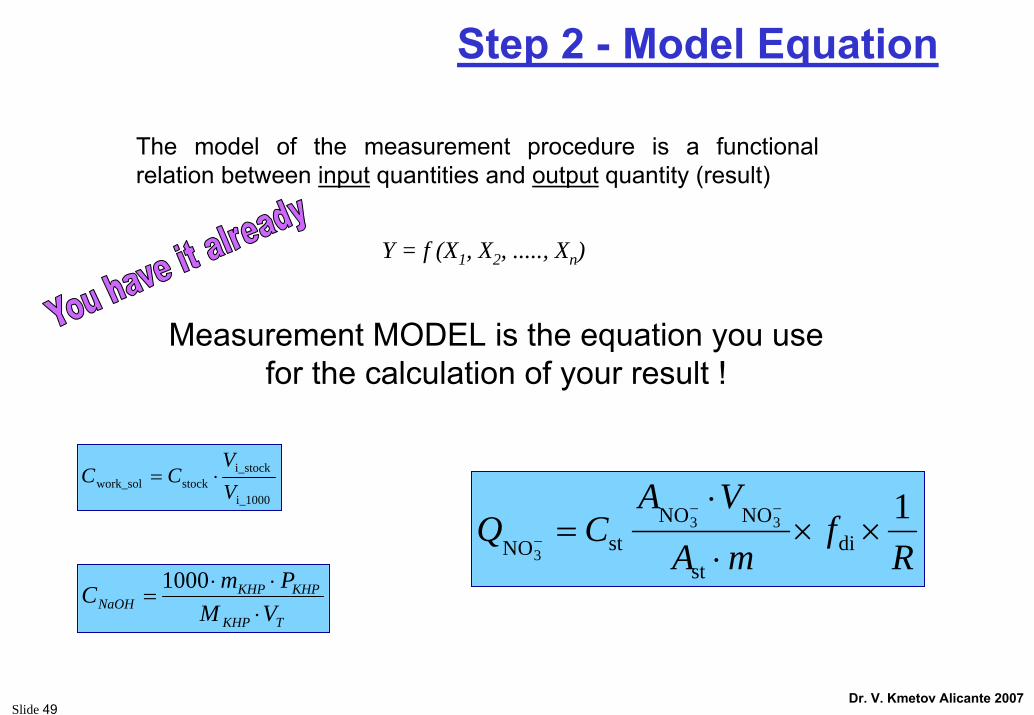
Step 2 - Model Equation
The model of the measurement procedure is a functional relation between input quantities and output quantity (result)
Y = f (X1, X2, ....., Xn)
Measurement MODEL is the equation you use for the calculation of your result !
Rf
mA
VACQ 1
dist
NONOstNO
33
3××
⋅
⋅=
−−
−
i_1000
i_stockstockwork_sol V
VCC ⋅=
TKHP
KHPKHPNaOH VM
PmC⋅⋅⋅
=1000

Slide 50Dr. V. Kmetov Alicante 2007
What are input quantities?
The output quantity Y depends on input quantities X1, X2, …, Xn :
Y = f (X1, X2, ....., Xn) [GUM 4.1.2]
Input quantities (Xi) may be quantities whose value and uncertainty
are directly determined in the current measurement (Type A,
statistical analysis of series of observation) or brought into the
measurement from external sources (Type B, previous experiments,
literature data, information from manufacturer )

Slide 51Dr. V. Kmetov Alicante 2007
Model Equation
QNO3- nitrate content of the sample (mg/g)Cst nitrate concentration in standard solution (mg/l)ANO3- intensity of the signal (AP) for sample solutionAst intensity of the signal (AP) for standard solutionVNO3- volume of sample solution ( l )m mass of the sample (g)fdi dilution factor (no units); R recovery factor (cf. sample preparation)
Rf
mA
VACQ 1
dist
NONOstNO
33
3××
⋅
⋅=
−−
−

Slide 52Dr. V. Kmetov Alicante 2007
Step 3 - Possible Sources of Uncertainty
recovery of analyte from a complex matrix
storage conditions
reagent purity
assumed stoichiometry
sampling
measurement conditions
instrument response
bias of instrument
instrument resolution
uncertainty of standards and CRM’s
variations in repeated observations

Slide 53Dr. V. Kmetov Alicante 2007
Step 3 - Possible Sources of Uncertainty
QNO3-
Standardconcentration, Cst
Recovery, R
Samplemass, m
Signal ofSample, ANO3
Purity
Standard mass
Volume, VNO3
balance calibration
GlasswareCertificate
Temperature
balance calibration
Instrumentcalibration
Signal ofStandard, Ast
Signal Stability
Collection of operations
Rf
mA
VACQ 1
dist
NONOstNO
33
3××
⋅
⋅=
−−
−

Slide 54Dr. V. Kmetov Alicante 2007
Step 4 - Input Quantities Uncertainty (evaluation type A & B)
• repeated observation (A)
• validation experiments (A and/or B)
• manufacturers’ specifications (B)
• calibration certificates (B)
• results of interlaboratory method validations (B)
• from experience and/or literature (B)

Slide 55Dr. V. Kmetov Alicante 2007
Freq
uenc
y
± 1 s
± 2 s
Step 5 - Convert to Standard Uncertainties
Before combining, all uncertainty contributions must be expressed/converted as “estimated” standard uncertainty
when available as:
– standard deviation: use as is
– confidence intervals: convert
– stated range: convert
– expanded uncertainties: convert
But what is Δx ?
xxR Δ±= S

Slide 56Dr. V. Kmetov Alicante 2007
The Value is between the limits
The expectation
Assumed standard deviation:
3/as =
+− aa K
1/2a
2a(= ± a)
X
axy ±=
Rectangular distribution
One can only assume that it is equally probable for the value to lie anywhere within the interval
32abSus
−==

Slide 57Dr. V. Kmetov Alicante 2007
“It is likely that the value is somewhere in that range”
Rectangular distribution is usually described in terms of:the average value and the range (±a)
Certificates or other specification give limits where the value could be, without specifying a level of confidence (or degree of freedom).
The purity of the cadmium is given on the certificate as (99.99 ± 0.01) %Assuming rectangular distribution the standard uncertainty is:
%0058.03/01.03/)( ==== axus
Example of Rectangular distribution
lmgaxus /16.13/23/)( ====
Examples:Concentration of calibration standard is quoted as (1000 ± 2) mg/lAssuming rectangular distribution the standard uncertainty is:
Slide 58Dr. V. Kmetov Alicante 2007
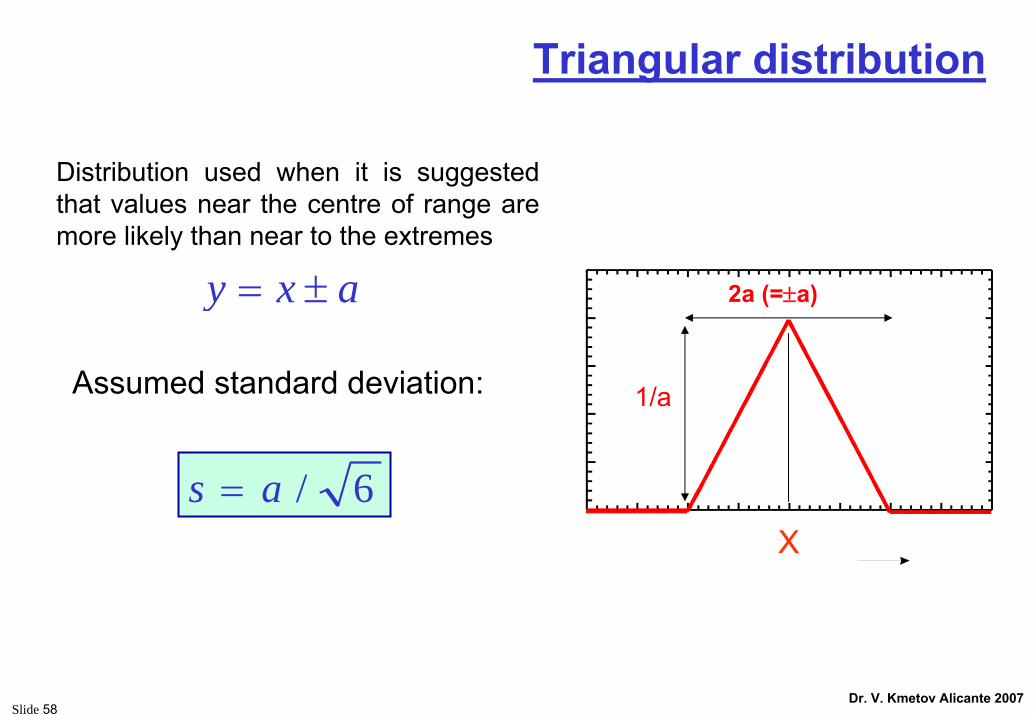
6/as =
Distribution used when it is suggested that values near the centre of range are more likely than near to the extremes
Assumed standard deviation:
2a (=±a)
1/a
X
axy ±=
Triangular distribution

Slide 59Dr. V. Kmetov Alicante 2007
Values close to x are more likely than near the boundaries
The available information concerning the value is less limited than for rectangular distribution.
Example (volumetric glassware)
The manufacture quotes a volume for the flask of (100 ± 0.1) ml at T = 20° C.
Nominal value most probable!Assuming triangular distribution the standard uncertainty is:
mlaxus 04.06/1.06/1)( ==⋅==
Example of Triangular distribution
In case of doubt, use the rectangular distribution

Slide 60Dr. V. Kmetov Alicante 2007
Step 6 - Calculate Value of Measurand
Use model equation to calculate the value of output quantity Y (QNO3-)
78.0110
142.10232.01000.00131.0801.0
3NO××
××
×=−Q
gmgQ /508.03NO=−
Rf
mA
VACQ 1
dist
NONOstNO
33
3××
⋅
⋅=
−−
−

Slide 61Dr. V. Kmetov Alicante 2007
When there is no correlation between input quantitiesthe combined standard uncertainty is evaluated as the square root of the combined variance according to:
Step 7 - Combined Standard Uncertainty
( )22
2 )()( ii
c XuXfYu ⋅⎟⎟⎠
⎞⎜⎜⎝
⎛∂∂
= ∑
Can be done by spreadsheet or by dedicated software!
whereuc(Y) = combined standard uncertaintyu(Xi) = standard uncertainty of each input quantity
Law of Uncertainty propagation

Slide 62Dr. V. Kmetov Alicante 2007
Law of “Uncertainty Propagation”without correlation
22 )()()( buauCu +=)()(
baCbaC
−=+=
Y = f (X1, X2, ....., Xn)
( )22
2 )()( ii
c XuXfYu ⋅⎟⎟
⎠
⎞⎜⎜⎝
⎛∂∂
= ∑
)/()(
baCbaC
=∗= 22 )()()(
⎟⎠⎞
⎜⎝⎛+⎟
⎠⎞
⎜⎝⎛=
bbu
aau
CCu
Slide 63Dr. V. Kmetov Alicante 2007
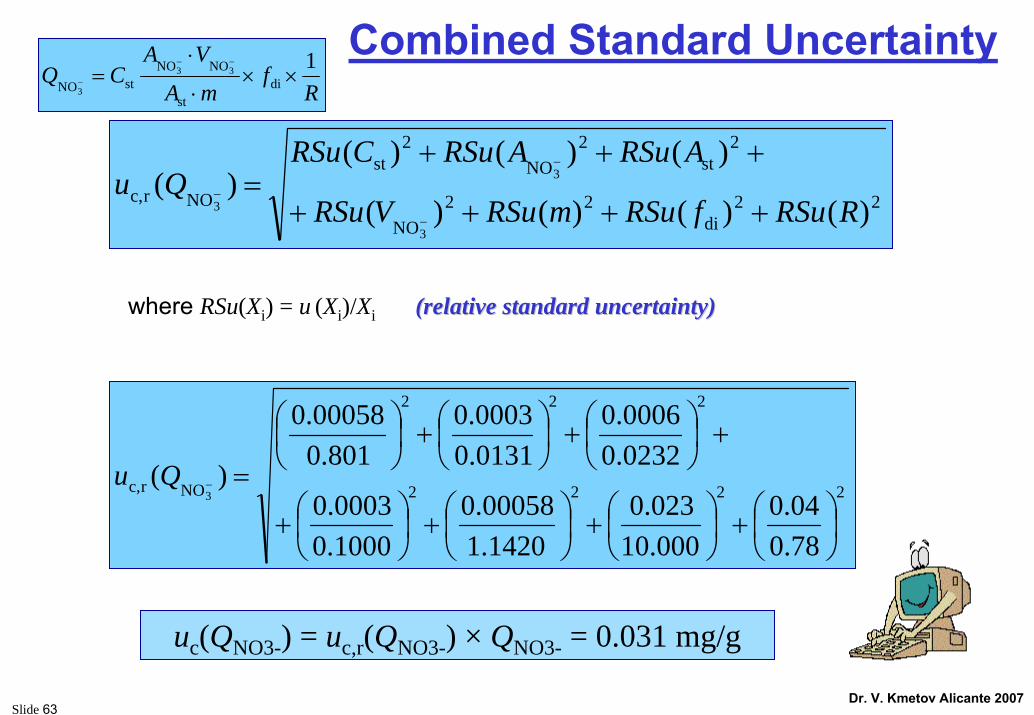
Combined Standard Uncertainty
where RSu(Xi) = u (Xi)/Xi (relative standard uncertainty)(relative standard uncertainty)
22di
22NO
2st
2NO
2st
NOrc, )()()()(
)()()()(
3
3
3 RRSufRSumRSuVRSu
ARSuARSuCRSuQu
++++
+++=
−
−
−
2222
222
NOrc,
78.004.0
000.10023.0
1420.100058.0
1000.00003.0
0232.00006.0
0131.00003.0
801.000058.0
)(3
⎟⎠⎞
⎜⎝⎛+⎟
⎠⎞
⎜⎝⎛+⎟
⎠⎞
⎜⎝⎛+⎟
⎠⎞
⎜⎝⎛+
+⎟⎠⎞
⎜⎝⎛+⎟
⎠⎞
⎜⎝⎛+⎟
⎠⎞
⎜⎝⎛
=−Qu
uc(QNO3-) = uc,r(QNO3-) × QNO3- = 0.031 mg/g
Rf
mA
VACQ 1
dist
NONOstNO
33
3××
⋅
⋅=
−−
−

Slide 64Dr. V. Kmetov Alicante 2007
RSD stdev value description?? 0,02 2,46 X1
3,0% ?? 4,32 X2?? 0,11 6,38 X3
2,3% ?? 2,99 X4
RSD stdev value description0,8% 0,02 2,46 X13,0% 0,13 4,32 X21,7% 0,11 6,38 X32,3% 0,07 2,99 X4
RSD stdev value description0,8% 0,02 2,46 X13,0% 0,13 4,32 X21,7% 0,11 6,38 X32,3% 0,07 2,99 X4
?? ?? 0,557 Result
Model: Y = X1 * X2 / (X3 * X4) part 1
Kragten approach

Slide 65Dr. V. Kmetov Alicante 2007
RSD stdev value description X1 X2 X3 X40,8% 0,02 2,46 X1 2,46 2,46 2,463,0% 0,13 4,32 X2 4,32 4,32 4,321,7% 0,11 6,38 X3 6,38 6,38 6,382,3% 0,07 2,99 X4 2,99 2,99 2,99
?? ?? 0,557 Result
RSD stdev value description X1 X2 X3 X40,8% 0,02 2,46 X1 2,48 2,46 2,46 2,463,0% 0,13 4,32 X2 4,32 4,45 4,32 4,321,7% 0,11 6,38 X3 6,38 6,38 6,49 6,382,3% 0,07 2,99 X4 2,99 2,99 2,99 3,06
0,557 Result 0,562 0,574 0,548 0,544
x+Δx
diff 0,005 0,017 -0,009 -0,013 0,001
sumsq(diffi)
4,2% 0,024
Model: Y = X1 * X2 / (X3 * X4) part 2
( )∑ −=i ic yyu 2
Kragten approach

Slide 66Dr. V. Kmetov Alicante 2007
Model: Y = X1 * X2 / (X3 * X4) part 3
RSD stdev value description X1 X2 X3 X40,8% 0,02 2,46 X1 2,48 2,46 2,46 2,463,0% 0,13 4,32 X2 4,32 4,45 4,32 4,321,7% 0,11 6,38 X3 6,38 6,38 6,49 6,382,3% 0,07 2,99 X4 2,99 2,99 2,99 3,064,2% 0,024 0,557 Result 0,562 0,574 0,548 0,544
diff 0,005 0,017 -0,009 -0,013 0,001
index 3,7% 50,8% 16,1% 29,4% 100,0%sum
( )∑ −
−=
i i
i
yyyyindex 2
2)(X1
X2
X3
X4
Major Contributor :
• Type B?• Type A?☺• Replicates?• Much work?• Control Charts?
Kragten approach
Slide 67Dr. V. Kmetov Alicante 2007
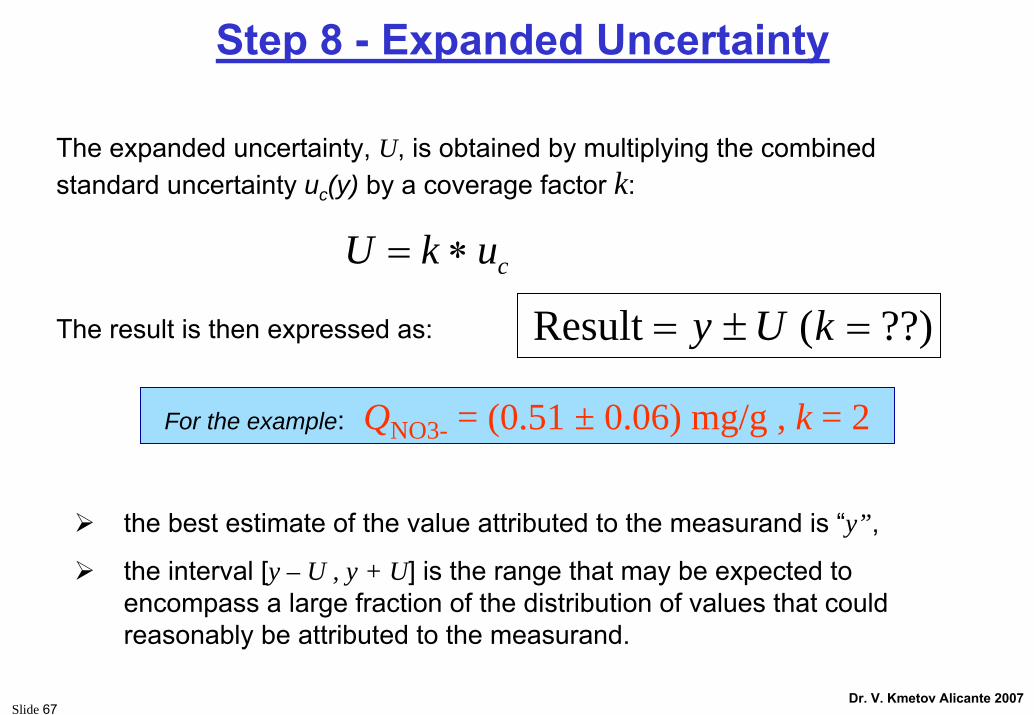
Step 8 - Expanded Uncertainty
The expanded uncertainty, U, is obtained by multiplying the combined standard uncertainty uc(y) by a coverage factor k:
cukU ∗=
The result is then expressed as: ??)(Result =±= kUy
the best estimate of the value attributed to the measurand is “y”,
the interval [y – U , y + U] is the range that may be expected to encompass a large fraction of the distribution of values that could reasonably be attributed to the measurand.
For the example: QNO3- = (0.51 ± 0.06) mg/g , k = 2

Slide 68Dr. V. Kmetov Alicante 2007
Standard uncertainty should be used inside the laboratory(to apply uncertainty propagation)
Expanded uncertainty is more realistic range given for the end-users of the results
Expanded uncertainty gives a more realistic range of possible values.
The coverage factor usually used is k = 2, representing a coverage of about 95%, if the distribution is normal
Step 8 - Expanded Uncertainty (2)

Slide 69Dr. V. Kmetov Alicante 2007
Step 10 - Reporting Results
QNO3- =(0.51 ± 0.06) mg/g (*)
(*) the reported uncertainty is an expanded uncertainty calculated using a coverage factor of k = 2, which gives a level of confidence of approximately 95%

Slide 70Dr. V. Kmetov Alicante 2007
Metrologists obsessed by small uncertainties ?Learning how to apply GUM: Better sell your results with reliable uncertainty statement !
0.63
0.73
0.83
0.93
1.03
1.13
1.23
1.33
1.43
1.53
1.63
1.73
1.83
c
m
mol
·kg-1
-50
-40
-30
-20
-10
0
10
20
30
40
50
Dev
iatio
n fr
om m
iddl
e of
cer
tifie
d ra
nge
in %
Cd
Results from all participants.
Certified range [U =k ·u c (k =2)]: 1.226 - 1.294 mmol·kg-1
9 values below -50%
3 values above 50%
Slide 71Dr. V. Kmetov Alicante 2007
Conclusion: about uncertainty
Uncertainty budgeting according to the GUM is a useful and accepted concept to evaluate results of a measurement;
It allows others (e.g. assessors) to understand what & how things were done
It allows the analyst to combine prior knowledge and observations in a consistent and well defined way;
It doesn’t requires to measure with smallest achievable uncertainty, but with the most realistic one

Slide 72Dr. V. Kmetov Alicante 2007
Uncertainty adopted and accepted by ...
Many international institutions, such as NMIs and BIPM
Is required under ISO 17025 for accreditation
IUPAC, OIML and accreditation community such as EA and ILAC have accepted this concept
CEN is incorporating these concepts

Slide 73Dr. V. Kmetov Alicante 2007
http://www.measurementuncertainty.org/

Validation ofValidation ofmeasurement measurement proceduresprocedures
Quality of measurement
result
Validation ( method fit-for-purpose )
Uncertainty Budget(How well I know the result )
Traceability(my result is comparable- common reference)
Quality: The ability of the qualitative (analyte identification) and quantitative
(accuracy, precision) data to satisfy the requirements of their purpose.

Slide 75Dr. V. Kmetov Alicante 2007
How to GUARANTEE reliability of the measurement result
StandartirizedMethods Validated
Methods
THE TRUSTTHE TRUST
Fully documented measurement procedure by a transparent, clear and standartirizedapproach

Slide 76Dr. V. Kmetov Alicante 2007
Content
• What is validation of a measurement procedure ?
• Why procedure validation ?
• Approach to procedure validation ?
• How to perform validation ?
• Step by step examples?
• How the ILC and PT should be evaluate?

Slide 77Dr. V. Kmetov Alicante 2007
The result of the chemical measurement is little morethan a DECLARATION of an isolated figure
until /or someone does not prove the contrary !
C2H5OH C2H5OH
© P De Bièvre SAPUZ ZÜRICH July 1999
The goal of the measurement is to assign a value to an unknown quantity
THE ANALYSIS IS COMPARISON !THE ANALYSIS IS COMPARISON !

Slide 78Dr. V. Kmetov Alicante 2007
The analysis concept
Analyticalsample
Provocation Stimulus
Reagent, titrant, coagulant electrons, photons, atoms, ions, molecules , heat
Response
Phisico-Chemicalquantity that could be registered and quantified as a magnitude
TO WHICH EXTEND the procedure is stable and relationships are constant ?

Slide 79Dr. V. Kmetov Alicante 2007
Beware
Difference in terminology between ISO/IEC 17025 and VIM (Internat. Vocabulary of basic and general terms in Metrology)
- ISO/IEC 17025 uses “method” method validation
- VIM uses “(measurement) procedure” procedure validation
- GLP uses “standard operating procedure”, SOPSOP validation
Measurement procedure - set of operation, described specifically, used in the performance of particular measurement according to a given method
[VIM 2.5]
Method of measurement - Logical sequence of operation, described generically, used in the performance of measurements
[VIM 2.4]

Slide 80Dr. V. Kmetov Alicante 2007
What is validation ?
Validation is the confirmation by examination and
provision of objective evidence that the particular
requirements for a specific intended use are fulfilled
(ISO/IEC 17025)
Validation includes
analytical requirements
determination of procedure characteristics
check that requirements can be fulfilled by the procedure
statement on validity
Slide 81Dr. V. Kmetov Alicante 2007
Validation of measurement procedure
Process of establishing includes:- performance characterisation - scope & limitation of a measurement procedure- identification of the influences which may change the characteristics and to what extent.
- Which analyte can it determine, in which matrices, in the presence of which interference?
- Within these conditions (to be defined) what uncertainty can be achieved?
The process of verifying that a procedure is
fit for purpose(i.e. for solving a particular analytical problem)
Slide 82Dr. V. Kmetov Alicante 2007
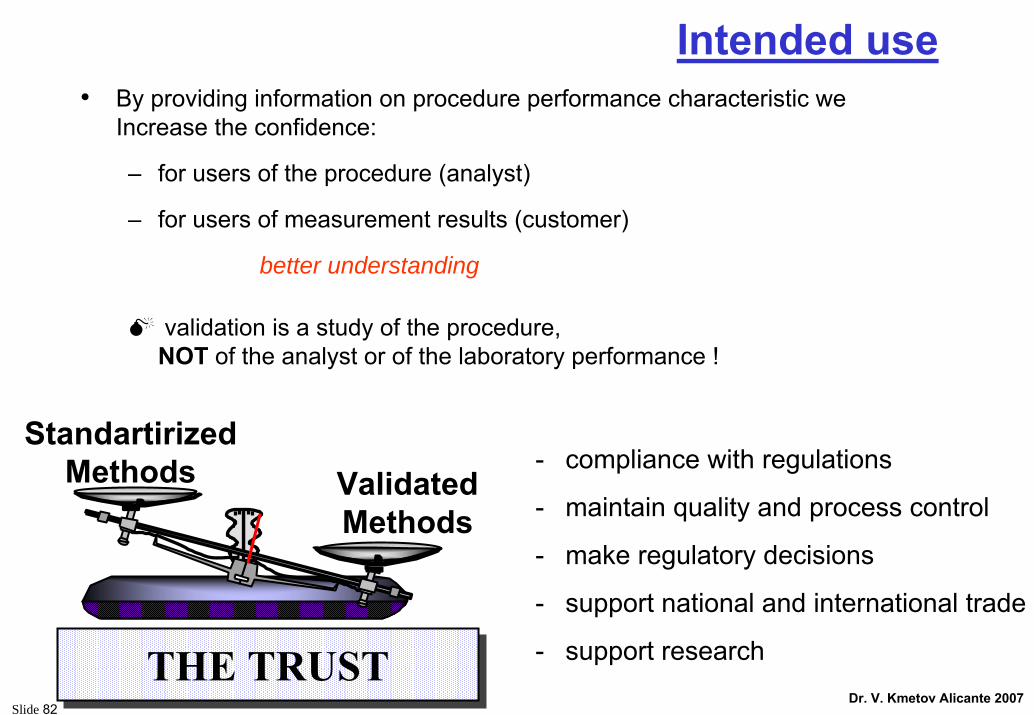
Intended use
- compliance with regulations
- maintain quality and process control
- make regulatory decisions
- support national and international trade
- support research
StandartirizedMethods Validated
Methods
THE TRUSTTHE TRUST
• By providing information on procedure performance characteristic we Increase the confidence:
– for users of the procedure (analyst)
– for users of measurement results (customer)
better understanding
validation is a study of the procedure, NOT of the analyst or of the laboratory performance !

Slide 83Dr. V. Kmetov Alicante 2007
Standard & non-standard methods (procedures)
Sources of standard method (procedures):
procedures published in international, regional, national standards (ISO, EN, DIN, BS, ASTM, …)
procedures published by reputable organizations in their publications (AOAC for food and agriculture; ICH for clinical analysis,….)
not in scientific literature!

Slide 84Dr. V. Kmetov Alicante 2007
Why do we need it ?
Laboratories should demonstrate that they operate within qualitysystem, are technically competent and are able to generate technically valid results
(ISO/IEC 17025)
Three milestones of ISO/IEC 17025:
procedure validation
traceability of results
uncertainty of results
Validation is essential EVEN IF you are not going for accreditation

Slide 85Dr. V. Kmetov Alicante 2007
Often Encountered Terms– Full Validation:
where all relevant parameters of the procedure are investigated
– Degree of Validation:where only some of the performance parameters are investigated
– Confirmation:used in relation to (already validated) standardised procedures. No need for additional validation, just a “confirmation” in your lab.
Which procedures should be validated?
non-standard
in-house developed
standard ones used outside their intended scope
modified standard
Will a validated procedure “automatically” work in my lab?
(First) No, confirmation needed
(Then) Yes, within the specified conditions

Slide 86Dr. V. Kmetov Alicante 2007
SelectedProcedure
AlreadyValidated
Confirmation validation
Yes No
When is a procedure validation needed?

Slide 87Dr. V. Kmetov Alicante 2007
Put the effort where it is needed
• validate whole procedure(from sample preparation to measured signal)
• validate full concentration range (intended use!)
• validate all intended types of matrices
Sampling & SampleTreatment
Data treat
Result
Instrumentcalib & measur
The scope of validation
Slide 88Dr. V. Kmetov Alicante 2007
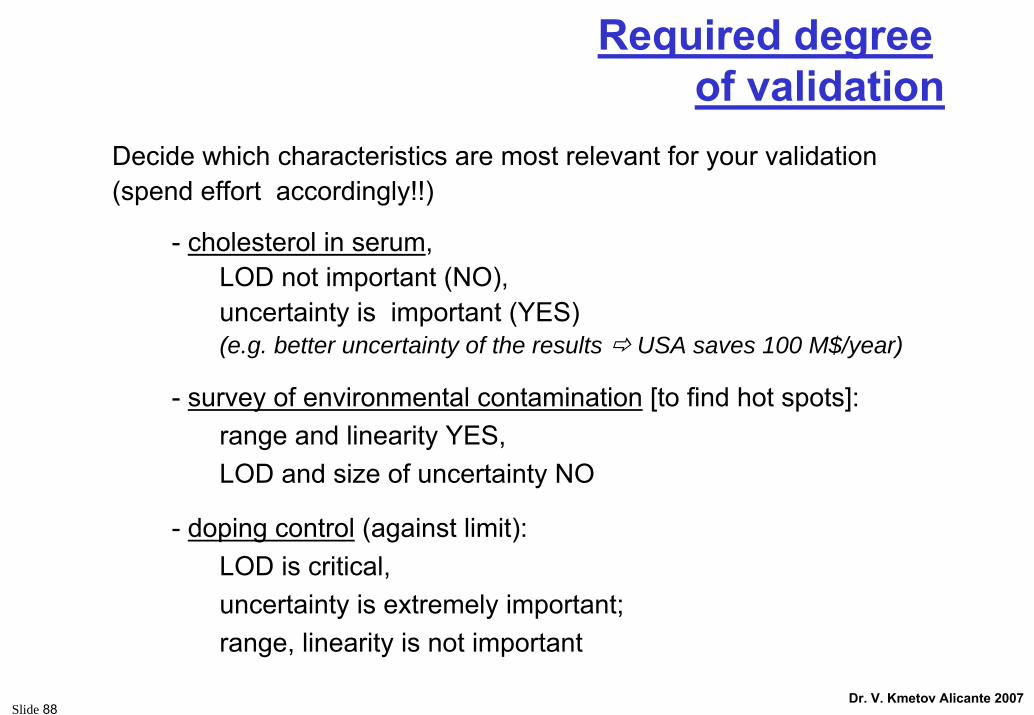
Required degree of validation
Decide which characteristics are most relevant for your validation (spend effort accordingly!!)
- cholesterol in serum, LOD not important (NO), uncertainty is important (YES)(e.g. better uncertainty of the results USA saves 100 M$/year)
- survey of environmental contamination [to find hot spots]: range and linearity YES, LOD and size of uncertainty NO
- doping control (against limit): LOD is critical, uncertainty is extremely important; range, linearity is not important

Slide 89Dr. V. Kmetov Alicante 2007
Validation technique...… recommended by ISO/IEC 17025
evaluation of uncertainty = systematic assessment of the quantities influencing the result
measurement of CRM
participation in inter-laboratory comparison
comparison of results achieved with other procedures
Use...Standards and/or reference materialsInvestigate blanks Artificially prepared samples (e.g. spiked)StatisticsCommon sense
Slide 90Dr. V. Kmetov Alicante 2007
The
Valid
atio
n Ch
eckl
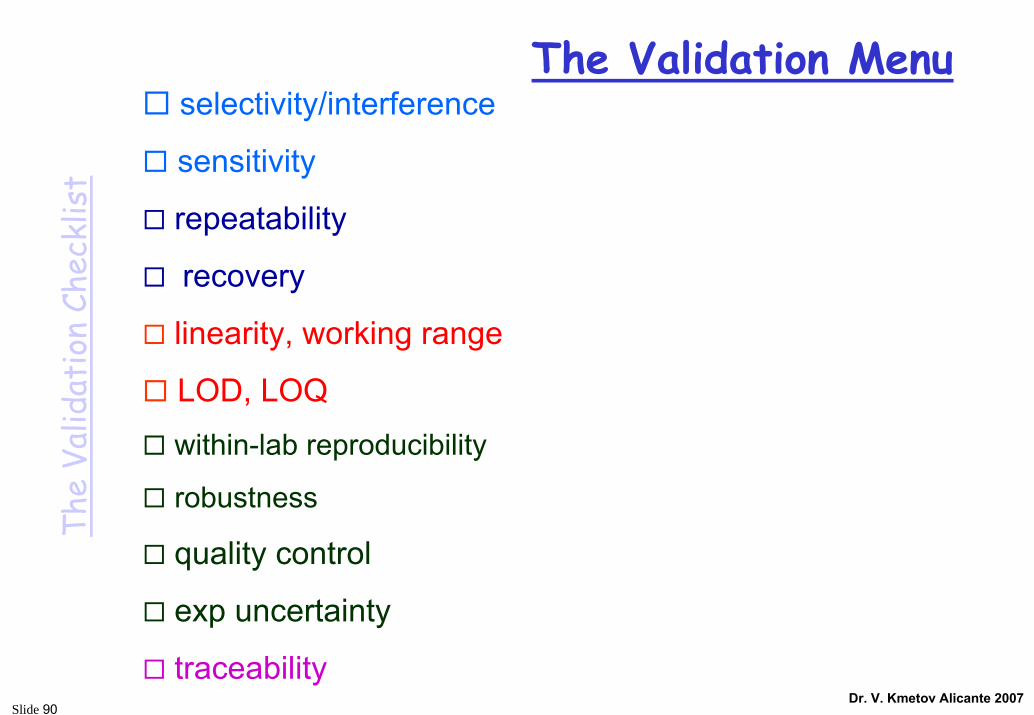
istThe Validation Menu
selectivity/interference
sensitivity
repeatability
recovery
linearity, working range
LOD, LOQ
within-lab reproducibility
robustness
quality control
exp uncertainty
traceability

Slide 91Dr. V. Kmetov Alicante 2007
Check listPerformance parameters of the procedure
(qualitative): selectivity, specificity
(quantitative):sensitivitydetection & quantification/determination limitsworking (linear) range
Property of the result obtained with this procedure
traceability (cf. other module)
uncertainty, considering e.g.– recovery– robustness
– repeatability– reproducibility

Slide 92Dr. V. Kmetov Alicante 2007
Selectivity, Specificity
• Specificity is 100% selectivity
• Few, if any methods are specific
• IUPAC recommends that the term specificity should be avoided
(IUPAC, 2001)
Selectivity refers to the extent to which the method can be used to determine particular analytes in mixtures or matrices without interferences from other components of similar behaviour
(IUPAC, 2001)
Potentially interfering substances must be chosen and relevant blank samples must be analyzed to estimate such effects.
Slide 93Dr. V. Kmetov Alicante 2007
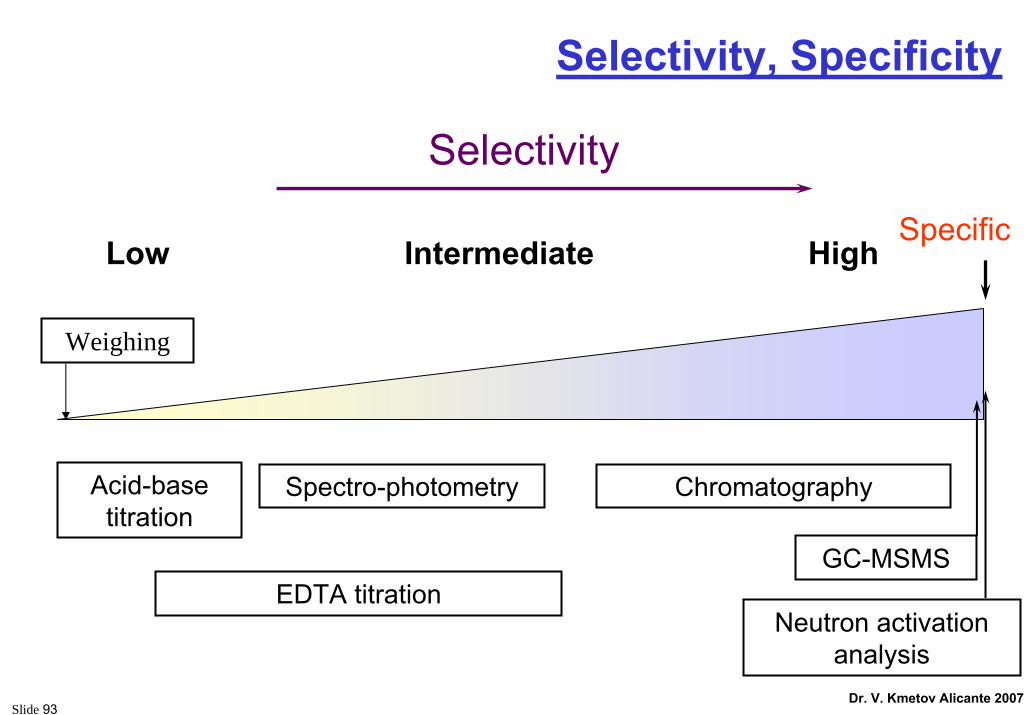
Selectivity, Specificity
Specific
Selectivity
IntermediateLow High
Acid-base titration
Spectro-photometry Chromatography
EDTA titrationNeutron activation
analysis
GC-MSMS
Weighing

Slide 94Dr. V. Kmetov Alicante 2007
Sensitivity
• What it means: It is a measure of the gradient (slope) of the calibration graph
Definition:The change in the response of a measuring instrument divided by the corresponding change in the stimulus
(VIM 1993)
αtgdC
dSigmb ===1
XbbY 10 +=

Slide 95Dr. V. Kmetov Alicante 2007
Prof. Dr. Antonio Canals Hernández
Univariate Methodological Calibration on Instrumental Analysis

Slide 96Dr. V. Kmetov Alicante 2007
Standard deviation of predicted values
2)ˆ(
/ −−
= ∑n
yys ii
yx
∑ −=
2
/
)(1
ii
xyb
xx
ss
2
2
/ )( ii
ixyb xxn
xss
o −=
∑∑

Slide 97Dr. V. Kmetov Alicante 2007
Reporting of LOD
Insensitive method?Interference?
Interference? Contamination
Analyte…
Analyte… Not present Present
Not detected True Negative False Negative
Detected False Positive True Positive
c = 0 c > 0 concentration
FP areaFN area
cut-off
Non-presence of analyte Presence of analyte

Slide 98Dr. V. Kmetov Alicante 2007
Limits of...Detection (LOD)
Quantification (LOQ)
Calibration equation: Signal = b0 + b1 * c
Ybl = Signal of the ‘blank’ ; sbl= stdev of the ‘blank’ in signal domain
YLOD = Ybl + 3 sbl LOD = (YLOD – b0)/b1
YLOQ = Ybl + 10 sbl LOQ = (YLOQ – b0)/b1
‘Blank’• instrumental• from sample treatment (e.g. contamination in digestion, purification)
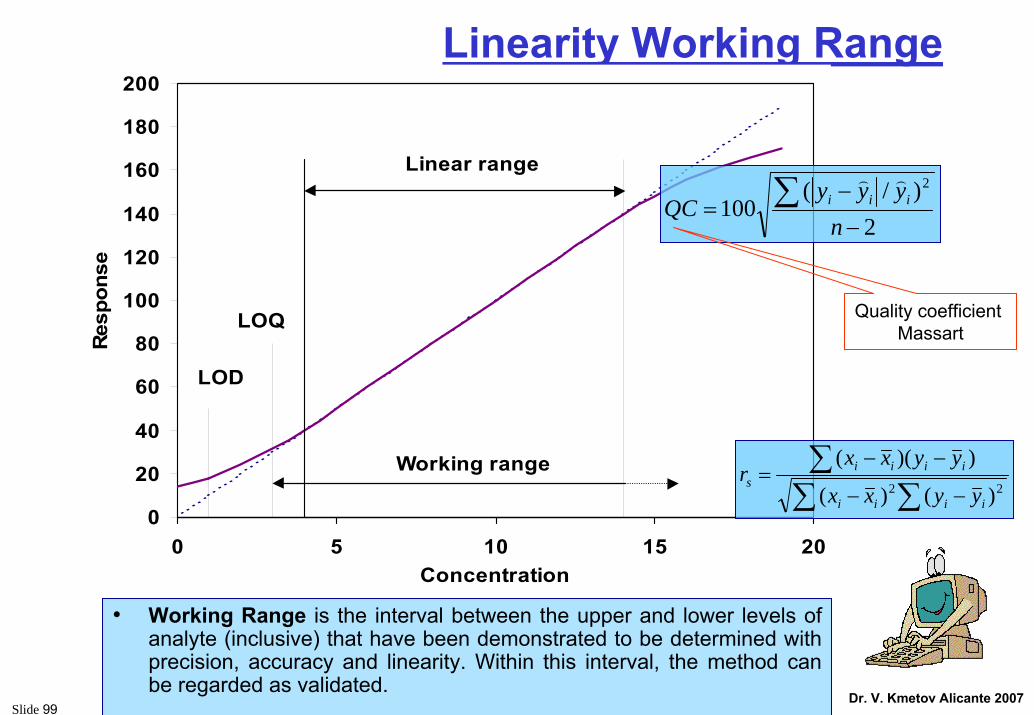
Slide 99Dr. V. Kmetov Alicante 2007
Linearity Working Range
0
20
40
60
80
100
120
140
160
180
200
0 5 10 15 20Concentration
Resp
onse
LOD
LOQ
Linear range
Working range
• Working Range is the interval between the upper and lower levels of analyte (inclusive) that have been demonstrated to be determined with precision, accuracy and linearity. Within this interval, the method can be regarded as validated.
2)/(
1002
−−
= ∑n
yyyQC iii
))
Quality coefficient Massart
22 )()(
))((
∑ ∑∑
−−
−−=
iiii
iiiis
yyxx
yyxxr

Slide 100Dr. V. Kmetov Alicante 2007
V. Kmetov, A. Sanchez, A. Canals, D. Georgieva, V. Stefanova 5th European Furnance Symposium and 10th International Solid Sampling Colloquium with Atomic Spectrometry, 1-4 September 2002, South-West University "Neofit Rilski",Blagoevgrad, P28, 90 Determination of Pb and Cd in wool and goat's hair from animal population in the vicinity of Plant for non-ferrous metals (Plovdiv) by ETAAS and ICP-MS methods.
y = 0.0092xR2 = 0.9998
y = -2E-05x2 + 0.0101xR2 = 0.9996
0
0.2
0.4
0.6
0.8
1
1.2
1.4
0 25 50 75 100 125 150 175 200 225
Mass (pg)
Abs
orba
nce

Slide 101Dr. V. Kmetov Alicante 2007
Recovery (1)
A measure of the trueness of a (measurement) procedure
(IUPAC 1999)
Reference value from:
- CRM
- spike of pure substance
The closer R is to 1, the smaller the bias in the procedure
value_referencevalue_observedR =
CRM
observed
CCR =
spike
matrixobserved
cccR −
=
Recovery is the estimate of trueness through the addition of a known mass of the analyte to the test portion.

Slide 102Dr. V. Kmetov Alicante 2007
Accurate? Precise?
no no
no yes
yes no
yes yes
(close) (scatter)
Best estimate of the “True Value”
Precision: The closeness of agreement between independent test resultsobtained under stipulated conditions [ISO 5725]
Precision ⇒ Scatter ⇒ uncertainty
It is normally expressed as the percent relative standard deviationfor a statistically significant number of samples.
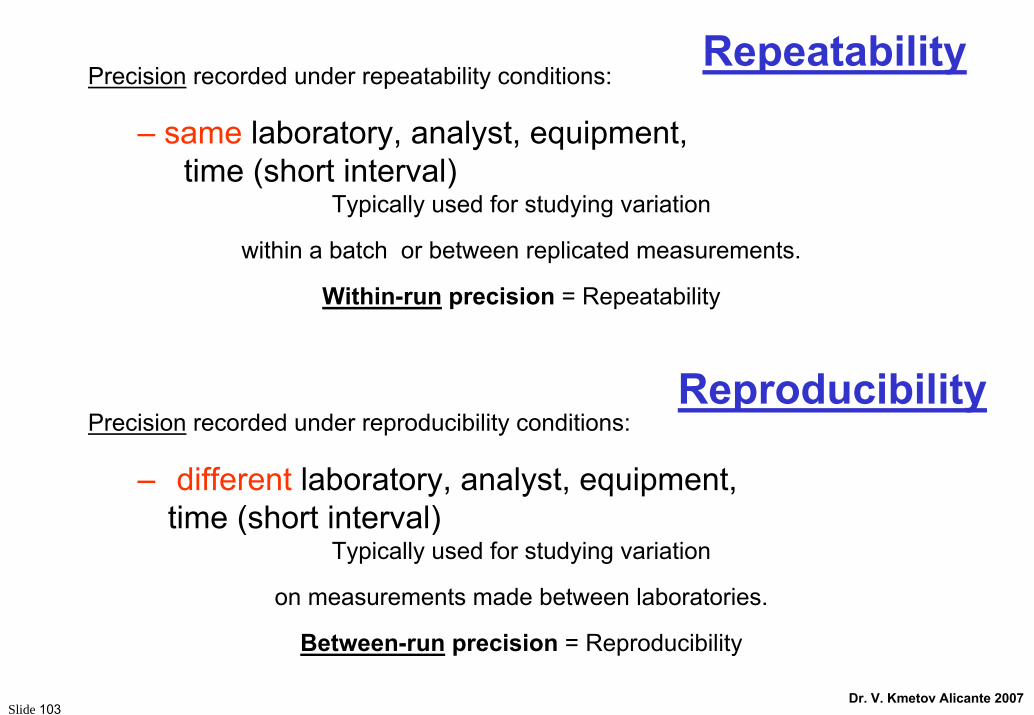
Slide 103Dr. V. Kmetov Alicante 2007
Precision recorded under repeatability conditions:
– same laboratory, analyst, equipment,time (short interval)
Typically used for studying variation
within a batch or between replicated measurements.
Within-run precision = Repeatability
Repeatability
ReproducibilityPrecision recorded under reproducibility conditions:
– different laboratory, analyst, equipment,time (short interval)
Typically used for studying variation
on measurements made between laboratories.
Between-run precision = Reproducibility

Slide 104Dr. V. Kmetov Alicante 2007
Trumpet of Horwitz
-80-60-40-200
20406080
1,0E
-10
1,0E
-08
1,0E
-06
1,0E
-04
1,0E
-02
1,0E
+00
1,0E
+02
концентрация като m/m
RSD
%
)log5,01(2 CRSD −±=

Slide 105Dr. V. Kmetov Alicante 2007
646566676869707172
0 2 4 6 8 10 12 14 16
Replicates 1 2 3 4 5 6Vials 1 66 68 67 69 70 69
2 66 67 68 68 68 693 71 67 68 69 68 704 66 68 67 68 68 695 67 67 66 69 69 686 65 67 67 69 68 697 67 68 68 68 69 698 67 66 66 68 68 699 67 67 66 69 68 69
10 66 65 67 68 69 6811 67 67 69 68 68 7012 67 68 69 69 68 6913 67 67 68 69 68 6814 67 68 68 69 68 6915 65 66 65 68 68 67
SUMMARYGroups Count Sum AverageVariance
1 6 409 68.2 2.22 6 406 67.7 1.13 6 413 68.8 2.24 6 406 67.7 1.15 6 406 67.7 1.56 6 405 67.5 2.37 6 409 68.2 0.68 6 404 67.3 1.59 6 406 67.7 1.510 6 403 67.2 2.211 6 409 68.2 1.412 6 410 68.3 0.713 6 407 67.8 0.614 6 409 68.2 0.615 6 399 66.5 1.9
ANOVASource of Variation SS df MS F P-value F crit
Between Groups 26.2 14 1.87 1.34 0.207 1.83Within Groups 104.8 75 1.40
Total 131.0 89
repeatability stdev sr 1.18 =sqrt(MSW)
reproducibility stdev sR 1.21 =sqrt(MSW+(MSB-MSW)/N)(n replicates)
Anova Single factor
Sum of squares
Degree of freedom
Mean squeres

Slide 106Dr. V. Kmetov Alicante 2007
Control charts
4,8
4,85
4,9
4,95
5
5,05
5,1
5,15
5,20 1 2 3 4 5 6 7 8 9 10 11 12 13 14 15 16 17 18 19 20
ml обем
на пи
пета
`
How to determine the
interval ?
Is this an outlier ?
Slide 107Dr. V. Kmetov Alicante 2007
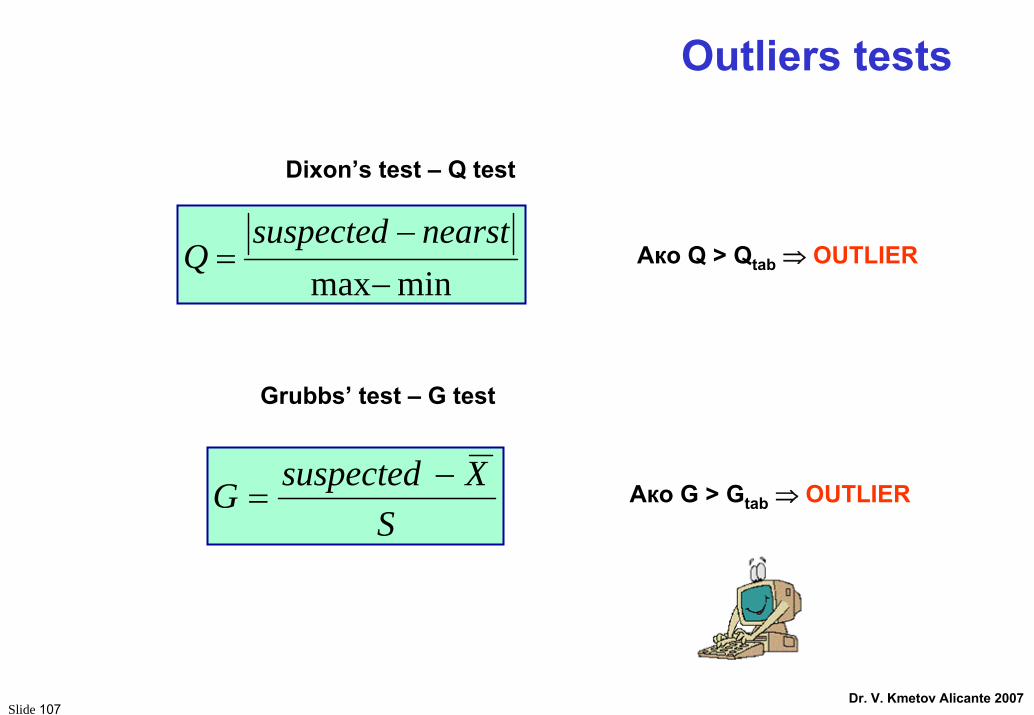
Outliers tests
minmax−−
=nearstsuspected
Q
Dixon’s test – Q test
Grubbs’ test – G test
SXsuspectedG −
=
Ако Q > Qtab ⇒ OUTLIER
Ако G > Gtab ⇒ OUTLIER

Slide 108Dr. V. Kmetov Alicante 2007
Robustness (1)
Procedure prescribes the limits for experimental parametersExamples: pH, temperature, concn. of reagent, operator, ......
The robustness (ruggedness) of the measurement procedure is the resistance to change in the result when minor deviations are made
from the experimental conditions described in the procedure
Parameter Values
Res
pons
e Δ
Pn Pa
Res
pons
e
Δ~0
Pn Pa
ParameterValues
Non-Robust Parameter Robust Parameter

Slide 109Dr. V. Kmetov Alicante 2007
Robustness (2)
Experiment no.: 1 2 3 4 5 6 7 8ParametersA pH 5 5 5 5 7 7 7 7B temp. 25 25 35 35 25 25 35 35C reaction time 30 60 30 60 30 60 30 60D reagent 1 1 1 2 2 2 2 1 1E reagent 2 1 2 1 2 2 1 2 1F age of column old new new old old new new oldG personnel xx yy yy xx yy xx xx yy
Response r t u v w x y z
ANOVA:A, B, and D are non-robust
provide basic/preliminary informationevaluate whether the model equation is validbetter instructions for operators
• Identify variables of method: A,B, C, D etc
• Set-up experiments (Youden/Steiner)
• By systematic changing of one variable, determine effects on result (see table Y/S)
• Review the results to determine optimal conditions
• Procedure improvement from results obtained(gives also information on influence quantities)
Slide 110Dr. V. Kmetov Alicante 2007
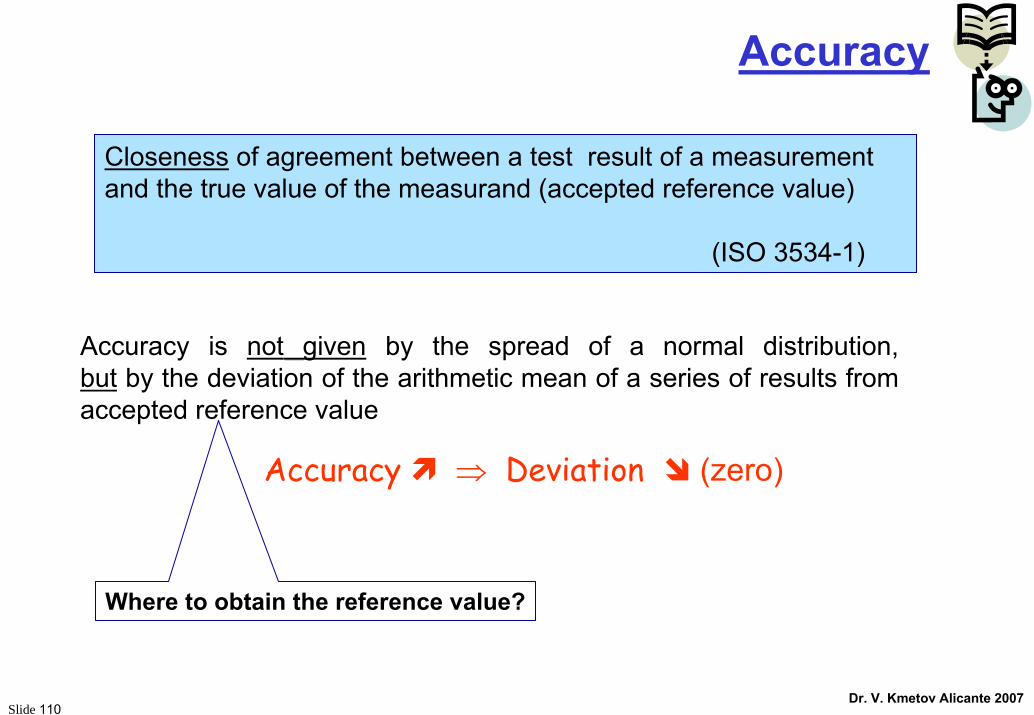
Accuracy is not given by the spread of a normal distribution,but by the deviation of the arithmetic mean of a series of results fromaccepted reference value
Accuracy
Accuracy ⇒ Deviation (zero)
Closeness of agreement between a test result of a measurementand the true value of the measurand (accepted reference value)
(ISO 3534-1)
Where to obtain the reference value?

Slide 111Dr. V. Kmetov Alicante 2007
Inter-Laboratory Comparison (ILC) -Organisation, performance and evaluation of tests on the same (or similar) items by two or more laboratories in accordance of predetermined conditions
Proficiency Testing (PT) -Determination of laboratory testing performance by means of inter-laboratory test comparison.
[ISO/IEC Guide 43:1997]
Definitions
Slide 112Dr. V. Kmetov Alicante 2007
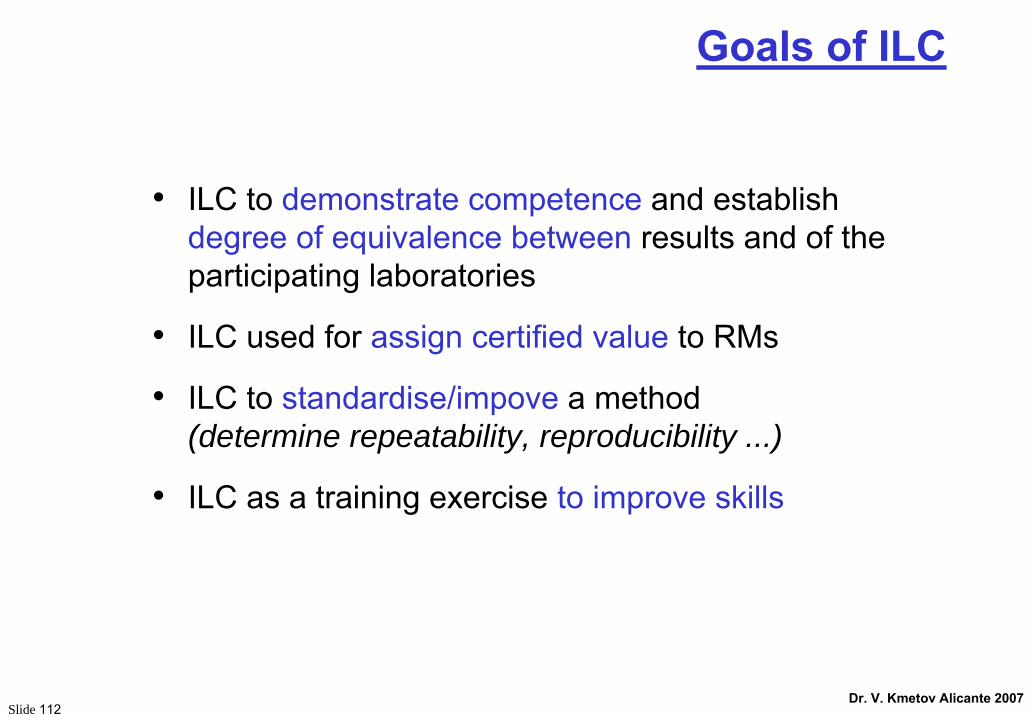
• ILC to demonstrate competence and establish degree of equivalence between results and of the participating laboratories
• ILC used for assign certified value to RMs
• ILC to standardise/impove a method (determine repeatability, reproducibility ...)
• ILC as a training exercise to improve skills
Goals of ILC
Slide 113Dr. V. Kmetov Alicante 2007
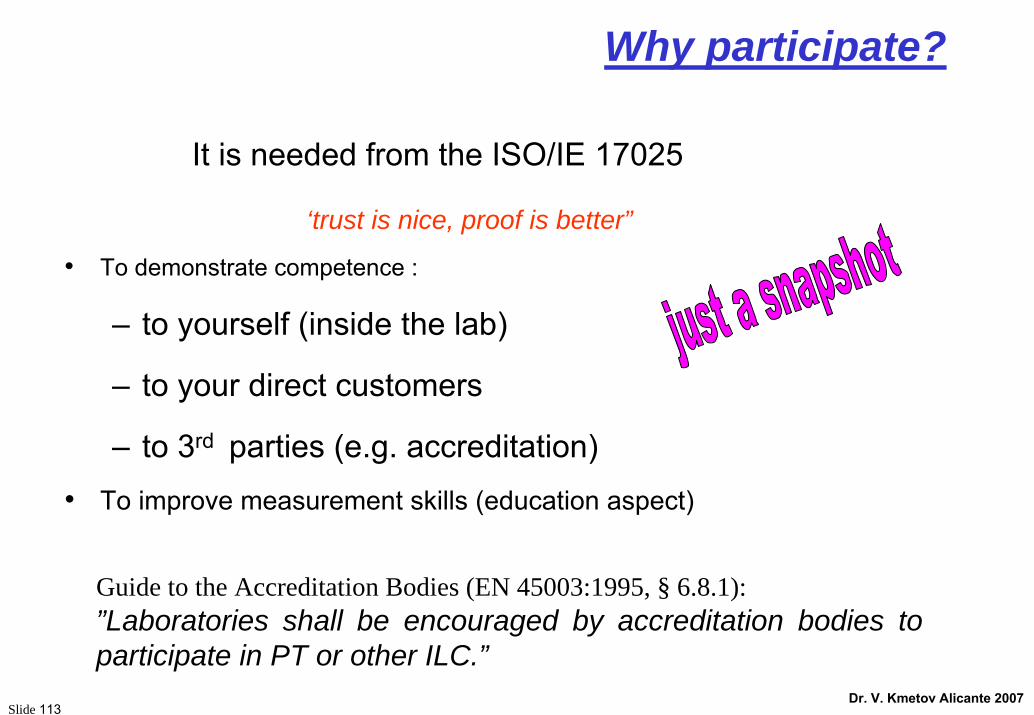
‘trust is nice, proof is better”
• To demonstrate competence :
– to yourself (inside the lab)
– to your direct customers
– to 3rd parties (e.g. accreditation) • To improve measurement skills (education aspect)
Guide to the Accreditation Bodies (EN 45003:1995, § 6.8.1):”Laboratories shall be encouraged by accreditation bodies to participate in PT or other ILC.”
Why participate?
It is needed from the ISO/IE 17025
Slide 114Dr. V. Kmetov Alicante 2007
42
47
52
57
62
67
72
77
82
87
92
97
102
107
112
117
122
c
n
mol
·L-1
-50
-40
-30
-20
-10
0
10
20
30
40
50
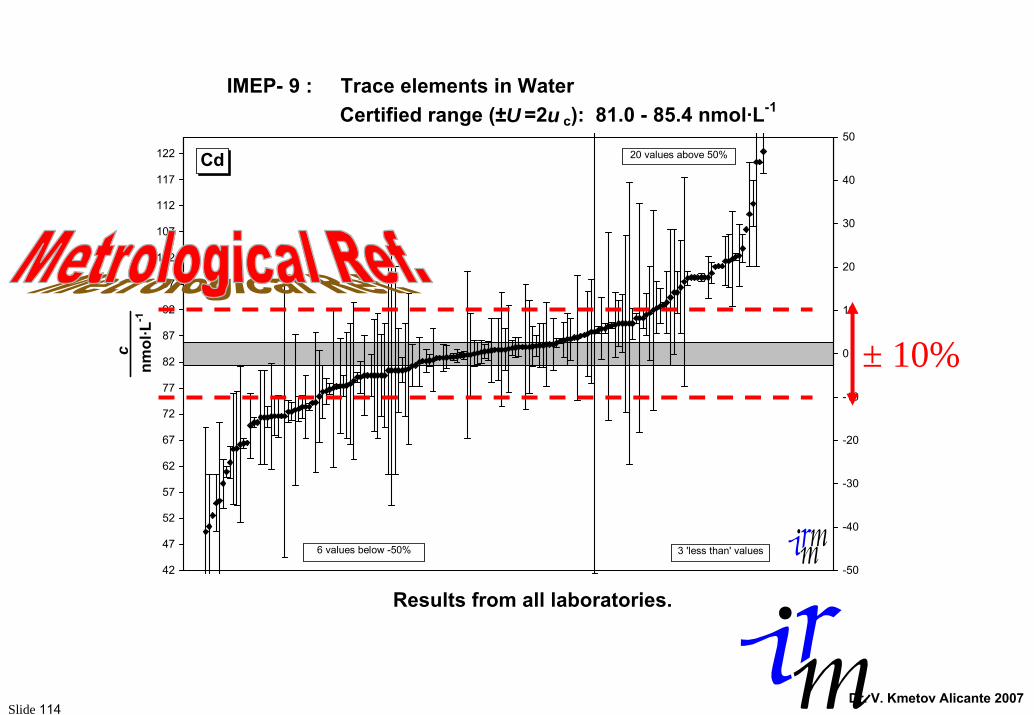
IMEP- 9 : Trace elements in Water Certified range (±U =2u c): 81.0 - 85.4 nmol·L-1
Cd
Results from all laboratories.
3 'less than' values6 values below -50%
20 values above 50%
± 10%
Slide 115Dr. V. Kmetov Alicante 2007
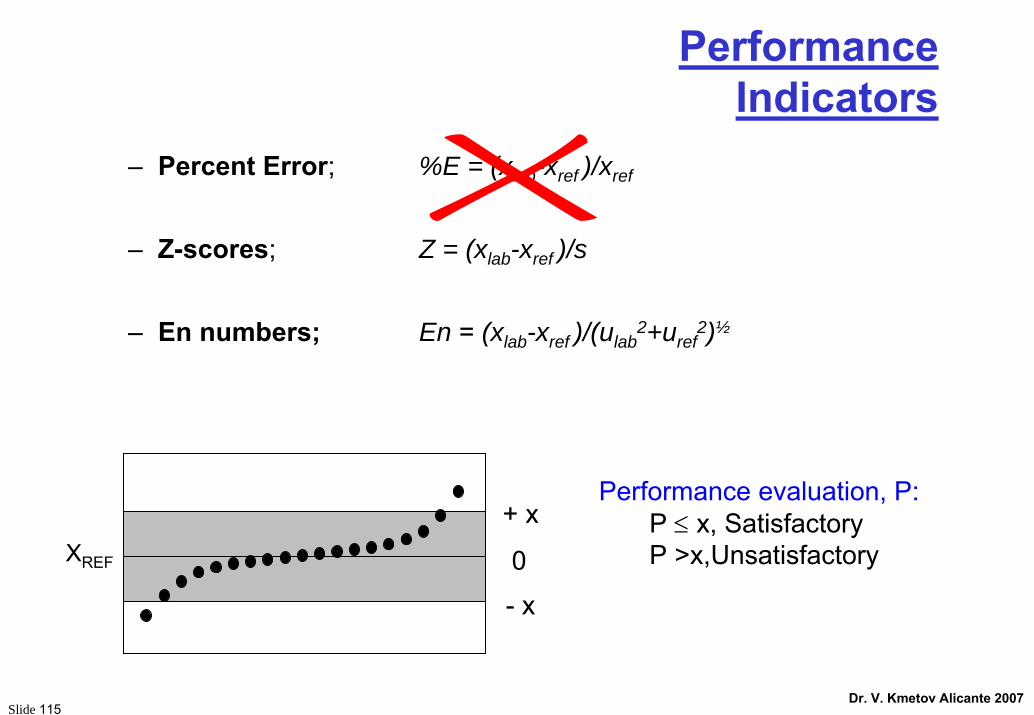
– Percent Error; %E = (xlab-xref )/xref
– Z-scores; Z = (xlab-xref )/s
– En numbers; En = (xlab-xref )/(ulab2+uref
2)½
Performance evaluation, P:P ≤ x, SatisfactoryP >x,Unsatisfactory
- x
+ x
0XREF
PerformanceIndicators

Slide 116Dr. V. Kmetov Alicante 2007
Performance evaluation:0 <|Z|< 2 : good2 <|Z|< 3 : warning preventive action
|Z|> 3 : unsatisfactory corrective action
(Traditional) Z-score
"" sxx
Z reflab −=
Difference distance accuracy
• Target performance (i.e. 5%)• Reference uncertainty (nominal value)• Inter-Laboratory Comparison reproducibility
“Normalized” versus ...

Slide 117Dr. V. Kmetov Alicante 2007
En-score according to GUM
)( 22reflab
reflab
uu
xxEn
+
−=
“Normalized” versus ...propagated combined uncertainties
Performance evaluation:0 <|En|< 2 : good2 <|En|< 3 : warning preventive action
|En|> 3 : unsatisfactory corrective action
Slide 118Dr. V. Kmetov Alicante 2007
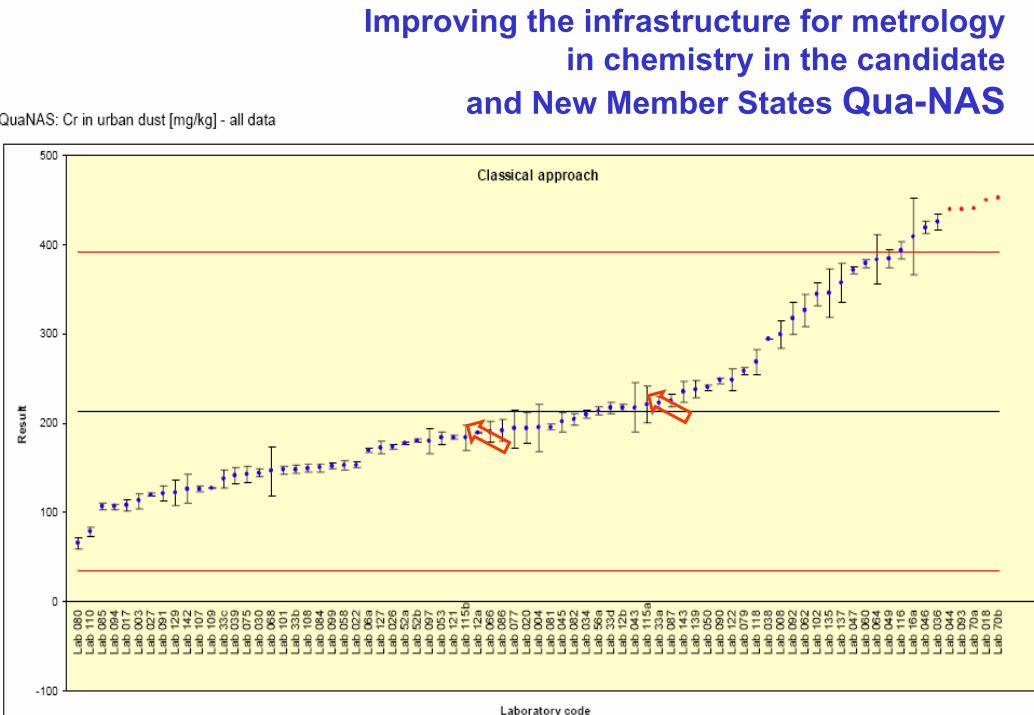
Improving the infrastructure for metrologyin chemistry in the candidate
and New Member States Qua-NAS

Slide 119Dr. V. Kmetov Alicante 2007
A well-defined and documented validation process provides regulatory agencies with evidence that the system and method are suitable for their intended use.
The ultimate goal of validation

Traceability of the Traceability of the results results
Quality of measurement
result
Validation ( method fit-for-purpose )
Uncertainty Budget(How well I know the result )
Traceability(my result is comparable- common reference)
Slide 121Dr. V. Kmetov Alicante 2007
Scope of the lecture
• What is Traceability?
• What is it needed for?
• How to establish Traceability?
• How to demonstrate Traceability?
• How CRM should be used?
Slide 122Dr. V. Kmetov Alicante 2007
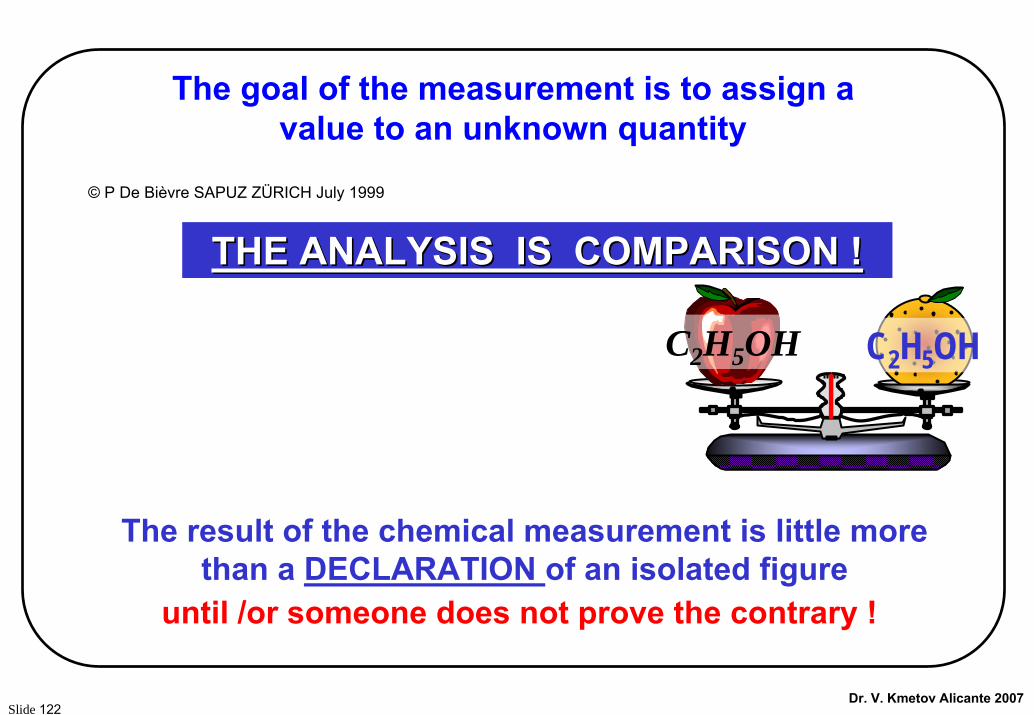
The result of the chemical measurement is little morethan a DECLARATION of an isolated figure
until /or someone does not prove the contrary !
C2H5OH C2H5OH
© P De Bièvre SAPUZ ZÜRICH July 1999
The goal of the measurement is to assign a value to an unknown quantity
THE ANALYSIS IS COMPARISON !THE ANALYSIS IS COMPARISON !
Slide 123Dr. V. Kmetov Alicante 2007
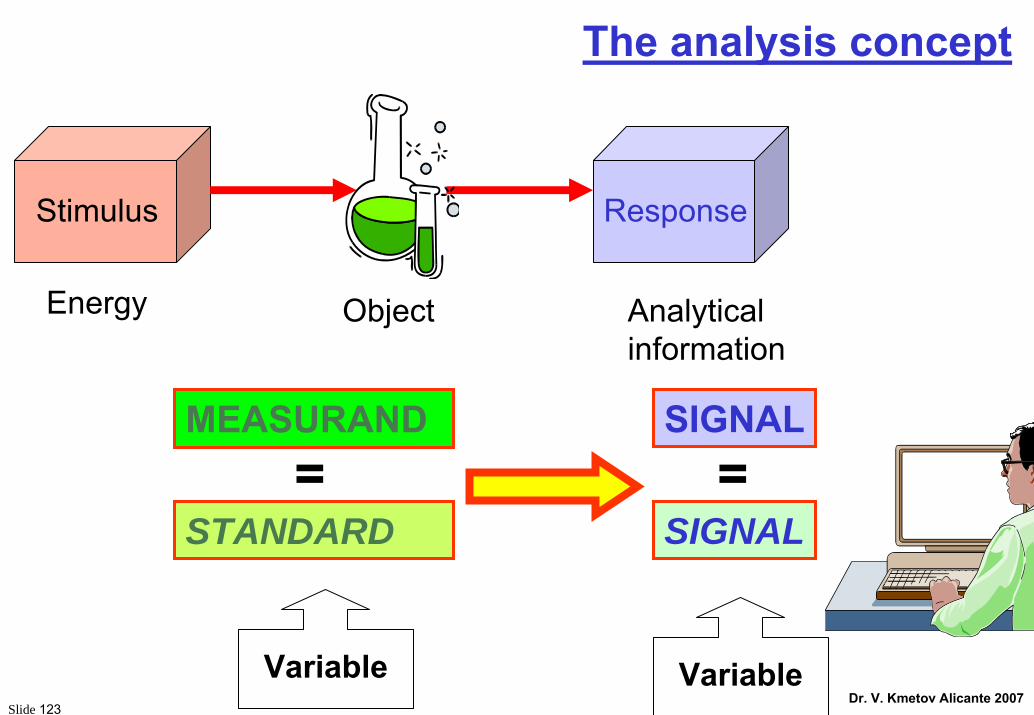
The analysis concept
MEASURAND SIGNAL
Stimulus Response
Energy Object Analyticalinformation
Variable Variable
STANDARD SIGNAL= =

Slide 124Dr. V. Kmetov Alicante 2007
Traceability of ...
Not concerned by:… sample in the lab… documents in a filing system
Not applicable to:… institution… method
Relevant for… measurement results … reference values
trackability

Slide 125Dr. V. Kmetov Alicante 2007
LENGTH MEASUREMENT
UNIT
Tape measure
Ruler 1
Ruler 2
King’s foot
value
value
value
value

Slide 126Dr. V. Kmetov Alicante 2007
Definition
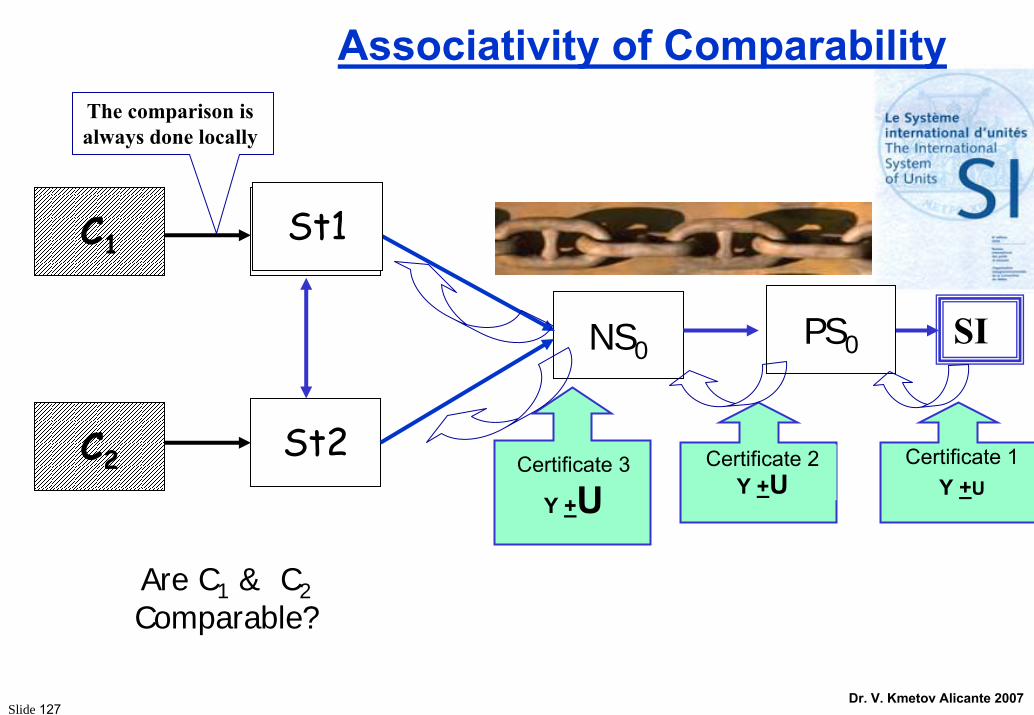
Traceability is a property of the result of a measurement or the value of a standard whereby it can be related to stated references, usually national or international standards, through an unbroken chain of comparisons all having stated uncertainties.
[VIM, 6.10]
A posteriori
A priori
Slide 127Dr. V. Kmetov Alicante 2007
NS0
C1 St1
St2C2
SI
St1
PS0
Certificate 1Y +U
Certificate 2Y +U
Certificate 3
Y +U
The comparison is always done locally
Associativity of Comparability
Are C1 & C2Comparable?
Slide 128Dr. V. Kmetov Alicante 2007
Stated reference units
Meaningful comparisons between measurements are only possible if the results are expressed in the same units(measurement scale)
• SI units (m, kg, s, A, K, mol, cd) or combination
• to best internationally agreed reference (if no SI), such as:
delta scale for isotopic measurements
pH scale
the scale of octane numbers for petroleum fuel

International System of Measurements : the SI
Advantage of SI traceability ?• traceability is needed to be able to compare, so the traceability acts as a tool to obtain equivalence
• values are independent of time
• values are independent of place
The system was created because of ‘compelling’ forcesin trade & economyIt is valid worldwide and is constantly maintained and improved by the BIPM to ensure that results are compatible and the values are anchored.

Slide 130Dr. V. Kmetov Alicante 2007
Metre convention1875
Diplomatictreaty
CGPM
CIPM
Consultativecommittees
BIPM
Governments
Internationalorganisations
Nationallaboratories
Organising measurements on an international scale

Slide 131Dr. V. Kmetov Alicante 2007
putting MRA into practice:the “satellite” concept
BIPM/CCQMAPMP
EUROMET
SIM
UKGERMANY
FRANCE
CANADA
S. AFRICA
AUSTRALIAUSA
BRASIL
CHINA
JAPAN
KOREA
SPAIN
N. ZEALAND
RUSSIA
DENMARK
ITALY
HELLAS
THAILANDSWITZERLAND
PORTUGAL
SINGAPORE
TAIWAN
INDONESIA
MALAYSIA
ARGENTINA
PERU
MEXICOJAMAICA
CHILE
NICARAGUA
transfer
Consultative committee for amount of substances

Slide 132Dr. V. Kmetov Alicante 2007
Stating&
Establishing&
Demonstrating
… Traceability
… is a claim
… is what I do in my lab
… and I can show it

Slide 133Dr. V. Kmetov Alicante 2007
Establishing traceability
Specifying the measurand
Choosing a suitable
– measurement procedure
– model equation
Demonstrating (validation) that:
– the model equation is adequate (all significant influence quantities have been taken into account)
– the measurement conditions are adequate
Establishing traceability for each influence quantity:
– Choosing appropriate reference standards
– Calibrating using the standards that are traceable
Evaluating uncertainty
[EURACHEM/CITAC Guide, 2002 ]
Slide 134Dr. V. Kmetov Alicante 2007
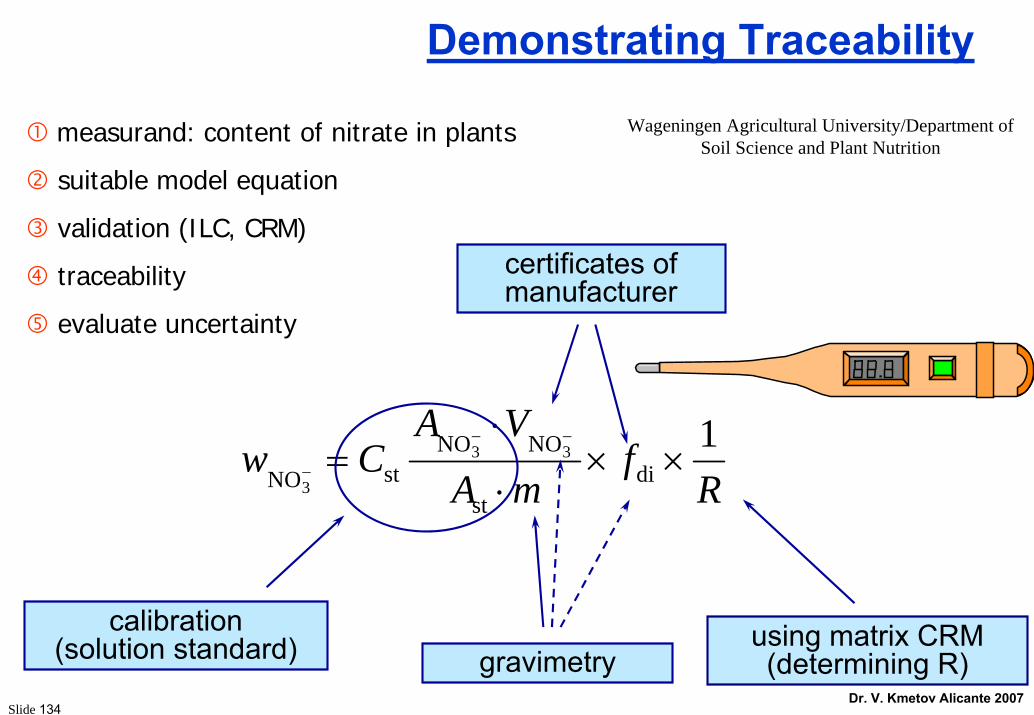
Demonstrating Traceability
Rf
mA
VACw 1
dist
NONOstNO
33
3××
⋅
⋅=
−−
−
using matrix CRM (determining R)gravimetry
calibration(solution standard)
certificates of manufacturer
measurand: content of nitrate in plants
suitable model equation
validation (ILC, CRM)
traceability
evaluate uncertainty
Wageningen Agricultural University/Department of Soil Science and Plant Nutrition

Slide 135Dr. V. Kmetov Alicante 2007
Establishing Traceability procedure
Traceability to be established for each input quantity specified in the
procedure / model equation
• established by calibration using appropriate standards
Calibration:Set of operations which establish, under specified conditions, the relationship between values indicated by a measuring instrument -(including chemical steps) and the corresponding known values of the measurand.
Must be performed by reference standards with demonstrated traceability and adequately small uncertainty.

Slide 136Dr. V. Kmetov Alicante 2007
Result Traceable to Value of Reference Standard
Inst
rum
enta
l
0
2
4
6
8Si
gnal
Calibration model
Reference Standard (mg/kg)
Sample Weighing
Traceable to? Via?
Traceable to? Via?
E. Merck St

Slide 137Dr. V. Kmetov Alicante 2007
You certainly heard about...Standards
• Primary and Secondary standard• International (measurement) standard• National standard• Calibration standard• Measurement standard
Reference Materials (CRM, SRM, ...)Primary and Secondary RM Laboratory RMInternal, “in-house” RMMatrix RM
Traceability should be established by:
1. Use of traceable standards to calibrate the measuring equipment
2. By using, or by comparison to the results of, a primary method
3. By using a pure substance RM.
4. By using an appropriate matrix Certified Reference Material (CRM)
5. By using an accepted, closely defined procedure.
QUAM (3.3.4)
primary method is a method having the highest metrological qualities, whose operation is completely
described and understood in terms of SI units and whose results are accepted without
reference to a standard of the same quantity.

Slide 138Dr. V. Kmetov Alicante 2007
[ILAC-G2:1994] Traceability of Measurements
0,2% 2 %5 %
uncertainry
• Primary Std• International Std• National Std• Reference Std• Transfer Std• Travelling Std• Working Std
• BIPM• Nat. Metrology Institutes• Accredited Calib. Labs• Company (in-house)
- calibration centre- test laboratory
Met
rolo
gica
l Tra
ceab
ility
Uncertainty
Tools Service ProvidersCalibration Hierarchy
Slide 139Dr. V. Kmetov Alicante 2007
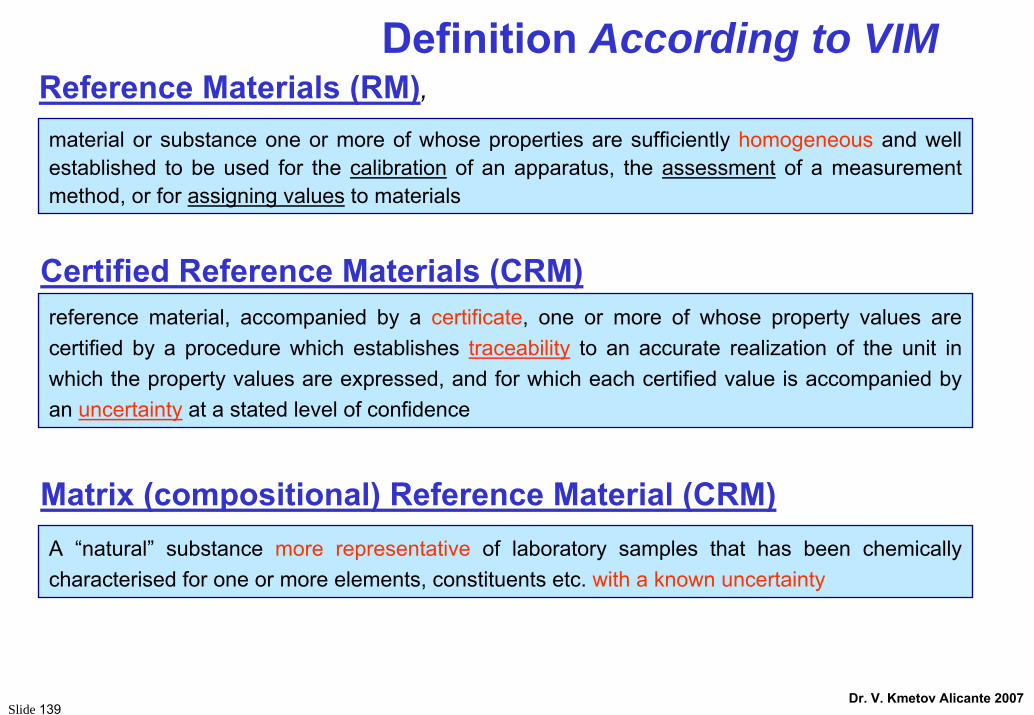
material or substance one or more of whose properties are sufficiently homogeneous and well established to be used for the calibration of an apparatus, the assessment of a measurement method, or for assigning values to materials
Definition According to VIMReference Materials (RM),
Certified Reference Materials (CRM)reference material, accompanied by a certificate, one or more of whose property values are certified by a procedure which establishes traceability to an accurate realization of the unit in which the property values are expressed, and for which each certified value is accompanied by an uncertainty at a stated level of confidence
A “natural” substance more representative of laboratory samples that has been chemically characterised for one or more elements, constituents etc. with a known uncertainty
Matrix (compositional) Reference Material (CRM)

Slide 140Dr. V. Kmetov Alicante 2007
C.D.EHRLICH, S.D.RASBERRY J.Res. NIST 103 (1998) 93
Traceability Timeline
NMI
Calib-lab
Test-lab
P P QS1 P QS1
S S QS2 S QS2
C C QS3 C QS3
P S
S C
C SampleValue and uncertainty propagation
Traceability
Slide 141Dr. V. Kmetov Alicante 2007
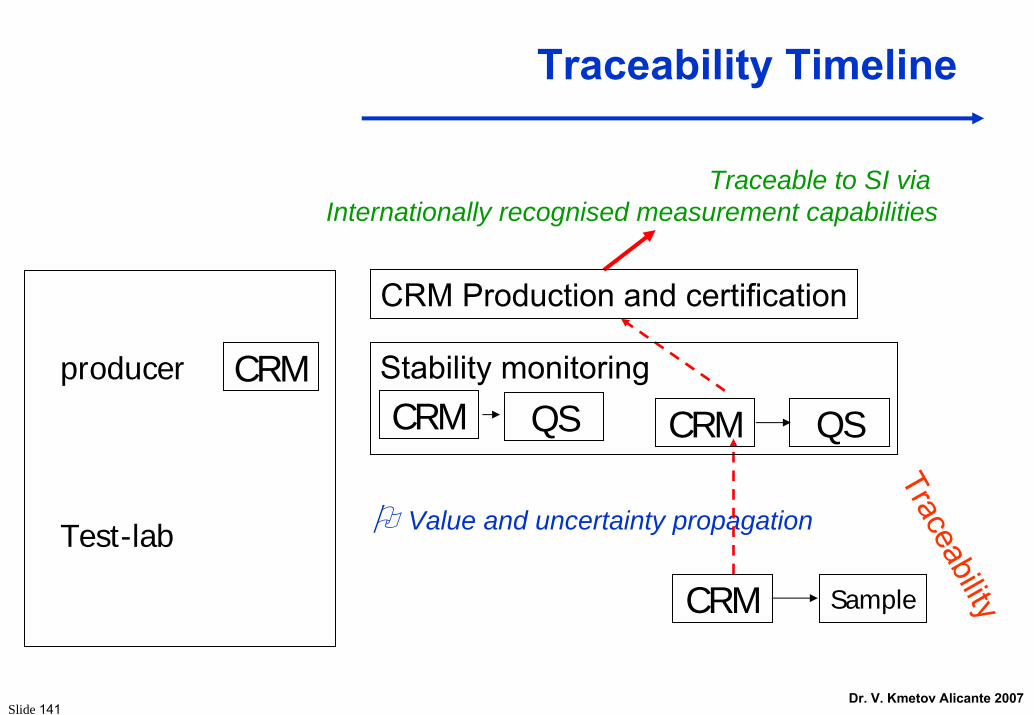
Traceability Timeline
Traceable to SI via Internationally recognised measurement capabilities
producer
Test-lab
CRM
Value and uncertainty propagation
CRM Production and certification
Stability monitoring
SampleCRM
Traceability
CRM QS CRM QS

Slide 142Dr. V. Kmetov Alicante 2007
IRMM-RM 2003 ©

Slide 143Dr. V. Kmetov Alicante 2007
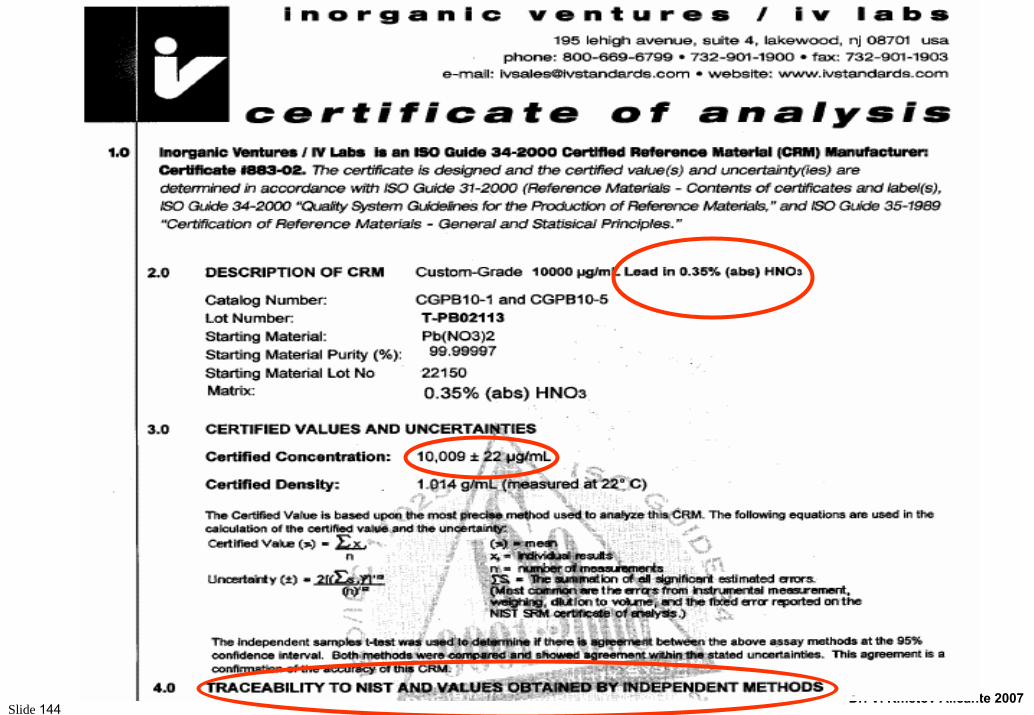
A high quality (C)RM should :
• State traceability of certified value (e.g. traceability to S.I., or to values obtained with method XYZ)
• State an ISO-GUM uncertainty of certified value
• Demonstrate traceability & uncertainty of certified value (e.g. in a certification report ; experimental evidence of demonstrated capability from participation to international intercomparisons such as those from BIPM)
• Produced according to ISO-35 and ISO-34 (preferably)
OK, we can rely on (C)RMs
Slide 144Dr. V. Kmetov Alicante 2007

Slide 145Dr. V. Kmetov Alicante 2007
Who
needs to do which measurement
at which uncertainty ?
structured measurement system

The new challenge in the global measuring world
THE MUTUAL RECOGNITION
ARRANGEMEN
once measured
all measurements
accepted everywhere
It is easy to say, but is difficult to be accomplished !

Analysis of Gold Alloys Analysis of Gold Alloys by FAASby FAAS

Slide 148Dr. V. Kmetov Alicante 2007
Jamboree at JRC-IRMM 19-21 June 2006
TrainMiCTra in in g in Me t ro log y in Ch e m is t ry
Challenge of the best TrainMiC example
Slide 149Dr. V. Kmetov Alicante 2007
Let’s do it together
Please, read the next slides and try to identify:
– What is the intended use?
– What are the parameters that must be considered
for procedure validation?
– Which are the input quantities?
– How to build the uncertainty budget?

Slide 150Dr. V. Kmetov Alicante 2007
Introduction• The jewellery gold alloys contain as major components Au, Ag, Cu and Zn, which precise determination is of great importance.
• The fineness of precious metal alloys are specified in ISO 9202:1991, according to the purity of gold as ‰: 375, 585, 750 and 916 ( 9, 14, 18 and 22 karats respectively). One karat is equal to 41,667‰
• The Au analysis has to keep the expanded uncertainty (k=3) less than 9 ‰
• The traditional internationally recognised method is based on cupellation (fire assay) ISO Standard 11426.

Slide 151Dr. V. Kmetov Alicante 2007
Procedure descriptionGold alloy samples are stretched to folio with 0.3 - 0.4 mm thickness. The
surface is washed by 5% v/v HNO3. A dry piece of 0.1 g accurately weighted to +
0,0001 g is directly dissolved into a volumetric flask of 50 ml with 5ml freshly prepared
aqua regia.
The flask is heated on ceramic hot plate for 20 min. During this process Ag
precipitates as AgCl. AgCl is dissolved by adding of 10 g NH4Cl to the cooled solution
and total weigh of solution is made up to 50 g with BDW at (20°C).
The solution is diluted additionally by transferring 0,400 g with micro-pipette
to a conical vial adding 5% NH4Cl in order to keep the solution homogeneous with
final weight of 12,000 g gravimetrically controlled.
Procedural blank is subject to exactly the same sample preparation
procedure as the analysed sample.

Slide 152Dr. V. Kmetov Alicante 2007
Collection of a sample14 karat Au alloy
Gold alloy is stretched tofolio with 0.3 - 0.4 mm
thickness
Cleaning of the surface with5% v/v HNO3
Weighing of the sample0,1 g
Dissolved into a volumetricflask of 50 ml by 5ml freshly
prepared aqua regia.
ASDI-FAASMeasurement
[(St1_sample_St2)*N]
Weighing of 0. 1g 99,99% pure gold. Dissolution with aqua regia and made
up to 100g with BDW
Preparation of calibration standards St1 and St2
Dissolvation of AgCl by adding of 10 g NH4Cl
Dilution of 0,4 g sample solution with 11.6 g 5% NH4Cl
N repeats of sets andSignals treatment
Recovery correctionCalculation of result

Slide 153Dr. V. Kmetov Alicante 2007
Uncertainty sources1. Conversion of alloy to homogeneous solution and total amount of gold to be
transferred into the solution
• Use the trick with NH4Cl
2. Dilution factor
• Use minimum steps
• Be sure that your (results) balances and glassware are traceable
3. Standards for calibration
• Provide standards with certificate (traceable)
• Make fresh standard from pure gold 99,99 certified
4. Repeatability of absorption measurements
• Work with the best S/N ratio according the scedastic curves
• Remove drift by standard-sample-standard sequence
• Apply signal smoothing and ensemble summation

Slide 154Dr. V. Kmetov Alicante 2007
Instrumental conditions
Table 1 Instrumental parameters for ASDI-FAAS determination of Au
FAAS parameters values ASDI parameters
Au spectral line (nm)
Au spectral slit
242,8
0,7
Ql- aspiration rate 6,4 ml/min checked by BDW
Injection time 5 s; Injection volume ≈ 0,530 µL
Au Hollow cathode lamp current 10 mA Washing time 10 s; Total replicate time 15 s
Air/C2H2 units
Observation high (mm)
50/18
6
Smoothing Savitzky-Golay 24 points
Ensemble summation N signal profiles
Working range ppm
Deuterium BG corrector
37 - 43
OFF
Pseudo plateau 3 s
Sampling mode (St1 _ sample _ St2 )* N
Readings – points/s 50 Total time for one set 66 s

Slide 155Dr. V. Kmetov Alicante 2007
1. Calibration standardsAn initial Au standard solution C_Au_999,9 mg/L is prepared by dissolution
of 0,1 g pure gold 99,99 % (certified from Non-Ferrous Metallurgical Plant Plovdiv) with 5 ml aqua regia filled up to 100 g with 5 % NH4Cl.
Two calibration standard solutions with concentration 37 and 43 µg/grespectively are prepared in 5 % NH4Cl.Both calibration standards are obtained in polypropylene vials after further dilution of 0.370 g and 0.430 g from initial standard solution made up with procedural blank solution to 10.000 g (gravimetrically controlled).
10
43,0__999,92 _
*_G
GCC p
AuSt =
4
100_999,9 10*
__*_
GpurityAupureAumC Au =
10
37,0__999,91 _
*_G
GCC p
AuSt =

Slide 156Dr. V. Kmetov Alicante 2007
ASDI-FAAS
Air Segmented Discrete Introduction Flame Atomic Absorption Spectrometry (ASDI-FAAS)- way to improve signal-noise ratio

Slide 157Dr. V. Kmetov Alicante 2007
AZ
plateau
SOLVENT SOLVENTSAMPLE
ASDI-FAAS pseudo-steady state signals
Nu
u setoneAA
___
_=

Slide 158Dr. V. Kmetov Alicante 2007
ASDI-FAAS pseudo-steady state signals
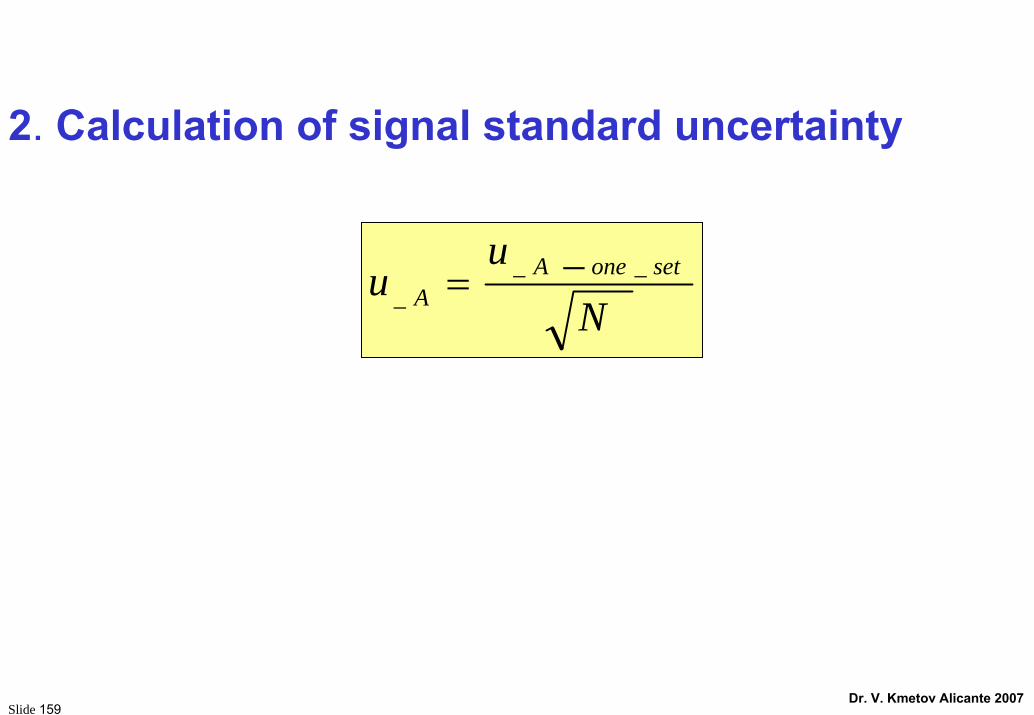
Slide 159Dr. V. Kmetov Alicante 2007
Nu
u setoneAA
___
_=
2. Calculation of signal standard uncertainty
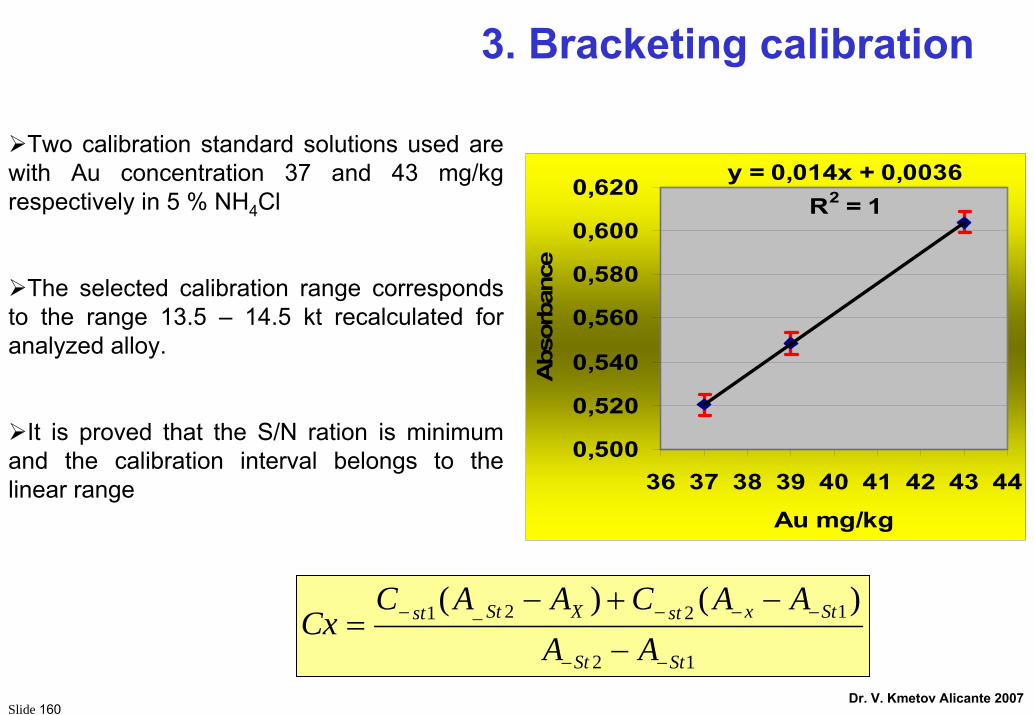
Slide 160Dr. V. Kmetov Alicante 2007
3. Bracketing calibration
Two calibration standard solutions used are with Au concentration 37 and 43 mg/kg respectively in 5 % NH4Cl
The selected calibration range corresponds to the range 13.5 – 14.5 kt recalculated for analyzed alloy.
It is proved that the S/N ration is minimum and the calibration interval belongs to the linear range
y = 0,014x + 0,0036R2 = 1
0,500
0,520
0,540
0,560
0,580
0,600
0,620
36 37 38 39 40 41 42 43 44
Au mg/kgA
bsor
banc
e
12
122_1 )()(
StSt
StxstXStst
AAAACAAC
Cx−−
−−−−
−
−+−=

Slide 161Dr. V. Kmetov Alicante 2007
6. Gold content (‰) in jewellery gold alloys
RC
GG
mV
oW xP
vials 1*.4,0_
_**
10001%_ 12
1,0_
50_=
%__%_
refWWR =
5. Recovery correction

Slide 162Dr. V. Kmetov Alicante 2007
The
Valid
atio
n Ch
eckl
ist
The Validation Menu
selectivity/interference
recovery
linearity, working range
LOD, LOQ
repeatability,
within-lab reproducibility
robustness
quality control
exp uncertainty
traceability
??
??
??
??
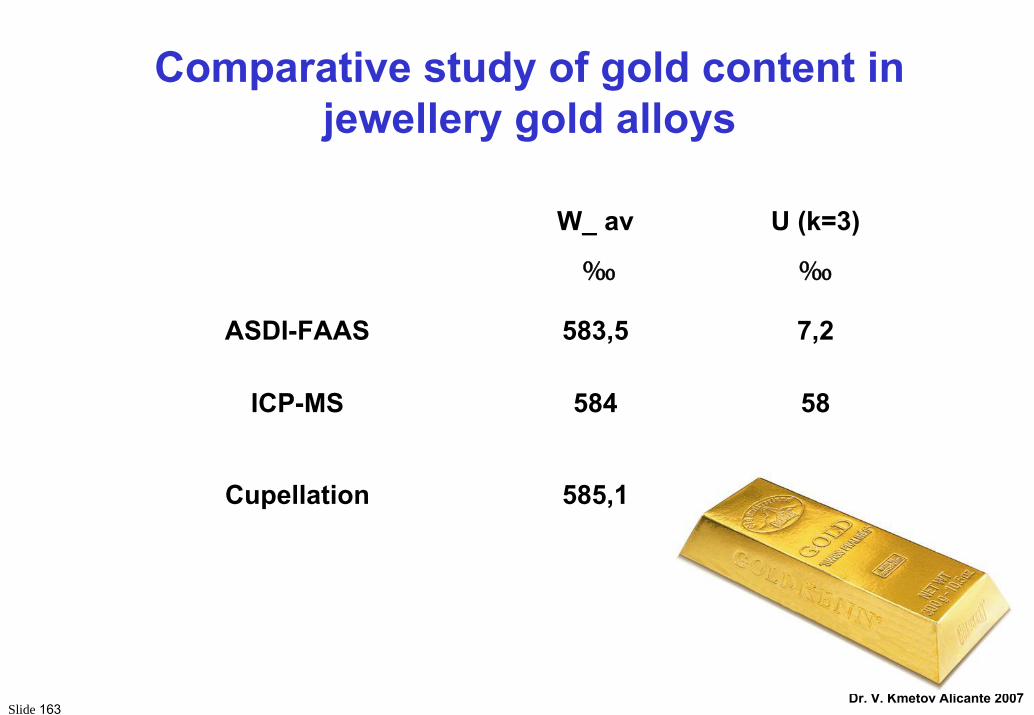
Slide 163Dr. V. Kmetov Alicante 2007
W_ av
‰
U (k=3)
‰
ASDI-FAAS 583,5 7,2
ICP-MS 584 58
Cupellation 585,1 -
Comparative study of gold content in jewellery gold alloys

Slide 164Dr. V. Kmetov Alicante 2007
For all of you who succeed to understand our example……….
enjoy the picture!
THE TRUSTTHE TRUST