metropolitan planning organization ... - university of florida
TRANSCRIPT

Metropolitan Planning Organization
Training and Resources
for the Sea Level Scenario
Sketch Planning Tool
Post Evaluation Report
Contract BDV31 932-03 December 2017
Prepared for Florida Department of Transportation
Office of Policy Planning
Prepared by the University of Florida GeoPlan Center

ii
Acknowledgements
We would like to thank the following individuals and organizations for their assistance in
organizing and conducting these training workshops:
• Maria Cahill
• Dennis Smith
• Jennifer Carver, FDOT OPP
• Denise Imbler & Kwentin Eastberg, Apalachee Regional Planning Council
• Greg Burke, Capital Region TPA
• Jessica Paul, West Florida RPC
• Allison Yeh and staff of Hillsborough MPO
• Mike Maholtz & Leigh Holt, Sarasota/Manatee MPO
• James Cromar, Buffy Sanders, Charlene Burke, and Peter Gies, Broward MPO
• Peter Buchwald and Yi Ding, St. Lucie TPO
• Denise Bunnewith, North Florida TPO
• Stephan Harris and Pamela Blankenship, River to Sea TPO
• Sarah Kraum and Steven Bostel, Space Coast TPO
• Tara McCue, East Central Florida RPC
• Holly Abeels, University of Florida IFAS Extension Brevard
• Staff at Brevard County Emergency Management Office
• GeoPlan Center staff and students: Reginald Pierre-Jean, Erik Finlay, Lex Thomas,
Kate Norris, Rosemarie Fusco, Sam Palmer, Danny Downing, and Lance Barbour.

iii
Executive Summary
Florida is particularly vulnerable to the impacts of SLR due to the State’s low elevation,
extensive coastline, and high populations living in the coastal zone. Sea level rise will affect
coastal environments, both natural and built, with impacts extending into the State’s
economy. Understanding, analyzing, and planning now for the impacts of SLR on the
State’s transportation system is critical for ensuring a robust and resilient economy moving
into the future. Planning for the impacts of SLR is a complex process and communities
often lack the technical, financial, and human resources needed to get started. Access to
data and tools to assist in the identification of vulnerable areas is needed, as well as access
to training and resources to ensure that data is utilized and interpreted appropriately.
In the fall of 2017, the University of Florida GeoPlan Center organized and conducted
training workshops across the State to teach individuals on how to use the Sea Level
Scenario (SLS) Sketch Planning Tool. The SLS Sketch Planning Tool was developed by the
UF GeoPlan Center, with funding from the Florida Department of Transportation, to assist
in the identification and assessment of transportation facilities at risk to current and future
flood hazards. This project sought to build capacity of regional transportation agencies and
their partners through training and education on geospatial tools and data for assessing
coastal flood hazards to transportation infrastructure.
Nine training workshops were held at eight locations around the State in October and
November of 2017. The training workshops attracted 147 attendees from local, regional,
state, and federal governmental agencies, non-governmental agencies, non-profits, tribal
government, academic institutions, private companies, and the public. The diverse range
of participants showed the wide interest and demand for learning about tools and data to
assess SLR, coastal flooding, and impacts to the transportation system. Feedback on the
training workshops was very positive, as indicated in the training evaluation responses. An
overwhelming majority of attendees found the training workshop useful and informative.
Positive responses and feedback from the participants indicates the need for these types of
data and tools for assessing coastal flood hazards, as well as the need for continued training
and education opportunities. Additionally, the high volume of climate science that
continues to develop needs to be incorporated into our data and tools for iterative
assessment of our rapidly changing State.

iv
Contents Acknowledgements .................................................................................................................................... ii
Executive Summary.....................................................................................................................................iii
Project Background ..................................................................................................................................... 1
Training Workshops .................................................................................................................................... 2
Goals and Objectives............................................................................................................................... 2
Training Content ..................................................................................................................................... 2
Training Dates & Locations ..................................................................................................................... 3
Results ........................................................................................................................................................ 6
Attendance ............................................................................................................................................. 6
Feedback ................................................................................................................................................. 8
Images from Training Workshops ......................................................................................................... 11
Conclusion ................................................................................................................................................ 14
Appendix A. Training Evaluation ............................................................................................................... 15
Appendix B. Summary of Responses: Training Evaluations ....................................................................... 18
Appendix C. Data Needs Survey ............................................................................................................... 30
Appendix D. Summary of Responses: Data Needs Survey ........................................................................ 33

1
Project Background Since 2012, researchers at the University of Florida (UF) GeoPlan Center have been
working with the Florida Department of Transportation (FDOT) to develop geospatial data
and tools to assess the potential impacts of sea level rise (SLR) on the transportation
system in Florida. In 2012-13, the UF GeoPlan Center completed its first phase of this SLR
research under a project entitled “Development of a Geographic Information System (GIS)
Tool for the Preliminary Assessment of the Effects of Predicted Sea Level and Tidal Change
on Transportation Infrastructure” (Research office contract BDK75-977-63). During Phase
1, UF GeoPlan Center developed the Sea Level Scenario (SLS) Sketch Planning Tool to
facilitate the identification of transportation infrastructure potentially at risk from
projected sea level changes. The purpose of the tool is to visualize various sea level
scenarios at future time periods to inform transportation planners and highlight
infrastructure for potential avoidance, minimization, or mitigation.
In 2013-15, the UF GeoPlan Center, working with the FDOT Office of Policy Planning (OPP),
completed a second phase of SLR research entitled “Testing and Enhancement of the
Florida Sea Level Scenario Sketch Planning Tool”, referred to as “Phase 2”. In Phase 2, the
GeoPlan Center and FDOT OPP worked with two Metropolitan Regional Planning
Organizations (MPOs) to test the tool’s usefulness for planning at the MPO or local scale.
Both MPOs were awarded grants through the Federal Highway Administration (FHWA)’s
Climate Change Resilience Pilot Program, which has funded partners to assess
infrastructure vulnerability to the impacts of sea level changes and extreme weather
events, determine adaptation options, and improve resiliency of infrastructure. This
opportunity allowed for testing of the SLS Sketch Planning Tool with partners who could
benefit from the tools, while providing feedback on usability enhancements.
In 2015-2017, the UF GeoPlan Center, again with FDOT OPP, completed a third phase of
work entitled “Updating the Florida Sea Level Scenario Sketch Planning Tool”. In Phase 3,
updates and improvements were made to the SLS Sketch Planning Tool based on
recommendations and feedback from Phase 2 and incorporation of the latest available data
and science. Major updates completed in this phase of work included: re-run of the SLR
models of inundation and affected infrastructure using updated input data and corrected
bridge elevation data; development and deployment of a new, modern web map viewer for
data visualization; update of the GIS calculator tool; addition of current flood risk layers
and transportation analyses; modeling and assessment of storm surge data; and
development of a method for assessing multiple flood risks to transportation facilities.
Continuing the work on the SLS Sketch Planning Tool, under this project the UF GeoPlan
Center developed and offered technical training workshops on how to utilize the SLS
Sketch Planning Tool for planning for resilient transportation infrastructure.

2
Training Workshops
Goals and Objectives
The purpose of the workshops was to train coastal MPO staff in Florida and their local and
regional partners on how to become technically proficient with the SLS Sketch Planning
Tool. The data and tools can assist MPOs and municipalities in understanding how future
sea level rise may impact their regional transportation systems. Target audience for the
training was staff from regional transportation agencies (MPOs/TPOs/TPAs), regional
planning councils, county or municipal staff and community partners involved in
transportation planning, coastal resiliency efforts, and GIS and mapping. Focus was on
agencies located in coastal areas that are subject to current and future coastal flood
hazards.
Learning Objectives for the participants included:
• Describe basic concepts regarding global sea level rise and SLR impacts;
• Describe SLR projections from U.S. Army Corps of Engineers (USACE) and National Oceanic and Atmospheric Administration (NOAA);
• Apply training exercises to build proficiency in operating the new SLS Sketch Planning Tool online map viewer,
• Apply techniques to view and analyze current flood risk areas, projected future flood areas from SLR, and affected infrastructure using the online map viewer;
• Recognize how to download GIS layers of SLR and affected transportation;
• Recognize how to run the SLR Inundation Surface Calculator for ArcMap (Optional for those with ArcGIS software).
Training Content
The GeoPlan Center developed a four-hour training session, which included a combination
of lectures, tool demonstrations, and training exercises for the participants. The first half of
the training session was structured to deliver to participants background information on
sea level rise, mapping inundation, data and methods used to develop the SLS Sketch
Planning Tool, and a live demonstration of the SLS Sketch Planning Tool components. The
second half of the training session was structured with technical exercises that participants
followed to learn specific functionality of the online map viewer.

3
Training workshop components were as follows:
Time Content Format
1 hour Background on Sea Level Rise, SLR Projections & Impacts
Sketch Tool: Purpose, Data & Methods
Lecture
45 minutes Guided Demo of SLS Map Viewer Tool Demonstration
45 – 60 minutes
Map Viewer Exercises: Follow Printed Exercises in your binder. Optional: For those with GIS software: How to install and run SLR Inundation Surface Calculator.
Training Exercises
45 minutes Group Exercise: Vulnerability Assessment. Training Exercises
30 minutes Report out. Presentation of findings from groups. Participant Presentation
Training materials were printed and organized into binders, which were provided to
participants to keep. Materials included presentation from lecture; training exercises;
tutorials on how to use the map viewer, GIS data, and SLR Inundation Surface Calculator;
and regional profiles of affected infrastructure.
Regional profiles of transportation impacts were developed for each region. The profiles
quantified the amount of affected transportation infrastructure from various SLR scenarios
using the data developed in the SLS Sketch Planning Tool. The purpose of the profiles is to
characterize the projected transportation impacts in each region and assist each coastal
MPO in understanding how and when future SLR may impact their transportation system.
Training Dates & Locations
Nine training workshops were conducted in eight locations around the State. Training
locations were selected based on the availability of training facilities and the centrality of
location for multiple MPOs to access, with the goal of holding at least one training in each
FDOT District. In Southeast Florida, it was recommended by the MPOs and FDOT District 4
staff that the Southeast Florida Regional Climate Change Compact counties (Broward,
Miami-Dade, Monroe, and Palm Beach) be included together in one training. Hence, one
training was conducted in Fort Lauderdale for FDOT District 6 & the southern portion of
District 4 (Broward & Palm Beach). The northern half of FDOT District 4, which includes
counties not in the Southeast Florida Regional Climate Change Compact, were included in a
training in Port St. Lucie. All training dates and locations are listed below.

4
For each training, a local host assisted with developing and contacting regional
stakeholders appropriate for participating in the training workshop. The participation of
the local hosts was critical for the workshop planning, coordination, and outreach to local
participants that would benefit from the training. We were fortunate to have enthusiastic
and helpful hosts in each region.
List of Training Dates and Locations
Training 1: District 3 East - Tallahassee
Monday, October 9, 10am – 3pm
Tallahassee City Hall, Tallahassee Room, 300 S Adams St, Tallahassee, FL 32301
Local hosts: Capital Region TPA and Apalachee Regional Planning Council
Training 2: District 3 West - Destin
Tuesday, October 10, 10am – 3pm
Destin Community Center, Calhoun Room, 101 Stahlman Ave, Destin, FL 32541
Local host: West Florida Regional Planning Council
Training 3: District 7 - Tampa
Monday, October 16, 8:30am – 12:00pm
Hillsborough MPO, 601 E Kennedy Blvd # 18, Tampa, FL 33602
Local host: Hillsborough County MPO
Training 4: District 1 - Sarasota
Thursday, October 26, 10am – 3pm
Sarasota County MPO, 7632 15th St E, Sarasota, FL 34243
Local host: Sarasota-Manatee MPO
Training 5: District 6 and District 4 South
Friday, October 27*, Workshop 1: 9:00a – 12:00pm and Workshop 2: 1:30pm – 4:30pm
Broward MPO, 100 W Cypress Creek Rd #650, Fort Lauderdale, FL 33309
Local host: Broward MPO
Training 6: District 4 North
Date: Tuesday, October 31, 9am – 2pm
Location: St. Lucie TPO, 466 SW Port St Lucie Blvd #111, Port St Lucie, FL 34953
Local host: St. Lucie TPO
Training 7: District 2 - Jacksonville
Friday, November 3, 10am – 3pm
North Florida TPO, 980 N Jefferson St, Jacksonville, FL 32209
Local host: North Florida TPO
5
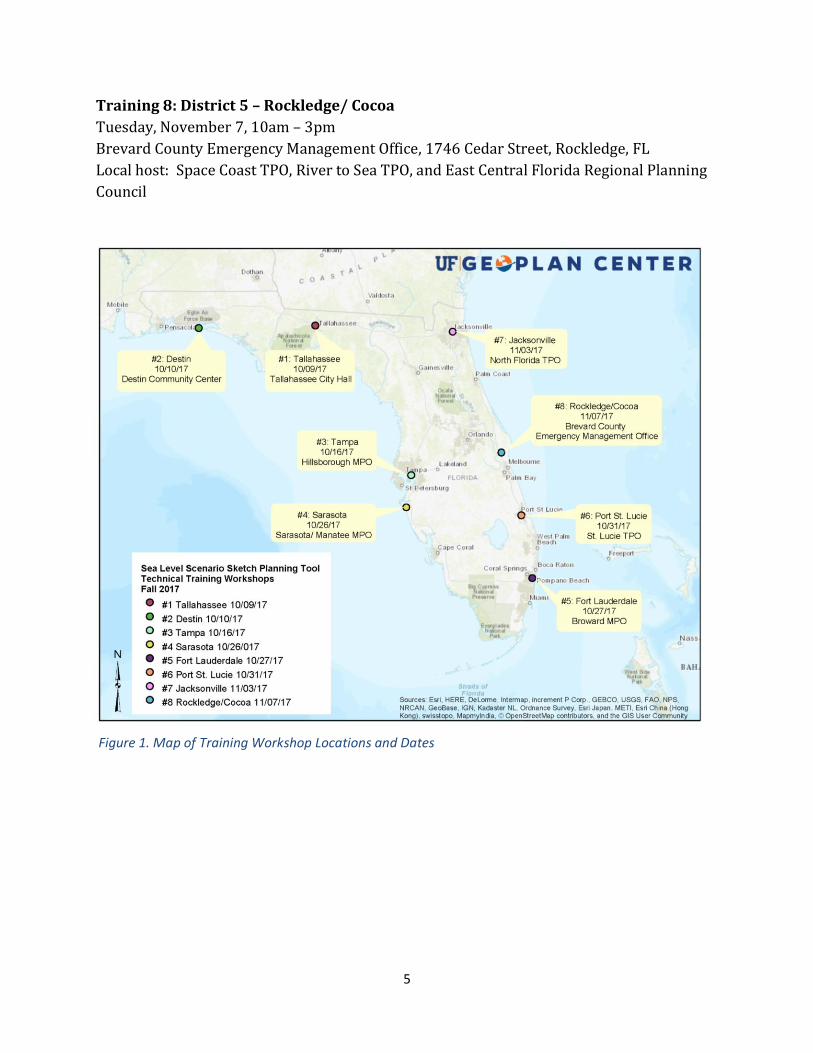
Figure 1. Map of Training Workshop Locations and Dates
Training 8: District 5 – Rockledge/ Cocoa
Tuesday, November 7, 10am – 3pm
Brevard County Emergency Management Office, 1746 Cedar Street, Rockledge, FL
Local host: Space Coast TPO, River to Sea TPO, and East Central Florida Regional Planning
Council

6
Results
Attendance
There were 147 attendees for all nine training workshops. Figure 2 below shows the
number of attendees per location. In Fort Lauderdale, two training workshops were
offered to accommodate more participants. Figure 3 below shows the number of attendees
by organization type.
Figure 2 . Attendees by Location. Total attendees for all locations = 147
Figure 3 . Attendees by Organization Type. Total attendees for all locations = 147.

7
The training workshops attracted various people from local, regional, state, and federal
governmental agencies, non-governmental agencies, tribal government, academic
institutions, private companies, and the public. This diverse range of participants showed
the wide interest and demand for learning about tools and data to assess SLR, coastal
flooding, and impacts to the transportation system. The map below shows the geographic
distribution of attendees from local, regional, and tribal governments and agencies.
The training workshops included participation from:
• 34 staff from 19 municipalities
• 28 staff from 9 counties
• 23 staff from 16 private companies
• 21 staff from 12 MPOs/ TPOs/ TPAs
• 11 staff from 6 Regional Planning Councils
• 14 staff from 4 state agencies
• 5 staff from 3 universities
• 4 staff from 4 NGOs/Non-profits
• 2 staff from 2 federal agencies
• 2 staff from 1 tribal government (The Seminole Tribe)
• 2 citizens
• 1 staff from 1 Water Management District (WMD)
Figure 4. Map of Training Attendees from Local & Regional Governments & A gencies

8
Feedback
At the end of the training workshop, the attendees were given a training evaluation and a
data needs survey. The purpose of the training evaluation was to assess the quality and
effectiveness of the workshop material and gather feedback from participants on any
suggested improvements and what they found most useful from the training. The purpose
of the data needs survey was to get feedback from participants on the types of data and
tools needed for coastal resiliency planning.
Feedback on the training material was very positive, as indicated in the training evaluation
responses (which are included in Appendix 2). There were 147 total attendees for all nine
trainings and 123 attendees returned training evaluations, for a 83% response rate.
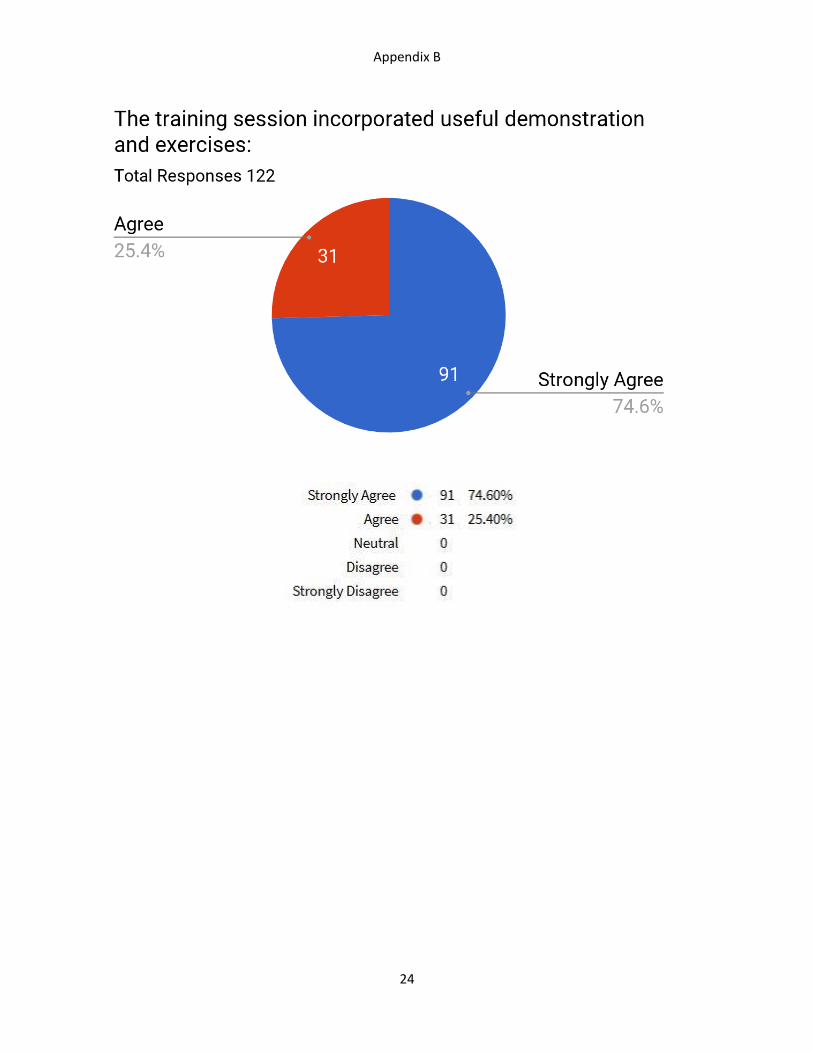
Below are highlights from the responses. The full responses are included in Appendix 2. For
the questions below, there were 5 choices: Strongly Agree, Agree, Neutral, Disagree, and
Strongly Disagree. No attendees chose “Disagree” or “Strongly Disagree”.

9

10
Sample of Comments Left by Attendees:
• “Great training. I liked the participant presentations at the end.”
• “A very valuable workshop. We can begin using the SLR tool right away for numerous projects.”
• “Great tool, great training, very useful. Keep up the great work.”
• “Great workshop and really looking forward to using the tool in my work.”
• “Great information and available technology - we just need to use. “
• “Excellent workshop and excellent analytical tool”
• “Well done training, looking forward to future opportunities from this department”
• “Great class! I feel well equipped to use the tool and to share with others”
• “This session was very informative. i look forward to sharing this knowledge with my colleagues. “
• “Great Inclusiveness - great exposure to others working in the domain. “
• “Excellent Session, appreciate the quality of the User Guide”

11
Images from Training Workshops
Below are images from the training workshops. The first image on this page is from the
Rockledge workshop, which was held at the Brevard Emergency Operations Center. The
second image is from the Port St. Lucie workshop, which was held at the St. Lucie TPO.

12
Images below are attendees working on training exercises at the Fort Lauderdale training
workshops, which were held at the Broward MPO.

13
Attendees from
Tallahassee workshop
pictured to the left
Attendees from
Rockledge workshop
pictured to the right
The end of the workshop included an assignment where attendees worked in groups to
prepare a vulnerability assessment using the online map viewer and techniques learned
during the training sessions. The pictures below show groups from three different
workshops presenting their vulnerability assessments and the information and maps
created using the SLS Sketch Planning Tool.
Attendees from
Sarasota workshop
pictured to the right

14
Conclusion Planning for sea level rise and related coastal flooding issues is a complex process, but one
that the State should continue to support to ensure its economic viability. Access to data
and tools to assist in the identification of vulnerable areas is a critical part of the planning
process. Additionally, continued training and resources are needed to ensure that the data
is utilized and interpreted appropriately. This project sought to build capacity of regional
transportation agencies and their partners through training and education on geospatial
tools and data for assessing coastal flood hazards to transportation infrastructure. The
diverse range of participants showed the wide interest and demand for learning about
tools and data to assess SLR, coastal flooding, and impacts to the transportation system.
Positive responses from the participants indicated that they found the training workshop
useful and informative. Feedback from the participants indicates the need for these types
of data and tools for assessing coastal flood hazards, as well as the need for continued
training and education opportunities. The high volume of climate science that continues to
develop needs to be incorporated into our data and tools for iterative assessment of our
rapidly changing State.

Appendix A
15
Appendix A. Training Evaluation
This appendix includes the training evaluation that was distributed to attendees after the
training workshop.

Training Evaluation
Thank you for joining The University of Florida GeoPlan Center for our Fall 2017, SLS technical training workshop. We greatly appreciate, and benefit from, your responses.
*For 1-7 please circle the response you feel is best
1. Overall, the SLS Tool training met or exceeded my expectations:
Strongly Disagree Disagree Neutral Agree Strongly Agree
2. The presenters met or exceeded my expectations:
Strongly Disagree Disagree Neutral Agree Strongly Agree
3. The presenters explained the training content thoroughly:
Strongly Disagree Disagree Neutral Agree Strongly Agree
4. The training provided useful ideas or techniques for my profession:
Strongly Disagree Disagree Neutral Agree Strongly Agree
5. The training session incorporated useful demonstration and exercises:
Strongly Disagree Disagree Neutral Agree Strongly Agree
6. I would recommend this training to others in my field of work:
Strongly Disagree Disagree Neutral Agree Strongly Agree
7. The content of this event was:
Very Basic Somewhat Easy Neutral Hard Very Advanced
8. What did you find most successful about the training? (mark all that apply)
❏ The SLS Tool in general ❏ Overview of sea level change concepts ❏ SLS Tool demonstration ❏ Using the online map viewer exercise ❏ Vulnerability assessment exercise ❏ Other: __________________________
9. I would like to see future training sessions on these subjects:
_____________________________________________________________________________________
_____________________________________________________________________________________
_____________________________________________________________________________________

We look forward to seeing you again.
Thank you for your feedback.
10. How would you improve this training session (mark all that apply)
❏ No improvements needed ❏ Reduce the content covered in the workshop ❏ Increase the content covered in the workshop ❏ Make the training less difficult ❏ Make the training more difficult ❏ Slow down the pace ❏ Speed up the pace ❏ Shorten the time allocated ❏ Allot more time ❏ Other: __________________________
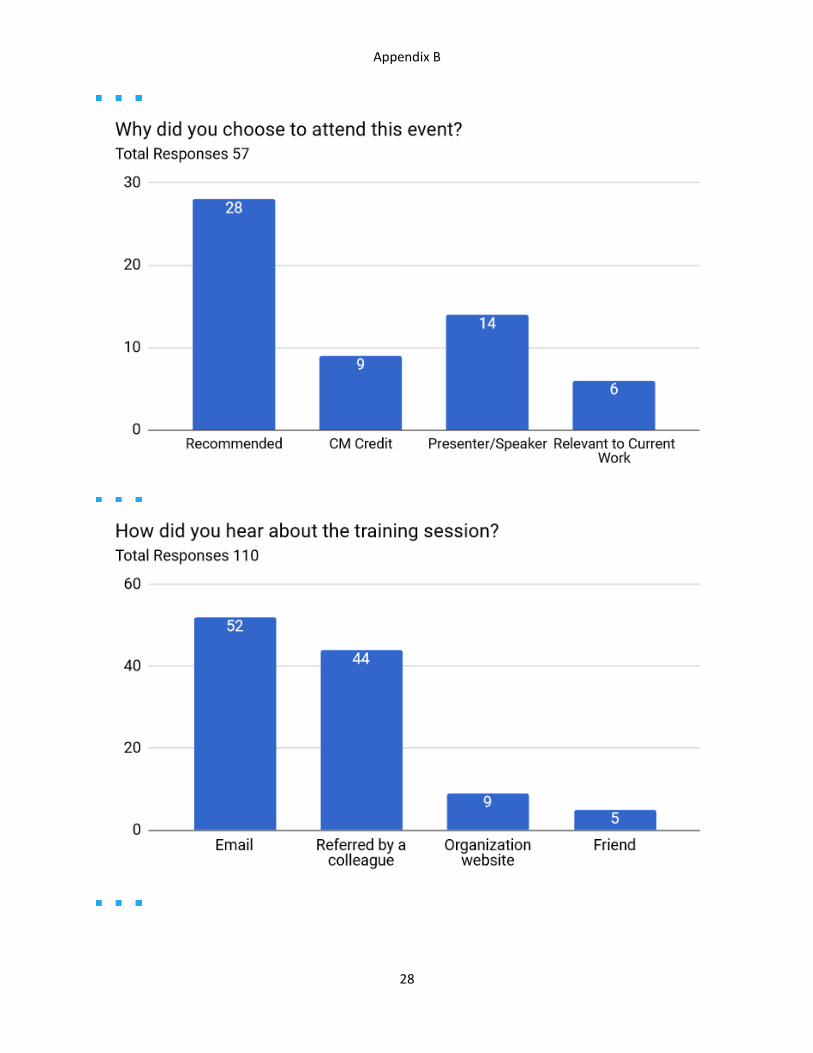
11. Why did you choose to attend this event? (mark all that apply)
❏ Topic ❏ Presenter/Speaker ❏ CM credit ❏ Recommended ❏ Other: __________________________
12. How did you hear about the training session:
❏ Email ❏ Referred by a colleague ❏ Organization website ❏ Friend ❏ Other: __________________________
13. Your Organization Type:
❏ MPO / TPO / TPA ❏ State ❏ County Government ❏ City / Municipal Government ❏ Regional Planning Council ❏ Private ❏ Citizen ❏ Education ❏ Other
14. Any additional comments or feedback:
_____________________________________________________________________________________
_____________________________________________________________________________________
_____________________________________________________________________________________

Appendix B
18
Appendix B. Summary of Responses: Training Evaluations
This appendix includes a summary of the post-workshop evaluation responses from the nine training workshops on the SLS Sketch Planning Tool offered between in October
and November 2017. Of the 147 total attendees, 123 evaluation forms were returned. Not all questions were answered in the 123 returned forms.

Appendix B
19
Evaluation Responses:

Appendix B
20

Appendix B
21

Appendix B
22

Appendix B
23
Appendix B
24

Appendix B
25

Appendix B
26

Appendix B
27
Appendix B
28
Appendix B
29
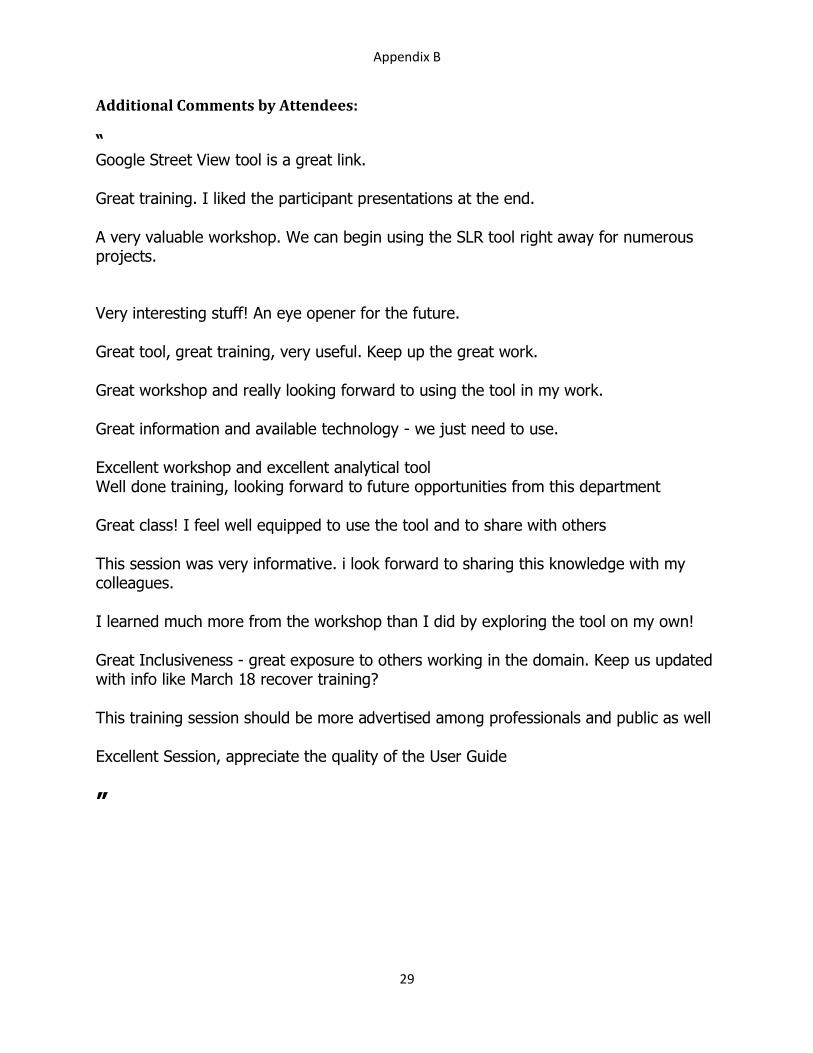
Additional Comments by Attendees:
“
Google Street View tool is a great link.
Great training. I liked the participant presentations at the end.
A very valuable workshop. We can begin using the SLR tool right away for numerous projects.
Very interesting stuff! An eye opener for the future.
Great tool, great training, very useful. Keep up the great work.
Great workshop and really looking forward to using the tool in my work.
Great information and available technology - we just need to use.
Excellent workshop and excellent analytical tool Well done training, looking forward to future opportunities from this department
Great class! I feel well equipped to use the tool and to share with others
This session was very informative. i look forward to sharing this knowledge with my colleagues.
I learned much more from the workshop than I did by exploring the tool on my own!
Great Inclusiveness - great exposure to others working in the domain. Keep us updated with info like March 18 recover training?
This training session should be more advertised among professionals and public as well
Excellent Session, appreciate the quality of the User Guide
”

Appendix C
30
Appendix C. Data Needs Survey
This appendix includes the data needs survey that was distributed to attendees after the training workshop.

Data Needs Survey
The following survey is to help us understand the types of data and tools needed for coastal resiliency planning. Please answer as best you can.
1. Please list your organization type:
❏ MPO/ TPO/ TPA ❏ State ❏ County Government ❏ City Government ❏ City/ Municipal Government
❏ Regional Planning Council ❏ Private ❏ Citizen ❏ Education ❏ Other (please list): __________________
2. Does your organization currently have policies in place addressing resiliency of infrastructure to the related impacts of SLR and coastal flooding?
❏ Yes ❏ No, but planning to add ❏ No, and not planning to add
3. How well prepared does your organization’s staff feel about planning for coastal resiliency?
❏ Very well prepared ❏ Moderated prepared ❏ Somewhat prepared ❏ Not at all prepared ❏ Not concerned about coastal resiliency
4. Barriers to preparedness: (mark all that apply)
❏ Time ❏ Money ❏ Training/ education ❏ Data and tools
❏ Lack of interest/ support from stakeholders and public
❏ None ❏ Other (please list): __________________
5. Has your organization been involved in resiliency efforts or vulnerability assessments? If so please
explain.
_____________________________________________________________________________________
_____________________________________________________________________________________
_____________________________________________________________________________________

Thank you for your contribution.
6. What kind of GIS data does your organization need to assist with resiliency planning? (mark all that apply)
❏ Groundwater data ❏ Precipitation data ❏ Hurricane Storm Surge Models ❏ Lidar elevation data ❏ Locations of critical facilities ❏ Transportation facilities
❏ Traffic demand models ❏ Building footprints ❏ Parcels ❏ City Limits ❏ Socio-economic data ❏ Other (please list): ____________________
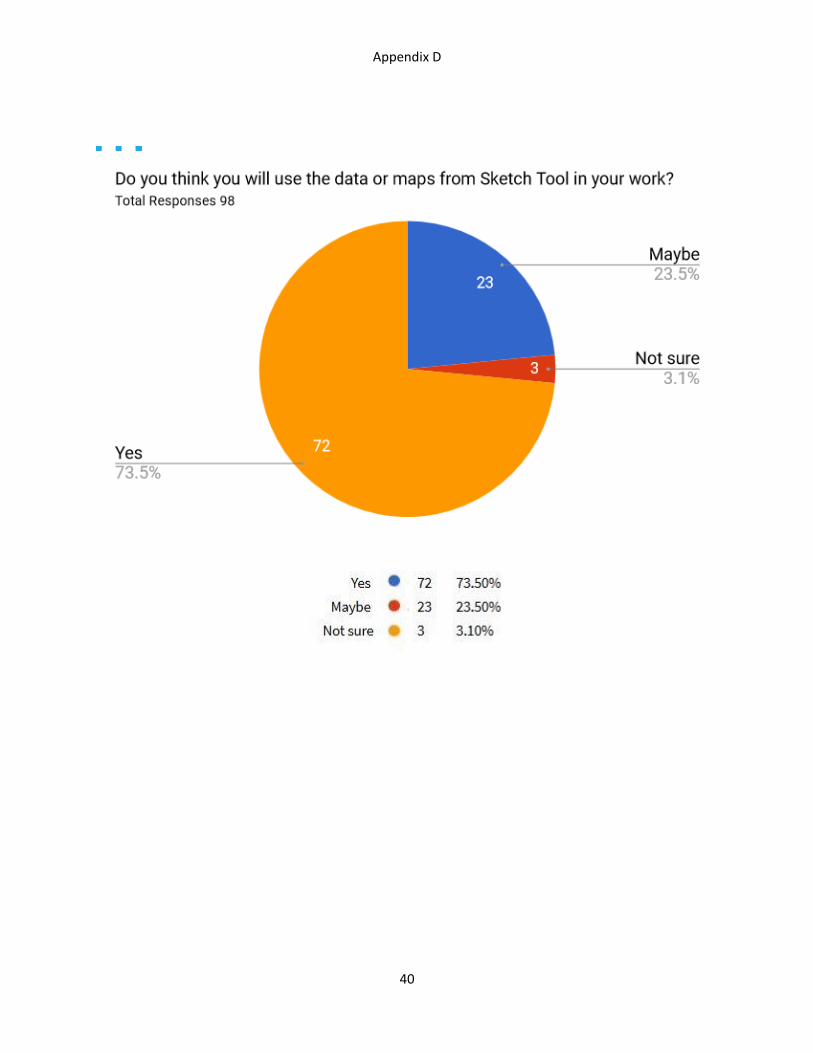
7. Do you think you will use the data or maps from Sketch Tool in your work?
❏ Yes ❏ No ❏ Maybe ❏ Not sure
8. What other data, visualization and analysis tools do you use for modeling flood risks? (mark all that apply)
❏ NOAA Coastal Flood Exposure Mapper ❏ NOAA Sea Level Rise Viewer ❏ Climate Central's Surging Seas Risk finder ❏ The Nature Conservancy Coastal Resilience ❏ FEMA Hazus -MH ❏ SLAMM – Sea Levels Affecting Marshes Model ❏ None ❏ Other (please list): ________________________
9. Please list any other data needs for resiliency planning not addressed here:
_____________________________________________________________________________________
_____________________________________________________________________________________
_____________________________________________________________________________________
10. If you have any general comments/ suggestions about the Sketch Tool, please list below.
_____________________________________________________________________________________
_____________________________________________________________________________________
_____________________________________________________________________________________

Appendix D
33
Appendix D. Summary of Responses: Data Needs Survey
This appendix includes a summary of the data needs survey responses from the nine
training workshops on the SLS Sketch Planning Tool offered between in October and
November 2017. Of the 147 total attendees, 110 data needs surveys were returned. Not all
questions were answered in the 110 returned surveys.

Appendix D
34
Survey Responses

Appendix D
35

Appendix D
36

Appendix D
37
Other responses for “Barriers to Preparedness” include:
“Governor”
“National Policy”
“Not effected directly”

Appendix D
38

Appendix D
39
Appendix D
40

Appendix D
41
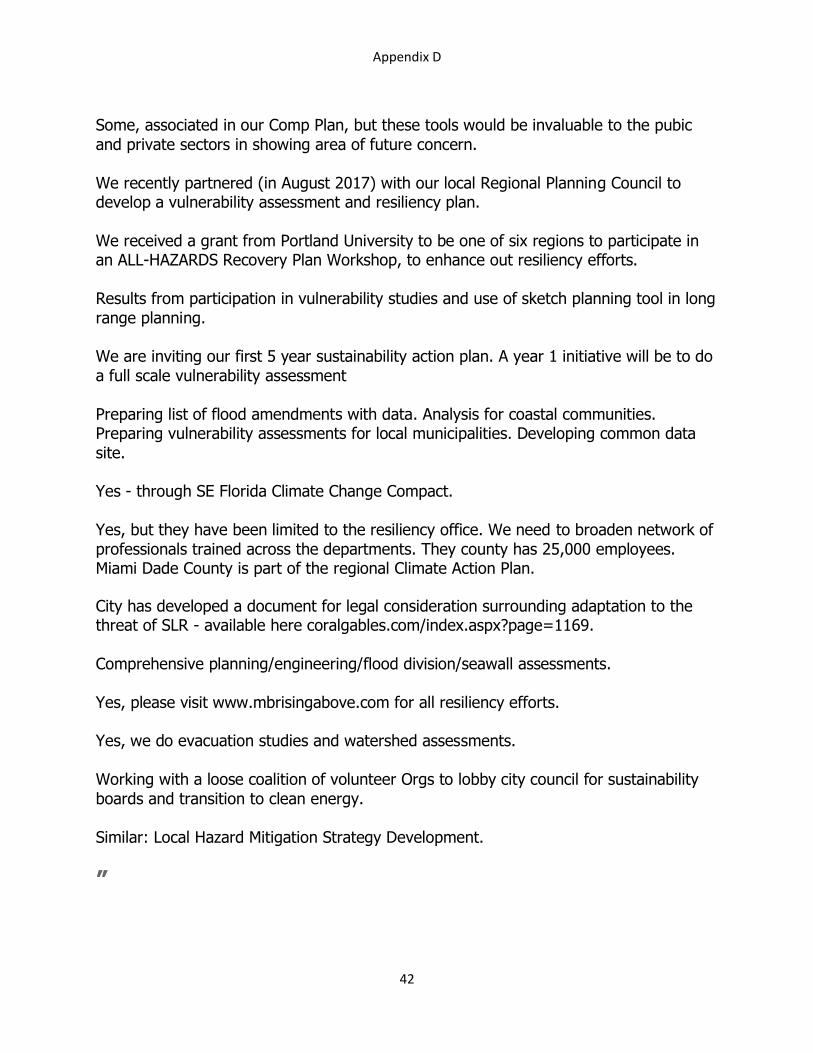
Short Answers from Attendees for “Has your organization been involved in resiliency
efforts or vulnerability assessments?”:
“
In a general sense, watershed management + water supply planning.
Involved in NOAA resiliency tool and conducting a Statewide Ecosystem Assessment of Coastal & Aquatic Resources (SEACAR).
Our comprehensive plan has many policies that address resiliency and climate adaptation.
Very involved in the statewide regional evacuation study. Help update local government Coastal Management Plans.
Sierra Club works to create awareness and understanding, regarding SLR threat, cause, and extent.
Not yet, but we plan to undertake regional vulnerability assessment as part of next LRTP 3 Project cycle.
Appendix D
42
Some, associated in our Comp Plan, but these tools would be invaluable to the pubic
and private sectors in showing area of future concern.
We recently partnered (in August 2017) with our local Regional Planning Council to develop a vulnerability assessment and resiliency plan.
We received a grant from Portland University to be one of six regions to participate in an ALL-HAZARDS Recovery Plan Workshop, to enhance out resiliency efforts.
Results from participation in vulnerability studies and use of sketch planning tool in long
range planning. We are inviting our first 5 year sustainability action plan. A year 1 initiative will be to do
a full scale vulnerability assessment
Preparing list of flood amendments with data. Analysis for coastal communities. Preparing vulnerability assessments for local municipalities. Developing common data
site. Yes - through SE Florida Climate Change Compact.
Yes, but they have been limited to the resiliency office. We need to broaden network of
professionals trained across the departments. They county has 25,000 employees. Miami Dade County is part of the regional Climate Action Plan.
City has developed a document for legal consideration surrounding adaptation to the threat of SLR - available here coralgables.com/index.aspx?page=1169.
Comprehensive planning/engineering/flood division/seawall assessments.
Yes, please visit www.mbrisingabove.com for all resiliency efforts. Yes, we do evacuation studies and watershed assessments.
Working with a loose coalition of volunteer Orgs to lobby city council for sustainability
boards and transition to clean energy.
Similar: Local Hazard Mitigation Strategy Development.
”

Appendix D
43
Additional Comments/Suggestions by Attendees:
“
Perhaps local site specific applications. Nice app! Good code base and functionality.
Would love to be able to add local data that is not in a map service.
The ability to import data into the tool (ex. shapefiles/internal rasters).
Amazing tool. Great viewer and functionality, and incredibly rich in content.
Great tool, will be more practical next year in this and other GIS projects.
If we could export the slide/compare, I think it would make a huge public impact.
Will you develop an ArcGIS Pro tool to compliment the ArcMap version? Make a swipe display in map to be printable.
Automatically clip extents to speed up the performance of software.
Provide the ability to run scenarios at the municipal level.
I believe an analysis on the occurrences of natural disasters should be implemented by utilizing current forecast models.
Ability to view data with features only.
Thank you very much for providing this free and very useful tool.
”