mgm resorts international second quarter 2016 earnings ......third quarter 2016 earnings...
TRANSCRIPT

MGM RESORTS INTERNATIONAL Third Quarter 2016 Earnings Presentation
November 7, 2016

1
Forward-Looking Statements
Statements in this presentation that are not historical facts are forward-looking statements, within the meaning of the Private Securities Litigation Reform Act of 1995 and involve risks and/or uncertainties, including those described in the Company's public filings with the Securities and Exchange Commission. The Company has based forward-looking statements on management’s current expectations and assumptions and not on historical facts. Examples of these statements include, but are not limited to, the Company’s expectations regarding future results (including REVPAR and other guidance), its ability to generate future cash flow growth and to execute on future development and other projects, such as the Profit Growth Plan, the expected results of the Profit Growth Plan, its ability to drive future growth across all room segments, and the Company’s ability to execute its strategic plan and improve its financial flexibility. These forward-looking statements involve a number of risks and uncertainties. Among the important factors that could cause actual results to differ materially from those indicated in such forward-looking statements include effects of economic conditions and market conditions in the markets in which the Company operates and competition with other destination travel locations throughout the United States and the world, the design, timing and costs of expansion projects, risks relating to international operations, permits, licenses, financings, approvals and other contingencies in connection with growth in new or existing jurisdictions and additional risks and uncertainties described in the Company’s Form 10-K, Form 10-Q and Form 8-K reports (including all amendments to those reports). In providing forward-looking statements, the Company is not undertaking any duty or obligation to update these statements publicly as a result of new information, future events or otherwise, except as required by law. If the Company updates one or more forward-looking statements, no inference should be drawn that it will make additional updates with respect to those other forward-looking statements.
Note Regarding Presentation of Non-GAAP Financial Measures
The following presentation includes certain “non-GAAP financial measures” as defined in Regulation G under the Securities Exchange Act of 1934, as amended. Schedules that reconcile the non-GAAP financial measures to the most directly comparable financial measures calculated and presented in accordance with Generally Accepted Accounting Principles in the United States are included on slide 38 and in our earnings releases that have been furnished with the SEC and are available on our website at www.mgmresorts.com.
.

Key Third Quarter Highlights
Diluted earnings per share was $0.93, including $0.60 related to a $430 million gain on Borgata acquisition and a $0.20 charge related to the NV Energy exit, compared to diluted earnings per share of $0.12 in the prior year quarter
Net income attributable to MGM Resorts of $536 million
Domestic resorts net revenues increased 16%, and increased 8% on a same-store basis1
RevPAR2 at the Company’s Las Vegas Strip resorts increased 11%
Domestic resorts Adjusted Property EBITDA increased 39%, and increased 31% on a same-store basis1
Best domestic resorts net revenues, Adjusted Property EBITDA, and Adjusted Property EBITDA margins since 20071
Profit Growth Plan contributed ~$78 million3 of year over year Adjusted EBITDA growth
CityCenter Resort Operations Adjusted EBITDA increased 41%
MGM China Adjusted EBITDA4 increased 15% due to its focus on operating efficiency, quality customer service, and focus on the mass customer
2
1 Excludes contributions from Borgata which the Company began consolidating in August of 2016 and Circus Circus Reno, which the Company sold in 2015 2 RevPAR is hotel revenue per available room 3 Includes Adjusted EBITDA impact contributed by domestic resorts plus 50% of CityCenter 4 Before licensing fee

Quarter Items at a Glance Successful Execution of Key Strategic Initiatives Positions The Company for Growth
3
• Borgata acquisition: • On August 1, 2016, MGM Resorts completed the previously announced acquisition of Boyd Gaming Corporation’s interest in
Borgata Hotel Casino and Spa (“Borgata”). In connection with the acquisition, the real estate assets associated with Borgata were sold to MGM Growth Properties LLC (“MGP”)
• Accretive transaction for both MGM & MGP pre-synergies and proves ability to transact at arm’s length • As a result of the transaction, MGM Resorts recorded a $430 million gain ($0.60 impact to diluted earnings per share)
• NV Energy exit: • Domestic Resorts Operating Income included $139 million NV Energy exit expense1 ($0.18 impact to diluted earnings per share)
CityCenter’s Operating Income included $26 million NV Energy exit expense2 (MGM Resorts’ 50% share: $13 million, or $0.02 impact to diluted earnings per share)
• Provides complete energy independence and opportunity for more competitive pricing, which we expect will yield immediate cost savings
• MGM China additional stake: • On September 1, 2016, MGM Resorts closed its acquisition of an additional 4.95% of the outstanding common shares of MGM
China. As a result, MGM Resorts now owns 56% of MGM China's outstanding common shares • The purchase represents a long-term strategic initiative whereby MGM reinforced its confidence in the Macau story
• Accessed the capital markets: • On August 19, 2016, MGM Resorts issued $500 million of 4.625% senior notes due 2026, the lowest pricing of any long-term
note offering in the history of our Company. Net proceeds from the offering, together with cash on hand, were used to redeem the $743 million 7.625% senior notes due 2017
• On August 12, 2016, the MGP Operating Partnership issued $500 million of 4.50% senior unsecured notes due 2026. Net proceeds were used in part to refinance amounts drawn under the revolving credit facility related to the Borgata acquisition
• The MGP Operating Partnership also re-priced its term loan B facility at par. As a result, pricing was reduced to LIBOR plus 2.75% with a 75bps floor, which represents a 50bps reduction
• Announced December 8, 2016 grand opening of MGM National Harbor 1 Domestic Resorts: $139 million includes $68 million upfront impact fee + accrual of $71 million non-bypassable rate charges 2 CityCenter: $26 million includes $12 million million upfront impact fee + accrual of $14 million non-bypassable rate charges

3Q 2016 Financial Highlights Domestic Resorts
• Domestic Net Revenue +16% to $1.9 billion, and +8% on a same-store basis2
• Continued strong growth in Domestic Resorts Adjusted Property EBITDA and Adjusted Property EBITDA margin
4
Domestic Resorts1 (YoY) Actual Same Store2
Adjusted Property EBITDA $ $570 million 39% $534 million 31% Adjusted Property EBITDA Margin 30% 489 bps 31% 527 bps
Las Vegas Strip3 (note: excludes CityCenter)
Adjusted Property EBITDA $ $452 million 34% Adjusted Property EBITDA Margin 31% 586 bps RevPAR4 $149 11%
Regional5
Actual Same Store2
Adjusted Property EBITDA $ $118 million6 64% $82 million 14%
Adjusted Property EBITDA Margin 27%6 148 bps 29% 228 bps
1 Domestic Resorts Operating Income of $301 million increased 4% year-over-year, and decreased 3% on a same-store basis due to the $139 million NV Energy exit expense 2 Excludes Borgata which was acquired on August 1, 2016 and Circus Circus Reno which was sold in 2015 3 Las Vegas Strip (excluding CityCenter) Operating Income of $211 million decreased 9% year-over-year due to the $139 million NV Energy exit expense 4 RevPAR is hotel revenue per available room 5 Regional Operating Income of $90 million increased 52% year-over-year, and 19% on a same-store basis 6 Adjusted Property EBITDA for Borgata includes an $8 million real estate transfer tax related to the sale to MGP

3Q 2016 Adjusted Property EBITDA Growth Drivers
Our Profit Growth Plan continues to drive our Domestic Adjusted Property EBITDA, on top of healthy normal growth
5
$411
$570
$33
$31
$23
$73
$350
$400
$450
$500
$550
$600
Q3-15 Hold impact Normal growth PGP Q3-16
Growth % 8% 7% 5%
Domestic Resorts ($ in millions)
1 Adjusted for $3 million of other resort operations related to Circus Circus Reno which was sold in 2015 2 Excludes our 50% share of CityCenter ($5 million)
18%
Borgata and other same-store
adjustments1
39%
2
+23%

3Q 2016 Financial Highlights CityCenter Resort Operations
• Net Revenue +11% • Aria and Vdara’s RevPAR increased 7% and 15%, respectively
• Leverage2 of ~3.5x • One-time items:
• The CityCenter campus incurred $26 million of expenses associated with the Company’s strategic decision to exit the fully bundled sales system of NV Energy
• Dividends received to date: $740 million3
• Aria is consistently one of the top 3 performing resorts within the MGM
Resorts portfolio4
6
CityCenter Resort Operations1 (YoY) 50% owned by MGM Resorts
Adjusted EBITDA $ $93 million 41% Adjusted EBITDA Margin 30% 627bps
1 Excludes The Shops at Crystals. CityCenter Resort Operations reported Operating Income of $8 million, which included $26 million of NV Energy exit expenses 2 Leverage ratio is calculated as Total Long-Term Debt of $1.2 billion over Adjusted EBITDA from Resort Operations 3 Represents MGM Resorts’ 50% share 4 Based on Adjusted EBITDA

Profit Growth Plan
MGM’s Profit Growth Plan was created to challenge, reinvigorate and empower our Company to take a smarter, more innovative approach to
the way we operate our business...
7
…with the ultimate goal of creating an embedded culture of operational excellence and continuous improvement
Key Objectives Path to Achieving We’ve identified roughly 500 ideas to
implement across all segments of the business, including gaming, hotel, entertainment and F&B
One-third from revenue generating ideas; Two-thirds from cost savings
Fully implement identified initiatives by year-end 2016
Realize $400 million of incremental Adjusted EBITDA1 by 2017
Domestic Adjusted Property EBITDA
margins to exceed 30%
1 Domestic Resorts plus 50% of CityCenter

Profit Growth Plan: $400 million target We are tracking ahead of plan
8
$36 million $40 million
$78 million $81 million
Q2-15 Q3-15 Q4-15 Q1-16 Q2-16 Q3-16
$114 million
$78 million
$36 million from Q3-15
MGM Resorts Launches
Profit Growth Plan
Exceed 30% Adjusted Property EBITDA margins
2017 impact goal:
$400 million
Adjusted EBITDA impact – Improvement over 2014 baseline Domestic Resorts + 50% of CityCenter

3Q 2016 Financial Highlights MGM China
• Net revenue declined 6% year-over-year and sequentially improved quarter-over-quarter by 11%
• Adjusted EBITDA2 improved quarter-over-quarter by 25%
• Adjusted EBITDA2 margin improved both year-over-year and quarter-over-quarter by 575 bps and 361 bps, respectively
• ~80% profitability from mass segment
• Macau 3Q 2016 Market Trends:
• Visitation +11% QoQ3
• Total GGR +7% QoQ4
• VIP Table Games GGR +5% QoQ5 • Mass Table Games GGR +8% QoQ5
9
MGM China1 (YoY) 56% owned by MGM Resorts
Adjusted EBITDA2 $ $159 million 15% Adjusted EBITDA2 Margin 32% 575 bps
1 MGM China Operating Income of $84 million increased 34% year-over-year
2 Before licensing fee 3 Macau Statistics & Census Service 4 Macau Gaming Inspection & Coordination Bureau 5 Wall Street estimates

Acquisition of 4.95% Stake in MGM China
On September 1, 2016, MGM Resorts closed its acquisition of an additional 4.95% of the outstanding common shares of MGM China
Acquisition price was below the IPO price and current trading levels
As a result, MGM Resorts now owns approximately 56% of MGM China's outstanding common shares
This transaction: Increases MGM Resorts’ exposure to what continues to be the
largest gaming market in the world Represents a long-term strategic action whereby MGM Resorts
reinforced its belief in the future success of Macau Was structured in a financially prudent manner which resulted in
minimal impact to MGM Resorts’ leverage profile
10
MGM Resorts continues to execute on its strategic plan with long-term value accretion in mind
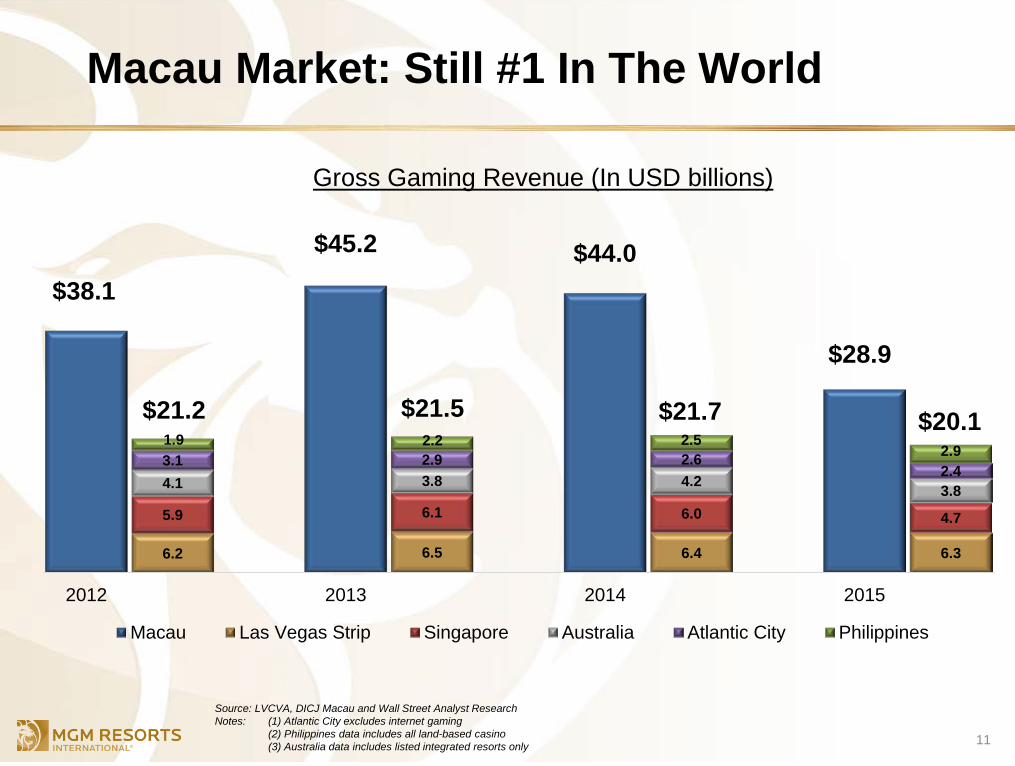
Macau Market: Still #1 In The World
11
$38.1
$45.2 $44.0
$28.9
6.2 6.5 6.4 6.3
5.9 6.1 6.0 4.7
4.1 3.8 4.2 3.8
3.1 2.9 2.6 2.4
1.9 2.2 2.5 2.9
2012 2013 2014 2015
Gross Gaming Revenue (In USD billions)
Macau Las Vegas Strip Singapore Australia Atlantic City Philippines
Source: LVCVA, DICJ Macau and Wall Street Analyst Research Notes: (1) Atlantic City excludes internet gaming (2) Philippines data includes all land-based casino (3) Australia data includes listed integrated resorts only
$21.2 $21.5 $21.7 $20.1

3Q 2016 Financial Highlights MGM Growth Properties
12
• On September 15, 2016, MGP’s Board of Directors declared a quarterly dividend of $0.3875 per Class A common share ($1.55 on an annualized basis) totaling $22 million, which was paid on October 14, 2016.
• Concurrently paid $72 million distribution to MGM Resorts • Increased by $0.12 per share on an annualized basis
• On August 1, 2016, MGP completed the acquisition of the real estate assets of the Borgata
MGM Growth Properties (76% owned by MGM Resorts)
($ in millions) 3Q 2016 IPO Date to September 30, 2016
Rental Revenue $155 $256 Funds From Operations $98 $166 Adjusted Funds From Operations $111 $180 Adjusted EBITDA $151 $248

Actual 9/30/2016
Borgata Annualization
Adjustment
Pro Forma9/30/2016
Total Cash1 $1,446 $-- $1,446
LTM Adjusted EBITDA related to:Domestic Resorts $2,001 $186 2 $2,187Management and other operations 17 -- 17MGM China 514 -- 514Corporate expense (excluding stock-based compensation) (305) -- (305)
$2,228 $186 $2,414
Dividends and distributions received by MGM Resorts3 60 -- 60$2,288 $186 $2,474
Total Principal Amount of Debt related to:
MGM Resorts Consolidated4 $12,951 $-- $12,951$12,951 $-- $12,951
Net Leverage Ratio 5.0x 4.7x
1 9/30/16 Actual includes $430 million and $340 million at MGM China and MGM Grow th Properties, respectively2 Based on 9/30/16 LTM actuals less $36M of Borgata Adjusted Property EBITDA reported in the quarter ended September 30, 2016.
4 9/30/16 Actual includes $1.8 billion, $3.7 billion, and $425 million at MGM China, MGM Grow th Properties Operating Partnership, and MGM National Harbor, respectively
3 Represents ordinary dividends (excluding special dividends) and other regular cash distributions actually received by MGM from CityCenter and Grand Victoria.
Capital Structure Enhancement: Consolidated Net Leverage
13
PF Net Leverage at < 5x Despite CIP Balance of ~$4 billion
Note: Debt amount is net of Premiums, discounts, and unamortized debt issuance costs

3Q 2016 Capital Expenditures
• Domestic Operations: $85 million – Includes Park theater, Excalibur garage and general maintenance and growth
• U.S. Development Projects: $248 million – MGM National Harbor: $213 million
– MGM Springfield: $35 million
• MGM China: $252 million
– MGM Cotai: $240 million
– MGM Macau: $12 million
14
Excludes capitalized interest, pre-opening expense and development fees

Corporate expense (excluding stock comp): $65-70 million, including ~$2 million related to Profit Growth Plan
Preopening expense: ~$75 million, including ~$45 million at MGM National Harbor
Recall: First full quarter of consolidating Borgata MGM China ownership: 56% MGM Growth Properties ownership: 76% Opening MGM National Harbor on December 8th
Fourth Quarter At A Glance
15
4Q 2016

We Remain Focused on Delivering on our Strategic Goals
16
Industry leader in innovation and operational excellence, with a strong commitment to corporate & social responsibility
Strong and collaborative corporate culture of continuous improvement led by a highly motivated management team
Majority economic ownership in MGM Growth Properties, a premier triple net lease REIT that is positioned to grow internally and through acquisitions
Focused on free cash flow generation and continued balance sheet improvement with the near term goal of becoming an investment grade company
Targeted, accretive growth opportunities Continue to invest in existing properties Disciplined approach to new market opportunities in the U.S. and
internationally

APPENDIX
17
Las Vegas Market Position
MGM Resorts Capital Initiative Projects
Supplemental Data

Development – MGM National Harbor Rendering – Opening December 8, 2016
18

Development – MGM National Harbor Construction as of October 2016
19

Development – MGM National Harbor Construction as of October 2016
20

21
Development – The Park Theater Rendering – Opening December 17, 2016

22
Development – The Park Theater Construction as of October 2016 (Las Vegas Strip View)

23
Development – The Park Theater Construction as of October 2016 (The Park View)

24
Development – MGM Cotai Rendering – Expected To Open 2Q 2017

Development – MGM Cotai Construction as of October 2016
25

26
Development – MGM Cotai Construction as of October 2016

27
Development – MGM Springfield Rendering – Expected To Open Late 2018

28
Development – MGM Springfield Construction as of October 2016 (Panoramic View)

APPENDIX
29
MGM Resorts Capital Initiative Projects
Las Vegas Market Position
Supplemental Data

Las Vegas Positioned To Outperform In The Next Several Years
30
As The Leading Entertainment And Hospitality Company In Las Vegas, MGM Resorts Is The Primary Contributor
And Beneficiary
• Strong visitation trends
• Limited supply growth expected in the near-term
• Expansion of meetings and convention business
• Continued diversification defining Las Vegas as a leading U.S. entertainment destination which drives incremental domestic and international demand
• Las Vegas is positioned to continue to regain RevPAR share
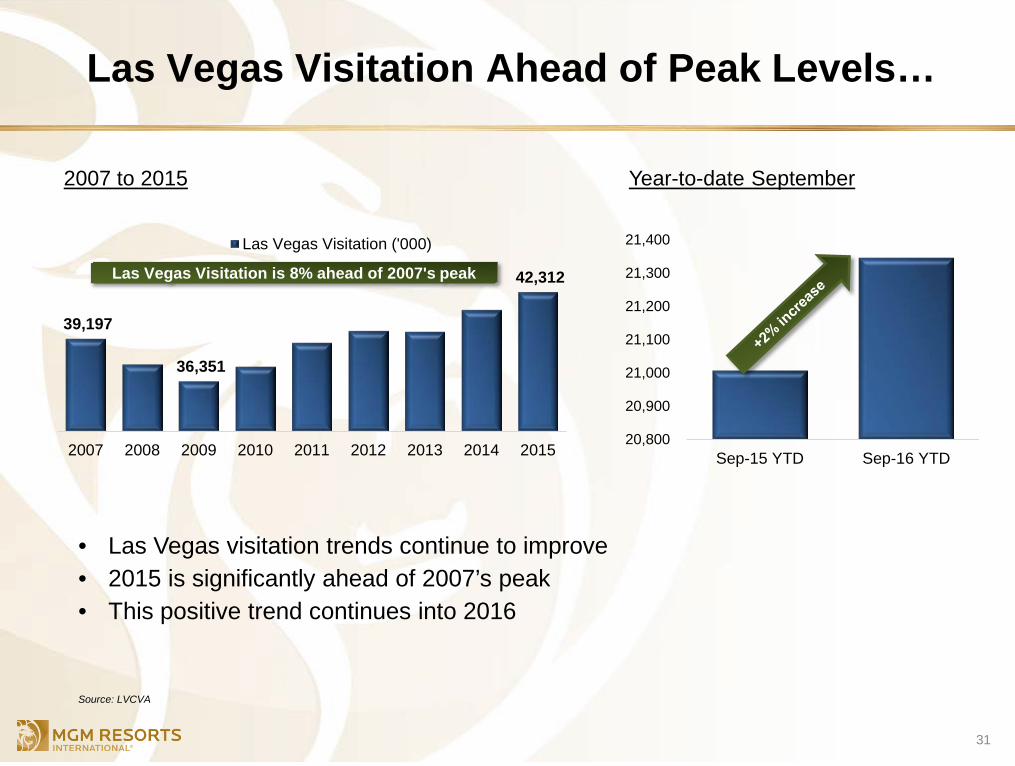
Las Vegas Visitation Ahead of Peak Levels…
31
• Las Vegas visitation trends continue to improve • 2015 is significantly ahead of 2007’s peak • This positive trend continues into 2016
2007 to 2015 Year-to-date September
39,197
36,351
42,312
2007 2008 2009 2010 2011 2012 2013 2014 2015
Las Vegas Visitation ('000)
Las Vegas Visitation is 8% ahead of 2007's peak
20,800
20,900
21,000
21,100
21,200
21,300
21,400
Sep-15 YTD Sep-16 YTD
Source: LVCVA

… With Limited Room Supply Growth Over Next Several Years
32
• Over the next several years Las Vegas is expected to have limited room supply growth while U.S. lodging supply is expected to continue to expand
• This will be an additional contributing factor that will allow Las Vegas to grow its RevPAR share premium to the U.S. over the next several years
Source: U.S. historical data Smith Travel Research, U.S. Forecast PKF; Las Vegas data LVCVA (Resort World 50% 2018 based on current probability of completion)
95
100
105
110
115
120
125
2006 2007 2008 2009 2010 2011 2012 2013 2014 2015 2016F 2017F 2018F
Las Vegas Supply U.S. Supply
2007 - 2015 CAGR Las Vegas 1.5% U.S 1.3%
2015 - 2018F CAGR Las Vegas 0.4% U.S 2.2%
Las Vegas vs. U.S. Room Supply (Indexed)

Opportunity For Growth When Adjusted For Room Supply
33
Even with a conservative estimate of only 2.0% annual growth in visitation, Las Vegas is expected to get back to 2007 levels in 2017
Source: Las Vegas data LVCVA; Future supply assumes Resort World and Alon estimated to open in 2018 and 2019
1.26 1.24 1.24 1.37 1.50 1.46 1.41 1.39 1.39 1.34 1.29 1.26 1.24 1.23 1.23
2005 2006 2007 2008 2009 2010 2011 2012 2013 2014 2015 2016E 2017E 2018E 2019E
At only 2.0% annual vistor growth
estimate
Las Vegas Year-End Inventory Per Average Daily Visitor

Large Scale Meetings and Conventions: MGM Resorts Outperforms In An Improving Market
34
Las Vegas vs. U.S. (Indexed)
• MGM Resorts outperforms after the implementation of several key initiatives that successfully shifted group mix to over 18% in 2015, an all time record high. o Optimization of group placement across a portfolio-wide meeting space platform o Global Sales Team to better leverage key accounts on an enterprise-wide basis o Citywide group sales department – one-stop shop for all MGM properties
Source: Las Vegas Attendees - LVCVA , U.S. group room nights - Smith Travel Research, Luxury & Upper Upscale Hotels, MGM - Domestic Las Vegas Strip Properties (excluding Aria)
60
70
80
90
100
110
120
2006 2007 2008 2009 2010 2011 2012 2013 2014 2015MGM Las Vegas Group Room Nights Las Vegas Convention Attendees U.S. Group Room Nights
MGM 12% ahead of 2007
Las Vegas (5)% behind 2007
MGM Implements new group sales strategy
U.S. 3% ahead of 2007

Meeting Space Across The U.S. Continues to Decline
Compared to those built in 2000-2009, hotels in the last two years have 24% less meeting space per room.
35
Source: STR, inc.
23.4
19.8 17.8
2000-2009 2010-2013 2014-2015
U.S. Industry Meeting Space by Year Built Meeting Space / Room (sq. ft.)

Las Vegas Positioned To Continue Regaining RevPAR Share
36
• Las Vegas had a $54 RevPAR premium to the broader U.S., which shrank to $20 in 2009 • Since then, Las Vegas has gained back a portion of its share and it is well positioned to continue on this path
of outperformance • Compared to prior peak RevPAR1:
• U.S. Lodging is 23% above • Las Vegas is 7% below • MGM Resorts Las Vegas Strip2 RevPAR is 5% below
Source: U.S. data Smith Travel Research, Las Vegas data LVCVA 1 LTM 9/30/16 vs 2007 levels 2 Excludes CityCenter
$40
$60
$80
$100
$120
$140
2007 2008 2009 2010 2011 2012 2013 2014 2015
Total U.S. RevPAR Las Vegas RevPAR
2007 Las Vegas premium $54
2015 Las Vegas premium $27

APPENDIX
37
MGM Resorts Capital Initiative Projects
Supplemental Data
Las Vegas Market Position

Supplemental Data: Non-GAAP Financial Measures
38
Twelve Months Twelve MonthsEnded Ended (1)
December 31, September 30,2015 2016
Bellagio $ 360,979 $ 288,797 $ 395,385 $ 467,567 MGM Grand Las Vegas 261,143 200,038 280,266 341,371 Mandalay Bay 200,621 164,745 203,474 239,350 The Mirage 112,244 95,801 112,475 128,918 Luxor 81,130 62,322 87,169 105,977 New York-New York 91,655 77,040 106,457 121,072 Excalibur 75,907 59,598 82,247 98,556 Monte Carlo 61,884 63,738 85,962 84,108 Circus Circus Las Vegas 46,235 31,568 43,245 57,912 MGM Grand Detroit 127,856 109,723 154,979 173,112 Beau Rivage 76,127 66,784 88,843 98,186 Gold Strike Tunica 38,312 34,144 46,023 50,191 Borgata (2) 36,099 - - 36,099 Other resort operations (3) - 4,933 3,441 (1,492) Domestic resorts 1,570,192 1,259,231 1,689,966 2,000,927 MGM China 383,187 408,898 539,881 514,170 Unconsolidated resorts (4) 495,588 217,631 257,883 535,840 Management and other operations 9,788 29,803 37,419 17,404
2,458,755 1,915,563 2,525,149 3,068,341
Corporate (220,366) (169,627) (254,104) (304,843) Stock compensation (31,432) (22,280) (32,125) (41,277)
$ 2,206,957 $ 1,723,656 $ 2,238,920 $ 2,722,221
MGM RESORTS INTERNATIONAL AND SUBSIDIARIESSUPPLEMENTAL DATA - ADJUSTED PROPERTY EBITDA and ADJUSTED EBITDA
(In thousands)(Unaudited)
Nine Months Ended
(1) The last twelve months financial data for the period ending September 30, 2016 has been calculated by subtracting the data for the nine months ended September 30, 2015 from the data for the year ended December 31, 2015 and adding the data for the nine months ended September 30, 2016.
(4) Represents the Company's share of operating income (loss), adjusted for the effect of certain basis differences.
September 30, September 30,2016 2015
(3) Sold in 2015(2) Represents Adjusted Property EBITDA of Borgata for the period from August 1, 2016 (the first day of the Company's full ownership) through September 30,