michigan capacity resource assessment
TRANSCRIPT

Michigan Capacity Resource Assessment
Michigan Agency for Energy
Michigan Public Service Commission
January 31, 2017

1
I. Executive Summary
On August 9, 2016, the Michigan Agency for Energy (MAE) and the Michigan Public Service Commission (MPSC) requested the Midcontinent Independent System Operator (MISO) to conduct a study to help the state of Michigan better understand the effects of declining reserve margins and the impact of several retiring coal plants, particularly during high load emergency conditions.1 Specifically, MAE requested that MISO assess and inform Michigan of vulnerabilities associated with planned or unplanned outages at the Palisades and Fermi 2 nuclear power plants in 2018, while at the same time experiencing extremely hot weather similar to that experienced in the summer of 2012 when both nuclear plants were down during a hot weather alert. The request specifically asked for determinations regarding MISO Local Resource Zone (LRZ or Zone) 7 including: (1) what internal generating capacity, (2) what contracted capacity, (3) what import capability, and (4) what capacity and transmission service from outside of Michigan could be available to serve Michigan load.
While this near-term operational information for 2018 was specifically requested, expansion plans that might be developed addressing declining reserve margins and the impact of several retiring coal plants are typically evaluated over a much longer period. To address this specific request, MISO provided MAE and MPSC staff a long-range base planning model for Michigan and supported MAE and MPSC staff’s modeling efforts. A range of assumptions, sensitivities, and scenarios were modeled to determine near-term results for 2018, as well as to establish a foundation for further long-term expansion plans. It is worth noting that this study occurs as a snapshot in time based on information available at the time of the study.
To meet high 2018 demand (approximately the historical demand highs) while experiencing significant nuclear outages, the model relies on demand response programs planned by Michigan load serving entities (LSEs) as outlined in recent MPSC filings. Key findings include the following:
1. If electric demand hits historical highs, not all of DTE Electric Company’s St. Clair unitsreturn, and no new resources are developed within Michigan’s Lower Peninsula by thesummer of 2018, Michigan’s Lower Peninsula would not meet federal reliabilitystandards.2 3
2. Michigan’s Lower Peninsula would be able to meet federal reliability standards ifdemand hits historic highs, as long as planned new resources within Michigan’s LowerPeninsula are developed and all of DTE Electric Company’s St. Clair units return forthe summer of 2018. If the St. Clair units have not all returned for the summer of2018, additional resources would need to be developed to offset that resource.
3. Additional demand response programs would be the most cost-effective way to fill anygap.
1 See Appendix A, Letter to MISO from MAE and MPSC dated August 9, 2016. 2 Planning Reserve Margin Pursuant to the North American Electric Reliability Corporation http://www.nerc.com/pa/stand/reliability%20standards%20complete%20set/rscompleteset.pdf and the Federal Energy Regulatory Commission Order 747 https://www.ferc.gov/whats-new/comm-meet/2011/031711/E-7.pdf 3 Due to the August 2016 fire at DTE Electric Company’s St. Clair Power Plant, the fate of all of the units was uncertain at the time of the study. The model was therefore run at a worst-case scenario of having a portion of the plant entirely out of operation.

2
II. Introduction and Background
On August 9, 2016, MAE and MPSC requested MISO to conduct a study to help the state of Michigan better understand the effects of declining reserve margins and the impact of several retiring coal plants, particularly during high load emergency conditions.4 Specifically, MAE requested that MISO assess and inform Michigan of vulnerabilities associated with planned or unplanned outages at the Palisades and Fermi 2 nuclear power plants in 2018, while at the same time experiencing extremely hot weather similar to that experienced in the summer of 2012 when both nuclear plants were down during a hot weather alert.
While this near-term operational information for 2018 was specifically requested, expansion plans that might be developed addressing declining reserve margins and the impact of several retiring coal plants are typically evaluated over a much longer period. To address this specific request, MISO provided MAE and MPSC staff a base long-range planning model for Michigan and supported MAE and MPSC staff’s modeling efforts. A range of assumptions, sensitivities and scenarios were modeled to determine near-term results for 2018, as well as a foundation for further long-term expansion plans. For example, the Michigan-specific model includes specified known and assumed coal plant retirements in Michigan, as well as forecasts for fuel prices, demand, energy, energy efficiency, and demand response along with several other assumptions. The majority of the modeling assumptions were taken from MPSC filings, reports, and other publicly available information, as discussed further in this report. Several future scenarios and sensitivities were developed, analyzed and included with this report. However, the scenario most closely aligning with the original study request includes an outage of both the Palisades and Fermi 2 nuclear plants for the 2018 summer months, as well as high demand and energy growth to simulate demand conditions for an extremely hot summer scenario. The 2018 analysis and results for that specific case are presented in this report and best address the original request. It is worth noting that this study occurs as a snapshot in time based on information available at the time of the study.
Furthermore, on August 17, 2016, Governor Snyder and MAE requested MISO to conduct a study of near- and long-term transmission expansion options to better connect the Upper Peninsula of Michigan to the Province of Ontario, as well as to the Lower Peninsula of Michigan.5 This exploratory second phase of the study will follow the completion of the current first study phase and will identify potential benefits and costs of certain transmission expansion in Michigan. The first year of the transmission study will likely begin with the five year out model. For that reason, 2021 reference case results and analysis are included in this report.
Sensitivity cases were performed on the reference case around demand and energy growth rates, natural gas prices, renewable portfolio standards (including renewable energy goals), carbon emission reductions, energy efficiency programs, demand response programs, and availability of additional imports. The results for the full 20-year study period ending in 2035 over a range of scenarios are presented in this report as well.
4 See Appendix A, Letter to MISO from MAE and MPSC dated August 9, 2016. 5 See Appendix B, Letter to MISO from MAE dated August 17, 2016.

3
III. Model Development and Assumptions
MAE and MPSC staff developed a model for the state of Michigan to explore demand and supply-side options to address future generation needs in the 2016 to 2035 time period. The Electric Generation Expansion Analysis System (EGEAS) software was used for the analysis. The annual minimum reserve margin modeled for Michigan was 15.5 percent in base growth forecast scenarios.6 Michigan-specific study parameters and assumptions include natural gas price forecasts, energy transfer limits, demand and energy forecasts, energy efficiency programs, planned and assumed retirements, as well as parameters for new thermal generation, new renewable generation and new demand response programs. These assumptions make up the reference case - the set of characteristics that will be compared with other additional study cases. In those additional study cases, targeted assumptions are varied to model specific situations; e.g., increased demand due to hot weather, generator outages, etc. The study outputs provide predictions of potential future costs, and the costs are indicative based on the assumptions used in the modeling. Only capital, fixed operating and maintenance, and production cost increases are captured. Additional costs related to electric transmission expansion, gas infrastructure expansion, and stranded generation facilities are not included in this analysis.
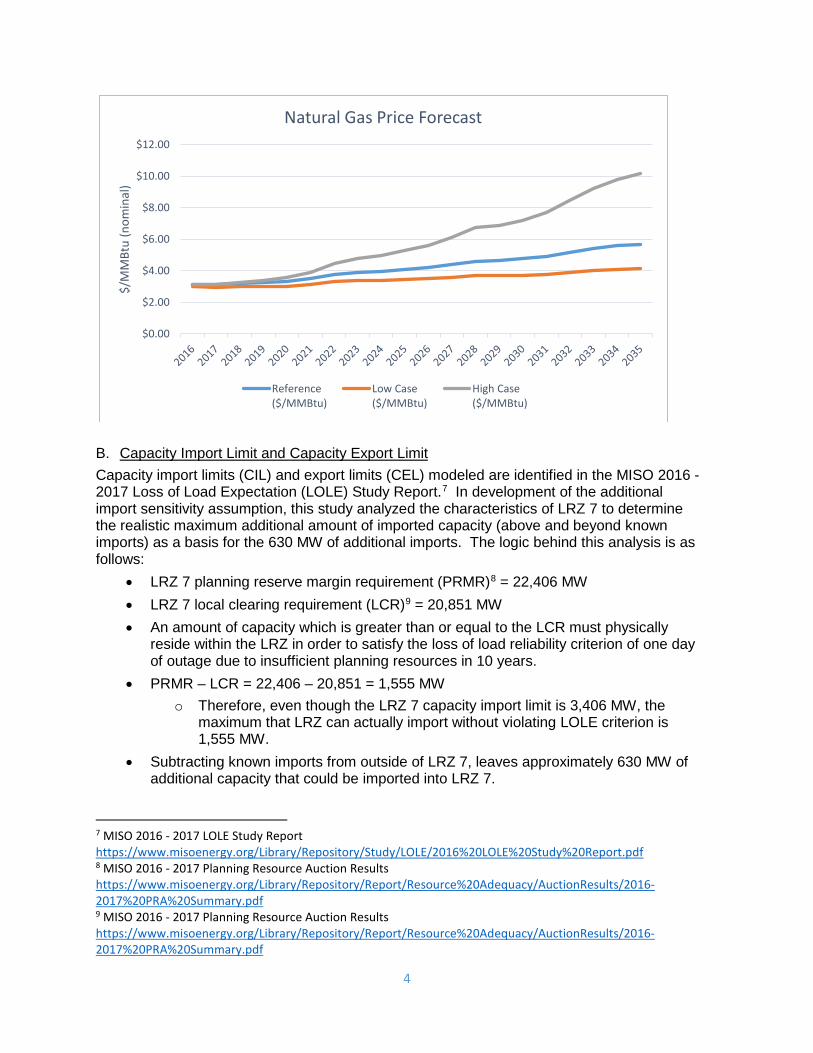
A. Natural Gas Price Forecast The natural gas price forecast utilized in the study reference case was developed with Michigan stakeholder input and consultant advice during the state of Michigan Clean Power Plan modeling effort. It is comprised of a conglomerate of forecast Henry Hub spot prices, Energy Information Administration forecasts, and NYMEX futures prices.
6 While the current MISO requirement is 15.8 percent, Michigan’s coincidence factor (how closely Michigan’s peak load matches MISO’s peak load) was assumed to be 0.997 resulting in a Michigan planning reserve requirement of 15.5 percent.
4
B. Capacity Import Limit and Capacity Export Limit Capacity import limits (CIL) and export limits (CEL) modeled are identified in the MISO 2016 - 2017 Loss of Load Expectation (LOLE) Study Report.7 In development of the additional import sensitivity assumption, this study analyzed the characteristics of LRZ 7 to determine the realistic maximum additional amount of imported capacity (above and beyond known imports) as a basis for the 630 MW of additional imports. The logic behind this analysis is as follows:
• LRZ 7 planning reserve margin requirement (PRMR)8 = 22,406 MW • LRZ 7 local clearing requirement (LCR)9 = 20,851 MW • An amount of capacity which is greater than or equal to the LCR must physically
reside within the LRZ in order to satisfy the loss of load reliability criterion of one day of outage due to insufficient planning resources in 10 years.
• PRMR – LCR = 22,406 – 20,851 = 1,555 MW o Therefore, even though the LRZ 7 capacity import limit is 3,406 MW, the
maximum that LRZ can actually import without violating LOLE criterion is 1,555 MW.
• Subtracting known imports from outside of LRZ 7, leaves approximately 630 MW of additional capacity that could be imported into LRZ 7.
7 MISO 2016 - 2017 LOLE Study Report https://www.misoenergy.org/Library/Repository/Study/LOLE/2016%20LOLE%20Study%20Report.pdf 8 MISO 2016 - 2017 Planning Resource Auction Results https://www.misoenergy.org/Library/Repository/Report/Resource%20Adequacy/AuctionResults/2016-2017%20PRA%20Summary.pdf 9 MISO 2016 - 2017 Planning Resource Auction Results https://www.misoenergy.org/Library/Repository/Report/Resource%20Adequacy/AuctionResults/2016-2017%20PRA%20Summary.pdf
$0.00
$2.00
$4.00
$6.00
$8.00
$10.00
$12.00
$/M
MBt
u (n
omin
al)
Natural Gas Price Forecast
Reference($/MMBtu)
Low Case($/MMBtu)
High Case($/MMBtu)

5
LRZ 710 LRZ 211 Capacity Import Limit (MW) 3,406 1,703 Capacity Export Limit (MW) 4,541 2,996 Local Clearing Requirement (MW) 22,406 n/a Planning Reserve Margin Requirement (MW) 20,851 n/a
C. Energy and Peak Demand Forecast The energy and peak demand forecast utilized in the study reference case was developed with stakeholder input and consultant advice during the state of Michigan Clean Power Plan modeling effort. Existing energy efficiency (noted as EE below) measures were modeled as a net adjustment to the energy forecast. Costs for existing/planned energy efficiency programs were not modeled.
Compound Annual Growth Rate
2016-2035 Peak Demand 1.2% Energy 1.2% Peak Demand (Net of EE) 0.52% Energy (Net of EE) 0.88% Energy Efficiency Savings 1.3% in 2016; 1.0% in 2035
D. Generator Retirement Assumptions Generator retirements were based on assumptions embedded in the EGEAS model as well as MAE / MPSC assumed retirements.12 Some retirement assumptions embedded in the EGEAS model were based on MTEP17 Futures age related retirement assumptions (55 years for gas and oil units, 65 years for coal units). Michigan-specific retirement assumptions were applied as well. The chart below illustrates some of the Michigan generator retirements included in the EGEAS model.13 14 It is worth noting that generators under 50 MW in size are not included in this chart.
10 LRZ 7 refers to the portion of the Lower Peninsula that is part of MISO. 11 LRZ 2 includes the Upper Peninsula and a portion of Wisconsin. 12 Due to the August 2016 fire at DTE Electric Company’s St. Clair Power Plant, the fate of all of the units was uncertain at the time of the study. The model was therefore run at a worst-case scenario of having a portion of the plant entirely out of operation. 13 For any year in which a generator unit is listed as retired, the unit will not be available for that entire year. For example, a generator retiring in 2016 was not available to the model at any time during that same year. 14 Palisades was assumed to retire in 2031 based upon the expiration of its license with the NRC (therefore Palisades is listed as retiring in 2032 so it could be available to the model in 2031). Late in 2016, Entergy announced its intent to close the plant in 2018, however, that retirement date is not taken into account in this study. One scenario considered an early retirement of Palisades in 2022 to coincide with the expiration of the current power purchase agreement.

6
E. New Thermal Generation Options a. New Combustion Turbine (CT) units were available for the model to select in 400
MW increments. The assumptions for the cost of the new CT were based upon MISO’s published Cost of New Entry (CONE) as applied to Zone 7.
b. New Combined Cycle (CC) units were available for the model to select in 400 MW increments. The assumptions for the cost of the new CC were based upon the National Renewable Energy Laboratory’s (NREL) 2016 Annual Technology Baseline published in September 2016.15
F. New Renewable Generation Options a. Solar was available to be selected by the model in 25 MW increments with a 13
percent annual capacity factor and with a 50 percent capacity credit at peak.16 The assumed costs for new solar were based upon NREL’s 2016 Annual Technology Baseline published in September 2016.
b. Wind was available to be selected by the model in 300 MW increments17 with a 36 percent annual capacity factor and with a capacity credit of 15.6 percent.18 The assumed costs for new wind generation were based upon NREL’s 2016 Annual Technology Baseline published in September 2016.19
15 NREL 2016 Annual Technology Baseline http://www.nrel.gov/docs/fy16osti/66944.pdf 16 MISO 2017 - 2018 LOLE Study Report https://www.misoenergy.org/Library/Repository/Study/LOLE/2017%20LOLE%20Study%20Report.pdf 17 While Michigan has historically seen wind builds in the 100 MW range, 300 MW increments were modeled to better align with other unit sizes in the model. 18 MISO 2016 - 2017 Wind Capacity Credit Report https://www.misoenergy.org/Library/Repository/Report/2016%20Wind%20Capacity%20Report.pdf 19 The wind pricing contained in NREL’s baseline was vetted against historical wind pricing in Michigan taking into account the federal production tax credit that began the first decreasing step in January 2017.

7
G. Demand Response Programs a. Demand response resources were modeled as resources as opposed to being
included as a reduction to the peak load forecast. b. The amount of demand response available to be selected by the model were taken
from MPSC filings made by Michigan LSEs for 2016 to 2020. c. The amount of demand response available for the model to select for the reference
cases is outlined below. A long-term sensitivity included additional demand response as discussed later in the sensitivity analysis portion of this report.
d. Demand response resources could only be selected in the first year of availability to ensure the program’s establishment and growth are modeled correctly.
H. Assumptions for the 2018 Nuclear Outages During Extreme Summer Weather a. The Palisades and Fermi 2 nuclear power plants were assumed to be out for 16
weeks during the summer for extended maintenance; from the 18th week through the 34th week of the calendar year.
b. In order to simulate the load during extreme summer weather such as could be experienced during a hot weather alert, the high demand and energy forecast was utilized, which includes a 5 percent increase in the demand forecast compared to the reference case.
I. Other Assumptions a. Exelon’s Clinton Nuclear Power Plant of 1,055 MW, a significant portion of which
has been a resource for Michigan LSEs in the past, was assumed to retire in 2017. The recent approval of legislation in Illinois to keep the Clinton and Quad Cities nuclear power plants in service for several more years was not considered in this analysis because it had not occurred at the time the modeling was done.
0
100
200
300
400
500
600
700
800
900
2016
2017
2018
2019
2020
2021
2022
2023
2024
2025
2026
2027
2028
2029
2030
2031
2032
2033
2034
2035
Demand Response Programs (MW)
Commercial and Industrial Interruptible A/C
Residential Price Response

8
b. Entergy’s Palisades Nuclear Power Plant announcement on December 8, 2016, of retiring by October 1, 2018, was not considered in this analysis.20
i. Palisades was assumed to be out for maintenance for the 2018 summer analysis as previously described.
ii. Palisades was assumed to retire in 2022 in one of the long-term scenarios discussed in Appendix C.
c. The New Covert Generating Power Plant was not included in our model, since most, if not all of its capacity is in the PJM market.
d. Any known contracts for import into Zone 7 were modeled, allowing room for an additional 630 MW of import capacity from outside Zone 7, without exceeding the CIL and still meeting the local clearing requirement.
e. AEP’s Indiana Michigan Power’s Donald C. Cook Nuclear Plant generation served its own Michigan load and was not included in this model, since all of its capacity is used in the PJM market.
IV. 2018 Analysis and Results
While several future scenarios and sensitivities were developed and analyzed, the scenario most closely aligning with the original study request includes an outage of both the Palisades and Fermi 2 nuclear plants during the summer months, as well as high demand and energy requirements which simulate demand conditions for an extremely hot summer. The key assumptions changed for this study are the nuclear plant outages and the demand forecast utilized in the model. Palisades and the Fermi 2 nuclear plants were assumed to be out for 16 weeks for extended maintenance, for the 18th week through the 34th week of the calendar year from May 15 to September 15, 2018. In order to simulate the load during extreme summer weather such as could be experienced during a hot weather alert, the high demand and energy forecast was utilized, which includes a 5 percent increase in the demand forecast compared to the reference case. The study outputs provide predictions of potential future costs and the costs are indicative based on the assumptions used in the modeling. Only capital, fixed operating and maintenance and production cost increases are captured. Additional costs related to electric transmission expansion, gas infrastructure expansion, and stranded generation facilities are not included in this analysis. In 2018, the model adds all of the new demand response programs that the model had available to add per the reference case, in both the high demand and energy case (HDE), and the high demand and energy case with the nuclear plants on outage (NUC HDE). In 2018, the Commercial and Industrial Interruptible Load is assumed to grow from a current 621 MW to a planned 789 MW, the Residential Direct Load Control programs grows from a current 150 MW to a planned 200 MW, and 100 MW of planned new Residential Price Response programs were selected. Even without considering the nuclear plant outages or the extreme summer weather, modeling results suggest that implementation of planned demand response programs in Michigan will provide significant contributions toward meeting near-term capacity requirements. 20 Entergy recently announced that Palisades would retire October 1, 2018.

9
While the results indicate that no new thermal generation units are needed by 2018 for the reference case, both the NUC HDE and HDE scenarios added 400 MW of peaking capacity additions in 2018.21 While it may no longer be possible to construct peaking capacity in time to meet the 2018 peak period, additional implementation of energy efficiency and demand response programs could delay the need for peaking capacity under the high demand scenarios. Although two nuclear units were assumed to be out on maintenance for the NUC HDE scenario, results indicated no difference in capacity additions between the NUC HDE and HDE scenarios. The reason that the capacity additions of the NUC HDE and HDE are the same is due to the fact that the nuclear units were only placed out on maintenance, therefore still available for capacity, but not available to provide energy during the summer outage. Significant differences resulted in the mix of the energy served by resource type between the HDE and NUC HDE cases as shown in the chart below.
The energy requirements of the reference case scenario as compared to the NUC HDE and HDE scenarios highlight the increased energy requirements of the system. Furthermore in comparing the NUC HDE scenario with the HDE scenario, the NUC HDE scenario relies on all other non-nuclear resources more heavily in an effort to meet the energy requirements while two nuclear baseload units were offline.
21 While the model assumed that the Clinton Nuclear Power Plant is not available after 2016, recently signed legislation in Illinois allowing its continued operation may offset some or all of the need for new capacity resources in 2018 for the NUC HDE and HDE scenarios.
50% 52% 52%
14% 14% 11%
22%25% 28%
8%8% 8%5%5% 5%
-
20,000
40,000
60,000
80,000
100,000
120,000
140,000
Reference Case High Demand andEnergy
Nukes Out HighDemand
GWh
2018 Total Energy Served by Resource Type
Other (Biomass, PumpedStorage, Oil, DR)
Renewables
Natural Gas
Nuclear
Coal

10
The assumed minimum reserve margin requirement for 2018 for these three cases are 15.5 percent for the reference case, 11 percent for HDE case, and 11 percent for NUC HDE case.22 The actual reserve margin in 2018 in the reference case is 15.5 percent and 11.5 percent in the NUC HDE case. Under these two HDE cases, it shows that additional peaking capacity is needed in 2018 compared to the reference case since EGEAS added a new 400 MW combustion turbine unit in 2018 in the high demand scenarios while it did not in the reference case. (Please note the model does not have a constraint for construction and permitting timelines.) However, increases in demand response in Michigan could delay the need for additional peaking capacity to meet high demand conditions. And if DTE Electric Company’s St. Clair units come back online, then Michigan may not need to rely on additional demand response, energy efficiency or imports from outside Zone 7 to fill this potential need. Known contracts for imports into Zone 7 were modeled, leaving room for additional imports of up to 630 MW of capacity from outside of Zone 7 without exceeding the existing capacity import limit and still meeting the Zone 7 local clearing requirements. Because a Michigan-specific model was developed, specific assumptions for entities and resources located outside of Michigan that do not currently serve Michigan load were not made. Without knowledge or assumptions relative to entities outside of Michigan, and without running a real-time energy analysis, the answer to what capacity and transmission service from outside of Michigan could be available to provide up to 630 MW to serve Michigan load is still unknown but could be reviewed in the second phase of the study. Given the 2018 results, it seems that it will be necessary for Michigan LSEs to follow through with their current plans for demand response development. The demand response programs become increasingly important when the system is stressed due to high demand and/or unexpected plant outages. In addition to implementing demand response programs, approximately 400 MW of additional peaking capacity should be considered in the near-term.
V. 2021 Analysis and Results
The second phase of this study that is not yet under way will address an additional request from Governor Snyder and MAE to conduct an evaluation of transmission expansion to better connect the Upper Peninsula of Michigan to the Province of Ontario and/or to the Lower Peninsula of Michigan. The first year of the transmission study will likely begin with the five year out model. For that reason, an overview of the 2021 reference case results is included here. 2021 Reference Case Overview Expansion Plan In order to meet the 2021 system requirements, the EGEAS reference case model adds a total of 2,218 MW of new resources between 2016 and 2021. New demand response programs were added as quickly as allowed by the model and the current rate of demand response development.
22 With higher demand and energy forecast starting value, starting 2016 reserve margin is 11.5 percent. These high demand and energy forecast scenarios model maintaining this starting reserve margin in the higher demand and energy scenarios for resource and reserve margin comparison.

11
In 2019, one 400 MW CT unit is added; two 400 MW CT units in 2020; and one 400 MW CT unit in 2021. The cumulative capacity additions through 2021 for the reference case results in a 17.17 percent reserve margin. The chart below shows the cumulative capacity additions between 2016 and 2021.
Total Energy by Fuel Type The chart below depicts the 2021 reference case energy by fuel type in Gigawatt hours (GWh).
1,600
168
450
0%
10%
20%
30%
40%
50%
60%
70%
80%
90%
100%
Reference Case
2016-2021 Reference Case Total Capacity Additions by Fuel Type (MW)
Total New Residential DemandResponse
Total New CommercialDemand Response
New Natural Gas

12
Reliability Report 2021 Reference Case Reliability Report Snapshot
Demand Side Management Impact The reference case reflects 771 MW of existing demand response in 2016 and the addition of 618 MW of new demand response programs through 2021.
Demand Response Programs
Existing in 2016 Incremental Additions Through
2021 (Reference Case)
Cumulative 2021 (Reference Case)
Commercial and Industrial
621 MW 168 MW 789 MW
Interruptible 150 MW 200 MW 350 MW Residential Price
Response 0 MW 250 MW 250 MW
Total 771 MW 618 MW 1,389 MW 2021 Reference Case Conclusion The implementation of planned demand side management programs and 1,600 MW of new natural gas-fired peaking units are projected to meet Michigan’s reference case requirements in 2021.
53,498
16,864
26,840
9,429 5,431
106 -
10,000
20,000
30,000
40,000
50,000
60,000
Coal Nuclear Natural Gas Renewables(Hydro, Solar,
Wind)
Other (Biomass,Pumped Storage,
Oil)
Total DSM
2021 Reference Case Total Energy by Fuel Type (GWh)
Peak Load 22,444 MW Energy 105,074 GWh Reserve Margin 17.17%
13
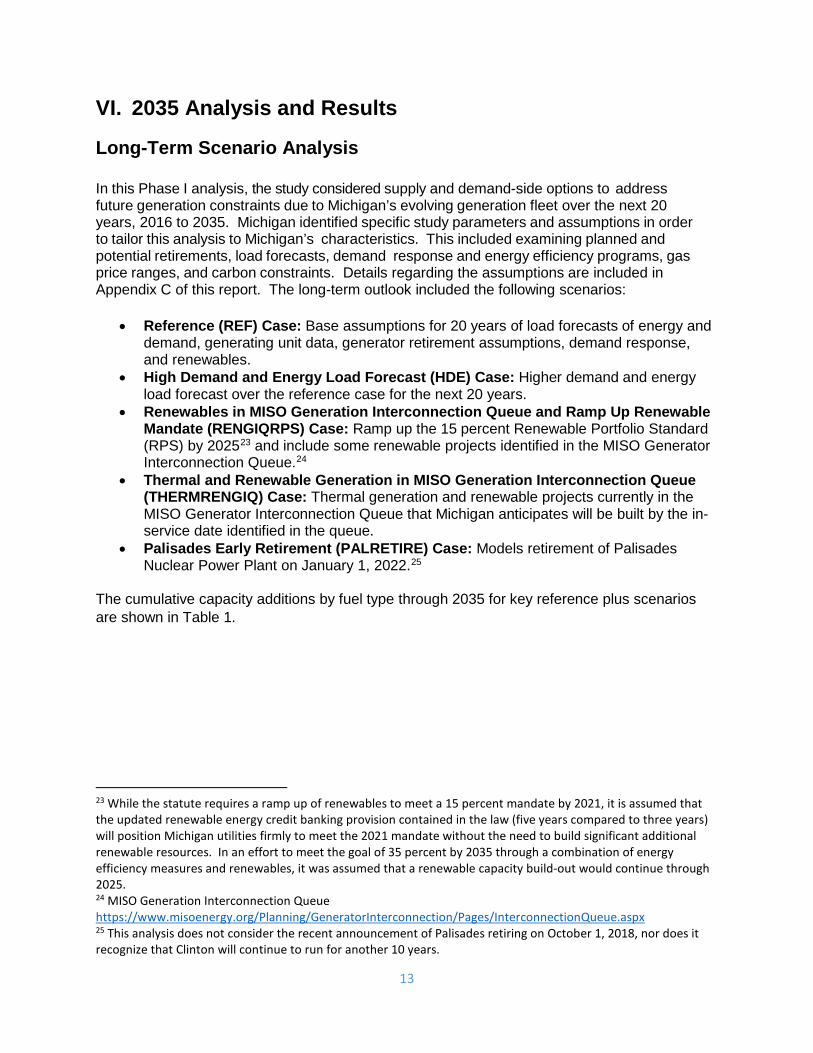
VI. 2035 Analysis and Results Long-Term Scenario Analysis In this Phase I analysis, the study considered supply and demand-side options to address future generation constraints due to Michigan’s evolving generation fleet over the next 20 years, 2016 to 2035. Michigan identified specific study parameters and assumptions in order to tailor this analysis to Michigan’s characteristics. This included examining planned and potential retirements, load forecasts, demand response and energy efficiency programs, gas price ranges, and carbon constraints. Details regarding the assumptions are included in Appendix C of this report. The long-term outlook included the following scenarios:
• Reference (REF) Case: Base assumptions for 20 years of load forecasts of energy and demand, generating unit data, generator retirement assumptions, demand response, and renewables.
• High Demand and Energy Load Forecast (HDE) Case: Higher demand and energy load forecast over the reference case for the next 20 years.
• Renewables in MISO Generation Interconnection Queue and Ramp Up Renewable Mandate (RENGIQRPS) Case: Ramp up the 15 percent Renewable Portfolio Standard (RPS) by 202523 and include some renewable projects identified in the MISO Generator Interconnection Queue.24
• Thermal and Renewable Generation in MISO Generation Interconnection Queue (THERMRENGIQ) Case: Thermal generation and renewable projects currently in the MISO Generator Interconnection Queue that Michigan anticipates will be built by the in-service date identified in the queue.
• Palisades Early Retirement (PALRETIRE) Case: Models retirement of Palisades Nuclear Power Plant on January 1, 2022.25
The cumulative capacity additions by fuel type through 2035 for key reference plus scenarios are shown in Table 1.
23 While the statute requires a ramp up of renewables to meet a 15 percent mandate by 2021, it is assumed that the updated renewable energy credit banking provision contained in the law (five years compared to three years) will position Michigan utilities firmly to meet the 2021 mandate without the need to build significant additional renewable resources. In an effort to meet the goal of 35 percent by 2035 through a combination of energy efficiency measures and renewables, it was assumed that a renewable capacity build-out would continue through 2025. 24 MISO Generation Interconnection Queue https://www.misoenergy.org/Planning/GeneratorInterconnection/Pages/InterconnectionQueue.aspx 25 This analysis does not consider the recent announcement of Palisades retiring on October 1, 2018, nor does it recognize that Clinton will continue to run for another 10 years.

14
Table 1:
Case Types
New Combine
Cycle (MW)
New Combustion
Turbine (MW)
New Wind (MW)
New Solar/ Photo
Voltaic (MW)
New Demand Response =
Comm DR + Res DR + Res Direct Load
Total Amount of Capacity added by 2035 (MW)
REF 3,200
6,000
-
50
883 10,133
HDE 4,000
6,800
-
-
883 11,683
RENGIQRPS 2,000
6,400
2,700
-
883 11,983
THERMRENGIQ 2,000
5,600
-
-
883 8,483
PALRETIRE
3,200
6,000
-
50
883 10,133
This Table tabulates the new generation modeled in Michigan by 2035 under five different scenarios which are explained in greater detail in Appendix C. The relative cost difference between the various key scenarios and the reference case are illustrated below: 26
26 It should be noted that the greatest levelized cost variance between the scenarios is approximately $2/MWh.

15
The levelized cost is the value for which an equal-valued fixed revenue delivered over the life of the asset's generating profile would cause the project to break even. The levelized cost per GWh was derived using the annual net present value (NPV) (sum of production, fixed operating and maintenance, and capital fixed costs) of the generating assets/electricity-generating system. The levelized cost calculation is a going-forward look where all existing plant costs are taken as sunk. The output (GWh) generated by those assets/electricity-generating system is based on the dispatch created by EGEAS over the lifetime of the assets/electricity-generating system even beyond the study period. This can be roughly calculated as the NPV of all costs over the lifetime of the assets/electricity-generating system divided by the total electrical energy output (GWh) of the assets/electricity-generating system. Under the five cases outlined above, the levelized cost per GWh was the lowest under the reference case and the most expensive with the renewables in the MISO Generation Interconnection Queue and Renewable Mandate ramp up, although it should be noted that the largest difference from the reference case amounts to only $2/MWh over the study period. Referencing this table, and the chart depicting the levelized costs, for the RENGIQRPS case, 2,700 MW of wind was added to meet the RPS and thus the higher levelized cost over the reference case. Likewise, the HDE case required an additional 1,550 MW to be added above the reference case, thus a corresponding cost increase. For the HDE case, it does indicate that with increased demand and energy, the costs will also increase. The energy generated by fuel type for each of the reference plus cases is shown below:
2.473%
0.812%
6.375%
0.237%
0.000%
1.000%
2.000%
3.000%
4.000%
5.000%
6.000%
7.000%
High Demand and Energy Palisades Retire Renewable GIQ with RPS Thermal Renewable GIQ
Levelized Cost ($/GWh): Percentage Difference from Reference Case (including the extension period)

16
A detailed discussion of the results and capacity additions for each of the reference scenarios is included as Appendix C. In addition to these scenario analyses, several additional future sensitivities were also considered. VII. Sensitivity Analysis As a part of this study, sensitivity cases were performed on the reference case around demand and energy growth rates, natural gas prices, renewable portfolio standards, carbon emission reductions, energy efficiency programs, demand response programs, and import capability. In this study, every possible combination of these policy and economic sensitivities were modeled, for a total of 432 sensitivities models and results. The figure below provides an overview of the range of sensitivities analyzed in this study.
45% 43% 45% 44% 46%
13% 13% 11% 13% 13%
23% 23%24% 22% 21%
8% 8%8% 8% 8%
5% 5%5% 5% 5%
6%8%
8% 2%6%
0.003% 0.003% 5% 1%
-
500,000
1,000,000
1,500,000
2,000,000
2,500,000
Reference Case High Demandand Energy
PalisadesRetire
Renewable GIQwith RPS
ThermalRenewable GIQ
Ener
gy (G
Wh)
2035 Energy by Fuel Type
New Renewables
New Natural Gas
Other
Existing Renewables
Existing Natural Gas
Nuclear
Coal

17
The need for near-term capacity, generally in the form of peaking capacity, commercial demand response, and residential demand response, was common across a wide sample of sensitivity cases. Additional wind resources built throughout the study period were highly dependent on the price of natural gas, and additional renewable portfolio standard constraints. The economic selection of natural gas combined cycle units was driven primarily by the price of natural gas, retirement of existing baseload capacity, and a high electric demand and energy forecast. The following table outlines a 10 and 20-year capacity addition by fuel type over a range of sensitivity cases:
Demand & Energy
Growth Rates
•High •Mid• Low
Natural Gas Prices
•High •Mid • Low
Renewable Portfolio
Standards
• Existing 10%• 15% by 2025
Carbon Emission
Reductions
•No constraint• 25% reduction by 2030• 35% reduction by 2030
Energy Efficiency Programs
• Existing• 2% savings/year
Demand Response Programs
• Existing•Additional programs
Imports• Existing•Additional import of
630 MW

18
Sensitivity Case Descriptors: HDE, MDE, LDE High, medium, and low demand and energy projection EE, 2EE Reference energy efficiency assumption, and 2% energy
efficiency savings reduction HG, MG, LG High, medium, and low gas price forecast RPS, RPS15 Existing RPS, 15% RPS by 2025 sensitivity NC, 25C, 35C No CO2 restriction, 25%, 35% CO2 reduction by 2030 DR, ADR Reference demand response, additional demand response
availability IMP, AIMP Reference import assumption, additional (630 MW) import
capability While there was a large amount of output from the sensitivity analysis, the sample of sensitivity analysis results shown in the table below represent a range of reasonable outcomes that provide additional insights around Michigan’s ability to meet its load obligations under a range of realistic and/or worst case scenarios. Near and long-term capacity additions for a small subset of sensitivity cases are highlighted in the tables below. 27
When analyzing energy production by fuel type over the entire study period, this study finds that wind production is significantly higher under an additional RPS constraint case, and also shows some correlation to forecasted natural gas prices over a range of sensitivity cases.
27 Demand response programs can only be selected by the EGEAS model in the first year they are available to ensure the program’s establishment and growth are modeled accurately. Further modeling would have to be completed to determine if there is a more appropriate year to offer demand response resources in sensitivity cases that did not initially select demand response programs.
CaseCombined
CycleCombusion
TurbineWind Solar
Commercial Demand
Response
Residential Direct Load
Control
Residential Price
Response
Commercial Price
ResponseHDE_2EE_HG_RPS_NC_ADR_IMP 800 2,400 0 0 168 150 401 804HDE_2EE_HG_RPS15_NC_ADR_AIMP 0 4,000 2,700 0 168 150 0 0HDE_2EE_HG_RPS15_NC_DR_IMP 0 4,000 2,700 0 168 150 0 0HDE_EE_HG_RPS_NC_DR_IMP 1,200 2,800 0 0 168 150 401 0LDE_EE_HG_RPS_NC_DR_IMP 0 1,200 0 0 168 150 401 0LDE_EE_HG_RPS15_NC_DR_IMP 0 800 2,400 0 168 150 401 0LDE_EE_LG_RPS_NC_DR_IMP 0 1,200 0 0 168 150 401 0
CaseCombined
CycleCombusion
TurbineWind Solar
Commercial Demand
Response
Residential Direct Load
Control
Residential Price
Response
Commercial Price
ResponseHDE_2EE_HG_RPS_NC_ADR_IMP 5,600 4,400 0 0 168 150 401 804HDE_2EE_HG_RPS15_NC_ADR_AIMP 4,000 6,800 3,000 0 168 150 0 0HDE_2EE_HG_RPS15_NC_DR_IMP 4,000 6,800 3,000 0 168 150 0 0HDE_EE_HG_RPS_NC_DR_IMP 5,600 5,200 0 25 168 150 401 0LDE_EE_HG_RPS_NC_DR_IMP 4,000 4,000 0 0 168 150 401 0LDE_EE_HG_RPS15_NC_DR_IMP 3,600 4,000 2,700 0 168 150 401 0LDE_EE_LG_RPS_NC_DR_IMP 3,200 4,800 0 0 168 150 401 0
10 Year Capacity Addition by Fuel Type (MW)
20 Year Capacity addition by Fuel Type (MW)

19
The sensitivity cases analyzing an additional 630 MW of imported generation were only selected as being an economic resource in cases with medium to high demand and energy forecasts and a CO2 constraint applied. Absent both of these conditions, EGEAS did not select this option as an economic planning alternative. Over the 432 sensitivity cases analyzed in this study, cases with the high energy efficiency sensitivity were 1.6 percent less costly, on average, than options under the reference case energy efficiency assumption. VIII. Conclusions In Michigan in 2012, two large baseload nuclear plant outages occurred during a hot weather event. In order to be prepared for a potential repeat of that scenario, additional steps should be taken between now and 2018 to ensure that the Lower Peninsula of Michigan will be able to meet load and reserve margin requirements. Under high demand conditions in 2018, the model relies heavily on demand response programs planned by Michigan load-serving entities as outlined in recent MPSC filings, as well as building additional peaking capacity. The demand response programs become increasingly important when the system is stressed due to high demand and/or unexpected plant outages. In addition to implementing demand response programs, around 400 MW of additional peaking capacity should be considered in the near-term. The need for peaking capacity could be delayed by further increasing demand response in Michigan. Further, if DTE Electric Company’s St. Clair units come back online, then Michigan’s reliance on demand response programs, energy efficiency programs or imports from outside Zone 7 to meet the capacity requirements would be lessened significantly. Because a Michigan-specific model was developed, assumptions for entities and resources located outside of Michigan were not made. Without knowledge or assumptions relative to entities outside of Michigan, and without running a real-time energy analysis, the answer to what capacity and transmission service from outside of Michigan could be available to serve Michigan load is unknown at this time. This could be reviewed within the second phase of the study, which will include modeling transmission.
Case Coal Gas Nuclear Wind Hydro Solar Oil Biomass Ludington Generation
DSM Energy
HDE_2EE_HG_RPS_NC_ADR_IMP 44.88% 29.25% 12.90% 4.92% 3.02% 0.01% 0.03% 0.07% 4.78% 0.15%
HDE_2EE_HG_RPS15_NC_ADR_AIMP 44.46% 25.15% 12.89% 9.45% 3.02% 0.01% 0.02% 0.07% 4.86% 0.08%
HDE_2EE_HG_RPS15_NC_DR_IMP 44.46% 25.15% 12.89% 9.45% 3.02% 0.01% 0.02% 0.07% 4.86% 0.08%
HDE_EE_HG_RPS_NC_DR_IMP 43.81% 31.10% 12.57% 4.79% 2.95% 0.01% 0.02% 0.07% 4.58% 0.10%
LDE_EE_HG_RPS_NC_DR_IMP 47.03% 25.58% 13.85% 5.28% 3.25% 0.01% 0.02% 0.08% 4.80% 0.11%
LDE_EE_HG_RPS15_NC_DR_IMP 46.44% 21.79% 13.83% 9.57% 3.24% 0.01% 0.02% 0.08% 4.91% 0.11%
LDE_EE_LG_RPS_NC_DR_IMP 41.93% 30.69% 13.86% 5.28% 3.25% 0.01% 0.02% 0.08% 4.78% 0.11%
20 Year Energy by Fuel Type (%)

20
The model results of the long-term scenario analysis for 2035 suggest that higher demand and energy requirements lead to increased capacity additions and higher overall costs. The early retirement of the Palisades Nuclear Power Plant assumed in 2022 in one scenario led to slightly higher costs as well. Sensitivities including 2 percent annual energy waste reduction (efficiency) requirements as opposed to 1 percent, led to the least-costly resource expansion plans. In all of the reference cases and the overwhelming majority of sensitivities analyzed, the model selected all of the demand response programs available in the early years. Investigating the potential to increase the capacity from demand response programs, assuming they are cost-effective, could reduce costs in the future. Over a range of several scenarios, in addition to demand response and energy waste reduction programs, 7,600 to 10,800 MW of natural gas-fired electric generation units are selected by the model starting in 2018 through the 2035 timeframe to replace retiring capacity and help Michigan meet its load and reserve margin requirements. Over the 432 sensitivity cases analyzed in this study, cases with the high energy efficiency sensitivity were the least costly.

Appendix A
August 9, 2016
Mr. John Lawhorn
Senior Director of Policy and Economic Studies
Midcontinent Independent System Operator
P.O. Box 4202
Carmel, IN 46082-4202
Dear Mr. Lawhorn,
The Michigan Agency for Energy (MAE) and the Michigan Public Service Commission (MPSC)
request that the Midcontinent Independent System Operator (MISO) conduct a study to help the
State of Michigan better understand the effects of declining reserve margins in emergency
situations. As you know, Michigan has recently experienced a large number of plant retirements
in the very recent past, and MISO’s regional planning and modeling expertise is necessary and
invaluable to us as we look to determine whether Michigan is on track to continue meeting its
reliability goals, including the goal never to experience a massive outage due to a lack of supply.
Many fundamental characteristics of the Bulk Electric System (BES) have evolved over the last
five years, and change to the system is expected to accelerate. With system-wide capacity
shortfalls in MISO anticipated as soon as 2018 per the 2016 MISO-OMS Survey, it is critical for
Michigan to understand whether our system still can support the level of reliability it was able to
show a few years ago. To that end, we request that MISO conduct a scenario analysis that
considers updated system assumptions specific to Michigan’s unique structure. An attachment to
this letter outlines recent and expected changes to the electricity system that could have an
impact in Michigan.
Declining reserve margins in MISO and in Michigan require that we more fully understand the
implications on Michigan, specific from MISO, of certain energy emergencies. As such, MAE
requests that MISO assess and inform Michigan of vulnerabilities associated with simultaneous
planned or unplanned outages at Palisades Power Plant (Palisades) and Fermi, Unit 2 (Fermi 2)
nuclear energy facilities. These two facilities are capable of producing a combined 1,855 MW of
reliable baseload power.
We did not pick this scenario randomly. Rather, it is our goal to understand what would happen
in the summer of 2018 if we had a recurrence of the events that occurred in the summer of 2012,
when there were simultaneous outages at these two nuclear facilities while MISO was under a
hot weather alert. Obviously, in 2012, we were able to sustain the grid in those conditions. We
would like to know if that would still be expected to be true.
Accounting for the retirement of numerous coal-fired generation this summer and other expected
future changes to the system, we request that MISO conduct an analysis that assumes Palisades
and Fermi 2 are offline, and then determines for MISO zone 7 (1) what internal generating
capacity, (2) what contracted capacity, (3) what import capability; and (4) what capacity and
transmission service from outside of Michigan, could be available to serve Michigan load. We
appreciate your consideration of this request and are happy to address any additional questions
you would have and provide any technical assistance that would be requested in support of this
study.

Sincerely,
Valerie Brader
Executive Director
Michigan Agency for Energy
Sally Talberg
Chairman
Michigan Public Service Commission

Attachment
Page 1 of 2
System Conditions for MISO’s Consideration
Generation
1. Retirement of coal-fired generators in Michigan:
a. In 2013, one DTE Harbor Beach unit (121 MW) retired.
b. In 2016:
i. Two DTE Trenton Channel units (7a and 8) (240 MW) retired.
ii. Two CE BC Cobb units in Muskegon (312 MW) retired.
iii. Two CE JC Karn-Weadock units in Essexville (312 MW) retired.
iv. Three CE JR Whiting units in Erie (345 MW) retired.
v. One Michigan South Central Power Agency's Endicott unit in Litchfield (55 MW)
retired.
c. In 2017, three Holland Board of Public Works DeYoung units (3, 4, and 5) (63 MW)
retiring.
d. In 2018, six Lansing Board of Water and Light Eckert units (335 MW) retiring.
2. Palisades Nuclear power station offline after 2022 (PPA Expiration) (NRC operating license
expires in 2031).
3. Fermi 2 nuclear power station remains online after 2025 (NRC license renewal is expected)
4. Announced retirement of Quad Cities nuclear power station on June 1, 2018.
5. Announced retirement of Clinton nuclear power station on June 1, 2017.
6. New Wolverine 410 MW Alpine natural gas simple cycle generating unit in Elmira
Township, MI.
7. New 280 MW (summer peak) natural gas combined cycle generation in Marquette County,
MI with expected in-service date in December 2019 (Project J394).
8. Impact of generation pseudo-ties out of MISO.
Load
9. Retirement of Empire Mine in 2016.
Transmission
10. Plains to National proposed transmission line moved to MTEP Appendix B.
11. 230 kV underground line from Sault Ste. Marie, Ontario to Sault Ste. Marie, MI. Presidential
Permit granted.
12. Congestion mitigation of Lake Michigan loop flow.
13. Increased transfer capability across the Straits of Mackinac.
14. Maintenance flexibility for northern Lower Peninsula transmission.

Attachment
Page 2 of 2
15. Management flexibility of Ludington Pumped Storage asset.
16. Contribution of high voltage, direct-current flow control device and associated substation in
eastern Upper Peninsula.
17. Approved MTEP reliability projects in advanced stages of development.
Other Considerations
18. New Michigan Upper Peninsula (MI-UP) Load Balancing Authority area.
19. Updated MTEP Models and Futures Scenarios.
20. Impacts voltage and local reliability (VLR) constraints and Revenue Sufficiency Guarantee
(RSG) make-whole payments.

RICK SNYDER GOVERNOR
John Lawhorn
STA'fE OF MICHIGAN
EXECUTIVE OFFICE LANSINCr
August 17, 2016
Senior Director of Policy and Economic Studies Midcontinent Independent System Operator P.O. Box 4202 Carmel, IN 46082-4202
Dear Mr. Lawhorn,
BRIAN CALLEY LT. GOVERNOR
The Michigan Agency for Energy (MAE) requests that the Midcontinent Independent System Operator (MISO) conduct system analyses to help the State of Michigan better understand the potential production cost savings, reliability, and resource adequacy benefits of transmission including increased import capability, and generation expansion in Michigan. MISO's regional planning and modeling expertise will be invaluable to us as we set Michigan on a path toward adaptable, reliable, affordable and environmentally protective energy. Specifically, we would ask that MISO conduct a near and long term evaluation of transmission expansion better connecting the Upper Peninsula of Michigan to our Canadian neighbors as well as to lower Michigan.
Many fundamental characteristics of the Bulk Electric System (BES) have evolved over the last five years on both sides of the international border, and change to the system is expected to accelerate within Michigan. With so many changes to the overall MISO system, but especially the challenges that Michigan residents and business face, it is critical for Michigan that MISO conduct analyses that consider updated system assumptions and scenarios specific to Michigan's unique peninsulas. For MISO's consideration, an attachment to this letter outlines recent and expected changes to the electricity system that could have an impact in Michigan.
Specifically, MAE requests that MISO conduct a near and long term regional evaluation of potential production cost savings, reliability, and resource adequacy benefits of transmission and generation expansion in MISO's northern footprint, specifically Michigan's eastern Upper Peninsula (part of Zone 2) up to Sault Ste. Marie, Ontario and northern Lower Peninsula (Zone 7) at the Straits of Mackinac down to the northernmost portion of the existing 345 kV transmission line near Gaylord, MI. Alternatively, MAE requests MISO update its 2012 Northern Area Study for these same Michigan areas, but in that event, to work more closely with the Ontario grid operators to ensure possible benefits are fully studied, as we understand the interconnection is to an area that has high production potential compared to the load but constrained transmission. Ontario's next Long-Term Energy Plan process will commence this summer, so this may be an excellent opportunity to work together.
Further, MAE is interested to know the impacts that a new natural gas-fired electric generating station located strategically in northern lower Michigan could have on the BES, especially in conjunction with the transmission upgrades. As you know, Michigan is likely to have to add capacity, likely in the form of a natural gas plant, in the near term. An evaluation as to the ability of strategic location of that plant to be part of an overall cost-lowering strategy is something that would be especially beneficial at this time.
GEORGE W. ROMNEY BUILDING • 111 SOUTH CAPITOL AVENUE • LANSING, MICHIGAN 48909
www.michigan.gov
Appendix B
John Lawhorn August 17,2016 Page 2 of 2
Specifically, MAE would like MISO to model the production cost savings, reliability, resource adequacy, and power flows that would result from a natural gas-fired generating station located in the northcentral Lower Peninsula of Michigan. The optimal site to model new gas-fired generation is near existing underground natural gas storage fields in Otsego and Kalkaska counties, intrastate natural gas pipelines, and 345 kV electric transmission lines in the northern Lower Peninsula.
MAE appreciates your consideration of this request and are happy to address any additional questions you would have. MAE staff would be happy to provide any technical assistance, government-to-government outreach, or any other support that would be requested by MISO to assist it in conducting this study.
Sincerely,
~~ Rick Snyder Governor
Attachment
Valerie Brader Executive Director Michigan Agency for Energy

1
Appendix C
Long-term Reference Plus Case Results
Reference (REF) Case
In this reference case, there were no carbon emission limits, expected and assumed retirements were included, and Michigan’s reference natural gas price was included. EGEAS met Michigan’s reserve margin requirements for all years. In the early years, the system relies heavily on all of the current utilities’ demand response programs and adding in all of the current energy optimization (EO) to meet the reserve margin requirements because no combustion turbine (CT), combined cycle (CC), wind or solar units could be built in the first two years, 2017 to 2018. Thereafter, Michigan will need to utilize all EO and demand response programs to meet its peak reserve margin requirements, especially in the first three years since its primary concern is the peak demand, not the energy needs.
Since it takes a minimum of two years to build a CT, and a minimum of three years to build a CC unit, planned construction of these two do not begin until the years 2019 to 2022, and as a result, CT or CC units will need to be built to maintain the designated reserve margin of 15.5 percent. Wind and solar are available to be selected after 2017 to 2018, but only one solar unit was selected in the last year of the study period.
By 2035, EGEAS results had 10,133 MW of capacity expansion, with the bulk of it being natural gas CC or CT units. EGEAS added the first 400 MW CT online in 2019 and ends with a Solar/Photo Voltaic unit of 50 MW coming on line in 2035.
Regarding residential price response, initially 50 MW was added in 2017, and that same amount each year thereafter through 2024, for a total capacity of 400 MW. That total 400 MW was then utilized every year after 2024, as a peak load reduction supply source, listed as cumulative residential price response in the chart below.
Regarding residential direct load control, initially 150 MW was selected in 2016, and 50 MW were added per year for six years beginning in 2018, and another 15 MW in year 2024, for a total capacity of 465 MW. That 465 MW was then utilized every year after 2024, as a peak load reduction supply source, listed as cumulative residential direct load control (DLC) in the chart below.
Regarding commercial demand response, initially 621 MW was selected in 2016, and another 168 MW was added in 2017. That total capacity of 789 MW was then utilized every year thereafter as a peak load reduction supply source, listed as cumulative commercial demand response in the chart below.
This model includes the utilities’ MPSC filings in recent capacity cases, rate cases, and Power Supply Cost Recovery cases of several years’ worth of added demand response programs and results suggest that demand response customer contributions are needed in the next 20 years for peak load reduction under certain conditions.
These existing demand response programs typically do not get utilized until MISO sends out hot

2
weather alerts and potentially max generation alerts or warnings.1
High Demand and Energy Forecast (HDE) Case The HDE case had the same assumptions as the reference case, with a higher demand and energy forecast. In the early years, the system relies heavily on all of the current utilities’ demand response programs and adding in all of the current EO to meet the reserve margin requirements because no CT, CC, wind or solar units could be built in the first two years, 2017 to 2018. For the first several years in the forecast, under this high demand and energy forecast case, Michigan will not meet its reserve margins of 15.5 percent since it cannot build the needed generation units within that short time period. However the utilities and Alternative Electric Suppliers may still be able to import into Michigan, but the specific quantity of how much can be imported, if at all, is an unknown since transmission is not modeled in EGEAS. Generation expansion plans also required more build outs due to the increased load requirements. With increased demand and energy forecasts, all costs increased. For 2035, in comparison to the reference case, the HDE case requires more new units to be built of natural gas for an amount of 10,800 MW. The same amount of new demand response from three programs are used in this case of 883 MW. 1 MISO Independent Market Monitor Quarterly Report Summer 2016 https://www.misoenergy.org/Library/Repository/Meeting%20Material/Stakeholder/BOD/Markets%20Committee/2016/20160913/20160913%20Markets%20Committee%20of%20the%20BOD%20Item%2003%20IMM%20Quarterly%20Report%20Summer%202016.pdf
21,834 MW
9,200 MW
789 MW465 MW
401 MW
20,000
24,000
28,000
32,000
36,000
2016 2017 2018 2019 2020 2021 2022 2023 2024 2025 2026 2027 2028 2029 2030 2031 2032 2033 2034 2035
Capa
city
(MW
)
Reference Case Capacity by Fuel Type
Existing Capacity Cumulative New GasCumulative Commercial DR Cumulative Residential DLCCumulative Residential Price Response Cumulative Solar
50 MW

3
Regarding the three demand response programs in this HDE case, EGEAS picked the same amount of programs as the reference case resulting in a total of 1,654 MW being used.
Renewables in MISO Generation Interconnection Queue and Ramp Up Renewable Mandate (RENGIQRPS) Case
In this case, it ramped up the Renewable Portfolio Standard (RPS) to 15 percent by 20252, which resulted in the addition of wind units. The reserve margin requirement was met in all years. In the early years, the system relies heavily on all of the current utilities’ demand response programs and adding in all of the current EO to meet the reserve margin requirements because no CT, CC, wind or solar units could be built in the first two years, 2017 to 2018. Thereafter, Michigan will need to utilize all demand response programs to meet its peak reserve margin requirements in the first three years since its primary concern is the peak demand, not the energy needs. In this RENGIQRPS case, EGEAS calculated for the 20 years, through 2035, Michigan will need to build at least 11,983 MW of new generation. The higher RPS constraint required the addition of wind units, and thus it would bring on line about 2,700 MW of wind, 8,400 MW of new natural 2 While the statute requires a ramp up of renewables to meet a 15 percent mandate by 2021, it is assumed that the updated renewable energy credit banking provision contained in the law (five years compared to three years) will position Michigan utilities firmly to meet the 2021 mandate without the need to build significant additional renewable resources. In an effort to meet the goal of 35 percent by 2035 through a combination of energy efficiency measures and renewables it was assumed that a renewable capacity build-out would continue through 2025.
21,784 MW
10,800 MW
789 MW465 MW
401 MW
20,000
24,000
28,000
32,000
36,000
2016 2017 2018 2019 2020 2021 2022 2023 2024 2025 2026 2027 2028 2029 2030 2031 2032 2033 2034 2035
Capa
city
(MW
)
High Demand Scenerio Capacity by Fuel Type
Existing Capacity Cumulative New GasCumulative Commercial DR Cumulative Residential DLCCumulative Residential Price Response

4
gas, and utilizing 1,654 MW of demand response programs by 2035.
Thermal and Renewable Generation in MISO Generation Interconnection Queue (THERMRENGIQ) Case
This case included all thermal generation and renewable projects currently in the MISO Generator Interconnection Queue that are expected to be built by the in-service date identified in the queue. In the early years, the system relies heavily on all of the current utilities’ demand response programs and adding in all of the current EO to meet the reserve margin requirements because no CT, CC, wind or solar units could be built in the first two years, 2017 to 2018. Thereafter, Michigan will need to utilize all EO and demand response programs to meet its peak reserve margin requirements in the first three years since its primary concern is the peak demand, not the energy needs. This case had lower overall costs with the plan to build 7,600 MW of new gas generation and utilize demand response programs of 1,654 MW. Fundamentally, it makes sense that if you build the generation sooner, the NPV will be less given depreciation over 20 years, and adding generation later on in the period will be more expensive than generation built early in the period because of the time value of money. However, building significant amounts of generation early in the plan could lead to excess capacity being built too soon.
22,154 MW
8,800 MW
2,700 MW789 MW
465 MW401 MW
20,000
24,000
28,000
32,000
36,000
2016 2017 2018 2019 2020 2021 2022 2023 2024 2025 2026 2027 2028 2029 2030 2031 2032 2033 2034 2035
Capa
city
(MW
)
Renewable GIQ with RPS ScenerioCapacity by Fuel Type
Existing Capacity Cumulative New GasCumulative New Wind Cumulative Commercial DRCumulative Residential DLC Cumulative Residential Price Response

5
Palisades Early Retirement (PALRETIRE) Case
This case modeled Palisades’ retirement on January 1, 2022. EGEAS was able to solve to meet Michigan’s reserve margin requirements for all years. In the early years, the system relies heavily on all of the current utilities’ demand response programs and adding in all of the current EO to meet the reserve margin requirements because no CT, CC, wind or solar units could be built in the first two years, 2017 to 2018. Thereafter, Michigan will need to utilize all EO and demand response programs to meet its peak reserve margin requirements in the first three years since its primary concern is the peak demand, not the energy needs.
With the early retirement of Palisades, the capacity requirements are the same as the reference case as shown in Table 1 and the reference case chart above. However with the generation unit retiring early in the study, there will be additional costs associated with new added capacity as well as running more expensive units to replace the lost energy supplied by Palisades.
23,725 MW
7,600 MW
789 MW465 MW
401 MW
20,000
24,000
28,000
32,000
36,000
2016 2017 2018 2019 2020 2021 2022 2023 2024 2025 2026 2027 2028 2029 2030 2031 2032 2033 2034 2035
Capa
city
(MW
)Thermal and Renewable GIQ Scenario
Capacity by Fuel Type
Existing Capacity Cumulative New GasCumulative Commercial DR Cumulative Residential DLCCumulative Residential Price Response