michoud4 guido gerig hongtu zhu stephen m. pizer martin
TRANSCRIPT

SlicerSALT: Shape AnaLysis Toolbox
Jared Vicory1, Laura Pascal1, Pablo Hernandez1, James Fishbaugh3, Juan Prieto2, Mahmoud Mostapha2, Chao Huang2, Hina Shah1, Junpyo Hong2, Zhiyuan Liu2, Loic Michoud4, Jean-Christophe Fillion-Robin1, Guido Gerig3, Hongtu Zhu2, Stephen M. Pizer2, Martin Styner2, and Beatriz Paniagua1
1Kitware, Inc
2University of North Carolina at Chapel Hill
3New York University
4Univeristy of Michigan
Abstract
SlicerSALT is an open-source platform for disseminating state-of-the-art methods for performing
statistical shape analysis. These methods are developed as 3D Slicer extensions to take advantage
of its powerful underlying libraries. SlicerSALT itself is a heavily customized 3D Slicer package
that is designed to be easy to use for shape analysis researchers. The packaged methods include
powerful techniques for creating and visualizing shape representations as well as performing
various types of analysis.
Keywords
Shape analysis; Statistics; Software
1 Introduction
Statistical shape analysis is an active area of research in the medical imaging community
with many groups working on novel methods of representing and analyzing the shape of
anatomical structures. Unfortunately, due to the sheer number of data formats and software
packages created in a variety of programming languages, it can be difficult to pull together
pipelines making use of methods created by different groups. In addition, much of the
available software is written only to be used by other computer scientists, making it difficult
for the wider medical community to make use of these powerful analysis techniques.
SlicerSALT [3] is an open-source platform for the dissemination of state-of-the-art methods
for performing statistical shape analysis. The goal of SlicerSALT is to provide an easy to use
end-to-end solution for performing statistical shape analysis of anatomical objects. As
shown in figure 1, SlicerSALT provides methods for importing segmentation data in several
formats, performing a variety of pre-processing and quality control tasks, deriving shape
represtations with good correspondences from these segmentations, and performing
statistical analysis using a variety of powerful techniques. SlicerSALT is a heavily
customized version of 3D Slicer[1, 5] that is designed to streamline the importing and
HHS Public AccessAuthor manuscriptShape Med Imaging (2018). Author manuscript; available in PMC 2019 April 25.
Published in final edited form as:Shape Med Imaging (2018). 2018 September ; 11167: 65–72. doi:10.1007/978-3-030-04747-4_6.
Author M
anuscriptA
uthor Manuscript
Author M
anuscriptA
uthor Manuscript
running of the included methods to make it easy for even non-experts to perform powerful
shape analysis studies as well as remove the non-relevant modules of 3D Slicer to avoid
confusion.
SlicerSALT is built as a series of extensions to 3D Slicer. This enables SlicerSALT to
leverage the power of Slicer’s underlying toolkits as well as its large and active developer
community. It also makes contributing to SlicerSALT easy, as additional functions can be
created as indepdendent Slicer extensions and incorporated into SlicerSALT’s build system.
This is combined with a strong software infrastructure including automatic building, unit
testing, and dashboards. The end result is a robust software package that is easy to both
extend and maintain as new methodology continues to be developed.
2 Available Extensions
This section describes the extensions developed as part of SlicerSALT. These are available
as part of the SlicerSALT distribution as well as individually in 3D Slicer via the Slicer
Extension Manager. Because the methods are packaged as 3D Slicer modules, non-expert
users are able to run them through the SlicerSALT UI while advanced users could also run
them from the command line.
2.1 Home
SlicerSALT starts by default on the home module shown in figure 2. This module describes
a basic workflow from data loading through the creation and analysis of the target shapes. It
also features links to jump directly to each module. This module is designed to guide new
and inexperienced users through a typical workflow.
2.2 Data Importer
This extension is designed to make it easy for the user to import data in multiple different
formats and perform quick visualizations and quality control prior to analysis. Data can be
imported as either binary label maps or surfaces. The Data Importer also has special logic to
deal with importing data output from popular segmentation applications such as Autoseg
[14], FSL [9], and FreeSurfer [6]. Figure 3 shows the Data Importer interface with an
example dataset.
2.3 SPHARM-PDM
SPHARM-PDM [13] is a tool that uses spherical harmonics to compute point distribution
models (PDMs) using a parametric boundary description for use in shape analysis. The
SPHARM-PDM extension takes one or more binary images as input. The binary images are
first processed to ensure spherical topology, then converted to surface meshes using
marching cubes. The spherical parameterization was computed from the surface meshes
using area-preserving, distortionminimizing spherical mapping. The SPHARM description
was then computed from the mesh and its spherical parameterization. Using icosahedron
subdivision on the spharm description, a set number of points is sampled to create
correspondent PDMs. These resulting PDMs have been shown to provide a strong
foundation for a variety of statistical studies of the shape of anatomical objects, particularly
Vicory et al. Page 2
Shape Med Imaging (2018). Author manuscript; available in PMC 2019 April 25.
Author M
anuscriptA
uthor Manuscript
Author M
anuscriptA
uthor Manuscript

in the brain. SPHARM-PDM provides a basis on which many of the other included methods
operate.
Also included is ShapePopulationViewer [2], shown in figure 4, for visualizing the resulting
PDMs and their parameterizations to ensure good correspondence.
2.4 Group-wise Registration For Shape Correspondence (GROUPS)
GROUPS[11] is a method for improving correspondence of a population of PDMs, such as
those resulting from SPHARM-PDM, using a group-wise registration and optimization
strategy. This optimization works by minimizing the entropy of the distribution of
curvedness of the surface at corresponding point locations, ensuring that corresponding
points are in positions with similar geometric features across the population. This method is
particularly helpful in improving correspondences on objects with complicated geometry
where the standard SPHARM-PDM correspondences may prove inadequate.
2.5 Multivariate Functional Shape Data Analysis (MFSDA)
MFSDA[10] packages a powerful set of advanced statistical tools that can efficiently
correlate shape data with clinical and demographic variables such as age, gender, and
genetic markers. Users can load in sets of additional data corresponding to each input shape
and determine whether there is a statistically significant morphological difference caused by
some combination of the covariates.
2.6 Shape Regression
This extension allows for modeling the continuous evolution of anatomical objects via
geodesic regression and creates a 4D shape model [7]. There are two separate modules as
part of this extension: RegressionComputation for computing the regression and
RegressionVisualization for visualizing the resulting shape model. A visualization of a
regression on a set of brain data is shown in figure 5.
2.7 Shape Evaluator
The Shape Evaluator module is designed to take in a set of corresponding PDMs such as
those generated by SPHARM-PDM or GROUPS and use principal component analysis
(PCA) to compute a mean shape and its major modes of variation. The user can then
visualize the mean shape as well as how moving along each principal component changes
the shape of the object. This module allows for a quantitative comparison of the generated
shape space to those created by other methods by examining the percent of variation
explained by the modes of variation as well as computing generalization, specificity, and
compactness measures on the distribution.
2.8 Skeletal Representations (S-reps)
This module packages methods for creating and visualizing skeletal representations, known
as s-reps, of anatomical objects. S-reps are powerful shape representations that have been
shown to have beneficial properties compared to pure boundary models [12] in applications
such as classification and segmentation.
Vicory et al. Page 3
Shape Med Imaging (2018). Author manuscript; available in PMC 2019 April 25.
Author M
anuscriptA
uthor Manuscript
Author M
anuscriptA
uthor Manuscript

Currently only s-rep visualization is included, but there will soon be support for fitting s-
reps to objects and eventually for estimating probability distributions and performing
classification. These statistical methods are designed to work on s-reps as data from a non-
Eucliean manifold and will be applicable to other representations such as PDMs as well. An
example of an s-rep loaded into SlicerSALT is shown in figure 6.
3 Software Infrastructure
SlicerSALT is set up with a modern open-source software infrastructure. In addition to
information about the individual methods available in the package, the SlicerSALT website
[3] has a variety of information on using and contributing to SlicerSALT. The code for
SlicerSALT itself is hosted on GitHub [4] and includes information on how to build the
software locally as well as guidelines for contributing to SlicerSALT.
The main SlicerSALT repository has code for pulling in and building a lightweight version
of 3D Slicer and its dependencies as well as links to the external repositories where the code
for the various included methods is stored. During the building of SlicerSALT, the code for
each method is checked out from its own Git repository and built as a 3D Slicer extension.
During packaging these extensions are then pulled in along with the customized version of
3D Slicer to create the final SlicerSALT package.
SlicerSALT is built nightly and the results of these builds are uploaded to a dashboard to
track and diagnose problems with building Slicer or any of the individual extensions.
Additionally each extension has its own set of tests to ensure they are functioning correctly
as well as documentation and tutorials.
4 Discussion
The first release of SlicerSALT packages a number of powerful tools for performing
statistical shape analysis with an easy-to-use interface. It is designed as a platform for
disseminating these methods to the broader medical community.
SlicerSALT development is ongoing. Several of the methods described here are still under
active development and we will continue to improve the existing modules as well as
introduce new methods for representing and analyzing shape.
In particular, there is ongoing work [8] to establish correspondence between shapes with
complex geometry, including those with non-spherical toplogy, that cause traditional
methods such as SPHARM-PDM to fail. This work establishes correspondences by using a
diffeomorphic registration technique to deform a template shape representation into each
member of a population.
SlicerSALT is open to contributions of other shape representation and analysis methods.
New methods can be contributed by packaging them as 3D Slicer extensions. Detailed
contribution guidelines can be found in the SlicerSALT GitHub repository.
Vicory et al. Page 4
Shape Med Imaging (2018). Author manuscript; available in PMC 2019 April 25.
Author M
anuscriptA
uthor Manuscript
Author M
anuscriptA
uthor Manuscript
Future work will also include user evaluations and usability testing of the software to ensure
that it is easily usable by both expert and non-expert users.
Acknowledgments
SlicerSALT development is funded by NIH R01EB021391.
References
1. 3D Slicer. http://www.slicer.org
2. Shape population viewer. https://www.nitrc.org/projects/shapepopviewer/
3. SlicerSALT. http://salt.slicer.org
4. Slicersalt github. https://github.com/Kitware/SlicerSALT
5. Fedorov A, Beichel R, Kalpathy-Cramer J, Finet J, Fillion-Robin JC, Pujol S, Bauer C, Jennings D, Fennessy F, Sonka M, et al.: 3d slicer as an image computing platform for the quantitative imaging network. Magnetic resonance imaging 30(9), 1323–1341 (2012) [PubMed: 22770690]
6. Fischl B: Freesurfer. Neuroimage 62(2), 774–781 (2012) [PubMed: 22248573]
7. Fishbaugh J, Durrleman S, Gerig G: Estimation of smooth growth trajectories with controlled acceleration from time series shape data. In: International Conference on Medical Image Computing and Computer-Assisted Intervention pp. 401–408. Springer (2011)
8. Fishbaugh J, Pascal L, Fischer L, Nguyen T, Boen C, Goncalves J, Gerig G, Paniagua B: Estimating shape correspondence for populations of objects with complex topology. In: Biomedical Imaging (ISBI 2018), 2018 IEEE 15th International Symposium on pp. 1010–1013. IEEE (2018)
9. Jenkinson M, Beckmann CF, Behrens TE, Woolrich MW, Smith SM: Fsl. Neuroimage 62(2), 782–790 (2012) [PubMed: 21979382]
10. Li Y, Zhu H, Shen D, Lin W, Gilmore JH, Ibrahim JG: Multiscale adaptive regression models for neuroimaging data. Journal of the Royal Statistical Society: Series B (Statistical Methodology) 73(4), 559–578 (2011) [PubMed: 21860598]
11. Lyu I, Kim SH, Seong JK, Yoo SW, Evans A, Shi Y, Sanchez M, Niethammer M, Styner MA: Robust estimation of group-wise cortical correspondence with an application to macaque and human neuroimaging studies. Frontiers in neuroscience 9, 210 (2015) [PubMed: 26113807]
12. Pizer SM, Jung S, Goswami D, Vicory J, Zhao X, Chaudhuri R, Damon JN, Huckemann S, Marron J: Nested sphere statistics of skeletal models. In: Innovations for Shape Analysis, pp. 93–115. Springer (2013)
13. Styner M, Oguz I, Xu S, Brechbühler C, Pantazis D, Levitt JJ, Shenton ME, Gerig G: Framework for the statistical shape analysis of brain structures using spharm-pdm. The insight journal (1071), 242 (2006) [PubMed: 21941375]
14. Wang J, Vachet C, Rumple A, Gouttard S, Ouziel C, Perrot E, Du G, Huang X, Gerig G, Styner MA: Multi-atlas segmentation of subcortical brain structures via the autoseg software pipeline. Frontiers in neuroinformatics 8, 7 (2014) [PubMed: 24567717]
Vicory et al. Page 5
Shape Med Imaging (2018). Author manuscript; available in PMC 2019 April 25.
Author M
anuscriptA
uthor Manuscript
Author M
anuscriptA
uthor Manuscript
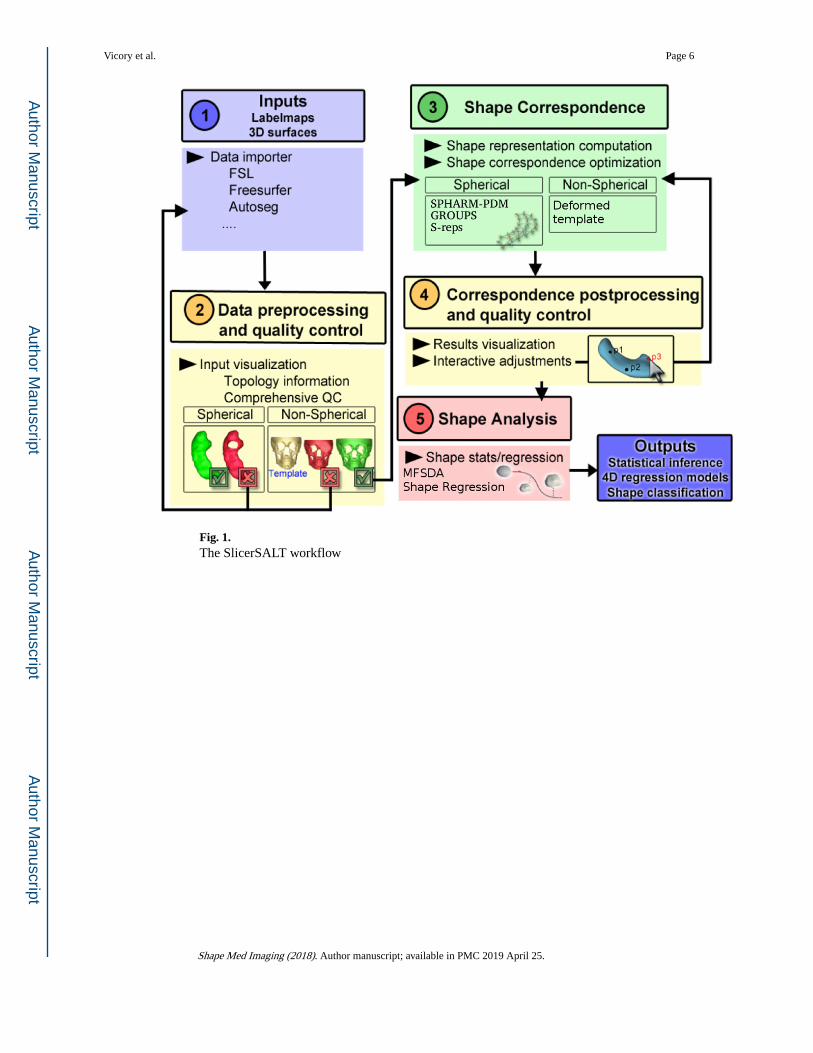
Fig. 1. The SlicerSALT workflow
Vicory et al. Page 6
Shape Med Imaging (2018). Author manuscript; available in PMC 2019 April 25.
Author M
anuscriptA
uthor Manuscript
Author M
anuscriptA
uthor Manuscript

Fig. 2. The SlicerSALT home module with direct links to the available extensions.
Vicory et al. Page 7
Shape Med Imaging (2018). Author manuscript; available in PMC 2019 April 25.
Author M
anuscriptA
uthor Manuscript
Author M
anuscriptA
uthor Manuscript

Fig. 3. The Data Importer module after loading lateral ventricle segmentations.
Vicory et al. Page 8
Shape Med Imaging (2018). Author manuscript; available in PMC 2019 April 25.
Author M
anuscriptA
uthor Manuscript
Author M
anuscriptA
uthor Manuscript
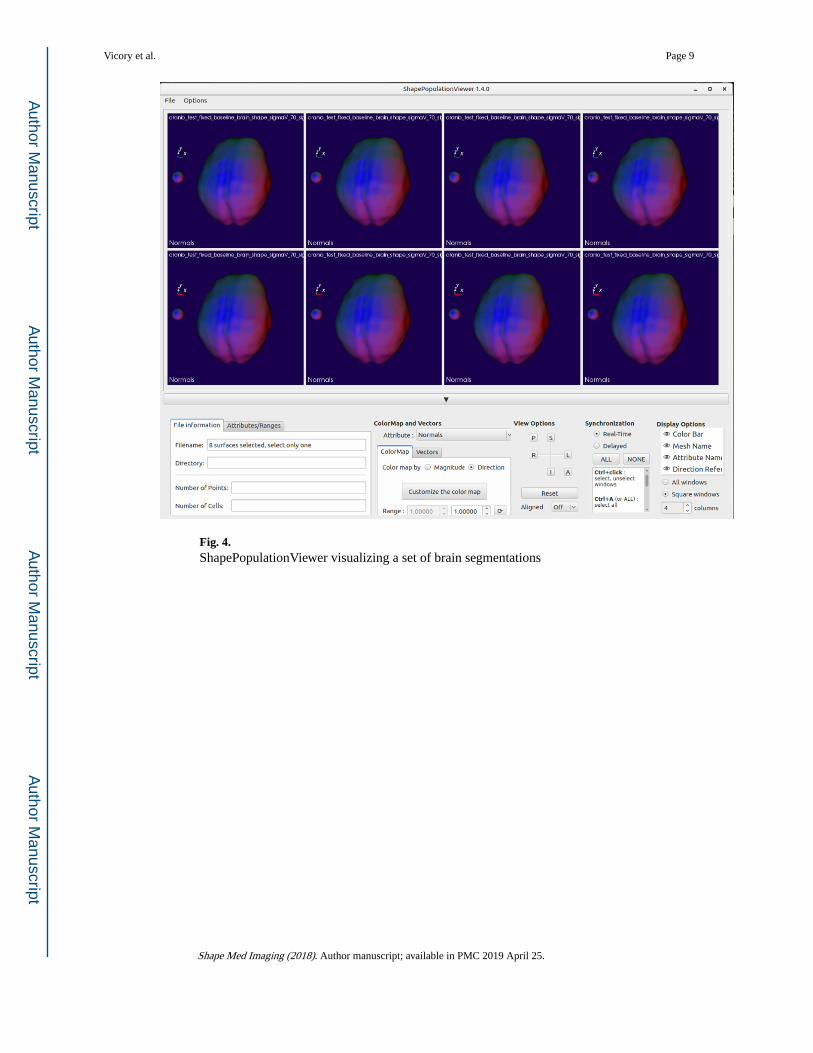
Fig. 4. ShapePopulationViewer visualizing a set of brain segmentations
Vicory et al. Page 9
Shape Med Imaging (2018). Author manuscript; available in PMC 2019 April 25.
Author M
anuscriptA
uthor Manuscript
Author M
anuscriptA
uthor Manuscript

Fig. 5. The RegressionVisualization module showing the result of a regression computation on a set
of brain segmentations.
Vicory et al. Page 10
Shape Med Imaging (2018). Author manuscript; available in PMC 2019 April 25.
Author M
anuscriptA
uthor Manuscript
Author M
anuscriptA
uthor Manuscript

Fig. 6. An example skeletal model (s-rep) loaded into SlicerSALT.
Vicory et al. Page 11
Shape Med Imaging (2018). Author manuscript; available in PMC 2019 April 25.
Author M
anuscriptA
uthor Manuscript
Author M
anuscriptA
uthor Manuscript