micro-bolometer arrays and the south pole telescope · micro-bolometer arrays and the south pole...
TRANSCRIPT

Micro-bolometer arrays and the South Pole Telescope
Clarence L. ChangSLAC AIS Seminar
March 18, 2009

The CMB: A Cornerstone to our understanding of
Cosmology• Universe is flat
• Measurement of the relic abundance of CDM
• Seeds of structure formation
• Inflation
• Dark Energy
WMAP
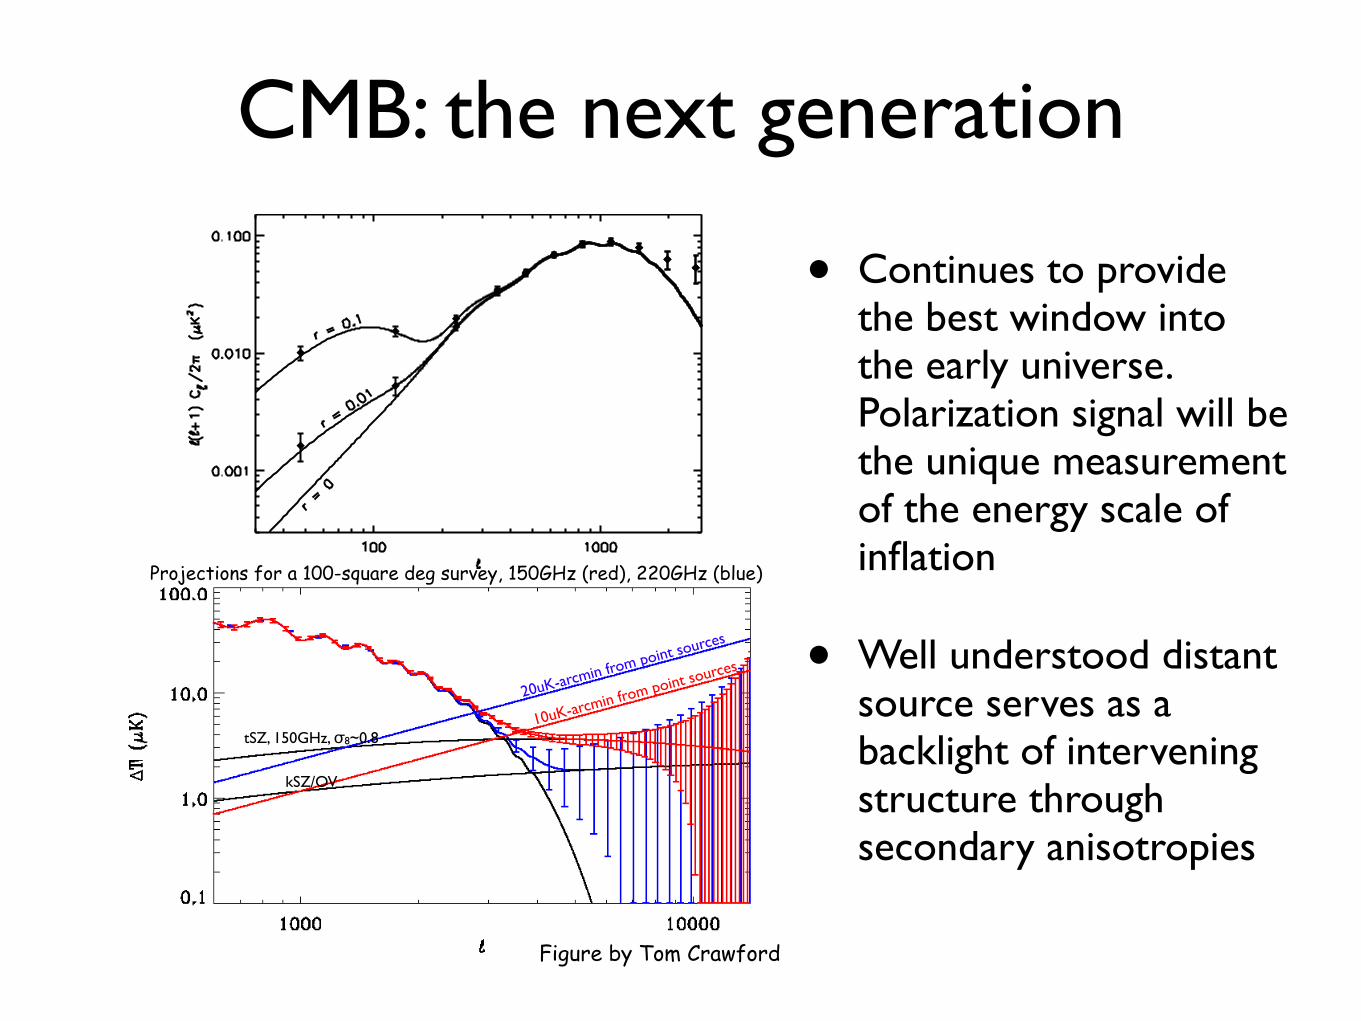
CMB: the next generation
• Continues to provide the best window into the early universe. Polarization signal will be the unique measurement of the energy scale of inflation
• Well understood distant source serves as a backlight of intervening structure through secondary anisotropies
tSZ, 150GHz, σ8~0.8
kSZ/OV
20uK-arcmin from point sources
10uK-arcmin from point sources
Projections for a 100-square deg survey, 150GHz (red), 220GHz (blue)
Figure by Tom Crawford
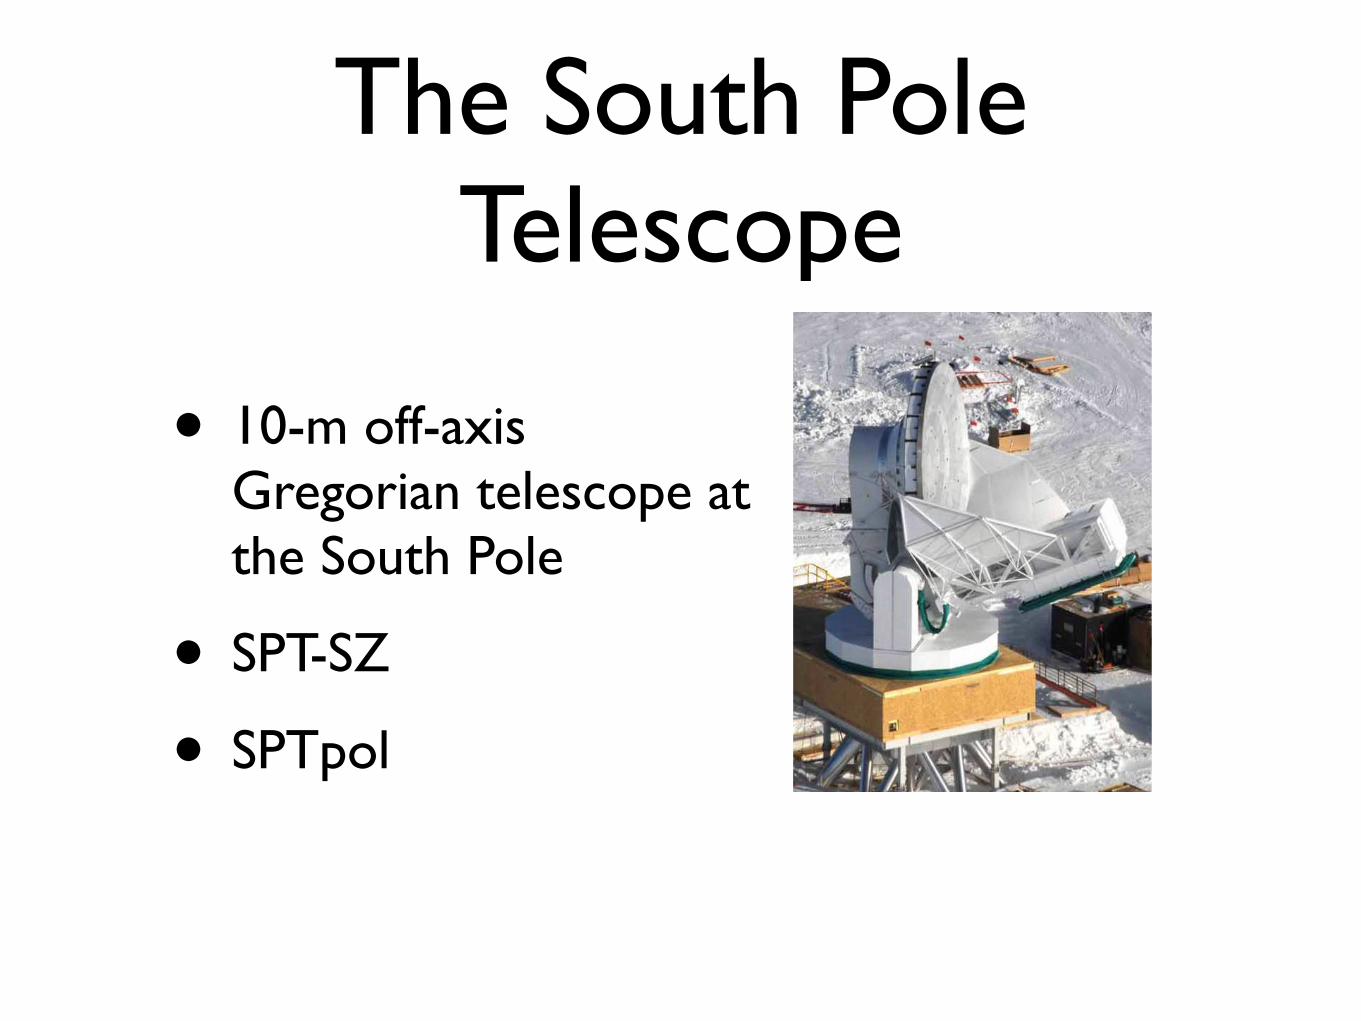
The South Pole Telescope
• 10-m off-axis Gregorian telescope at the South Pole
• SPT-SZ
• SPTpol

OutlineMicro-bolometers and TESs
SPT-SZ
GoalsTelescopeDetectorsSeason OneSeason TwoSeason Three
SPTpol

OutlineMicro-bolometers and TESs
SPT-SZ
GoalsTelescopeDetectorsSeason OneSeason TwoSeason Three
SPTpol

Bolometer preliminaries
• Measure thermal power, not single photons
• Two fundamental noise sources
- “loading” - fluctuations of photon arrival
- “thermal carrier” - non-zero heat sinking
• Non-zero loading sets a lower limit on bolometer noise - “background limited”
C
G-1
Tbath
T
Poptical

Bolometers have reached the background limit
Second results from QUaD 21
0 500 1000 1500 200010
2
103
104
multipole
l(l+
1)C
l / 2! (µ
K2)
TT
WMAP5
ACBAR
QUaD
0 500 1000 1500 2000!200
!150
!100
!50
0
50
100
150
200
multipole
l(l+
1)C
l / 2! (µ
K2)
TE
WMAP5
B03
CBI
QUaD
0 500 1000 1500 2000
100
101
102
multipole
l(l+
1)C
l / 2! (µ
K2)
EE ! only >2" detections plotted
WMAP5
B03
CBI
CAPMAP
DASI
QUaD
0 500 1000 1500 2000
100
101
multipole
l(l+
1)C
l / 2! (µ
K2)
BB 95% confidence upper limits
WMAP5
B03
CBI
CAPMAP
DASI
QUaD
FIG. 22.— QUaD power spectra compared to results from WMAP (Nolta et al. 2008), ACBAR (Reichardt et al. 2008), B03 (Piacentini et al. 2006;Montroy et al. 2006), CBI (Sievers et al. 2007), CAPMAP (Bischoff et al. 2008) and DASI (Leitch et al. 2005). The BB upper limits are stated values whereprovided, and otherwise the 95% point of the positive part of the bandpower pdf.
• Sensitivity: Noise Equivalent Temperature (NET) defined as rms of fluctuations in one sec of integration (Kelvin √s)
• ACBAR and QUAD have ~16 detectors with NET ~350 μK √s (Background limited for ground based observations)
Mapping speed
• Mapping speed: rms noise in a map pixel for a given exposure
• scales as Nbolo / NET2

• Apply a voltage bias across a thin superconducting film
• Superconducting transition has steep R(T)
TES basics
R
T

Constant voltage, measure current
• Low impedance, low noise current measurement using Superconducting Quantum Interference Devices (SQUIDs)
• Readout can be multiplexed
0 1 2 Φ / Φ 0
V

A case for TESs?• Pros
- Improved linearity
- Increased bandwidth
- Fixed detector noise
- no microphonics
- reduced wiring from MUX
- Low power dissipation from SQUIDs
• Cons
- None (of course)

A case for TESs?• Pros
- Improved linearity
- Increased bandwidth
- Fixed detector noise
- no microphonics
- reduced wiring from MUX
- Low power dissipation from SQUIDs
• Cons
- None (of course)

OutlineMicro-bolometers and TESs
SPT-SZ
GoalsTelescopeDetectorsSeason OneSeason TwoSeason Three
SPTpol

• Survey for clusters using the Sunyaev-Zel’dovich effect
• Expect a nearly red-shift independent mass threshold
• Measure the evolution of the cluster mass function when combined with
SPT-SZ
Gil Holder

The Sunyaev-Zeldovich effectA
dapt
ed fr
om L
. Van
Spe
ybro
eck
• Distortion of CMB spectrum
- Null @ 220 GHz, decrement below, increment above
- ~100 μKCMB for 2×10¹⁴ Msun
- Need lots of sensitivity!
• Clusters are a few arcmins
- Need resolution!

OutlineMicro-bolometers and TESs
SPT-SZ
GoalsTelescopeDetectorsSeason OneSeason TwoSeason Three
SPTpol

Want the right tool for the job

Want the right tool for the job

Why the South Pole?
Pre
cip
itab
le W
ater
Vap
or
(mm
of
wat
er)
0
2
1
3
4
5
6
4/95-9/95 10/95-3/96 4/95-9/95 10/95-3/96 Jan-June July-Dec
South Pole Atacama Mauna Kea
25%
50%
75%
0.1
9
0.2
5
0.3
2
0.3
4
0.4
7 0.6
7
0.6
8 1.0
0
1.6
0
1.1
0
2.0
0
3.7
0
1.0
5
1.6
5
3.1
5
1.7
3
2.9
8
5.8
8
From radiosonde Computed from measured 225 GHz opacity
!"#$%&'%"'(%)*(+,
-)+&.(%/&0%/1
!"#$#%&'()%*++,-
2""0&+3/&%(045(+&$)6"+'7(%*5&#"$0*89&$80&$##":+&;*9&57"'1
-)+&5"#0<
=.(%$9(&)(6'&*8&:*8)(%&>&?@AB1

High throughput, high resolution
• ~260 panels aligned to 25 μm rms over 10-m surface gives 95% efficiency at 220 GHz
• 8-10 meter dish gives 1’ resolution at 150 GHz
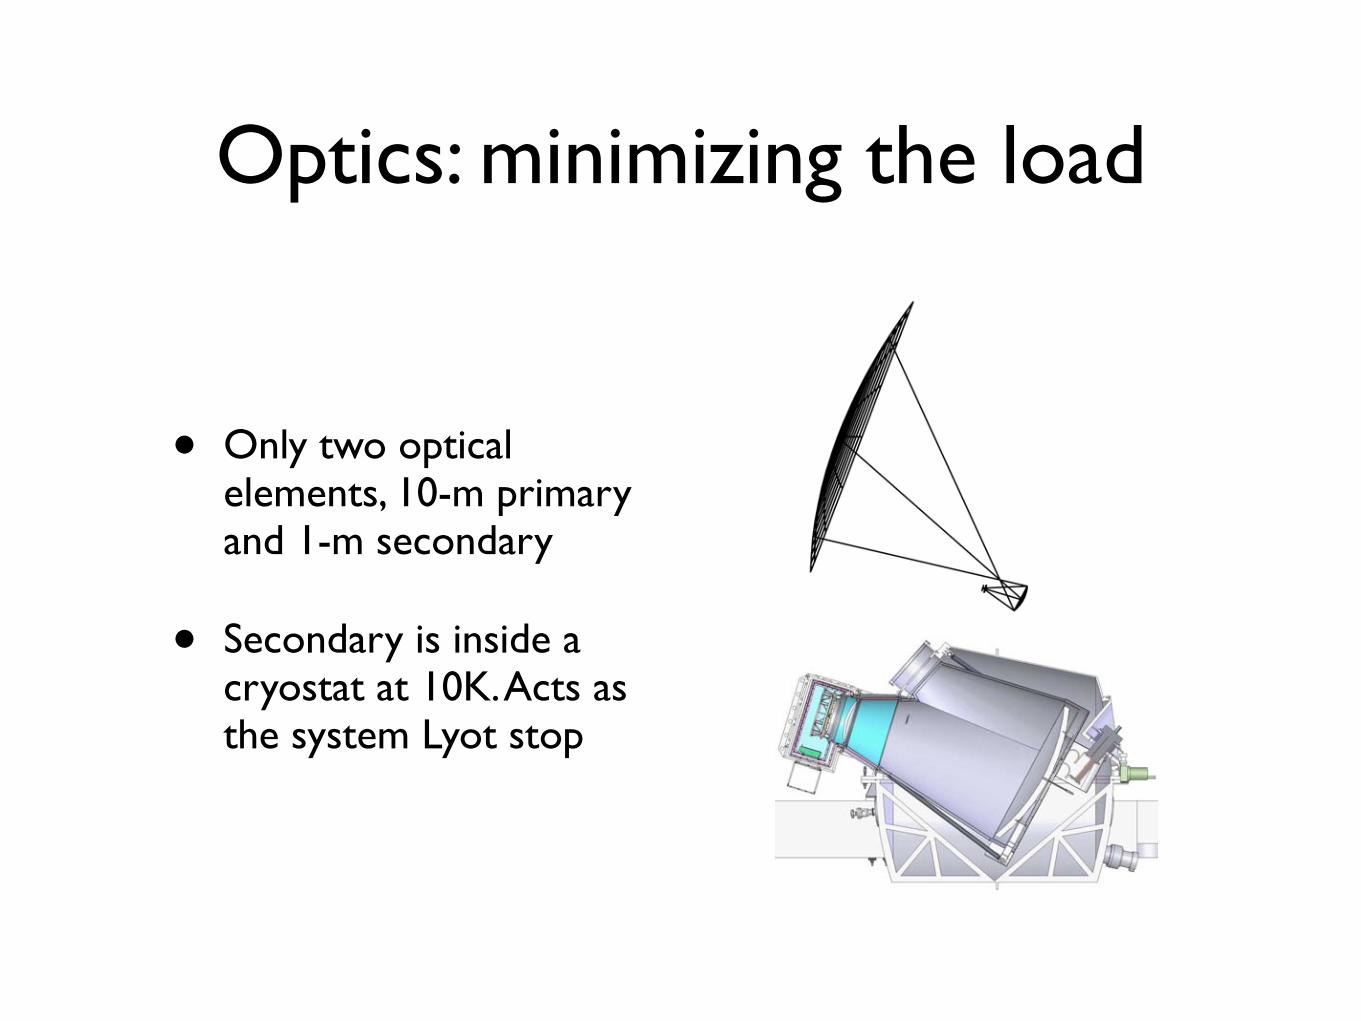
Optics: minimizing the load
• Only two optical elements, 10-m primary and 1-m secondary
• Secondary is inside a cryostat at 10K. Acts as the system Lyot stop

21
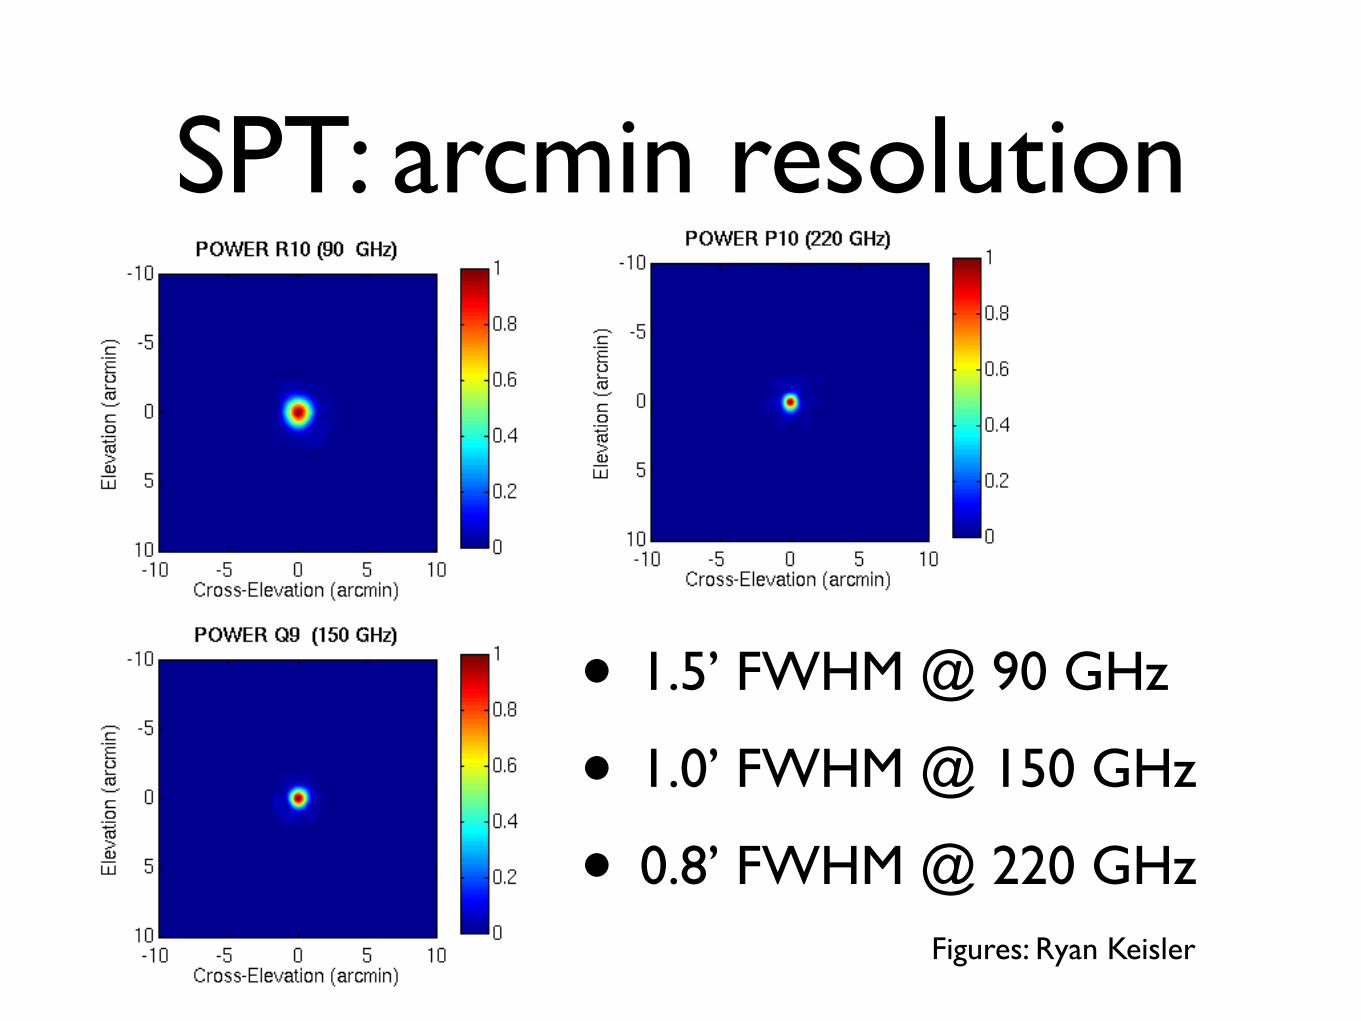
SPT: arcmin resolution
• 1.5’ FWHM @ 90 GHz
• 1.0’ FWHM @ 150 GHz
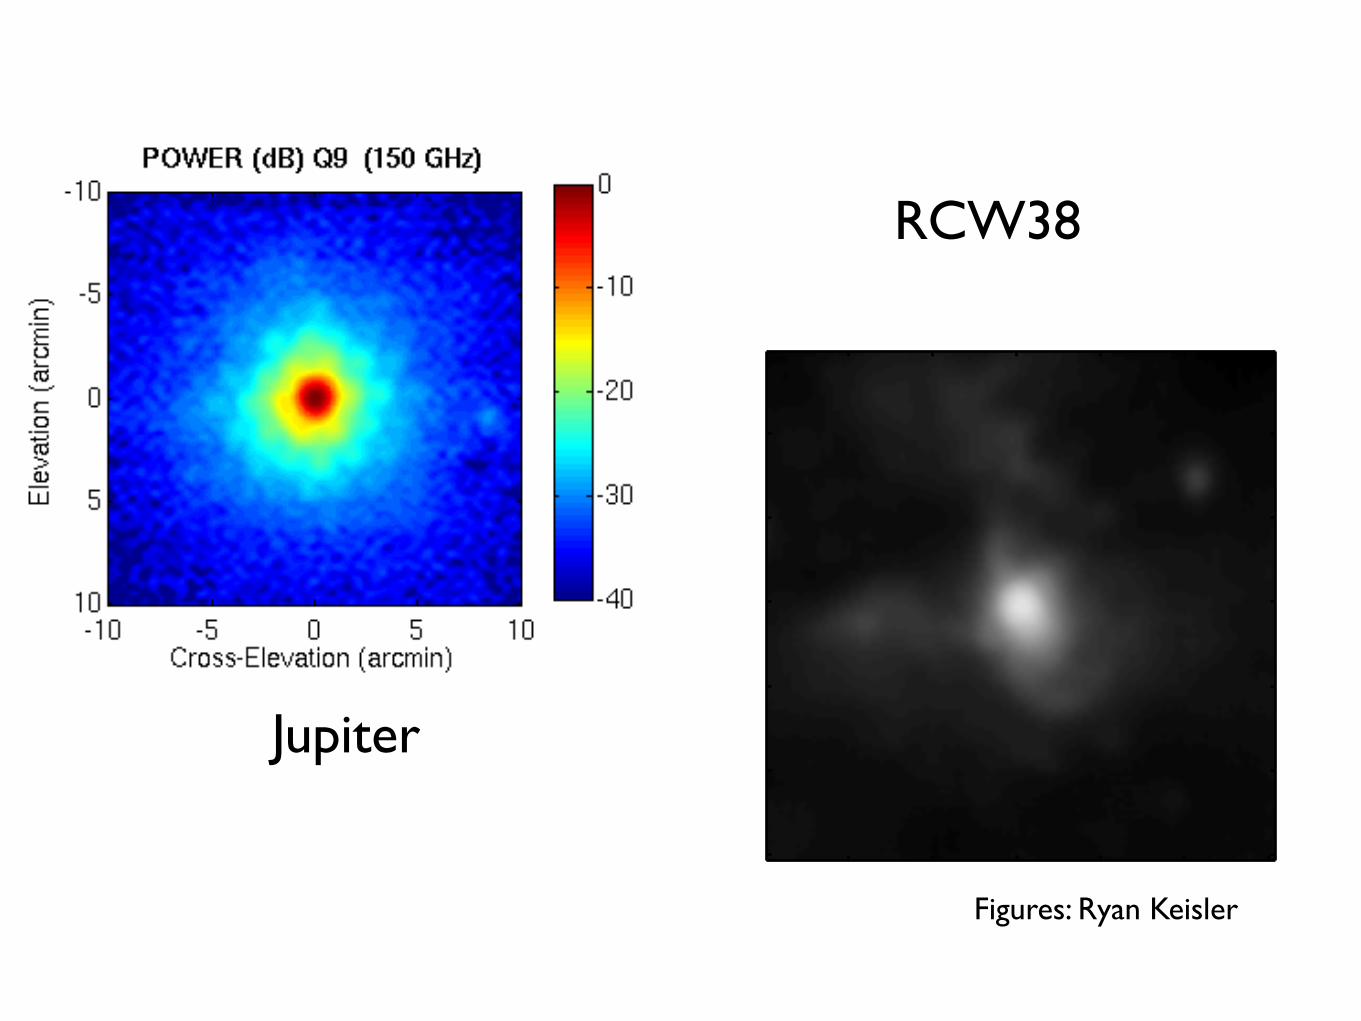
• 0.8’ FWHM @ 220 GHzFigures: Ryan Keisler
!"#$%& '("#$%& ))"#$%&
#
#*+#,-!./0
"
"1)
"12
"13
"14
#
"1""4
"1")(
"1"4"
"1)(5
"14""
Jupiter
RCW38
Figures: Ryan Keisler
OutlineMicro-bolometers and TESs
SPT-SZ
GoalsTelescopeDetectorsSeason OneSeason TwoSeason Three
SPTpol

The TES Spiderweb bolometer
4 m
m
• Spiderweb geometry minimizes cosmic ray cross section• Sheet impedance of web tuned to maximize in band absorption
•Suspended on 1 μ-thick low stress SiN membrane for thermal isolation• G defined by 100 Å-thick gold strip• Bandwidth Limiting INterface made of Gold (BLING)
• TES is a Al/Ti bilayer, Tc ~ 550 mK
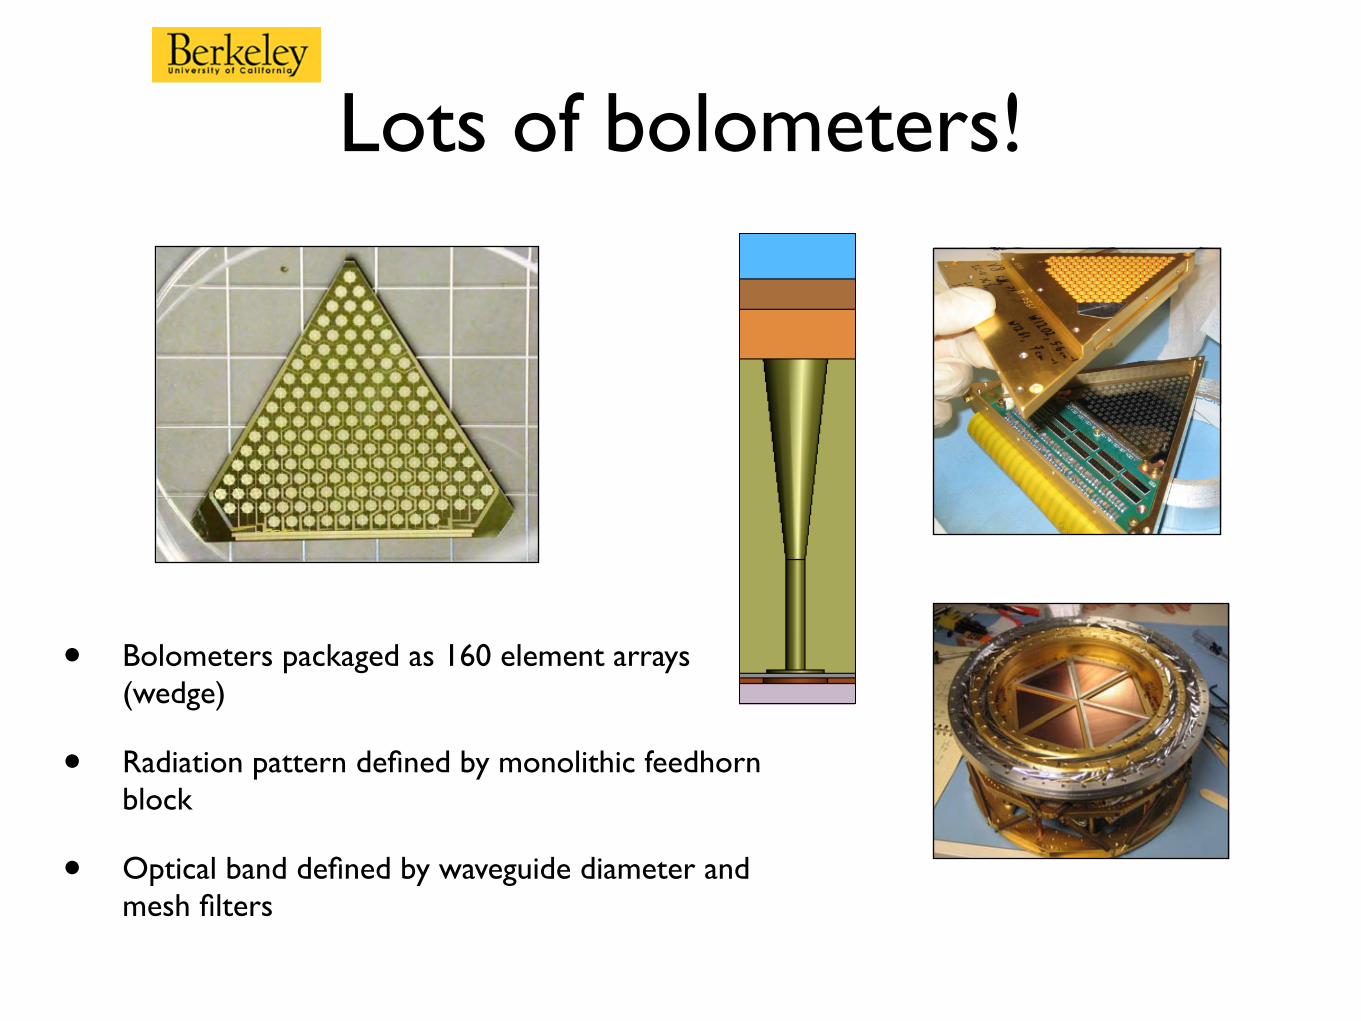
Lots of bolometers!
• Bolometers packaged as 160 element arrays (wedge)
• Radiation pattern defined by monolithic feedhorn block
• Optical band defined by waveguide diameter and mesh filters

Multiplexed readout: the fMUX
• AC bias TES (100kHz-1MHz)
• LC filters in series to determine unique bias frequency for each TES
• Sum signals at SQUID input coil
• Demodulate SQUID Feedback to recover individual bolometer timestreams
• 7 TESs per SQUID
250 mK

OutlineMicro-bolometers and TESs
SPT-SZ
GoalsTelescopeDetectorsSeason OneSeason TwoSeason Three
SPTpol
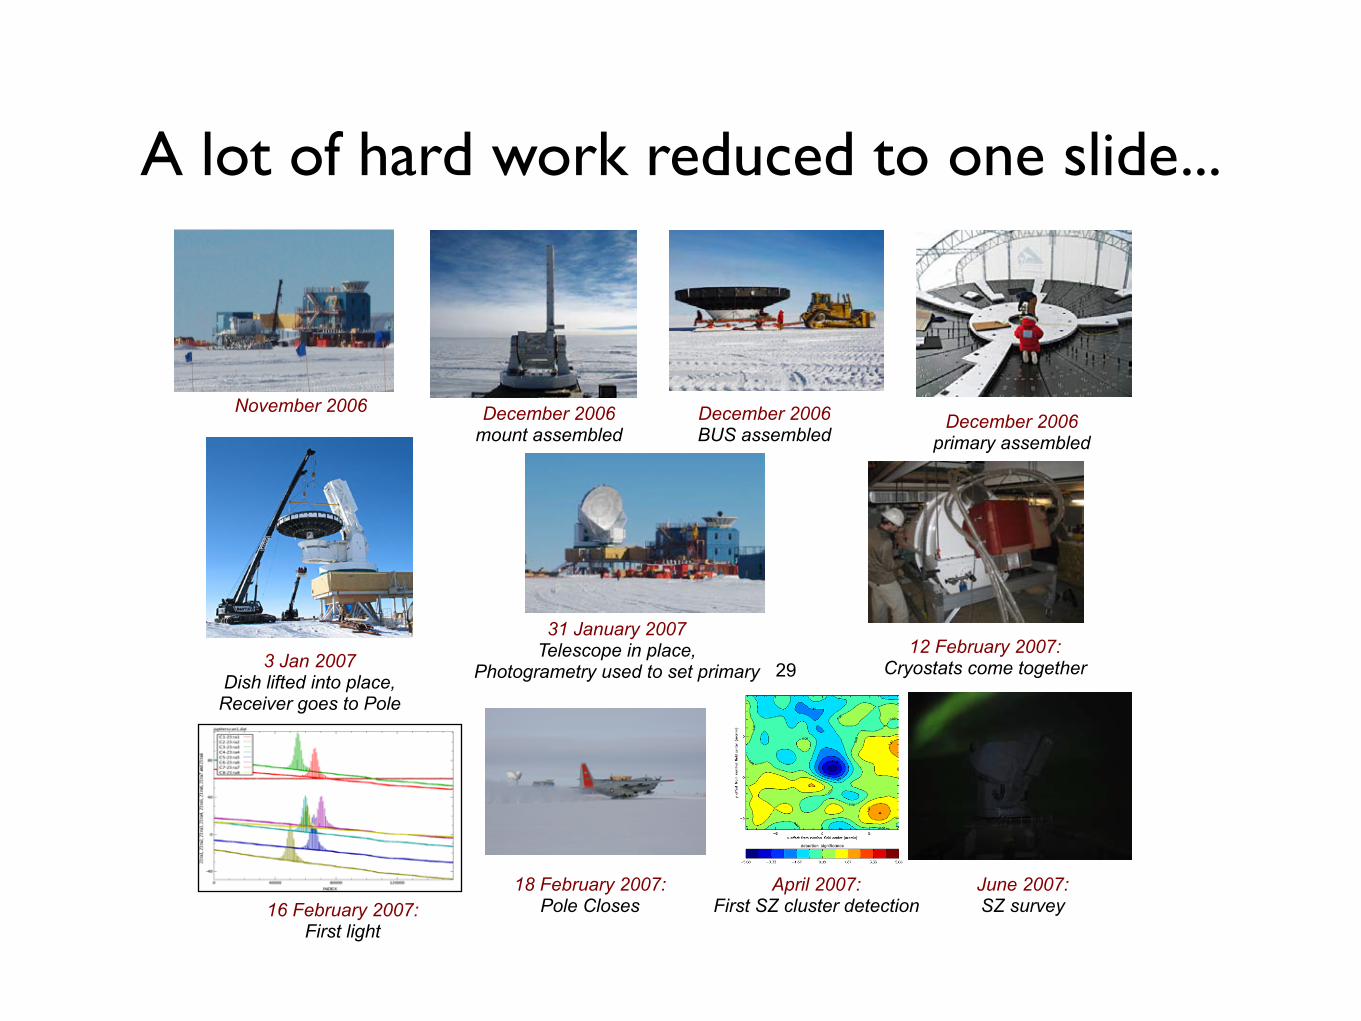
A lot of hard work reduced to one slide...
29
SPT Season 1
December 2006mount assembled
12 February 2007:Cryostats come together
April 2007:First SZ cluster detection
3 Jan 2007Dish lifted into place,Receiver goes to Pole
November 2006
16 February 2007:First light
June 2007:SZ survey
18 February 2007:Pole Closes
December 2006BUS assembled
December 2006primary assembled
31 January 2007Telescope in place,
Photogrametry used to set primary

Seeing clusters w/ SZE
• 90 GHz: 120 bolos @ 1500 μKCMB √s
• 150 GHz:140 bolos @ 1500 μKCMB √s
• 220 GHz: unstable operation
•2007 SPT SZ measurement cluster AS1063•95 and 150 GHz, 1 hour•5 sigma detection
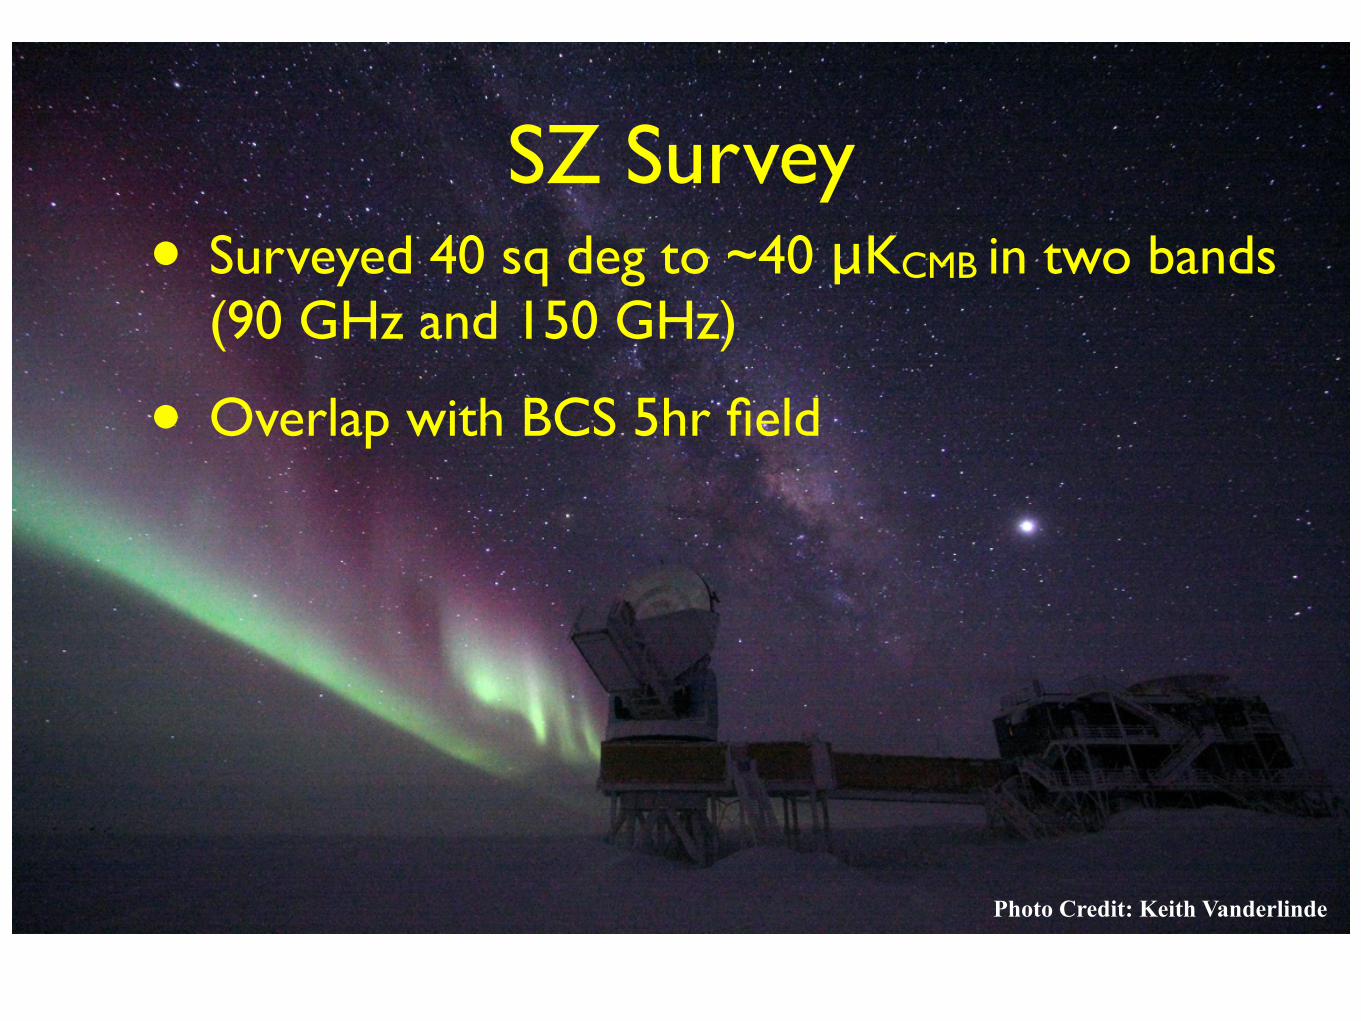
SZ Survey• Surveyed 40 sq deg to ~40 μKCMB in two bands
(90 GHz and 150 GHz)
• Overlap with BCS 5hr field
Photo Credit: Keith Vanderlinde

Lessons: stability
• As with all feedback systems, there are oscillations
• Increased bandwidth from ETF is sensitive to internal thermal circuit
• Simple thermal model for first season bolo reveals the problem... needed better coupling to bling

The fix
• Spiderweb structure for bling improves isothermal behavior
• Move TES “inside” of bling to improve thermal connection
120 μm
100 μm

Words of caution: Tc
• ETF fixes operating temperature at Tc
• G(Tc) is fixed
• Tc control is critical
• Proximity effect with nearby materials is non-negligible!

Words of caution: Tc
• ETF fixes operating temperature at Tc
• G(Tc) is fixed
• Tc control is critical
• Proximity effect with nearby materials is non-negligible!

Words of caution: Tc
• ETF fixes operating temperature at Tc
• G(Tc) is fixed
• Tc control is critical
• Proximity effect with nearby materials is non-negligible!

OutlineMicro-bolometers and TESs
SPT-SZ
GoalsTelescopeDetectorsSeason OneSeason TwoSeason Three
SPTpol

Same cluster, same exposure, better noise
• 90 GHz: saturated
• 150 GHz: 320 bolos @ 360 μKCMB√s
• 220 GHz: 170 bolos @ 850 μKCMB√s
•2008 observation of cluster AS1063•150 GHz 40 minutes
•16 sigma detection
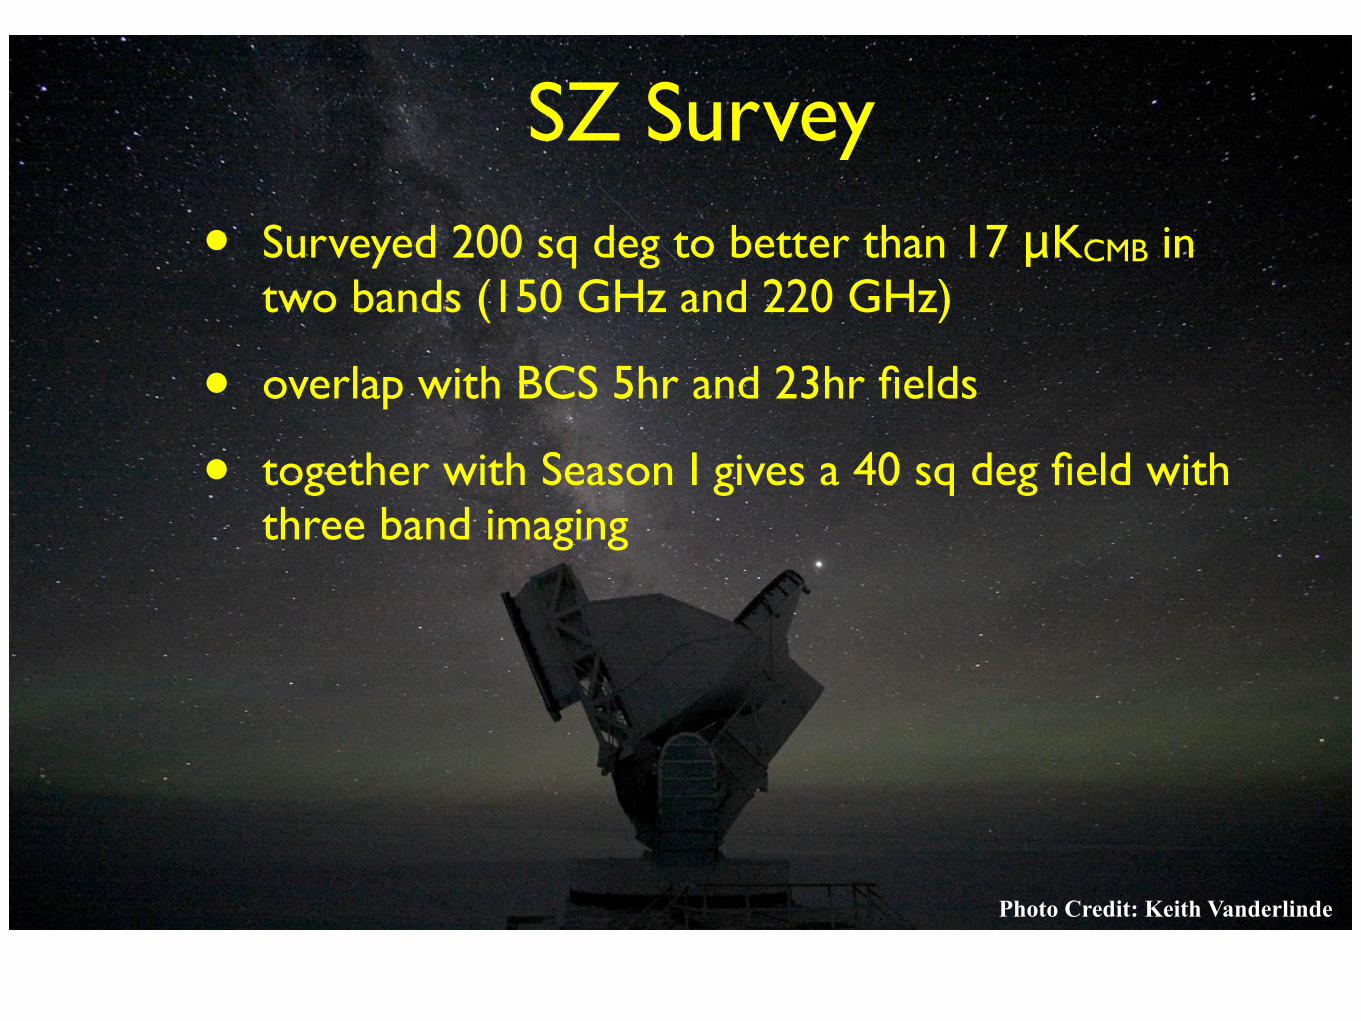
SZ Survey
• Surveyed 200 sq deg to better than 17 μKCMB in two bands (150 GHz and 220 GHz)
• overlap with BCS 5hr and 23hr fields
• together with Season I gives a 40 sq deg field with three band imaging
Photo Credit: Keith Vanderlinde

Clear SZ signature
Submitted to ApJ 10/10/08; Staniszewski et al, astro-ph/0810.1578

OutlineMicro-bolometers and TESs
SPT-SZ
GoalsTelescopeDetectorsSeason OneSeason TwoSeason Three
SPTpol

More power!!!
• 90 GHz: 120 bolos @ 450 μKCMB√s
• 150 GHz: 500 bolos @ 360 μKCMB√s
• 220 GHz: 130 bolos @ 850 μKCMB√s

More power!!!
• 90 GHz: 120 bolos @ 450 μKCMB√s
• 150 GHz: 500 bolos @ 360 μKCMB√s
• 220 GHz: 130 bolos @ 850 μKCMB√s
As good as it gets!

Plans
• Observe 800 sq deg over the next two years
• Plan to have 1000 sq deg to better than 20 μKCMB
• High l CMB Power spectrum
• Point sources (high-z dusty galaxies?)
Photo Credit: Keith Vanderlinde
OutlineMicro-bolometers and TESs
SPT-SZ
GoalsTelescopeDetectorsSeason OneSeason TwoSeason Three
SPTpol

90 GHz Detectors
• Similar detector architecture to PSBs (QUaD, BICEP, B2K, Planck)
• Coupling strictly in waveguide, choke suppresses leakage out of gap
• Absorbers consist of crossed dipoles (1 ea pol)
input waveguide
2 Gold Absorbers (on
separate planes)

Prototype properties
• Mo/Au bilayers on suspended SiN bridges
• G defined by SiN legs
• Au absorber bar
• G close to target

Prototype optical properties
• Cross-polar coupling <1.6% (simulations predict <1%)
• Good in band performance (structure from measurement)
• Coupling seems low (20% compared to > 90% from simulations)

150 GHz detector
• TES Mo/Cu bilayer suspended on SiN island
• G defined by SiN legs
• Couple to waveguide via OMT to Nb/NbO microstrip
• Microstrip filters to define bandpass

Prototype properties

Prototype optical properties
• Bandpass filters work (again, structure from the measurement)
• broad out of band coupling (already reduced to <1%)
• cross-pol <1% as predicted by simulations
• coupling ~60%
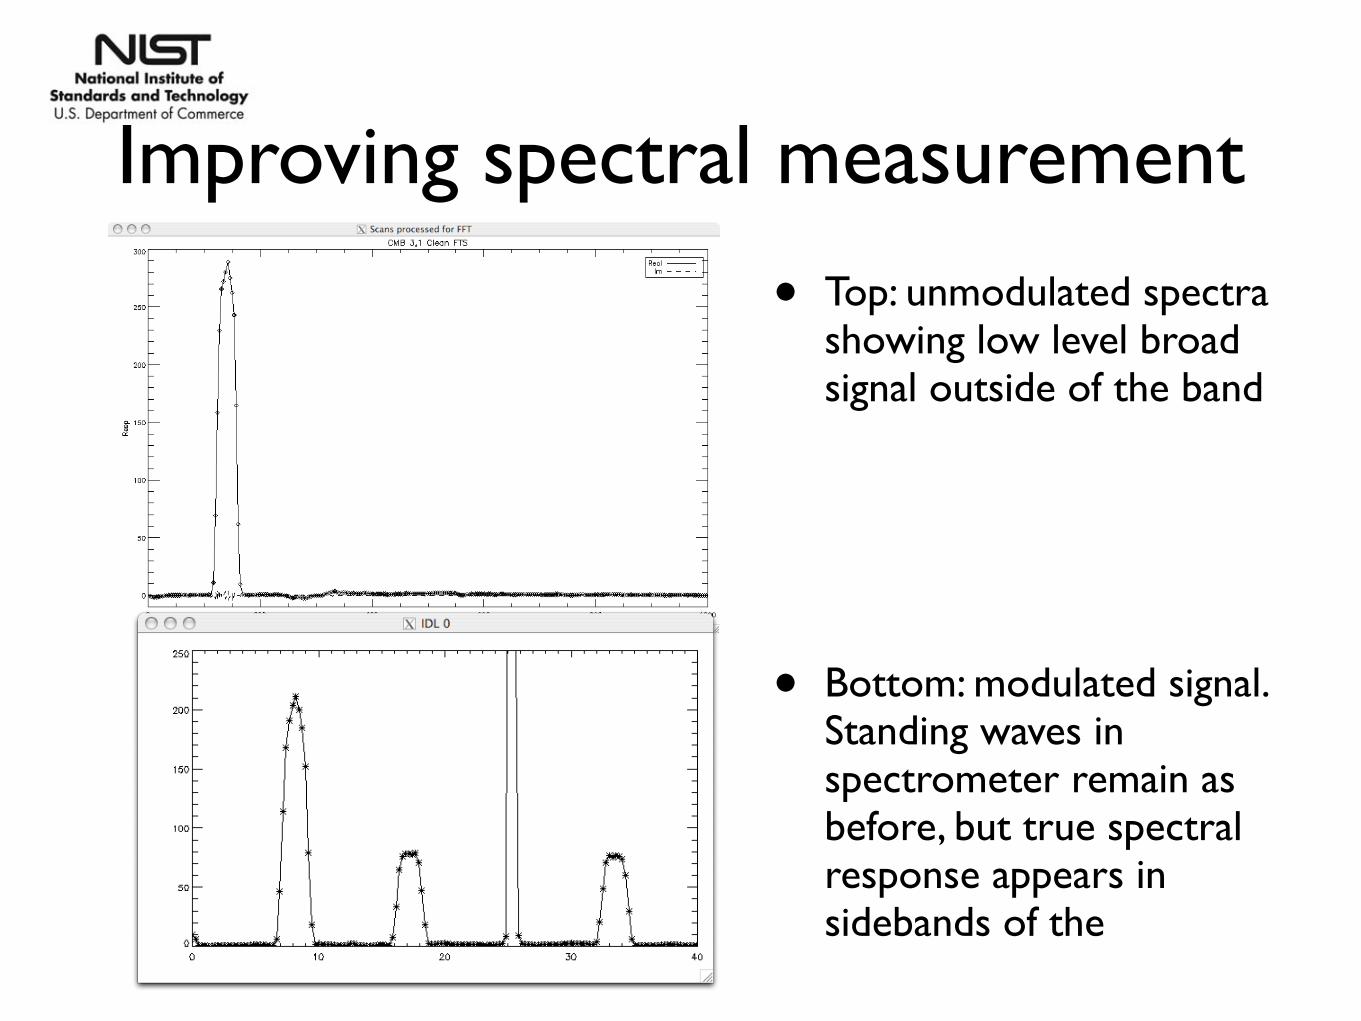
Improving spectral measurement
• Top: unmodulated spectra showing low level broad signal outside of the band
• Bottom: modulated signal. Standing waves in spectrometer remain as before, but true spectral response appears in sidebands of the

Improving spectral measurement
• Top: unmodulated spectra showing low level broad signal outside of the band
• Bottom: modulated signal. Standing waves in spectrometer remain as before, but true spectral response appears in sidebands of the

Expensive photos
Zak Staniszewski2007
KeithVanderlinde2008
Dana Hrubes 2008
Steve Padin2007
Erik Shirokoff2009
Ross Williamson2009

Photo Credit: Keith Vanderlinde
• SPT-SZ is the most powerful SZ cluster survey instrument in existence
• Success demonstrates that TES micro-bolometer technology is mature enough for the next generation of CMB experiments
•New detector efforts for SPTpol look promising