mid-term review of masibambane iii:april 2007 – september … · mid-term review of masibambane...
TRANSCRIPT


M i d - T e r m R e v i e w o f M a s i b a m b a n e I I I : A p r i l 2 0 0 7 – S e p t e m b e r 2 0 0 8
O v e r v i e w R e p o r t p.1
Figures and Tables 4 Glossary 6 List of contributors 8
1. EXECUTIVE SUMMARY 9 1.1 Reduction in Services Backlogs 9 1.2 Institutional Development and Performance 10
1.2.1 Water Service Authorities (WSAs) 10 1.2.2 Water Service Providers (WSPs) 11 1.2.3 Alternative Financing Mechanisms 11 1.2.4 Catchment Management Agencies (CMAs) 12 1.2.5 Integrated Water Resource Management (IWRM) 12
1.3 Strengthening Sector Collaboration 13 1.4 Cross Cutting Issues 14
1.4.1 Civil Society Organisations (CSOs) 14 1.4.2 Environment 14 1.4.3 Gender 14 1.4.4 HIV and AIDS 15 1.4.5 Appropriate Technology 15
1.5 DWAF’s Sector Leadership 15 1.6 Conclusion 16
2. INTRODUCTION 17 2.1 Background 18
2.1.1 Context 18 2.1.2 Masibambane (MSB) 19
3. METHODS 21 3.1 Limitations 23
4. RESULTS 24 4.1 Reduction in Services Backlogs 26
4.1.1 Relevance 26 4.1.2 Effectiveness 28
4.2 Institutional Development and Performance 32 4.2.1 Relevance 32 4.2.2 Effectiveness 33

M i d - T e r m R e v i e w o f M a s i b a m b a n e I I I : A p r i l 2 0 0 7 – S e p t e m b e r 2 0 0 8
O v e r v i e w R e p o r t p.2
4.3 Enhanced Role of Civil Society Organisations (CSOs) 45 4.3.1 Relevance 45 4.3.2 Effectiveness 46
4.4 Strengthening of Sector Collaboration 50 4.4.1 Relevance 50 4.4.2 Effectiveness 51
4.5 The percentage of WSA’s implementing a Drinking Water Quality Management System (KPI 12.1) 53 4.5.1 Relevance 53 4.5.2 Effectiveness 53
4.6 DWAF reports annually against all 19 target areas outlined in the Strategic Framework for water services (KPI 12.2) 54 4.6.1 Relevance 54 4.6.2 Effectiveness 54
4.7 Cross-cutting Issues 55 4.7.1 Environment 55
4.7.1.1. Relevance 55 4.7.1.2. Effectiveness 56
4.7.2 Gender 56 4.7.2.1. Relevance 56 4.7.2.2. Effectiveness 57
4.7.3 HIV and AIDS 59 4.7.3.1. Relevance 59 4.7.3.2. Effectiveness 60
4.7.4 Appropriate Technology 62 4.7.4.1. Relevance 62 4.7.4.2. Effectiveness 62
4.8 DWAF Sector Leadership 62 4.8.1 Programme Management 62
4.9 Financial Analysis 64 4.9.1 Regional distribution of expenditure 65 4.9.2 Source of funds 66 4.9.3 Expenditure 67 4.9.4 Expenditure against the 8 Result Areas of the MSB III
Financing Agreement 68 4.9.5 Expenditure allocation to cross cutting themes 69
5. DISCUSSION 70 5.1 Stakeholder collaboration is in place and focussed on sustainable
water management for all South Africans (Key Result Area 1) 71 5.2 Catchment management agencies (CMAs) are established and
operational (Key Result Area 2) 72 5.3 Municipalities are proficient in their designated water resource
management and water service roles (Key Result Area 3) 73 5.4 DWAF is a strong, capacitated leader providing policy direction,
regulation and support to the water sector (Key Result Area 4) 74 5.5 Civil society organisations (CSOs) (Key Result Area 5) 75 5.6 Review of alternative financing mechanisms for sustainable
delivery of water services and water resource management (Key Result Area 6) 77

M i d - T e r m R e v i e w o f M a s i b a m b a n e I I I : A p r i l 2 0 0 7 – S e p t e m b e r 2 0 0 8
O v e r v i e w R e p o r t p.3
5.7 Water service providers are operating in an effective and efficient manner, meeting norms and standards (Key Result Area 7) 78
5.8 Sustainable, ecosystem based integrated water resource management (IWRM) is contributing to social development (Key Result Area 8) 80
6. CONCLUSION AND RECOMMENDATIONS 82
7. REFERENCES 88
Appendix A List of Interviewees
Appendix B Methodology

M i d - T e r m R e v i e w o f M a s i b a m b a n e I I I : A p r i l 2 0 0 7 – S e p t e m b e r 2 0 0 8
O v e r v i e w R e p o r t p.4
Figures and Tables
Table 1: Matrix depicting the relationship between MSB III Finance Agreement Result Areas and SFWS KPIs. 22
Table 2: Overall Rating of MSB III, in terms of relevance and effectiveness (where 6 is highly satisfactory and 1 is highly unsatisfactory) 24
Table 3: Components of MSB III that achieved satisfactory progress, with respect to Relevance and Effectiveness 25
Table 4: Components of MSB III that achieved unsatisfactory progress, with respect to Relevance and Effectiveness 25
Table 5: The first five of nineteen strategic goals adopted by South Africa’s water sector in 2003. 26
Table 6: DWAF’s new Backlog Classification for Water Services 26 Table 7: Municipal categories for focused support 27 Table 8: Categories of municipalities and the estimated number of backlogs 27 Table 9: Water delivery as per DWAF 3rd Quarter 2008/2009 Report and 4th Quarter
2006/2007 report. 28 Table 10: Sanitation delivery in South Africa (by DWAF, DPLG, and Dept. of Housing 28 Table 11 South African sanitation backlog estimation. 29 Table 12: Total households served with FBW (Source: DWAF FBS website, 31 March
2009) 31 Table 13: Transfer agreements between DWAF and the receiving institutions 31 Table 14: Transfer progress during the period under review by the MTR 32 Table 15: CMA Establishment Progress 40 Table 16: Source of funds. 66 Table 17: Expenditure Progress by Province. 67 Table 18: Schedule and status of provincial forums held during the fieldwork phase of the
MTR of MSB III 101 Table 19: Scoring system used in the MTR of MSB III 101
Figure 1: Backlogs – Estimate of date for eradication (Source: WSA Survey) 30 Figure 2: Percentage of WSAs who have by-laws, charters, plans and policies in place
(Source: WSA Survey) 36 Figure 3: Number of WSA managers who believe they would be able to source funds for
water infrastructure development in their area from partnerships with different partners (Source: WSA manager). 38
Figure 4: Number of WSA Managers who have participated in the establishment of a CMA (Source: WSA Survey) 40
Figure 5: Main challenges facing CMAs, according to WSA managers (Source: WSA survey) 41
Figure 6: Number of WSA Managers who agree with key IWRM Concepts 42

M i d - T e r m R e v i e w o f M a s i b a m b a n e I I I : A p r i l 2 0 0 7 – S e p t e m b e r 2 0 0 8
O v e r v i e w R e p o r t p.5
Figure 7: Number of WSAs that work with CSOs (Source: WSA survey) 46 Figure 8: What roles do CSO’s perform and how effective, as rated by WSA managers
(Source: WSA Survey). 47 Figure 9: Challenges cited by WSA managers, when asked “What is the one main
challenge your MUNICIPALITY faces when working with CSOs” (Source: WSA Survey) 49
Figure 10: The main benefits that WSA Managers perceive from working with CSOs (Source: WSA Survey) 49
Figure 11: Who attends water sector meetings and how regularly they attend them, as perceived by stakeholders in the Water Sector (Source: Stakeholder Survey). 52
Figure 12: KPIs measured by WSA managers (Source: WSA Survey) 54 Figure 13: Number of WSAs who have programmes that ensure equal opportunities and
access to water resources for women in their municipality (Source: WSA Survey) 58
Figure 14: What done by WSAs to ensure equal access for women (Source: WSA Survey)59 Figure 15: WSAs who have put mechanisms in place to ensure that their municipality has
an HIV and AIDS policy, and the number of WSAs who have received guidance on HIV and AIDS from the Water Sector (Source: WSA Survey) 60
Figure 16: Number of WSAs who have a policy on providing additional water or water closer to homes where those suffering from HIV and AIDS are being cared for (Source: WSA Survey). 61
Figure 17: Rating of DWAF leadership of the sector by stakeholders (Source: Stakeholder Survey) 62
Figure 18: Rating by WSA Managers of DWAF’s leadership and support in terms of how their municipality implements key sector policies and strategies (Source: WSA Survey) 63
Figure 19: Rating by WSA managers of specific support initiatives (Source: WSA Survey) 64 Figure 20: Expenditure division between head office and regional projects 65 Figure 21: Expenditure by province. 66 Figure 22: Sources of funding 67 Figure 23: Expenditure against annual budget. 68 Figure 24: Expenditure per key performance indicator (KPI). 68 Figure 25: Expenditure per cross cutting theme 69 Figure 26: Number of WSAs who responded, by province 99 Figure 27: Number of years WSA manager has been in their current position 99 Figure 28: Number of Stakeholders from provincial forums who completed the
questionnaire 100 Figure 29: Number of years stakeholders had participated in Water Sector forums in the
province 100

M i d - T e r m R e v i e w o f M a s i b a m b a n e I I I : A p r i l 2 0 0 7 – S e p t e m b e r 2 0 0 8
O v e r v i e w R e p o r t p.6
Glossary
AIDS Acquired Immune Deficiency Syndrome
ASGISA Accelerated and Shared Growth Initiative for South Africa
AT Appropriate Technology
BEE Black Economic Empowerment
BP Business Plan
CBG Capacity Building Grant
CBO Community Based Organisation
CCAW Coordinating Committee on Agriculture Water
CIP Consolidated Infrastructure Plan
CMA Catchment Management Agencies
CME Compliance Monitoring and Enforcement
CSO Civil Society Organisations
DBSA Development Bank of South Africa
DDG Deputy Director General
DEAT Department of Environmental Affairs and Tourism
DG Director General
DM District Municipality
DoH Department of Housing
DoRA Division of Revenue Act
DPLG Department of Provincial & Local Government
DWAF Department of Water Affairs and Forestry
DWQ Drinking Water Quality
ES Equitable Share
EU European Union
eWQMS Emanti Water Quality Management System
FA Financing Agreement
FBW Free Basic Water
HIV Human Immune Virus
HO Head Office
IB Irrigation Board
IDP Integrated Development Plan
IGR Inter-governmental Relations
IMC Inter-ministerial Committee
ISRDP Integrated Sustainable Rural Development Programme
IWRM Integrated Water Resource Management
JIPSA Joint Initiative for Priority Skills Acquisition
KFA Key Focal Area
KPA Key Performance Area
KPI Key Performance Indicators
KRA Key Result Area
LED Local Economic Development Plan
LG Local Government
LM Local Municipality
MCC Masibambane Coordinating Committee
MDG Millennium Development Goals
MSIG Municipal Systems Improvement Grant
M&E Monitoring & Evaluation
M,E & R Monitoring & Evaluation and Reporting

M i d - T e r m R e v i e w o f M a s i b a m b a n e I I I : A p r i l 2 0 0 7 – S e p t e m b e r 2 0 0 8
O v e r v i e w R e p o r t p.7
MIG Municipal Infrastructure Grant
MSB Masibambane
MTR Mid-term Review
MTSF Medium Term Strategic Framework
NEPAD New Partnership for Africa’s Development
NGO Non-government Organisation
NIEMS National Educational Infrastructure Management System
NWRS National Water Resource Strategy
NWSP National Water Sector Programme
O&M Operation and Maintenance
PDI Previously Disadvantaged Individuals
PEP Project Execution Plan
PFMA Public Financial Management Act
PGDP Provincial Growth and Development Plan
PGDS Provincial Growth and Development Strategy
PLWHA People Living with HIV and AIDS
PMU Programme Management Unit
PPP Public Private Partnerships
PSP Professional Service Provider
PWSP Provincial Water Sector Plans
RDP Reconstruction & Development Programme
RPF Resource Poor Farmers
RPMS Regulatory Performance Management System
SAAWU South African Association of Water Utilities
SADC Southern African Development Community
SALGA South African Local Government Association
SANGOCO South African National NGO Coalition
SIP Special Intervention Programme
SWAP Sector Wide Approach
SFWS Strategic Framework for Water Services
TA Technical Assistance
TISPP Target Implementation Support Programme Plan
TOR Terms of Reference
WAR Water Allocation Reform
WASH Water, Sanitation and Hygiene
WC/DM Water Conservation / Demand Management
WfG&D Water for Growth and Development
WIN-SA Water Information Network of South Africa
WMI Water Management Institution
WMIG Water Management Institutions Governance
WRC Water Research Commission
WRM Water Resource Management
WSA Water Services Authority
WSLG Water Services Sector Leadership Group
WSDP Water Services Development Plan
WSRPMS Water Services Regulatory Performance Management System
WSP Water Service Provider
WSSD Water Services Sector Development
WSSSP Water Services Sector Support Programme
WUA Water User Association

M i d - T e r m R e v i e w o f M a s i b a m b a n e I I I : A p r i l 2 0 0 7 – S e p t e m b e r 2 0 0 8
O v e r v i e w R e p o r t p.8
List of contributors
▪ Matthew Smith
▪ Phillip Ravenscroft
▪ Julia Cain
▪ Gugu Masibuko
▪ Nobayethi Dube
▪ Nicky McLeod
▪ Jonathan Dennison
▪ Thandile Ntshwanti
▪ Dave Still
▪ Siyabulela Manono
▪ Jim Gibson
▪ Ross Jennings
▪ Sharon Snyman
▪ Magdel van der Merwe

M i d - T e r m R e v i e w o f M a s i b a m b a n e I I I : A p r i l 2 0 0 7 – S e p t e m b e r 2 0 0 8
O v e r v i e w R e p o r t p.9
1. Executive Summary As agreed in the Financing Agreement (FA) between the European Union (EU) and the Government of South Africa, a mid-term review (MTR) of the third term of the Masibambane programme (MSB III), themed Water for Growth and Development (WfG&D), was undertaken to assess relevance and effectiveness and efficiency, and to determine whether the EU support should be redirected. The MTR covered activities from April 2007 to end September 2008. The overall objective of the MTR was to assess the progress of MSB III against the key result areas of the financing agreement, and to make recommendations for improvement. Using a mixed methods approach, the MTR conducted two telephonic surveys (reaching 78% of the WSAs and 100 provincial forum stakeholders); interviewed nearly a 100 roleplayers from the sector; observed three provincial forums; and comprehensively reviewed relevant programme documentation during the six weeks made available for fieldwork. As specified in the Terms of Reference (ToR), the Review Team focused on the issues of Relevance and Effectiveness. With regards to relevance the Team examined the extent to which the objectives of MSB III are consistent with beneficiaries’ requirements, country needs, and institutional priorities. With respect to effectiveness, the team explored to what extent the planned objectives, results and activities of MSB III are being achieved. The findings of the Review Team signify that the issue for the remainder of MSB III is not one of redirection (as asked in the ToR) but rather one of re-energising the programme. The Team found that the roadmap that MSB III developed at the onset of the programme (including the EU Financing Agreement) clearly identifies the relevant issues that need to be
addressed and the manner in which these key result areas should be addressed. In general the programme is very relevant to the needs of the sector and there are excellent plans, policies and guidelines in place. However, in some areas, progress with implementation has lagged behind and thus the programme does not score as well on effectiveness. 1.1 Reduction in Services Backlogs
Excellent progress has been made with Key Performance Indicators (KPIs) 3, 4 and 5 (water service provision), and steady progress continues to be made with KPIs 1 and 2 (sanitation service provision). Progress with respect to Free Basic Water (FBW) remains impressive. In the period the MTR examined, only four WSAs out of a national total of 169 were still not serving free basic water to any of their population. In the period under review, this equated to 85.46% (increasing to 85.62% by March 2009) of households in South Africa receiving FBW. Of the targeted poor households, by September 2008 74.91% received FBW (increasing to 85.87% by March 2009). Although steady progress is being made in the area of backlog reduction, the main performance indicator used in this area is the level and rate of the spending of the MIG grant. Not enough attention is given to the efficiency and effectiveness with which the grant is spent, and not enough attention is given to ensuring that completed projects are maintained and continue to meet their intended purposes. However, Government has recognised that the service backlog cannot be looked at by taking one service in isolation, and that the whole backlog of services, including water, sanitation, refuse removal, electricity and housing, needs to be addressed as an integrated package. To address this, new realistic targets have been set

M i d - T e r m R e v i e w o f M a s i b a m b a n e I I I : A p r i l 2 0 0 7 – S e p t e m b e r 2 0 0 8
O v e r v i e w R e p o r t p.10
for the eradication of the services backlog by 2014. A Water Targets Implementation Support Programme Plan (Water TISPP) has been drafted to co-ordinate the department’s efforts to help municipalities to achieve this new target. The plan recognizes that the term “backlog” is too simplistic, and provides for classification into sub-categories (i.e. those with no infrastructure, vs those with infrastructure which is inadequate in various ways). It also classifies municipalities according to how far they are from meeting their backlog targets, and how much support they need. This therefore enables the sector to prioritise the needs of different households to ensure a far more targeted and holistic response than has previously been achieved. Progress with the transfer of DWAF-owned assets to WSAs and Water Boards, together with the staff associated with those assets, has been measured against a functional assessment completed in 2002. Transfer agreements between DWAF and the receiving institutions are almost complete and only the final stages are outstanding on the last three agreements. Overall progress is estimated at 98% and 95% of the agreements are in place and signed by all parties. Concluding the transfer of these staff has been identified as a major challenge and the participation of the sector partners including SALGA will be critical in its resolution.
Main Recommendation: DWAF’s Regulatory Performance Management System (RPMS) should be fully implemented across all Water Services Authorities. Once this is done, it can be used to ensure that funding for new infrastructure is used more efficiently and effectively. Since the end of MSB II, the sector has redirected much of its attention towards addressing the sustainability of water services and has thus brought much needed focus on to operations and maintenance (O&M). This has been done through programmes and support for municipalities in the operation and maintenance of water and sanitation services. These initiatives (e.g. monitoring drinking water quality; asset management; water services regulation; and much of the WSP and WSA support) are critical interventions that are
required to address the needs of the largest challenge facing the sector - the capacity for operating and maintaining municipal services. However the challenge remains a massive one that will continue to need resources and support for the foreseeable future.
Main Recommendation: The agenda of O&M must be continuously pushed and there must be strong and focused follow-through on the O&M foundations that have now been put into place. 1.2 Institutional Development and
Performance
1.2.1 Water Service Authorities (WSAs)
Reporting by Water Service Authorities (WSAs) continues to improve, albeit that reporting against WSDPs remains low. Nevertheless, against Consolidated Infrastructure Plans (CIPs), the number of WSAs complying with reporting continues to gradually improve. Furthermore, it should be noted that WSDP reporting has been enhanced to include additional information that was not included previously e.g. reporting on water services audit information. This information is passed on to the regulator to feed into DWAF’s Regulation Performance Management System (RPMS). In instances where Water Service Provider (WSP) arrangements are in place, there has been improvement according to the WSA Checklist Assessment Reports. As at the end of March 2007, the results of the WSA Checklist Assessment pertaining to WSA/WSP functionality, reported that of the WSAs that responded, 65 (i.e. 41%) WSAs had service delivery agreements in place to monitor and regulate WSPs and 85 WSAs (53%) had performance management contracts in place with senior WSP managers. According to the interviews conducted as part of this review, there is general consensus that municipalities are improving in terms of the implementation of prioritised projects. The indication is that most of the projects get implemented through the Municipal

M i d - T e r m R e v i e w o f M a s i b a m b a n e I I I : A p r i l 2 0 0 7 – S e p t e m b e r 2 0 0 8
O v e r v i e w R e p o r t p.11
Infrastructure Grant (MIG) programme (it is estimated that 65% of the WSDP projects are implemented through MIG funding).
Main Recommendation: DWAF, in its role as Regulator, must ensure that WSAs continue to be supported so that they adhere to prescribed norms and standards. 1.2.2 Water Service Providers (WSPs)
Developing Water Service Provider (WSP) capacity is a serious challenge with which the sector is now actively engaging. This is being led by the Directorate Water Services Sector Development (WSSD) as part of the implementation of the National Joint Water Services Sector Support Strategy through the WSP Support Project Execution Plan (PEP). The WSP PEP is focused at the operational level of WSPs and is intended to take policy to practice. A pilot programme at four sites has been completed and the lessons learned are feeding into the final WSP Support Implementation Plan. This plan is to be operationalised at the 4 pilot sites in the financial year 2009/10 and then mainstreamed and rolled out at a national level from 2010/11. The KPIs for Enhanced WSP Capacity under the MSB III agreement (viz. WSP business plans; consumer charters; asset management systems; tariff policies and consumer-friendly billing) still need to be specifically incorporated into the WSP Support Implementation Plan in some cases. The rollout of this plan is critical for various areas. Importantly, bearing in mind the sector’s concerns around drinking water quality (DWQ), DWQ has been identified as one of the top 3 KPAs in the WSP Support Implementation Plan. If effectively implemented, it could be instrumental in improving the management of drinking water quality, as well as in improving operations and maintenance overall. This will also involve investigating the causes of the problems associated with DWQ and the training needs that will be required to ensure staff have sufficient skills in those plants that are performing poorly.
Coordination of this WSP support across the sector players can be expected to be a key challenge. Even more critical will be the allocation of substantial funds to support the implementation of this programme at WSP level.
Main Recommendation: There must be strong and focused follow-through on the WSP Support Implementation Plan. This is critical for developing fully functional WSPs that can effectively meet their responsibilities. Capable WSPs are essential for the development of sustainable water services. The national roll-out of the WSP Support programme is a real priority that must receive adequate support and financial resources. 1.2.3 Alternative Financing Mechanisms
Exploring alternative financing mechanisms remains a challenge for many municipalities, and at the national level progress remains slow. However, various potential models are being explored. For instance, the DBSA is making available funding which will specifically target the turnaround of non-revenue water in municipalities. Moreover, the Department of Provincial and Local Government (DPLG) reports that it has allocated R30m of Masibambane funds to a programme that provides technical assistance and training to municipalities to help inter alia in accessing loan funding or to secure a credit rating. This has been piloted in 7 municipalities. It is also important to note that the DBSA and the commercial banks do regularly lend to municipalities. A component of this is for water and sanitation infrastructure. The sector as a whole is still heavily dependent on MIG grants to finance new infrastructure. Given the free basic water policy, this will not change in the foreseeable future. However, there needs to be some kind of feedback loop in the system that ensures that WSAs who are poor performers in terms of reporting requirements and operations and maintenance requirements, receive funding for new infrastructure at a reduced rate until they have put their house in order.

M i d - T e r m R e v i e w o f M a s i b a m b a n e I I I : A p r i l 2 0 0 7 – S e p t e m b e r 2 0 0 8
O v e r v i e w R e p o r t p.12
Main Recommendation: A feedback loop needs to be created to ensure that poorly performing WSAs and strongly performing WSAs are not treated equally when it comes to the disbursing of grants for new water and sanitation infrastructure. 1.2.4 Catchment Management Agencies
(CMAs)
The achievements with regards the establishment of 19 Catchment Management Agencies (CMAs) provides a mixed bag of results. Two fully-fledged CMAs have been established while many others are at various stages of establishment. The established CMAs, Breede and Inkomati, each have a Governing Board and a CEO in place. The other 17 CMAs range from being at proposal development stage to advisory committee process stage. A major reason for the delays is that DWAF is in an institutional re-alignment process that includes CMA establishment assessment. Therefore the CMA establishment process is on hold as the institutional re-alignment process could affect the number of CMAs to be established. However the re-alignment process is being finalized. The CMA establishment process will continue after the realignment process, based on a consideration of the proposals from the re-alignment process. Concern was raised that within DWAF there is not unanimous support of CMA establishment, yet CMA establishment is part of DWAF policy and is provided for by the Act as well as the National Water Resource Strategy (NWRS). Any changes around CMAs will require new policy direction.
Main Recommendation: A clear internal message that confirms CMAs as a sound policy direction and confirms that they will be established is required. Support mechanisms and funded programmes that will support the establishment of the CMAs will then need to be put into place. 1.2.5 Integrated Water Resource
Management (IWRM)
Progress continues to be seen in terms of Integrated Water Resource Management
(IRWM), however not in all areas. Water Allocation Reform (WAR) has been substantially ineffective to date in achieving its primary objectives. In terms of Compulsory Licensing there has been significant investment and technical preparation in pilot catchments (Jan Dissels, Umhlatuze and Nkomati) in preparation for Compulsory Licensing. However, with regards to Routine Licensing (Section 17 licensing compliance) there has been marked success only in the Western Cape where DWAF has been proactive in prompting and supporting the BEE element in new license applications and has actively integrated this with funding and departmental support from the Land Reform Process and the Department of Agriculture. The experience in other provinces has not been as positive in terms of new licenses issued which comply with Section 17. Nevertheless, interviews with a range of regional and national DWAF staff showed that Water Conservation and Demand Management Strategies (WC/DM) as a working principle, is on the routine working agendas of both the WSAs and DWAF regions and there is a sense that the national strategies for WC/DM that are in place are appreciated. WC/DM is considered important and is, in the view of the MTR team, effectively internalized by DWAF regional staff as a priority issue. However, what is now needed is to ensure that this knowledge is shared with those working on the ground to ensure that the principles of WC/DM underpin their work. Importantly the strategy has been developed to ensure compliance monitoring and enforcement of legislation and license conditions and this component of the scorecard has been largely achieved and scores well. Compliance Monitoring and Evaluation (CME) has been driven enthusiastically and has full support from the regions for regional expansion. However national coverage is thin, with limited funding available and with low numbers of dedicated CME personnel. Good progress has also been achieved with respect to the transformation of irrigation

M i d - T e r m R e v i e w o f M a s i b a m b a n e I I I : A p r i l 2 0 0 7 – S e p t e m b e r 2 0 0 8
O v e r v i e w R e p o r t p.13
boards (IBs). To date 46 Irrigation Boards have been transformed into Water User Associations (WUAs) across the 9 provinces and a further 34 have been established. Furthermore, DWAF has shouldered wider responsibilities in implementing the Resource Poor Farmers’ (RPF) subsidy and this leadership has clearly resulted in relative success of the RPF programme and DWAF has certainly demonstrated strong leadership in this area.
Main Recommendation: Policy direction in terms of Water Allocation Reform (WAR) implementation via Compulsory Licensing needs to be provided and followed with an implementation strategy. 1.3 Strengthening Sector
Collaboration
The MSB programme scores well in its efforts to ensure that sustainable collaborative structures are in place and are supported by regular, inclusive strategic planning processes. Eight out of the nine water sector forums have been reconfigured in line with the Intergovernmental Relations Act. However, participation by sector partners in the regional forums varies, and is an issue that requires attention in almost all regions. Nevertheless the flexible/responsive nature of collaboration allows the sector to respond immediately to crises, e.g. the manner in which sector players in the effected provinces worked together to address the cholera epidemic. Moreover, Provincial Water Sector Plans (PWSPs) are in place in all nine regions and at different stages of review. In regions where forums are not fully functional PWSPs are done by DWAF through direct consultation with sector players on a one-on-one basis. In terms of the National Water Sector Plan, the plan is in place and was developed with the involvement of national water sector partners. A key feature of sector collaboration is the knowledge sharing that occurs at all different levels within the sector. Research within the sector has in fact shown that lesson sharing had become a major reason for collaboration by
sector roleplayers. This occurs not only formally through the different forums, but also through the comprehensive collection, management and distribution of relevant data in innovative and interactive ways by WIN-SA. Challenges nevertheless remain, as those within MSB must try to ensure that knowledge sharing also reaches ground level, particularly at local municipality level. The participation of DWAF in SADC and other bilateral country-to-country technical committees is negatively impacted by the general problem of a shortage and continued loss of technical expertise within DWAF. However, as part of South Africa’s contribution to the SADC agenda - regional integration and economic growth – the sector assists the regional technical skills support programme. Lesson learning and sharing (documentation of regional experiences) is a significant element of the collaboration both within the sector and across the region (significantly assisted by WIN-SA in this regard).
Main Recommendation: The process of reconfiguration of both national and regional collaboration structures should be speeded up, with emphasis on putting in place implementation protocols (collaboration agreements) as a way of managing relationships with sector partners. This process should focus on clarification of the relationship of formal Inter-governmental Relations (IGR) structures within the water sector as well as informal forums in order to enhance the quality of collaboration in the regions. The Monitoring, Evaluation and Reporting (M,E,&R) framework is largely appropriate to ensuring the reporting needs of the sector. With respect to reporting requirements, DWAF’s Water Services Regulatory Performance Management System (WSRPMS) tracks 11 KPIs, including DWQ. Thus for instance, in October 2008, it was recorded that 3,538 sites were monitored for DWQ nationally: 236 sites were non-compliant and posed health related DWQ threats (Quarterly Report: Consolidated report Oct – Dec 2008). Moreover, in line with its mandate, DWAF does report annually against all

M i d - T e r m R e v i e w o f M a s i b a m b a n e I I I : A p r i l 2 0 0 7 – S e p t e m b e r 2 0 0 8
O v e r v i e w R e p o r t p.14
19 target areas outlined in the Strategic Framework for Water Services. However, concern remains about the availability, accuracy and timeliness of the data provided by sector partners to DWAF. Whilst steps are being taken to address the alignment of data, it is essential that for the remainder of MSB III the M, E & R unit is strengthened to allow it to fulfil its vital role.
Main Recommendation: Strengthen efforts to improve and streamline Municipal Reporting through the RPMS and through the Annual WSDP Reports as required by legislation. 1.4 Cross Cutting Issues
1.4.1 Civil Society Organisations (CSOs)
With regards to Civil Society Organisations (CSOs), the programme witnessed a number of achievements, including appointing an implementing agent to drive and coordinate the CSO capacity building programme. Moreover, the five-year business plan for CSOs was finalised through engagements with CSOs such as the Water Caucus and Mvula Trust and a CSO advocacy strategy has been developed. CSO capacity building has also happened in a number of provinces including the Free State, Limpopo and Gauteng. However, whilst there is notable progress, the involvement of CSOs in local government is still limited. Also the CSO sector is still represented by the same small number of CSOs and an attempt to involve new organizations must be made. The perception of CSOs is still poor within local government. Moreover, there are still barriers to the entry of CSOs into service provision due to excessively cumbersome and demanding contractual procedures by local municipalities. The legislative framework is presently not conducive for CSOs to contribute to sustainable service provision within the local municipalities. Procurement policies need to be looked at to consider the options for making them more accessible to CSOs.
Main Recommendation: The challenge to CSO sustainability within the sector needs to be looked at, in particular the role the sector can play in lobbying for financial support for CSOs. 1.4.2 Environment
The sector has excellent strategic frameworks and environmental management toolkits, but still no accepted strategy for mainstreaming environment within MSB III itself. A concise “Draft Strategic Framework for Mainstreaming Environmental Manage-ment” (March 2008) was funded through the MSB III programme, but has not been adopted. Moreover, related activities, although not officially listed as environmental management activities under the MSB III budget, have under-spent across the board (e.g. sanitation awareness programmes). However, The WfG&D framework and increased profile of the Compliance Monitoring and Enforcement (CME) unit are good catalysts here, and require underpinning through increased public awareness and action.
Main Recommendation: Institutionalize environmental management, within and beyond the Masibambane programme, by activating the good policy level intent through Cabinet approval of the WfG&D framework and its sustainability principles. 1.4.3 Gender
There has been little progress made in mainstreaming gender across the sector. The gender mainstreaming framework needs to be reviewed to take into account issues of integrated water resources management as well as WfG&D approach. A gender mainstreaming champion needs to be identified, to ensure that the agenda for gender gathers momentum.
Main Recommendation: Review current strategy to interface with issues of water resources management as well as principles of WfG&D and in so doing set reliable targets, implement gender specific projects on the ground and monitor for the remainder of the programme.

M i d - T e r m R e v i e w o f M a s i b a m b a n e I I I : A p r i l 2 0 0 7 – S e p t e m b e r 2 0 0 8
O v e r v i e w R e p o r t p.15
1.4.4 HIV and AIDS
A comprehensive strategy has been developed, the Strategic Framework for Mainstreaming HIV and AIDS in the Water Sector, which covers important areas in the water sector. The challenge will obviously be to ensure that rollout is effective and that the entire sector mainstreams HIV and AIDS into their core activities. Pockets of best practice in this regard can already be found throughout the sector.
Main Recommendation: Clarify roles and responsibilities within the sector to ensure roll-out and implementation by all sector partners of the strategy. 1.4.5 Appropriate Technology
The need to consider appropriate technology solutions in the drive to supply water services to all in South Africa is identified in the Strategic Framework for Water Services and is generally acknowledged within the sector; it is also identified as a key outcome from the 2008 Municipal Indaba. The draft strategy document must still be reviewed and adopted by the sector urgently. While very little implementation took place during the reporting period, since then progress has been made in appointing a champion to drive the mainstreaming of Appropriate Technology and a draft strategy has been produced to guide implementation. Moreover, practical learning workshops, like the one held in Limpopo in March, provide a direct learning experience between experience and need and should be repeated in other areas.
Main Recommendation: For further progress to be made during MSB III, DWAF must urgently initiate a process of sector consultation, review and adoption of the strategy. The top priority activities within the strategy must be identified based on what will have the greatest impact in achieving the goal, and implementation of these activities must commence as soon as possible. 1.5 DWAF’s Sector Leadership
The leadership that DWAF has played in promoting Water for Growth and Development (WfGD) has been viewed as a
success by the vast majority of stakeholders interviewed by the Review Team, particularly in ensuring that the sector has moved from looking at water and sanitation services to viewing water far more holistically. In 2008 (i.e. during the period under review), the Inter-Ministerial Committee (IMC) chaired by the then Deputy President, Ms Phumzile Mlambo-Ngcuka, raised a number of issues regarding actions that needed to be taken to avoid a potential crisis in the water sector. DWAF responded to the IMC with its Water Sector Immediate Challenges Response document, a nuanced and comprehensive acknowledgement of the challenges facing the sector. Essentially the challenges related to the ability of government and its partners to continue to provide adequate water for economic development and human well-being and to protect the natural water resource environment. The need to address key challenges facing the water sector in South Africa, as outlined in the Water Sector Immediate Challenges Response document, required DWAF to rethink its approach to the Masibambane programme. As a result there has been a conscious move to focus on key priorities that would address the challenges identified in the Water Sector Immediate Challenges Response document. There was also a realization within DWAF that its regulatory mandate had not been receiving the priority it deserved and the decision was therefore made to focus on strengthening this function. The above-mentioned factors contributed to DWAF’s DG implementing the following:
▪ Making hands-on decisions regarding the management arrangements for MSB III, especially the allocation of funding;
▪ Identifying and aligning priorities throughout DWAF and thus allocating funds accordingly;
▪ Refocusing the department on the development and implementation of the WfG&D strategy;
▪ Strengthening DWAF’s regulatory function at local government level;
▪ Guiding the development of an exit strategy and simultaneously making a request to

M i d - T e r m R e v i e w o f M a s i b a m b a n e I I I : A p r i l 2 0 0 7 – S e p t e m b e r 2 0 0 8
O v e r v i e w R e p o r t p.16
National Treasury to provide funding for DWAF’s core functions that are currently funded by Masibambane.
However, there is also a realization within DWAF that to ensure that MSB continues to be seen as a valuable asset, it requires a Champion to resurrect the programme, provide strategic leadership, and ensure that the planned activities get done. Such a Champion should also remind the sector of the enormous success that the sector has achieved in the longest running, and arguably, most successful sector–wide programme in South Africa. Moreover, the enormous success that MSB has achieved in ensuring that the sector collaborates is not only an impressive achievement, but is also vital for ensuring the success of WfG&D. For WfG&D to succeed the sector leadership needs to ensure collaboration not only between different sections within DWAF (the link between water services and water resources is an obvious example), but also between all the key stakeholders who work within the sector. (Note: The Water for Growth and Development Framework received endorsement from Cabinet in January, 2009 and it is in its final stage of consultation before it is submitted to Cabinet in August 2009). By doing this it will ensure that MSB adds value by sharing the hard lessons learnt about effective sector collaboration and about its extraordinary success as a way of working. It will also ensure the correct positioning of MSB to allow it to facilitate the implementation of the strategy by driving the process through the collaborative structures it has diligently built at all levels (including local, provincial and national).
Main Recommendation: The true value of MSB needs to be restated and recognised in order to position it correctly so that it can effectively facilitate the implementation of WfG&D. 1.6 Conclusion
Masibambane is now in its third phase under the theme of Water for Growth and Development. The programme remains both relevant and critical to the development of
South Africa; its objectives are directly in line with the government’s strategic focus as articulated in the previous Medium Term Strategic Framework (MTSF) and the Accelerated and Shared Growth Initiative of South Africa (ASGISA). There is no doubt that, even with the new MTSF objectives, and the likely shift in priorities under the newly elected President, the fact that MSB continues to facilitate and promote integration between Water Service provision and Water Resource Management in the sector must continue. Moreover, President Zuma’s stated desire to usher in a new political dispensation that will lead to the restructuring of government and also introduce new bodies (e.g. Planning Commission and Government M&E unit in the presidency; Human Settlements; Rural Development; Gender; etc.), not to mention the integration of water and the environment into the Department of Water and Environmental Affairs, resonate powerfully with the objectives of Water for Growth and Development. The management of MSB must therefore seize the moment and take the opportunity that the new President has provided to restate and ensure broad recognition of the inherent value of MSB, and thereby position MSB appropriately to underpin and strengthen WfG&D. The Review Team noted that the ToR for the MTR asked the Team to consider whether, if necessary, MSB III needed to be redirected. In response, the Team would argue that it is not so much a question of redirection but rather one of re-energising the programme. The roadmap that MSB III developed at the onset of the programme (including the EU Financing Agreement) clearly identifies the relevant issues that need to be addressed and the manner in which these key result areas should be addressed. The challenge remains in ensuring greater efficiency and effectiveness at implementation. It is also critical that a comprehensive exit strategy is prepared to ensure that MSB remains sustainable, and implements what is planned after the EU funding comes to an end in 2011.

M i d - T e r m R e v i e w o f M a s i b a m b a n e I I I : A p r i l 2 0 0 7 – S e p t e m b e r 2 0 0 8
O v e r v i e w R e p o r t p.17
2. Introduction
The Mid-Term Review of Masibambane III (MTR MSB III) is presented in this the Overview Report. However, it should be noted that in addition to the Overview Report 15 background papers were also produced which helped shape the views expressed in this report (these papers can be found as a separate collection on the CD that accompanies the Overview Report). As agreed in the Financing Agreement between the European Union (EU) and the Government of South Africa, a mid-term evaluation of the third term of the Masibambane programme, themed Water for Growth and Development (WfG&D), was undertaken to assess relevance and effectiveness and efficiency, and to determine whether the EU support should be redirected. The MTR covered activities from April 2007 to end September 2008, this being the effective mid-term period of the three-year “operational implementation phase” of the MSB support programme. The overall objective of the Review was to assess the progress of the Masibambane III programme against the key result areas of the financing agreement, and to make recommendations for improvement. In order to do this the Terms of Reference specified that the following aspects of MSB III should be assessed:
▪ The effectiveness of stakeholder collaboration & coordination and the SWAP approach on sustainable water management for all South Africans;
▪ The transformation and institutional arrangements around the establishment and operationalisation of catchment management agencies;
▪ The extent to which institutional capacity building of municipalities has been successful in ensuring proficiency in their designated water resource management and water services roles;
▪ The DWAF’s leadership capacity in providing policy direction, regulation and support to the water sector;
▪ The participation of civil society organisations in providing training and support to, and advocacy in, the water sector;
▪ Progress, by DWAF as the sector leader, in identifying alternative financing mechanisms for sustainable delivery of water services and water resource management;
▪ The operating effectiveness and efficiency of Water Service Providers (WSPs), with regard to meeting norms and standards;
▪ The extent to which sustainable, ecosystem based IWRM contributes to social development (policy, strategy, implementation plan);
▪ The institutionalisation of Masibambane (its approach, objectives and modus operandi) and the effectiveness and strategic impact of Masibambane (as a whole). To what extent the Masibambane programme results have been entrenched on a sustainable basis;
▪ The achievement of outputs and progress in meeting strategic objectives as outlined in the Strategic Framework for Water Services, including the extent to which cross cutting issues have been considered;
▪ The water sector strategy and appropriateness of the changes made, in order to make recommendations for future implementation of the programme;
▪ The situation with regard to the support from the Municipal Infrastructure Grant (MIG) and Capacity-Building Grant (CBG) to the water sector and to recommend actions for re-orientation of the Masibambane programme procedures, if required.

M i d - T e r m R e v i e w o f M a s i b a m b a n e I I I : A p r i l 2 0 0 7 – S e p t e m b e r 2 0 0 8
O v e r v i e w R e p o r t p.18
2.1 Background
2.1.1 Context
The government, through the Accelerated and Shared Growth Initiative of South Africa (ASGISA), is promoting a strategy for growth and development in which water resources management is a significant contributor. Water for Growth and Development (WfGD) means that water and related services are part of the equation of economic, social and environmental development. However, South Africa is water scarce, with far lower rainfall than most other countries in the world, and the threat of climate change will bring additional challenges to the management of this scarce resource (DWAF Report to ASGISA, June 2008). Thus it is essential that all growth and development strategies at all levels – national, provincial and local – must be based on realistic assessment of water availability. Moreover, the investment in the water sector across all spheres of government is well below what it should be. If South Africa is to maintain and provide reliable water services that support economic growth and social development, this investment will have to increase substantially. Current investment is in the order to 1.2% of GDP whereas a benchmark level for water resources and water services investment in a country of the economic status of South Africa should be in the region of 2-3%. (DWAF Report to ASGISA, June 2008). The economic, social and environmental benefits of improved water supply and sanitation and water resource are, therefore, essential ingredients of national decision-making for the economic development of South Africa. Central to this strategy is the need not only to ensure that the water services backlog is being reduced to ensure that every South African has access to clean drinking water and adequate sanitation, but that sustainability will only be ensured if water services and water resource management are integrated. The Strategic Framework for Water Services (SFWS), which was approved by Cabinet in September 2003, is the primary policy document for the water services sector in South Africa. It was prepared after extensive consultation with all stakeholders in the water services sector and sets out a comprehensive approach with respect to the provision of water services, ranging from small community water supply and sanitation schemes to large regional schemes supplying water and wastewater services to people and industries in the largest urban areas. The SFWS defines the goals for the water services sector, which includes the following:
▪ All people living in South Africa have access to an appropriate, acceptable, safe and affordable basic water supply and sanitation service;
▪ All people living in South Africa are educated in healthy living practices (specifically with respect to the use of water and sanitation services) and the wise use of water;
▪ Water and sanitation services are effectively regulated with a view to ensuring the ongoing achievement of these goals.
The National Water Resource Strategy (NWRS) provides the framework for the protection, use, development, conservation, management and control of water resources for the country as whole. It is binding on any institution that is exercising powers or performing duties in the sector. As such, the DWAF must give effect to Water Resource Management in ways that take into account, amongst other factors, the following:
▪ Meeting the basic human needs of present and future generations;

M i d - T e r m R e v i e w o f M a s i b a m b a n e I I I : A p r i l 2 0 0 7 – S e p t e m b e r 2 0 0 8
O v e r v i e w R e p o r t p.19
▪ Promoting equitable access to water; ▪ Redressing the results of past racial and gender discrimination; ▪ Promoting the efficient, sustainable and beneficial use of water in the public interest; ▪ Facilitating social and economic development; ▪ Providing for the growing demand for water; ▪ Protecting aquatic and associated ecosystems and their biological diversity; ▪ Reducing and preventing pollution and degradation of water resources; ▪ Meeting international obligations; ▪ Promoting dam safety; ▪ Managing floods and droughts; ▪ Establishing suitable institutions.
The creation of the Water for Growth and Development (WfG&D) strategy under the leadership of the Minister of Water Affairs and Forestry has ensured that the water sector has an appropriate framework in order to begin to meet development targets embedded within both ASGISA and the Joint Initiative for Priority Skills Acquisition (JIPSA). WfG&D is also the key focus of the MSB III Sector Support Programme for the period 2007/08 to 2011/12 and thus the vision for the programme is to develop a “robust and accountable water sector, which successfully meets demands for water security and reliable and effective water services, and enables equitable, environmentally sustainable economic growth and social development in South Africa”.
2.1.2 Masibambane (MSB)
Masibambane is now in its third phase, and is arguably South Africa’s largest and most successful sector wide programme (SWAP). During Phase I (2001–2004) the key deliverable of the Masibambane Programme was the Strategic Framework for Water Services (SFWS) that was approved by Cabinet in September 2003. This document was created through the active participation of all parties in the water services sector who set the targets they needed to achieve. During Phase II of the Masibambane Programme (2004–2007), the DWAF was established as the sector leader, and the sector delivered on the targets that they had set. In addition, the sector defined the interface between sub-components in the sector, namely water resources and water services, while also executing the ground work on the Water for Growth and Development (WfG&D) concept. Previous evaluations (see the Summative Evaluation of MSB II for instance) have praised the programme for promoting sector collaboration and establishing collaborative structures at all levels within government, initially to promote water and sanitation services, but also more recently to promote water resource management. Ostensibly, through the third phase of Masibambane (2007 – 2010), the DWAF will gradually relinquish its role of service provision to local government and focus more on determining sector policy; supporting local government with service provision; monitoring the performance of new water supply institutions; and, most importantly, regulating the sector. The Strategic Framework for Water Services assigns to the DWAF the key roles (amongst others) in the water services sector as policy maker, overall sector leader, regulator and supporter. MSB III complements the strategic direction of DWAF by ensuring that water and related services are part of the overall equation of a sustainable economy and of social and environmental integration and development. This will lead to effective, efficient and sustainable institutions that are accountable and responsive to those whom they serve.

M i d - T e r m R e v i e w o f M a s i b a m b a n e I I I : A p r i l 2 0 0 7 – S e p t e m b e r 2 0 0 8
O v e r v i e w R e p o r t p.20
DWAF continues to be responsible for the overall organisation and implementation of the Masibambane III programme using the machinery and procedures set up and developed during the initial two periods of the programme. DWAF works closely with other stakeholders, particularly with DPLG and SALGA at national level; with the provincial Departments for Local Government and Housing; with the municipalities; and with CSO’s at provincial and local level. Particularly close collaboration is demanded regarding establishing and clarifying the machinery and procedures that will govern the operation of the water sector at local government level. The Water Sector Leadership Group gives strategic guidance to the programme and to the Masibambane Co-ordinating Committee responsible for steering the programme. At provincial level, the Masibambane Programme is implemented within the framework of multi-annual action plans developed in collaboration with other stakeholders and consistent with relevant provincial development strategies The EU Financing Agreement outlines eight main key result areas (KRAs) to which the MSB III programme is expected to contribute (and which thus determine the main focus areas of this mid-term review). These consist of the following:
1) Stakeholder collaboration; 2) Catchment management agencies; 3) Capacity building of municipalities; 4) DWAF is a strong, capacitated leader providing policy direction, regulation and support
to the water sector; 5) Civil society organisations (CSOs); 6) Alternative financing mechanisms; 7) Water service providers; 8) Sustainable, ecosystem-based integrated water resource management.
In order to achieve this, MSB III is co-financed by the South African Government and EU co-operation programmes. The United Kingdom, Ireland and Flemmish co-operation programmes provide parallel funding. The EU contribution to the WfG&D is 107million Euros for MSB III, in the form of a direct contribution to the South African government budget.

M i d - T e r m R e v i e w o f M a s i b a m b a n e I I I : A p r i l 2 0 0 7 – S e p t e m b e r 2 0 0 8
O v e r v i e w R e p o r t p.21
3. Methods1 The Mid-term Review was conducted within an extremely tight timeframe. The Inception Report was submitted on 6 February, and all fieldwork was completed on 31 March in order that this Draft Report could be submitted on 21 April 2009. A multi-method approach2 was used for the Mid-term Review, focusing specifically on two key issues, namely:
▪ Relevance: i.e. the extent to which the objectives of MSB III are consistent with beneficiaries’ requirements, country needs, institutional priorities. It also entails an assessment of project coherence in achieving its objectives. i.e. how relevant is what MSB III doing in this area to SA’s needs? And how relevant are the activities being performed in this area to what was intended under MSB III?
▪ Effectiveness: i.e. are the planned objectives, results and activities of MSB III being achieved? If yes, how is this being achieved? If no, what are the challenges preventing this? Do those problems still exist, and how can they be overcome during the second half of MSB III?
Where applicable, and relevant data was available, the issue of Efficiency was also assessed, i.e. were inputs (resources and time) being used in the best possible way to achieve the objectives of MSB III? If yes, how is this efficiency being achieved, if no, what are the reasons for this inefficiency? What could be done to improve efficiency? How can further efficiencies be achieved in the final phase of MSB III? Two telephonic surveys were conducted. The first survey was with the WSA Managers (of which 78% were interviewed). The second telephonic survey was aimed at regional stakeholders (particularly those who attend provincial forums) in order to understand their perceptions of the programme (of whom 100 were interviewed). At the provincial level, the Review Team visited 3 of the 9 provincial forums as not all provinces held such meetings during the period this evaluation was conducted, At the national and regional level, structured in-depth interviews were held with more than 90 key role-players in the sector, including officials from all the key departments within the sector (See Appendix A for details of persons interviewed). The two surveys were analysed using descriptive statistics, which in turn were combined with the qualitative data (such as notes from interviews, official reports and so on) to provide a detailed analysis of each aspect of MSB III. In order to standardize this analysis a scoring system was used in order to rate each component of MSB III. Each axes of the evaluation (i.e. relevance, effectiveness) have been scored using the following scale:
1 For a full discussion of the methods used see Appendix B. 2 This included a review of programme documentation, in-depth-interviews with key role players, and two telephonic surveys.

M i d - T e r m R e v i e w o f M a s i b a m b a n e I I I : A p r i l 2 0 0 7 – S e p t e m b e r 2 0 0 8
O v e r v i e w R e p o r t p.22
Score Assessment Category Aggregated Score
1 Highly unsatisfactory 2 Unsatisfactory 3 Moderately unsatisfactory
UNSATISFACTORY
4 Moderately satisfactory 5 Satisfactory 6 Highly satisfactory
SATISFACTORY
Furthermore, the evaluation team analysed the data using the following matrix, which depicts the relationship between the 8 key result areas in the MSB III Financing Agreement and the Key Performance Indicators (KPIs) specified in the SFWS and adapted for the MSB III programme. The matrix is tabulated as follows:
Table 1: Matrix depicting the relationship between MSB III Finance Agreement Result Areas and SFWS KPIs.
Result Areas ( As per MSB III Financing Agreement) 1 2 3 4 5 6 7 8
Reduction in Services Backlogs • KPI 1- Decrease in population without access to a basic water supply facility
• KPI 2 - Decrease in households without access to a basic sanitation facility • KPI 3 - Decrease in number of schools without access to a basic water and sanitation services • KPI 4 - Decrease in number of clinics without access to a basic water and sanitation services
• KPI 5 – Eradication of bucket toilet system in formal established settlements
Institutional Development and Performance
• KPI 6 Institutional Management & Planning Skills of WSA’s
• KPI 7 - Enhanced Water Service Provider Capacity
• KPI 8 - Establishment and Development of CMA’s
• KPI 9 Implementation of Integrated Water Resource Management in priority areas
Enhanced Role of Civil Society Organisations (CSO’s)
• KPI 10 Enhanced role of Civil Society Organisations
Strengthening of Sector Collaboration
• KPI 11 Strengthening collaborative structures and processes
• KPI 12 – DWAF Sector Reporting
O&M of Water and Sanitation Services
Environment
Gender
HIV/ H&H
AT
Water for growth & development

M i d - T e r m R e v i e w o f M a s i b a m b a n e I I I : A p r i l 2 0 0 7 – S e p t e m b e r 2 0 0 8
O v e r v i e w R e p o r t p.23
The key findings per KPI are revealed in the Results section of the report, and then the Discussion section of this report discusses these findings within the context of the 8 Result Areas of the MSB III Financing Agreement. It should be noted that 8 months have passed since the period under review ended and the submission of this report. Moreover, during those 8 months MSB III has made considerable progress in a number of areas. Therefore throughout the report, and as requested by the Sector, there are instances where data subsequent to the MTR period is also provided to ensure the reader has a better sense of what is happening (or not happening) within a specific aspect of the programme.
3.1 Limitations
There are three significant limitations that affected this mid-term review and should be borne in mind when reviewing the main findings presented below. The first has to do with the forthcoming election (22 April 2009) which meant that a number of provincial forums were postponed or cancelled at the last minute due either to members of the forum required for electioneering purposes and/or a reluctance to convene a decision making body prior to the political situation possibly changing as a result of the election. Secondly, due to external events such as Water Week, the International Water Conference in Turkey, school/Easter holidays and the fact that senior managers by their very nature often have to attend to urgent matters at very short notice, many of those who the team would have liked to interview were simply not in a position to create time in their overflowing diaries. Thus a number of key players in the sector were unavailable for much of the time that the fieldwork was conducted3. Thirdly, the end of the financial year for government departments meant many key officials were caught up in finalising reports, budget meetings and so on and were thus not in a position to respond to repeated requests for relevant information.
3 Interestingly key finding #1 of the MSB II Summative Evaluation found that “many key respondents were consistently
unavailable for interview; a number expressed ‘evaluation fatigue’” (2007: 20).

M i d - T e r m R e v i e w o f M a s i b a m b a n e I I I : A p r i l 2 0 0 7 – S e p t e m b e r 2 0 0 8
O v e r v i e w R e p o r t p.24
4. Results In presenting the main findings with respect to each KPI, the Review Team scored each area of MSB III in terms of both relevance and effectiveness. The overall scores for each of the different components that the MTR was asked to assess in the ToR are tabulated in Table 2.
Table 2: Overall Rating of MSB III, in terms of relevance and effectiveness (where 6 is highly satisfactory and 1 is highly unsatisfactory)
Relevance4 Effectiveness5 Overall
Sector Reporting 6.0 4.0 5.0
Water for Growth and Development 6.0 4.0 5.0
Sector Collaboration 5.0 4.5 4.8
Alternative Finance 5.0 4.0 4.5
Backlogs 5.0 4.0 4.5
Water Service Authorities 5.0 4.0 4.5
Water Service Providers 5.0 4.0 4.5
Integrated Water Resource Management 5.0 4.0 4.5
HIV and AIDS 6.0 3.0 4.5
Operations and Maintenance 5.0 3.5 4.3
Civil Society Organisations 4.5 3.5 4.0
Environment 4.0 3.0 3.5
Appropriate Technology 4.0 3.0 3.5
Catchment Management Agencies 4.0 3.0 3.5
Gender 3.0 3.0 3.0
4 Note that the assessment being made here is about whether or not what MSB III was doing in this area during the period under
review was meeting the needs of South Africa. For instance, Sector Reporting is given a 6/6 as it is meeting the needs required of it in terms of legislation, knowledge management, lesson sharing and so on. Gender on the other hand gets a 3/6, not because gender is not relevant but rather because what the programme is doing under gender is not yet relevant to the needs of the beneficiaries.
5 This score reflects whether or not the programme implemented what it set out to do in the period under review.

M i d - T e r m R e v i e w o f M a s i b a m b a n e I I I : A p r i l 2 0 0 7 – S e p t e m b e r 2 0 0 8
O v e r v i e w R e p o r t p.25
In all instances the score for relevance was higher than the score given for effectiveness. Components that achieved satisfactory progress (i.e. a score of 4.0 or above), included:
Table 3: Components of MSB III that achieved satisfactory progress, with respect to Relevance and Effectiveness
Component Brief Description Overall score
Sector Reporting Reporting by DWAF on sector development and progress 5.0
Water for Growth and Development Implementation of the Water for Growth and Development Strategy 5.0
Sector Collaboration Existence of collaborative structures and planning processes 4.8
Alternative Finance Activities to seek alternative funding sources, and approaches involving a multiplicity of options and models
4.5
Backlogs KPIs 1 – 5, access to water and sanitation services and the reduction in backlogs to these services 4.5
Water Service Authorities Enhancement of the management of Water Sector Authorities 4.5
Water Service Providers Capacity of Water Service Providers enhanced 4.5
Integrated Water Resource Management
Implementation of Integrated Water Resource management processes and systems 4.5
HIV and AIDS Implementation of the Cross cutter, HIV and AIDS strategy 4.5
Operations and Maintenance Operation and maintenance of the existing infrastructure 4.3
Civil Society Organisations Capacity of civil society is enhanced to ensure that CSOs are able to play a more meaningful role in the sector
4.0
Components of the MSB III that achieved unsatisfactory progress (i.e. a score of below 4.0), included:
Table 4: Components of MSB III that achieved unsatisfactory progress, with respect to Relevance and Effectiveness
Component Brief Description Overall Score
Environment Cross–cutting issue of Environment 3.5
Appropriate Technology Implementation of the cross cutter of appropriate technology within MSB 3.5
Catchment Management Agencies Establishment of Catchment Management Agencies 3.5
Gender Implementation of the cross-cutter aimed at gender mainstreaming 3.0
The remainder of this section of the report presents the main findings for each of the KPIs that relate to each of these components of the programme.

M i d - T e r m R e v i e w o f M a s i b a m b a n e I I I : A p r i l 2 0 0 7 – S e p t e m b e r 2 0 0 8
O v e r v i e w R e p o r t p.26
4.1 Reduction in Services Backlogs
4.1.1 Relevance
In 2003 South Africa set itself 19 targets for the water sector as part of its Strategic Framework for Water Services. Of these 19 targets, the first five are set out below.
Table 5: The first five of nineteen strategic goals adopted by South Africa’s water sector in 2003.
1 All people in South Africa have access to a functioning basic water supply facility by 2008. 2 All people in South Africa have access to a functioning basic sanitation facility by 2010. 3 All schools have adequate and safe water supply and sanitation services by 2005. 4 All clinics have adequate and safe water supply and sanitation services by 2007. 5 All bucket toilets are eradicated by 2006.
In 2008 Cabinet recognized that there was a misalignment between targets set by DWAF and the Department of Housing (the Housing target, which contributes to overall targets for water and sanitation delivery, is for 2014) and it also recognised that supply of water and sanitation to all by 2008 and 2010 was not an achievable target and reset the target date to 20146. A Water Targets Implementation Support Programme Plan (Water TISPP) has been drafted to co-ordinate the department’s efforts to help municipalities to achieve this new target. The plan recognizes that the term “backlog” is too simplistic, and provides for classification into sub-categories (i.e. those with no infrastructure vs. those with infrastructure that is inadequate in various ways). The backlog classification table for water services is as shown in Table 6 below.
Table 6: DWAF’s new Backlog Classification for Water Services
CLASSIFICATION PRIORITY
DEFINITIONS
Priority 1 No Water Services Whole community has never had formal (municipal) water supply system.
Priority 2 Inadequate DWAF Infrastructure Need: Extension
Communities have formally grown and there are households that do not have water.
1. Network: new infrastructure 2. Storage: new & adjacent, 3. Local Available Source: New BH, pipe
Priority 3 Inadequate DWAF Infrastructure Need: Upgrade
Existing infrastructure not at RDP standard. 1. Network: Too small pipes, 2. Storage: Add to existing / elevation 3. Source: Infrastructure to increase existing yield
Priority 4 Inadequate DWAF Resource Need
Not enough water in system due to Demand Management problems or local source development issues
Priority 5 Inadequate DWAF Management Need: O&M
Water can be restored to RDP (where infrastructure is ok) by: enough & efficient staff and sufficient funds for O&M (incl. e.g.: quality at water treatment works, machines working, etc)
Priority 6 Inadequate DWAF Management Need: Refurbishment
Water can be restored to RDP by: Repair/Replace with same existing infrastructure
Priority 7 Inadequate Housing Interim Squatter (un-orderly layout) to be addressed with temp infra Priority 8 Inadequate Housing
Permanent Orderly layout where housing scheme is needed. Eg overcrowded yard, existing low cost housing project with need
Adequate Adequate Infrastructure
6 This is a good example of the programme internalising lessons learnt and adapting their approach accordingly.

M i d - T e r m R e v i e w o f M a s i b a m b a n e I I I : A p r i l 2 0 0 7 – S e p t e m b e r 2 0 0 8
O v e r v i e w R e p o r t p.27
The Water Targets Implementation Support Programme Plan (Water TISPP) goes on to classify municipalities in terms of their progress towards the elimination of backlogs (on the basis of numbers of households with a water supply, even if not a fully functional water supply, vs. those not served at all). Water Services Authorities are classified from A to D according to the size of their backlogs and the year by which they expect to have these backlogs eliminated:
Table 7: Municipal categories for focused support
Proposed Year Categories of Municipalities Level of Backlogs
2008/2009 A 0
2008/2009 A1 < 5000
2009/2010 B < 40 000
2010/11 -2012 C < 80 000
2011/12 - 2014 D > 80 000
The Water TISPP goes on to give some indication of the numbers and of municipalities falling into each of the above classification types per province.
Table 8: Categories of municipalities and the estimated number of backlogs
Zero <5000 <40000 <80000 >80000
Province or Region No. of
Munics No. of Munics
No. of HH
No. of Munics
No. of Munics
No. of HH
No. of Munics
No. of Munics No. of HH
Total No. of Backlogs
Eastern Cape 8 1 1 204 4 131 105 - - 1 228 235 360 544
Free State 3 17 11 895 1 13 953 - - - - 25 848
Gauteng 10 1 2 230 1 30 704 - - - - 32 934
Kwazulu Natal 1 3 4 771 3 88 896 4 273 106 3 380 959 747 732
Limpopo 2 3 2 291 4 94 534 1 78 555 1 98 056 273 436
Mpumalanga - 10 16 817 8 124 947 - - - 141 764
Northern Cape 20 11 1 616 1 7 009 - - - - 8 625
North West 5 1 40 6 105 176 - - - 105 216
Western Cape 3 27 6 356 - - - - - - 6 356
Total 52 74 47 220 28 596 324 5 351 661 5 707 250 1 702 455 The EU funding that forms part of this agreement is not used to finance infrastructure costs. However, the funding is intended to assist the sector to become more effective in its overarching goal to provide an acceptable level of water supply and sanitation to all in South Africa. Therefore the 19 targets, including the five specified above, are included as part of the performance monitoring framework for the Masibambane programme, and it is of relevance to review progress against these goals during the period of this MTR (albeit that new targets have subsequently now been set for 20147 and will need to be reflected in an addendum to the EU
7 For the period under review, April 2007 to September 2008, the sector was still reporting against the original KPIs for the SWAP.
For this reason (and the fact that the ToR specify this) this report provides data on these KPIs. However, subsequent events have to some extent overtaken these original KPIs and recognition must be made of the fact that the sector has introduced more holistic and realistic targets for the provision of water and sanitation services.

M i d - T e r m R e v i e w o f M a s i b a m b a n e I I I : A p r i l 2 0 0 7 – S e p t e m b e r 2 0 0 8
O v e r v i e w R e p o r t p.28
Financing Agreement to ensure that the specific conditions for the release of tranches are amended accordingly).
4.1.2 Effectiveness
All people in South Africa have access to a functioning basic water supply facility by 2008 (KPI 1) During the period April 2007 to March 2008 a total of 1,801,800 people were provided with water at the RDP level of service, or higher8. The figure of 1,801,800 people served in 2007/2008 can be seen in context by comparing with information from previous Consolidated Water Sector reports (see Table below).
Table 9: Water delivery as per DWAF 3rd Quarter 2008/2009 Report and 4th Quarter 2006/2007 report.
Period 2004/2005 2005/2006 2006/2007 2007/2008 Number of people served 2,271,939 1,778,823 2,339,200 1,801,800
The evidence from Table 9 suggests that delivery of water services fluctuates by some 10 or 15% above or below the mean of just over 2 million people per year. The same quarterly report (3rd Quarter 2008/2009) reports that the water services backlog as at April 2008 was believed to be 5,76 million people. At the average rate of delivery of two million people per year, the complete elimination of this backlog by March 2011 should be possible. Although this is a little over two years later than the target date set in KPI 1, attaining this goal by March 2011 would be a very significant achievement. All people in South Africa have access to a functioning basic sanitation facility by 2010 (KPI 2) After a dip in 2005/2006, the rate of sanitation delivery has increased strongly, with growth of 23% in 2007/2008 relative to 2006/2007. Table 10 shows the estimated year on year sanitation delivery in South Africa over the last four years (until March 2008)9.
Table 10: Sanitation delivery in South Africa (by DWAF, DPLG, and Dept. of Housing
Period 2004/20051 2005/20061 2006/20072 2007/20083 Number of households served 360,200 305,878 380,806 322,732
Table 11 shows the estimated sanitation backlog in South Africa over the period October 2001 to April 2008. These figures are also derived from DWAF’s Consolidated Water Sector Reports10.
8 At the time of writing of this report (April 2009) no information was as yet available for any quarter within the period April 2008
until December 2008 from either the Department of Housing or the Department of Provincial and Local Government, and therefore DWAF has been unable to report on subsequent progress. Nevertheless, the figures are meant to reflect provision of waters services by both DPLG and DoH.
9 Sources: DWAF 4th Quarter 2006/2007 Consolidated Water Sector report, DWAF 4th Quarter 2007/2008 Consolidated Water Sector report, DWAF 3rd Quarter 2008/2009 Consolidated Water Sector report

M i d - T e r m R e v i e w o f M a s i b a m b a n e I I I : A p r i l 2 0 0 7 – S e p t e m b e r 2 0 0 8
O v e r v i e w R e p o r t p.29
Table 11 South African sanitation backlog estimation.
Date October 20012 April 20061 April 20072 April 20083
Number of households 4,759,709 3,745,182 3,525,791 3,311,512
The rate of backlog reduction does not match the rate of sanitation delivery. The rate of backlog reduction is fairly even at 220 000 units per year over the period October 2001 to April 2008. The apparent anomaly between this rate and the rate of sanitation delivery may be explained by population growth, a reduction in household sizes and population movements. At the current rate of backlog reduction it will take 15 years for all in South Africa to have access to basic sanitation (i.e. until March 2023). All schools have adequate and safe water supply and sanitation services by 2005 (KPI 3) In 2004 there were still approximately 4 000 schools in South Africa without access to water and sanitation. Since inception of MSB III to September 2008, 91 Priority 1 schools have been served with water and 92 with sanitation by DWAF specifically. It should be noted however that DWAF is focussing on those schools that have been determined by DoE as Priority 1 schools. Contracts were in various stages of completion for all of these schools, and completion may well occur before the revised deadline of 2010, but this is of course dependent on how many schools are eventually assigned by DoE. All clinics have adequate and safe water supply and sanitation services by 2007 (KPI 4) In March 2006 it was estimated that 727 clinics were in need of a water supply, and 437 were in need of sanitation. By December 2007 these backlogs had been eliminated by the sector (DWAF’s contribution was to provide these services to 716 clinics using top-up funding from National Treasury), however this still needs to be verified with the Department of Health (as noted above the Department of Health had not reported up-to-date data during the period that this MTR is focussing upon). All bucket toilets are eradicated by 2006 (KPI 5) The Consolidated Water Sector report for the Third Quarter of 2008/2009 reports that during the period 2005-2009 the following progress has been made with the eradication of buckets. The estimated backlog at February 2005 was 252 254, by September 2008 this had been reduced to 10 395. Eradication of the last few thousand buckets is dependent on provision of water supply and may take some time. In the opinion of the WSA managers (Figure 1), the majority were confident that water and sanitation backlogs would be eradicated by 2015.
10 Sources: DWAF 4th Quarter 2006/2007 Consolidated Water Sector report, DWAF 4th Quarter 2007/2008 Consolidated Water Sector
report, DWAF 3rd Quarter 2008/2009 Consolidated Water Sector report.

M i d - T e r m R e v i e w o f M a s i b a m b a n e I I I : A p r i l 2 0 0 7 – S e p t e m b e r 2 0 0 8
O v e r v i e w R e p o r t p.30
Figure 1: Backlogs – Estimate of date for eradication (Source: WSA Survey)
However, there is also growing evidence that in many municipalities, as backlogs are overcome, people rejoin the backlog queue. Three out of every four (76%) of WSA managers believe that people in their municipality have already rejoined the backlogs. A very similar number (72%) are convinced that if people have not yet joined the backlog queue they will do so in the future. The main reason for people joining the backlog queue was seen to be the migration of people into the urban areas (87% of WSA managers supported this perception). Free Basic Water (FBW) The Water Services Strategic Framework (2003) set out the goal of promoting access to an appropriate, acceptable, safe and affordable basic water supply and sanitation service through the implementation of a “free basic water policy in all water services authorities.” The free basic water concept was initiated in 2007 with the objective of accelerating the implementation of FBW in 36 targeted municipalities and to share the benefits, good practice and lessons learnt from the programme with all municipalities. The FBW Strategy and Special Intervention Plan (SIP) was an inter-governmental programme and was part of the Intergovernmental Framework Act between sector departments and municipalities. Achievements in the provision of free basic water can be summarized as follows:
▪ From a national perspective, 85.46% (increasing to 85.62% by March 2009) of households in South Africa received FBW. In terms of the targeted poor households, by September 2008, 74.91% received FBW (increasing to 85.87% by March 2009 (see table below);
▪ Information received from the interviews indicate that throughout the period under review (and subsequent periods) the sector continues to make steady progress, particularly in the Eastern Cape, KwaZulu-Natal, Northern Cape and North West provinces (see table below);
▪ A total increase of 10.92% in the total number of poor households receiving FBW was recorded in the most recent quarter (increasing to 85.87% of the total of poor households served);
▪ The latest report on free basic water indicates that only four WSAs (i.e. less than 0.1%) are still not serving free basic water to any of its population.

M i d - T e r m R e v i e w o f M a s i b a m b a n e I I I : A p r i l 2 0 0 7 – S e p t e m b e r 2 0 0 8
O v e r v i e w R e p o r t p.31
Table 12: Total households served with FBW (Source: DWAF FBS website, 31 March 2009)
Total Household served by Free Basic Water
Total Population served Prov.
Jun 2008 % Sept 2008 %
December2008
% March 2009
% Number Served
% Served
EC 1,124,968 71.67% 1,179,670 73.67% 1,179,670 73.67% 1,179,973 73.69% 303 0.02%
FS 738,220 92.75% 738,181 92.75% 738,181 92.75% 738,181 92.75% 0 0%
GP 2,977,318 88.54% 2,988,083 88.17% 2,988,083 88.17% 2,988,084 88.17% 0 0%
KZN 1,972,514 82.39% 2,017,793 82.20% 2,017,793 82.20% 2,020,682 82.32% 2,889 0.12%
LP 1,018,703 80.83% 1,018,076 80.82% 1,018,076 80.82% 1,018,076 80.82% 0 0%
MP 821,552 90.88% 821,878 90.88% 821,878 90.88% 821,875 90.88% -3 0% NC 244,452 92.26% 244,747 92.23% 244,747 92.23% 251,104 94.63% 6,357 2.4%
NW 768,578 82.11% 759,547 82.03% 761,567 82.25% 771,503 83.33% 9,936 1.08%
WC 1,366,017 95.36% 1,365,730 95.36% 1,365,730 95.36% 1,365,730 95.36% 0 0%
Total 11,032,322 85.39% 11,133,705 85.46% 11,135,725 85.47% 11,155,207 85.62% 19,482 0.15%
However, as to be expected, not all WSAs have been in a position to provide FBW to all communities and there have been instances (such as in the City of Tswane) where only indigent households are provided with FBW. Moreover, the nature of the FBW provision can vary from 200m standpipes, to household metres to more rudimentary schemes in rural areas (such as those being used in Zululand) and so on. Transfers Progress with the transfer of DWAF-owned assets to WSAs and water boards, together with the staff associated with those assets, has been measured against a functional assessment completed in 2002. Transfer agreements between DWAF and the receiving institutions are almost complete and only the final stages are outstanding on the last three agreements. Overall progress is estimated at 98% and 95% of the agreements are in place and signed by all parties.
Table 13: Transfer agreements between DWAF and the receiving institutions
Authority TA's ConcludedTA’s in
Circulation (awaiting DG signature)
TA's to be Concluded Total
Water Boards 3 0 3 Metropolitan Municipalities 4 0 4 District Municipalities 22 1 0 23 Local Municipalities 28 2 30 Total 57 1 2 60 95.0% 1.7% 3.3% 100%
Progress during the reporting period is described in the table below. The functional assessment information was recently adjusted to cater for municipal demarcation adjustments.

M i d - T e r m R e v i e w o f M a s i b a m b a n e I I I : A p r i l 2 0 0 7 – S e p t e m b e r 2 0 0 8
O v e r v i e w R e p o r t p.32
Table 14: Transfer progress during the period under review by the MTR
Progress as at end of
Transfers
Functional Assessment (FA) 2001 Baseline
(revised) March 2007 March 200811 Progress in
report period
Transfer Agreements 58 (60) 53 57 4
Schemes Identified in FA 318 306 309 3
Total Schemes12 Unknown 1666 1702 36
Value of assets (bn Rand)13 7.122 (6.777) 5.931 5.77 -0.161
Staff for Transfer 8141 (7803) 4494 361
Seconded staff 3104
Staff Total 8141 (7803) 7463 7598 135 In addition to the 1702 transferred schemes, the 3rd Quarterly report records that a further 38 schemes are in the process of being finalised for transfer. The estimate of the cost to refurbish the DWAF schemes has escalated from R712m in 2001 to a current estimate of R1.3bn. While the process of transferring physical assets is near completion, only 58% of the DWAF staff had been transferred by December 2008 and an additional 3104 staff have been seconded. Concluding the transfer of these staff has been identified as a major challenge and the participation of the sector partners including SALGA will be critical in its resolution. The operating funds allocated to DWAF for the transferred assets and staff are specified in the Division of Revenue Act (DoRA) under the water services operating subsidy and will reduce over a three-year period until June 2012 by which time the subsidy will be fully incorporated into the municipal equitable share.
4.2 Institutional Development and Performance
4.2.1 Relevance
In terms of the financing agreement, the objective for KPI 6 is to assess institutional development and performance of Water Services Authorities (WSAs). This includes “institutional management and planning skills of WSAs,” which covers reporting on Water Service Development Plans (WSDPs) and water service provider (WSP) arrangements. The central thrust of KPI 6 is to maintain a legislative and policy framework that ensures adequate governance through coordinated planning and management of service delivery. This is achieved by making sure that WSAs respond to the planning requirements as specified by DWAF through the relevant legislation (e.g. Water Services Act) and the SFWS. WSDPs are one of the ways of making sure that a WSA responds to these requirements. It should however be noted that there are other regulatory requirements which a WSA should adhere to. These are dealt with in the section on O&M of the MTR. The WSSS strategy is the other key strategy to achieve this objective as it provides an integrated approach to support to local government.
11 Latest data available to Mid term review from the 3rd Quarterly report October to December 2008. 12 The total schemes includes rudimentary and post 1994 schemes excluded from the FA 13 The value of asset figures in the quarterly report is obviously not correct and need to be reconciled with earlier reports

M i d - T e r m R e v i e w o f M a s i b a m b a n e I I I : A p r i l 2 0 0 7 – S e p t e m b e r 2 0 0 8
O v e r v i e w R e p o r t p.33
4.2.2 Effectiveness
% of total number of WSA’s reporting annually on progress against their WSDPs (KPI 6.1) The Water Service Development Plans (WSDPs) are an important tool in that they are used by the DWAF for reporting, regulating, and supporting local government with water services functions. Based on interviews with officials, currently only 10% of municipalities are reporting adequately on their WSDPs i.e. these 10% have WSDPs that are deemed to be at an acceptable level and are meeting the DWAF reporting requirements. Otherwise the number of WSAs reporting on WSDPs is higher. It should further be stated that local government also responds to a number of reporting requirements that have the same targets as the WSDPs by DWAF, e.g. reporting to DPLG through Comprehensive Infrastructure Plans (CIP); reporting to the Auditor General; reporting to National Treasury; etc. Within these reports, there is generally an improvement on water services function by the municipalities. The finding of this review was that reporting by municipalities on WSDPs varies. In this regard, it must first be noted that the ability to report against approved WSDPs depends largely on the availability of managerial and planning capacity in municipalities. Secondly it should be noted that WSDP reporting has been enhanced to include additional information that was not included previously e.g. reporting on water services audit information. This information is passed on to the regulator to feed into DWAF’s Regulation Performance Management System (RPMS), which is up and running. Since the system is new, it is developing slowly, however it is anticipated that it will improve as more and more WSAs report on their progress and performance. Part of the objectives in terms of the MSB III Financing Agreement related to this KPI is an assessment of the implementation of projects prioritized under the WSDPs. According to the interviews conducted as part of this review, there is general consensus that municipalities are improving in terms of the implementation of prioritised projects. The indication is that most of the projects get implemented through the MIG programme. It is estimated that 65% of the WSDP projects are implemented through MIG funding. While this section gives an indication of the progress so far on the WSDPs, it should be noted that the work done in this regard has been through the DWAF budget and not the Masibambane programme. There were no funds that were received from Masibambane for WSDP support. Therefore the next tranche of financial support should specifically cover WSDP support, particularly due to the fact that DWAF is using WSDPs as a tool for annual reporting on water services functions. WSAs with council approved delivery mechanisms and provider arrangements in place where appropriate (KPI 6.2) The key objective of KPI 6.2 is to have external WSP arrangements in place, where appropriate, that will render water services on behalf of a WSA based on a contract. This process starts with a Section 78 assessment, the end result of which should indicate the most appropriate arrangements for water services provision within the WSA municipal jurisdiction. The finding from this review is that for the most part, municipalities have completed their Section 78 assessments, and on this basis, have taken decisions on WSP arrangements. This is confirmed to be the case broadly in Mpumalanga, Eastern Cape, North West and KwaZulu-Natal provinces. Information in this regard on other provinces is still being compiled. It should be noted that not all municipalities have successfully managed these processes. The finding is that these municipalities have not implemented Section 78 decisions for different reasons. In some cases,

M i d - T e r m R e v i e w o f M a s i b a m b a n e I I I : A p r i l 2 0 0 7 – S e p t e m b e r 2 0 0 8
O v e r v i e w R e p o r t p.34
the Councils of these municipalities have not agreed with the decisions reached through the Section 78 process and therefore refuse to implement it. In other instances, capacity challenges lie behind the lack of success. In cases where WSP arrangements are in place, there has been improvement according to the Checklist Reports. As at the end of March 2007, the results of the WSA Checklist Assessment pertaining to WSA/WSP Functionality, reported that of the WSAs that responded, 65 (41%) WSAs had Service Delivery Agreements in place to monitor and regulate WSPs, and 85 WSAs (53%) had performance management contracts in place with senior WSP managers. The latest Checklist Report (2007/2008) and the Consolidated Report 4th Quarter 2007/2008 indicate that 62% of municipalities have WSP contracts in place, and that 62% of municipalities are monitoring and regulating performance management of the WSP contract. Despite the results indicated in the Checklist Reports, the interviews with DWAF officials conducted as part of this review suggested that very few, or no, municipalities are reporting on their WSP contracts as per regulatory requirements. The finding from this review is that DWAF officials “have to beg municipalities to provide copies of the contracts for the purposes of the review in terms of regulation”. The finding of this review is therefore that WSA/WSP functionality is not strong due to the following challenges:
▪ The relevant roles and responsibilities are not clear; ▪ In many cases, municipalities are failing to collect revenue, and therefore fail to honour
their contract terms; ▪ In limited cases there is no formal agreement -- the WSA/WSP relationship is based on
“gentleman’s agreement” without a formal written contract. This finding contradicts the results of DWAF’s Checklist Reports. This confirms the broader finding of this review that different sources provide different information on water services. This is a challenge that should be addressed. (It should be noted that the contradicting information gathered as part of this review is based on reports from DWAF regional offices. There is still a need to confirm the information provided). Support to WSPs (KPI 7) The MSB III Financing Agreement stipulates that DWAF was to develop reporting systems and performance indicators for the programme. DWAF thus developed indicators against which the Sector’s performance is measured. The following KPIs related to enhanced WSP capacity were thus developed as part of this process:
7.1 Development of approved WSP business plans; 7.2 Development and dissemination of consumer charters; 7.3 Implementation of tariff policy and consumer friendly billing; 7.4 Development of asset management systems.
While there is a direct link between these KPIs and the SFWS (e.g. WSP business plans and consumer charters are specifically mentioned), activities under MSB III to date have not taken much consideration of WSP business plans, consumer charters, or consumer-friendly billing. However, the implementation of tariff policy -- in so far as putting in place free basic water (FBW) -- has been a significant focus. Specific, but limited, attention has also been paid towards the development of asset management systems under MSB III. Because the content of the Masibambane KPIs with regards WSPs has largely been overlooked by DWAF up to this point, progress with regards to these KPIs is largely not on target. DWAF is now advocating for

M i d - T e r m R e v i e w o f M a s i b a m b a n e I I I : A p r i l 2 0 0 7 – S e p t e m b e r 2 0 0 8
O v e r v i e w R e p o r t p.35
changing the substance of several of these KPIs. However, while these KPIs (viz. WSP business plans; consumer charters; tariff policies and billing; and asset management systems) do need to be addressed with WSPs, the lack of progress with regards these KPIs does not give the full picture. Promising work has been done with regards WSP support and this needs to preface the specific discussion of these KPIs. Developing WSP capacity is a serious challenge with which the sector is now actively engaging. This is being led by the Directorate WSSD as part of the implementation of the National Joint Water Services Sector Support Strategy through the WSP Support Project Execution Plan (PEP). The WSP PEP is focused at the operational level of WSPs and is intended to take policy to practice. A pilot programme at four sites has been completed and the lessons learned are feeding into the final WSP Support Implementation Plan. This plan is to be operationalised at the 4 pilot sites in the financial year 2009/10 and then mainstreamed and rolled out at a national level from 2010/11. The KPIs for enhanced WSP capacity under the MSB III agreement (viz. WSP business plans; consumer charters; asset management systems; tariff policies and consumer-friendly billing) still need to be specifically incorporated into this WSP Support Implementation Plan in some cases. Importantly, bearing in mind the national concerns around drinking water quality (DWQ), DWQ has been identified as one of the top 3 KPAs in the WSP Support Implementation Plan. The rollout of this plan is critical for various areas. If effectively implemented, it could be instrumental in improving the management of drinking water quality, as well as in improving operations and maintenance overall. Coordination of this WSP support across the sector players can be expected to be a key challenge. Even more critical will be the allocation of substantial funds to support the implementation of this programme at WSP level. Development of approved WSP business plans (KPI 7.1) According to DWAF’s MSB III Assessment Report (Sept 2008), it was not possible to measure the development of approved WSP Business Plans (BPs) until the Water Services Information division has compiled a database of all WSPs (i.e. the foundation for measuring this KPI is not in place -- the identity of all WSPs is not known). While some WSPs have developed and approved BPs, this has also not been tracked and documented by DWAF. However, DWAF draws from the WSA Checklist Assessments 2007/2008, which suggests that 67% of respondents interviewed demonstrated that some sort of internal monitoring of WSP BP and performance was taking place. DWAF’s recommendation is thus that this KPI be managed, tracked and regular progress updates reported within the Masibambane quarterly reporting mechanisms. The WSA survey conducted as part of this mid-term review indicated that 68% of WSAs have WSP Business Plans in place; 29% do not have WSP Business Plans; and 3% did not know (Figure 2). More in-depth sample telephonic interviews with WSAs have suggested that the percentage of WSPs that have formal WSP BPs in place may be less than this.

M i d - T e r m R e v i e w o f M a s i b a m b a n e I I I : A p r i l 2 0 0 7 – S e p t e m b e r 2 0 0 8
O v e r v i e w R e p o r t p.36
Figure 2: Percentage of WSAs who have by-laws, charters, plans and policies in place (Source: WSA Survey)
Development and dissemination of consumer charters (KPI 7.2) According to DWAF’s MSB III Assessment Report (Sept 2008), it was not possible to measure this KPI because this indicator is not tracked by the sector. (The fact that not all WSPs are even known must also be a factor). Again, DWAF’s own recommendation on this is that the targets for this KPI be changed to tracking the development of the reporting systems that would measure this (instead of actually measuring % of WSPs with consumer charters in place). Information gathered last year by DWAF and contained in “A Table of Contracts Between Municipalities and Water Boards and Related Information,” suggests that of the 15 water boards listed, none reported having consumer charters. The WSA survey found that 46% have consumer charters; 39% do not have consumer charters; and 15% did not know (Figure 2). More in-depth sample telephonic interviews with WSAs on this question drew mixed responses. While none reported that consumer charters were in place, some stated that consumer charters were in the process of being drafted. However, it did appear that there is a lack of clarity generally about what exactly is a ‘consumer charter.’ While most WSAs were clear that they had customer care regulations and by-laws in place, several asked for clarification on what a consumer charter was. (Note: According to DWAF’s Development of a Consumer Rights and Obligations Pack (Dec 2005)), a consumer charter is a document that sets out both the municipality’s and the consumers’ obligations when it comes to water services. The charter should at least fulfil the requirements of the Water Services Act; provide a system for dealing with consumer complaints; and set out the consumer’s rights to redress. It is also stipulated that consumers should have a say in the drafting of the charter. A consumer charter should be a user-friendly document. (For example, Cape Town’s charter is a one-page illustrated poster available in 3 different languages).

M i d - T e r m R e v i e w o f M a s i b a m b a n e I I I : A p r i l 2 0 0 7 – S e p t e m b e r 2 0 0 8
O v e r v i e w R e p o r t p.37
Implementation of tariff policy and consumer friendly billing (KPI 7.3) According to DWAF’s MSB III Assessment Report (Sept 2008), the targeted 80% of WSAs implementing tariff policies and providing consumer friendly billing was exceeded. The achievements reported include the following: 87% of respondents have implemented council approved tariff policies; 73% of respondents have council adopted tariff by-laws; and 85% of WSAs provide FBW (considered as “consumer-friendly billing”). The apparent success with regards this KPI is somewhat mitigated by the broader context of billing and cost recovery. The WSA survey found that 61% of respondents indicated their WSPs are able to bill all households, but 83.5% agreed, “non-payment is a huge financial burden” (Figure 2). The more in-depth sample telephonic interviews revealed that while tariff policies appear to be largely in place, billing systems (and especially cost recovery) are far more problematic. Development of asset management systems (KPI 7.4) According to DWAF’s MSB III Assessment Report (Sept 2008), DWAF is in the process of developing the WSA/WSP asset management strategy and it was to be implemented in the 2008/09 financial year. However, the existing DWAF asset management system does track the scheme transfers programme from DWAF to WSAs, where 1,701 schemes were transferred with an asset value of R5,956 billion. DWAF’s own recommendation on this is that since the asset management strategy is in the developmental phase, the targets for this KPI be changed to tracking the development of this reporting system. The WSA survey indicates that 66% have asset management plans in place and 34% do not (Figure 2). More in-depth sample telephonic interviews with WSAs suggested that the percentage of WSPs that have genuine asset management plans in place is less than this – all of the interviewees reported that they did not have a comprehensive asset management plan. While there was general awareness about asset management plans, there were also indications in some cases that there was a lack of thorough understanding of what constitutes an asset management plan. Some WSAs are simply trying to make lists of assets – but even this has only been partially achieved by many WSAs, some of whom are still not completely clear on the infrastructure that exists within their jurisdiction. There also seemed to be some confusion as to where responsibility for the asset management plan lies – with engineering or with finance – and there were indications that there can be a lack of cooperation and/or communication between engineering and finance within local government structures on this issue. Alternative Financing Mechanisms Although not a KPI in its own right, a key component of enhanced WSP capacity is the ability to finance current operations using alternative means. As far as the objective for the Masibambane programme to assist in the creation of alternative financing mechanisms for water services, discussions with senior officials at DWAF, DPLG, the DBSA, and Treasury revealed that the exploration of alternative financing mechanisms remains a challenge for many municipalities, whilst at the national level progress remains slow in terms of concrete results. Nevertheless examples of progress include:
▪ The DBSA is aware of the incipient creation of a fund that will target the turnaround of non-revenue water in municipalities. This fund is to attract private sector participation in both the financing and implementation aspects of its operation, given the quick and

M i d - T e r m R e v i e w o f M a s i b a m b a n e I I I : A p r i l 2 0 0 7 – S e p t e m b e r 2 0 0 8
O v e r v i e w R e p o r t p.38
sustainable returns that unaccounted for water loss management measures can offer. The driver for the fund’s creation is a private sector initiative – Af-Cap. It claims to be attracting some funding from USAID and potential investment from the World Bank.
▪ The National Treasury pointed out that there is very little activity on the Public Private Partnership front. They would welcome some activity but lament that international water companies seem to have less appetite for pursuing PPPs than was initially the case. This is true – international water companies such as Vivendi, Suez, Thames Water, and Biwater are considerably less bullish and more risk averse than in the 1990s. This is largely as a result of adverse experiences of political and currency risk. The concessions signed in RSA in Nelspruit and the North Coast of KZN are, however, still operational. The Treasury officials agreed that, in addition to the above, the legislation for PPPs in RSA makes the conclusion of any deal extremely onerous.
▪ The DPLG reports that it has allocated R30m of Masibambane funds to a programme that provides technical assistance and training to municipalities to help inter alia in accessing loan funding or secure a credit rating. This has been piloted in 7 municipalities. The main problem commercial lenders have is that investments have to generate a revenue stream at rates that are affordable to the consumers. The DPLG has experienced cases where the water tariff required for loan payback is R28/kl. This is obviously unaffordable.
▪ The DBSA and the commercial banks do, however, regularly lend to municipalities. A component of this is for water and sanitation infrastructure. It is not apparent that there have been any new developments in devising alternative financial instruments.
Figure 3: Number of WSA managers who believe they would be able to source funds for water infrastructure development in their area from partnerships with different partners
(Source: WSA manager).
Figure 3 nevertheless illustrates that many WSA managers believe that it is possible to source funds from alternative funds. The most commonly cited included other grants (50% of managers made mention of this); Public-private partnerships (38%) and Commercial agriculture (34%). Direct consumer billing and debt collection is obviously the primary revenue stream for municipalities. This was not explored in this review.

M i d - T e r m R e v i e w o f M a s i b a m b a n e I I I : A p r i l 2 0 0 7 – S e p t e m b e r 2 0 0 8
O v e r v i e w R e p o r t p.39
Establishment and Development of Catchment Management Agencies (KPI 8) In terms of the desired outcomes related to KPI 8: Establishment and Development of Catchment Management Agencies, the Masibambane III Financing Agreement defines these as the following: By the end of Masibambane III, 2011/12 all 19 catchment management agencies identified, should be established, and the composition of their Boards should reflect all relevant water sector stakeholders, and the agencies would be well on the way to financial self-sufficiency as reflected in the budgets and audited accounts. (Masibambane III Outcomes: As per the EU/SA Financing Agreement, 2007) The specific KPIs identified to measure these desired outcomes consist of the following:
▪ KPI 8.1: Establishment of CMAs published in the Government Gazette; ▪ KPI 8.2: Number of CMA Governing Boards appointed; ▪ KPI 8.3: Percentage of established CMAs with Business Plan and strategies in place.
The achievements with regards the establishment of CMAs provides a mixed bag of results. Two fully-fledged CMAs have been established while many others are at various stages of establishment. The established CMAs, Breede and Inkomati, each have a Governing Board and a CEO in place. The other CMAs range from being at proposal development stage to advisory committee process stage. Challenges have been met in the following areas:
▪ DWAF is in an institutional re-alignment process that includes CMA establishment assessment. Therefore the CMA establishment process is on hold as the institutional re-alignment process could affect the number of CMAs to be established. However the re-alignment process is being finalized. The CMA establishment process will continue after the realignment process based on a consideration of the proposals from the re-alignment process.
▪ The appointment of professional service providers (PSPs) to support the CMA process was stopped twice in order to await the findings of the institutional alignment process. The implications are that there is no movement on the CMA establishment process.
▪ DWAF organisational restructuring is also impeding the CMA establishment process. This is being exacerbated by the fact that Regional Office structures are going through restructuring despite an understanding of CMA establishment.
▪ DWAF preparedness on institutional change in relation to CMA establishment (change management) is insufficient. Taking into account the gaps as well as other related challenges, particularly within DWAF at Head office and the Regions, there is very little evidence that the department is well prepared for the changes that will be brought by the CMAs. The gaps are mainly in terms of staff transfer, budget transfers, transfer of functions, etc.
▪ Stakeholder engagement processes have slowed considerably and are now too far drawn out in between stages, thereby creating continuity problems. This will pose a serious problem in relation to stakeholders when the CMA establishment process resumes.
▪ DWAF is not unanimous in support of CMA establishment, yet CMA establishment is part of DWAF policy and is provided for by the Act as well as the National Water Resource Strategy (NWRS). Any changes around CMAs will require new policy direction.
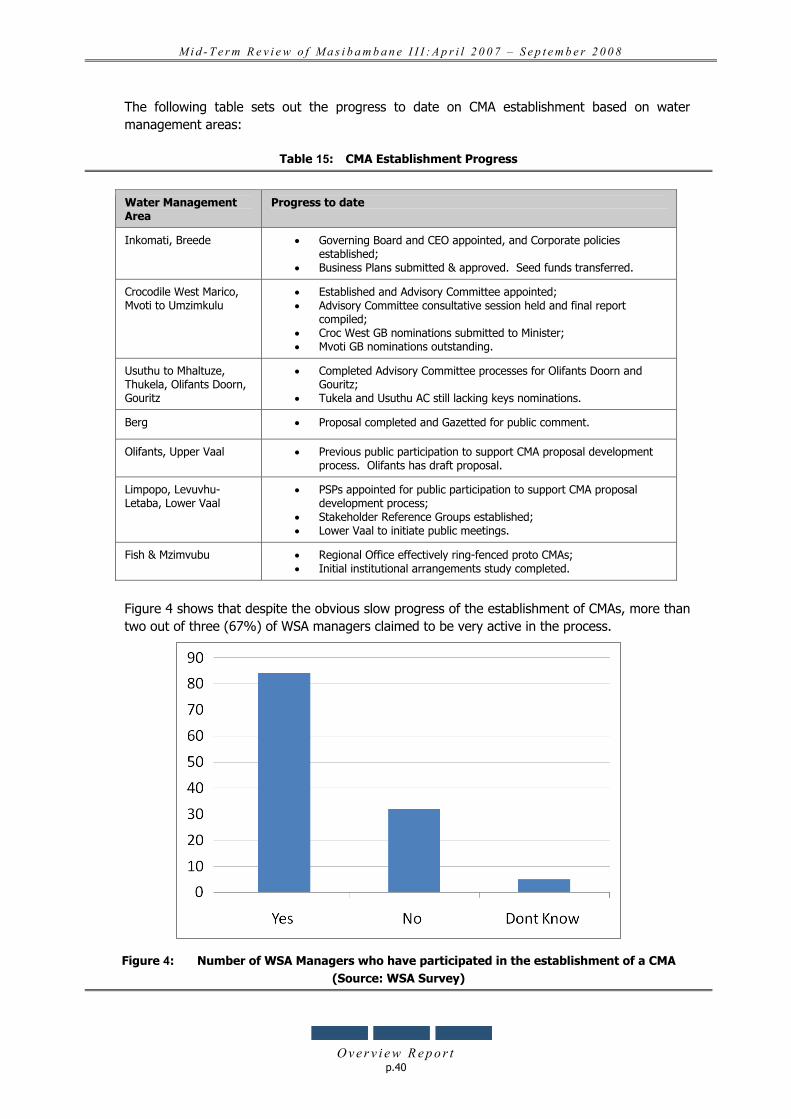
M i d - T e r m R e v i e w o f M a s i b a m b a n e I I I : A p r i l 2 0 0 7 – S e p t e m b e r 2 0 0 8
O v e r v i e w R e p o r t p.40
The following table sets out the progress to date on CMA establishment based on water management areas:
Table 15: CMA Establishment Progress
Water Management Area
Progress to date
Inkomati, Breede • Governing Board and CEO appointed, and Corporate policies established;
• Business Plans submitted & approved. Seed funds transferred.
Crocodile West Marico, Mvoti to Umzimkulu
• Established and Advisory Committee appointed; • Advisory Committee consultative session held and final report
compiled; • Croc West GB nominations submitted to Minister; • Mvoti GB nominations outstanding.
Usuthu to Mhaltuze, Thukela, Olifants Doorn, Gouritz
• Completed Advisory Committee processes for Olifants Doorn and Gouritz;
• Tukela and Usuthu AC still lacking keys nominations.
Berg • Proposal completed and Gazetted for public comment.
Olifants, Upper Vaal • Previous public participation to support CMA proposal development process. Olifants has draft proposal.
Limpopo, Levuvhu- Letaba, Lower Vaal
• PSPs appointed for public participation to support CMA proposal development process;
• Stakeholder Reference Groups established; • Lower Vaal to initiate public meetings.
Fish & Mzimvubu • Regional Office effectively ring-fenced proto CMAs; • Initial institutional arrangements study completed.
Figure 4 shows that despite the obvious slow progress of the establishment of CMAs, more than two out of three (67%) of WSA managers claimed to be very active in the process. Figure 4: Number of WSA Managers who have participated in the establishment of a CMA
(Source: WSA Survey)

M i d - T e r m R e v i e w o f M a s i b a m b a n e I I I : A p r i l 2 0 0 7 – S e p t e m b e r 2 0 0 8
O v e r v i e w R e p o r t p.41
Figure 5: Main challenges facing CMAs, according to WSA managers (Source: WSA survey)
The main challenges that WSA managers perceive CMAs will face (Figure 5) include human resources and policy guidelines on CMAs (67% of managers perceived this as the main challenge). Other key challenges include stakeholder participation (66%), financial sustainability (63%) and political buy-in by political leadership at all levels (62%). Implementation of Integrated Water Resource Management (IWRM) in Priority Areas (KPI 9) IWRM aims to strike a balance between the use of resources for livelihoods and its protection for future generations, whilst promoting social equity, environmental sustainability and economic efficiency. In the context of MSB III, IWRM aims to address five key areas: Water Allocation Reform (WAR); Water Conservation and Demand Management (WC/DM); Compliance Monitoring and Enforcement (CME); transformation of Irrigation Boards (Ibs); and Resource Poor Farmers (RPFs) established. These are all priority areas for furthering government objectives in terms of efficient and effective water use in the context of the need for equitable access and redress. These IWRM components each have a high degree of relevance and therefore strong reason for ongoing emphasis in MSB III. Figure 6 depicts the main perceptions of WSA managers with regards to IWRM; these perceptions are discussed in greater detail below.

M i d - T e r m R e v i e w o f M a s i b a m b a n e I I I : A p r i l 2 0 0 7 – S e p t e m b e r 2 0 0 8
O v e r v i e w R e p o r t p.42
Figure 6: Number of WSA Managers who agree with key IWRM Concepts
Water Allocation Reform schedules finalised and implementation commenced in priority catchments (KPI 9.1) Compulsory Licensing: There has been significant investment and technical preparation in pilot catchments (Jan Dissels, Umhlatuze and Nkomati) in preparation for Compulsory Licensing. However a range of legal and process challenges have delayed gazetting by the Minister to commence the Compulsory Licensing process. During the reporting period of this mid-term review, DWAF has also struggled internally with the foundations of the Compulsory Licensing component of the WAR strategy. Routine licensing: Section 17 licensing compliance has seen marked success in the Western Cape, where the DWAF has been proactive in prompting and supporting the BEE element in new license applications and has actively integrated this with funding and departmental support from the Land Reform Process and the Department of Agriculture. The success of the Western Cape in driving this element of the WAR agenda is linked to two key observations, namely energetic informed leadership within the DWAF region and the generally functional inter-governmental relations in key committees and fora such as the Coordinating Committees on Agricultural Water (CCAW). Furthermore, the regional DWAF office is actively involved with WSDP and IDP planning processes at Municipality level. The experience in other provinces has not been as positive. The Eastern Cape and Limpopo present a typical picture of the provinces (other than the W. Cape) with no successful license applications in the reporting period, mainly due to non-BEE compliance as defined by DWAF Head Office (HO), after submission of license applications by the regions. Interviews with regional personnel indicated that repeated rejection by DWAF HO was on the basis of stated non-compliance with Section 17 requirements and this has resulted in demoralization of the regional staff because they are applying themselves to try and register new licensing

M i d - T e r m R e v i e w o f M a s i b a m b a n e I I I : A p r i l 2 0 0 7 – S e p t e m b e r 2 0 0 8
O v e r v i e w R e p o r t p.43
applications (which are BEE compliant) but repeatedly fail on submission to DWAF HO. The reason that is given for rejections of new licenses from DWAF HO are thought by the regional staff to be inconsistent and present no practical options for them to engage with new license applicants. So while the regional staff currently endeavour to meet requirements as they understand them, they find that these requirements are subject to differing interpretation at DWAF HO and importantly, are not specified clearly in writing in a guideline document. There is a lack of clarity as to what exactly complies and does not comply with the DWAF HO interpretation of Section 17 and a sense of frustration with DWAF HO for not providing direction and actively guiding the detailed content of the applications so that they can in fact comply. While the licensing and implicit WAR outcomes are not positive, the observations and discussions show a positive aspect for the future. Regional staff who were interviewed seem to have internalized the priority objectives of WAR, and demonstrate a willingness to apply themselves to implement the BEE provisions vis-à-vis new license applications. This suggests that investment to establish explicit written criteria (for licensing approval) and improvement in routine communication between regional licensing personnel and HO licensing personnel could result in significant gains in this KPI. Water conservation and demand management strategies developed and implementation commenced in priority catchments (KPI 9.2) Interviews with a range of regional and national DWAF staff showed that WC/DM is considered important and is, in the view of the evaluation team, effectively internalised by DWAF regional staff as a priority issue. While the difference between ‘conservation’ and ‘demand management’ were in discussions not fully understood by informants, the intent to encourage water efficiency measures and behavioural change in water consumption was substantively found to be present at regional level. This was evidenced in the consideration of Municipal licensing conditions, where WC/DM requirements were included, and where planning collaboration between DWAF Regional personnel and Municipality driven water-related developments has taken place. Of the 121 WSA’s interviewed for example, 64.5% stated that DWAF assisted with the planning of water resources management, which domain includes WC/DM. While cases of poor collaboration between the DWAF Regions and Municipalities were related in interviews (documented further under the Co-operative Governance and Sector Collaboration section of the MTR), this does not detract from the finding that an awareness of the importance of WC/DM is significantly present and has meaning to Regional DWAF staff and there is a degree of clarity as to how it should be implemented in practice. Questionnaire interviews with WSAs answered predominantly by senior personnel, showed that water demand management and water conservation are high priority issues (Figure 6). Responses showed that 59.5% stated that water demand management is a struggle with which they are engaging with substantial intent. Questionnaire interviews of 100 members across Provincial Water Fora showed that 91% rated the forums performance in providing support on water demand management as either ‘Good’ or ‘Fair’ while 72% of respondents answered similarly in relation to water conservation support. These findings show, with a degree of confidence, that WC/DM is an issue with which DWAF personnel and WSAs are engaging with intent. WC/DM as a working principle is concluded to be on the routine working agendas of both the WSAs and DWAF regions. There is a sense that the national strategies for WC/DM that are in place are appreciated and that different sector partners have access to information, though widespread implementation and enforcement of WC/DM has not been achieved to an acceptable degree (59.5% of WSAs reported that they are struggling to implement WC/DM).

M i d - T e r m R e v i e w o f M a s i b a m b a n e I I I : A p r i l 2 0 0 7 – S e p t e m b e r 2 0 0 8
O v e r v i e w R e p o r t p.44
Compliance monitoring and enforcement strategy developed and implemented (KPI 9.3) The national strategy is in place and this component of the scorecard has been largely achieved and scores well. However, implementation itself scores weakly because of the current scale of the response and size of the Compliance Monitoring and Enforcement (CME) unit at present. Despite the enthusiasm of the national CME unit and de-facto support from the regions for regional expansion, national coverage is widely agreed to be thin with limited funding available, and with low numbers of dedicated CME personnel. Percentage of Irrigation Boards transformed to Water User Associations (KPI 9.4) Transformation of existing Irrigation Boards (IBs) is the focus of this KPI and while the basis for evaluation therefore addresses this IB transformation element alone, discussion and feedback from the mid-term evaluation extends to the formation of new Water User Associations (WUAs) as well. Transformation of Irrigation Boards has been substantially successful in terms of numbers of IBs transformed -- to date 46 Irrigation Boards have been transformed into Water User Associations across the 9 provinces and a further 34 WUAs have been established. This represents good progress against the KPI target on a numbers count but the meaningful participation of new PDI members remains limited and true transformation (i.e. meaningful participation and empowerment) remains questionable. Interviews with selected WUAs (transformed IBs) showed that they have embraced the intentions of the transformation process and routinely make an effort to include previously disadvantaged farmers, women and local government representatives as required by policy. DWAF has provided guidance in the composition of the new WUA structures across the country, but meaningful participation of new members is still widely perceived to be lacking. Thus on the first count, the transformation process has been effective in that 80 IBs have undergone the process. On the second item covering active participation of new PDI members, substantial challenges remain in that participating members on the new WUAs (i.e. transformed IBs) often have limited exposure to water issues, technical content, jargon and implications. However, many of those interviewed were of the opinion that by persevering with the process, capacity will develop. Resource poor farmers established and developed to promote equitable and sustainable water supply (KPI 9.5) The DWAF subsidy makes provision for six categories of financial support to resource poor farmers (RPFs), most of these linked directly to irrigation infrastructure (bulk water supply to field edge), operations and maintenance subsidy (full subsidy to zero over five years), and also for support to food-producers using rainwater harvesting approaches. Applications for the subsidy are meant to be directed to the DWAF HO, after approval by the Provincial Coordinating Committee for Agricultural Water (CCAW). The DWAF effort to support resource poor farmers in the reporting period of this mid-term review was severely curtailed by the moratorium passed by the former DG in 2007, which instructed that no subsidy payments from the DWAF Resource Poor Subsidy would be made until missing regulations were developed and promulgated. The subsidy had been in effect for some years prior to this and disbursements had routinely been made up until the moratorium was declared. After the moratorium was declared, the regulations were formulated during 2007 and were passed in January 2008, resulting in more than 1 year where allocated government funds available for resource-poor farmers were locked-up by administrative processes and were

M i d - T e r m R e v i e w o f M a s i b a m b a n e I I I : A p r i l 2 0 0 7 – S e p t e m b e r 2 0 0 8
O v e r v i e w R e p o r t p.45
not used. As a result the entire subsidy went practically unspent during the reporting period of this mid-term evaluation. In addition to the temporary freeze on disbursements from the subsidy, a major limitation is also experienced on the processing of applications at DWAF HO. Presently only one person at DWAF HO has the responsibility of dealing with the subsidy applications from the whole country, and as a result there is reportedly a backlog of some 2 years on the processing of applications. This staffing situation is untenable if the intentions of the subsidy as set out in the Policy on Resource Poor Farmers and the supporting regulations are to be put into effect. The personnel limitations present a key blockage to ensuring that the subsidy is made available to those resource poor farmers that the subsidy is intended to support. However, at food-gardening level and particularly in relation to the subsidy for rainwater harvesting, DWAF has made remarkable progress and taken a lead role in driving this element, with benefits extending to improved water availability for poor households, improved nutritional security and potentially significant impact on women and households with HIV and AIDS. This marked and encouraging improvement is largely as result of DWAF efforts which must be highlighted and commended. The rainwater harvesting and home-food production pilot programme took place in 2006 and after the delays due to the moratorium while the regulations were finalized in 2007, is currently underway in the second (expansion) phase. This phase commenced in early 2008 with financial and contractual processes and moved into full-scale implementation in late 2008, early 2009. The DWAF subsidy for this element has been channelled through the Independent Development Trust to a set of approved implementers working with rural food producers in five provinces. Progress was therefore achieved in setting up the DWAF Rainwater Harvesting support process during the reporting process and this has set the scene for rapid implementation in the second half of the MSB III duration. The expansion phase targets more than 600 homestead food-producers to benefit from the subsidy during MSB III. Thus the planning and preparation for this element has taken place during the mid-term evaluation reporting period (i.e. 18 months up to September 2008), but the actual implementation (presently underway at the time of writing of this report) has taken place after the mid-term evaluation reporting period.
4.3 Enhanced Role of Civil Society Organisations (CSOs)
4.3.1 Relevance
It is generally accepted that CSO involvement is considered valuable and relevant to service delivery at all levels of government. Because of their proximity to communities they are considered the eyes and ears on the ground. Local government sees huge scope for CSO involvement mainly in Local Economic Development (LED) and health issues as well as general water management. MSB III continues to embark on a process of advocacy and marketing the value of CSO participation so stakeholders will recognize CSO as a resource and partner in service delivery and create space for their participation. There has been significant CSO training and support through the Masibambane CSO Capacity Building Programme, the vehicle to assist CSO develop the skills they need to be participants in the water sector.

M i d - T e r m R e v i e w o f M a s i b a m b a n e I I I : A p r i l 2 0 0 7 – S e p t e m b e r 2 0 0 8
O v e r v i e w R e p o r t p.46
4.3.2 Effectiveness
Advocacy, lobbying and communication programme developed and rolled-out (KPI 10.1); CSO capacity building (KPI 10.2); and Involving Communities in Water Resources Management (KPI 10.3) Essentially, the goal is to ensure the involvement of community-based organizations in both new water and sanitation projects, as well as in the operation and maintenance phase of schemes. The specific target goals for the period under review were the following:
▪ National workshops to be facilitated for provincial committee members. All nine provincial committees to be actively engaged and municipalities made aware of CSO capabilities;
▪ 8 CSOs to be accredited, and Monitoring and Evaluation (M&E) training to be provided for the 9 provincial committees;
▪ 10 CSOs to be trained in Water Resource Management (WRM). Evidence from the WSA survey depicts that less than half (43%) of the WSAs surveyed work with CSOs (Figure 7), thus suggesting that much work is still required to ensure that all WSAs work with CSOs.
Figure 7: Number of WSAs that work with CSOs (Source: WSA survey)

M i d - T e r m R e v i e w o f M a s i b a m b a n e I I I : A p r i l 2 0 0 7 – S e p t e m b e r 2 0 0 8
O v e r v i e w R e p o r t p.47
Figure 8: What roles do CSO’s perform and how effective, as rated by WSA managers (Source: WSA Survey).
Experiences of WSAs with CSOs has been mixed (Figure 8), with some WSA managers being very positive about how effective CSOs are, whereas other managers have not had the same positive experience. The participation by CSOs in consultative forums received the highest rating (72% of WSA agreed that CSOs were effective in this role), followed by the role CSOs play in mentoring the implementation of projects (48% of WSAs agreed with this). However, nearly two out of every three WSA managers (60%) reported that CSOs were ineffective in the implementation of projects on behalf of municipalities. However, it is likely that the perception amongst WSA managers will change as initiatives by MSB begin to take effect. In terms of KPI 10.1: Advocacy, lobbying and communication programme developed and rolled-out, the following achievements have been recorded by DWAF as part of its Assessment for the Release of the First Variable Tranche of Funding 2007/2008:
▪ An Implementing Agent (IA), has been appointed to drive and coordinate the CSO capacity building programme;
▪ The five-year Business Plan for CSOs was finalised through engagements with CSOs such as the Water Caucus14 and Mvula Trust. Its implementation is expected to begin in the 2008/9 financial year;
▪ CSO advocacy strategy has been developed. This too was a product of a full consultation process. It will be rolled out in the 2008/09 financial year;
▪ CSO inputs have been incorporated into DWAF WS Regulation strategy;
14 Since the ending of MSB II, and influenced by the MSB II Final Evaluation, the sector has provided effective support to the
Water Caucus. Yet another example of MSB internalising lessons learnt and adapting strategies accordingly.

M i d - T e r m R e v i e w o f M a s i b a m b a n e I I I : A p r i l 2 0 0 7 – S e p t e m b e r 2 0 0 8
O v e r v i e w R e p o r t p.48
▪ A national CSO knowledge sharing workshop was held where CSOs from various provinces participated;
▪ A CSO was incorporated into the National WS Regulatory Strategy Task Team; ▪ In the Western Cape, 30 WSA advocacy and communication plans have been developed
and rolled out; ▪ In Mpumalanga, CSOs were involved in advocacy in 3 WSAs; ▪ In the Free State, CSOs have been involved in advocacy at 20 WSAs; ▪ In the Northern Cape the CSO database was rolled out to all local municipalities; ▪ In KwaZulu Natal, Eastern Cape, North West, Limpopo and Gauteng advocacy strategies
are in various stages of development and implementation. There has also been active participation and engagement of CSOs in the development of the Water Services Regulation Strategy, Africa Conference and Water for Growth and Development process. Through the Masibambane CSO Capacity Building Programme, MSB III continues to address skills shortages within CSOs involved in the service delivery of water as per KPI 10.2 Capacity Building. There has been significant CSO training and support as reported by DWAF in its Assessment for the Release of the First Variable Tranche of Funding 2007/2008:
▪ 30 CSOs trained and capacitated in the Free State; ▪ 18 CSOs trained and capacitated in Limpopo on leadership, computer literacy, facilitation,
tendering and resource mobilization, and advocacy and lobbying; ▪ 5 CSOs trained and capacitated in Gauteng (in Gauteng CSOs have been involved in the
river health programme, concentrating on pollution of rivers by industries and informal settlements on three rivers; CSOs have also been involved in HIV/AIDS mainstreaming projects at various municipalities);
▪ 19 CSOs trained by Mvula Trust on Health and Hygiene practice through sanitation projects in Gauteng.
Further training and capacity building inputs include the following:
▪ Mvula has offered limited training on M&E with respect to rainwater harvesting and catchment management processes in the Inkomati area;
▪ In the North West, training focused on capacity building of participants and maintaining healthy relationships with the municipality;
▪ Through SANGOCO (North West), 24 CSOs participated in the CSO capacity enhancement programme.
Figure 9/…

M i d - T e r m R e v i e w o f M a s i b a m b a n e I I I : A p r i l 2 0 0 7 – S e p t e m b e r 2 0 0 8
O v e r v i e w R e p o r t p.49
Figure 9: Challenges cited by WSA managers, when asked “What is the one main challenge your MUNICIPALITY faces when working with CSOs” (Source: WSA Survey)
Figure 9 illustrates that more than half (56%) of the WSA mangers that work with CSOs found no real challenge when working with CSOs. Common challenges included the perception amongst WSA managers that CSOs do not have the necessary skills (cited by 20% of WSA managers); that CSOs are poorly managed (14%); and that there were insufficient resources for CSOs (10%).
Figure 10: The main benefits that WSA Managers perceive from working with CSOs (Source: WSA Survey)

M i d - T e r m R e v i e w o f M a s i b a m b a n e I I I : A p r i l 2 0 0 7 – S e p t e m b e r 2 0 0 8
O v e r v i e w R e p o r t p.50
In Figure 10 it can be seen that one in three (36%) of WSA managers who work with CSOs believe that the greatest benefit from working with CSOs is that they are well connected with the community. Other benefits identified included that CSOs “have the appropriate skills” (16%), and that they are “equipped to do the job at hand” (12%). One in five WSA managers (22%) were, however, of the opinion that they “did not encounter any benefits” when they worked with CSOs. Other evidence found by the MTR that the relationship on the ground between officials and CSOs was strong included:
▪ A reported increase in the number of CSOs involved in water projects and water resource management. In provinces such as Western Cape, Limpopo and Eastern Cape, the number of CSOs participating in the water sector has increased.
▪ CSOs are participating in water consultative bodies and other relevant levels including provincial forums.
Moreover, many WSAs have acknowledged that support for direct engagement with CSOs has allowed them the opportunity to deal with their fears regarding CSO capacity and capabilities and to appreciate the standpoint of CSOs.
4.4 Strengthening of Sector Collaboration
4.4.1 Relevance
Collaboration is not an end itself, but a means to an end. In the context of the water sector, collaboration is in support of (but not limited to) leadership, policy (formulation, monitoring and review), planning and budgeting, lesson learning, regulation and implementation of programmes. The Strategic Framework for Water Services (SFWS) outlines the constitutional principle of cooperative governance to which all spheres of government should adhere. The strategic aims of the Intergovernmental Relations (IGR) Framework Act are to promote and facilitate cooperative decision making; coordinate and align priorities, budgets, policies and activities across interrelated functions and sectors; ensure a smooth flow of information within government, and between government and communities, with a view to enhancing the implementation of policy and programmes; prevent and resolve conflict. The IGR FA provides for the establishment of intergovernmental relations structures at municipal, provincial, and national levels. At a national level, the President’s Coordinating Committee is central to national coordination, with possibilities of setting up function-specific forums and technical committees. A similar arrangement is in place in provinces, with the Premier’s Intergovernmental forum being central for provincial coordination. The water sector forums in provinces are water-specific forums feeding into the Provincial Growth and Development Plans (PGDPs). At a municipal level similar structures are in place that link politicians and officials. The need for intergovernmental relations at an international level is motivated by shared watercourses and aquifers with high spatial temporal variability. The strategic objectives of the Regional Sector Action Plans (RSAPs) include the following:
▪ Maintaining and sustaining an enabling environment for regional water resources development and management;
▪ Providing a framework for sustainable, effective and efficient planning and management of shared river basins at regional and related national levels;

M i d - T e r m R e v i e w o f M a s i b a m b a n e I I I : A p r i l 2 0 0 7 – S e p t e m b e r 2 0 0 8
O v e r v i e w R e p o r t p.51
▪ Establishing supporting mechanisms for strategic infrastructure development for regional integration and development, and poverty alleviation;
▪ Developing, promoting and facilitating best practices regarding effective participation by various individual and institutional stakeholders in water resource development and management, including women, youth and other disadvantaged groups.
A key feature of sector collaboration is the knowledge-sharing that occurs at all different levels within the sector. Research within the sector has in fact shown that lesson-sharing has become a major reason for collaboration by sector role-players. This occurs not only formally through the different forums, but also through the comprehensive collection, management and distribution of relevant data in innovative and interactive ways by WIN-SA. Challenges nevertheless remain, as those within Masibambane must find the means to ensure that knowledge-sharing also reaches ground level, particularly at local municipality level. The SFWS commits DWAF to seek to learn and share knowledge and experiences related to the development of water services policies and strategies in Africa and also commits to the principle of sharing water with neighbouring states. In an attempt to translate the policy prescript to reality, the then Minister, Ms Lindiwe Hendricks, at the Launch of MSB III promised “to extend the Water Information Network (WIN-SA) to SADC, NEPAD and other partners in delivering MDGs in Africa”.15
4.4.2 Effectiveness
Sustainable collaborative structures are in place and are supported by regular, inclusive strategic planning processes (KPI 11.1) Eight out of the nine water sector forums have been reconfigured in line with the IGR Framework Act. Participation by sector partners in the regional forums varies from region to region, and is an issue that requires more attention in almost all regions. Since 2007 DWAF has embarked on a process of reconfiguration of sector collaboration structures with a focus on both national and regional structures. As part of this process, the Water Services Sector Leadership Group (WSLG) and the Masibambane Coordinating Committee (MCC) at a national level have also been through significant realignment in line with the IGR. The WSLG has been reconfigured to include other DGs from other sector Departments. The first meeting of the reconfigured WSLG had nearly 100% attendance. While attendance is not the only measure of effectiveness, it is a necessary condition. Seven of the nine technical committees of the reconfigured WSLG are functioning effectively. Of those that are normally invited to participate in the provincial forums that participated in the survey, attendance by sector partners varied widely (Figure 11), DWAF (92%), WSPs (78%), Water boards (67%) were rated highly on regular attendance. Municipal officials (61%), Councillors (57%) and SALGA (51%) were all given what could be considered to be mediocre scores. Among those who were scored low on attendance are DPLG (46%), Department of Health (11%), Department of Environmental Affairs, Tourism (11%), Department of Education (9%), Department of Agriculture (7%), CSOs (7%). While these scores do not reflect the variations of the different provinces, the results show that attendance of provincial forums by sector partners is a matter that requires attention. While attendance is not the only measure by which provincial forums can be measured, it is the baseline where collaboration starts.
15 Speech by Mrs LB Hendricks, Minister of Water Affairs and Forestry, Launch of Masibambane III, Gallagher Estate, Midrand,
Gauteng, 17 March 2008

M i d - T e r m R e v i e w o f M a s i b a m b a n e I I I : A p r i l 2 0 0 7 – S e p t e m b e r 2 0 0 8
O v e r v i e w R e p o r t p.52
Figure 11: Who attends water sector meetings and how regularly they attend them, as perceived by stakeholders in the Water Sector (Source: Stakeholder Survey).
Provincial Water Sector Plans developed and reviewed annually (KPI 11.2) Provincial Water Sector Plans (PWSPs) are in place in all nine regions and at different stages of review. In regions where forums are not fully functional PWSPs are done by DWAF through direct consultation with sector players on a one-on-one basis. The nature as well as the extent of collaboration in the development of PWSPs varies from region to region. Only four regions (Eastern Cape, Western Cape, Mpumalanga and North West) reported on the collaborative process used in formulation.16 National Water Sector Plan developed and reviewed annually (KPI 11.3) The National Water Sector Plan is in place and was developed with the involvement of national water sector partners.17 Cooperation of Integrated Water Resources Management in Africa, in support of NEPAD (KPI 11.4) The participation of DWAF in SADEC and other bilateral country-to-country technical committees is negatively impacted upon by a general problem of shortage and continued loss of technical expertise within DWAF. As part of South Africa’s contribution to the SADEC agenda of regional integration and economic growth, SADEC is involved in a regional technical skills support programme. Lesson-learning and sharing (documentation of regional experiences) is a significant element of the collaboration. The process of engaging with WIN-SA is at conceptualisation stage, with the first meeting scheduled for the 9th of April 2009.
16 Consolidated DWAF Regional Report, 4th Quarter, 2007/2008; Water Services KFA 14.4. 17 DWAF, 2008, Masibambane III Programme (Water for Growth and Development), Assessment for the Release of the First
Variable Tranche of Funding 2007/2008.

M i d - T e r m R e v i e w o f M a s i b a m b a n e I I I : A p r i l 2 0 0 7 – S e p t e m b e r 2 0 0 8
O v e r v i e w R e p o r t p.53
4.5 The percentage of WSA’s implementing a Drinking Water Quality Management System (KPI 12.1)
4.5.1 Relevance
Drinking water quality (DWQ) is a high profile issue because it has a direct effect on the health, and sometimes lives, of consumers. Failures to provide adequate drinking water quality also attract media attention. In this context, DWAF has put an emphasis on ensuring adequate DWQ. The WSA survey found water quality to be the most commonly cited area in which WSA managers believed their organisations to be regulated, and the area in which they believed they were most compliant. DWQ monitoring is conducted in most municipalities and most WSAs are reporting on DWQ using the electronic water quality management system (eWQMS). While sampling and reporting on DWQ is largely taking place, the following challenges exist:
▪ Not all WSAs have the laboratory capacity to test DWQ samples. Testing, which is costly, must then be contracted out;
▪ In the cases of poor results, appropriate steps and actions are not necessarily taken. This seems to be the result of the following: lack of capacity; confusion over who is responsible; and/or lack of cooperation and communication within these WSAs;
▪ Also related is the quality of raw water: sewage effluent is often not monitored and/or there are waste water treatment works with severe problems.
DWAF has noted the challenges related to drinking water quality and identified the following relevant responses for dealing with WSAs that do not ensure adequate DWQ: investigate the options for taking over water services functions when a quick response is required; take action against non-performers; use Water Boards where appropriate; implement urgent recruitment and training programmes; and investigate ways to incentivise sufficient budgeting for DWQ management and monitoring (An Immediate Response to the Challenges Facing the Water Sector (June 2008)).
4.5.2 Effectiveness
Ensuring safe drinking water at scheme level is a critical area for support. The management of DWQ emerged as the most commonly cited area of support required that WSA managers identified independently during the WSA survey conducted as part of this mid-term review. Additionally, 42% of those surveyed agreed that providing good quality water is a challenge. DWAF’s Water Services Regulatory Performance Management System (RPMS) tracks 11 KPIs, including DWQ. DWQ is one of 3 of these KPIs that are rated as non-compliant (RPMS, online, March 2009). In October 2008, it was recorded that 3,538 sites were monitored nationally: 236 sites were non-compliant and posed health related DWQ threats (Quarterly Report: Consolidated report Oct – Dec 2008). DWQ has been identified as one of the top 3 KPAs in the WSP Support Implementation Plan (February 2008). The rollout of this plan is critical for various areas. If effectively implemented, it could be instrumental in improving the management of drinking water quality, as well as in improving operations and maintenance overall.

M i d - T e r m R e v i e w o f M a s i b a m b a n e I I I : A p r i l 2 0 0 7 – S e p t e m b e r 2 0 0 8
O v e r v i e w R e p o r t p.54
4.6 DWAF reports annually against all 19 target areas outlined in the Strategic
Framework for water services (KPI 12.2)
4.6.1 Relevance
There is no doubt that the sector reporting process established by DWAF is directly relevant to the needs of the sector. As the leading policy maker in the sector, DWAF has the appropriate policies in place that defines its mandate in terms of reporting. The system created provides information that allows the sector to:
▪ Monitor the current needs of DWAF in accordance with its water sector mandate; ▪ Monitor the future needs of DWAF in line with its mandate; ▪ Monitor regulations and compliance in line with its Regulator mandate; and ▪ Ensures that DWAF has information to report annually against all the targets.
4.6.2 Effectiveness
Thus whilst WSAs are largely satisfied with the system, it does highlight a critical concern of the M&E Unit within DWAF, namely that much of the data which they report on is not actually gathered by DWAF. DWAF, as the sector leader, is expected to drive the reporting process within the sector, yet much of the data they report on is not actually directly under their control. The M&E Unit, who do an “impressive job” in compiling the reports are woefully under-resourced and are simply not in a position to validate the data coming in.
Figure 12: KPIs measured by WSA managers (Source: WSA Survey)

M i d - T e r m R e v i e w o f M a s i b a m b a n e I I I : A p r i l 2 0 0 7 – S e p t e m b e r 2 0 0 8
O v e r v i e w R e p o r t p.55
Figure 12 illustrates this problem. When prompted, most WSA managers will admit that they measure many of the KPIs they are meant to be measuring, nevertheless only two out of three (62%) said yes initially when asked whether they measure the water quality of the services provided, and less than half (42%) said yes initially when asked whether they measure the quantity and quality of water discharged. The suggestion here is that measuring KPIs is not done automatically by all WSAs, but that in most instances they do so when prompted by DWAF. It is, for instance, well known in the sector that there have been occasions when different departments have reported on ostensibly the same issue, over the same period of time, very different data. Whilst a commission, which is using the expertise of National Treasury and Stats SA, is currently looking at means to reconcile different data sources, it does highlight the challenges faced by the M&E Unit within DWAF in trying to provide continuous up-to-date data for the sector. Moreover, whilst WSDP reporting has been enhanced to include other information that was not there before (e.g. reporting on water services audit information), this information is passed on to the regulator to feed into the Regulation Performance Management System and thus reported at national level without an opportunity to independently verify the accuracy of the data. DWAF itself is certainly conversant with these findings, and thus it is appropriate to end this section with what they have identified as the means to strengthen M,E & R within the sector:
Sector collaboration on M&E&R is not “mainstreamed” and should be promoted to facilitate cooperative development of M&E&R frameworks between sector departments. M&E&R systems must be designed to ensure consistent and accurate measurement of KPIs, regular information flow, and common definition of indicators. M&E&R co-ordinators to be deployed to DWAF regions. Staff needs to be appropriately trained in the regions and dedicated to monitor, evaluate and report on water and sanitation project implementation…There must be greater alignment between the reporting on the DWAF Strategic Plan, Regional Operation Plans and Provincial Water Sector Plans.
(DWAF, Consolidated WS Report, 3rd Quarter, 2008: 203-204)
4.7 Cross-cutting Issues
4.7.1 Environment
4.7.1.1. Relevance
Environmental management as a cross cutter has a foundation in excellent national legislation and policy. It is extremely relevant in the context of Water for Growth and Development, and is well entrenched in the draft WfG&D framework. The framework clearly recognizes that growing economic and social development demands must be supplied by a finite resource, which is ecosystem based. The effective functioning of this fairly resilient resource system is being impacted upon in an exponential manner through increasing growth activities, affecting quantity and quality of supply. Poor catchment management (mainly through contamination and reduced recharge / absorption capacity) is constraining the ability of the system to deliver sustainably. This factor has been identified globally as a major development constraint, and is reflected in the findings of this review, which included a snapshot survey of challenges facing WSAs in South Africa.

M i d - T e r m R e v i e w o f M a s i b a m b a n e I I I : A p r i l 2 0 0 7 – S e p t e m b e r 2 0 0 8
O v e r v i e w R e p o r t p.56
Although DWAF has some excellent strategic frameworks and environmental management toolkits, there is no accepted strategy for mainstreaming environment within MSB III itself. A concise Draft Strategic Framework for mainstreaming Environmental Management (March 2008) was funded through the MSB III programme, but has not been adopted by DWAF. The relevance of this draft strategy is limited to providing clarity on the policy framework, and bears little reference to addressing the real zones of impact at local level through effective mechanisms, such as support for local WSAs. DWAF is going back to the drawing board and refocusing its efforts on finding means of supporting the identified environmental challenges at municipal level where much of the negative impacts on sustainability of supply appear to be occurring. The latter is explored in more detail in the background paper on Environment. Mainstreaming of environment in the MSB programme is highly relevant, indeed essential, if the DWAF mandate to ensure water security for the nation is to be fulfilled. The actual objectives of environment as a cross cutter are not outlined in any available documentation, but are strongly alluded to in the draft WfG&D framework. This makes mainstreaming difficult to assess and monitor, in the absence of any structured objectives. 4.7.1.2. Effectiveness
Related activities, although not officially listed as environmental management activities under the MSB III budget, have under-spending across the board (e.g. sanitation awareness programmes), especially with regard to public and service provider awareness raising. This is a clear reflection of how mainstreaming of environment has failed: impacts on environment are generally given little credence in planning, as they are not immediately measurable or visible. Institutionalising of environmental management was a key recommendation of the MSB II review, but this has not been effectively carried out beyond the formation of a draft strategic framework, which has since been shelved. There is observed improvement since MSB II in regional and local collaboration between the sector leader and WSPs through a support and regulatory role by the former for the latter. The concept of payment for ecosystem services has been touched on in the WfG&D programme strategy, but not highlighted or implemented effectively, being a fairly new concept in the country. The concept is viewed as a fundamental environmental management requirement for the water sector to effectively deliver on its mandate in a sustainable manner.
4.7.2 Gender
4.7.2.1. Relevance
The National Implementation Strategy and Action Plan (2006-2010) is the framework that is in place and used as a guideline to mainstream gender in the water sector. The policy is used as a guideline by provinces in drawing their own guidelines. In this review we found that gender mainstreaming continues to be a challenge within the sector, as well as within DWAF. In-depth interviews indicate that the concept is still misunderstood and usually implementation slants more towards women empowerment. An area of concern also raised is that senior managers are not seen as playing a supportive role. Interestingly, these are the same challenges that came out of the summative evaluation of MSB II conducted in 2007. The challenge in implementing the strategy for DWAF relates to it developing the policy and then having to rely on the other sector partners to implement.

M i d - T e r m R e v i e w o f M a s i b a m b a n e I I I : A p r i l 2 0 0 7 – S e p t e m b e r 2 0 0 8
O v e r v i e w R e p o r t p.57
DWAF has a gender directorate. The gender directorate deals with policy, programme and project support. The directorate has very little to do with Masibambane III and is rather an internal DWAF structure. Interviews with the directorate show that it is important for the DWAF to plan its business and activities by integrating gender mainstreaming. Respondents indicated that in terms of DWAF, women make up a significant percentage of the senior management, however, caution was also given in that whilst taking women empowerment issues to heart, men should not be neglected. A suggestion was made that perhaps gender mainstreaming should form part of people’s performance contract. Other suggestions centered around the importance of targeted gender mainstreaming training for senior managers. The social development support unit deals with Masibambane III and is responsible for providing guidelines on issues of gender mainstreaming within the sector. As mentioned above, the National Implementation Strategy and Action Plan (2006-2010) is the guideline that is used for providing guidance on gender mainstreaming. In-depth interviews conducted with DWAF show that whilst the document is in place, it is not easy to translate into action, particularly at WSA level. Some respondents indicated that the guideline does not provide practical steps on how to mainstream gender, particularly at WSA level. The strategy and action plan points more to the bottlenecks around gender mainstreaming, and less on practical implementation. Suggestions were made that perhaps it is time to review the strategy and interface issues of water services and water resources since the current strategy is only focusing on water. The suggestion was also made in light of the WfG&D as an approach that is gaining ground i.e. gender mainstreaming should be contextualized within the context of water for growth and development. 4.7.2.2. Effectiveness
Issues of water affect women and men differently. Women and girl children are affected in a sense that traditionally they take care of their families. This may change with the impact of HIV/AIDS on communities, with boy children having to assume more responsibilities. The MTR team did not speak to all the provinces to obtain information on how provinces fared with regards to gender mainstreaming in the review period under assessment. For this review we managed to speak to the following provinces: Limpopo; KwaZulu Natal; Western Cape; Gauteng. We unfortunately could not speak to the provinces due to the challenges of finding the respondents. The picture at provincial level differs from province to province. Of the Masibambane coordinators that we spoke to, Limpopo indicated that they have developed a gender mainstreaming guideline that they have shared with local municipalities to use when they provide a service. They seemed to think that more ought to be done with regards gender mainstreaming, especially in ensuring that the water sector understands the concept. The Masibambane coordinator also indicated that they had trained gender-focal people in some of the municipalities. Relevant training was also provided to some project managers within WSAs since it is project managers that implement projects. The Masibambane coordinator also indicated that they have intensified their advocacy efforts to influence the process of including gender mainstreaming at municipal levels. Both KwaZulu-Natal and the Western Cape indicated that they had not developed a gender mainstreaming guideline. In KwaZulu-Natal we were told that funding had not been provided for this and so they had no activities to report on with regards gender mainstreaming during the period of April 2007 to September 2008. The Western Cape also indicated that there was

M i d - T e r m R e v i e w o f M a s i b a m b a n e I I I : A p r i l 2 0 0 7 – S e p t e m b e r 2 0 0 8
O v e r v i e w R e p o r t p.58
no budget to work from in this regard. Both of these provinces also stated that a lack of guidelines for implementation of gender mainstreaming was also a problem. Gauteng has also not developed its own guideline. The Gauteng representative mentioned that they have taken a project approach to try and address the issues of gender mainstreaming. For example, they have initiated a project in Evaton where they are embedding all the cross-cutting issues. In this project there are about ten women and four men who are taking care of orphans affected and infected by HIV/AIDS. The project was provided with a borehole and has since been expanded to incorporate a vegetable garden as well as a crèche. While no information is available for the other five provinces (North West; Northern Cape; Free State; Mpumalanga and the Eastern Cape), the results of this review indicate that the provincial picture is an unbalanced one. It is cause for concern that only one province has a working document in place for use as a gender mainstreaming guideline. This is borne out in Figure 13 where one in four (26%) WSA managers reported that they have programmes in place to ensure equal opportunities and access to water for women in their municipality.
Figure 13: Number of WSAs who have programmes that ensure equal opportunities and access to water resources for women in their municipality (Source: WSA Survey)
When asked what was the nature of the programme being conducted by their municipality to promote gender mainstreaming, the majority of WSA managers (52%) where gender programmes were being run stated that employing more women was the focus of their programme. Other initiatives included involving women in projects (22%) and promoting gender specific projects such as the establishment of vegetable gardens (13%).

M i d - T e r m R e v i e w o f M a s i b a m b a n e I I I : A p r i l 2 0 0 7 – S e p t e m b e r 2 0 0 8
O v e r v i e w R e p o r t p.59
Figure 14: What done by WSAs to ensure equal access for women (Source: WSA Survey)
Whilst challenges clearly remain at WSA level, there is a strong sense at National level that the sector must:
Move beyond developing and reviewing strategies… we always do that. We now need practical projects on the ground. We need to ensure that poor women have access to services (we need to monitor all of that such as the times it takes for women to get water in the rural areas and so on). At the strategic level we need to address and monitor issues such as, for women in senior positions, how do they relate to men in the sector, are there support structures, how do we build women in water resources, engineering and so on.
(Thoko Sigwaza, personal communication)
4.7.3 HIV and AIDS
4.7.3.1. Relevance
The Strategic Framework for Mainstreaming HIV and AIDS in the Water Sector has been developed and is currently awaiting the DG’s signature. The framework was developed by DWAF’s policy and strategy directorate together with other sectors: DOH, SALGA, dplg, SAAWU and civil society organizations. The framework is well written and includes key objectives for mainstreaming HIV and AIDS in the Water sector as follows:
▪ To ensure continued and improved delivery of water services delivery by the relevant authorities and service providers in the context of the impact of HIV and AIDS on water institutions;

M i d - T e r m R e v i e w o f M a s i b a m b a n e I I I : A p r i l 2 0 0 7 – S e p t e m b e r 2 0 0 8
O v e r v i e w R e p o r t p.60
▪ To assist infected individuals to lead healthy and productive lives through the provision of safe, reliable, sufficient and affordable water services;
▪ To improve the quality of life and dignity of people living with HIV and AIDS (PLWHA) through the provision of water and sanitation services;
▪ To contribute towards poverty reduction, sustainable livelihoods and a decrease in vulnerability to infection through the provision of basic water services and water for multiple uses;
▪ To contribute to the reduction in the stigma and discrimination attached to HIV and AIDS through the actions of all water institutions;
▪ To provide effective prevention, care and support for Water Sector employees through internal support mechanisms.
4.7.3.2. Effectiveness
The strategy has not been rolled out yet. Sector partners such as DPLG and SALGA already have their working documents, for example the handbook on HIV/AIDS launched by DPLG on 2 April 2009, targeting ward councillors. However, the team did find considerable evidence of WSAs addressing the HIV and AIDs crisis.
Figure 15: WSAs who have put mechanisms in place to ensure that their municipality has an HIV and AIDS policy, and the number of WSAs who have received guidance on HIV and AIDS from the Water
Sector (Source: WSA Survey)

M i d - T e r m R e v i e w o f M a s i b a m b a n e I I I : A p r i l 2 0 0 7 – S e p t e m b e r 2 0 0 8
O v e r v i e w R e p o r t p.61
A good example of how the sector is taking a holistic approach to HIV and AIDS and linking it to other key cross–cutters is the project at the Mthonjeni Awareness Centre. By so doing the project addresses prioritized needs of the community and thereby pilots an integrated approach to cross cutting issues such as the following:
▪ HIV and AIDS; ▪ Gender mainstreaming; ▪ Youth development; ▪ Appropriate technology; ▪ Environmental management.
Figure 15 illustrates that more than half the municipalities (55%) reported that they have an HIV and AIDS policy, and a similar number (52%) had developed such a policy as a result of input received from partners in the sector. Figure 16 demonstrates that many of these policies appear to be fairly nuanced as of those who have an HIV and AIDS policy, 85% include within this a policy on providing additional water or water closer to homes where those suffering from HIV and AIDS are being cared for.
Figure 16: Number of WSAs who have a policy on providing additional water or water closer to homes where those suffering from HIV and AIDS are being cared for (Source: WSA Survey).

M i d - T e r m R e v i e w o f M a s i b a m b a n e I I I : A p r i l 2 0 0 7 – S e p t e m b e r 2 0 0 8
O v e r v i e w R e p o r t p.62
4.7.4 Appropriate Technology
4.7.4.1. Relevance
The need to consider appropriate technology (AT) solutions in the drive to supply water services to all in South Africa is identified in the Strategic Framework for Water Services and is generally acknowledged within the sector and was identified as a key outcome from the 2008 Municipal Indaba. The draft strategy document is the key planning document that provides direction of the AT cross cutter and the strategy must still be reviewed and adopted by the sector urgently so it can be implemented and translated into practical useful outputs. 4.7.4.2. Effectiveness
While very little implementation took place during the reporting period, since then progress has been made in appointing a champion to drive the mainstreaming of AT and a draft strategy has been produced to guide implementation.
4.8 DWAF Sector Leadership
4.8.1 Programme Management
Figure 17: Rating of DWAF leadership of the sector by stakeholders (Source: Stakeholder Survey)
Figure 17 provides a powerful visual depiction of the esteem with which stakeholders in the sector view the leadership of DWAF. More than two thirds (69% of the 100 stakeholders who were surveyed) rated the leadership as good, a further 10% rated the leadership as excellent. This is a positive finding. The in-depth interviews conducted paint a slightly less flattering picture. Common concerns included:

M i d - T e r m R e v i e w o f M a s i b a m b a n e I I I : A p r i l 2 0 0 7 – S e p t e m b e r 2 0 0 8
O v e r v i e w R e p o r t p.63
▪ “DWAF has increasingly lost its identity as an organisation, lacking a crystal vision and strategies to get there”;
▪ “DWAF tries to be a Father Christmas to everybody. When a sector partner is not doing what it is meant to be doing, DWAF negates its role and throws money at the problem…in its effort to maintain good relations, DWAF lacks the guts to play its regulatory function”;
▪ “DWAF is over-reliant on consultants to do the work it should be doing… DWAF uses money to do various things which should be done internally (writing quarterly reports, project management, communication) .. a manifestation of this problem is that every 2nd person one comes across in the DWAF passages is a consultant, … Senior management have gotten used to using consultants for everything, to the extent that they have not been able to enhance their skills (basic management skills, report writing, etc.) … People do not think twice before hiring a consultant, partly because of the history and culture of the organisation”;
▪ “Considerable institutional memory has been lost recently, and many are still finding their feet to be truly effective”.
▪ “Despite the FA having been carefully drawn up to emphasise the key issues that MSB should focus upon, there seems to be little evidence that DWAF is providing strategic leadership on these issues…. Who within DWAF is thinking strategically about these issues? For instance, issues such as alternative funding mechanisms, asset management and CMAs are critical, but who is thinking strategically about these and ensuring that the needs are being strategically addressed?”
However, when speaking to WSA managers who are effectively at the operational side within the water sector, support from DWAF is seen to be both relevant and effective. For instance, when asked about DWAF’s leadership and support in terms of how their municipality implements key sector policies and strategies (Figure 18), three out of four (73%) WSA managers said the support was either good or excellent, with only 10% rating the support as poor.
Figure 18: Rating by WSA Managers of DWAF’s leadership and support in terms of how their municipality implements key sector policies and strategies (Source: WSA Survey)

M i d - T e r m R e v i e w o f M a s i b a m b a n e I I I : A p r i l 2 0 0 7 – S e p t e m b e r 2 0 0 8
O v e r v i e w R e p o r t p.64
To further test the usefulness of the support provided by DWAF, WSA managers were also asked to rate specific types of support, and as Figure 19 illustrates, when WSA managers made use of the support they found it to be either very useful or useful. For instance, of the 60 WSA managers who had participated in a quarterly MSB led provincial forum, more than half (38 WSA managers) had rated it as very useful, a further third (20 managers) had rated it as useful and only 2 had rated it as not useful. A similar pattern can also be found with those WSA managers who have used PSTI (more than 80% had rated it as either useful or very useful), WASH (96% had said it was either useful or very useful), and so on. Figure 19: Rating by WSA managers of specific support initiatives (Source: WSA Survey)
4.9 Financial Analysis
The financial analysis included in the Mid-term Review looks specifically at the expenditure over an 18-month period from April 2007 to September 2008 and is based on the information contained in the database of Masibambane projects supplied by DWAF. While the database contains much information and allows for summarising project expenditure by many different criteria, there are a few relatively minor shortcomings that if addressed could provide an even more powerful project management tool, these are:
▪ The contract information in the database is not comprehensive and as a result it has not been possible to extract the expenditure allocations that have been utilised by DWAF operational expenditure and projects implemented utilising different sector partners, CSO’s, consultants, etc.;
▪ Noting the above, the database does describe the contractual commitment of each project as Business Plan, Tender, or Contractual Commitment. This seems to indicate that all the funds are used to contract NGO’s, sector partners and consultants for project implementation;
▪ The database records of expenditure are not based on a regular time interval, which makes cash flow analysis not possible.

M i d - T e r m R e v i e w o f M a s i b a m b a n e I I I : A p r i l 2 0 0 7 – S e p t e m b e r 2 0 0 8
O v e r v i e w R e p o r t p.65
4.9.1 Regional distribution of expenditure
The provinces incurred just over half of the expenditure (53%), while the remaining 47% was incurred by DWAF head office. Of the expenditure allocated to head office, a significant portion is spent on regional support and where this is recorded in the database it equates to 26% of the head office expenditure. Consequently one can conclude that approximately 65% of expenditure is spent regionally compared with 35% at the DWAF national head office.
Figure 20: Expenditure division between head office and regional projects
The regional distribution of expenditure indicates that significant expenditure was achieved in the priority provinces of Limpopo (R70m) and the Eastern Cape (R52m). Significant funds were also expended in the Northern Cape (R51m), North West (R46m) and Mpumalanga (R33m) while the very low expenditure (and budget) for KwaZulu Natal (R20M) appears to be disproportionate to the needs of the provinces.

M i d - T e r m R e v i e w o f M a s i b a m b a n e I I I : A p r i l 2 0 0 7 – S e p t e m b e r 2 0 0 8
O v e r v i e w R e p o r t p.66
Figure 21: Expenditure by province.
4.9.2 Source of funds
The EU funds accounted for approximately 61% of the expenditure while the remainder of the funds were sourced from Irish, Flemish and Swiss donors as well as the DWAF funds from National Treasury in the proportions shown in Table 16 and Figure 22.
Table 16: Source of funds.
Funding Source Expenditure
(April 07 to Sept 08) Proportion of total expenditure
EU 386,592,938 60.9%
Irish 61,213,059 9.7%
Flemish 8,066,574 1.3%
Swiss 3,500,000 0.6%
DWAF MTEF 174,915,136 27.6%
TOTAL 634,287,707 100.0%

M i d - T e r m R e v i e w o f M a s i b a m b a n e I I I : A p r i l 2 0 0 7 – S e p t e m b e r 2 0 0 8
O v e r v i e w R e p o r t p.67
Figure 22: Sources of funding
4.9.3 Expenditure
Progress with MSB expenditure is lagging, with only 27% of expenditure registered by the end of the first 18-month period. There are a number of contributing factors including the following:
▪ Slow initial start up of the programme; ▪ Time consuming procurement processes; ▪ The inevitable time lag between work being completed, invoiced, paid and recorded on
the system; ▪ The planned programme expenditure is greater in the second and third years.
Table 17: Expenditure Progress by Province.
Province Total 3 year Budget
07/08/09/10Sum Total Expenditure
(April 07 to Sept 08)
Expenditure Progress against
Budget (%)
Eastern Cape 171,285,124 52,274,550 31%
Free State 90,900,000 23,639,783 26%
Gauteng 92,100,000 22,886,667 25%
Kwazulu Natal 60,450,000 20,404,142 34%
Limpopo 252,189,834 69,622,636 28%
Mpumalanga 111,700,000 33,060,167 30%
North West 89,628,532 46,463,230 52%
Northern Cape 181,049,258 51,336,295 28%
Western Cape 179,011,924 18,962,523 11%
Head Office 1,151,115,430 295,637,713 26%
Grand Total 2,379,430,102 634,287,707 27%

M i d - T e r m R e v i e w o f M a s i b a m b a n e I I I : A p r i l 2 0 0 7 – S e p t e m b e r 2 0 0 8
O v e r v i e w R e p o r t p.68
Figure 23: Expenditure against annual budget.
Most provinces have expended between a quarter and a third of their three year budgets, except North West which has already expended half and the Western Cape where only 11% of the budget has been spent.
4.9.4 Expenditure against the 8 Result Areas of the MSB III Financing Agreement
The expenditure per KPI against budget is summarised in the figure below. Sector strengthening accounts for the largest proportion of expenditure at 37% while KPI 10, enhancing the role of CSO’s, accounted for 1.8% of the expenditure.
Figure 24: Expenditure per key performance indicator (KPI).

M i d - T e r m R e v i e w o f M a s i b a m b a n e I I I : A p r i l 2 0 0 7 – S e p t e m b e r 2 0 0 8
O v e r v i e w R e p o r t p.69
4.9.5 Expenditure allocation to cross cutting themes
Within the financial database, project expenditure is allocated to both KPIs and to cross cutters where appropriate. Expenditure against cross cutting themes are shown in Figure 25.
Figure 25: Expenditure per cross cutting theme
Overall the expenditure targets the poorest provinces with the greatest need, except for KwaZulu Natal where relatively little expenditure has been planned or incurred. There has been no expenditure on some KPI’s (KPI 8 for example) and generally the low expenditure corresponds with lack of progress in implementing the KPI’s. However, some of the apparent lack of expenditure can be attributed to projects allocated to the wrong KPI and this should be addressed. It would appear that a large proportion of the funds are expended on outside organisations and consultants providing support to DWAF and other sector partners (especially WSAs) and that the support ranges from specialist expertise to administrative and reporting assistance. It is very important that the programme exit strategy ensures that all critical functions are adequately allocated budgets from other sources. Identification of the critical operational functions currently funded by MSB III and securing treasury allocations for these is already in progress.

M i d - T e r m R e v i e w o f M a s i b a m b a n e I I I : A p r i l 2 0 0 7 – S e p t e m b e r 2 0 0 8
O v e r v i e w R e p o r t p.70
5. Discussion Leadership within the South African water sector is well aware that this country is on the brink of a water crisis. As far back as June 200818 (i.e. within the period of this MTR, April 2007 – September 2008) DWAF presented to cabinet a document which identified the following as areas that required an immediate response, and importantly, outlined the initial steps that should be taken to begin to tackle these challenges. The areas included:
▪ Water infrastructure and universal access; ▪ Compliance and enforcement; ▪ Water quality (raw water and drinking water); ▪ Water conservation and demand management; and ▪ Skills and human resources.
Whilst aspects of these challenges (such as, for instance, the relationship between water as a source of power generation and the ongoing electricity shortage that periodically besets this country) are well beyond the remit of MSB III, it is nevertheless prosaic that the findings of this MTR resonate powerfully with issues already identified by DWAF as critical to the success of the sector. Moreover, they also align neatly with the key result areas identified in the EU Financing Agreement, namely:
1. Stakeholder collaboration; 2. Catchment management agencies; 3. Capacity building of Municipalities; 4. DWAF is a strong, capacitated leader providing policy direction, regulation and support
to the water sector; 5. Civil society organisations (CSOs); 6. Alternative financing mechanisms; 7. Water service providers; 8. Sustainable, ecosystem-based IWRM.
It is also worth remembering that the Summative Evaluation of MSB II found the following:
Overall, MSB II emerges as a robust programme, targeting very poor communities, providing services that have pshycho-social and particularly socio-economic impacts, and is well regarded by WSA and PMU Managers. Integrated WS provision is clearly a critical issue to take up in MSB III. Sanitation is clearly a major challenge. Operations and Maintenance – the cornerstone of sustainability – are widely seen as weak points (2007: 20)
This touches on an important issue (that was also identified during the summative evaluation of MSB II), namely that the sector is extremely good at identifying the key weaknesses in the sector – in fact this level of transparency is seldom witnessed in any other government sector in South Africa – and it is extremely diligent in developing appropriate and relevant strategies, policies and guidelines to shape the response to the challenges that are identified. However, what the sector is not always effective in doing, is implementing the approach it has so carefully
18 DWAF (2008) A Response to the Immediate Challenges Facing the Water Sector, Report to the ASGISA IMC.

M i d - T e r m R e v i e w o f M a s i b a m b a n e I I I : A p r i l 2 0 0 7 – S e p t e m b e r 2 0 0 8
O v e r v i e w R e p o r t p.71
thought through and designed. This is not to imply that MSB is not effective in implementation, far from it, a number of key successes have been identified. Extensive perceptions canvassed across MSB III highlight certain key strengths and weaknesses which the MSB leadership need to urgently give thought to, to ensure that the programme meets the objectives it has set itself. In the Results section of this report, several components of MSB III were identified to be highly successful, namely:
▪ Water for Growth and Development; ▪ Sector Reporting; ▪ Sector Collaboration.
Areas were also identified where there has been good progress, but more attention is still required to ensure the programme delivers what was planned, namely:
▪ Alternative Finance; ▪ Backlogs; ▪ Water Service Authorities; ▪ Water Service Providers; ▪ Integrated Water Resource Management; ▪ Operation and Maintenance; ▪ Civil Society Organisations.
Lastly, there were aspects of MSB III where little progress was witnessed, and attention is therefore urgently required if the stated objectives are to be met in the remainder of the funding period, namely:
▪ Environment; ▪ Appropriate Technology; ▪ CMAs; ▪ Gender.
This section of the report takes each of these components of MSB III and discusses them under the relevant 8 key result areas (KRAs) of the EU Financing Agreement in order to comment on the progress that has been made during the period under review.
5.1 Stakeholder collaboration is in place and focussed on sustainable water management for all South Africans (Key Result Area 1)
Under this KRA, the Financing Agreement specifies that collaborative structures at all levels will be “enlarged to accommodate all relevant stakeholders”; WRM principles will be adopted and implemented; and that these forums will visibly influence the strategic direction of relevant initiatives in the sector. And all of this should be done under the umbrella of the IGR Framework Act. The evidence presented above is fairly convincing that the sector has done well to make this a reality. Stakeholder collaboration is in place, and much of it has been focussed on WRM. In response to the prescripts of the IGR Framework Act, DWAF has developed a manual entitled, Guidelines on practical application of the Intergovernmental Relations Framework Act, 13 of

M i d - T e r m R e v i e w o f M a s i b a m b a n e I I I : A p r i l 2 0 0 7 – S e p t e m b e r 2 0 0 8
O v e r v i e w R e p o r t p.72
2005. In addition, a related manual entitled Selected Best Cases of Best Practice: Promoting Intergovernmental Relations in the Water Sector for DWAF, has also been produced. The process of rolling out the implementation of the guidelines is underway at both national and provincial levels. The process of reconfiguration of collaborative structures at national and provincial levels is underway. However, as previously noted, the process of setting up of CMAs is going very slowly with only two established so far. Moreover, Participation by sector partners in the regional forums varies from region to region, and is an issue that requires more attention in almost all regions. Since 2007 DWAF has embarked on a process of reconfiguration of sector collaboration structures with a focus on both national and regional structures. As part of this process, the Water Services Sector Leadership Group (WSLG) and Masibambane Coordinating Committee (MCC) at a national level have also been through significant realignment in line with the IGR. The WSLG has been reconfigured to include other DGs from other sector Departments. The first meeting of the reconfigured WSLG witnessed nearly 100% attendance. While attendance is not the only measure of effectiveness, it is a necessary condition. Seven of the nine technical committees of the reconfigured WSLG are functioning effectively. Furthermore, the nine (9) provincial forums are in the process of reconfiguration in line with the IGR Framework Act. The reconfiguration entails interface of officials and politicians in respect of planning, budgeting and policy. The older forums have been retained as technical wings of regional forums. The only province that has not set up an IGR forum is Mpumalanga. However, even in this province there is a long history of an effective Regional Forum and there are signs that this will soon be reconfigured into an effective provincial forum. However, whilst collaboration appears to be relatively strong across the sector, the issue of integration remains. For instance, whilst many sector roleplayers collaborate by providing information on request, the information systems are often not interoperable and thus it makes data verification very difficult. A further area of concern is that whilst considerable success has been achieved through knowledge-sharing across the sector, efforts to ensure the sustainability of this knowledge-sharing and thus retain the institutional memory of the programme have not yet succeeded. In particular the future of WIN-SA remains unclear beyond MSB III, and the sector must be urged to absorb the infrastructure of WIN-SA to ensure that this valuable and effective knowledge management tool is not lost.
5.2 Catchment management agencies (CMAs) are established and operational (Key Result Area 2)
The establishment of the water resource management institutions has been slow. In relation to the CMAs, only 2 fully-fledged CMAs have been established (19 Catchment Agencies are required to be identified by 2011/12 according to the target in the Financing Agreement). The other CMAs are at different stages ranging from being at proposal development stage to advisory committee process stage. A total of 34 Water User Associations (WUAs) have been established and a total of 46 Irrigation Boards have been transformed into WUAs across the 9 provinces. A majority of these WUAs are in the Western Cape (which incidentally has received no funding for any of this work from MSB

M i d - T e r m R e v i e w o f M a s i b a m b a n e I I I : A p r i l 2 0 0 7 – S e p t e m b e r 2 0 0 8
O v e r v i e w R e p o r t p.73
III). Other provinces have not progressed as well as the Western Cape, having established and transformed far fewer WUAs. The Chief Directorate Water Management Institutions Governance (WMIG) leads the establishment and support of CMAs. However, the findings from this review indicate that cooperation between the Directorate and Masibambane on the transfer of funds for support of WMI establishment was not consistent. According to the Directorate, the last and only time MSB got involved in this was during the drafting of the proposals and programmes for support of WMIs as set out in the Financing Agreement. There was no transfer of funds for the proposals and programmes. The work done and achieved so far on the CMAs and WUA has thus been through DWAF budget not Masibambane III. This was confirmed by the Director (HO) as well as several of the regions, e.g. Gauteng, Western Cape and Mpumalanga regional offices. Therefore the reflections below are based on work done through the department’s budgets. It is therefore proposed that any future budget transferred from Masibambane towards this KPI should focus on the areas identified as part of the recommendations included in this review. The resources and time put into CMA establishment are used efficiently in the process. However more efficiency could be achieved if all activities by DWAF towards CMA establishment support could be streamlined. This is in terms of staff transfers, financial transfers, transfer of functions, etc. The experience of the few CMAs that have been established highlighted a number of areas that could help improve efficiency in the process. New proposals on CMA establishment stages have been made to improve on efficiency. A CMA best practice document is being finalized to support efficiency. New institutional models are being proposed to make CMAs more efficient in terms of governance and achieving IWRM. These models should be implemented once the CMA establishment continues again, i.e. after re-alignment. A capacity-building programme should be considered for the CMAs that have been established. This will also benefit the new ones still to be established.
5.3 Municipalities are proficient in their designated water resource management and water service roles (Key Result Area 3)
This KRA is about ensuring that municipalities receive appropriate and relevant support to ensure they become more effective in the provision of both water services and the management of water resources. As was noted above, WSA Managers were both appreciative of the support they received, and many felt the support met their needs. However, there is a sense that support being provided is often in the form of consultants, which always raises the issue of sustainability. In addition, many WSAs felt that support from MSB was mainly for projects that they had to do (for DWAF) and that they then had to get consultants to implement and ended up with a report that they were not sure how to take forward. Moreover, evidence gathered by the Review Team found that initiatives conducted by MSB III do not always focus on the means to facilitate the development of effective WSAs, but rather focus on the means to ensure that WSAs respond to legislative requirements. Therefore the intended strategic intervention of initiatives to promote institutional growth at local level is lost.

M i d - T e r m R e v i e w o f M a s i b a m b a n e I I I : A p r i l 2 0 0 7 – S e p t e m b e r 2 0 0 8
O v e r v i e w R e p o r t p.74
A further concern is the support that WSAs are receiving to improve operations and maintenance (O&M). O&M has long been neglected, firstly in favour of addressing backlogs and building new infrastructure, and then in favour of developing capacity at WSA level. Significant failure of both old and new infrastructure to supply adequate, reliable and good quality water supply to consumers means that WSP performance and their support requirements must become a critical focus – this is in line with the support framework outlined in the Strategic Framework for Water Services (2003). A significant (but not major) percentage of MSB III inputs have gone into WSP support, and this is needed for improving both the profile of O&M at local government level and the actual status of on-the-ground operations and maintenance. Nevertheless, significant inputs have been made by MSB III with regards to water conservation and demand management, and to drinking water quality management. To maintain this momentum the programme must continue to strive to implement the WSP Support Programme based upon the plans they have developed and the actions that are identified by applying the WSP Assessment Diagnostic tool that they have developed as part of that programme. Applying the tool will provide a comprehensive assessment of the functional competency of a WSP and inform the support required for that WSP. If anything, the rollout of that programme should be accelerated. While providing support and capacity building for WSPs is in line with the SFWS, it should be emphasised that DWAF, in its primary function as regulator, must also hold WSAs accountable for ensuring water services provision within their jurisdictions. This should involve making sure that WSP support is in line with the needs of the Regulator. For instance, with DWQ a key regulatory priority, on-going efforts must be supported to identify the problems and ensure the support provided addresses these challenges.
5.4 DWAF is a strong, capacitated leader providing policy direction, regulation and support to the water sector (Key Result Area 4)
DWAF as a sector leader adopted (by default) a decentralised approach, leading by consensus. This is largely a reflection of the history where DWAF was predominantly developing and popularising policy and providing support. The shortcoming of this approach is that collaboration is largely viewed as an end unto itself. This approach has been successful in the development of a coherent water sector, which evolved during MSB I and MSB II. During MSB III there has been an increasing consciousness within DWAF of the need to fulfil its regulatory constitutional requirements and the creation of a single regulatory framework for water. Central to DWAF’s role has been the development of a sector wide Monitoring, Evaluation and Reporting System. “What gets measured gets done,” and the effective M,E and R system that highlights the delivery gaps, missed targets and so on provides a wealth of information for the management of the programme. However, management of the programme must use this information more effectively to ensure that those who provide services comply with what they are meant to be delivering. The leadership that DWAF has played in promoting WfG&D has been viewed as a success, particularly in ensuring that the sector has moved beyond simply looking at water and sanitation services and now has a far more holistic and nuanced view of water. However, to ensure that MSB continues to be seen as a valuable asset, it requires a Champion to resurrect the programme, provide the strategic leadership that appears to be missing at present, and to ensure that the planned activities get done. Such a Champion should also

M i d - T e r m R e v i e w o f M a s i b a m b a n e I I I : A p r i l 2 0 0 7 – S e p t e m b e r 2 0 0 8
O v e r v i e w R e p o r t p.75
remind the sector of the enormous success that the sector has achieved in the longest running, and arguably, the most successful sector wide programme in South Africa. Moreover, the enormous success that MSB has achieved in pulling the sector together is not only an impressive achievement, but it is also vital for ensuring the success of WfG&D. For the strategy to succeed it needs to ensure collaboration not only between different sections within DWAF (the link between water services and water resources is an obvious example), but also between all the key stakeholders who work within the sector. Thus MSB not only adds value by sharing hard lessons learnt about effective sector collaboration and about its extraordinary success as a way of working, but by positioning MSB correctly it can add value by ensuring that the strategy is implemented by driving the process through the collaborative structures it has diligently built at all levels including local, provincial and national.
5.5 Civil society organisations (CSOs) (Key Result Area 5)
Civil Society Organizations (CSOs) have played a significant role as the voice of communities in South Africa from the time of the anti-apartheid struggle. Founded in this history, the EU has a long-standing record of working with CSOs in this country. The Masibambane programme has always sought to promote meaningful participation of CSOs in the water and sanitation sector as one of its key objectives. In MSB III, the EU entrenched this objective as one of its key outcomes as identified in the EU/SA Financing Agreement (2007) and thereby specified that “participation of CSOs in water sector consultative bodies at catchment and other relevant local levels will be essential to assist, implement and support the water for growth and development policies”. Overall MSB III has made progress in delivering its objectives, and there is a growing realisation in the sector of the significance of involving CSOs that goes beyond window-dressing. An increase in the number of CSOs involved in water projects and water resource management has been reported. CSO are progressively considered highly relevant in both planning and implementation (e.g. through participants in various water forums and task teams, CSO’s are making input in strategy planning). The capacity building component of the Civil Society Support Programme has made some impact in this regard. While CSOs are independent of the state, their very presence and survival depends on government e.g. on laws governing CSOs, and perhaps more importantly on government attitudes towards CSOs. It is important that a conducive and supportive climate for CSO participation is provided particularly at local government level and that a space for CSO participation is created. There is still concern over the definitions of and understanding of what is meant by CSO involvement and understanding the role of CSOs in service delivery. There is also confusion over the role of ward committees and community development workers. Community development workers are still used or regarded to be doing the same role as CSOs. However, the CSO role is distinct from that of ward committees. This confusion continues despite the fact that both the Civil Society Advocacy and Communication Strategy and the Masibambane Civil Society Strategy define in detail who CBOs and NGOs (CSOs) are. They also clearly state how they differ from ward committees. Equally there is confusion within municipalities as to the value that CSOs can add. There is still yet no common understanding amongst stakeholders in the sector of the role envisaged for civil society, nor indeed why there should be a role at all. CSO involvement is seen as sporadic, particularly when issues are hot. There is also a perceived lack of coherence among CSOs. CSOs do not speak with one voice. Sometimes there is conflict

M i d - T e r m R e v i e w o f M a s i b a m b a n e I I I : A p r i l 2 0 0 7 – S e p t e m b e r 2 0 0 8
O v e r v i e w R e p o r t p.76
amongst themselves. The conflict is usually over CSO budget and funding; issues such as who is getting more work and why. Smaller CSOs also feel that they are not benefiting from the Masibambane project as much as the bigger CSOs. The larger CSOs are considered to be monopolizing the stage. It is the same CSOs that benefit from programmes like Masibambane and other similar programmes. This conflict amongst CSOs spills over to their ability to present a united voice. This detracts from their impact and participation in government service delivery programmes and also partly explains the slow pace in improving CSO participation. One of the reasons why CSOs cannot always speak with a single voice is that CSOs embody a rich diversity in terms of purpose, size, structure and capacity. However, despite this concern, CSOs do feel that the Masibambane Programme is succeeding in bringing together CSOs from different streams i.e. service delivery, advocacy, and environmental groups who are now working together in both the water resources and water services field. But there is a need to see an increase in the number of and diversity in CSOs participating in the Masibambane Programme. CSO’s expectations also need to be managed. Despondency identified within the CSOs is as a result of, among other factors, over-expectations on the part of the CSOs. CSOs need to define their own role, and understand their capabilities within the context of the service delivery agenda. Lastly, the accreditation of CSOs is also central in improving the chances of CSO participation in service delivery at local government. However the accreditation process is painfully slow. Only one organization has received its accreditation status thus far. Clarity is still needed on the issue of accreditation. Clarity between accreditation of individual and accreditation of organization must be established and benefits of accreditation clearly spelt out. Ensuring effective civil society participation is a key to strengthening governance and creating a more responsive state at local level. While there has been notable progress in the involvement of CSOs, it is still limited, with participation at national government level fairing better than at local government levels. Also, the CSO sector continues to be represented by the same minority of CSOs. Attempts to involve new organizations must be made. Perceptions of CSOs are still poor and negative. There are still barriers to the entry of CSOs to service provision due to excessively cumbersome and demanding contractual procedures by local municipalities. The legislative framework is presently not conducive for CSOs to contribute to sustainable service provision within local municipalities. Procurement policies need to be looked at to explore the options for making them more accessible to CSOs. Moreover, the long-term sustainability of CSOs operating within the sector remains an important issue. Whilst the sector does not necessarily have the capacity and resources to sustain CSOs, it could do far more to lobby for more CSO support from funding institutions at international level. CSO funding should be prioritised as they are an important vehicle to meet the sector’s objectives. Similarly on the Water Resources side there are questions surrounding the survival of Water User Associations (WUAs). Again the sector does not have funding to sustain the 200 small WUAs all over the country. However some associations have taken on functions in, for instance, assisting DWAF in billing activities and therefore they will be able to sustain themselves. The sector needs strong local movements in the water sector as a vehicle for encouraging community participation and ensuring that citizens have a voice on water issues and the extent to which they are heard or listened to.

M i d - T e r m R e v i e w o f M a s i b a m b a n e I I I : A p r i l 2 0 0 7 – S e p t e m b e r 2 0 0 8
O v e r v i e w R e p o r t p.77
5.6 Review of alternative financing mechanisms for sustainable delivery of water services and water resource management (Key Result Area 6)
Under this KRA it is expected that the sector would “seek alternative sources, and approaches involving a multiplicity of options and models” with respect to ensuring that water services and WRM are sustainable. Moreover, the KRA also specified that “DWAF could play a pivotal role by reviewing and advising on alternative finance mechanisms, assisting water operators to establish and source finance, and advising sector stakeholders of the various mechanisms available”. From the findings above it is apparent that whilst a number of new initiatives in alternative financing mechanisms are being explored, successful models still need to be developed. Direct government grants will continue to be the mainstay of financing of the water sector for those municipalities whose cost recovery on billings is inadequate to cover the operating, overheads, and capex financing costs. A number of issues were discussed regarding the efficiency and effectiveness of the grants. These are reported below.
▪ Treasury is working towards being more transparent about the make up of the Equitable Share grants in the allocations. It is eventually hoped that a municipal recipient will therefore know the separate amounts provided for electricity, water, sanitation, and refuse. The intention behind this is to empower departments within municipalities to “contest” for their allocations as opposed to the grant being absorbed into non-service delivery overheads. However, this is the eventual aim, at present there is still some way to go before National Treasury provides any real pressure on the actual spending of the ES.
▪ Similarly, this greater transparency in the make-up of the allocations could help bulk providers such as Water Boards, who sometimes struggle to obtain payment from municipalities.
▪ DWAF has looked into the possibility of making a part of the Equitable Share a “pass through” payment to, for example, a Water Board. This has not proceeded beyond the ideas phase and its legality is doubtful.
▪ Similarly, the option of making a portion of the grant conditional has been considered by the DPLG. The main obstacle that presents to all the efforts to ensure that the Equitable Share is spent more on service delivery and less on overheads is the constitutional separation of the powers and functions of the different spheres of Government – National, Provincial, and Local.
▪ The effect of the separation of powers is that the link between funder (national government) and intended recipient is to a large extent severed. Local government is somewhat insulated from the consequences of poor service delivery as the revenue stream from the Equitable Share continues regardless. To the extent that this revenue stream is a material proportion of total revenue there is a degree of impunity with regard to the actual quality of service delivery.
▪ The net effect of the unconditional status of the Equitable Share grant is that the regulator – DWAF - is somewhat toothless in ensuring that the grant is used for the purposes intended.
This raises three important points: Firstly, there is a lack of co-ordination and integration in the planning for infrastructure as a whole. DWAF emphasized that the MIG grants cover retail basic infrastructure. South Africa is now at a point where bulk capacity is at a premium. The RBIG grant is designed to cover bulk infrastructure but it is inadequate in relation to the rollout of retail infrastructure. There is also a lack of integration. DBSA mentioned, by way of example, the case of Wolmaransstad (where

M i d - T e r m R e v i e w o f M a s i b a m b a n e I I I : A p r i l 2 0 0 7 – S e p t e m b e r 2 0 0 8
O v e r v i e w R e p o r t p.78
very few of the residents can afford to pay for basic services) where water-borne sanitation was provided to 3512 homes in order to upgrade them from the bucket system. The bulk implications were not thought through and the water supply in the town proved inadequate for the new demand load. This led to the need for the construction of a R120m water augmentation supply pipe from Bothaville. It is also felt that the peri-urban needs of the cities are somewhat neglected in the whole planning process, whereas they are the major settlement problem. Further, there is insufficient planning co-ordination between the housing planners and the bulk infrastructure providers. Secondly, there is an emphasis on capital expenditure whist in general expenditure on operations and maintenance is neglected. This has been discussed to some extent above. The Equitable Share grant is intended for O&M but is often misused. The DBSA points out that in terms of life cycle costing, O&M should have the largest share of costs – 44%. Financing attracts 37% whilst capital costs are only 17%. Effective planning, which need cost no more than 0.5%, is essential. The point they make is that the water services business is not only about new infrastructure. Thirdly, and leading on from this, is it possible to create a link between the ES and MIG grants? There seems little value in building new infrastructure whilst existing systems are being neglected. It would be desirable to create a positive feedback between the judicious use of the ES transfer (i.e. it is used for operation and maintenance of basic services for the poor) and the attainment of further MIG grants. This suggestion will no doubt come up against the same constitutional barrier as mentioned earlier, but maybe these should be addressed. It will require audits of municipal budgets and expenditure to determine whether there has been judicious use of the monies available. Further grants should depend on some compliance with a good governance norm or target set.
5.7 Water service providers are operating in an effective and efficient manner, meeting norms and standards (Key Result Area 7)
This KRA includes not only the delivery of water and sanitation services, and the O&M of those water services (i.e. water services provision), but also the incorporation of the cross cutters. As was noted previously, good progress has been made with several of the KPIs specific to water and sanitation backlogs (such as 3, 4 and 5), in terms of the following:
▪ The Schools water and sanitation backlogs continues to be prioritised (KPI 3); ▪ The Clinics water and sanitation backlog is also being dealt with (KPI 4); ▪ All but the last few thousand bucket toilets have been eradicated (KPI 5).
In the case of domestic water supply (KPI 1), it appears that another three years will be required to eliminate the backlog, which was estimated in March 2008 at 5,7 million people. However, services are being provided to several hundred thousand new households every year. In terms of the international Millennium Development Goal (to halve the 2002 percentage of the population without water and sanitation by 2015), South Africa has met these. However, this does assume it is going to be as easy to serve the rest of the water service backlog as it was to help the communities served over the last few years. To some extent, the “low hanging fruit” has been picked and it is only the difficult (in terms of water resources and/or challenging topography) settlements that still need water services.

M i d - T e r m R e v i e w o f M a s i b a m b a n e I I I : A p r i l 2 0 0 7 – S e p t e m b e r 2 0 0 8
O v e r v i e w R e p o r t p.79
With respect to backlogs, the critical issues remain. In particular, the eradication of the sanitation backlog is further behind, with some 3,3 million homes still without provision in March 2008. At current rates of backlog reduction it will take another 15 years before all are served. This is significantly longer than is expected at the political level. The sector does have capacity to increase the rate of delivery, but more funds will be required to step up production. There are, however, three significant concerns:
▪ Monitoring and evaluation of completed work indicates that, across the board, policy and standards are not being complied with to a satisfactory level. To single out just a few common problems, more attention needs to be paid to health and hygiene education, to water metering, to tapstand design and to VIP design.
▪ Problems with either the original planning and design, or with maintenance, are causing some who were served to rejoin the backlog queue.
▪ At current rates of progress the sanitation backlog will not be eliminated before 2023. Significantly increased levels of funding will be required to deal with this backlog in the next five years.
Since the end of MSB II, the sector has redirected much of its attention towards addressing the sustainability of water services and has thus brought much needed focus on to operations and maintenance. This has been done through programmes and support for municipalities in the operation and maintenance (O&M) of water and sanitation services. These initiatives (e.g. monitoring drinking water quality; asset management; water services regulation; and much of the WSP and WSA support) are critical interventions that are required to address the needs of the largest challenge facing the sector -- the capacity for operating and maintaining municipal services. However the challenge remains a massive one that will continue to need resources and support for the foreseeable future DWAF’s performance against the KPIs it developed to measure its own performance in the MSB programme as related to O&M has had mixed results, specifically with regards to developing WSP capacity. This includes the development of WSP capacity such that WSPs are equipped with and able to manage WSP business plans; asset management systems; consumer charters; and tariff policies and consumer-friendly billing. (Note that target 17 of the Strategic Framework for Water Services (2003) states: “All water service providers are rendering services in terms of a business plan by 2005”). Within the context of drinking water quality reporting, which is done by WSAs, there has been greater success. (Note, however, that the supply of consistently adequate drinking water quality by WSPs is less successful). In terms of all the cross-cutters, there is a sense that many remain sidelined. For instance, although the cross-cutters have been embraced by many DWAF stakeholders and officials, as well as entrenched at policy level through the WfG&D framework, they still remain largely considered as a ‘necessary evil’ at delivery level. Nevertheless, the relevance of effective environmental management is being highlighted through the WfG&D framework, which has the capacity to entrench good environmental management as a paradigm, viewing it as a sustainability pillar. However, the good environmental intent at policy level, as identified previously in the MSB II review, is not carried through to implementation, and thus has limited effectiveness. Effectiveness of environmental

M i d - T e r m R e v i e w o f M a s i b a m b a n e I I I : A p r i l 2 0 0 7 – S e p t e m b e r 2 0 0 8
O v e r v i e w R e p o r t p.80
management strategies appears to be diluted the further one moves from national policy directive level, and is almost non-existent at delivery level in many places. This prevailing attitude makes any effective attempts at addressing holistic and sustainable resource management very challenging, and requires an extensive paradigm shift through massive awareness-raising, using the WfG&D framework as a mandating mechanism, right across the sector. Similar concerns can be raised about the attempts to mainstream both gender and HIV and AIDS. Effective policies and strategies are being developed, but implementation of practical projects on the ground remains a significant challenge. Nevertheless, pockets of best practice are beginning to emerge, particularly in ensuring a strong link between the provision of water and sanitation services and the caring of those who suffer from HIV and AIDS. With regards to Appropriate Technology, the picture is also very similar. While progress has been made in producing a strategy that provides an appropriate and relevant framework for mainstreaming AT, the challenge now is to get the strategy adopted by the sector and to implement the strategy within the limited time left in the programme. Within the reporting period very little effective progress has been made and this can be clearly seen from the expenditure.
5.8 Sustainable, ecosystem based integrated water resource management (IWRM) is contributing to social development (Key Result Area 8)
Under this, the final KRA, the emphasis is on “understanding of water use” being significantly improved to ensure the upliftment of disadvantaged communities. In the context of MSB III, IWRM aims to address five key areas: Water Allocation Reform (WAR); Water Conservation and Demand Management (WC/DM); Compliance Monitoring and Enforcement (CME); transformation of Irrigation Boards (IBs); and establishment of Resource Poor Farmers (RPFs). The findings outlined above, suggest steady progress albeit that the outcome is unlikely to be fully realised during the life of MSB III. With respect to WAR, there has been minimal actual gains to date on re-allocation of the national water resource to PDI users. This is compounded by the strategic uncertainty in relation to compulsory licensing, and by the difficulty that the regions experience in getting new licenses approved in compliance with Section 17. In terms of WC/DM, the evidence suggests that there is widespread appreciation of the purpose and practice of WC/DM within DWAF. However implementation and enforcement of WC/DM has not been achieved to an acceptable degree with the majority of WSA’s expressing a need for more support on this aspect. The national strategy with regards to CME is in place and scores well. Implementation itself is relatively weak despite the enthusiasm and intent of the CME Unit because of the current small size of the CME unit. However, the WfG&D framework and the potential for an increased profile of the CME unit could be good catalysts for IWRM, and require underpinning through increased public awareness and action. IB transformation has been effective in that 80 IBs have undergone the process on paper, but active and meaningful participation of new PDI members remains a substantial challenge and will need to be addressed in the remainder of MSB III.

M i d - T e r m R e v i e w o f M a s i b a m b a n e I I I : A p r i l 2 0 0 7 – S e p t e m b e r 2 0 0 8
O v e r v i e w R e p o r t p.81
DWAF has shouldered wider responsibilities in implementing the Resource Poor Farmer’s subsidy and this leadership has clearly resulted in relative success of the RPF programme and DWAF has certainly demonstrated strong leadership in this area. Until South Africa’s water resources are classified and the reserves are set, the basis of IWRM and WAR, all IWRM and WAR activities are compromised. Although the National Water Act is already 11 years old, the river classification system for South Africa has not been gazetted. It is therefore still not possible to classify the water resources of South Africa. The simplest form of reserve determination, the Desktop Assessment, which is only useful as a rough guide, takes approximately two days to complete. The more complex so-called Rapid Assessment takes approximately five weeks, and a Comprehensive Assessment, which is called for in the case of either pristine rivers or highly stressed rivers, can take years. There are 1 946 quaternary sub-catchments in South Africa. Desktop assessments have been completed for all of these sub-catchments. Rapid or Comprehensive assessments have been completed for only a handful of South African rivers. DWAF has until recently had only two staff available for the setting of reserves, which given the magnitude of the task described above was clearly very inadequate. Recently nine new hydrologists and four Assistant Deputy Directors have been employed. This is a highly commendable step-up in capacity, although it will take some time before the new staff are trained and productive. However, to date, MSB III has to date not committed any resources to assisting with the classification of water resources or Reserve determination. MSB III could help to make DWAF more effective in this critical area in the following ways:
▪ The water resources classification system is overdue for finalisation. Without this, no Reserve can be formally determined or implemented. The classification system should be finalised as a matter of urgency.
▪ DWAF is still uncertain which ecological indicators will be used to determine if the Ecological Reserves (once set and implemented) are working as intended, or whether they should be altered. The Masibambane programme could assist DWAF in clarifying this question.
▪ Even with the Reserves set, classification finalised and ecological indicators adopted, DWAF needs to create effective river health monitoring capacity or partnerships in all its regions. The Masibambane programme could be used to assist in building this capacity.

M i d - T e r m R e v i e w o f M a s i b a m b a n e I I I : A p r i l 2 0 0 7 – S e p t e m b e r 2 0 0 8
O v e r v i e w R e p o r t p.82
6. Conclusion and Recommendations Masibambane is now in its third phase under the theme of Water for Growth and Development. The programme remains both relevant and critical to the development of South Africa; its objectives are directly in line with the government’s strategic focus as articulated in the previous Medium Term Strategic Framework (MTSF) and the Accelerated and Shared Growth Initiative of South Africa (ASGISA). Moreover, there is no doubt that, even with the new MTSF objectives, and the likely shift in priorities under the newly elected President, the fact that MSB continues to facilitate and promote integration between Water Service provision and Water Resource Management in the sector must continue. Moreover, President Zuma’s stated desire to usher in a new political dispensation that will lead to the restructuring of government and also introduce new bodies (e.g. Planning Commission and Government M&E unit in the presidency; Human Settlements; Rural Development; Gender; etc.), not to mention the integration of water and the environment into the Department of Water and Environmental Affairs, resonate powerfully with the objectives of Water for Growth and Development. The management of Masibambane must therefore seize the moment and take the opportunity that the new President has provided to restate and ensure broad recognition of the inherent value of Masibambane, and thereby position Masibambane appropriately to underpin and strengthen WfG&D. The Review Team noted that the ToR for the MTR asked the Team to consider whether, if necessary, MSB III needed to be redirected. In response, the team would argue that it is not so much a question of redirection but rather one of re-energising the programme. The roadmap that MSB III developed at the onset of the programme (including the EU Financing Agreement) clearly identifies the relevant issues that need to be addressed and the manner in which these key result areas should be addressed. The challenge remains in ensuring greater efficiency and effectiveness in implementation. It is also critical that a comprehensive exit strategy is prepared to ensure that MSB remains sustainable, and implements what is planned after the EU funding comes to an end in 2011. Specific conclusions and recommendations per key focal area of MSB III are listed in the table below:

M i d - T e r m R e v i e w o f M a s i b a m b a n e I I I : A p r i l 2 0 0 7 – S e p t e m b e r 2 0 0 8
O v e r v i e w R e p o r t p.83
CONCLUSION RECOMMENDATIONS
Reduction in Services Backlogs Excellent progress has been made with KPIs 3, 4 and 5, and steady progress continues to be made with KPIs 1 and 2. Although steady progress is being made in the area of backlog reduction, the main performance indicator used in this area is the level and rate of the spending of the MIG grant. Not enough attention is given to the efficiency and effectiveness with which the grant is spent, and not enough attention is given to ensuring that completed projects are maintained and continue to meet their intended purposes.
More Masibambane funding should be directed to the building of DWAF’s capacity to carry out monitoring and evaluation of water and sanitation infrastructure. Systems must be established to enable lessons learned from monitoring and evaluation to get back to those responsible for new project implementation, as well as those responsible for maintenance. The revision of the MIG formula needs to be finalised if backlog targets are to be reached, in particular sanitation targets should be prioritised. DWAF’s Regulatory Performance Management System (RPMS) should be fully implemented across all Water Services Authority. Once this is done, it can be used to ensure that funding for new infrastructure is used more efficiently and effectively.
Free Basic Water The statistics indicate that substantial success has been achieved nationally in terms of providing free basic water services to households in poor communities. However, a few questions must be raised in relation to this information:
• What data capture and reporting systems are being used as a basis for these results?
• Do these results take into consideration those people who are rejoining the backlog queue (i.e. those people officially served, but for whom water services have failed in the operation and maintenance phase)?
As the FBW process was an inter-governmental initiative, the roles of different government departments should be clearly defined to facilitate a coordinated reporting process/system. In order to ensure the accuracy of the information captured, the reporting systems should be based on regularly updated information that confirms whether or not free basic water is currently being supplied to consumers.
Transfers Transfer agreements between DWAF and the receiving institutions are almost complete and only the final stages are outstanding on the last three agreements. While the process of physical assets is near completion, only 58% of the DWAF staff had been transferred by December 2008.
Sector leadership must facilitate the effective participation of the sector partners, including SALGA, to ensure the speedy resolution of the transfer of staff.
Operations and Maintenance O&M is only now starting to receive the attention and budget it requires within the sector because of the potential crisis in O&M that threatens water services sustainability in South Africa.
The agenda of O&M must be continuously pushed and there must be strong and focused follow-through on the O&M foundations that have now been put into place.

M i d - T e r m R e v i e w o f M a s i b a m b a n e I I I : A p r i l 2 0 0 7 – S e p t e m b e r 2 0 0 8
O v e r v i e w R e p o r t p.84
CONCLUSION RECOMMENDATIONS Several key strategies and programmes are now ready to be rolled out, which show exciting potential.
Institutional Development and Performance WSAs
There is a need to address the challenge of seeing local government support as a way of making WSAs comply with regulations instead of seeing it as strategic institutional development support to enable them deliver services to citizens.
DWAF, in its role as Regulator, must ensure that WSAs continue to be supported so that they adhere to prescribed norms and standards.
WSPs Developing WSP capacity is a serious challenge with which the sector is now engaging more seriously. The new WSP Support Implementation Plan has been developed based on a recent pilot project in 4 areas. The key emphasis is on taking WSP capacity building from strategy to implementation.
There must be strong and focused follow-through on the WSP Support Implementation Plan, taking into account the activities that are identified by applying the WSP Assessment Diagnostic Tool. The national roll-out of the WSP Support programme is a real priority that must receive adequate support and financial resources.
CMAs The achievements with regards the establishment of 19 CMAs provides a mixed bag of results. Two fully-fledged CMAs have been established while many others are at various stages of establishment. The established CMAs, Breede and Inkomati, each have a Governing Board and a CEO in place. The other 17 CMAs range from being at proposal development stage to advisory committee process stage.
DWAF should prepare and circulate a clear internal message that confirms CMAs as a sound policy direction and confirms that they will be established is required. Support mechanisms and funded programmes that will support the establishment of CMAs will then need to be put in place.
IWRM WAR has been substantially ineffective to date in achieving its primary objectives. WC/DM as a working principle is on the routine working agendas of both the WSAs and DWAF regions and there is a sense that the national strategies for WC/DM that are in place are appreciated. Widespread implementation and enforcement of WC/DM has not been achieved to an acceptable degree. CME has been driven enthusiastically and has full support from the regions for regional expansion. However national coverage is thin with limited funding available, and with low numbers of dedicated CME personnel. IB Transformation has seen progress on numbers of IBs transformed by active involvement but it needs additional support. The relatively successful Western Cape feedback on IB transformation shows that a period of 3 to 4 years of active participation
Clarify and clearly document the BEE licensing requirements that DWAF HO needs for Section 17 compliance in new license applications. Policy direction in terms of WAR implementation via Compulsory Licensing needs to be provided and followed with an implementation strategy. As identified in the Overall Programme of Support to WSP providers (WSSSS), “relatively small investments in water loss and demand management projects have been found to yield excellent payback in most cases.” Informed inputs at WSP level are thus required to make a difference at scheme level. Funding and personnel resources dedicated to CME need to be expanded and taken to the regions in close liaison with the existing National CME team.

M i d - T e r m R e v i e w o f M a s i b a m b a n e I I I : A p r i l 2 0 0 7 – S e p t e m b e r 2 0 0 8
O v e r v i e w R e p o r t p.85
CONCLUSION RECOMMENDATIONS of new WUA members can result in meaningful participation, when leadership both within the WUA and the DWAF region take on a ‘coaching’ approach. Resource Poor Farmer establishment has seen delays resulting from a moratorium on subsidy payments during the reporting period, but despite this, there has been substantial progress on the RWH programme, targeting food production and poverty alleviation.
Provide direct training for regional staff on institutional development processes linked to IB transformation and WUA establishment. The serious skills deficit in the Institutional Directorates at regional offices needs to be addressed. An expanded RPF programme is needed. This should embrace the current garden development / tank-based approach which provides for all-year round home-food production, as well as single-season cropping approaches such as the ARC in-field RPF methods and floodwater diversion methods among others.
Enhanced Role of Civil Society Organisations (CSO’s) Ensuring effective civil society participation is a key to strengthening governance and creating a more responsive state at local level. There’s notable progress in the involvement of CSO in local government. However this is still limited, with participation at national government level fairing better relative to local government. Also the CSO sector is still represented by the same minority of CSOs and an attempt to involve new organisations must be made. Perception of CSOs is still poor. There are still barriers to entry of CSOs to service provision due to excessively cumbersome and demanding contractual procedures by local municipalities. The legislative framework is presently not conducive for CSOs to contribute to sustainable service provision within the local municipalities.
Create an enabling environment for CSO participation. CSOs that have the potential capacity to cope with procurement policies and procedures should be assisted to do so. Enable engagement with organisations that are already doing interesting and relevant work. Define areas of CSO engagement. Training should be informed by the skills needs of the CSOs in response to local government needs for resources to assist with effective service delivery. Procurement policies need to be looked at to look at options to make them accessible to CSOs. Further interactions are needed with Local Government to further promote the role of CSOs and the potential value CSOs can bring to service delivery. SALGA must be engaged on how local government could be supported to be more open to CSO participation. The challenges of CSO sustainability within the sector need to be looked at, in particular the role that the sector can play in lobbying for the financial support for CSOs.
Strengthening of Sector Collaboration Sector Collaboration remains strong at all levels of government. Effective knowledge- sharing across the sector plays a significant role in this collaboration. Sector collaboration should not be viewed as an end unto itself, but as a means to an end. In the context of the water sector, collaboration is in support of (but not limited to) leadership, policy (formulation, monitoring and review), planning and budgeting, lesson
The process of reconfiguration of both national and regional collaboration structures should be speeded up, with emphasis on putting in place implementation protocols (collaboration agreements) as a way of managing relationships with sector partners. This process should focus on clarification of the relationship of formal IGR structures to the water sector informal forums as well as improving quality of collaboration in regions.

M i d - T e r m R e v i e w o f M a s i b a m b a n e I I I : A p r i l 2 0 0 7 – S e p t e m b e r 2 0 0 8
O v e r v i e w R e p o r t p.86
CONCLUSION RECOMMENDATIONS learning, regulation and implementation of programmes. If this paradigm is acceptable in future, DWAF would evaluate collaboration in terms of the extent to which it supports these key focal areas, not as an independent virtue. The critical challenge facing sector collaboration particularly in most of the regions is poor attendance by some sector partners
The measurement for sector collaboration should be reviewed towards measurements that take into account both quantitative and qualitative aspects of collaboration. Finding the means to ensure long-term sustainability of knowledge-sharing structures within the sector, including WIN-SA, must be prioritised
The M, E & R framework is largely appropriate to ensure the reporting needs of the sector. However, the means to achieve this have yet to be fully realized. In particular, there is insufficient capacity to achieve these means, and thus it is critical for the remainder of MSB III that the M, E & R unit is strengthened.
Current information is vital to the success of a SWAP to steer the sector; it is critical that the unit is strengthened in order to perform the functions the framework requires of it Strengthen efforts to improve and streamline Municipal Reporting through the RPMS and through the annual WSDP Reports as required by legislation. Efforts to verify the accuracy of the data, and to align the data gathered across the sector by a multitude of role players, must be accelerated.
Cross Cutters Environment
Very relevant, with good policy intent and basic framework. Low priority, unclear implementation direction and lack of profile have led to ineffective mainstreaming of environmental management within MSB III. The South African water sector is on the brink of a crisis, with poor environmental management being the catalyst, and improvements thereof being the key. The WfG&D framework and increased profile of the CME unit are good catalysts here, and require underpinning through increased public awareness and action.
Institutionalise environmental management, within and beyond the Masibambane programme, by activating the good policy level intent through Cabinet approval of the WfG&D framework and its sustainability principles. Can be highlighted at local level by clearly linking its performance with KPIs, programme targets and ecosystems benchmarks, plus reporting from delivery level on compliance. Appoint a dedicated, experienced and suitably skilled champion to drive this process beyond MSB III funding, and support CME unit functions at regional level to enhance DWAF’s regulatory role. Implementation must include a massive water awareness campaign and payment for watershed services programme, in the context of the unknown changes in resource character in the throes of climate change. The former should be integrated into the WC/DM strategy, and the latter within IWRM strategy.
HIV and AIDS The strategy is comprehensive and covers important areas in the water sector. The challenge will obviously be to ensure that rollout is effective and that the entire sector mainstreams HIV/AIDS into their core activities.
Clarify roles and responsibilities within the sector to ensure roll-out and implementation by all sector partners of the strategy.
Gender

M i d - T e r m R e v i e w o f M a s i b a m b a n e I I I : A p r i l 2 0 0 7 – S e p t e m b e r 2 0 0 8
O v e r v i e w R e p o r t p.87
CONCLUSION RECOMMENDATIONS The gender mainstreaming framework needs to be reviewed to take into account issues of integrated water resources management as well as WfG&D approach. A gender mainstreaming champion needs to be identified, to ensure that the agenda for gender gathers momentum.
Review current strategy to interface with issues of water resources management as well as principles of WfG&D. Implement/ pilot a set of gender specific projects on the ground Set reliable targets and monitor for the remainder of the programme.
Appropriate Technology While progress has been made in producing a strategy that provides an appropriate and relevant framework for mainstreaming AT, the challenge now is to get the strategy adopted by the sector and to implement the strategy within the limited time left in the programme. Within the reporting period very little effective progress has been made and this can be clearly seen from the expenditure. Practical learning workshops, like the one held in Limpopo in March 2009, provide a direct learning experience between experience and need and should be repeated in other areas.
For further progress to be made during MSB III, DWAF must urgently initiate a process of sector consultation, review and adoption of the strategy. The top priority activities within the strategy must be identified based on what will have the greatest impact in achieving the goal and implementation of these activities must commence as soon as possible. If the planned work and expenditure are to be achieved, implementation must be accelerated Actively organise, promote and support local information-sharing workshops like March 2009 Limpopo workshop, and include sharing of experiences between provinces where appropriate.

M i d - T e r m R e v i e w o f M a s i b a m b a n e I I I : A p r i l 2 0 0 7 – S e p t e m b e r 2 0 0 8
O v e r v i e w R e p o r t p.88
7. References African Development Bank, 2009: Technical Report on the Ecolink Integrated Water Harvesting
Project, Mpumalanga, South Africa. Internal Assessment Report. African Development Bank Water Facility. AfDB. Tunisia.
Botha, J.J., van Rensburg, L.D., Anderson, J.J., Hensley, M., Macheli, M.S., van Staden, P.P., Kundhlande, G., Groenewald, D.C., and Baiphethi, M.N. (2003). Water conservation techniques on small plots in semi-arid areas to enhance rainfall use efficiency, food security, and sustainable crop production. Report No. 1176/1/03, Water Research Commission, Pretoria.
CSIR (2008). Position paper: Appropriate technologies in the water sector in South Africa, Draft 4, May 2008 available on DWAF’s web site but to be replaced by the following inception report.
CSIR (2009). Inception report: Appropriate technologies for the water sector in South Africa, Final draft, March 2009.
CSIR (2009). Case study report 1: Developing a strategy for mainstreaming Appropriate Technologies for water and sanitation services in South Africa, February 2009.
CSIR (2009). Strategy for mainstreaming appropriate technology in the water sector. Draft (version 0), March 2009.
Daley, D.M. 2008. Interdisciplinary Problems and Agency Boundaries: Exploring Effective Cross-Agency collaboration; Journal of Public Administration Research and Theory, University of Kansas.
Denison, J.A., Manona, S. (2007). Principles, Approaches and Guidelines for the Participatory Revitalisation of Smallholder Irrigation Schemes. Volume 1 – A Rough Guide for Irrigation Development Practitioners. Volume 2 – Concepts and Cases. Water Research Commission Project No. K5/1463/4, South Africa
Denison, J.A. (2008). Principles, Approaches and Guidelines for the Participatory Revitalisation of Smallholder Irrigation Schemes. An Interactive DVD. Water Research Commission. South Africa
Denison, J.A., Wotshela, L.E. (2009). A Scoping Study of Indigenous Water Harvesting and Conservation Systems in South Africa. Final Report. Water Research Commission. Project No. K4/1777/5., South Africa.
DPLG (2005). MIG: Municipal Infrastructure Grant Feasibility Study Framework & Process. Draft V1.0 for comment, dated 12 September 2005.
DPLG (June 2005): Basic Level of Services and Unit Costs: A guide for municipalities.
DWAF (September 2002): Minimum standards and guidelines for feasibility studies of water services projects.
DWAF. 2002. Environmental Management Framework, First Draft. Developed by the
Directorate: Social and Ecological Services in the Department of Water Affairs and Forestry.

M i d - T e r m R e v i e w o f M a s i b a m b a n e I I I : A p r i l 2 0 0 7 – S e p t e m b e r 2 0 0 8
O v e r v i e w R e p o r t p.89
DWAF. 2003. Strategic Framework for Water Services. Department of Water Affairs and Forestry.
DWAF (2004): Technical guidelines for the development of water and sanitation infrastructure, Second edition.
DWAF (2007). DWAF Water Services: Regional Bulk Infrastructure Grant (RBIG) – Policy and Criteria. Draft 1 dated February 2007.
DWAF (2008). A Response to the Immediate Challenges facing the Water Sector: Report to the ASGISA IMC, June 2008.
DWAF, 2008, Masibambane III Programme (Water for Growth and Development), Assessment for the Release of the First Variable Tranche of Funding 2007/2008
DWAF (2008). Water Sector: Monitoring, Evaluation and Reporting Process Document, Revision 5 (September, 2008).
DWAF (undated), Guidelines on the practical application of the Intergovernmental Relations Framework Act 13 of 2005 for DWAF
Grey, D. & Sadoff, C.W. (2008). Water for Growth and Development”. in Thematic Documents of the IV World Water Forum. DWAF: Strategic framework on Water for Growth and Development, (Summary Discussion Document), May 2008.
Speech by Mrs LB Hendricks, Minister of Water Affairs and Forestry, Launch of Masibambane III, Gallagher Estate, Midrand, Gauteng, 17 March 2008
Merian-Webster Online Dictionary
MSB (2004). Masibambane Water Sector Support Programme: Civil Society Strategy. November 2004
MSB (2005). Masibambane Water Sector Support Programme: Civil Society Advocacy and Communication Strategy- Action and Implementation Plan December 2005
MSB III Water Sector Programme: Volume II. Regional Report Summary. 2nd Quarter 2008/2009 (July-Sept 2008)
MSB III Water Sector Programme: North West Regional Report Summary. 2nd Quarter 2008/2009 (July- September 2008)
MSB III Water Sector Programme: Northern Cape Regional Report Summary. 2nd Quarter 2008/2009 (July- September 2008)
MSB III Water Sector Programme: Mpumalanga Regional Report Summary. 2nd Quarter 2008/2009 (July- September 2008)
MSB III Water Sector Programme: KwaZulu Natal Regional Report Summary. 2nd Quarter 2008/2009 (July- September 2008)
MSB III Water Sector Programme: Limpopo Regional Report Summary. 2nd Quarter 2008/2009 (July- September 2008)
MSB III Water Sector Programme: Free State Regional Report Summary. 2nd Quarter 2008/2009 (July- September 2008)

M i d - T e r m R e v i e w o f M a s i b a m b a n e I I I : A p r i l 2 0 0 7 – S e p t e m b e r 2 0 0 8
O v e r v i e w R e p o r t p.90
MSB III Water Sector Programme: Gauteng Regional Report Summary. 2nd Quarter 2008/2009 (July- September 2008)
MSB III Water Sector Programme: Eastern Cape Regional Report Summary. 2nd Quarter 2008/2009 (July- September 2008)
MSB III Water Water Sector Programme: Volume II: DWAF Regional Reports. 1st quarter 2008/09 (April – June 2008)
MSB III Water Sector Programme: Western Cape Regional Report Summary. 1st Quarter 2008/09 (April- June 2008)
MSB III Water Sector Programme: North West Regional Report Summary. 1st Quarter 2008/09 (April- June 2008)
MSB III Water Sector Programme: Northern Cape Regional Report Summary. 1st Quarter 2008/09 (April- June 2008)
MSB III Water Sector Programme: Mpumalanga Regional Report Summary. 1st Quarter 2008/09 (April- June 2008)
MSB III Water Sector Programme: Limpopo Regional Report Summary. 1st Quarter 2008/09 (April- June 2008)
MSB III Water Sector Programme: KwaZulu Natal Regional Report Summary. 1st Quarter 2008/09 (April- June 2008)
MSB III Water Sector Programme: Gauteng Regional Report Summary. 1st Quarter 2008/09 (April- June 2008)
MSB III Water Sector Programme: Free State Regional Report Summary. 1st Quarter 2008/09 (April- June 2008)
MSB III Water Sector Programme: Eastern Cape Regional Report Summary. 1st Quarter 2008/09 (April- June 2008)
MSB III Water Sector Programme: Vol I: Consolidated Water Sector Report. 1st Quarter 2008/2009. (April – June 2008)
MSB III Water Sector Programme: Limpopo Regional Report Summary. 3rd Quarter 2007/08 (October-Dec 2007)
MSB III Water Sector Programme: North West Regional Report Summary. 3rd Quarter 2007/08 (October-Dec 2007)
MSB III Water Sector Programme: KwaZulu Natal Regional Report Summary. 3rd Quarter 2007/08 (October-Dec 2007)
MSB III Water Sector Programme: Gauteng Regional Report Summary. 3rd Quarter 2007/08 (October-Dec 2007)
MSB III Water Sector Programme: Eastern Cape Regional Report Summary. 3rd Quarter 2007/08 (October-Dec 2007)
MSB III Water Sector Programme. Volume I Consolidated Water Sector Report 3rd Quarter 2007/2008 (Oct- Dec 2008)

M i d - T e r m R e v i e w o f M a s i b a m b a n e I I I : A p r i l 2 0 0 7 – S e p t e m b e r 2 0 0 8
O v e r v i e w R e p o r t p.91
MSB III water Sector Programme Western Cape Regional Report Summary: 4th Quarter 2007/2008 (Jan- March 2008)
MSB III water Sector Programme North West Regional Report Summary: 4th Quarter 2007/2008 (Jan- March 2008)
MSB III water Sector Programme Mpumalanga Regional Report Summary: 4th Quarter 2007/2008 (Jan- March 2008)
MSB III water Sector Programme Limpopo Regional Report Summary: 4th Quarter 2007/2008 (Jan- March 2008)
MSB III water Sector Programme KwaZulu Natal Regional Report Summary: 4th Quarter 2007/2008 (Jan- March 2008)
MSB III water Sector Programme Gauteng Regional Report Summary: 4th Quarter 2007/2008 (Jan- March 2008)
MSB III water Sector Programme Free State Regional Report Summary: 4th Quarter 2007/2008 (Jan- March 2008)
MSB III water Sector Programme Eastern Cape Regional Report Summary: 4th Quarter 2007/2008 (Jan- March 2008)
Napakade T., 29 October 2009, Strengthening Sector Collaboration in the Water Sector, Power Point Presentation
SADC (2001) Revised Regional Protocol on Water
SADC (2006) Regional Water Policy. Gaborone: SADC Secretariat
South Africa (1996). The Constitution of the Republic of South Africa. Act 108 of 1996, adopted on 8 May and amended by the Constitutional Assembly on 11 October.
UNESCO. 2000 The Dublin Statement on Water and the Environment. Internet (http://www.unesco.org)
United Nations (UN), 1997. UN Convention on the Law of the non-Navigational Uses of Shared Watercourse.
Win-SA & DWAF, May 2008, Water Regulation Bulletin.

M i d - T e r m R e v i e w o f M a s i b a m b a n e I I I : A p r i l 2 0 0 7 – S e p t e m b e r 2 0 0 8
O v e r v i e w R e p o r t p.92

M i d - T e r m R e v i e w o f M a s i b a m b a n e I I I : A p r i l 2 0 0 7 – S e p t e m b e r 2 0 0 8
O v e r v i e w R e p o r t p.93
APPENDIX A: LIST OF INTERVIEWEES National Stakeholders:
Official Department/ Organisation
Responsibility
Cindy Damons DPLG Senior Manager: Free basic water supply Lorren Haywood CSIR Service provider: Mainstreaming Environment as cross
cutter in MSB Francis Craigie DEAT Chief Director: Compliance & EnforcEment Derek Weston Pegasys /former DWAF CMAs & WUAs William Moraka SALGA Manager: Water Services-SALGA Junior Potloane WISA Water for Growth and Development Jonathan Patrick National Treasury Director, Local Government Budget Process (Equitable
Share) Umesh Nathe National Treasury Budget Controller, DWAF and DPLG, Mike Marler DBSA Senior Project Manager Godfrey Mwiinga DBSA Specialist Advisor, Water and Sanitation Charles Reeve EU Kevin Wall CSIR/SAICE CSIR/SAICE Infrastructure report card Tinus Kruger CSIR Appropriate Technology PSP Leslie Steele Water Dialogues Researcher on community based water services provider
case study Mary Galvin Water Dialogues Research Coordinator
DWAF National List:
Official Responsibility Pam Yako DG: DWAF Thandeka Mbassa DDG: DWAF - Regions Rosetta Simelane Deputy Director: Social Development Shantel Harigobin Deputy Director: Water Services Policy and strategy Lebohang Moche Co-ordinator: Environment within Masibambane Jackie Nel Water Services Policy and strategy Thandia Kamdanje CME unit admin support Thoko Sigwaza Director: Water Sector Regulation Denis Mtsweni Councillor training programme Eustathia Bofilatos CMAs & WUAs Jenny Evans Deputy Director: W/S Support Louise Colvin DWAF Consultant Antonino Manas WS policy & strategy Mirandah Raborefe FBW Ndileka Mohapi WfG&D Noxolo Ncaphayi WfG&D Maxima WSDPs Nduduzi Zulu WSA/WSP arrangement Thobile Mthiyane Section 78 Silas Mbedzi DWAF Catchment Management Directorate Helen Moremong CSO Programme Helgard Muller Chief Director, Water Services in the Department of Water Affair and Forestry - DWAF Gilbert Morake Mosupye Deputy Director: Africa Relations Tabita Napakade Deputy Director: Sector Collaboration Lebohang Moche Assistant Director: Sector Collaboration Nasele Mehlomakhulu Resource Poor Farmers Support Mr Ngaka Machete HIV/AIDS Programme Mr Kgabo Sehlakgoe Gender Mainstreaming Mr Nthuse Monyela Appropriate Technology

M i d - T e r m R e v i e w o f M a s i b a m b a n e I I I : A p r i l 2 0 0 7 – S e p t e m b e r 2 0 0 8
O v e r v i e w R e p o r t p.94
Official Responsibility Ms Matjuda Mosibudi Masibambane Cross- Cutting Coordinator Ms Ditshego Magoro WINSA: Programme Manager Mr Jacob Mashishi Deputy Director: Gender Directorate Leonardo Manus Water Quality Management Thabiso Toko DWAF Finance Thad Malkovitz DWAF Contracts Fazel Ismail DWAF Finance
Provincial:
Province Official Responsibility Eastern Cape Nomonde Mnukwa Chief Director Lizna Fourie Institutional Establishment & Authorisation Andrew Lucas Director: Water Regulation & Use Moosa Bera Licensing officer Bongani Matomela MSB WSS co-ordinator Galelo Mbambisa Director: Projects & Implementation Theo Geldenhuys Regulation & Use Div de Villiers DEAT: Director IEM Compliance (provincial) Shakes Ndilele Forestry licensing unit Cobus Theron DEAT: Dep Director IEM Alfred Nzo region S. Nash ADM R. Smith ANDM M Dungu CHDM E. Spring PSU Johan de Wet Blue Crane Municipality Theo van Rensburg Water Resource Planning Simpiwe Ngilana Institutional Development Directorate (WUA’s and CMA’s) Rogers Jack Deputy Director: Projects & Implementation Gareth Muthumuni Backlog Task Team Coordinator Tshitsho Majavu DLGTA Limpopo Ramoano Masidigiri DWAF ISD manager Cyril Nemutudi MSB co-ordinator Limpopo region Faan Coetzee DEAT: IEM Compliance (provincial) Refilwe Pitsoe Mopani DM Morris Morrisey Asst. Mngr. Retail, Water Rex Ntileni Director Sector Support KZN Pat Reddy Regulation and Compliance Mr Bheki Ngubo Masibambane coordinator Rod Potter DEAT: IEM Compliance (provincial) Glen Singh Uthukela DM, Deputy of Water Free State Werner Boeing DEAT: IEM Compliance (provincial) Mpumalanga Jean de Beer DEAT: IEM Compliance (provincial) Willie Enright DWAF(RO-MP) Gauteng Rens Botha DWAF (RO-GP) Kemmy Oageer Director: Gauteng PG, Municipal Infrastructure Programme Ms Ntsebeng Monggae Unit Support Manager Western Cape Willie Enright DWAF (RO-WC) Ms Magamase Mange Assistant Director: Water Sector Support John Roberts Catchment Manager Breede Johan Visser Catchment Manager Gouritz Jannie van Staden BOCMA Patrick van Coller Gouritz Catchment water quality management

M i d - T e r m R e v i e w o f M a s i b a m b a n e I I I : A p r i l 2 0 0 7 – S e p t e m b e r 2 0 0 8
O v e r v i e w R e p o r t p.95
WSA / DM / LM Official Responsibility Ndlambe LM, EC Richard Pote Dep Director Infrastructure Alfred Nzo DM, EC Lumka Salukazana WSA Manager Alfred Nzo DM Mr Gulwa WSP manager Umzimvubu area Alfred Nzo DM Manegisi Mahahase Environmental Health officer Alfred Nzo DM Noluthando Chonco Water quality monitoring officer Mbizana LM, EC Yetbarek Ayano Director Infrastructure Umzimvubu LM, EC Msi Ndongeni LED officer Matatiele WSP, Alfred Nzo region Mme Maguwa Technician for WSP
Other / CSO:
Name Organisation Area / theme David Gardner SAVE (NGO) Vaal river system conservation Charlie Scott Hans Merensky Holdings Forestry development Eastern Cape Enver Mapanda Hans Merensky Holdings Forestry development Eastern Cape Chris Reay SAIMeCE Professional Engineering Placements Di Dold WESSA KZN region conservation Dr Leila Smith Mvula Trust CSO Mr Bryan Ashe South African Water Caucus CSO Mr Jerry Phalane Rural development Support
Network CSO
Rets Dolamo Mvula Trust FS CSO Mr Xola Ntobongwana- Mvula Trust KZN CSO Mr Frans Themba Operation Hunger CSO Mr Xola Mlandu CSO Chairperson CSO

M i d - T e r m R e v i e w o f M a s i b a m b a n e I I I : A p r i l 2 0 0 7 – S e p t e m b e r 2 0 0 8
O v e r v i e w R e p o r t p.96

M i d - T e r m R e v i e w o f M a s i b a m b a n e I I I : A p r i l 2 0 0 7 – S e p t e m b e r 2 0 0 8
O v e r v i e w R e p o r t p.97
APPENDIX B: METHODOLOGY The Mid-term Review was conducted within an extremely tight timeframe. The Inception Report was submitted on 6 February, and all fieldwork was completed on 31 March in order that the Draft Report could be submitted on 21 April 2009.
Phase Activity Description Deliverable / result Completion date Project Planning and Preparation
1.1 Finalise ToR / project plan (budget, activities, roles, responsibilities)
Inception Report 06 February 2009
1.2 Literature Review Literature Review 27 February 2009
1.3 Prepare Instruments WSA Questionnaire + in-depth-interview schedule
23 February 2009
1
1.4 Interview contacts identified & set up (National, Provincial, Local)
Schedule for all Interviews 23 February 2009
Data Gathering and Fieldwork
2.1 National Interviews National Interviews completed 20 March 2009
2.2 Provincial visits (forums & Interviews) Provincial visits completed 20 March 2009
2
2.3 Telephonic Interviews Telephonic Interviews completed 20 March 2009
Data Analysis
3.1 Analysis of Telephonic Survey Data Survey Data set 30 March 2009
3
3.2 Analysis of in-depth interview data (includes Provincial and National Interviews)
In-depth-Interview Data 30 March 2009
Drafting Report
4.1 Writing-up Draft Report Draft Report submitted 21 April 2009
4
4.2 Receive written feedback from DWAF, MCC, Key Stakeholders and Regions
18 May 2009
Finalising Report
5.1 Final Report prepared Final Report Submitted 29 May 2009
5
5.4 Final Workshop and presentation Presentations at Final workshop 15 May 2009
A multi-method approach19 was used for the Mid-term Review, focusing specifically on two key issues, namely:
▪ Relevance – does Masibambane III continue to target the priorities of its beneficiaries? If yes, how far has it come since the beginning of MSB I in doing so? How can this be deepened (or corrected, as appropriate) so that a phase III of MSB remains both justified and more sure of dealing with capacity issues, service provision backlogs, a changing inter-governmental environment, and the like?
▪ Effectiveness – are the planned objectives, results and activities of Masibambane III being achieved? If yes, how is this being achieved, if no what are the challenges preventing this? Do those problems still exist, and how can they be overcome during the second half of MSB III?
Where applicable, and relevant data was available, the issue of Efficiency was also assessed - are inputs (resources and time) being used in the best possible way to achieve the objectives of MSB III? If yes, how is this efficiency being achieved, if no what are the reasons for this inefficiency? What could be done to improve efficiency? How can further efficiencies be achieved in the final phase of MSB III?
19 This included a review of programme documentation, in-depth-interviews with key role players, and two telephonic surveys.
M i d - T e r m R e v i e w o f M a s i b a m b a n e I I I : A p r i l 2 0 0 7 – S e p t e m b e r 2 0 0 8
O v e r v i e w R e p o r t p.98
These 3 criteria were to be used in assessing each of the following core programme areas:
▪ Water and sanitation services ▪ Water Sector Support ▪ Institutional Support ▪ Transfers and Alignment ▪ Integrated Water Resource Management ▪ Programme Management
Furthermore, cross-cutting issues (as set out below) were assessed within each of these six core areas as well as stand-alone items in their own right, as follows:
▪ The participation of civil society organisations will be assessed in the manner in which they are providing training and support to, and advocacy in, the water sector.
▪ Environmental issues will be assessed with particular emphasis on capacity building and institutional support for WSA, and the mainstreaming of environment in the programme.
▪ Appropriate technology will be explored with special emphasis on the development and implementation of policy).
▪ Gender mainstreaming will be assessed covering not only the development and implementation of policy but also gender mainstreaming within delivery, within institutional development, within capacity building and within programme management, as well as separately assessed as a deliverable in its own right.
▪ HIV and AIDS will be assessed from both the development and the implementation of policy.
▪ Water for Growth and Development will be assessed at both the policy level and the implementation of actions within the sector.
The main emphasis of the evaluation was on a bottom-up approach, where the aims and objectives of the SWAP are tested in the field at local level. Inputs from DWAF and national sector structures are important, but the Review Teams also felt that it was critical that interviews were conducted at municipal level to gauge what works and whether or not it can be replicated; what does not work, and why. Therefore, the team conducted two telephonic surveys. The first survey was with the WSA Managers (of which 78% were interviewed). The second telephonic survey was aimed at regional stakeholders (particularly those who attend provincial forum) in order to understand their perceptions of the programme. (of whom 100 were interviewed).

M i d - T e r m R e v i e w o f M a s i b a m b a n e I I I : A p r i l 2 0 0 7 – S e p t e m b e r 2 0 0 8
O v e r v i e w R e p o r t p.99
Figure 26: Number of WSAs who responded, by province
The figure above shows that whilst all the WSAs in KwaZulu-Natal, responded to our request to interview them, this was not the case in all provinces. The Eastern Cape and the Northern Cape were the least responsive to our requests for an interview. However, of the WSAs who responded in all provinces, the majority (62%) had been in their current position for more than three years. The remainder (38%) had served in their current position for between one and two years.
Figure 27: Number of years WSA manager has been in their current position
With respect to the stakeholder questionnaire, the Eastern Cape provided the majority of stakeholders who completed the questionnaire. No stakeholders from either Mpumalanga or the Western Cape completed the questionnaire.

M i d - T e r m R e v i e w o f M a s i b a m b a n e I I I : A p r i l 2 0 0 7 – S e p t e m b e r 2 0 0 8
O v e r v i e w R e p o r t p.100
The majority of the respondents had participated in Water Sector Forums in the province for more than two years (79%).
Figure 28: Number of Stakeholders from provincial forums who completed the questionnaire
Figure 29: Number of years stakeholders had participated in Water Sector forums in the province

M i d - T e r m R e v i e w o f M a s i b a m b a n e I I I : A p r i l 2 0 0 7 – S e p t e m b e r 2 0 0 8
O v e r v i e w R e p o r t p.101
At the provincial level, the Review Team visited as many provincial fora as possible, bearing in mind that not all provinces will necessarily be holding such meetings during the period this evaluation was conducted, as the following table illustrates.
Table 18: Schedule and status of provincial forums held during the fieldwork phase of the MTR of MSB III
Province Schedule Date Status Gauteng 8 April 2009 Confirmed Free State 13 March 2009 Postponed indefinitely Limpopo 12 March 2009 Meeting held on 23 March 2009. Mpumalanga 27 March 2009 Postponed indefinitely North West 19 March 2009 Postponed due to Cholera epidemic Northern Cape No scheduled date for next meeting Eastern Cape 11 March 2009 Confirmed KwaZulu Natal 2 April 2009 Postponed indefinitely Western Cape No meeting currently scheduled At the national level, structured in-depth interviews were held with all the key stakeholders in the sector, including officials from all the key departments within the sector (See Appendix A for details of person interviewed). The two surveys were analysed using descriptive statistics, which in turn were combined with the qualitative data (such as notes from interviews, official reports and so on) to provide a detailed analysis of each aspect of MSB III. In order to standardize this analysis a scoring system was used in order to rate each component of MSB III. Each axes of the evaluation (i.e. relevance, effectiveness) have been scored using the following scale:
Table 19: Scoring system used in the MTR of MSB III
Score Assessment Category Aggregated Score
1 Highly unsatisfactory 2 Unsatisfactory 3 Moderately unsatisfactory
UNSATISFACTORY
4 Moderately satisfactory 5 Satisfactory 6 Highly satisfactory
SATISFACTORY

M i d - T e r m R e v i e w o f M a s i b a m b a n e I I I : A p r i l 2 0 0 7 – S e p t e m b e r 2 0 0 8
O v e r v i e w R e p o r t p.102