migration, and skills disparities across the canadian provinces by serge coulombe &...
Post on 18-Dec-2015
217 views
TRANSCRIPT

Migration, and skills disparitiesacross the Canadian provinces
By Serge Coulombe
& Jean-François Tremblay
Department of Economics
University of Ottawa
We are grateful to Ivelina DeLeva and Betty You for research assistance and to the HRDC-IC-SSHRC Skills Research Initiative for financing.
Motivations of the study
• Human capital (H) one of the key determinants of living standards across developed countries
• H (output) is “produced” by a combination of factors or inputs such as (years of schooling, quality of education, experience and pertinence of experience).
• In standard approaches (labour economics, development accounting) H is measured by an input most specifically schooling, S
• We provide output measures of the aggregate human capital intensity of Canada and the ten provinces from skill data (IALLS 2003)
Skills matter
-.3
-.2
-.1
.0
.1
.2
.3
-.10 -.05 .00 .05 .10
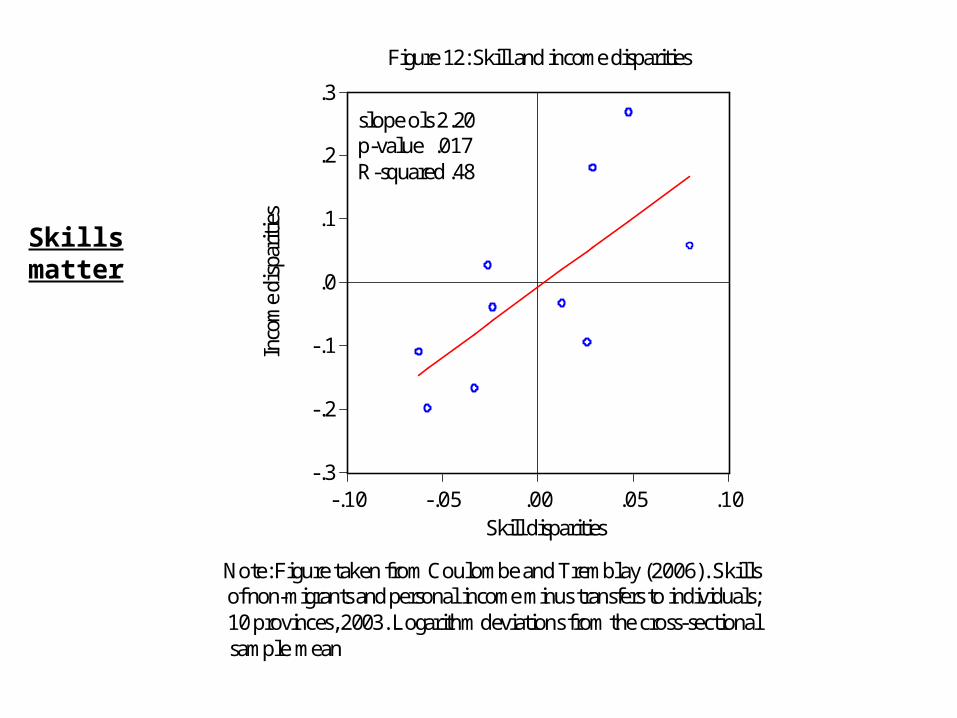
Figure 12: Skill and income disparities
slope ols 2.20p-value .017R-squared .48
Inco
me
disp
arit
ies
Skill disparities
Note: Figure taken from Coulombe and Tremblay (2006). Skills of non-migrants and personal income minus transfers to individuals; 10 provinces, 2003. Logarithm deviations from the cross-sectional sample mean
Motivations of the study
• Does-it matters to use an input or and output measure?• Answer: YES when comes the time to measure the
contribution of international immigration (II) to the human capital intensity
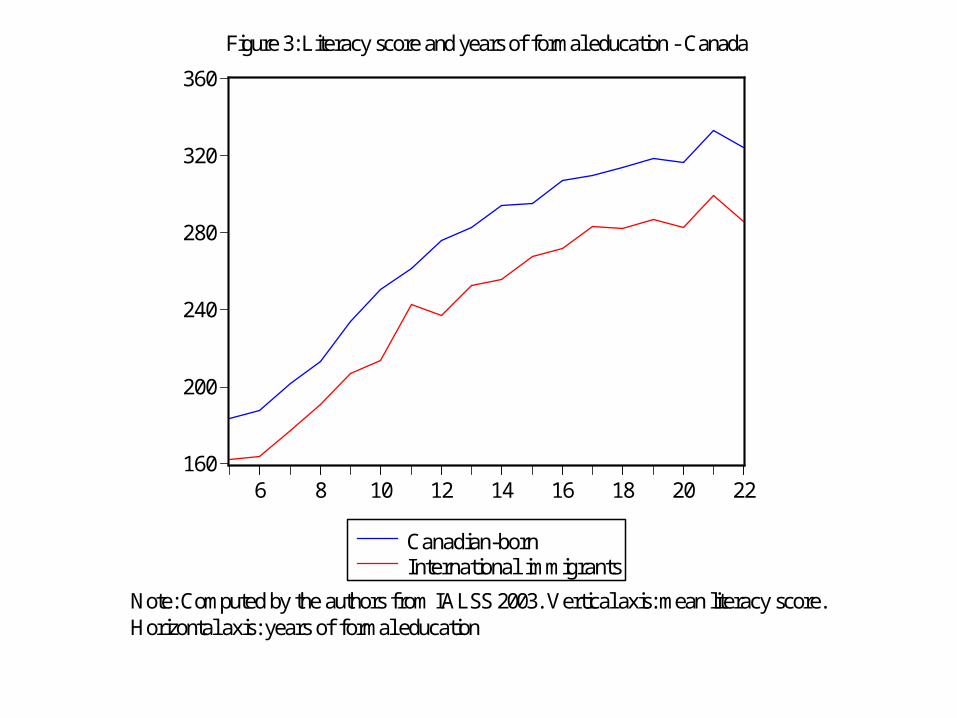
• Why? International immigrants have more years of schooling but substantially less skills (Skill-schooling gap) than the Canadian-born population
• Does-it matter a lot? YES, From a schooling measure, II contribute to slightly decrease human capital disparities across provinces, from a skill measure, the effect of II is to decrease regional disparities by 45%
Data
• Construction of aggregate data base from raw data of 2003 Canadian sample of International Adult Literacy and Skills Survey (IALSS)
• IALSS designed to capture skill differences across countries and across subgroups of the population with different cultural backgrounds.
• IALSS is a stratified multi-stage sample, population 16 years and over, we use a sample of 20 019 respondants, from the ten provinces, 16 559 Canadian-born, and 3460 foreign-born
• Average data from four literacy domains: prose, document, numeracy, and problem solving
Two Contributions of the paper
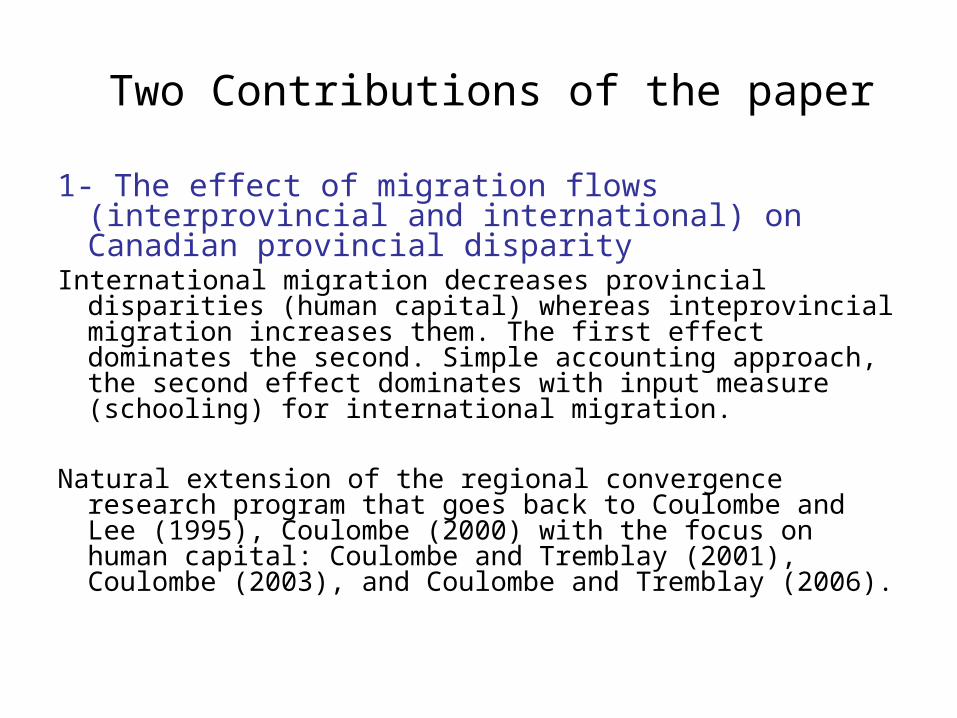
1- The effect of migration flows (interprovincial and international) on Canadian provincial disparity
International migration decreases provincial disparities (human capital) whereas inteprovincial migration increases them. The first effect dominates the second. Simple accounting approach, the second effect dominates with input measure (schooling) for international migration.
Natural extension of the regional convergence research program that goes back to Coulombe and Lee (1995), Coulombe (2000) with the focus on human capital: Coulombe and Tremblay (2001), Coulombe (2003), and Coulombe and Tremblay (2006).
Second: Schooling is a biased indicator of human capital at the cross-country level
This is the natural extension of our recent research program on explaining cross-country differences in living standards with a special emphasis on human capital
Borjas (1987) (earning is associated with Q (EQ))
Klenow and Rodriguez-Clare (1997) (development accounting, EQ)
Hendricks (2002) (development accounting, EQ)
Manuelli and Seshadri (2005) (development accounting, theory of EQ)
Sweetman (2004) (Canadian immigrant and quality of education, Skill with Q)
Ferrer, A., D. A. Green, and W. C. Riddell (2004) (micro skills of international migrants)
Coulombe, Tremblay and Marchand (2004) (growth regression, Schooling versus skill)
Coulombe and Tremblay (2006) (Canadian province versus CTM 2004)
I- International migration and the skill-schooling gap
H=F(S, Q, …)
160
200
240
280
320
360
6 8 10 12 14 16 18 20 22
Canadian-bornInternational immigrants
Figure 3: Literacy score and years of formal education - Canada
Note: Computed by the authors from IALSS 2003. Vertical axis: mean literacy score.Horizontal axis: years of formal education
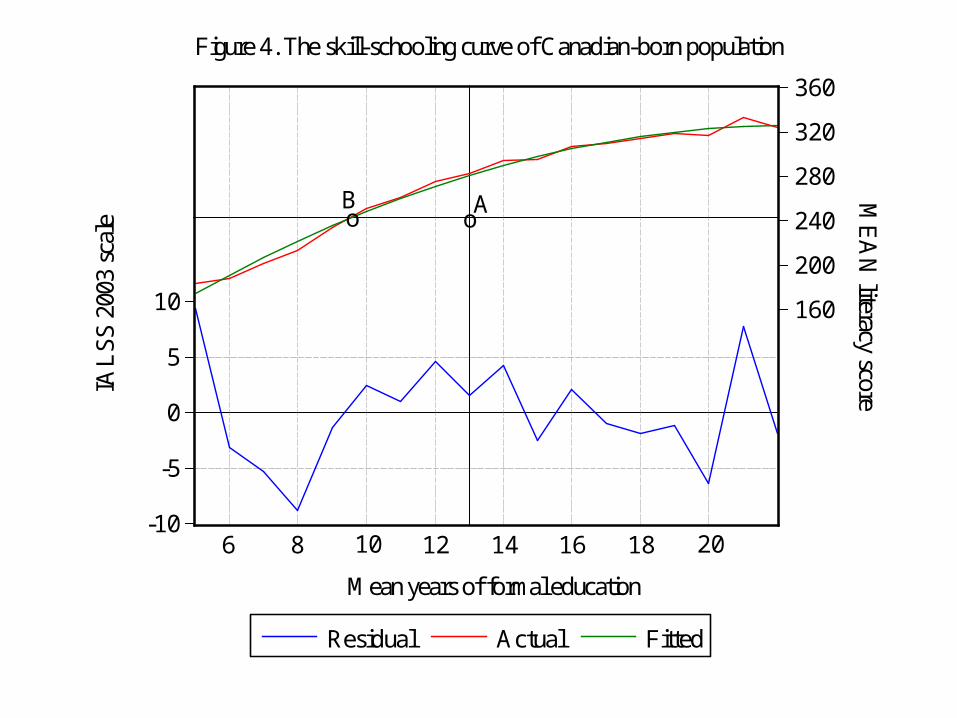
-10
-5
0
5
10 160
200
240
280
320
360
Residual Actual Fitted
Figure 4. The skill-schooling curve of Canadian-born population
ME
AN
literacy score
Mean years of formal education
6 8 10 12 14 16 18 20
ooAB
IAL
SS
200
3 sc
ale
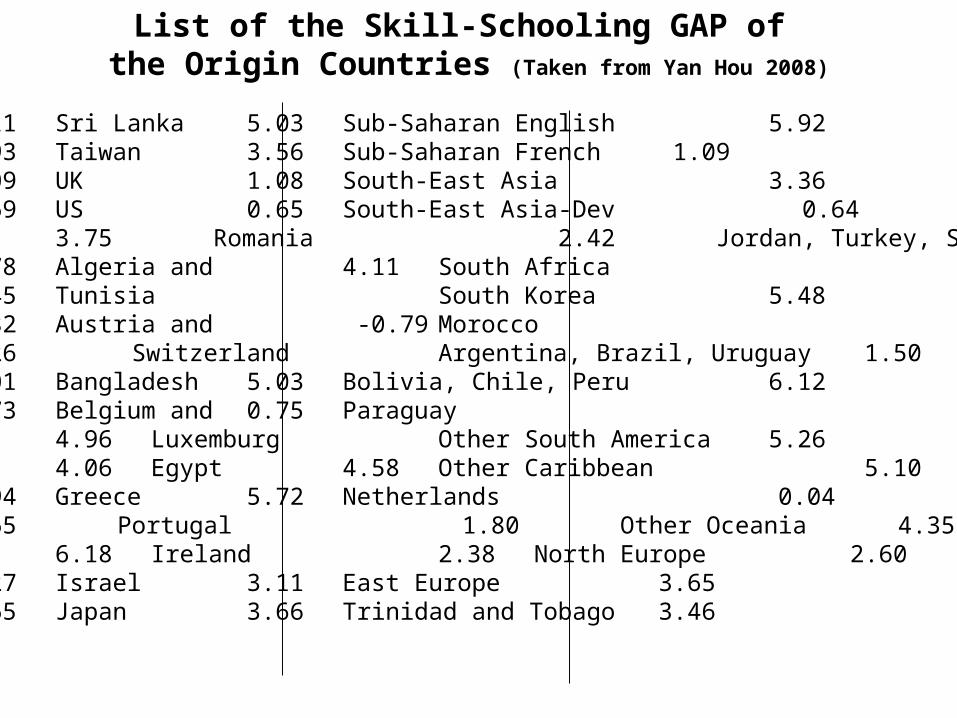
China 4.11 Sri Lanka 5.03 Sub-Saharan English 5.92EI Salvador 4.93 Taiwan 3.56 Sub-Saharan French 1.09France 2.09 UK 1.08 South-East Asia 3.36USSR 5.69 US 0.65 South-East Asia-Dev 0.64Vietnam 3.75 Romania 2.42 Jordan, Turkey, Syria 3.95Guyana 3.78 Algeria and 4.11 South Africa -0.16Germany 2.45 Tunisia South Korea 5.48HK 2.82 Austria and -0.79 Morocco 5.10India 5.26 Switzerland Argentina, Brazil, Uruguay 1.50Iran 3.01 Bangladesh 5.03 Bolivia, Chile, Peru 6.12Italy 1.73 Belgium and 0.75 ParaguayJamaica 4.96 Luxemburg Other South America 5.26Lebanon 4.06 Egypt 4.58 Other Caribbean 5.10Mexico 3.94 Greece 5.72 Netherlands 0.04Haiti 5.65 Portugal 1.80 Other Oceania 4.35Pakistan 6.18 Ireland 2.38 North Europe 2.60Philippines 4.27 Israel 3.11 East Europe 3.65Poland 5.65 Japan 3.66 Trinidad and Tobago 3.46
List of the Skill-Schooling GAP of the Origin Countries (Taken from Yan Hou 2008)
0
1
2
3
4
5
6
7
0 5000 10000 15000 20000 25000 30000
per capita income
skill
-sch
oolin
g ga
p
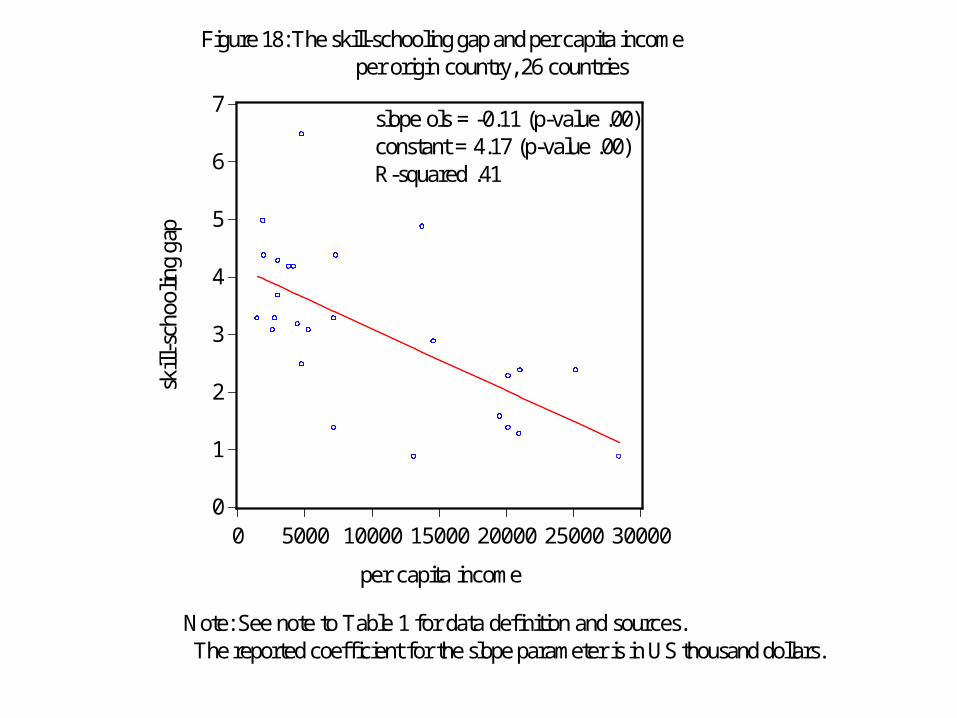
Figure 18: The skill-schooling gap and per capita income per origin country, 26 countries
slope ols = -0.11 (p-value .00)constant = 4.17 (p-value .00)R-squared .41
Note: See note to Table 1 for data definition and sources. The reported coefficient for the slope parameter is in US thousand dollars.
0
1
2
3
4
2.52.6
1.3
2.9
3.4
2.5
2.11.9 1.8 1.8
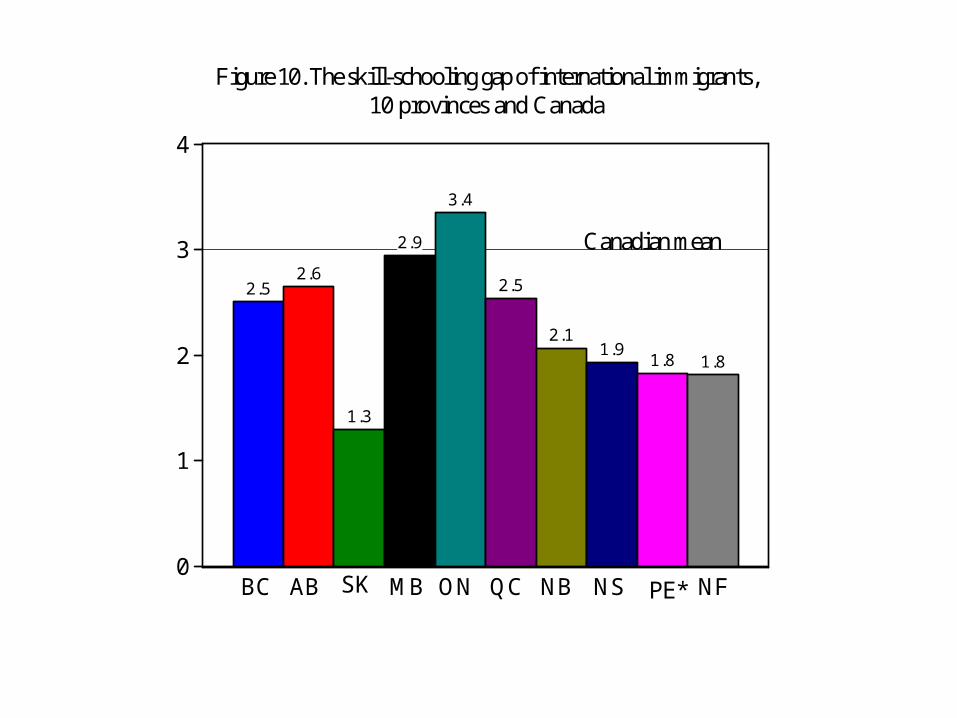
Figure 10. The skill-schooling gap of international immigrants,10 provinces and Canada
BC AB SK MB ON QC NB NS PE* NF
Canadian mean
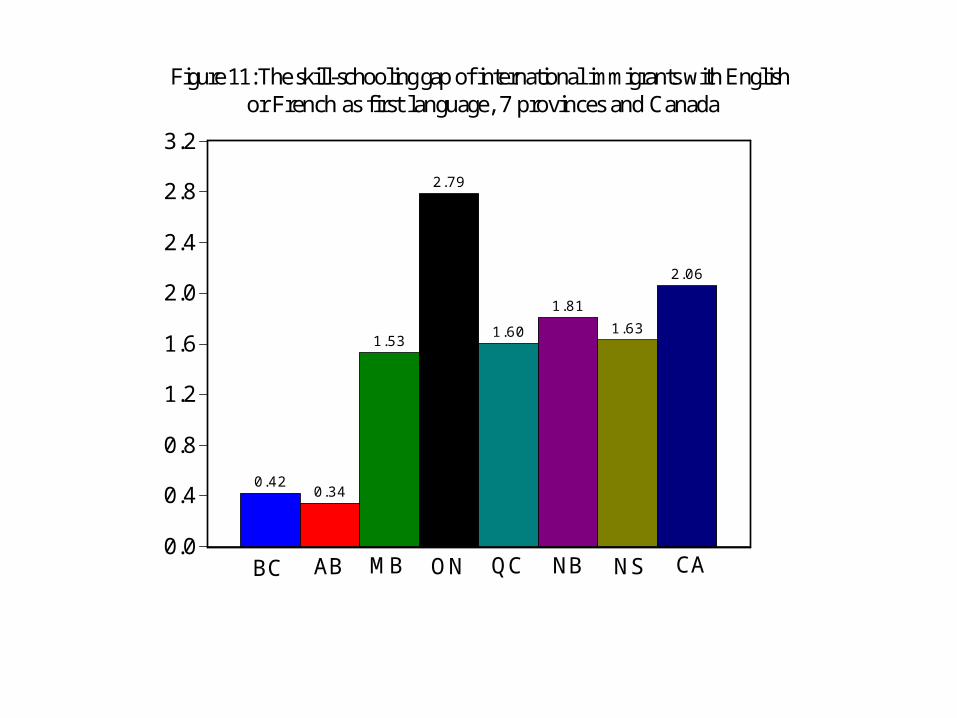
0.0
0.4
0.8
1.2
1.6
2.0
2.4
2.8
3.2
0.420.34
1.53
2.79
1.60
1.811.63
2.06
BC AB MB ON QC NB NS CA
Figure 11: The skill-schooling gap of international immigrants with English or French as first language, 7 provinces and Canada
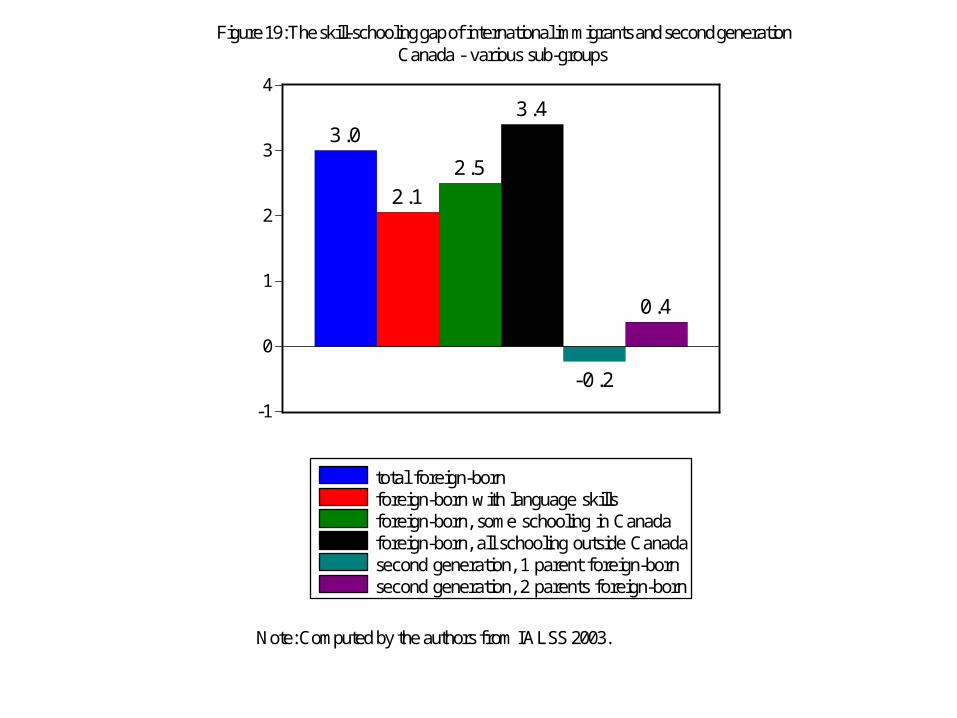
-1
0
1
2
3
4
3.0
2.12.5
3.4
-0.2
0.4
total foreign-bornforeign-born with language skillsforeign-born, some schooling in Canadaforeign-born, all schooling outside Canadasecond generation, 1 parent foreign-bornsecond generation, 2 parents foreign-born
Figure 19: The skill-schooling gap of international immigrants and second generationCanada - various sub-groups
Note: Computed by the authors from IALSS 2003.
II- Migration and provincial disparity
• Skill intensity of foreign-born population varies widely across provinces
Tends to reduce provincial disparities
• Typical interprovincial migrant has a skill level higher than the non-migrant
Skill redistribution process from the poorer to the richer Canadian provinces
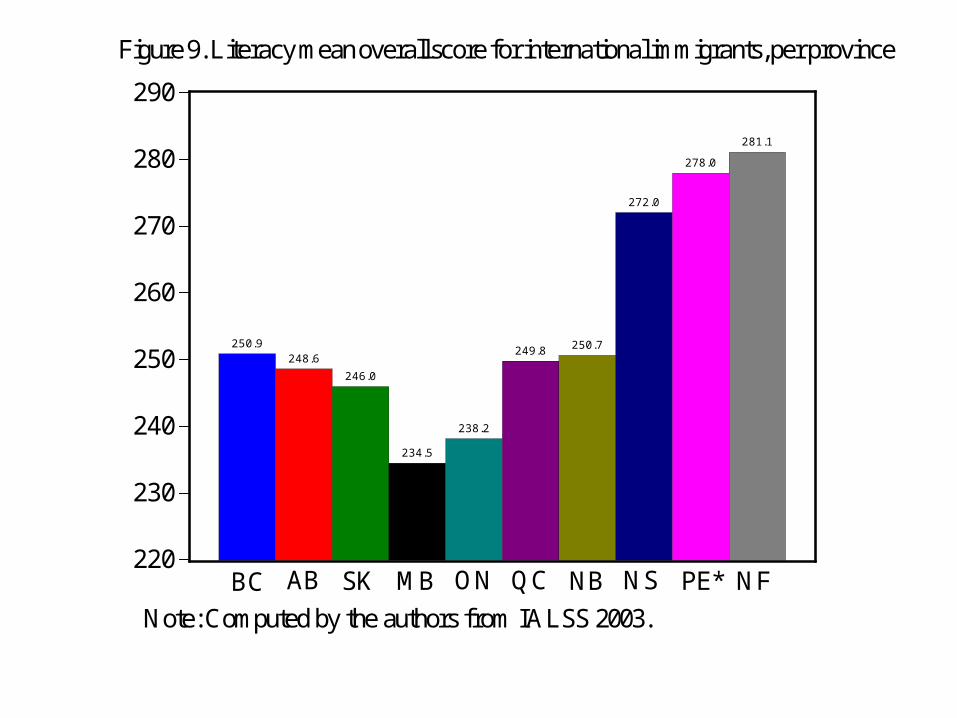
220
230
240
250
260
270
280
290
250.9248.6
246.0
234.5
238.2
249.8 250.7
272.0
278.0
281.1
Figure 9. Literacy mean overall score for international immigrants, per province
BC AB SK MB ON QC NB NS PE* NF
Note: Computed by the authors from IALSS 2003.
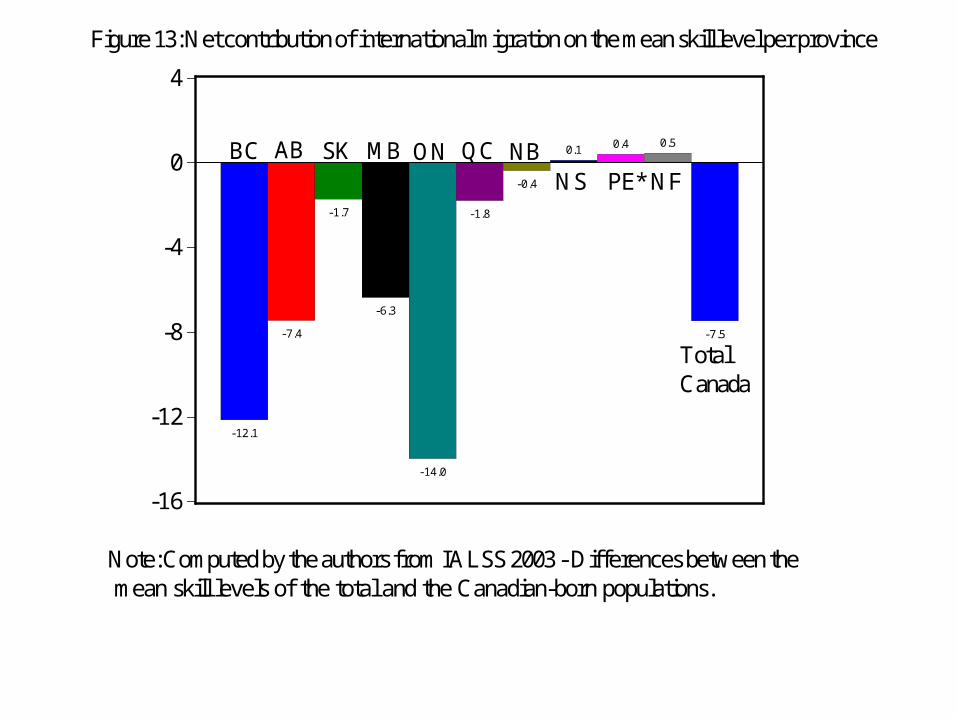
-16
-12
-8
-4
0
4
-12.1
-7.4
-1.7
-6.3
-14.0
-1.8
-0.4
0.1 0.4 0.5
-7.5
Figure 13: Net contribution of international migration on the mean skill level per province
BC AB SK MB ON QC NBNS PE* NF
TotalCanada
Note: Computed by the authors from IALSS 2003 - Differences between the mean skill levels of the total and the Canadian-born populations.
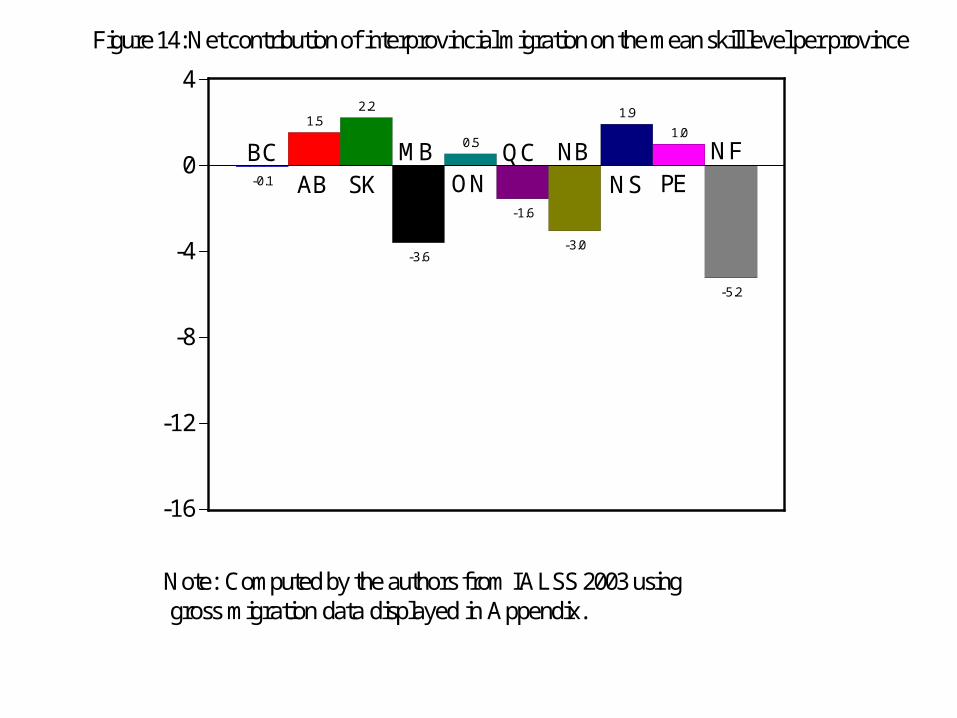
-16
-12
-8
-4
0
4
-0.1
1.52.2
-3.6
0.5
-1.6
-3.0
1.91.0
-5.2
Figure 14: Net contribution of interprovincial migration on the mean skill level per province
ABBC
SKMB
ONQC NB
NS PENF
Note: Computed by the authors from IALSS 2003 using gross migration data displayed in Appendix.

Net effect of both channels on provincial disparity
• A - The dispersion (SD) of skill intensity across Canadian provinces is reduced by 45 percent when international immigration is accounted for. (By comparison, international immigration reduces the
dispersion in years of schooling by only 9 percent ) • B - Interprovincial migration accounts for an
increase of 21 percent of the dispersion of the skill intensity across the Canadian provinces.
• Effect A dominates B, result from the skill (instead of schooling) approach
Main findings
• Schooling is a biased indicator of human capital (skills) at the cross-country level
Potential implications for the immigration selection process and for Foreign Credential Recognition (FCR) program: recognize and select from skills
• International immigration and interprovincial migration have opposite effects on provincial disparities
Net effect is to decrease disparities