milky way mass constraints from the galactic satellite gap
TRANSCRIPT

Mon. Not. R. Astron. Soc. 000, 000–000 (0000) Printed 12 October 2018 (MN LATEX style file v2.2)
Milky Way mass constraints from the Galactic satellite gap
Marius Cautun1,2?, Carlos S. Frenk1, Rien van de Weygaert2, Wojciech A.Hellwing1,3 and Bernard J. T. Jones2
1 Department of Physics, Institute for Computational Cosmology, University of Durham, South Road Durham DH1 3LE2 Kapteyn Astronomical Institute, University of Groningen, P.O. Box 800, 9747 AV Groningen, The Netherlands3 Interdisciplinary Centre for Mathematical and Computational Modellings, University of Warsaw, ul. Pawinskiego 5a, Warsaw, Poland
12 October 2018
ABSTRACTWe use the distribution of maximum circular velocities, Vmax, of satellites in the MilkyWay (MW) to constrain the virial mass, M200, of the Galactic halo under an assumedprior of a ΛCDM universe. This is done by analysing the subhalo populations of a largesample of halos found in the Millennium II cosmological simulation. The observationthat the MW has at most three subhalos with Vmax > 30 km/s requires a halo massM200 6 1.4× 10¹²M, while the existence of the Magellanic Clouds (assumed to haveVmax > 60 km/s) requires M200 > 1.0 × 10¹²M. The first of these conditions isnecessary to avoid the “too-big-to-fail” problem highlighted by Boylan-Kolchin et al.,while the second stems from the observation that massive satellites like the MagellanicClouds are rare. When combining both requirements, we find that the MW halo massmust lie in the range 0.25 6 M200/(1012M) 6 1.4 at 90% confidence. The gap inthe abundance of Galactic satellites between 30 km/s 6 Vmax 6 60 km/s places ourgalaxy in the tail of the expected satellite distribution.
Key words: Galaxy: abundances - Galaxy: halo - dark matter - Cosmology: N-bodysimulations
1 INTRODUCTION
Due to their proximity, the Milky Way (MW) and its satel-lite galaxies provide an unparalleled dataset for testing as-trophysical and cosmological ideas. For example, resolvingthe stellar content of the dwarf spheroidals enables tests ofgalaxy formation and evolution theory (Grebel 2005); ana-lyzing their internal kinematics constrains the nature of theirdark matter content (e.g. Strigari, Frenk & White 2010);detecting satellites three orders of magnitude fainter thanin external galaxies (e.g. Willman et al. 2005) provides in-formation on the physics of extreme, very low luminositygalaxies. Given that the MW satellites play such a promi-nent role, it is important to investigate how representativethe MW substructures are of systems of this kind.
Several alleged points of tension between observationsand predictions of the standard cosmological model, ΛCDM,concern properties of the MW and its satellites. One is anapparent discrepancy between the predicted distribution ofthe maximum circular velocity, Vmax, of the most massivesubhalos and the inferred values for the MW satellites. Thisis often referred to as the “satellite problem”, and was orig-
? E-mail : [email protected]
inally identified by Klypin et al. (1999) and Moore et al.(1999). Another variant of this discrepancy was recentlyhighlighted by Parry et al. (2012) and by Boylan-Kolchin,Bullock & Kaplinghat (2011, 2012) who dubbed it the “too-big-to-fail” problem.
Various arguments based on the kinematics of the ninebright “classical” dwarf spheroidal satellites of the MW sug-gest that they reside in subhalos with maximum circularvelocities of Vmax<
∼ 30 km/s (Penarrubia, McConnachie &Navarro 2008; Strigari et al. 2008; Lokas 2009; Walker et al.2009; Wolf et al. 2010; Strigari, Frenk & White 2010), oreven Vmax<
∼ 25 km/s (Boylan-Kolchin, Bullock & Kapling-hat 2012). If this is indeed the case, only the two Magel-lanic Clouds (MCs) and the Sagittarius dwarf would residein dark matter substructures with larger maximum velocitythan this. Using the Aquarius simulations (Springel et al.2008), Boylan-Kolchin, Bullock & Kaplinghat (2011, 2012)argued that having at most three massive satellites withVmax > 30 km/s in the MW is in conflict with current under-standing of galaxy formation and evolution within ΛCDM:simulations produce, on average, eight, not three, subhaloswith Vmax larger than 30 km/s. At face value, this wouldrequire the most massive substructures to be devoid of starswhen less massive objects are not. This is not expected in
c© 0000 RAS
arX
iv:1
405.
7697
v2 [
astr
o-ph
.CO
] 2
3 O
ct 2
014

2 Cautun et al.
models of how galaxies populate low mass halos (e.g. Bensonet al. 2002) and could signal a fundamental shortcoming ofthe ΛCDM model itself. A similar conclusion was indepen-dently reached by Parry et al. (2012) from hydrodynamicsimulations of galaxy formation in some of the Aquarius ha-los.
A possible solution to the “too-big-to-fail” (TBTF)problem was put forward by Wang et al. (2012, hereafterWang12). Using the approximate invariance of the scaledsubhalo maximum velocity function with host halo mass (seee.g. Moore et al. 1999; Kravtsov et al. 2004; Zheng et al.2005; Springel et al. 2008; Weinberg et al. 2008), Wang12derived statistics for galactic subhalos and estimated theprobability that a Milky Way halo contains three or fewersatellites with Vmax > 30 km/s, as a function of the hosthalo mass. These results were further refined by Cautunet al. (2014, hereafter C14), who developed a better methodfor estimating the abundance of galactic subhalos in cos-mological simulations. Both studies found that rather thanruling out ΛCDM, the small number of massive satellites inour galaxy imposes an upper limit to the mass of the MWhalo if ΛCDM is the correct model. They found that theMW satellite data are consistent with ΛCDM predictions atthe 10% confidence level if the MW halo has a virial mass< 1.3 × 10¹²M, which is near the lower end of commonlyaccepted values. A similar solution to the TBTF problemwas proposed by Purcell & Zentner (2012), who comparedthe structure of MW satellites with that of subhalos pre-dicted by a semi-analytical model. They recognized that thesolution to the problem requires the mass of the MW haloto be below a certain value that, however, is significantlylarger than the value we find in this paper.
A low MW halo mass, however, has a large impact onthe probability of finding the two MCs, which are rathermassive. Recent estimates with HST data find maximumcircular velocities of (92 ± 19) km/s and (60 ± 5) km/s forthe Large and Small Magellanic Clouds respectively (Kalli-vayalil et al. 2013; van der Marel & Kallivayalil 2014), whichbroadly agree with measurements based on HI and stellarkinematics (e.g. van der Marel et al. 2002; Stanimirovic,Staveley-Smith & Jones 2004; Harris & Zaritsky 2006; Olsen& Massey 2007). Simulation studies agree that, in ΛCDM,substructures with the mass of the MCs are common in mas-sive galactic halos, of mass ∼ 2− 3× 10¹²M, but are quiterare in halos of lower mass, <
∼ 1× 10¹²M (Boylan-Kolchin,Besla & Hernquist 2011; Busha et al. 2011a,b; Gonzalez,Kravtsov & Gnedin 2013). Galaxy redshift survey data in-dicate that galaxies with luminosity similar to the MW have∼4% probability of hosting two satellites like the MCs (Liuet al. 2011; Guo et al. 2011; Lares, Lambas & Domınguez2011). Taking into account both mass and orbital data forthe two MCs, Busha et al. (2011a) and Gonzalez, Kravtsov& Gnedin (2013) estimate a mass of ∼1.2× 10¹²M for theMW halo, in contradiction with the conclusion of Boylan-Kolchin, Besla & Hernquist (2011), which, using similar con-siderations, found that the MW halo mass is unlikely to beless than 2 × 10¹²M. The former is consistent with theconstraint of Wang12 but the latter is not.
In this paper we investigate the constraints that themassive satellite population of the MW sets on the mass ofits dark matter halo in the context of the ΛCDM model.In addition, we remark on the peculiar gap in the number
of satellites in the MW, with at most one satellite in therange 30 km/s 6 Vmax 6 60 km/s. The TBTF problem ispredicated on the basis of this gap. Such gaps are rare in oursimulations and might signal a tension between the ΛCDMmodel and observations. However, it is not clear how an aposteriori argument of this nature can be put on a properstatistical basis. This study was possible by making use of alarge and representative sample of simulated halos for whichwe determine the subhalo number statistics down to Vmax ∼15 km/s using the extrapolation method presented in C14.
The remainder of this paper is organized as follows. In§2 we give a description of the simulations and of the methodwe employ to extend the dynamic range over which we derivesubhalo count statistics. In §4 we calculate the probabilityof finding MW-like subhalos as a function of halo mass. In§5 we examine the sensitivity of our results to model param-eters. We conclude in §6 with a brief summary of our mainresults.
2 THE SIMULATIONS
We make use of the high-resolution Millennium-II cosmo-logical N-body simulation (MS-II; Boylan-Kolchin et al.2009). MS-II follows the evolution of cold dark matter, us-ing 21603 particles to resolve structure formation in a peri-odic cube 100 h−1Mpc on a side. Each particle has a mass,mp = 9.44 × 10⁶M, so MW-sized halos (∼ 1012M) areresolved with ∼ 105 particles. This represents a good com-promise between having a representative sample of MW-likehalos and resolving the most massive 10 substructures perhost halo. The spatial resolution is given by the Plummer-equivalent force softening, ε = 1 h−1kpc, which was keptconstant in comoving coordinates for the entire simulation.MS-II uses the WMAP-1 cosmogony (Spergel et al. 2003)with the following cosmological parameters: Ωm = 0.23,ΩΛ = 0.75, h = 0.73, ns = 1 and σ8 = 0.9.
2.1 Halo finder
Halos and subhalos in the simulation were identified with therockstar (Robust Overdensity Calculation using K-SpaceTopologically Adaptive Refinement) phase-space halo finder(Behroozi, Wechsler & Wu 2013). rockstar starts by se-lecting potential halos as Friends-of-Friends (FOF) groupsin position space using a large linking length (b = 0.28).This first step is restricted to position space to optimizethe use of computational resources, while each subsequentstep is carried out using the full 6D phase-space informa-tion. Each FOF group from the first step is used to create ahierarchy of FOF phase-space subgroups by progressively re-ducing the linking length. The phase-space subgroups are se-lected with an adaptive phase-space linking length such thateach successive subgroup has 70% of the parent’s particles.rockstar uses the resulting subgroups as potential haloand subhalo centres and assigns particles to them based ontheir phase-space proximity. Once all particles are assignedto halos and subhalos, an unbinding procedure is appliedto keep only the gravitationally bound particles. The finalhalo centres are computed from a small region around thephase-space density maximum associated with each object.
The outer boundary of the halos is cut at the point
c© 0000 RAS, MNRAS 000, 000–000

Milky Way mass constraints from the Galactic satellite gap 3
where the enclosed overdensity decreases below ∆ = 200times the critical density, ρc. Therefore, the halo mass, M200,and radius, R200, correspond to a spherical overdensity of200ρc. Using this definition of the main halo boundaries wedefine the satellite population as all the subhalos within adistance, R200, from the host centre.
2.2 Subhalo number statistics
A challenge when studying galactic substructures in simula-tions is to achieve the large dynamic range required for allsubhalos above a certain threshold (Vmax > 30 km/s in ourcase) to be resolved for a statistically useful sample. Onestrategy is to run ensembles of very high resolution simu-lations of galactic halos. (e.g. Diemand et al. 2008; Madau,Diemand & Kuhlen 2008; Springel et al. 2008; Stadel et al.2009). However, the limited sample size, six in the Aquariusprogramme, the largest to date, limits the extent to whichthey can be used to study how common the MW satellitesystems are. The alternative strategy is to run simulationsof cosmological volumes that produce representative sam-ples of galactic halos, but are limited in resolution, so thatnot all the subhalos above the desired Vmax threshold are re-solved (Boylan-Kolchin et al. 2009; Klypin, Trujillo-Gomez& Primack 2011). For example, while MS-II captures allsubstructures with Vmax > 45 km/s, it only generates anincomplete population of less massive subhalos (see C14).To be able to use MS-II for our analysis we need to re-cover the full population of substructures down to at leastVmax = 30 km/s. We now summarize a procedure introducedin C14 for achieving this.
We are interested in the subhalo abundance as a func-tion of the ratio,
ν =Vmax
V200, (1)
between the subhalo maximum velocity, Vmax, and the virialvelocity, V200, of the host halo. We use this quantity to char-acterise the halo population because the maximum velocityprovides a robust measurement of subhalo size that is in-dependent of the identification algorithm and definition ofsubhalo boundary (for details see Onions et al 2012). More-over, since Vmax depends only on the mass distribution inthe central parts of the object, it allows for a closer compar-ison with observations that typically probe only the innerregions of a halo where the galaxy resides. We now quan-tify the statistics of the number of subhalos exceeding ν andconsider both the mean subhalo count, N(>ν), and the dis-persion, σ(>ν).
The effects of limited resolution on the subhalo numbercounts are illustrated in Fig. 1. It contrasts, as a functionof ν, the mean subhalo count of (0.8− 1.8)× 1013M masshaloes resolved at low resolution in the Millennium simu-lation (Springel et al. 2005) and at 125 times higher massresolution in the MS-II (reproduced from C14). The low res-olution calculation recovers the massive substructures, butonly finds a partial population of subhalos below ν ≈ 0.4.While the exact value of ν below which a given simulationmisses subhalos depends on several parameters, especiallythe number of particles used to resolve the host halo, thequalitative behaviour shown in Fig. 1 holds for a wide rangeof halo masses.
0
0.2
0.4
0.6
0.8
1
1.2
0.2 0.5 0.1 1
Nlo
w-r
es(ν
) /
Nhi
gh-r
es(ν
)
ν = Vmax/V200
Figure 1. The impact of numerical resolution on the num-ber of subhalos found in simulations. The plot shows the ratio,
N low−res(ν)/Nhigh−res(ν), between the mean subhalo count in a
low and a high resolution simulation. A ratio of one correspondsto recovering the full substructure population, while lower values
reflect missing subhalos in the low resolution simulation. Repro-
duced from C14.
The subhalo population statistics, N(>ν) and σ(>ν),can be recovered to up to three times lower values of ν thanis possible in the simulation itself by using the extrapolationmethod described in C14. The first step consists of quanti-fying how many substructures are missing at each value ofν in a given sample of equal mass halos. Once this is known,the method adds the missing subhalos using a probabilisticapproach. Each new subhalo is randomly assigned to one ofthe halos in the sample. This procedure recovers the sub-halo statistics, but not the substructure of individual halosor their spatial distribution.
By applying our extrapolation method to the MS-IIdata, in C14 we studied the subhalo number statistics downto substructures with Vmax ∼ 15 km/s. Here we summarisesome of the results of C14 that are of importance to thepresent study. In C14 we have found that the probabilitydistribution function (PDF) of the number of subhalos ex-ceeding ν is well modelled by a negative binomial distribu-tion (see also Boylan-Kolchin et al. 2010),
P (N |r, s) =Γ(N + r)
Γ(r)Γ(N + 1)sr(1− s)N , (2)
where Γ(x) = (x − 1)! denotes the Gamma function. Theparameters, r and s, are given in terms of the mean, N(>ν),and the variance, σ2(>ν), of the subhalo population by
r(>ν) =N
2(>ν)
σ2(>ν)−N(>ν)and s(>ν) =
N(>ν)
σ2(>ν). (3)
To obtain the substructure number distribution functions,we employ the mean and the dispersion of the subhalo popu-lation computed in C14. While in C14 these quantities werecomputed for halos in the mass range (0.8 − 3) × 1012M,the results are largely independent of the exact halo mass(see C14 and Fig. 4).
c© 0000 RAS, MNRAS 000, 000–000

4 Cautun et al.
0.2
0.4
0.6
0.8
1
0.3 0.5 0.7 1 2 3
p (≤
3, 3
0 km
/s)
M200 [1012 MO•]
this workWang et al. (2012)
10-3
10-2
0.1
100 150 200V200 [km/s]
Figure 2. The probability, p(63, 30 km/s), that a halo contains
at most three subhalos with Vmax > 30 km/s as a function of
the host virial velocity, V200, (lower tick marks) and virial mass,M200, (upper tick marks). The solid curve gives our results, while
the dashed line shows the previous results of Wang12. Note that
the y-axis is linear above 0.1 and logarithmic for lower values.
3 LIMITS ON THE MILKY WAY HALO MASS
In this section we use the subhalo statistics of galactic halosto constrain the mass of the MW halo assuming the ΛCDMmodel. As we discussed in the introduction, various studiessuggest that in the MW only the two MCs and the Sagit-tarius dwarf reside in halos of maximum circular velocity,Vmax > 30 km/s. HI and stellar kinematics data suggest thatthe subhalos of the MCs have Vmax > 60 km/s (Kallivayalilet al. 2013). Therefore, the MW has at most three subhaloswith Vmax > 30 km/s and at least two with Vmax > 60 km/s.We denote such a population of substructures as a MW-likesubhalo system.
We first obtain the fraction of halos containing threeor fewer subhalos with Vmax > 30 km/s in the ΛCDMmodel and, following Wang12, use this to set an upper limitto the MW halo mass. We then independently obtain theprobability that a halo has at least two substructures withVmax > 60 km/s and set a lower limit on the MW halo mass.
3.1 An upper limit to the Milky Way halo mass
The negative binomial distribution, P (k|r(>ν0), s(>ν0)), ofEq. 2 gives the PDF that a halo has k subhalos with velocityratio exceeding ν0 ≡ V0/V200. It is then straightforward toestimate the probability that a halo has at most X sub-structures with Vmax > V0. This is simply the fraction ofhalos that have at most X subhalos with ν > ν0 and can beobtained by summing over the subhalo abundance PDF atν0:
p(6X,V0) =
X∑k=0
P (k|r(>ν0), s(>ν0)) with ν0 =V0
V200.
(4)The distribution parameters, r(>ν) and s(>ν), are uniquelydetermined by the mean N(>ν) and scatter σ(>ν) of thesubhalo population via Eq. (3).
The fraction of galactic halos, p(63, 30 km/s), with at
0.2
0.4
0.6
0.8
1
0.3 0.5 0.7 1 2 3 4
p (≥
2, 6
0 km
/s)
M200 [1012 MO•]
this workBusha et al. (2011)
10-3
10-2
0.1
100 150 200 250V200 [km/s]
Figure 3. The probability, p(>2, 60 km/s), that a halo contains
at least two subhalos with Vmax > 60 km/s as a function of the
host virial velocity, V200, (lower axis), and virial mass, M200,(upper axis). The solid curve shows our predictions, while the
filled circles show the results of Busha et al. (2011b). Note that
the y-axis is linear above 0.1 and logarithmic for lower values.
Table 1. The fraction of MS-II halos with massive subhalos
similar to those of the MW. The table lists the probability,p(63, 30 km/s), of finding at most three subhalos with Vmax >30 km/s, and the probability, p(>2, 60 km/s), of finding at least
two subhalos with Vmax > 60 km/s. The last row gives the com-bined probability of satisfying both conditions simultaneously.
Halo mass [×1012M] 0.5 0.7 1 2
p(63, 30 km/s) [%] 80 59 33 2.3
p(>2, 60 km/s) [%] 2.2 4.7 10 30
p(>2, 60 km/s;63, 30 km/s) [%] 0.8 0.7 0.4 0.04
most three subhalos with Vmax > 30 km/s is given in Fig.2 as a function of the host virial velocity, V200 (lower tickmarks), and, equivalently, host virial mass, M200 (upper tickmarks). For clarity, we plot the halo fraction on a linear scalefor values larger than 0.1 and on a logarithmic scale forsmaller values. The probability of having at most three sub-halos with Vmax > 30 km/s, shown as a thick red curve, is asteep function of host mass, decreasing from 33% at 1012Mto 0.1% at 3× 10¹²M. For convenience, we summarize theprobabilities for indicative halo masses in Table 1. Underthe assumption that ΛCDM is the correct model, our resultsthen imply a 90% confidence upper limit of 1.4×10¹²M forthe virial mass of the MW halo, M200; a mass of 2×10¹²Mis ruled out at 97.7% confidence.
The probability of finding at most three halos withVmax > 30 km/s as a function of V200 was previously derivedby Wang12 whose results are shown by the dashed curve inFig. 2. We find slightly lower upper limits than them forthe mass of the MW halo because they underestimated thesubhalo mass at which resolution effects become important.As a result, they found 20% fewer substructures than wedo (see C14 for more details), causing them to overestimatep(63, 30 km/s) at a given halo mass.
c© 0000 RAS, MNRAS 000, 000–000
Milky Way mass constraints from the Galactic satellite gap 5
3.2 A lower limit to the Milky Way halo mass
The fraction of halos which have at least X subhalos withVmax > V0 can be expressed as
p(>X,V0) = 1− p(6X−1, V0) , (5)
with p(6X−1, V0) given by Eq. (4).The probability, p(>2, 60 km/s), of a halo hosting at
least two subhalos with Vmax > 60 km/s is shown as a solidcurve in Fig. 3. This represents the fraction of halos thathost MCs-like or more massive substructures as a functionof the V200 or M200 of the host halo. This probability issmall in low mass halos but increases rapidly towards moremassive hosts. Therefore, assuming ΛCDM, p(>2, 60 km/s)sets a lower limit on the MW halo mass. From Fig. 3, wefind a lower limit of 1.0× 10¹²M for the mass of the MWhalo at 90% confidence.
The probability of finding two or more substructureswith Vmax > 60 km/s in galactic halos was previously esti-mated by Busha et al. (2011b) whose results are shown asfilled circles in Fig. 3. Our values are a factor of a few higherthan theirs. We suspect that the difference arises becauseBusha et al. (2011b) used the Bolshoi simulation (Klypin,Trujillo-Gomez & Primack 2011) which misses a large num-ber of MCs-like substructures due to numerical resolution ef-fects. Bolshoi has approximatively the same number of darkmatter particles as MS-II, but a volume ∼15 times larger.Given that MS-II misses subhalos with Vmax < 45 km/s(see C14), we suspect that the Bolshoi simulation under-estimates the number of substructures with Vmax below45 km/s× 151/3 ∼ 100 km/s.
4 THE MASS DISTRIBUTION OF THE MW
In this section we estimate the mass of the MW, given thatour galaxy contains at most three subhalos with Vmax >30 km/s, out of which two have at least Vmax > 60 km/s,to which we refer as a MW-like subhalo system. A crucialingredient of this analysis is the correlation between thepresence of satellites with Vmax > 60 km/s and those withVmax > 30 km/s, which we estimate from cosmological sim-ulations. This is in contrast to the results of the previoussection which treated the two satellite populations as inde-pendent, which is clearly not the case.
To obtain the mass distribution of haloes that con-tain MW-like satellite systems, we compute the probability,p(>X1, V1; 6X2, V2), that a halo contains at least X1 sub-halos with Vmax > V1 and at most X2 substructures withVmax > V2. As we shall see later, this probability is quitesmall for the kind of MW subhalos of interest here and thusa large sample of halos is required for a robust estimate. Dueto its limited volume, the MS-II does not provide sufficientstatistics for galactic halos.
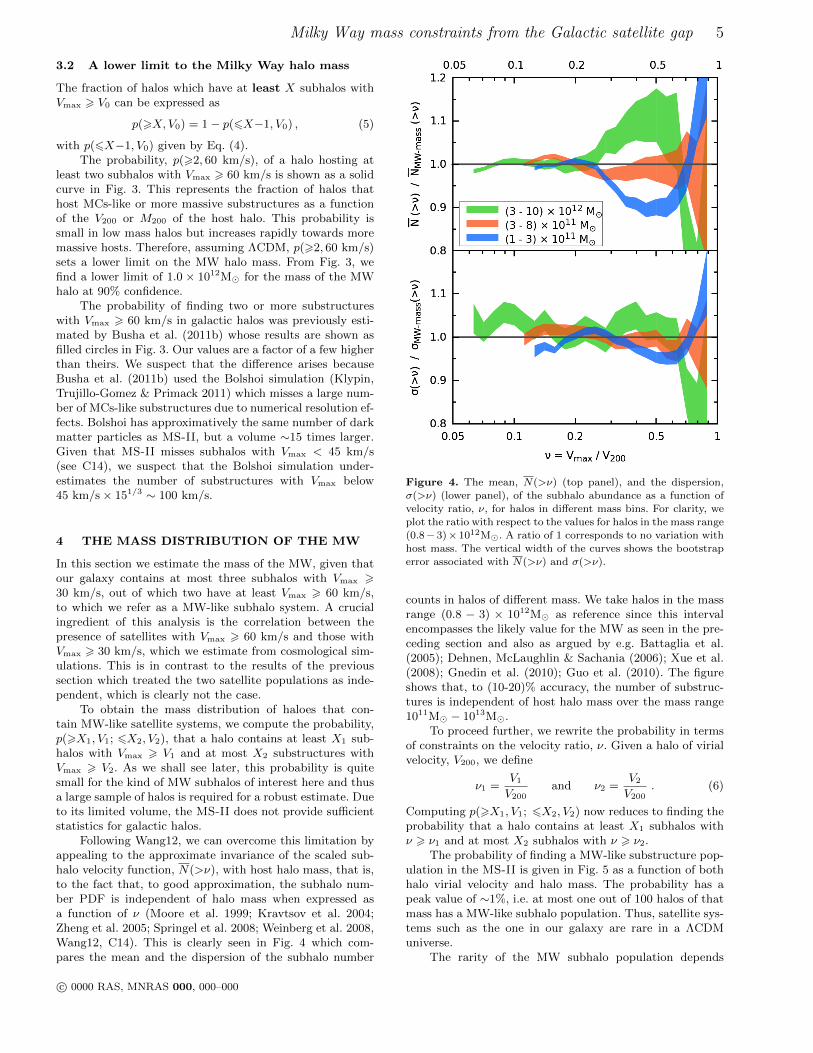
Following Wang12, we can overcome this limitation byappealing to the approximate invariance of the scaled sub-halo velocity function, N(>ν), with host halo mass, that is,to the fact that, to good approximation, the subhalo num-ber PDF is independent of halo mass when expressed asa function of ν (Moore et al. 1999; Kravtsov et al. 2004;Zheng et al. 2005; Springel et al. 2008; Weinberg et al. 2008,Wang12, C14). This is clearly seen in Fig. 4 which com-pares the mean and the dispersion of the subhalo number
Figure 4. The mean, N(>ν) (top panel), and the dispersion,σ(>ν) (lower panel), of the subhalo abundance as a function of
velocity ratio, ν, for halos in different mass bins. For clarity, we
plot the ratio with respect to the values for halos in the mass range(0.8−3)×1012M. A ratio of 1 corresponds to no variation with
host mass. The vertical width of the curves shows the bootstrap
error associated with N(>ν) and σ(>ν).
counts in halos of different mass. We take halos in the massrange (0.8 − 3) × 1012M as reference since this intervalencompasses the likely value for the MW as seen in the pre-ceding section and also as argued by e.g. Battaglia et al.(2005); Dehnen, McLaughlin & Sachania (2006); Xue et al.(2008); Gnedin et al. (2010); Guo et al. (2010). The figureshows that, to (10-20)% accuracy, the number of substruc-tures is independent of host halo mass over the mass range1011M − 1013M.
To proceed further, we rewrite the probability in termsof constraints on the velocity ratio, ν. Given a halo of virialvelocity, V200, we define
ν1 =V1
V200and ν2 =
V2
V200. (6)
Computing p(>X1, V1; 6X2, V2) now reduces to finding theprobability that a halo contains at least X1 subhalos withν > ν1 and at most X2 subhalos with ν > ν2.
The probability of finding a MW-like substructure pop-ulation in the MS-II is given in Fig. 5 as a function of bothhalo virial velocity and halo mass. The probability has apeak value of ∼1%, i.e. at most one out of 100 halos of thatmass has a MW-like subhalo population. Thus, satellite sys-tems such as the one in our galaxy are rare in a ΛCDMuniverse.
The rarity of the MW subhalo population depends
c© 0000 RAS, MNRAS 000, 000–000
6 Cautun et al.
10-5
10-4
10-3
10-2
50 100 150 200
0.1 0.2 0.4 0.6 1 2 3
p (≥
2, 6
0 km
/s;
≤3, 3
0 km
/s)
V200 [km/s]
M200 [1012 MO•]
Figure 5. The probability, p(>2, 60 km/s; 63, 30 km/s), that a
halo has a MW-like subhalo population as a function of halo virialvelocity (lower tick marks) and virial mass (upper tick marks).
The error bars show the 1σ spread due to the finite number of ha-
los and different realisations of the subhalo extrapolation method.The dashed grey line shows the size of the shift towards lower
V200 values when multiplying the probability by the halo massfunction. Note the logarithmic y-axis.
strongly on the mass of the MW halo. The probability islargest for halos in the mass range ∼ (0.4 − 1.0) × 1012Mand drops off sharply outside this interval, decreasing be-low one tenth of its peak value outside the mass range(0.2− 1.5)× 1012M.
To constrain the MW halo mass we need to multiply theprobability of finding a MW-like subhalo system in a haloof a given mass, p(>2, 60 km/s; 63, 30 km/s), by the totalnumber of halos of that mass. This gives the mass distribu-tion of haloes with MW-like satellite systems1. Due to thesharp drop of the probability outside its peak, multiplyingby the halo mass function results only in a slight shift ofthe distribution to lower halo masses. This is shown by thedashed grey line in Fig. 5. This shift is negligible in com-parison to other uncertainties, as we discuss in §5, and, to agood approximation, can be neglected.
To obtain the new MW mass constraints, we identifythe region under the p(>2, 60 km/s; 63, 30 km/s) curvethat contains 90% of the area. This gives a MW mass rangeof (0.25 − 1.4) × 1012M, at 90% confidence, with a mostlikely value of 0.6× 10¹²M given by the peak of the distri-bution. While the upper limit is the same as we found earlierusing the halo fraction, p(63, 30 km/s), the lower mass limitis significantly lower than the 1.0 × 10¹²M value inferredfrom the p(>2, 60 km/s) analysis. Thus, treating the MWsatellite numbers with Vmax > 60 km/s and Vmax > 30 km/sindependently of each other gives a Galactic mass range thatis both narrower and centred at larger values.
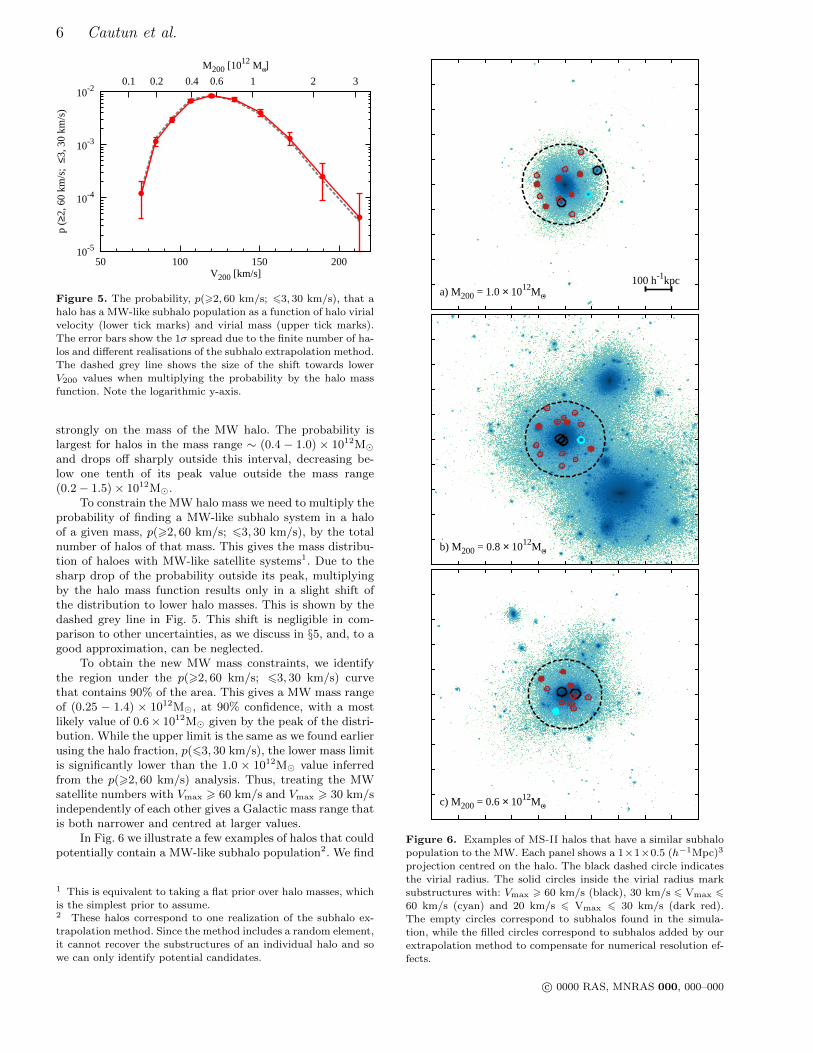
In Fig. 6 we illustrate a few examples of halos that couldpotentially contain a MW-like subhalo population2. We find
1 This is equivalent to taking a flat prior over halo masses, whichis the simplest prior to assume.2 These halos correspond to one realization of the subhalo ex-trapolation method. Since the method includes a random element,
it cannot recover the substructures of an individual halo and so
we can only identify potential candidates.
a) M200 = 1.0 × 10¹²MO•
100 h-1kpc
b) M200 = 0.8 × 10¹²MO•
c) M200 = 0.6 × 10¹²MO•
Figure 6. Examples of MS-II halos that have a similar subhalo
population to the MW. Each panel shows a 1×1×0.5 (h−1Mpc)3
projection centred on the halo. The black dashed circle indicatesthe virial radius. The solid circles inside the virial radius mark
substructures with: Vmax > 60 km/s (black), 30 km/s 6 Vmax 660 km/s (cyan) and 20 km/s 6 Vmax 6 30 km/s (dark red).The empty circles correspond to subhalos found in the simula-
tion, while the filled circles correspond to subhalos added by ourextrapolation method to compensate for numerical resolution ef-fects.
c© 0000 RAS, MNRAS 000, 000–000
Milky Way mass constraints from the Galactic satellite gap 7
candidate halos with a wide range of masses and embed-ded in a variety of large scale environments. For example,the halos in panels a) and c) do not have similarly massiveneighbours in their vicinity, while the halo in panel b) is partof a group with at least one more massive member. Substruc-tures with Vmax > 20 km/s found within the virial radius ofeach object are marked with solid circles. Even though eachof the four halos has at most three massive satellites, theycontain tens of subhalos with 20 km/s 6 Vmax 6 30 km/sthat can host the MW dwarf spheroidal satellites.
4.1 A model for the probability of having aMW-like subhalo population
In this section we introduce a theoretical model that makesuse of subhalo population statistics to predict the probabil-ity that a halo contains a population of substructures similarto that of our galaxy. This model is useful for exploring howthe conclusions of the previous section depend on the as-sumed values of its parameters.
For example, given that at most 1% of ha-los at any mass have MW-like subhalos, investigatingp(>2, 60 km/s; 63, 30 km/s) for a different cosmologi-cal model requires the analysis of ∼104 MW-mass halosand their substructures, which is a considerable computa-tional effort. In contrast, obtaining robust subhalo popula-tion statistics can be done using a smaller number of halos,and therefore the same outcome can be obtained much fasterand cheaper.
We are interested in an analytical model that describesthe probability for a halo to contain at least 2 substructureswith ν > ν1 and at most 3 substructures with ν > ν2. Theonly hosts that contribute to this probability are those thathave:
• 2 subhalos with ν > ν1 and 0 or 1 with ν ∈ [ν2, ν1] or• 3 subhalos with ν > ν1 and 0 with ν ∈ [ν2, ν1].
Assuming that the number of subhalos in the interval [ν2, ν1]is independent of the the number of subhalos above ν1, thecontribution of each of the above two terms is given by:
P (k|r(>ν1), s(>ν1))× PPoisson(6 l) . (7)
The first part of the equation is the negative binomial dis-tribution that gives the fraction of halos that contain ksubhalos with ν > ν1 (see Eq. 2). The second part is theprobability that a host contains at most l subhalos in theinterval [ν2, ν1]. This we model using a Poisson distribution,PPoisson(6 l). In the range [ν2, ν1] each halo contains on av-erage
∆N = N(>ν2)−N(>ν1) (8)
subhalos. Assuming that this number follows a Poisson dis-tribution with mean ∆N , the probability that a halo has lsubhalos in the interval [ν2, ν1] is given by,
∆N l
l!e−∆N . (9)
Putting everything together, we obtain the probability,p(>2, 60 km/s; 63, 30 km/s), of finding a halo with a sub-halo population similar to that in the MW, which is given
0.05
10-5
10-4
10-3
10-2
50 100 150 200 250 300
p (≥
2, 6
0 km
/s;
≤X2, 3
0 km
/s) X2 = 2
X2 = 3X2 = 4
10-5
10-4
10-3
10-2
50 100 150 200 250 300
p (≥
2, 6
0 km
/s;
≤3, V
2)
V200 [km/s]
V2 = 25 km/sV2 = 30 km/sV2 = 35 km/s
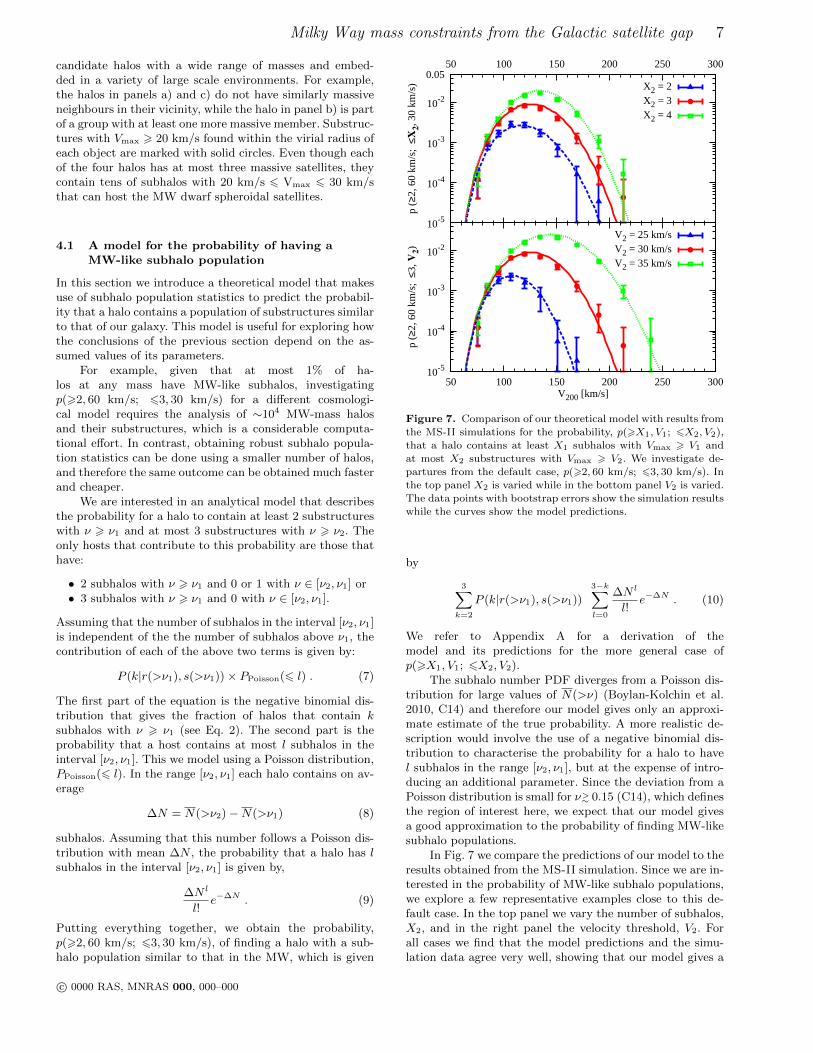
Figure 7. Comparison of our theoretical model with results fromthe MS-II simulations for the probability, p(>X1, V1; 6X2, V2),
that a halo contains at least X1 subhalos with Vmax > V1 and
at most X2 substructures with Vmax > V2. We investigate de-partures from the default case, p(>2, 60 km/s; 63, 30 km/s). In
the top panel X2 is varied while in the bottom panel V2 is varied.
The data points with bootstrap errors show the simulation resultswhile the curves show the model predictions.
by
3∑k=2
P (k|r(>ν1), s(>ν1))
3−k∑l=0
∆N l
l!e−∆N . (10)
We refer to Appendix A for a derivation of themodel and its predictions for the more general case ofp(>X1, V1; 6X2, V2).
The subhalo number PDF diverges from a Poisson dis-tribution for large values of N(>ν) (Boylan-Kolchin et al.2010, C14) and therefore our model gives only an approxi-mate estimate of the true probability. A more realistic de-scription would involve the use of a negative binomial dis-tribution to characterise the probability for a halo to havel subhalos in the range [ν2, ν1], but at the expense of intro-ducing an additional parameter. Since the deviation from aPoisson distribution is small for ν>
∼ 0.15 (C14), which definesthe region of interest here, we expect that our model givesa good approximation to the probability of finding MW-likesubhalo populations.
In Fig. 7 we compare the predictions of our model to theresults obtained from the MS-II simulation. Since we are in-terested in the probability of MW-like subhalo populations,we explore a few representative examples close to this de-fault case. In the top panel we vary the number of subhalos,X2, and in the right panel the velocity threshold, V2. Forall cases we find that the model predictions and the simu-lation data agree very well, showing that our model gives a
c© 0000 RAS, MNRAS 000, 000–000

8 Cautun et al.
good approximation to the probability of finding MW-likesubhalo systems.
5 DISCUSSION
The Vmax distribution of the Milky Way’s most massivesatellites places strong constraints on the mass of the MWhalo given the prior hypothesis that ΛCDM is the correctmodel. In this case, the fact that the MW has only threesatellites with Vmax > 30 km/s (the two Magellanic Cloudsand Sagittarius) requires the virial mass of the MW halo tobe M200 < 1.4 × 10¹²M at 90% confidence; on the otherhand, the existence of the two Magellanic Clouds, whichhave Vmax > 60 km/s, requires M200 > 1.0 × 10¹²M, alsoat 90% confidence. This conclusion is consistent with some,but not all, recent measurements of the MW mass (Battagliaet al. 2005; Smith et al. 2007; Xue et al. 2008; Guo et al.2010; Watkins, Evans & An 2010; Busha et al. 2011a; Gon-zalez, Kravtsov & Gnedin 2013; Piffl et al. 2014; Diaz et al.2014).
These mass constraints were derived by treating thenumber of Galactic satellites with Vmax > 60 km/s and thosewith Vmax > 30 km/s as independent, which is clearly notthe case. To overcome this, we defined halos with MW-likesubhalo systems as those that have at most three satel-lites with Vmax > 30 km/s, of which at least two haveVmax > 60 km/s. In the simulation, the mass distribution ofsuch halos is wider and shifted towards lower masses, sug-gesting a MW mass range of 0.25 6 M200/(1012M) 6 1.4at 90% confidence. It is important to note that the low endof the 90% confidence interval, 2.5× 10¹¹M, is likely ruledout by observations of the inner part of the Galactic halo.Using the fourth data release of the Radial Velocity Ex-periment (Kordopatis et al. 2013), Piffl et al. (2014) foundthat the MW halo mass within 180 kpc is > 9× 10¹¹M at90% confidence (Smith et al. 2007; Xue et al. 2008; Gnedinet al. 2010; Deason et al. 2012, found similar lower bounds,albeit with larger uncertainties). This result could, in prin-ciple, be used as a prior for the kind of analysis we havecarried out in this paper, along with other constraints com-ing from the orbital properties of the massive satellites (e.g.Busha et al. 2011a; Gonzalez, Kravtsov & Gnedin 2013) orthe luminosity function of the nine bright “classical” dwarfspheroidal satellites (Kennedy et al. 2014, see also Vera-Ciroet al. 2013).
Our results also confirm and extend the conclusion ofWang12 that the “too-big-to-fail” problem highlighted byBoylan-Kolchin, Bullock & Kaplinghat (2011, 2012) is not aproblem for the ΛCDM model provided the MW halo massis close to 1× 10¹²M rather than to the ∼ 2× 10¹²M ofthe Aquarius halos used in the studies by Boylan-Kolchin etal. Alternative solutions to the problem such as warm darkmatter (Lovell et al. 2012), self-interacting dark matter (Vo-gelsberger, Zavala & Loeb 2012) or baryonic effects (Brookset al. 2013) are therefore not required unless the mass of theMW halo can be shown to be larger than ∼ 2× 10¹²M.
In our ΛCDM simulations, halos with a Vmax distribu-tion similar to that of the MW, that is with at most threesatellites with Vmax > 30 km/s, of which at least two haveVmax > 60 km/s, are rather rare as we have seen in §4: atmost 1% of halos of any mass have satellite systems with
this property. This shows that the MW lies in the tail of thesatellite distribution when analysing the cumulative satel-lite population at Vmax,1 = 30 km/s and Vmax,2 = 60 km/s,which we call “the Galactic satellite gap”. However, it is im-portant to note that this result does not necessarily implya problem for the ΛCDM paradigm. To asses if the Galac-tic satellite gap represents a source of tension, we need tocalculate what is the probability of finding such a gap inΛCDM haloes. For this, one needs to search for the pres-ence of satellite gaps not only for Vmax,1 = 30 km/s andVmax,2 = 60 km/s, as we did here, but for all possible Vmax,1
and Vmax,2 combinations. It may be that satellite gaps arequite common, which would suggest that the Galactic satel-lite gap is a ΛCDM prediction and not a cause of tension.
To assess the robustness of our conclusions we now ex-plore their sensitivity to various parameters required for thisstudy.
1. Cosmological parametersThe results presented here are based on the MS-II that
assumed WMAP-1 values for the cosmological parameters.The main difference between these and more recent measure-ments from WMAP-7 (Komatsu et al. 2011) or the Plancksatellite (Planck Collaboration et al. 2013) is a lower valueof σ8. C14 found that lowering the value of σ8 from theWMAP-1 value of 0.9 to the WMAP-7 value of 0.8 resultsin a slightly lower number of substructures. This translatesinto a slightly different allowed range for the Milky Way halomass, as seen from Figs 8 and 9. The probability of findinga MW-like subhalo population assuming WMAP-7 parame-ters (dotted green line in Fig. 9) increases slightly and thepeak shifts towards higher masses, but the overall differenceis very small. For convenience, we summarized in Table 2the variations in both the mass estimate and peak height.
2. Maximum distance used to identify satellitesOur analysis so far has been based on substructures
found within the virial radius, R200, of the host halo cen-tre. For halo masses of 1012M and lower this distance cor-responds to <
∼ 200 kpc and it is significantly smaller thanthe distances of the outermost known satellites of the MW,such as Leo I, which lies at ∼250 kpc from the halo cen-tre (Karachentsev et al. 2004). To assess the impact of ourchoice of radius, we repeated the analysis including subha-los located within a fixed distance of 250 kpc from the hostcenter, independently on the host mass (see Appendix Bfor details). The results are shown in Figs 8 and 9 as thedotted-dashed red curve that can be compared with thesolid curve for our default case. The difference arises be-cause R200 < 250 kpc for halo masses below 1.5× 10¹²M,which are of interest for our comparison. Since the numberof massive substructures increases rapidly with the value ofthe limiting radius, it becomes more difficult to find haloswith at most three Vmax>30 km/s subhalos and this has theeffect of lowering the upper limit on the MW halo mass. Onthe other hand, it becomes easier to find at least two sub-structures with Vmax > 60 km/s and this has the effect ofalso lowering the lower limit on the MW halos mass. Thenet effect is to shift the allowed mass range to lower val-ues, 0.15 6 M200/(1012M) 6 1.2 at 90% confidence, andto reduce the peak probability of finding a MW-like subhalosystem.
c© 0000 RAS, MNRAS 000, 000–000
Milky Way mass constraints from the Galactic satellite gap 9
0.2
0.4
0.6
0.8
1.0
0.2
0.4
0.6
0.8
1.0
0.2 0.4 0.6 1 2 3
p (≤
3, 3
0 km
/s)
p (≥
2, 6
0 km
/s)
M200 [ 1012 MO• ]
0.2
0.4
0.6
0.8
1.0
0.2
0.4
0.6
0.8
1.0
0.2 0.4 0.6 1 2 3
p (≤
3, 3
0 km
/s)
p (≥
2, 6
0 km
/s)
M200 [ 1012 MO• ]
reference ( WMAP-1 )WMAP-7subhalos within 250 kpcunderdense or wall haloes
10-3
10-2
10-1
10-3
10-2
10-1
0.2
0.4
0.6
0.8
1.0
0.2
0.4
0.6
0.8
1.0
p (≤
3, 3
0 km
/s)
p (≥
2, 6
0 km
/s)
0.2
0.4
0.6
0.8
1.0
0.2
0.4
0.6
0.8
1.0
p (≤
3, 3
0 km
/s)
p (≥
2, 6
0 km
/s)
reference ( WMAP-1 )≤ 4 subh. with Vmax ≥ 30 km/s≥ 2 subh. with Vmax ≥ 55 km/s≤ 3 subh. with Vmax ≥ 35 km/s≤ 3 subh. with Vmax ≥ 25 km/s
10-3
10-2
10-1
100 150 20010-3
10-2
10-1
V200 [ km/s ]
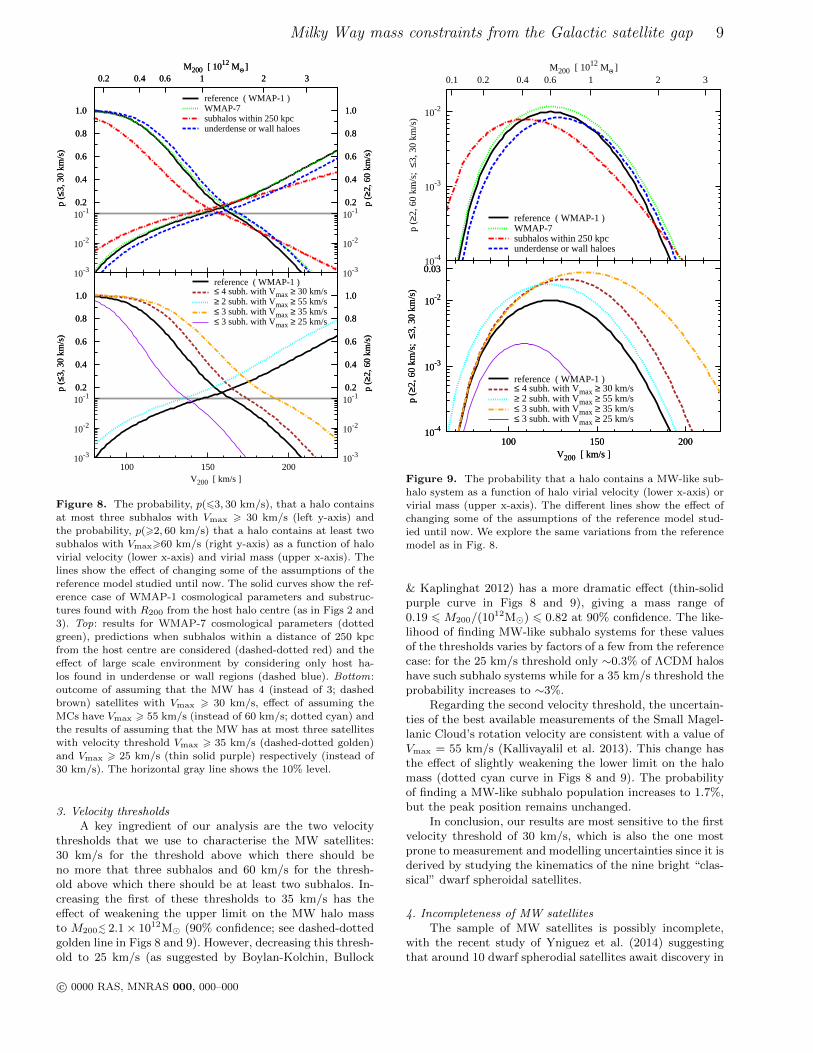
Figure 8. The probability, p(63, 30 km/s), that a halo contains
at most three subhalos with Vmax > 30 km/s (left y-axis) and
the probability, p(>2, 60 km/s) that a halo contains at least twosubhalos with Vmax>60 km/s (right y-axis) as a function of halo
virial velocity (lower x-axis) and virial mass (upper x-axis). The
lines show the effect of changing some of the assumptions of thereference model studied until now. The solid curves show the ref-
erence case of WMAP-1 cosmological parameters and substruc-
tures found with R200 from the host halo centre (as in Figs 2 and3). Top: results for WMAP-7 cosmological parameters (dotted
green), predictions when subhalos within a distance of 250 kpcfrom the host centre are considered (dashed-dotted red) and the
effect of large scale environment by considering only host ha-
los found in underdense or wall regions (dashed blue). Bottom:outcome of assuming that the MW has 4 (instead of 3; dashed
brown) satellites with Vmax > 30 km/s, effect of assuming the
MCs have Vmax > 55 km/s (instead of 60 km/s; dotted cyan) andthe results of assuming that the MW has at most three satellites
with velocity threshold Vmax > 35 km/s (dashed-dotted golden)
and Vmax > 25 km/s (thin solid purple) respectively (instead of30 km/s). The horizontal gray line shows the 10% level.
3. Velocity thresholdsA key ingredient of our analysis are the two velocity
thresholds that we use to characterise the MW satellites:30 km/s for the threshold above which there should beno more that three subhalos and 60 km/s for the thresh-old above which there should be at least two subhalos. In-creasing the first of these thresholds to 35 km/s has theeffect of weakening the upper limit on the MW halo massto M200<
∼ 2.1× 10¹²M (90% confidence; see dashed-dottedgolden line in Figs 8 and 9). However, decreasing this thresh-old to 25 km/s (as suggested by Boylan-Kolchin, Bullock
10-4
10-3
10-2
0.1 0.2 0.4 0.6 1 2 3
p (≥
2, 6
0 km
/s;
≤3, 3
0 km
/s)
M200 [ 1012 MO• ]
reference ( WMAP-1 )WMAP-7subhalos within 250 kpcunderdense or wall haloes
0.03
10-4
10-3
10-2
100 150 200
p (≥
2, 6
0 km
/s;
≤3, 3
0 km
/s)
V200 [ km/s ]
0.03
10-4
10-3
10-2
100 150 200
p (≥
2, 6
0 km
/s;
≤3, 3
0 km
/s)
V200 [ km/s ]
reference ( WMAP-1 )≤ 4 subh. with Vmax ≥ 30 km/s≥ 2 subh. with Vmax ≥ 55 km/s≤ 3 subh. with Vmax ≥ 35 km/s≤ 3 subh. with Vmax ≥ 25 km/s
Figure 9. The probability that a halo contains a MW-like sub-
halo system as a function of halo virial velocity (lower x-axis) or
virial mass (upper x-axis). The different lines show the effect ofchanging some of the assumptions of the reference model stud-
ied until now. We explore the same variations from the reference
model as in Fig. 8.
& Kaplinghat 2012) has a more dramatic effect (thin-solidpurple curve in Figs 8 and 9), giving a mass range of0.19 6 M200/(1012M) 6 0.82 at 90% confidence. The like-lihood of finding MW-like subhalo systems for these valuesof the thresholds varies by factors of a few from the referencecase: for the 25 km/s threshold only ∼0.3% of ΛCDM haloshave such subhalo systems while for a 35 km/s threshold theprobability increases to ∼3%.
Regarding the second velocity threshold, the uncertain-ties of the best available measurements of the Small Magel-lanic Cloud’s rotation velocity are consistent with a value ofVmax = 55 km/s (Kallivayalil et al. 2013). This change hasthe effect of slightly weakening the lower limit on the halomass (dotted cyan curve in Figs 8 and 9). The probabilityof finding a MW-like subhalo population increases to 1.7%,but the peak position remains unchanged.
In conclusion, our results are most sensitive to the firstvelocity threshold of 30 km/s, which is also the one mostprone to measurement and modelling uncertainties since it isderived by studying the kinematics of the nine bright “clas-sical” dwarf spheroidal satellites.
4. Incompleteness of MW satellitesThe sample of MW satellites is possibly incomplete,
with the recent study of Yniguez et al. (2014) suggestingthat around 10 dwarf spherodial satellites await discovery in
c© 0000 RAS, MNRAS 000, 000–000

10 Cautun et al.
Table 2. The sensitivity of the MW mass estimation on the various parameters used in our study. It shows the MW mass range, at90% confidence, as inferred for the various cases explored in Fig. 8 (third column) and Fig. 9 (fourth column). We also give the peak
value (sixth column) and the halo mass at the peak position (fifth column) for each of the datasets shown in Fig. 9.
DatasetRepresentation inFigs 8 and 9
MW mass limits [×1012M](90% confidence)
mass at peakposition [×1012M]
peak value[%]
WMAP-1 reference result solid black 1.0 − 1.4 0.25 − 1.4 0.61 1.0
WMAP-7 cosmology dotted green 1.0 − 1.6 0.26 − 1.5 0.64 1.2
subhalos within 250 kpc dashed-dotted red 0.83 − 1.2 0.15 − 1.2 0.42 0.80underdense or wall halos dashed blue 1.2 − 1.6 0.28 − 1.5 0.68 0.83
64 subhalos with Vmax > 30 km/s dashed brown 1.0 − 1.7 0.29 − 1.5 0.74 2.1
>2 subhalos with Vmax > 55 km/s dotted cyan 0.77 − 1.4 0.23 − 1.3 0.60 1.763 subhalos with Vmax > 35 km/s dashed-dotted golden 1.0 − 2.3 0.30 − 2.1 0.93 2.7
63 subhalos with Vmax > 25 km/s thin-solid purple − 0.19 − 0.82 0.38 0.28
the area left unexplored by the Sloan Digital Sky Survey. Itis possible, though unlikely, that one or more of these undis-covered satellites could have Vmax > 30 km/s. In addition,recent dynamical modelling of the Sculptor dwarf spheroidalgalaxy performed by Strigari, Frenk & White (2014) hasfound that the observational data allow for a maximum cir-cular velocity up to ∼35 km/s. The presence of an additionalmassive satellite would have the effect of weakening the up-per limit on the MW halo mass to M200<
∼ 1.5×10¹²M (90%confidence) and increasing the probability of finding a MW-like subhalo system (dashed brown curve in Figs 8 and 9).
5. Environmental effectsRecent studies have shown that the number of substruc-
tures depends on the large scale environment, with halosin lower density regions having fewer subhalos (Ishiyama,Fukushige & Makino 2008; Busha et al. 2011b; Croft et al.2012). This trend has been further quantified by Cautun etal. (in prep.) who find that this effect is significant only forhalos in the most underdense regions and for those residingin the sheets of the cosmic web. These halos have, on av-erage, 10− 20% fewer substructures than the population asa whole, and the deficiency is larger for more massive sub-halos. Environmental effects of this kind may play a role inour galaxy since both observational and theoretical consider-ations suggest that the Local Group lies within a large-scalesheet (Tully & Fisher 1988; Pasetto & Chiosi 2009; Aragon-Calvo, Silk & Szalay 2011).
To assess the importance of this kind of environmen-tal effect, we have applied NEXUS (Cautun, van de Wey-gaert & Jones 2013), a morphological environment identi-fication method, to count the substructures of halos thatreside in different environments. The paucity of the mostmassive subhalos within wall halos has the effect of increas-ing both the lower and upper limits on the allowed MW halomass (dashed blue curve in Figs 8 and 9) so that the allowedinterval shifts to ∼10% higher halo masses (see Table 2 fordetails). The probability of finding a MW-like subhalo sys-tem is only slightly lowered.
6. Baryonic effectsBaryonic processes are known to affect the mass func-
tion and inner structure of halos, especially at the low massend. For example, Sawala et al. (2013, 2014a) have shownthat baryonic effects in simulations of galaxy formationcause halos with mass <
∼ 1011M to grow at a reduced rate
compared to their counterparts in a dark matter only sim-ulation. Baryonic processes also affect the maximum circu-lar velocity of galactic satellites, especially dwarf spheroidalgalaxies (e.g. Zolotov et al. 2012; Brooks & Zolotov 2014),which can have important implications for our study. Theinclusion of baryons does not affect the maximum circularvelocity of massive satellites with Vmax ∼ 60 km/s, but itdoes lead to an average ∼10% reduction in the maximumcircular velocity of satellites with Vmax<
∼ 30 km/s (Sawalaet al. in prep., private communication). These results arebased on a comparison of matched satellites between darkmatter only and hydrodynamic simulations, in a set of 24distinct MW mass halos (The suite of simulations is de-scribed in Sawala et al. 2014b). Thus, dwarf spheroidalsthat have Vmax<
∼ 30 km/s correspond to subhalos that, in thedark matter only simulations, have a factor of ∼1.1 highermaximum circular velocity. This can be easily incorporatedinto our analysis by changing the condition of finding atmost three subhalos with Vmax > 30 km/s to the conditionsof finding at most three subhalos with Vmax > 34 km/s.This weakens the upper limit to the MW halo mass toM200<
∼ 1.9× 10¹²M (90% confidence; for clarity we do notshow this curve in Figs 8 and 9 but its position can be eas-ily estimated by comparing to the dashed-dotted golden linecorresponding to Vmax > 35 km/s).
6 SUMMARY
We have employed the Vmax distribution of satellites in theMW to set lower and upper limits to the virial mass of theGalactic halo and to find how likely the MW satellite systemis under the assumption that ΛCDM is the correct modelfor cosmic structure formation. The upper limit comes fromrequiring that the MW should have at most three subhaloswith Vmax > 30 km/s; the lower limit comes from requiringthat the MW should have at least two subhalos with Vmax >60 km/s. The first of these requirements is necessary to avoidthe TBTF problem highlighted by Boylan-Kolchin, Bullock& Kaplinghat (2011, 2012), while the second stems from theobservation that massive satellites like the MCs are rare (Liuet al. 2011; Guo et al. 2011; Lares, Lambas & Domınguez2011).
Our analysis is based on over 104 halos from theMillennium-II simulation. To achieve the required dynamicrange, we use an extrapolation method devised by C14 that
c© 0000 RAS, MNRAS 000, 000–000

Milky Way mass constraints from the Galactic satellite gap 11
allows us to count subhalos down to Vmax ∼ 15 km/s. Ina first step we estimate lower and upper bounds to theMW halo mass by treating the number of satellites withVmax > 60 km/s and those with Vmax > 30 km/s as in-dependent. The former requirement implies a MW massof M200 > 1.0 × 10¹²M while the latter condition indi-cates that M200 6 1.4 × 10¹²M, with both limits givenat 90% confidence. When requiring that host haloes have aVmax distribution similar to that of the MW, that is with atmost three satellites with Vmax > 30 km/s, of which at leasttwo have Vmax > 60 km/s, the allowed mass range becomes0.25 6M200/(1012M) 6 1.4 (90% confidence).
We also find that the Vmax distribution of the massivesubhalos of the MW, as defined by the number of satelliteswith Vmax > 30 km/s and those with Vmax > 60 km/s, isquite rare in ΛCDM simulations, with at most ∼1% of ha-los of any mass having a similar distribution. This might besignalling a tension between the ΛCDM model and obser-vations of the MW satellites, but it is not clear that con-structing a solid statistical analysis on such an a posterioriargument is possible without a detailed analysis of the fre-quency of gaps as a function of the threshold values of Vmax.
Our conclusion regarding the rarity of the MW sub-halo system does not vary significantly when we vary theparameters of our model. However, the allowed mass forthe MW halo is sensitive to uncertainties in the parame-ters we use, especially in the Vmax = 30 km/s threshold thatis derived from the kinematics of the nine bright “classical”dwarf spheroidal satellites. Thus, as pointed out by Wang12and C14, the TBTF problem is easily avoided if the MWhalo has a relatively low mass, certainly within the rangeof current measurements. However, our study highlights theimportance for cosmology of obtaining robust and reliablemeasurements of the mass of the MW’s halo.
ACKNOWLEDGEMENTS
We thank the referee for their useful comments that haveimproved this paper. We are also grateful to Shaun Cole,Vincent Eke, Douglas Finkbeiner, Julio Navarro, Till Sawalaand Andrew Pontzen for helpful discussions and sugges-tions. This work was supported in part by ERC Ad-vanced Investigator grant COSMIWAY [grant number GA267291] and the Science and Technology Facilities Coun-cil [grant number ST/F001166/1, ST/I00162X/1]. RvdWacknowledges support by the John Templeton Founda-tion, grant number FP05136-O. WAH is also supported bythe Polish National Science Center [grant number DEC-2011/01/D/ST9/01960]. The simulations used in this studywere carried out by the Virgo consortium for cosmologicalsimulations. Additional data analysis was performed on theCosma cluster at ICC in Durham and on the Gemini ma-chines at the Kapteyn Astronomical Institute in Groningen.
This work used the DiRAC Data Centric system atDurham University, operated by ICC on behalf of theSTFC DiRAC HPC Facility (www.dirac.ac.uk). This equip-ment was funded by BIS National E-infrastructure capitalgrant ST/K00042X/1, STFC capital grant ST/H008519/1,and STFC DiRAC Operations grant ST/K003267/1 andDurham University. DiRAC is part of the National E-Infrastructure. Data from the Millennium/Millennium-II
simulation is available on a relational database accessiblefrom http://galaxy-catalogue.dur.ac.uk:8080/Millennium .This research was carried out with the support of the “HPCInfrastructure for Grand Challenges of Science and Engi-neering” Project, co-financed by the European Regional De-velopment Fund under the Innovative Economy OperationalProgramme.
REFERENCES
Aragon-Calvo M. A., Silk J., Szalay A. S., 2011, MNRAS,415, L16
Battaglia G. et al., 2005, MNRAS, 364, 433Behroozi P. S., Wechsler R. H., Wu H.-Y., 2013, ApJ, 762,109
Benson A. J., Frenk C. S., Lacey C. G., Baugh C. M., ColeS., 2002, MNRAS, 333, 177
Boylan-Kolchin M., Besla G., Hernquist L., 2011, MNRAS,414, 1560
Boylan-Kolchin M., Bullock J. S., Kaplinghat M., 2011,MNRAS, 415, L40
Boylan-Kolchin M., Bullock J. S., Kaplinghat M., 2012,MNRAS, 422, 1203
Boylan-Kolchin M., Springel V., White S. D. M., JenkinsA., 2010, MNRAS, 406, 896, (BK10)
Boylan-Kolchin M., Springel V., White S. D. M., JenkinsA., Lemson G., 2009, MNRAS, 398, 1150
Brooks A. M., Kuhlen M., Zolotov A., Hooper D., 2013,ApJ, 765, 22
Brooks A. M., Zolotov A., 2014, ApJ, 786, 87Busha M. T., Marshall P. J., Wechsler R. H., Klypin A.,Primack J., 2011a, ApJ, 743, 40
Busha M. T., Wechsler R. H., Behroozi P. S., Gerke B. F.,Klypin A. A., Primack J. R., 2011b, ApJ, 743, 117
Cautun M., Frenk C. S., van de Weygaert R., HellwingW. A., Jones B. J. T., 2014, preprints ArXiv:1405.7697,(C14)
Cautun M., van de Weygaert R., Jones B. J. T., 2013,MNRAS, 429, 1286
Croft R. A. C., Matteo T. D., Khandai N., Springel V.,Jana A., Gardner J. P., 2012, MNRAS, 425, 2766
Deason A. J. et al., 2012, MNRAS, 425, 2840Dehnen W., McLaughlin D. E., Sachania J., 2006, MNRAS,369, 1688
Diaz J. D., Koposov S. E., Irwin M., Belokurov V., EvansW., 2014, preprints ArXiv:1405.3662
Diemand J., Kuhlen M., Madau P., Zemp M., Moore B.,Potter D., Stadel J., 2008, Nature, 454, 735
Gnedin O. Y., Brown W. R., Geller M. J., Kenyon S. J.,2010, ApJ, 720, L108
Gonzalez R. E., Kravtsov A. V., Gnedin N. Y., 2013,preprints ArXiv:1312.2587
Gonzalez R. E., Kravtsov A. V., Gnedin N. Y., 2013, ApJ,770, 96
Grebel E. K., 2005, in IAU Colloq. 198: Near-fields cosmol-ogy with dwarf elliptical galaxies, Jerjen H., Binggeli B.,eds., pp. 1–10
Guo Q., Cole S., Eke V., Frenk C., 2011, MNRAS, 417, 370Guo Q., White S., Li C., Boylan-Kolchin M., 2010, MN-RAS, 404, 1111
Harris J., Zaritsky D., 2006, AJ, 131, 2514
c© 0000 RAS, MNRAS 000, 000–000
12 Cautun et al.
Ishiyama T., Fukushige T., Makino J., 2008, PASJ, 60, L13Kallivayalil N., van der Marel R. P., Besla G., Anderson J.,Alcock C., 2013, ApJ, 764, 161
Karachentsev I. D., Karachentseva V. E., HuchtmeierW. K., Makarov D. I., 2004, The Astronomical Journal,127, 2031
Kennedy R., Frenk C., Cole S., Benson A., 2014, MNRAS,442, 2487
Klypin A., Kravtsov A. V., Valenzuela O., Prada F., 1999,ApJ, 522, 82
Klypin A. A., Trujillo-Gomez S., Primack J., 2011, ApJ,740, 102
Komatsu et al., 2011, ApJS, 192, 18Kordopatis G. et al., 2013, AJ, 146, 134Kravtsov A. V., Berlind A. A., Wechsler R. H., KlypinA. A., Gottlober S., Allgood B., Primack J. R., 2004, ApJ,609, 35
Lares M., Lambas D. G., Domınguez M. J., 2011, AJ, 142,13
Liu L., Gerke B. F., Wechsler R. H., Behroozi P. S., BushaM. T., 2011, ApJ, 733, 62
Lokas E. L., 2009, MNRAS, 394, L102Lovell M. R. et al., 2012, MNRAS, 420, 2318Madau P., Diemand J., Kuhlen M., 2008, ApJ, 679, 1260Moore B., Ghigna S., Governato F., Lake G., Quinn T.,Stadel J., Tozzi P., 1999, ApJ, 524, L19
Olsen K. A. G., Massey P., 2007, ApJ, 656, L61Onions et al, 2012, MNRAS, 423, 1200Parry O. H., Eke V. R., Frenk C. S., Okamoto T., 2012,MNRAS, 419, 3304
Pasetto S., Chiosi C., 2009, A&A, 499, 385Penarrubia J., McConnachie A. W., Navarro J. F., 2008,ApJ, 672, 904
Piffl T. et al., 2014, A&A, 562, A91Planck Collaboration et al., 2013, preprint arXiv:1303.5076Purcell C. W., Zentner A. R., 2012, Journal of Cosmologyand Astroparticle Physics, 12, 7
Sawala T., Frenk C. S., Crain R. A., Jenkins A., Schaye J.,Theuns T., Zavala J., 2013, MNRAS, 431, 1366
Sawala T. et al., 2014a, preprints ArXiv:1404.3724Sawala T. et al., 2014b, ArXiv e-printsSmith M. C. et al., 2007, MNRAS, 379, 755Spergel et al., 2003, ApJS, 148, 175Springel V. et al., 2008, MNRAS, 391, 1685Springel V. et al., 2005, Nature, 435, 629Stadel J., Potter D., Moore B., Diemand J., Madau P.,Zemp M., Kuhlen M., Quilis V., 2009, MNRAS, 398, L21
Stanimirovic S., Staveley-Smith L., Jones P. A., 2004, ApJ,604, 176
Strigari L. E., Bullock J. S., Kaplinghat M., Simon J. D.,Geha M., Willman B., Walker M. G., 2008, Nature, 454,1096
Strigari L. E., Frenk C. S., White S. D. M., 2010, MNRAS,408, 2364
Strigari L. E., Frenk C. S., White S. D. M., 2014, preprintsArXiv:1406.6079
Tully R. B., Fisher J. R., 1988, Catalog of Nearby Galaxies.Cambridge University Press
van der Marel R. P., Alves D. R., Hardy E., Suntzeff N. B.,2002, AJ, 124, 2639
van der Marel R. P., Kallivayalil N., 2014, ApJ, 781, 121Vera-Ciro C. A., Helmi A., Starkenburg E., Breddels M. A.,
2013, MNRAS, 428, 1696Vogelsberger M., Zavala J., Loeb A., 2012, MNRAS, 423,3740
Walker M. G., Mateo M., Olszewski E. W., Penarrubia J.,Wyn Evans N., Gilmore G., 2009, ApJ, 704, 1274
Wang J., Frenk C. S., Navarro J. F., Gao L., Sawala T.,2012, MNRAS, 424, 2715, (Wang12)
Watkins L. L., Evans N. W., An J. H., 2010, MNRAS, 406,264
Weinberg D. H., Colombi S., Dave R., Katz N., 2008, ApJ,678, 6
Willman B. et al., 2005, ApJ, 626, L85Wolf J., Martinez G. D., Bullock J. S., Kaplinghat M.,Geha M., Munoz R. R., Simon J. D., Avedo F. F., 2010,MNRAS, 406, 1220
Xue X. X. et al., 2008, ApJ, 684, 1143Yniguez B., Garrison-Kimmel S., Boylan-Kolchin M., Bul-lock J. S., 2014, MNRAS, 439, 73
Zheng Z. et al., 2005, ApJ, 633, 791Zolotov A. et al., 2012, ApJ, 761, 71
APPENDIX A: THE PROBABILITY OFFINDING MW-LIKE SATELLITES
Here we give a detailed description of the model that weuse to predict the probability, p(>X1, V1; 6X2, V2), that ahalo contains at least X1 subhalos with Vmax > V1 and atmost X2 substructures with Vmax > V2, where V1 > V2. Forsimplicity, we use the notation
P = p(>X1, V1; 6X2, V2) (A1)
and we take X2 > X1. The case X2 < X1 is trivial since theprobability is zero.
In the first instance we restrict attention to host haloswith virial velocity, V200. Using the notation,
ν1 =V1
V200and ν2 =
V2
V200, (A2)
the probability P reduces to finding all the halos with V200
that contain at least X1 subhalos with ν > ν1 and at mostX2 subhalos with ν > ν2. At ν2 there are, on average,
∆N = N(>ν2)−N(>ν1) (A3)
more substructures per halo than at ν1, where N(>ν1) andN(>ν2) are the mean subhalo counts at those two velocityratios. We make the assumption that these subhalos withν ∈ [ν2, ν1] are distributed among the host population ac-cording to a Poisson distribution with mean ∆N that is in-dependent on the number of substructures at ν1. Therefore,a halo has a probability,
PPoisson(l,∆N) =∆N l
l!e−∆N , (A4)
of having l subhalos with ν ∈ [ν2, ν1]. The same halo hasprobability
PPoisson(6i,∆N) =i∑
l=0
∆N l
l!e−∆N (A5)
of having at most i substructures in the range [ν2, ν1].The only halos that contribute to P are those that have
between X1 and X2 substructures with ν > ν1. Let us select
c© 0000 RAS, MNRAS 000, 000–000

Milky Way mass constraints from the Galactic satellite gap 13
such a halo containing k ∈ [X1, X2] subhalos with ν > ν1.This halo can contribute to P only if it has at most X2
substructures with ν > ν2 and therefore it can have at mostX2−k subhalos in the range [ν2, ν1]. The probability that itsatisfies this condition is given by Eq. (A5) with i = X2−k.
The quantity, P, is given by the fraction of halos with ksubstructures at ν > ν1 times the probability that they con-tain less than X2−k subhalos in the range [ν2, ν1], summedover k. Therefore, we have,
P =
X2∑k=X1
P (k|r(>ν1), s(>ν1)) PPoisson(6X2−k,∆N) ,
(A6)where P (k|r(>ν1), s(>ν1)) is the negative binomial distri-bution that gives the probability that a halo has k substruc-tures with ν > ν1 (see Eqs. 2 and 3). The probability, P, isa function of halo virial velocity, or equivalently, halo mass,through the dependence of r and s on ν1 as well as the vari-ation of ∆N with ν1 and ν2.
APPENDIX B: THE SUBHALO ABUNDANCEWITHIN A FIXED PHYSICAL RADIUS
To compute the subhalo abundance within a fixed physi-cal radius we make use of the universality of N(>ν) withhost halo mass. This approximation is valid when N(>ν)is measured within a distance fR200, with f a multiplica-tion factor. This is illustrated in Fig. 4 for a value of f = 1.We have checked that the universality still applies, to within∼20%, for the mass range 1×10¹¹M 6 M200 6 1×10¹³M,for values of f in the range 0.5 6 f 6 3.0.
Computing the subhalo abundance within a fixed phys-ical radius, R, is equivalent to a distance, fR200, with
f ≡ R
R200. (B1)
Since R200 is a function of mass, the multiplication fac-tor, f , is itself a function of halo mass, with f decreasingwith increasing halo mass. We computed the subhalo abun-dance within a distance of fR200 for a set of f values inthe range 0.57 to 2.7, which corresponds to a fixed distanceof R = 250 kpc spanning the mass range 1 × 10¹¹M 6M200 6 1× 10¹³M. The f values were selected to give nineequally spaced bins in M200. Following this, the abundanceof subhalos at a given halo mass was found using a linearinterpolation between the results for the two closest valuesof f corresponding to that mass value.
c© 0000 RAS, MNRAS 000, 000–000