millennium challenge account namibia
TRANSCRIPT

Millennium Challenge Account Namibia
Monitoring and Evaluation Plan
Revision 6: 1 July 2014 Approved by MCC: 9 July 2014
Approved by MCA‐N Board: 11 July 2014
Table of Contents
Page
1. Overview ............................................................................................................ 1 2. Summary of Programme, Projects, and Objectives ............................................. 1 2.1 Description of Compact ............................................................................................. 1 2.3 Expected Impact ........................................................................................................ 8 2.4 Economic Analysis ..................................................................................................... 9 2.5 Programme Beneficiaries ......................................................................................... 12
3. Monitoring Component .................................................................................... 12 3.1 Monitoring Strategy ................................................................................................ 12 3.2 Indicator Documentation, Baselines and Targets ..................................................... 13 3.3 Data Quality Reviews .............................................................................................. 14 3.4 Standard Reporting Requirements ........................................................................... 15 3.5 Linking Disbursement to Performance ..................................................................... 15
4. Evaluation Component ..................................................................................... 15 4.1 Introduction ............................................................................................................ 15 4.2 Education Project .................................................................................................... 17 4.3 Tourism Project ....................................................................................................... 17 4.4 Agriculture Project .................................................................................................. 21
5. Surveys ............................................................................................................. 24 6. Disaggregation by Sex ....................................................................................... 25 7. Vulnerable Groups ............................................................................................ 26 8. Modifying the M&E Plan................................................................................... 27 9. Assumptions and Risks ..................................................................................... 28 10. Implementation and Management of M&E ...................................................... 43 Annexes: 1. Indicator Information 2. Indicator Targets 3. Summary of Modifications to Indicators, Baselines, and Targets 4. Detailed Programme Logic 5. Map of MCA‐N Intervention Areas

Abbreviations
CBRLM Community‐Based Rangeland and Livestock Management
CDSGF Conservancy Development Support Grant Fund
CDSS Conservancy Development Support Services
CoEs former Colleges of Education, now University of Namibia campuses
COSDEC Community Skills Development Centre
COSDEF COSDEC Foundation
CPD Continuous Professional Development
CLB Communal Land Board
CLS Communal Land Support
CS Conservancy Support
DNEA Directorate of National Examinations and Assessments, Ministry of Education
DoT Directorate of Tourism and Gaming, Ministry of Environment and Tourism
DVS Directorate of Veterinary Services, Ministry of Agriculture, Water and Forestry
EMIS Education Management Information System
ENP Etosha National Park
ERR Economic Rate of Return
ESA Environment and Social Assessment
ETSIP Education and Training Sector Improvement Programme
GA Grazing Area
GIS Geographic Information System
GRN Government of the Republic of Namibia
HAMU HIV/AIDS Management Unit, Ministry of Education
INP Indigenous Natural Product
INP‐IF INP Innovation Fund
IP Implementing Partner
IPMS Integrated Programme Management System
IPTT Indigenous Plants Task Team
ITT Indicator Tracking Table
JV Joint Venture
LMEF Livestock Market Efficiency Fund
M&E Monitoring and Evaluation
MAWF Ministry of Agriculture, Water and Forestry
MCA‐N Millennium Challenge Account Namibia
MCC Millennium Challenge Corporation
MET Ministry of Environment and Tourism
MIS Management Information System
MLR Ministry of Lands and Resettlement
MoE Ministry of Education
MRLGHRD Ministry of Local and Regional Government, Housing and Rural Development
NACSO Namibia Association of Community‐Based Natural Resource Management (CBNRM) Support
Organizations

NA North American
NADM North America Destination Marketing
NamLITS Namibia Livestock Identification and Traceability System
NCAs Northern Communal Areas
NCHE National Council for Higher Education
NDP National Development Plan
NGO Non‐Governmental Organisation
NHIES Namibia Household Income and Expenditure Survey
NLFS Namibia Labour Force Survey
NSA Namibia Statistics Agency
NSFAF National Student Financial Assistance Fund
NTA Namibia Training Authority
NTB Namibia Tourism Board
NTF National Training Fund
RIAs Rangeland Intervention Areas
PIA Programme Implementation Agreement
PoN Polytechnic of Namibia
PPO Producer and Processor Organisations
Q‐camps Quarantine Camps
QDRP Quarterly Disbursement Request Package
RSRC Regional Study and Resource Centre
SCMU Supply Chain Management Unit, Ministry of Education
SME Small and Medium Enterprise
SVO State Veterinary Office
TA Traditional Authority
TEIs Tertiary Education Institutions
UNAM University of Namibia
VTC Vocational Training Centre
VTP Vocational Training Provider
WASH Water and Sanitation Health

1 | P a g e
1. Overview
Millennium Challenge Account Namibia (MCA‐N) is committed to delivering on the promises
made to the nation in the Compact signed between the governments of Namibia and the
United States. As such, measuring and tracking achievements and the impact that the
Compact is having on beneficiaries (the most important group of people to consider in the
implementation of the Programme) is of great importance. Therefore, this M&E Plan has
been developed by MCA‐N to serve as a tool to plan and manage the process of monitoring,
evaluating, and reporting progress towards achieving Namibia’s Compact results. It is used
in conjunction with other reporting and management tools such as work plans, procurement
plans, and financial plans.
The M&E Plan serves the following functions:
Explains in detail how and what will be a) monitored for the various Projects and
Activities to determine whether they are on track to achieving their intended results
and b) evaluated to estimate the impact and determine cost effectiveness and
sustainability of projects and activities.
Includes all indicators that must be reported to MCC and other stakeholders and the
targets they are reported against.
Serves as a guide for programme implementation and management and a
communication tool that allows MCA‐N and other stakeholders to understand the
Compact’s objectives, the targets the Programme must achieve, and progress made
towards those objectives and targets as implementation proceeds.
Provides data and information to support decisions about programme adjustments.
The M&E Plan is considered a binding document, and failure to comply with its stipulations
could result in suspension of disbursements. It may be modified or amended as necessary
only with the approval of MCC and the MCA‐N Board.
2. Summary of Programme, Projects, and Objectives
2.1 Description of Compact
The primary goal of the Compact is to reduce poverty in Namibia through economic growth,
focusing on three key sectors that make up the three Projects: Education, Tourism, and
Agriculture. The three Project‐level objectives are as follows:
1. Education Project: To alleviate workforce quality constraints to private sector‐led
growth by enhancing the equity and effectiveness of basic, vocational, and tertiary
education.
2. Tourism Project: To grow the Namibian tourism industry by improving tourism
management and increasing awareness of Namibia as a tourist destination.

Page | 2
3. Agriculture Project: To improve rural livelihoods by enhancing the sustainable use of
resources (the rangeland, livestock, and indigenous natural products) and increasing
land tenure security.
The Projects are described below, and the Programme Logic in Annex 4 provides a graphical
depiction of the expected chain of events for each sub‐activity while the map in Annex 5
portrays the geographic locations of MCA‐N’s interventions across the country.
The Education Project will improve the quality of education and training and access for
under‐served groups, enhancing the quality of the country’s labour force and increasing
employment opportunities for young people. The activities and sub‐activities of this project
are:
1. Improving the quality of general education
a. Construction and/or rehabilitation of 47 schools – This sub‐activity involves the
construction, rehabilitation, and/or equipping of facilities at up to 47 schools
located across the country. The goal of the intervention is to improve the
learning and teaching environment and maximize the ability of learners to
develop academically and thus perform at a higher level – ultimately enhancing
their chances in life as they pursue further education/training and become
contributing citizens.
b. Policy, operational and administrative support to the education sector,
including but not limited to Continuing Professional Development (CPD)1,
through which some support will be provided that cuts across the education
sector (e.g., HIV/AIDS training) or that encompasses one or more Education
Project sub‐activities (e.g., facilities management training and textbook
management training) – Through this sub‐activity, support is provided to the
CPD unit of the University of Namibia (UNAM) to upgrade educators’ skills and
competencies. The main goal is to improve teaching effectiveness and learner
performance. Also, technical support for improving the national standardized
testing system, as well as facilities management and Water and Sanitation
Health (WASH) activities, will be provided.
c. Equipment for Colleges of Education (CoEs)2 – This sub‐activity involves the
provision of science and Information, Communication and Technology (ICT)
equipment to UNAM’s CoEs. The action is aimed at facilitating higher student
achievement in the related subjects, leading to improved outcomes not only in
learning but also in later teaching.
1 Through a new, semi‐autonomous structure of Continuous Professional Development (CPD), the Education Project will help facilitate the development and delivery of specific training programs for teachers, teacher educators, and educational managers (principals, advisory teachers, inspectors of education etc.). MCA‐N has four or more CPD program activities scheduled including textbook management and utilization, HIV/AIDS teacher training, facilities maintenance, National Standardized Achievement Test deficiency training, and other training for managers in a decentralized environment. 2 The CoEs were incorporated into UNAM via a September 2009 Cabinet decision, effective 2010.

Page | 3
2. Expanding vocational and skills training
a. Technical assistance to establish a National Training Fund (NTF) – MCA‐N’s
intervention under this sub‐activity supports the Namibia Training Authority
(NTA) in the creation and operationalization of a levy collection system to fund
high priority vocational education and skills training.
b. Construction and upgrading of 9 Community Skills and Development Centres
(COSDECs), donation of 2 COSDEC mobile units, and training of Community Skills
Development Foundation (COSDEF) Management Support Unit staff – MCA‐N is
assisting in the construction of 4 new and upgrading of 5 existing COSDECs as
well as the construction of an Arts and Crafts Centre. In addition, COSDEC and
Foundation leadership receive support in strategic planning, budgeting, finance,
community skills assessment and performance management, all of which are
aimed at helping ensure that COSDECs and the training that they offer are more
responsive to the needs of their communities and of the local and national
economy.
c. Competitive grants for high‐priority vocational training programmes – Until the
NTF levy is operational, MCA‐N is financing training in high‐demand skill areas.
Like the rest of the sub‐activities under the “Expanding vocational and skills
training” activity, this action is aimed at expanding the availability of high‐
priority skills training and related opportunities and increasing the number of
people benefiting from vocational training in terms of better employment
prospects and increased income.
3. Improving access to and management of textbooks
a. Textbook baseline study – This study was conducted to collect detailed
information on textbooks and related indicators in the Namibian general
education system and to ascertain the exact level of textbooks presence for
each Namibian school for English, Mathematics and Science. Its findings were
used to inform the follow‐on activities (see b. and c. below).
b. Procurement and distribution of English, Mathematics, and Science textbooks –
As its name suggests, this sub‐activity involves the purchase and supply of
textbooks to schools around the country. The effort is aimed at reducing gaps
in the current provision of books, and increasing efficiency in textbook delivery
by refining the curriculum and improving the procurement process, including
the creation of the Supply Chain Management Unit (SCMU) to oversee the
entire textbook process, establishing a per capita capitation allotment formula
to determine yearly textbook need, ring fencing the textbook budget,
developing a textbook management information system as well as textbook
usage and management processes and training.
c. Textbook management policy and training (with training included under CPD) –
This sub‐activity builds the capacity of educators in how to manage and utilize

Page | 4
learning support materials, specifically textbooks. This will help ensure the
appropriate use of such materials for maximum learning potential.
4. Construction and management of Regional Study and Resource Centres (RSRCs)
a. Construction of 3 RSRCs – MCA‐N is constructing the first 3 of what will
eventually be 13 large resource centres (one in each of Namibia’s 13 regions)
that provide a wealth of documentation, information resources, training
materials and programs, as well as study facilities to local residents, providing
them with a nearby, well‐stocked resource for advancing their knowledge. The
vision is of centres that extend beyond the traditional role of public libraries
and enhance efforts to develop Namibian society, including supporting civic,
educational and entrepreneurial information needs.
b. Technical assistance and training to RSRC staff – This support provides guidance
in developing the RSRCs into key components of a regionally administered and
community focused library system. It will also help implement a national
Integrated Library Management System, which will digitize many aspects of
library service.
5. Expanding and improving access to tertiary finance
a. This activity involves the provision of technical assistance to develop a strategy
for expanding and improving access to tertiary finance by providing a policy and
operational framework for the effective and efficient deployment of a tertiary
education finance policy and providing an implementation strategy for MCA‐N
supported technical assistance to the National Council for Higher Education
(NCHE) and the National Student Financial Assistance Fund (NSFAF).
6. Provision of cross‐Project support
a. HIV/AIDS management strengthening to the Ministry of Education’s HIV/AIDS
Management Unit (HAMU) – This action is aimed at supporting HAMU to
improve the mainstreaming, coordination capacity and effectiveness of HIV and
AIDS responses in the education sector at national and regional levels.
The Tourism Project will improve the management and infrastructure of Etosha National
Park (ENP), enhance the marketing of Namibian tourism and, develop the capacity of
communal conservancies to attract investments in ecotourism and increase their revenue.
The activities and sub‐activities of this project are:
1. Improved management of and infrastructure for ENP
a. Policy reform and technical assistance to support improved management of ENP
– This sub‐activity aims to improve the management capacity of ENP through the
provision of technical assistance in support of improved management and a
study of tourism carrying capacity and potential tourism investments in and
around ENP.

Page | 5
b. Infrastructure investments in management centres and staff housing – The
MCA‐N Programme is supporting the construction of management centres and
staff housing in ENP. The goal of this intervention is to improve work conditions
and thus attract and retain high quality staff to apply their skills in the Park.
c. Provision of road maintenance and game translocation equipment – As its name
suggests, the support provided under this sub‐activity includes the provision of
road maintenance and game translocation equipment, which enables ENP staff
to improve the tourist experience not only in the Park but also in conservancies
receiving game species from the Park.
2. Marketing Namibia as a tourist destination
a. Destination marketing to the North American market – The objective of the
MCA‐funded North America Destination Marketing (NADM) sub‐activity is to
grow the Namibian tourism industry by carrying out an innovative, trade‐
focused marketing campaign to increase both arrivals from the North American
(NA) market and the number of NA tourism businesses that offer tours and
packages to Namibia. The support involves working closely with the Namibia
Tourism Board (NTB) and industry stakeholders to develop and market
itineraries that showcase tourism products and services offered by communal
conservancies, joint ventures (JV), and locally developed and managed
experiences throughout Namibia; build capacity among communities and JV
projects to reach NA operators; and conduct a public relations and marketing
campaign to increase recognition and awareness of Namibia’s offerings.
b. Development and marketing of local and regional tourism routes – As its name
suggests, this sub‐activity is an effort to develop local and regional tourism
routes in Namibia. Its overall aim is to improve the country’s offerings to
international (and domestic) travellers and thus enhance its appeal to potential
tourists, thereby increasing rural communities’ prospects of improving their
livelihoods through tourism enterprise.
c. Interactive website development – Like the other sub‐activities under this
activity (see a. and b. above), this sub‐activity is aimed at increasing the number
of tourist arrivals to Namibia by raising the country’s profile (i.e., awareness of
Namibia as a tourism destination) in target markets. The specific objective of
the online marketing campaign is to assist the NTB and its staff to carry out a
global online marketing plan for an initial period of two years to build
awareness of the value and effectiveness of online marketing techniques.
Concurrent capacity‐building helps enable NTB and industry to carry related
efforts forward after the Programme ends.
3. Ecotourism development in conservancies
a. Needs assessment of conservancies – The needs assessment (and the related
update review) evaluated the needs of conservancies in terms of the training
and technical assistance modules that each conservancy should receive as part

Page | 6
of the follow‐on support (see b. below). The information was gathered through
a series of consultations with individual conservancies, the Ministry of the
Environment and Tourism (MET), nongovernmental organizations (NGOs), and
private sector tourism operators.
b. Technical assistance and capacity building for conservancies – This sub‐activity is
aims to strengthen the capacity of conservancies to protect their natural
resources, attract investment, and achieve financial sustainability so that
households in communal conservancies can improve their livelihoods. Based on
individual conservancy needs and demands, the support provides a range of
technical assistance services and grant funding to 31 target conservancies across
the country. Such assistance and funding will help mitigate existing barriers to
tourism enterprise investment and contribute towards the financial
sustainability of conservancies. In addition, formerly disadvantaged Namibian
communities in selected conservancies will be empowered by having their
participation in potentially lucrative tourism enterprises facilitated through grant
funding (see c. below) to promote JV and other tourism enterprises.
c. Grant funds for conservancies for joint‐venture enterprises – The Conservancy
Development Support Grant Fund (CDSGF) supports conservancies in their
efforts to develop small tourism enterprises, limit human wildlife conflict, enter
into JV agreements with the private sector and market their tourism product
offerings, all with the goal of enabling them to capture a greater share of the
revenue generated by tourism. Together these activities are aimed at increasing
income and creating job opportunities, whilst preserving the natural resources
that serve as the base for the tourism industry.
The Agriculture Project will support investments aimed at achieving a sustainable increase in
the economic performance of the agricultural sector. The activities and sub‐activities of this
project are:
1. Improved land access and management
a. Communal land support (CLS) – The overall objectives of the CLS sub‐activity are
(1) to empower residents and land holders at the village/local level to actively
participate in the use and management of their land resources in the Northern
Communal Areas (NCAs); and (2) to improve the administration and
management of communal lands. The actions under this sub‐activity include,
among others, a comprehensive public awareness and outreach campaign to
educate the public regarding their land rights, the streamlining of administrative
procedures, a systematic verification and registration process that will result in
the formalization of land rights in the NCAs, and capacity building for Communal
Land Boards (CLBs) and other land administration institutions, namely
Traditional Authorities (TAs) and staff of the Ministry of Lands and Resettlement
(MLR).
b. Community‐based rangeland and livestock management (CBRLM) – MCA‐N
support under this sub‐activity aims to improve communal farmers’ livestock

Page | 7
quality and value by supporting training in community‐based management of
rangeland resources, herd management, and farm enterprise management
skills, including specific outreach to women in small ruminant production and
marketing, among participating communities. In addition, these communities
are eligible to receive rangeland management infrastructure (e.g. water points,
auction facilities, genetic material, etc.) to support their efforts.
2. Provision of support to the livestock sector
a. Construction of State Veterinary Offices (SVOs) and upgrading of quarantine
camps (q‐camps) – The MCA‐N Programme is supporting the construction of 5
SVOs in underserved parts of the country and 2 quarantine camps in Caprivi
Region. The new SVOs (and their related staff housing that aimed at improving
working conditions for SVO personnel) aim to bring veterinary services closer to
farmers and thus contribute to improved animal health, while the q‐camps are
designed to reduce losses due to quarantine inefficiencies and also contribute
to improved animal health.
b. Livestock traceability system – In partnership with the Ministry of Agriculture,
Water and Forestry (MAWF), this activity aims to support the universal tagging
of cattle in the NCAs and the establishment of a national traceability system for
livestock management. This will help Namibia to better understand and control
disease outbreaks and meet the food safety requirements of local and
international markets.
c. Livestock Market Efficiency Fund (LMEF) – The LMEF invests in improvements
that foster greater efficiencies in livestock marketing as well as in efforts to
understand livestock health and diversify market opportunities for farmers in
the NCAs. Along with the traceability system for livestock management (see b.
above), a key LMEF grant is aimed at placing Namibia’s NCAs firmly on the path
towards recognition as Foot and Mouth Disease and Contagious Bovine
Pleuropneumonia “disease‐free” by the World Organization for Animal Health.
3. Development of indigenous natural products (INPs)
a. Support to Producer and Processor Organisations (PPOs) – Under this sub‐
activity, PPO management and harvesters are provided with training to
improve harvesting practices and advance their operational and business
capacity, thus contributing to the activity’s overall goal to increase the volume,
quality and value addition of INPs.
b. Provision of the INP Innovation Fund (INP‐IF) – The INP‐IF supports research,
testing and application of new innovations and services critical to the INP
industry’s immediate, short‐term and long‐term competitiveness.
c. Delivery of Market Information – This sub‐activity aims to improve market
information to PPOs, provide capacity building for the Indigenous Plant Task
Team (IPTT) and supports implementation plans to ensure the protection of
indigenous knowledge.

Page | 8
2.2 Programme Logic
The below Programme Logic Diagram summarizes the Namibia Programme’s goals, Project‐
level objectives, and activity‐level outcomes of interest.
Short-, medium-, and long-term outcomes Compact goal
• Enhanced learning and cognitive development at
MCA‐N‐targeted schools• Increased access to quality vocational and skills
training
• Reduced gaps in the current provision of books,
and increased efficiency in textbook procurement
and delivery
• Increased use of information for formal
education, informal learning, business, and
research
• Expanded and improved access to tertiary finance
• Strengthen HIV/AIDS prevention and
management in the sector
• Improved management efficiency of ENP
• Increased international awareness of Namibia as
a tourist destination
• Improved management of and increased income
to communal conservancies
• Improved land tenure security and efficiency of
land tenure administration
• Increased community adoption of sustainable
rangeland management, animal husbandry, and
marketing techniques and methodologies
• Established systems for disease control,
improved livestock quality, and better market
access
• Improved production of and market access for
INPs
MCA‐N COMPACT LOGIC
Poverty reduction through economic growth
Education
Project
Tourism
Project
Note: The outcomes and goal indicators are informed by Vision 2030 and NDP3 and are in line with NDP4, and they reflect the expectation that MCA Namibia Programme will
contribute to the goals of Vision 2030. However, the MCA Namibia Programme is not of sufficient scale or scope to independently achieve these goals.
Agriculture
Project
Increased
competence of the
Namibian
workforce,
improved tourism
management and
awareness of
Namibia as a tourist
destination, and
increased
productivity of
agricultural and non‐
agricultural
enterprises in rural
areas.
Programme
ObjectiveCompact Goal
Poverty reduction through
economic growth, as
measured by the following
indicators:
• Poverty rate
• Unemployment rate
• Median household income
A detailed, sub‐activity‐level Programme Logic (that includes all indicators being used to
track progress) is provided in Annex 4.
2.3 Expected Impact
Overall, the US$304.5 million invested through the MCA‐N Programme is expected to
generate US$335.8 million in increased income and benefits over the life of the investment3.
At the end of the 5‐year Compact, the poverty rate is expected to decrease by almost 8
percentage points, from 27.6% to 20%. Median household income is expected to increase
by 27%, from N$43,520 to N$55,269, while the unemployment rate is expected to decrease
from 51.2%4 to 33.6% (based on the Namibia Labour Force Survey). These Goal‐level
indicators are national‐level indicators that are informed by the National Development Plans
3 This is the net present value of the benefits over the time indicated in the table in section 2.4 using a discount rate of 10%. 4 Note that data quality concerns were registered about this unemployment rate (see Additional Information column on p. 1 of Annex 1) and subsequent improvements made in methodology; therefore, any changes in the rate may not be directly comparable.

Page | 9
(specifically NDP3 and NDP4) towards Vision 2030 and are used because the MCA‐N
Programme is anticipated to contribute to the broader efforts of the Government of the
Republic of Namibia (GRN).
2.4 Economic Analysis
The economic impact of the MCA‐N Programme’s activities was estimated through economic
rate of return (ERR) calculations, using a cost‐benefit analysis. The ERRs attempt to quantify
the increase in incomes that will be generated by the activity. The Namibia Compact’s ERRs
were initially calculated by MCC prior to approval of the Programme and are currently being
updated. The updated ERRs will appear in the next iteration of the M&E Plan to provide
some context about the long‐term impacts that are expected from the Programme.
In the meantime, the original ERRs are still included below for context since they contributed
to early decisions related to the Compact. It should be noted that they are only estimates,
and any ex‐post analysis on the same activity may produce a different result due to
improved data, costs or benefits that may not have been included in the initial analysis, and
programme adjustments during implementation. It should also be noted that in some cases,
an ERR is not calculated for an activity/sub‐activity due to lack of available data.
Project Activity (Sub‐
Activity)
ERR
(initial)
ERR
(updated)
Time
Horizon
(Years)
Key Benefits (per
updated ERR)
Reason for ERR
change
EDUCATION Improving the
Quality of
General
Education (47
Schools)
13.7% 9% 20 • Increased
employment
income
• Reduced costs to
the education
sector due to lower
repetition and
failure rates
• Added benefits
of textbooks
• Including the
cost of proportion
of textbooks in
activity costs
• Updated student
numbers
Improving
Access to and
Management
of Textbooks
114% 109% 10 • Efficiency gains
via reduced
distribution and
procurement costs
• Delete effect on
student outcomes,
which is now
accounted for in
the Improving the
Quality of General
Education ERR
Expanding
Vocational
and Skills
Training
(Construction
of COSDECs)
44% 20% 30 • Increased
income of
participants
• Adjusted
timeline of benefits
so trainees begin
enrolling in year 5
and benefits begin
to accrue in year 6

Page | 10
Project Activity (Sub‐
Activity)
ERR
(initial)
ERR
(updated)
Time
Horizon
(Years)
Key Benefits (per
updated ERR)
Reason for ERR
change
• Extended
earnings benefits
from 20 years to 30
years
Expanding
Vocational
and Skills
Training
(Establishmen
t of NTF)
22.2%
4.7% 30 • Reduced costs of
provision of
training
• Increased
income of
participants
• ERR previously
calculated in
combination with
VTGF sub‐activity;
now separately
calculated
• MCC Costs
changed to NAD
from USD
• Extended income
benefits from 20 to
30 years
Expanding
Vocational
and Skills
Training
(VTGF)
21% 30 • Increased
income of
participants
• ERR previously
calculated in
combination with
Establishment of
NTF sub‐activity;
now separately
calculated
Expanding
and
Improving
Access to
Tertiary
Finance
21.1% 21.1% 20 • Increased
number of
graduates of
tertiary education
n/a
TOURISM Ecotourism
Development
in
Conservancies
7% 14.2%5 20 • Increased
income to
conservancies and
to conservancy
members
• Profits to joint‐
venture partners
• Tax revenues to
the Namibian
government
• Increased
• Adjusted cost‐
benefit analysis
figures, notably the
figures for
expected revenues
and operating
costs as well as the
rate of potential
self‐sufficiency
5 This figure should be considered tentative; key parameters need to be verified and the model needs to be peer reviewed.

Page | 11
Project Activity (Sub‐
Activity)
ERR
(initial)
ERR
(updated)
Time
Horizon
(Years)
Key Benefits (per
updated ERR)
Reason for ERR
change
numbers of wildlife
Improved
Management
of ENP
11% 11% 2 • Increased
tourism visits and
value added to the
Namibian
economy,
increased income/
receipts to ENP
n/a
Tourism
Marketing
17.8% 17.8% 6 • Increased
tourism arrivals
• Value added
from overseas
tourists
n/a
AGRICULTURE Land Access
and
Management
and Livestock
Support
8.7% update
not yet
final
20 • Efficiency gains
in marketing
• Improved land
tenure security for
communal farmers
• Policy
adjustment for
communal land to
better protect the
rights of women
and other
vulnerable groups
• Improved animal
health
• Reduced
expected losses of
livestock due to
severe weather
tbd
INPs 2.9% 11% 20 • Expanded supply
and more value‐
added by primary
producers
• Increased market
access for primary
producers
• Increased price
of INPs due to
certification and
marketing
• Added new
benefit streams for
product lines not
previously
modelled
Page | 12
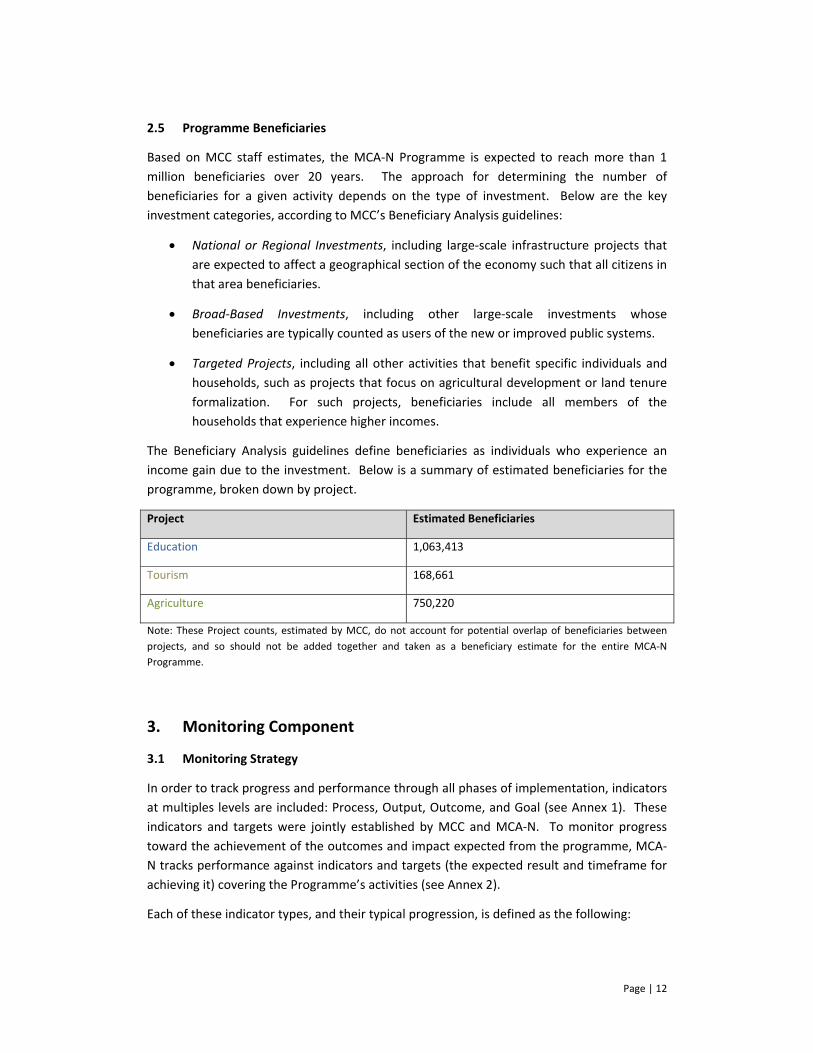
2.5 Programme Beneficiaries
Based on MCC staff estimates, the MCA‐N Programme is expected to reach more than 1
million beneficiaries over 20 years. The approach for determining the number of
beneficiaries for a given activity depends on the type of investment. Below are the key
investment categories, according to MCC’s Beneficiary Analysis guidelines:
National or Regional Investments, including large‐scale infrastructure projects that
are expected to affect a geographical section of the economy such that all citizens in
that area beneficiaries.
Broad‐Based Investments, including other large‐scale investments whose
beneficiaries are typically counted as users of the new or improved public systems.
Targeted Projects, including all other activities that benefit specific individuals and
households, such as projects that focus on agricultural development or land tenure
formalization. For such projects, beneficiaries include all members of the
households that experience higher incomes.
The Beneficiary Analysis guidelines define beneficiaries as individuals who experience an
income gain due to the investment. Below is a summary of estimated beneficiaries for the
programme, broken down by project.
Project Estimated Beneficiaries
Education 1,063,413
Tourism 168,661
Agriculture 750,220
Note: These Project counts, estimated by MCC, do not account for potential overlap of beneficiaries between
projects, and so should not be added together and taken as a beneficiary estimate for the entire MCA‐N
Programme.
3. Monitoring Component
3.1 Monitoring Strategy
In order to track progress and performance through all phases of implementation, indicators
at multiples levels are included: Process, Output, Outcome, and Goal (see Annex 1). These
indicators and targets were jointly established by MCC and MCA‐N. To monitor progress
toward the achievement of the outcomes and impact expected from the programme, MCA‐
N tracks performance against indicators and targets (the expected result and timeframe for
achieving it) covering the Programme’s activities (see Annex 2).
Each of these indicator types, and their typical progression, is defined as the following:

Page | 13
Indicator Type Definition Example
Process Activities undertaken and
milestones achieved Contract signed
Output Products and services produced # of farmers trained
Outcome
Immediate and higher order
effects of outputs on
beneficiaries
# of farmers adopting new
technology
Change in farmer income
Change in crop yield
Goal Tracks impact on economic
growth and poverty reduction Poverty Rate
3.2 Indicator Documentation, Baselines and Targets
Detailed information on indicators, including definitions, timing and frequency of reporting,
units, level, classification, source, and responsible parties for reporting, has been compiled in
Annex 1.
Every indicator must have a baseline, which should ideally be established prior to the start of
the corresponding activity. All indicators also must have annual targets whenever
appropriate. It should also be noted that even if the frequency of an indicator’s target is
annual, reporting on that indicator may be more frequent, to provide up‐to‐date information
on progress; in many cases, the indicator will be reported on quarterly. Targets for process
milestone and output indicators typically come from project work plans, though they are not
derived from these exclusively. Targets for outcome and goal indicators are largely derived
from quantitative analysis and/or expert input. The baselines and targets for each indicator
are compiled in Annex 2.
In addition to the notes provided in the indicator tables, please note the following:
Additional indicators (and their related baselines, targets, and other documentation)
may be added in subsequent revisions of the M&E Plan.
Some indicators tracking achievements related to the Tourism Project’s ENP activity
have not been included, but it should be noted that maintenance and game
translocation equipment valued at US$2,900,000 were delivered to ENP by 1
September 2010, and a new staffing structure for ENP was approved in July 2011.
Some indicators tracking impacts related to the CBRLM sub‐activity have not been
included but MCA‐N plans to work with the data collection teams, the evaluators,
and the relevant experts to devise suitable indicators and related targets.
All the indicators are also reflected in the detailed Programme Logic in Annex 4.
Page | 14
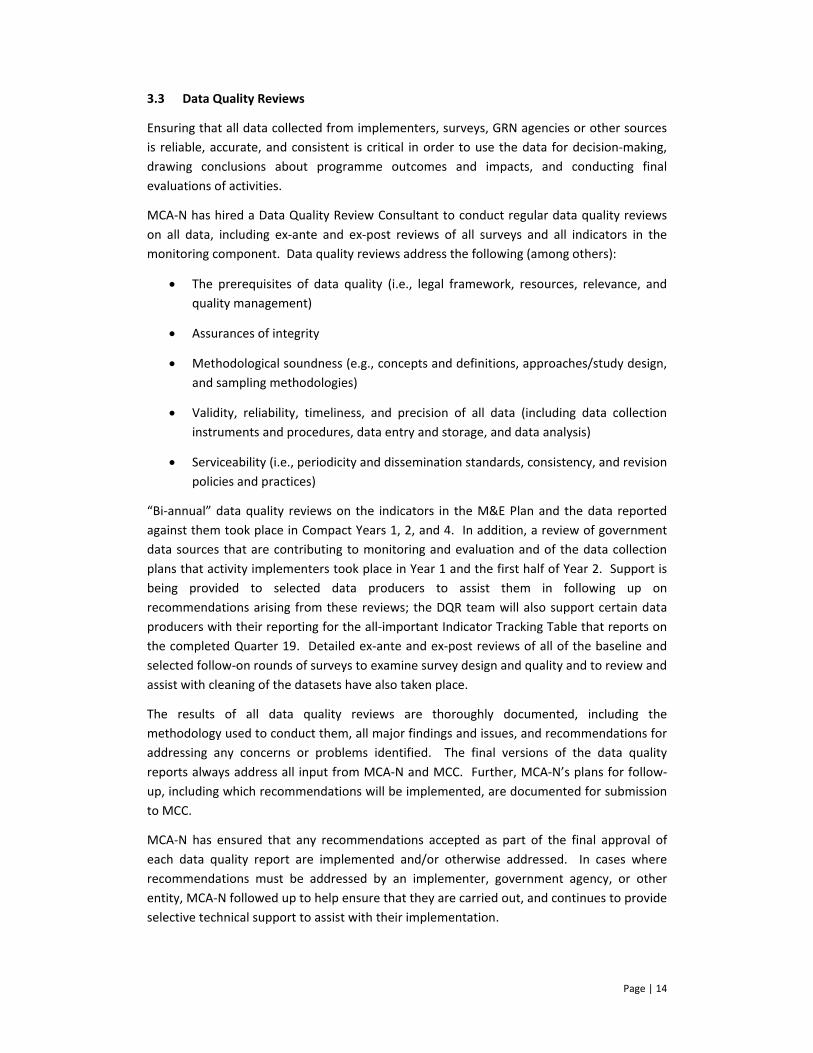
3.3 Data Quality Reviews
Ensuring that all data collected from implementers, surveys, GRN agencies or other sources
is reliable, accurate, and consistent is critical in order to use the data for decision‐making,
drawing conclusions about programme outcomes and impacts, and conducting final
evaluations of activities.
MCA‐N has hired a Data Quality Review Consultant to conduct regular data quality reviews
on all data, including ex‐ante and ex‐post reviews of all surveys and all indicators in the
monitoring component. Data quality reviews address the following (among others):
The prerequisites of data quality (i.e., legal framework, resources, relevance, and
quality management)
Assurances of integrity
Methodological soundness (e.g., concepts and definitions, approaches/study design,
and sampling methodologies)
Validity, reliability, timeliness, and precision of all data (including data collection
instruments and procedures, data entry and storage, and data analysis)
Serviceability (i.e., periodicity and dissemination standards, consistency, and revision
policies and practices)
“Bi‐annual” data quality reviews on the indicators in the M&E Plan and the data reported
against them took place in Compact Years 1, 2, and 4. In addition, a review of government
data sources that are contributing to monitoring and evaluation and of the data collection
plans that activity implementers took place in Year 1 and the first half of Year 2. Support is
being provided to selected data producers to assist them in following up on
recommendations arising from these reviews; the DQR team will also support certain data
producers with their reporting for the all‐important Indicator Tracking Table that reports on
the completed Quarter 19. Detailed ex‐ante and ex‐post reviews of all of the baseline and
selected follow‐on rounds of surveys to examine survey design and quality and to review and
assist with cleaning of the datasets have also taken place.
The results of all data quality reviews are thoroughly documented, including the
methodology used to conduct them, all major findings and issues, and recommendations for
addressing any concerns or problems identified. The final versions of the data quality
reports always address all input from MCA‐N and MCC. Further, MCA‐N’s plans for follow‐
up, including which recommendations will be implemented, are documented for submission
to MCC.
MCA‐N has ensured that any recommendations accepted as part of the final approval of
each data quality report are implemented and/or otherwise addressed. In cases where
recommendations must be addressed by an implementer, government agency, or other
entity, MCA‐N followed up to help ensure that they are carried out, and continues to provide
selective technical support to assist with their implementation.

Page | 15
3.4 Standard Reporting Requirements
MCA‐N reports quarterly on indicators and targets in the M&E Plan using the Indicator
Tracking Table (ITT). An ITT is submitted every quarter as part of the Quarterly
Disbursement Request Package (QDRP). Individual indicators are reported on within each
ITT according to the frequency outlined in this document’s Annex 1. Some additional
information on M&E is also provided in the Narrative Report that is part of the QDRP.
The full set of requirements for quarterly reporting is outlined in MCC’s Guidance on
Quarterly MCA Disbursement Request and Reporting Package. MCA‐N follows the most
current version of these guidelines when reporting each quarter.
The latest version of the ITT is posted on the MCA‐N website and quarterly status reports
based thereon are available on MCC’s website.
MCA‐N’s M&E and Public Outreach units use the progress reported in the ITT – as well as
other achievements tracked outside of the ITT – as a basis for results‐reporting.
3.5 Linking Disbursement to Performance
According to the Program Implementation Agreement (PIA) between MCC and GRN (through
the National Planning Commission), there must be “satisfactory progress on the M&E Plan
for the Programme, relevant Project or Project Activity and substantial compliance with the
requirements of such M&E Plan” (PIA, p. 16) prior to each disbursement of programme
funding. In the event that substantial compliance is not achieved, disbursements could be
held up until the requirement is met.
4. Evaluation Component
4.1 Introduction
Although programme monitoring is an integral part of tracking programme results, it is not
sufficient to measure higher‐level impacts on income and well‐being of beneficiaries, or to
glean lessons learned from implementation that can be applied to future interventions.
Consequently, evaluations of projects and activities, either individually or in sensible
combinations, are important to provide deeper measurement of results.
The methodology for each evaluation carried out should be tailored to what is feasible for
the activity under examination, but also should strive to use the most rigorous method
possible within that activity’s particular implementation context. In particular, it is
important, when feasible, to conduct impact evaluations that employ a rigorous approach
to estimate a counterfactual – that is, what would have happened in the absence of the
project or activity. Measuring results experienced by beneficiaries against a
counterfactual scenario (usually a comparison group of statistically similar individuals)
allows the net impact to be calculated quantitatively, and prevents overestimates of
results, since individuals who are not beneficiaries of MCA‐N activities may still see
improvements in their living situation due to other factors.

Page | 16
Below is a graphic presentation of how impact evaluations employ a comparison against a
counterfactual to determine the net impact attributable to the activity.
The below table summarizes the planned evaluation approach for each activity/sub‐
activity and the timeline for when results are expected.
Project Activity (Sub‐Activity) Evaluation Approach When Results Are
Expected
EDUCATION Improving the quality of general
education (includes 47 schools, CPD, and
textbooks)
Performance December 2015
Expanding Vocational and Skills Training Impact December 2016
Construction and management of RSRCs Performance December 2016
TOURISM Ecotourism Development in
Conservancies (joint evaluation with INPs)
Performance September 2014
Improved Management of ENP Performance December 2015
Tourism Marketing Performance December 2015
AGRICULTURE Land Access and Management (CLS) Performance December 2015
Land Access and Management (CBRLM) Impact June 2016
Livestock Support Performance September 2014
Development of INPs (joint evaluation
with Conservancy Support)
Performance September 2014
Beneficiaries(with activity)
Comparison(without activity)
Key Variable: Income
Year 1 Y2 Y3 Y4ProgrammePeriod
True Impact = B ‐ C
A
B
C
Impact ≠ B ‐ A
Why It Is Important To Measure An Activity’s Results Against A Counterfactual
Time
Note how the income of the Comparison group increases (though not as much) despite not participating in the activity.
Page | 17
Detailed descriptions of the evaluation concepts to date for each Project and activity/sub‐
activity follow below. In addition to the specific questions for each, all of them will look at
differences in impact between men and women and relevant age and income groups as
feasible and relevant, and will also assess lessons learned from implementation that can
be applied to similar activities in the future.
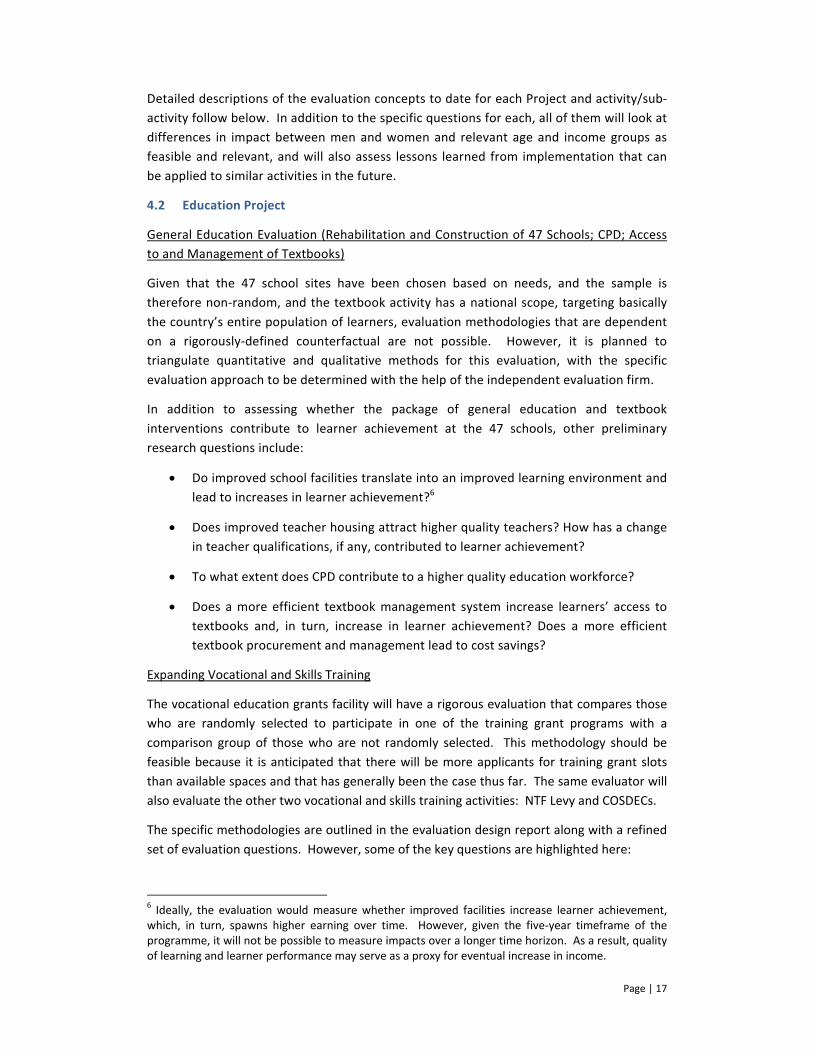
4.2 Education Project
General Education Evaluation (Rehabilitation and Construction of 47 Schools; CPD; Access
to and Management of Textbooks)
Given that the 47 school sites have been chosen based on needs, and the sample is
therefore non‐random, and the textbook activity has a national scope, targeting basically
the country’s entire population of learners, evaluation methodologies that are dependent
on a rigorously‐defined counterfactual are not possible. However, it is planned to
triangulate quantitative and qualitative methods for this evaluation, with the specific
evaluation approach to be determined with the help of the independent evaluation firm.
In addition to assessing whether the package of general education and textbook
interventions contribute to learner achievement at the 47 schools, other preliminary
research questions include:
Do improved school facilities translate into an improved learning environment and
lead to increases in learner achievement?6
Does improved teacher housing attract higher quality teachers? How has a change
in teacher qualifications, if any, contributed to learner achievement?
To what extent does CPD contribute to a higher quality education workforce?
Does a more efficient textbook management system increase learners’ access to
textbooks and, in turn, increase in learner achievement? Does a more efficient
textbook procurement and management lead to cost savings?
Expanding Vocational and Skills Training
The vocational education grants facility will have a rigorous evaluation that compares those
who are randomly selected to participate in one of the training grant programs with a
comparison group of those who are not randomly selected. This methodology should be
feasible because it is anticipated that there will be more applicants for training grant slots
than available spaces and that has generally been the case thus far. The same evaluator will
also evaluate the other two vocational and skills training activities: NTF Levy and COSDECs.
The specific methodologies are outlined in the evaluation design report along with a refined
set of evaluation questions. However, some of the key questions are highlighted here:
6 Ideally, the evaluation would measure whether improved facilities increase learner achievement, which, in turn, spawns higher earning over time. However, given the five‐year timeframe of the programme, it will not be possible to measure impacts over a longer time horizon. As a result, quality of learning and learner performance may serve as a proxy for eventual increase in income.

Page | 18
Competitive Grants for High‐Priority Vocational Skills Training (i.e., the Vocational Training
Grants Fund (VTGF))
Was the VTGF implemented as planned? How were the VTGF grants managed?
What were beneficiaries’ perceptions of the VTGF grants?
To what extent did those offered the opportunity of training through the VTGF
receive more training relative to non‐VTGF‐funded, qualified applicants?
How did employers hire VTGF graduates, and what were their perceptions of the
graduates? To what extent did the VTGF improve employment outcomes for VTGF‐
funded trainees relative to non‐VTGF‐funded, qualified applicants?
To what extent did VTGF‐funded trainees have higher earnings and income relative
to non‐funded, qualified applicants? To what extent did increased earnings result
from increased wages while employed, versus increased employment?
Did the effects of the training funded by the VTGF vary by trainee characteristics?
What key characteristics or practices of training providers were associated with
stronger impacts on employment and earnings?
Were the RPL and employer‐provided training pilots implemented as planned? To
what extent did employers’ and employees’ perceptions change after employee
certification?
Establishment of Namibia Training Fund (NTF)
Was the establishment of the NTF levy collection, distribution, and reporting system
implemented as planned?
How is the NTF levy collection and distribution system operating in practice
compared to the specifications outlined in the regulatory framework?
What are the stakeholder perceptions of sustainability of the NTF levy collection and
distribution system?
Construction and Upgrading of Community Skills Development Centres (COSDECs) and
COSDECs Management Training
Were the COSDEC Sub‐Activities implemented as planned?
To what extent did the COSDEC Sub‐Activities increase the availability of training?
How did COSDEC training affect the employment outcomes of trainees?
How did COSDEC training affect the earnings and income of trainees?
How were the new and renovated COSDECs managed?

Page | 19
Tertiary Finance
The Tertiary Finance component is has undergone significant programme design work during
the early Compact period. Appropriate monitoring indicators are still under development.
This activity will not undergo an independent evaluation given that the time required to
measure relevant outcomes, like income, and the resources that would be required to do so
are not justified by the activity budget. However, a number of intermediate outcomes can be
tracked with monitoring data. These might include the measure of expanded access to
tertiary education (e.g., enrolment), institutional efficiencies of tertiary education
institutions (TEIs) (e.g., loan recovery rates), and if possible, more equitable access to
tertiary education financing (e.g., proportion of students below the poverty line accessing
National Student Financial Assistance Fund products).
RSRCs
This activity is not a strong candidate for an impact evaluation, as there are not appropriate
facilities to serve as a counterfactual. However, independent evaluators will be hired to
design and implement a performance evaluation that uses a range of methods and data
sources to assess the relevance, efficiency, effectiveness, and sustainability of the RSRC
activity in achieving outputs and educational‐, economic‐, and community development‐
related outcomes. Evaluation questions include, among others, the following:
Was the Activity implemented according to plan, and within budget and schedule?
To what extent does the Activity reach intended and unintended participants? How
accessible are the facilities and services?
For what purpose do different groups of people use the RSRCs? To what extent do
the RSRCs meet different needs? What broader impact do the RSRCs have beyond
immediate users?
How effective is leadership in promoting and achieving the vision of the RSRCs?
How functional and sustainable are the RSRCs?
Cross‐Project Support (Support to HAMU)
This activity is not currently scheduled to be independently evaluated given its relative small
size, difficultly in identifying related outcomes that would be feasible to measure, and
limited potential to provide cost‐effective learning opportunities.
4.3 Tourism Project
Conservancy Development Support Services and the Conservancy Development Support
Grants Fund
The Conservancy Support (CS) activity is focused on 31 conservancies (i.e., about 40% of the
76 conservancies currently registered in Namibia) that were selected based on their high
potential for tourism. As such, a similarly‐situated group of conservancies that will not
receive the intervention cannot be established, rendering the activity unsuitable for an
impact evaluation. However, the activity will be evaluated through a mix of quantitative and

Page | 20
qualitative methods to compare results on beneficiaries and conservancies before and after
the intervention. The study will draw on panel survey data on households and communities
in the 31 conservancies, programme monitoring data, and data on conservancy revenue,
economic activity, and other information collected each year by the Namibia Association of
Community Based Natural Resource Management Support Organizations (NACSO). Due to
the overlap between the Conservancy Support sub‐activity and the INP sub‐activity, the
evaluations will be combined.
The conservancy component of the evaluation will consider the following questions:
Do technical support and grants to conservancies increase business partnerships
between conservancies and private businesses, and, in turn, increase conservancy
revenue?
Does technical support to conservancies improve benefit distribution?
Does the Conservancy Development Support Services (CDSS) sub‐activity lead to a
higher level and percentage of conservancy revenue going to members?
Do technical support and grants to conservancies increase business activity that
creates jobs and other opportunities for earned income for conservancy members?
o Is there an increase in Conservancy‐related employment as a result of the
CDSS activities?
o If so, how many new jobs are created and at what levels of employment –
formal/informal; unskilled/skilled/management?
Do the CDSS activities lead to an increase in household income over the life of its
programme?
What is the impact of game acquisitions (via game translocations)?
What is the effectiveness of training on gender integration over time in terms of
conservancy management and employment?
How sustainable are the results?
Because of the significant (but not full) overlap between conservancy members and INP
producers, the evaluation will cover both the CDSS‐related as well as the INP development‐
related activities.
Improved management and infrastructure of Etosha National Park
The evaluation of the improved ENP management and infrastructure is envisaged to be
largely qualitative, relying on an approach that involves a desk review, key informant
interviews, and case studies. The main objective of the evaluation will be to assess the
extent to which improved management of the ENP leads to improved tourist experience, a
sustainable increase in tourists and more revenue for the park. The specific evaluation
questions to be answered are yet to be finalised but preliminary questions include:

Page | 21
• To what extent, if any, do the park management reforms, improved equipment, and
new park management infrastructure increase park revenue or improved park
management?
• To what extent, if any, do the improved equipment and tourism‐related park
management reforms (specifically Galton Gate Plan and issuing of two access
concessions in ENP) lead to an improved visitor experience? How?
• To what extent, if any, do the park management reforms, improved equipment, and
new park management infrastructure increase the number of park visitors and/or
change the length of visitors’ stays in or in the vicinity of the park?
• To what extent did MCC’s investment in improving the management and
infrastructure in ENP increase private sector investment around the park on
communal lands?
• How sustainable are impacts related to Compact‐related ENP investments?
Marketing Namibia Tourism
The overall objective of the tourism marketing evaluation is to assess the success of the
activity in terms of increasing and stabilising the inflow of tourists into Namibia and
ultimately increasing tourism revenue into the country. The proposed evaluation should
involve a balanced and detailed analysis of the performance of the activity by answering
specific evaluation questions. Among other questions, the following questions are of
interest (but may be refined):
To what extent did the individual tourism marketing efforts, and the activity as a
whole, succeed in increasing tourist arrivals in Namibia generally, from North
America specifically and to conservancy sites in particular?
How effective are the online marketing efforts compared with traditional tourism
marketing?
How sustainable are these investments in tourism marketing?
Do North American tourism destination marketing efforts lead to changes in
perception among potential tourists in that area?
4.4 Agriculture Project
Communal Land Support
This activity will be evaluated to assess Compact‐related changes in parcel registration,
perceptions about land tenure, benefits to households or community groups that stem from
registration, and particular issues regarding women and vulnerable groups in obtaining
rights to parcels, including around their understanding of land rights and registration
thereof.

Page | 22
The specific methodology and refined set of evaluation questions will be outlined in the
approved evaluation design report; in the meantime, some preliminary questions are
highlighted below:
How has CLS contributed to increasing knowledge and awareness about land rights,
laws, and procedures?
To what extent was the policy reform agenda of CLS effective and appropriate?
How and to what extent has CLS helped improve perceptions related to tenure
security? To what extent has CLS helped to improve tenure security for women and
other vulnerable groups?
Has CLS contributed to improved economic outcomes?
How sustainable are the outputs and outcomes of CLS intervention likely to be?
Community‐Based Rangeland and Livestock Management
This activity will have a rigorous impact evaluation that compares the Rangeland
Intervention Areas (RIAs) selected to participate in the program with a statistically similar
group that shares key characteristics.7 The RIAs in the comparison group will receive some
parts of the intervention at the end of the MCA‐N Compact, so will gain some benefits of the
programme. The evaluation methodology will be outlined in more detail in the updated
evaluation design report, which will serve as the primary reference document on the
evaluation’s details.
The evaluation will consider questions including:
Do rangeland and livestock management training and technical support improve
cattle condition, cattle weight and herd composition, and ultimately lead to
increased average off‐take rate?
Does rangeland and livestock management training increase the quality of the
rangeland in communities?
Does the activity increase the wealth and mean household income of beneficiary
households?
Though some related outcome‐level indicators have been deleted from the indicator tables
(Annexes 1 and 2) given inadequate data sources, MCA‐N is committed to working with the
data collection teams, the evaluators, and the relevant experts to devise suitable indicators
and related targets.
Livestock Support
The evaluation of the MCA‐N’s individual Livestock Support activities – i.e., veterinarian
infrastructure support, livestock traceability system and livestock market efficiency fund
7 Given concerns over the sufficiency of statistical power to detect impacts, the viability of CBRLM evaluation is currently being assessed. Evaluation questions and/or methodologies may be adjusted based on this assessment.

Page | 23
(LMEF) – cannot be understood in isolation but rather only within the broader context of the
livestock sector and MCA Namibia’s Livestock Support Activity as a whole. The evaluation
will therefore include an assessment of the synergies between the different MCA‐N
Livestock Support sub‐activities.
Using quantitative and qualitative data (collected by MCA‐N, LMEF grantees, the Livestock
Support Evaluation Consultant, and other sources), the evaluation will assess the relevance,
effectiveness, efficiency, impact and sustainability of the MCA‐N Livestock Support activity.
In addition to the specific questions outlined in the evaluation design report, the evaluation
will also look at the impact of MCA‐N Livestock Support sub‐activities in terms of:
strengthening the livestock sector in the NCAs and reducing costs and losses
associated with marketing livestock there; and
identifying and eliminating barriers to increasing volume of livestock and livestock
products sold into existing markets and accessing additional markets destinations.
Development of Indigenous Natural Products (including all related sub‐activities: support to
PPOs, market information delivery, and the INP Innovation Fund)
As noted previously, there is significant, but not full, overlap between communities with high
concentrations of INP primary producers within the conservancy population. Thus the
evaluation of the two sub‐activities, INP and CDSS (or CS), will be combined. The INP sub‐
activity covers all producers of viable INPs in the country and therefore it is not feasible to
conduct a rigorous impact evaluation of this sub‐activity. However, the evaluation will aim to
measure impact and benefits to participants to the extent possible. In particular, the
evaluation will look at the change in household income among beneficiaries between the
baseline (2011) and end of project (2014). It will make extensive use of qualitative data,
which will allow for a triangulation of methods and provide information on lessons learned
about implementation. The same households will be tracked in all rounds of the evaluation
and monitoring surveys. Among other things, the evaluation will consider the following
questions:
Do the technical assistance package and the small grants sustainably increase the
volume of production and sales by harvesters? Do the technical assistance package
and the small grants increase the volume of processing and sales by producer
organizations? Do the technical assistance package and the small grants increase
harvesters’ income and producer organizations’ revenue?
What is the up‐take rate of the practices and techniques introduced as part of the
technical assistance?
To what extent has the Delivery of Market Information sub‐activity contributed to
increased understanding of the broader INP sector (e.g., volumes, markets, key
players, etc.)?
How has the re‐structuring of the Indigenous Plant Task Team contributed to the
growth and sustainability of the INP sector?

Page | 24
As the benefits from INPs increase, do men become more involved in INP harvesting
and management?
How sustainable are the results in terms of production, sales and income?
Overall, to what degree has the INP Innovation Fund accomplished its goals? How
did new developments from the INP Innovation Fund impact the INP sector?
In addition, the evaluation should examine the combined effects (interaction effects or
integrated impacts) of the conservancy‐ and INP‐related activities (e.g., for those harvesters
in PPOs that are conservancies, what is the additional benefit of being part of the PPO?).
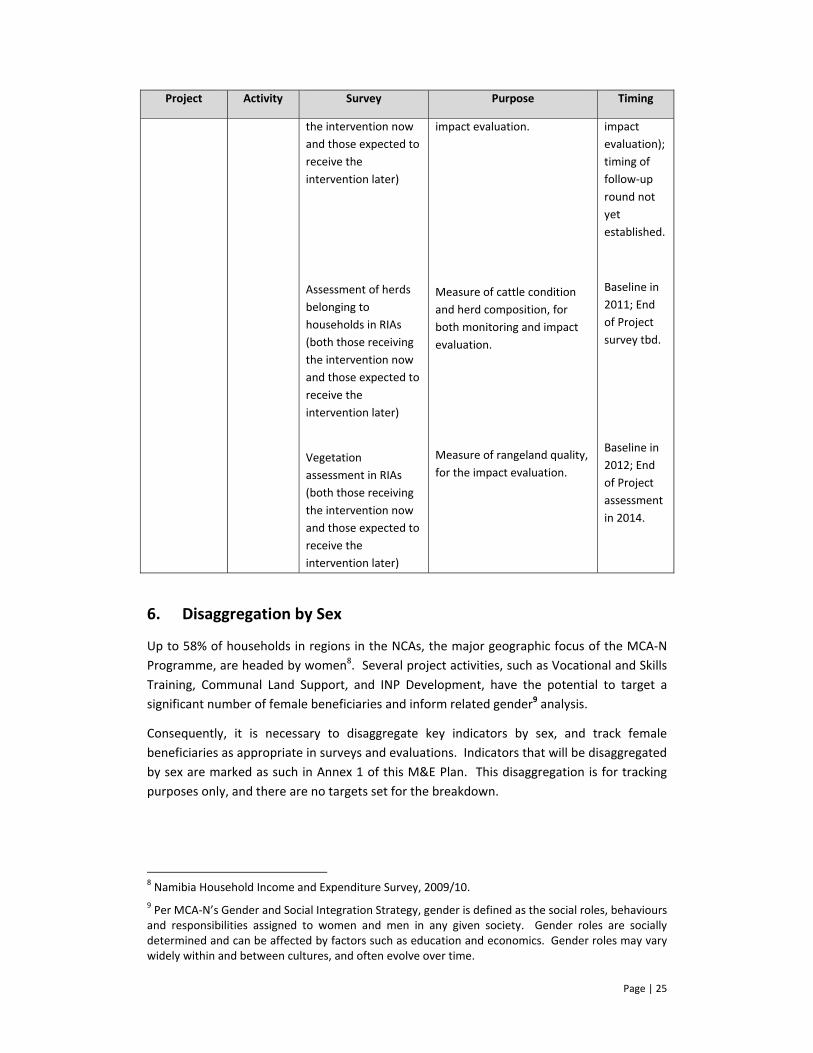
5. Surveys
The following table outlines the various MCA‐N‐commissioned surveys planned to provide
additional data to contribute to the monitoring component and to support the evaluation
component.
Project Activity Survey Purpose Timing
EDUCATION Vocational
and Skills
Training
Tracer survey on
trainees and
comparison groups,
focusing on
employment and
income
Contribute to monitoring
indicators and evaluation on
effects of vocational training
on employment and income
Baseline on‐
going
beginning in
2011;
follow‐up
rounds in
Years 3‐5
TOURISM Multiple
Activities
Tourist Exit Survey Provide up‐to‐date, reliable,
and comprehensive
information on foreign visitors
to Namibia and help compare
past trends and set new
benchmarks for the tourism
sector, especially with respect
to tourist behaviour,
expenditures and visitor
satisfaction/perceptions
Once‐off in
2012‐2013
TOURISM &
AGRICULTURE
(JOINT)
Conser‐
vancy and
INP
Support
Household and
Community Survey
(also conservancy and
PPO organizations)
Contribute to measuring
impact of activities on
household income,
organization revenue, and
employment (in the case of
Conservancy Support)
Baseline in
2011; End
of Project
survey in
2014
AGRICULTURE CBRLM Community and
Household Survey of
households in RIAs
(both those receiving
Measure income, off‐take,
adoption of CBRLM practices,
for both monitoring and
Baseline in
2010 (but
will not be
used in the
Page | 25
Project Activity Survey Purpose Timing
the intervention now
and those expected to
receive the
intervention later)
Assessment of herds
belonging to
households in RIAs
(both those receiving
the intervention now
and those expected to
receive the
intervention later)
Vegetation
assessment in RIAs
(both those receiving
the intervention now
and those expected to
receive the
intervention later)
impact evaluation.
Measure of cattle condition
and herd composition, for
both monitoring and impact
evaluation.
Measure of rangeland quality,
for the impact evaluation.
impact
evaluation);
timing of
follow‐up
round not
yet
established.
Baseline in
2011; End
of Project
survey tbd.
Baseline in
2012; End
of Project
assessment
in 2014.
6. Disaggregation by Sex
Up to 58% of households in regions in the NCAs, the major geographic focus of the MCA‐N
Programme, are headed by women8. Several project activities, such as Vocational and Skills
Training, Communal Land Support, and INP Development, have the potential to target a
significant number of female beneficiaries and inform related gender9 analysis.
Consequently, it is necessary to disaggregate key indicators by sex, and track female
beneficiaries as appropriate in surveys and evaluations. Indicators that will be disaggregated
by sex are marked as such in Annex 1 of this M&E Plan. This disaggregation is for tracking
purposes only, and there are no targets set for the breakdown.
8 Namibia Household Income and Expenditure Survey, 2009/10.
9 Per MCA‐N’s Gender and Social Integration Strategy, gender is defined as the social roles, behaviours and responsibilities assigned to women and men in any given society. Gender roles are socially determined and can be affected by factors such as education and economics. Gender roles may vary widely within and between cultures, and often evolve over time.

Page | 26
7. Vulnerable Groups
The MCA‐N Compact requires that “indicators will be disaggregated by sex, income level and
age, and beneficiary types to the extent practicable”. MCA‐N is using sectoral policy
definitions wherever available to define “vulnerable groups”10. Vulnerable groups are a
beneficiary type and certain indicators will be disaggregated accordingly, where feasible. In
the education and social sectors a number of documents are available defining both
marginalised and vulnerable children.11 In the agriculture and tourism sectors such
definitions are not readily available. The definitions described below will be used to
disaggregate selected M&E indicators, as defined in Annex 1, to the extent practicable.
Where infeasible to disaggregate monitoring indicators within the ITT, MCA‐N will
endeavour to ensure evaluation findings report on relevant disaggregations. It should be
noted that due to privacy concerns and willingness of respondents to provide certain types
of information, it may not be possible to collect data on all of the categories listed below.
Disaggregation by vulnerable groups will be continually evaluated for feasibility issues.
Within the education sector, vulnerable children include:
The girl‐child;
Indigenous minorities;
Orphans (children under 18 who have lost one or both parents);
A child living with a disability or living in a household headed by a person with a
disability; and
A child receiving a social grant (maintenance; foster; or disability).
Within the tourism sector, vulnerable people include:
Indigenous minorities;
People living with disabilities;
Elderly headed households whose primary source of income is a pension; and
Female‐headed households.
Within the agriculture sector, vulnerable people include:
Indigenous minorities12;
10 Per MCA‐N’s Gender and Social Integration Strategy, vulnerable groups are generically defined as those who cannot defend their own interests and who may be inadvertently excluded from Project Activities, or for whom benefits may be inaccessible as a result of severe poverty, low levels of education, social isolation or other factors. 11 National Policy on Orphans and Vulnerable Children (2004); National Policy of Educationally Marginalised Children (2000); Education Sector Policy for Orphans and Vulnerable Children (2008). 12 For the purposes of the MCA‐N M&E Plan, “Indigenous Minorities” are defined using the principal
of self‐determination described in the United Nations Declaration on the Rights of Indigenous Peoples (Resolution 61‐295), which to date in Namibia are the San and Himba ethnic groups.

Page | 27
People living with disabilities;
Elderly headed households whose primary source of income is a pension; and
Female‐headed households.
8. Modifying the M&E Plan
MCA‐N is required under Section 2.9 of the PIA to submit an updated M&E Plan to MCC on
an annual basis. The M&E Plan will be reviewed and revised as necessary each Compact
year, and MCA‐N will submit the updated M&E Plan to MCC and the MCA‐N Board. All
changes to the Plan will comply with the current approved version of MCC’s Policy for
Monitoring and Evaluation of Compacts and Threshold Programs.

Page | 28
9. Assumptions and Risks
Key assumptions about necessary factors for success and potential underlying risks are associated with all projects and activities. These are
summarized below and included in the M&E Plan to provide background information about the assumptions made when estimating expected
outcomes and impacts and context about external factors that may affect performance against indicators and targets and influence programme
results. These lists aim to be comprehensive, but should not be considered exclusive; it is possible that additional factors may be discovered over
time during programme implementation to affect performance.
9.1 Assumptions
Education Project
Improving the quality
of general education
Improved and expanded school facilities will improve the physical learning environment and contribute to improvement in the
quality of learning, which, in turn increases learners’ income over the long‐term.
Improved teacher housing will attract certified teachers to schools they otherwise would not teach in. Certified teachers provide
higher quality teaching, which improves learning outcomes, which, in turn increases learners’ income over the long‐term.
Improved quality of teachers, teacher educators, and education managers will lead to higher quality education services and improved
educational outcomes.
With the manuals and training in school maintenance as a part of project activities, staff will have the capacity to maintain the
physical learning environment. Material resources for school maintenance will be provided by the Namibian government through
the yearly education budget.
Improving access to
and management of
textbooks
A more efficient textbook management and utilization system will ensure that learners have the appropriate textbooks, thus
improving learning outcomes.
Textbook distribution across regions, schools and learners will be equitable.
The procurement reform, including textbook utilization, management, and storage activities will ensure that textbook utilisation and
distribution improvements can be maintained over the long term.

Page | 29
Constructing and
supporting
management of RSRCs
New RSRCs will attract a larger number of patrons who will use the facilities and materials to undertake activities that will increase
their income earning potential (such as use computers to work on their CVs or obtain information to start or improve a business),
utilize electronic and hard learning materials to improve their education or do homework to improve their performance in school,
and civic engagement.
Expanding vocational
and skills training
Training programmes will be widely available (i.e., to all language/ethnic groups, both sexes, etc.).
Students who complete vocational training programmes will be more productive and as a result earn higher incomes than would
have otherwise been the case.
Those better trained workers will spur some new investment and job creation so that new jobs are created.
Increased financing through the NTF will lead to increased training and employment opportunities in high‐demand sectors.
Through Industry Skills Committees, private industry will be involved in determining high‐demand sectors and defining skills needs
within those sectors.
Expanding and
improving access to
tertiary finance
The technical assistance provided will produce actionable recommendations that, when adopted by GRN, will lead to more students.
Including those from disadvantaged backgrounds, being able to attend tertiary education and increase their income earning capacity.
HIV/AIDS
management
strengthening to the
Ministry of Education’s
HIV/AIDS
Management Unit
Consolidated and coordinated HIV/AIDS training will be more effective than a less‐coordinated approach.

Page | 30
Tourism Project
Improving
management and
infrastructure of ENP
Constructing staff housing and management centres will attract more senior staff to ENP and will raise staff morale, therefore
improving management performance resulting in an improved tourist experience and increased tourist numbers (up to a sustainable
maximum).
MET and GRN are supportive of additional tourism enterprise opportunities for joint ventures between conservancies and the private
sector in and around ENP, creating direct and indirect income and employment opportunities for conservancy members and other
Namibians active in the tourism sector.
Improved park and road maintenance equipment will be used to improve the quality of roads and facilities in ENP and adjacent
conservancies, thereby improving the tourist experience and increasing tourism visits to conservancies and ENP.
MET is supportive of the “change management” reforms identified for ENP, setting a new model for park management that is more
cost‐effective and efficient, allowing ENP to maintain competitiveness with other national parks in the Southern African Region and
continuing to draw tourists as a key tourism destination in Namibia.
Marketing Namibia
Tourism
Tourists from the United States and Canada will respond to increased marketing and choose to travel to Namibia over other
destinations, creating income and employment opportunities in the Namibian tourism sector.
Traffic on the new regional tourism routes will result in increased tourist visits that prompt increased tourism spending, particularly
at conservancy tourism enterprises.
An improved NTB website will lead to more effective marketing of Namibia as a tourist destination and, therefore, increased
numbers of tourists to Namibia.

Page | 31
Conservancy
Development Support
There is sufficient private sector interest in joint ventures with conservancies to respond to the joint venture funds and generate new
businesses.
Wildlife translocation to conservancies will improve their viability as tourist destinations.
Conflicts emanating from increased wildlife in conservancies can be mitigated by preventive measures and will not discourage
conservancy members from supporting tourism as a livelihood option.
Tourists will continue to seek out lodges and campsites that are slightly off the beaten track and carry a “community‐friendly” label.
Conservancies are viable models to manage or benefit from tourism enterprises and financial benefits can be distributed to members
in an equitable fashion.
Training and technical assistance to conservancy committees and managers result in sustainable improvements in governance,
tourism management and business skills development for the wider conservancy; conservancies will have a transition plan in the
event of a change in conservancy leadership.
Women members of conservancies will be included in conservancy management.
Increases in demand for tourism products on conservancies can be managed in an environmentally sustainable manner.

Page | 32
Agriculture Project
Land Access and
Management
Community members will cooperate in managing resources and undertaking related actions for communal benefit, rather than
individual gain.
Sufficient water infrastructure is in place to foster participation in the CBRLM sub‐activity.
Livestock health/condition is highly dependent on rangeland quality/condition and herd management techniques.
Communal Land Support efforts will generate an increase in applications for parcel registration.
Communities can obtain management rights over local grazing areas/commonage so that they have an incentive to manage these
areas more sustainably.
There is political will within GRN to support both registration of legitimately‐obtained land parcels greater than 20 hectares, as well
as investigation of those parcels obtained in a less straightforward manner.
There is political will within GRN to accept and implement recommended policy reforms.
Land registration will lead to improved land management and increased financial security for the land users.
Livestock Support Farmers in the NCAs will respond to efforts to increase marketing and off‐take (from sales) of livestock.
Construction of State Veterinary Offices in underserved areas will – assuming GRN maintains, staffs, and equips them appropriately
– ultimately improve livestock health, and indirectly lead to increased household wealth and incomes.
Tagging cattle, as part of a broader traceability system, will facilitate management of disease outbreaks and improve marketing
opportunities for farmers in the NCAs.
Traceability, as implemented by the Government of the Republic of Namibia, will be recognized by the World Organisation for
Animal Health as an important step towards achieving disease‐free status in the NCAs.
A constraint to increased livestock sales is lack of marketing opportunities, and this constraint can be addressed through specific
interventions that increase the efficiency of the marketing process.
Development of INPs Demand for Namibian INPs exists and can be increased through targeted interventions related to improving the supply and quality

Page | 33
of existing products and identifying new products, ultimately leading to increased incomes of INP harvesters.
Communities can be supported to respond to an increased demand for INPs, and to meet quality standards/requirements for
harvesting and simple processing.
Supporting new and innovative techniques for harvesting and processing INPs will lead to increased demand for Namibian INPs.
Increases in demand for INPs can be managed in an environmentally sustainable manner.
9.2 Risks
Each risk is rated by the likelihood of the adverse event occurring as being either negligible (1), low (2), moderate (3), somewhat high (4) or high (5).
Second, the impact of the adverse event, if realized, is rated using the same scale (1‐5). The risk rating is obtained by adding the likelihood and
impact.
MCA Namibia Level 2 Risk Register: Programme Implementation
No. Risk Notes/Impact Likelihood
(1‐5)
Impact
(1‐5)
Rating
(2‐10) Counter Actions Lead
Reporting on Risks
and Counter Actions
1 EXTERNAL
1.1
Extreme climate such as
drought, floods and other
cyclical/recurring events
Delays in completion,
increase in costs and
increased challenge to reach
outcomes related to the
rangeland and INPs
4.0 4.0 8.0
Adequate planning for
mitigating impact of
flooding (e.g., start
work in areas prone to
flooding prior to heavy
rainfall). Not much can
be done to mitigate
against the weather’s
impact on the
rangeland and INPs,
but awareness of
DCEO: Programme
Implementation
Covered in contract
language for
infrastructure.
Severe impact of low
rainfall is imminent
for 2013‐14.

Page | 34
MCA Namibia Level 2 Risk Register: Programme Implementation
No. Risk Notes/Impact Likelihood
(1‐5)
Impact
(1‐5)
Rating
(2‐10) Counter Actions Lead
Reporting on Risks
and Counter Actions
climate change and
normal climatic
variation and their
impacts can be built
among affected
communities.
1.2
Downturn in economic
growth forecasts (esp. for
Tourism Project, Livestock
Support activity, and INP
activity)
Impact of MCA‐N Compact
diminishes 1.0 4.0 5.0
Early warning system
on economic growth
projections.
DCEO: Programme
Implementation
There are early signs
of upswing in
tourism business
development.
1.3
Mismatch between
production growth &
(international) market
demand (esp. for INPs,
community‐based tourism,
and livestock)
Reduced impact of MCA‐N
Compact 2.5 4.0 6.5
Pro‐active marketing in
tourism, INP, and
livestock; pro‐active
market intelligence,
on‐going project
planning based on
market information
DCEO: Programme
Implementation
2 GOVERNANCE / IMPLEMENTING PARTNERS / SECTORAL RESPONSE
2.1
GRN take‐over of
infrastructure works
contracts not completed in
Compact period and those
contracts for which DNP
extends beyond Compact
end date is not realized as
Outstanding work not
completed and/or
contractors not paid final
payment resulting in
reputational damage to
MCA‐N/MCC and unfinished
infrastructure works.
3.0 5.0 8.0
Possibility of early pay‐
out of retention fees is
under discussion
between MCA‐N and
MCC. Need for close
engagement of
Ministry of Works and
CEO
To date satisfactory
experience with GRN
co‐funding.

Page | 35
MCA Namibia Level 2 Risk Register: Programme Implementation
No. Risk Notes/Impact Likelihood
(1‐5)
Impact
(1‐5)
Rating
(2‐10) Counter Actions Lead
Reporting on Risks
and Counter Actions
anticipated. relevant line ministries.
2.2
IPs not performing as per
the IPA. Operationalization
of infrastructure not well
planned and executed (level
and no. of staff, equipment,
operational plan and
budget). Slow progress on
policy reforms (e.g. NTF and
Tertiary Education Reform).
Readiness for on‐going
implementation after
Compact end date (e.g.
CBRLM, CDSS, and INP
related work)
Ineffective implementation
and sustainability of the
MCA‐N Compact
investments. New
infrastructure not put to
intended use.
4.0 5.0 9.0
Board level mitigation,
per the CEO’s Report to
the Board meeting of
16 May 2013.
CEO
Action following
mentioned Board
meeting is pending.
If no effective action
is taken, failure of
significant parts of
the Compact is
certain.
2.3
Conflicting land uses (e.g. as
it relates to CLS, CBRLM,
CDSS, and INP related work)
Ineffective implementation
of the MCA‐N Compact 3.0 3.5 6.5
Land users themselves
should be in charge of
zonation plans, and not
the support agencies,
including line
ministries. Effective
consultation should be
pursued between
various stakeholders,
incl. MCA‐N, MET, MLR
and MAWF.
DCEO: Programme
Implementation

Page | 36
MCA Namibia Level 2 Risk Register: Programme Implementation
No. Risk Notes/Impact Likelihood
(1‐5)
Impact
(1‐5)
Rating
(2‐10) Counter Actions Lead
Reporting on Risks
and Counter Actions
3 INFRASTRUCTURE
3.1
Swakopmund Arts & Crafts
Centre, ENP
Housing/Management
Centres and Gam School are
on tight timeline for
completion within the
Compact period. DNP will
definitely extend beyond
Compact end date. DNP of
one or more SVOs may also
run beyond Compact end
date but only for a month or
two.
Risk as per 2.1 4.0 4.0 8.0 See 2.1 CEO
3.2
Etosha: Inadequate rate of
Galton Gate (GG) Plan
implementation
Delay in construction and
possible re‐scoping or non‐
continuation of activity
3.5 5.0 8.5
Support GG Plan
implementation and
track implementation
progress. Ongoing Task
Team Meetings to
liaise on relevant issues
and, where necessary,
speed up efforts
towards meeting all GG
Plan milestones. Full‐
time assistance from
the Change
Management Advisor
(his contract to be
Project Director

Page | 37
MCA Namibia Level 2 Risk Register: Programme Implementation
No. Risk Notes/Impact Likelihood
(1‐5)
Impact
(1‐5)
Rating
(2‐10) Counter Actions Lead
Reporting on Risks
and Counter Actions
extended up to end of
Compact).
3.3
Non‐participation by IPs in
infrastructure monthly
progress site meetings
This may result in last
minute request for changes
that will be costly due to
time extension claims by
contractors and in some
cases just not possible.
4.0 4.0 8.0 Board level
intervention CEO
3.4
Cost overruns due to higher
than estimated prices for
works contracts
Re‐scoping / change orders. 2.5 4.0 6.5 Scope Management
Plan/ Budget Review Infra Director
Risk has reduced
since nearly all
infrastructure
contracts are set out
and much of
infrastructure will be
completed already
by September 2013.
There is some risk
still for ENP,
Swakopmund Arts &
Crafts Centre and
Gam school.
3.5
Non‐sustainability of the
infrastructure due to lack of
(preventative) maintenance
planning
Limited lifespan of Compact‐
funded infrastructure and
associated benefits
4.0 4.0 8.0
MCA‐N funded
maintenance training
for MoE
administration,
contractors’ produced
Maintenance
Operational Manuals,
Project Directors
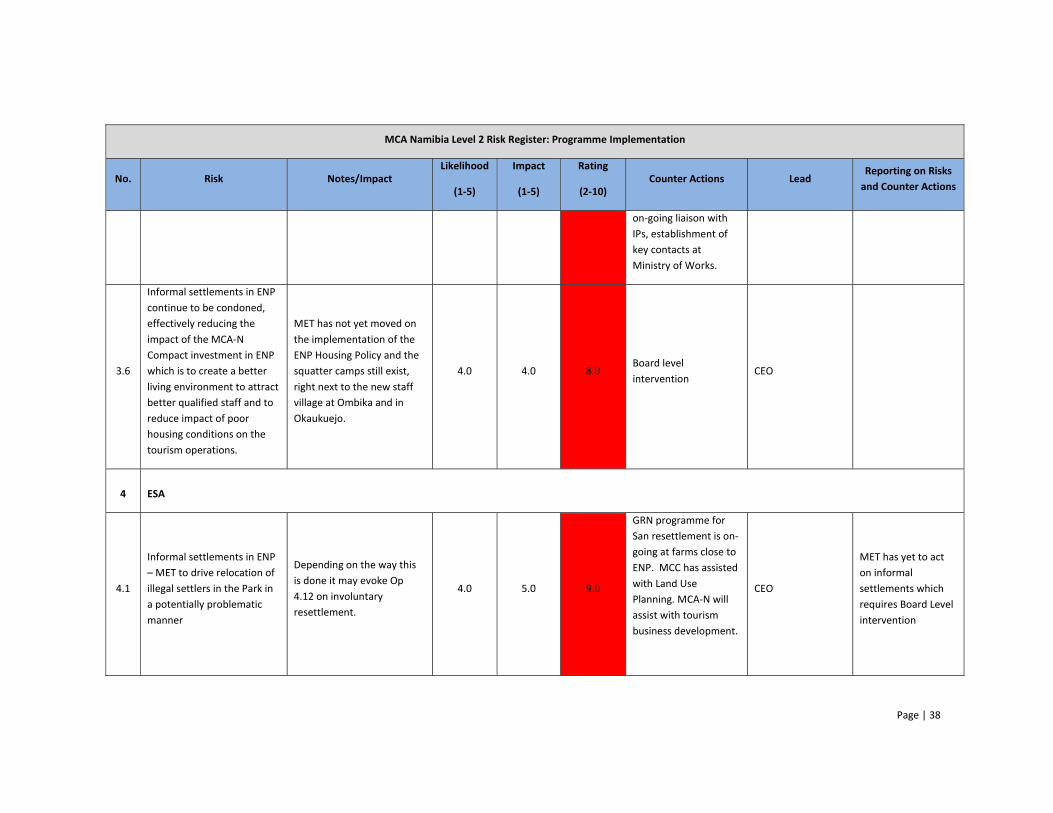
Page | 38
MCA Namibia Level 2 Risk Register: Programme Implementation
No. Risk Notes/Impact Likelihood
(1‐5)
Impact
(1‐5)
Rating
(2‐10) Counter Actions Lead
Reporting on Risks
and Counter Actions
on‐going liaison with
IPs, establishment of
key contacts at
Ministry of Works.
3.6
Informal settlements in ENP
continue to be condoned,
effectively reducing the
impact of the MCA‐N
Compact investment in ENP
which is to create a better
living environment to attract
better qualified staff and to
reduce impact of poor
housing conditions on the
tourism operations.
MET has not yet moved on
the implementation of the
ENP Housing Policy and the
squatter camps still exist,
right next to the new staff
village at Ombika and in
Okaukuejo.
4.0 4.0 8.0 Board level
intervention CEO
4 ESA
4.1
Informal settlements in ENP
– MET to drive relocation of
illegal settlers in the Park in
a potentially problematic
manner
Depending on the way this
is done it may evoke Op
4.12 on involuntary
resettlement.
4.0 5.0 9.0
GRN programme for
San resettlement is on‐
going at farms close to
ENP. MCC has assisted
with Land Use
Planning. MCA‐N will
assist with tourism
business development.
CEO
MET has yet to act
on informal
settlements which
requires Board Level
intervention

Page | 39
MCA Namibia Level 2 Risk Register: Programme Implementation
No. Risk Notes/Impact Likelihood
(1‐5)
Impact
(1‐5)
Rating
(2‐10) Counter Actions Lead
Reporting on Risks
and Counter Actions
5 M&E
5.1 Lack of cooperation from
survey respondents
Low quality of data on which
to base evaluation findings;
misinformed decision‐
making
2.5 4.5 7.0
Ensure appropriate
"entry" strategies and
procedures into
communities (e.g.,
informing TA); ensure
appropriate survey
instruments; adequate
incentives for
participants
M&E Director
5.2 Inability to detect impact in
evaluations
Insufficient implementation
integrity; insufficient time
lags between base‐ and
endline data collection;
reduction in size of
comparison groups;
insufficient evaluator
oversight or lack of clarity
around evaluation designs;
and need to adapt
evaluations to ongoing
changes in implementation
could limit ability to detect
impact
4.5 4.5 9.0
Support Project
contract managers to
ensure implementation
integrity; facilitate
communication
between evaluators
and implementers;
help ensure evaluation
designs are clear and
finalized on a timely
basis; and ensure
appropriately‐timed
data collection is
carried out to inform
evaluations.
M&E Director

Page | 40
MCA Namibia Level 2 Risk Register: Programme Implementation
No. Risk Notes/Impact Likelihood
(1‐5)
Impact
(1‐5)
Rating
(2‐10) Counter Actions Lead
Reporting on Risks
and Counter Actions
5.3
Lack of capacity for NPC to
carry out post‐Compact
M&E
Limited capacity for NPC to
carry out post‐Compact
M&E and lack of familiarity
with Compact could weaken
ability to complete MCC‐
contracted evaluations post‐
Compact and continue
measuring and reporting on
Compact results
2.5 4.0 6.5
Engage with NPC early
to familiarize NPC with
the Compact objectives
and M&E framework;
provide capacity‐
building support
M&E Director
6 EDUCATION
6.1
Lack of Continuous
Professional Development
(CPD) functionality
CPD not functioning as
envisioned resulting in lack
of increased teaching ability
and effectiveness.
4.5 3.0 7.5
Proactively ensure
integration of
stakeholders; high level
intervention with MoE
and UNAM.
Project Director
6.2
Lack of senior RSRC staffing,
and programming and
operations and maintenance
plans not in place when
centers open
RSRCs not functioning as
envisioned resulting in lack
of results.
4.0 5.0 9.0 Board level mitigation CEO
Despite NLAS efforts,
center heads and
other senior staff
have not been
selected. Designated
IT staff and a plan
for human resources
to perform
preventive
maintenance (staff
or contract) have not
been approved.

Page | 41
MCA Namibia Level 2 Risk Register: Programme Implementation
No. Risk Notes/Impact Likelihood
(1‐5)
Impact
(1‐5)
Rating
(2‐10) Counter Actions Lead
Reporting on Risks
and Counter Actions
7 TOURISM
7.1
Land lease tax on
conservancies undermines
their viability
Non‐participation of some
JV partners; curtailing of
benefits to conservancy
members
4.0 4.0 8.0
Engage with MET and
MLR to obtain
exemptions from the
land lease tax
CEO
7.2
Limited ability of
conservancies to adopt
technical assistance efforts
to raise their capacity in
terms of management of
assets, financial
management of proceeds to
the conservancy,
governance issues, etc.
Conservancy management
unable to properly govern
and administer the funds
and benefits to the
conservancy
3.0 5.0 8.0
Closely track
conservancy progress
towards self‐sufficiency
Ensure that the CDSS
consultant leaves all
relevant material
behind
Project Director
8 AGRICULTURE
8.1
Resistance to change:
national and regional
governance structures do
not support change/political
resistance (esp. CBRLM, CLS
& INP PPO contracts)
Delay in implementation 3.0 3.5 6.5
Public outreach; pro‐
active contract
management;
continued
collaboration with
MAWF
CEO

Page | 42
MCA Namibia Level 2 Risk Register: Programme Implementation
No. Risk Notes/Impact Likelihood
(1‐5)
Impact
(1‐5)
Rating
(2‐10) Counter Actions Lead
Reporting on Risks
and Counter Actions
8.2
For Communal Land Support
sub‐activity, implementation
risks consist of poor or late
contractor performance,
including possibly not
meeting related policy
objectives;
complexities/conflicts in
verifying land rights or in
authorizing fencing; and
insufficient capacity of MLR
and traditional authorities
Delays with achieving results
or inability to achieve results 3.5 3.5 7.0
Pro‐active contract
management;
continued
collaboration with MLR
Project Director

Page | 43
10. Implementation and Management of M&E
The M&E directorate in MCA‐N is responsible for overall monitoring and evaluation of the
Programme. The M&E directorate is headed by the Director: M&E and also staffed by three
Managers: M&E (including two staff and one consultant). (A Manager: MIS was previously
part of the team.) The directorate is primarily responsible for coordinating and ensuring
quality and accuracy in data collection and reporting on the indicators in this M&E Plan. In
addition, the unit oversees and manages all relevant consultants involved in data quality
assessments, survey work, evaluations, and other M&E‐related activities.
Effective monitoring and evaluation depends on the effective involvement of other MCA‐N
staff, implementing partners, other government ministries and agencies providing data for
programme monitoring, contractors and other key stakeholders. The M&E directorate, as
laid out in its outreach strategy, will work closely with MCA‐N sector Project directors to
track results and seek input on evaluations and other activities, with the MCA‐N Public
Outreach team to communicate results to key stakeholders, and with activity implementers
and relevant government ministries13 to support their data collection and reporting efforts
and to ensure data quality and accuracy. When necessary, the M&E directorate will provide
technical support to assist these stakeholders in their data collection activities.
10.1 Responsibilities
The specific responsibilities of the M&E directorate include:
Oversee all M&E contract management (survey firms, evaluators, data quality
reviewer, ad‐hoc consultants);
Serve as point of contact for M&E issues related to the IPs;
Serve as primary point of contact on all M&E procurement, finance, and budget
issues;
Liaise with MCA‐N project directors, contractors/facilitators and IPs to ensure that
required quarterly and annual performance data is submitted on time and to
appropriate standards of quality, and that they are receiving adequate support to
perform their M&E functions;
Work with MCA‐N project directors on reviewing project monitoring data to
evaluate programme effectiveness, assess whether projects are meeting their stated
objectives, and make decisions about relevant changes and adjustments to improve
performance;
Manage external reporting obligations, including quarterly and annual reporting to
MCC, reporting to GRN as required, reporting to external stakeholders, and other ad‐
hoc reporting requests;
13 Such government ministries include MCA‐N Implementing Partners as well as, for example, the Namibia Statistics Agency.

Page | 44
Liaise with MCA‐N public outreach staff to incorporate project results and M&E data
and information into external communication products and to ensure that
performance results are communicated to the public;
Liaise with MCC M&E specialist and Resident Mission on M&E issues and economic
analysis issues;
Provide technical direction, guidance, and advice as necessary on programme M&E
issues;
Oversee the set‐up and management of all M&E data and reporting systems,
including project monitoring database, surveys and other evaluation data, GIS
information, and any other data sources and systems used for the M&E function;
Conduct analysis and synthesis of project monitoring and other data to assess
programme effectiveness and whether projects are meeting their objectives;
Ensure that data are disaggregated by sex, age and income level, where practicable,
and that gender issues are appropriately incorporated into the M&E framework;
Directly participate in the monitoring of individual programme components through
site visits, review of project reports and primary data, and review of secondary data;
Conduct technical reviews of all evaluation and survey deliverables, and key project
performance deliverables, particularly those related to targets in the M&E plan;
Oversee work of the data quality reviewer, assess data quality review results and
serve as primary point of contact to implement any recommended changes or
corrections, and conduct intermittent data quality checks to provide additional data
quality oversight;
Conduct relevant economic analysis of projects, such as updating of ex‐ante ERRs,
ex‐post ERRs, etc.;
Review and revise M&E Plan as necessary on an annual basis.
10.2 Management Information System (MIS)
A Management Information System (MIS), called the Integrated Programme Management
System (IPMS) has been developed and is fully operational, with ongoing maintenance and
improvements. The IPMS is an electronic database that MCA‐N managers and directors use
to enter data and information about the various aspects of programme management. It
facilitates and integrates the tasks of planning and contract management mainly for financial
planning, monitoring, and reporting purposes though it is also able to generate reports that
integrate information related to procurement and project management, as well as facilitate
the maintenance of accurate and up‐to‐date information between the various MCA‐N
directorates.

Page | 45
10.3 Budget
The following table contains the budget for Monitoring and Evaluation activities. The line
items and amounts may be subject to change based on programme developments during
implementation and changing needs and priorities.
Millennium Challenge Account Namibia's M&E Budget (in US$)14,
as of May 27, 2014
CIF 2009/10 2010/11 2011/12 2012/13 2013/14 TOTAL
GENERAL M&E
0 188,709 373,245 170,104 606,471 1,338,529
EDUCATION M&E
0 92,977 319,944 330,580 513,445 1,256,946
TOURISM M&E
0 26,799 289,269 223,507 111,255 650,830
TOURISM & AGRICULTURE (JOINT) M&E
0 78,081 462,196 206,500 844,824 1,591,601
AGRICULTURE M&E
0 398,923 711,278 191,268 390,830 1,692,299
TOTAL ALLOCATED
0 785,489 2,155,932 1,121,959 2,466,825 6,530,205
TOTAL AVAILABLE
6,886,182
Total remaining to be allocated 355,977
The M&E Project and M&E Programme Administration funds remaining to be committed are
allocated for: high‐impact results‐reporting (from Programme Administration funds);
capacity‐building for the National Planning Commission’s M&E unit (the entity that will be
responsible for post‐Compact M&E); and additional qualitative data collection under the
vocational education/skills training and CLS evaluations. The remaining unallocated funds
(indicated above) will be left over due to de‐commitments required by MCC at a point when
there was not enough time or appropriate tasks to redeploy all the released resources
(although the bulk were redeployed). Funds remaining at the end of the Compact will be
returned to MCC.
For further information about MCA‐N’s M&E activities and the Programme’s achievements,
visit the MCA‐N website at www.mcanamibia.org.
14 Figures do not include the cost of evaluations and data collection activities funded by MCC.

CI CodeIndicator
LevelIndicator Name Definition
Unit of
Measure
Disaggre‐
gation
Primary Data
Source
Responsible
Party
Frequency of
ReportingAdditional Information
Goal Poverty Rate
The cost of a food basket enabling households to
meet a minimum nutritional requirement plus an
allowance for the consumption of basic non‐food
items. Households with consumption expenditure
in excess of this threshold are considered non‐poor
and households with expenditure less than the
threshold are considered poor.
Percentage NHIES NSAOnce
(in Year 5)
Goal Unemployment RateThe percentage of the economically active
population that is currently unemployed.Percentage NHIES NSA
Once
(in Year 5)
Given the weaknesses of the NLFS‐sourced
unemployment rate as identified by the Data Quality
Review (DQR) consultant in the Government Data
Quality Review and in Round 2 of the bi‐annual ex‐post
reviews, the unemployment rate from the NHIES (which
was found to be a reliable source of data) should be
used as a parallel indicator.
Goal Median Household Income
The sum of total consumption and non‐
consumption expenditures. Savings are not
included.
Namibian
DollarsNHIES NSA
Once
(in Year 5)
Note: The Goal Indicators are informed by Vision 2030 and NDP3 and reflect the expectation that MCA Namibia Programme will contribute to the goals of Vision 2030. However, the MCA Namibia Programme is not of sufficient scale or
scope to independently achieve these goals.
MCA Namibia M&E Plan
Annex 1: Indicator Documentation Table
Goal Indicators
1 | Annex 1

CI CodeIndicator
LevelIndicator Name Definition
Unit of
Measure
Disaggre‐
gation
Primary Data
Source
Responsible
Party
Frequency of
ReportingAdditional Information
MCA Namibia M&E Plan
Annex 1: Indicator Documentation Table
E‐1 Process
Value of signed educational
facility construction,
rehabilitation, and equipping
contracts
The value of all signed construction contracts for
educational facility construction, rehabilitation, or
equipping (e.g. information technology, desks and
chairs, electricity and lighting, water systems, latrines)
using compact funds.
US Dollars
Construction
Supervisory
Firm Reports
MCA‐N Quarterly
An exchange rate of NAD 7 to USD 1 will be maintained
for reporting purposes.
This indicator aggregates the three relevant indicators
under the 47 schools, Construction of COSDECs, and
Construction of RSRCs sub‐activities.
E‐2 Process
Percent disbursed of
educational facility
construction, rehabilitation,
and equipping contracts
The total amount of all signed construction contracts
for education facility works or equipping divided by
the total value of all signed contracts.
Percentage
Construction
Supervisory
Firm Reports
MCA‐N QuarterlyThis indicator aggregates relevant indicators under the
47 schools, Construction of COSDECs, and Construction
of RSRCs sub‐activities.
E‐4 OutputEducational facilities
constructed or rehabilitated
The number of educational facilities constructed or
rehabilitated according to standards stipulated in
MCA contracts signed with implementers.
Number
Construction
Supervisory
Firm Reports
MCA‐N Quarterly
This indicator aggregates the three relevant indicators
under the 47 schools, Construction of COSDECs (also
includes the Arts and Crafts Centre), and Construction of
RSRCs sub‐activities.
Process
Value of signed contracts for
design/supervisory services
for 47 schools
The value of all contracts that MCA‐N has signed
with contractors for design/supervisory services.US Dollars IPMS MCA‐N Quarterly
An exchange rate of NAD 7 to USD 1 will be maintained
for reporting purposes.
Process
Value disbursed against
design/supervisory contracts
for 47 schools
Actual value disbursed against the contracts for
construction, rehabilitation and equipment for 47
schools.
US Dollars IPMS MCA‐N QuarterlyAn exchange rate of NAD 7 to USD 1 will be maintained
for reporting purposes.
Process
% disbursed against
design/supervisory contracts
for 47 schools
The amount disbursed against signed contracts for
design/supervisory services.Percentage IPMS MCA‐N Quarterly
Process
Value of signed contracts for
construction, rehabilitation
and equipment for 47
schools
Value of signed contracts, in US Dollars, for
educational facility construction or rehabilitation
and/or equipping (e.g. information technology,
desks and chairs, electricity and lighting, water
systems, girls latrines, etc.). If the value of the
contract changes, the amount of the change (either
+ or ‐) should be reported in the quarter that the
change occurred. Cost sharing by others (e.g., co
financing by other donors or government) should
not be included.
US Dollars IPMS MCA‐N QuarterlyAn exchange rate of NAD 7 to USD 1 will be maintained
for reporting purposes.
Process
Value disbursed against
construction, rehabilitation
and equipment contracts for
47 schools
Actual value disbursed against the contracts for
construction, rehabilitation and equipment for 47
schools.
US Dollars IPMS MCA‐N QuarterlyAn exchange rate of NAD 7 to USD 1 will be maintained
for reporting purposes.
Sub‐Activity: Improving the Quality of General Education (47 schools)
Activity: Multiple Education Activities
Education Project Indicators
Activity: Improving the Quality of General Education
2 | Annex 1

CI CodeIndicator
LevelIndicator Name Definition
Unit of
Measure
Disaggre‐
gation
Primary Data
Source
Responsible
Party
Frequency of
ReportingAdditional Information
MCA Namibia M&E Plan
Annex 1: Indicator Documentation Table
Process
% disbursed against
construction, rehabilitation
and equipment contracts for
47 schools
The aggregate amount disbursed divided by all
signed contracts for education facility works and/or
equipping. Denominator = Value of signed
contracts for educational facility works/equipping
as defined above. Numerator = Amount of money
disbursed on the signed contracts for education
facility works/equipping. This is a proxy indicator
for physical completion of education facility works.
However, since the numerator includes industry
standard advance payments and mobilization fees,
it does not correlate perfectly with physical
progress.
Percentage IPMS MCA‐N Quarterly
Output
Educational facilities
constructed, rehabilitated,
equipped in the 47 schools
sub‐activity
Number of unique educational facilities
constructed, rehabilitated, and / or equipped
according to standards stipulated in MCA contracts
signed with implementers.
Number
Construction
Supervisory
Firm Reports
MCA‐N
Quarterly
(starting in
Year 2)
Output
% of schools with positions
filled to teach Information,
Communication and
Technology (ICT) Literacy
Percentage of MCA‐N‐supported schools with
temporary or permanent teachers hired to teach
ICT Literacy at schools where ICT
facilities/equipment are provided by MCA‐N.
PercentageMoE IPA
ReportsMoE
Quarterly
(starting in
Year 4)
Output
Learners (any level)
participating in the 47
schools sub‐activity
The number of learners enrolled or participating in
educational programs in the 47 schools plus any
new schools that split from the original schools and
are co‐located.
Number Sex EMIS MoE Annual
OutcomeTeacher qualification ‐ 47
schools
“% of teachers (in the 47 schools plus any new
schools that split from the original schools and are
co‐located) who have a teacher qualification of
Code 4, 5, or 6 for Professional Qualification in the
Annual Education Census.
Percentage EMIS MoE
Annual
(starting in
Year 4)
Outcome
Percentage of learners
attaining “Basic
Achievement” or higher on
the Grade 5 NSAT – English –
47 schools
The percentage of learners attaining “Basic
Achievement” or higher on the Grade 5 NSAT –
English – 47 schools.
Percentage DNEA MoE
Annual
(in Years 3 and
5)
For the purposes of this indicator, 47 schools refers only
to the 36 out of 47 schools that offer Grade 5.
Outcome
Percentage of learners
attaining “Basic
Achievement” or higher on
the Grade 5 NSAT –
Mathematics – 47 schools
The percentage of learners attaining “Basic
Achievement” or higher on the Grade 5 NSAT –
Mathematics – 47 schools.
Percentage DNEA MoE
Annual
(in Years 3 and
5)
For the purposes of this indicator, 47 schools refers only
to the 36 out of 47 schools that offer Grade 5.
3 | Annex 1
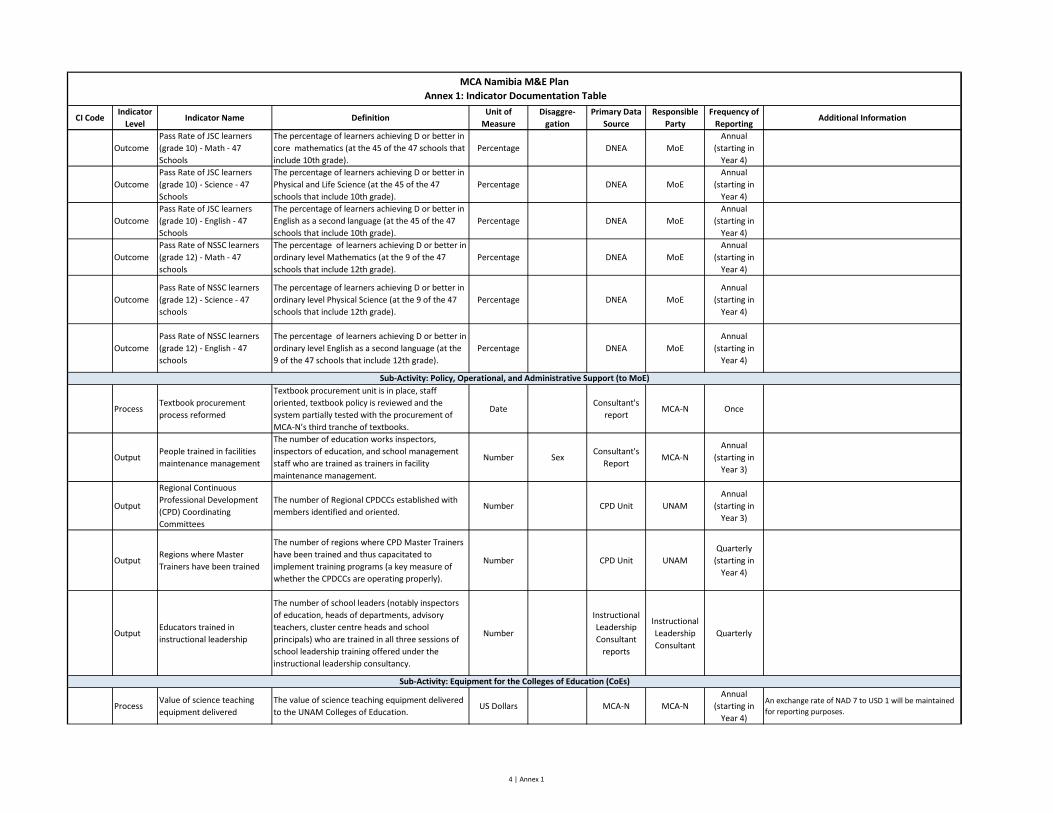
CI CodeIndicator
LevelIndicator Name Definition
Unit of
Measure
Disaggre‐
gation
Primary Data
Source
Responsible
Party
Frequency of
ReportingAdditional Information
MCA Namibia M&E Plan
Annex 1: Indicator Documentation Table
Outcome
Pass Rate of JSC learners
(grade 10) ‐ Math ‐ 47
Schools
The percentage of learners achieving D or better in
core mathematics (at the 45 of the 47 schools that
include 10th grade).
Percentage DNEA MoE
Annual
(starting in
Year 4)
Outcome
Pass Rate of JSC learners
(grade 10) ‐ Science ‐ 47
Schools
The percentage of learners achieving D or better in
Physical and Life Science (at the 45 of the 47
schools that include 10th grade).
Percentage DNEA MoE
Annual
(starting in
Year 4)
Outcome
Pass Rate of JSC learners
(grade 10) ‐ English ‐ 47
Schools
The percentage of learners achieving D or better in
English as a second language (at the 45 of the 47
schools that include 10th grade).
Percentage DNEA MoE
Annual
(starting in
Year 4)
Outcome
Pass Rate of NSSC learners
(grade 12) ‐ Math ‐ 47
schools
The percentage of learners achieving D or better in
ordinary level Mathematics (at the 9 of the 47
schools that include 12th grade).
Percentage DNEA MoE
Annual
(starting in
Year 4)
Outcome
Pass Rate of NSSC learners
(grade 12) ‐ Science ‐ 47
schools
The percentage of learners achieving D or better in
ordinary level Physical Science (at the 9 of the 47
schools that include 12th grade).
Percentage DNEA MoE
Annual
(starting in
Year 4)
Outcome
Pass Rate of NSSC learners
(grade 12) ‐ English ‐ 47
schools
The percentage of learners achieving D or better in
ordinary level English as a second language (at the
9 of the 47 schools that include 12th grade).
Percentage DNEA MoE
Annual
(starting in
Year 4)
ProcessTextbook procurement
process reformed
Textbook procurement unit is in place, staff
oriented, textbook policy is reviewed and the
system partially tested with the procurement of
MCA‐N’s third tranche of textbooks.
DateConsultant's
reportMCA‐N Once
OutputPeople trained in facilities
maintenance management
The number of education works inspectors,
inspectors of education, and school management
staff who are trained as trainers in facility
maintenance management.
Number SexConsultant's
ReportMCA‐N
Annual
(starting in
Year 3)
Output
Regional Continuous
Professional Development
(CPD) Coordinating
Committees
The number of Regional CPDCCs established with
members identified and oriented.Number CPD Unit UNAM
Annual
(starting in
Year 3)
OutputRegions where Master
Trainers have been trained
The number of regions where CPD Master Trainers
have been trained and thus capacitated to
implement training programs (a key measure of
whether the CPDCCs are operating properly).
Number CPD Unit UNAM
Quarterly
(starting in
Year 4)
OutputEducators trained in
instructional leadership
The number of school leaders (notably inspectors
of education, heads of departments, advisory
teachers, cluster centre heads and school
principals) who are trained in all three sessions of
school leadership training offered under the
instructional leadership consultancy.
Number
Instructional
Leadership
Consultant
reports
Instructional
Leadership
Consultant
Quarterly
ProcessValue of science teaching
equipment delivered
The value of science teaching equipment delivered
to the UNAM Colleges of Education.US Dollars MCA‐N MCA‐N
Annual
(starting in
Year 4)
An exchange rate of NAD 7 to USD 1 will be maintained
for reporting purposes.
Sub‐Activity: Equipment for the Colleges of Education (CoEs)
Sub‐Activity: Policy, Operational, and Administrative Support (to MoE)
4 | Annex 1

CI CodeIndicator
LevelIndicator Name Definition
Unit of
Measure
Disaggre‐
gation
Primary Data
Source
Responsible
Party
Frequency of
ReportingAdditional Information
MCA Namibia M&E Plan
Annex 1: Indicator Documentation Table
E‐6 Outcome
Students participating in MCC‐
supported education
activities
The number of students enrolled or participating in
MCC‐supported educational schooling programs.Number Sex NTA/MCA‐N MCA‐N
Annual
(starting in
Year 3)
This indicator aggregates the two relevant indicators
under the Establishment of the NTF and Competitive
Grants for High Priority Vocational Skills Training sub‐
activities.
ProcessNTF levy collection system
operational
The date upon which the NTF levy collection
system is completely set up and ready to start
collecting levy payments.
Date NTA NTA Once
Output
% of NTF levy funds collected
that are awarded for skills
training and related
improvement of training
facilities and equipment
The value of NTF levy funds collected for skills
training and related improvement of training
facilities and equipment that are awarded
expressed as a proportion of the total value of levy
funds collected. The calculation is done by dividing
the value of NTF levy funds collected that are
awarded for skills training and related
improvement of training facilities and equipment
by the total value of levy funds collected and
expressing the resultant proportion as a
percentage.
Percentage NTA MCA‐N
Quarterly
(starting in
Year 4)
It is expected that 20% of companies will pay 80% of the
levy.
The Year 5 target for this indicator is no longer
considered attainable during the Compact period, given
delays in implementation. However, it could not be
changed as delays in implementation are not included in
the 4 reasons laid out in MCC’s M&E Policy that justify
changing end‐Compact targets. And given that M&E will
continue post‐Compact, we are able to continue
monitoring when or whether the end of Compact target
is ultimately reached.
OutputVocational trainees assisted
from the NTF levy
The number of vocational trainees assisted from
the NTF Levy.Number Sex NTA MCA‐N
Quarterly
(starting in
Year 5)
The Year 5 target for this indicator is no longer
considered attainable during the Compact period, given
delays in implementation. However, it could not be
changed as delays in implementation are not included in
the 4 reasons laid out in MCC’s M&E Policy that justify
changing end‐Compact targets. And given that M&E will
continue post‐Compact, we are able to continue
monitoring when or whether the end of Compact target
is ultimately reached
Outcome Compliance rate for NTF levyThe percentage of firms paying the annual levy out
of total firms participating.Percentage NTA NTA
Annual
(starting in
Year 5)
The Year 5 target for this indicator is no longer
considered attainable during the Compact period, given
delays in implementation. However, it could not be
changed as delays in implementation are not included in
the 4 reasons laid out in MCC’s M&E Policy that justify
changing end‐Compact targets. And given that M&E will
continue post‐Compact, we are able to continue
monitoring when or whether the end of Compact target
is ultimately reached
Activity: Vocational Education and Skills Training
Sub‐Activity: Establishment of NTF
Sub‐Activity: Multiple Vocational and Skills Training Sub‐Activities
5 | Annex 1

CI CodeIndicator
LevelIndicator Name Definition
Unit of
Measure
Disaggre‐
gation
Primary Data
Source
Responsible
Party
Frequency of
ReportingAdditional Information
MCA Namibia M&E Plan
Annex 1: Indicator Documentation Table
Process
Value of vocational training
grants awarded through the
MCA‐N grant facility
The total value of grant agreements signed with
training services providers using MCA‐N grant
facility.
US Dollars MCA‐N MCA‐N QuarterlyAn exchange rate of NAD 7 to USD 1 will be maintained
for reporting purposes.
Output
Vocational trainees assisted
through the MCA‐N grant
facility
The number of vocational trainees assisted through
the MCA‐N grant facility.Number Sex MCA‐N MCA‐N Quarterly
Typically the value of cumulative indicators does not
decrease over time. Therefore the decrease in target
values between Years 2 and 3 must be explained. It is
due to the timing of the adjustment, which happened in
Year 3 and targets could not be adjusted retrospectively.
E‐7 Outcome
Graduates from MCC‐
supported education
activities
The number of students graduating from the
highest grade (year) for that educational level in
MCC‐supported education schooling programs.
Number Sex NTA NTA
Annual
(starting in
Year 3)
For the purposes of the Namibia Compact, this indicator
measures the total number of trainees funded through
the MCA‐N grant facility who complete vocational
training and graduate with formal certifications
awarded.
Outcome
NQA‐accredited and/or NTA‐
registered vocational training
providers
The number of NQA‐accredited and/or NTA‐
registered vocational training providers.Number NTA and NQA NTA and NQA
Annual
(starting in
Year 4)
E‐8 Outcome
Employed graduates of MCC‐
supported education
activities
The number of MCC‐supported training program
graduates employed in their field of study within
one year after graduation.
Number Sex
Tracer Survey
of Vocational
Trainees
Vocational
Education
Evaluator
Once
Outcome% of trainees who secure
employment
The proportion of MCA‐N‐assisted trainees who
secure at least 6 months of paid employment
(formal, informal, and self‐employment) during the
12‐month period following successful course
completion (disaggregated by COSDEC, VTC, private
provider, and other).
Percentage Sex
Tracer Survey
of Vocational
Trainees
Vocational
Education
Evaluator
Annual
(starting in
Year 4)
Outcome
Average gross monthly
income of VTGF‐supported
trainees
Average gross monthly income of VTGF‐supported
graduates disaggregated by sector, further defined
as average monthly gross earnings before tax
deductions and social security contributions.
Namibian
DollarsSex
Tracer Survey
of Vocational
Trainees
Vocational
Education
Evaluator
Annual
(starting in
Year 4)
The baseline figure reflects all of the training cohorts to
date, i.e. 2011 to 2013. However, 2012 remains as the
documented baseline year since multiple years cannot
be supported by MCC’s MIS into which this information
is uploaded.
Sub‐Activity: Competitive Grants for High Priority Vocational Skills Training
6 | Annex 1

CI CodeIndicator
LevelIndicator Name Definition
Unit of
Measure
Disaggre‐
gation
Primary Data
Source
Responsible
Party
Frequency of
ReportingAdditional Information
MCA Namibia M&E Plan
Annex 1: Indicator Documentation Table
Process
Value of signed contracts for
design/supervisory services
for COSDECs
The value of all contracts that MCA‐N have signed
with contractors for design/supervisory services.US Dollars IPMS MCA‐N Quarterly
An exchange rate of NAD 7 to USD 1 will be maintained
for reporting purposes.
Typically the value of cumulative indicators does not
decrease over time. Therefore the decrease in target
values between Years 2 and 3 must be explained. It is
due to the timing of the adjustment, which happened in
Year 3 and targets could not be adjusted retrospectively.
Process
Value disbursed against
design/supervisory contracts
for COSDECs
Actual value disbursed against the contracts for
construction, rehabilitation and equipment for
COSDECs.
US Dollars IPMS MCA‐N QuarterlyAn exchange rate of NAD 7 to USD 1 will be maintained
for reporting purposes.
Process
% disbursed against
design/supervisory contracts
for COSDECs
The amount disbursed against signed contracts for
Design/Supervisory services.Percentage IPMS MCA‐N Quarterly
Process
Value of signed contracts for
construction, rehabilitation
and equipment for COSDECs
Value of signed contracts, in US Dollars, for
educational facility construction or rehabilitation
and/or equipping (e.g. information technology,
desks and chairs, electricity and lighting, water
systems, girls latrines, etc.). If the value of the
contract changes, the amount of the change (either
+ or ‐) should be reported in the quarter that the
change occurred. Cost sharing by others (e.g., co
financing by other donors or government) should
not be included.
US Dollars IPMS MCA‐N
Quarterly
(starting in
Year 4)
An exchange rate of NAD 7 to USD 1 will be maintained
for reporting purposes.
Typically the value of cumulative indicators does not
decrease over time. Therefore the decrease in target
values between Years 2 and 3 must be explained. It is
due to the timing of the adjustment, which happened in
Year 3 and targets could not be adjusted retrospectively.
Process
Value disbursed against
construction, rehabilitation
and equipment contracts for
COSDECs
Actual value disbursed against the contracts for
construction, rehabilitation and equipment for
COSDECs.
US Dollars IPMS MCA‐N
Quarterly
(starting in
Year 4)
An exchange rate of NAD 7 to USD 1 will be maintained
for reporting purposes.
Process
% disbursed against
construction, rehabilitation
and equipment contracts for
COSDECs
The aggregate amount disbursed divided by all
signed contracts for education facility works and/or
equipping. Denominator = Value of signed
contracts for educational facility works/equipping
as defined above. Numerator = Amount of money
disbursed on the signed contracts for education
facility works/equipping. This is a proxy indicator
for physical completion of education facility works.
However, since the numerator includes industry
standard advance payments and mobilization fees,
it does not correlate perfectly with physical
progress.
Percentage IPMS MCA‐N
Quarterly
(starting in
Year 4)
Output COSDECS completedThe number of COSDECs that are fully completed
and operational.Number
Construction
Supervisory
Firm Reports
MCA‐N
Quarterly
(starting in
Year 4)
As of the March 2012 revision of the M&E Plan, this
indicator (and related infrastructure indicators) no
longer includes the Arts and Crafts Centre.
OutputArts and Crafts Centres
completed
The number of Arts and Crafts Centres that are fully
completed.Number
Construction
Supervisory
Firm Reports
MCA‐N
Quarterly
(starting in
Year 5)
Sub‐Activity: Construction and Upgrading of 9 Community Skills and Development Centres
7 | Annex 1
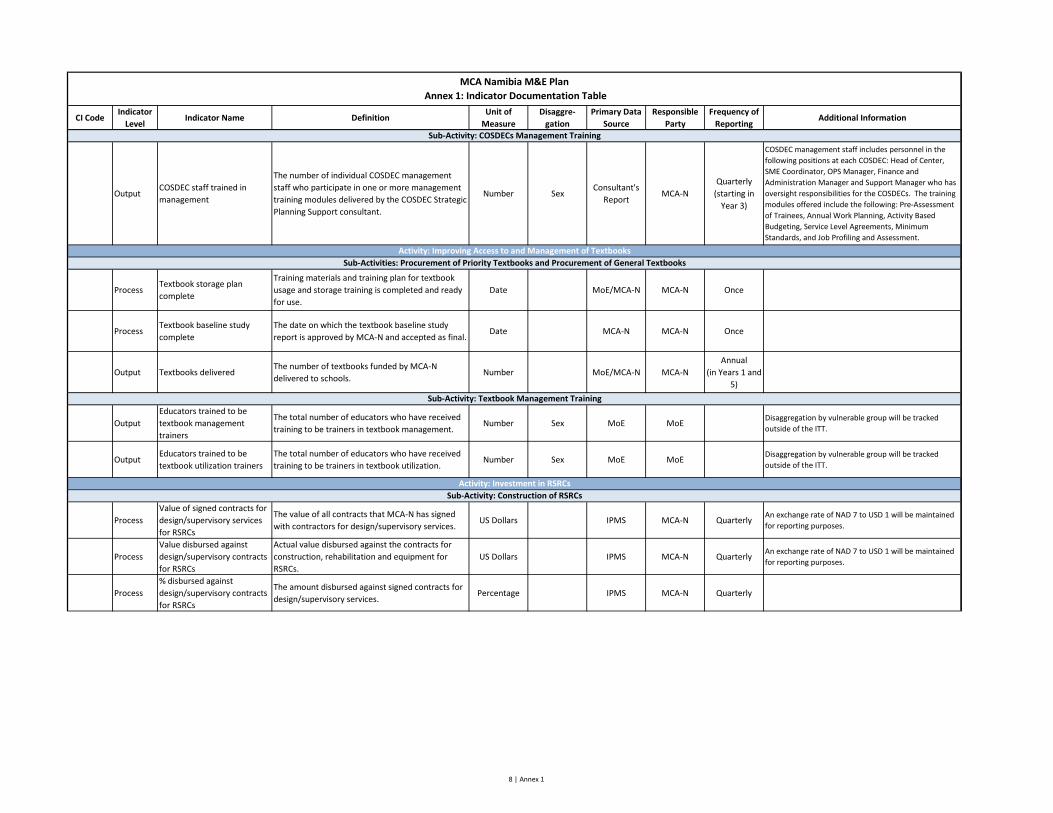
CI CodeIndicator
LevelIndicator Name Definition
Unit of
Measure
Disaggre‐
gation
Primary Data
Source
Responsible
Party
Frequency of
ReportingAdditional Information
MCA Namibia M&E Plan
Annex 1: Indicator Documentation Table
OutputCOSDEC staff trained in
management
The number of individual COSDEC management
staff who participate in one or more management
training modules delivered by the COSDEC Strategic
Planning Support consultant.
Number SexConsultant's
ReportMCA‐N
Quarterly
(starting in
Year 3)
COSDEC management staff includes personnel in the
following positions at each COSDEC: Head of Center,
SME Coordinator, OPS Manager, Finance and
Administration Manager and Support Manager who has
oversight responsibilities for the COSDECs. The training
modules offered include the following: Pre‐Assessment
of Trainees, Annual Work Planning, Activity Based
Budgeting, Service Level Agreements, Minimum
Standards, and Job Profiling and Assessment.
ProcessTextbook storage plan
complete
Training materials and training plan for textbook
usage and storage training is completed and ready
for use.
Date MoE/MCA‐N MCA‐N Once
ProcessTextbook baseline study
complete
The date on which the textbook baseline study
report is approved by MCA‐N and accepted as final.Date MCA‐N MCA‐N Once
Output Textbooks deliveredThe number of textbooks funded by MCA‐N
delivered to schools.Number MoE/MCA‐N MCA‐N
Annual
(in Years 1 and
5)
Output
Educators trained to be
textbook management
trainers
The total number of educators who have received
training to be trainers in textbook management.Number Sex MoE MoE
Disaggregation by vulnerable group will be tracked
outside of the ITT.
OutputEducators trained to be
textbook utilization trainers
The total number of educators who have received
training to be trainers in textbook utilization.Number Sex MoE MoE
Disaggregation by vulnerable group will be tracked
outside of the ITT.
Process
Value of signed contracts for
design/supervisory services
for RSRCs
The value of all contracts that MCA‐N has signed
with contractors for design/supervisory services.US Dollars IPMS MCA‐N Quarterly
An exchange rate of NAD 7 to USD 1 will be maintained
for reporting purposes.
Process
Value disbursed against
design/supervisory contracts
for RSRCs
Actual value disbursed against the contracts for
construction, rehabilitation and equipment for
RSRCs.
US Dollars IPMS MCA‐N QuarterlyAn exchange rate of NAD 7 to USD 1 will be maintained
for reporting purposes.
Process
% disbursed against
design/supervisory contracts
for RSRCs
The amount disbursed against signed contracts for
design/supervisory services.Percentage IPMS MCA‐N Quarterly
Activity: Investment in RSRCs
Sub‐Activity: Construction of RSRCs
Sub‐Activity: COSDECs Management Training
Activity: Improving Access to and Management of Textbooks
Sub‐Activities: Procurement of Priority Textbooks and Procurement of General Textbooks
Sub‐Activity: Textbook Management Training
8 | Annex 1

CI CodeIndicator
LevelIndicator Name Definition
Unit of
Measure
Disaggre‐
gation
Primary Data
Source
Responsible
Party
Frequency of
ReportingAdditional Information
MCA Namibia M&E Plan
Annex 1: Indicator Documentation Table
Process
Value of signed contracts for
construction, rehabilitation
and equipment for RSRCs
Value of signed contracts, in US Dollars, for
educational facility construction or rehabilitation
and/or equipping (e.g. information technology,
desks and chairs, electricity and lighting, water
systems, girls latrines, etc.). If the value of the
contract changes, the amount of the change (either
+ or ‐) should be reported in the quarter that the
change occurred. Cost sharing by others (e.g., co
financing by other donors or government) should
not be included.
US Dollars IPMS MCA‐N QuarterlyAn exchange rate of NAD 7 to USD 1 will be maintained
for reporting purposes.
Process
Value disbursed against
construction, rehabilitation
and equipment contracts for
RSRCs
Actual value disbursed against the contracts for
construction, rehabilitation and equipment for
RSRCs.
US Dollars IPMS MCA‐N
Quarterly
(starting in
Year 2)
An exchange rate of NAD 7 to USD 1 will be maintained
for reporting purposes.
Process
% disbursed against
construction, rehabilitation
and equipment contracts for
RSRCs
The aggregate amount disbursed divided by all
signed contracts for education facility works and/or
equipping. Denominator = Value of signed
contracts for educational facility works/equipping
as defined above. Numerator = Amount of money
disbursed on the signed contracts for education
facility works/equipping. This is a proxy indicator
for physical completion of education facility works.
However, since the numerator includes industry
standard advance payments and mobilization fees,
it does not correlate perfectly with physical
progress.
Percentage IPMS MCA‐N Quarterly
Output RSRCs completedThe number of RSRCs that are fully constructed
(i.e., practical completion achieved).Number
Construction
Supervisory
Firm Reports
MCA‐N
Quarterly
(starting in
Year 4)
Output% of positions at RSRCs
staffed
The percentage of existing staff positions that have
been filled with full‐time staff for all RSRCs that are
completed and open to visitors. This is calculated
as the total number of RSRC staff positions filled
with full‐time staff divided by the total existing staff
positions for all completed RCRCs staff positions,
multiplied by 100 (to obtain the percentage).
PercentageMoE IPA
ReportsMoE
Quarterly
(starting in
Year 4)
Output RSRCS opened to visitorsNumber of completed RSRCs that are open for
general public use.Number
MoE IPA
ReportsMoE
Quarterly
(starting in
Year 5)
9 | Annex 1

CI CodeIndicator
LevelIndicator Name Definition
Unit of
Measure
Disaggre‐
gation
Primary Data
Source
Responsible
Party
Frequency of
ReportingAdditional Information
MCA Namibia M&E Plan
Annex 1: Indicator Documentation Table
OutcomeVisits to MCA‐N assisted
RSRCs
The number of visits per year to MCA‐N assisted
RSRCs.Number MoE MoE
Quarterly
(starting in
Year 5)
The Year 5 target for this indicator is no longer
considered attainable during the Compact period, given
delays in implementation. However, it could not be
changed as delays in implementation are not included in
the 4 reasons laid out in MCC’s M&E Policy that justify
changing end‐Compact targets. And given that M&E will
continue post‐Compact, we are able to continue
monitoring when or whether the end of Compact target
is ultimately reached
Outcome
Library loans of books and
learning and study materials
from MCA‐N assisted RSRCs
The number of books and materials library loans
per year in MCA‐N assisted libraries.Number MoE MoE
Quarterly
(starting in
Year 5)
The Year 5 target for this indicator is no longer
considered attainable during the Compact period, given
delays in implementation. However, it could not be
changed as delays in implementation are not included in
the 4 reasons laid out in MCC’s M&E Policy that justify
changing end‐Compact targets. And given that M&E will
continue post‐Compact, we are able to continue
monitoring when or whether the end of Compact target
is ultimately reached
Outcome
Library loans of books and
learning and study materials
from MCA‐N assisted mobile
units
Number of books and materials loaned per year
from MCA‐N supported mobile units.Number MoE MoE
Quarterly
(starting in
Year 5)
Process
Namibia Student Financial
Assistance Fund policy in
place
The date on which the revised Namibia Student
Financial Assistance Fund policy is approved by
Cabinet.
Date
Cabinet
Secretariat
and MoE
MoE Once
ProcessModified NSFAF MIS
complete
The date on which the modified NSFAF MIS is
considered complete and the system is operational.Date
NSFAF
ConsultantMCA‐N Once
OutputEducators trained to be
HIV/AIDS awareness trainers
The number of Regional AIDS Committees for
Education (RACE) Coordinators, Continuous
Professional Development (CPD) Coordinators,
HIV/AIDS Management Unit (HAMU) staff and
regional school counsellors who (a) are trained as
trainers of life skills teachers on delivering effective
HIV and AIDS awareness programs, and (b) score
85% or higher on the post‐test.
Number
HAMU
Consultant
Reports
HAMU
ConsultantOnce
Sub‐Activity: HIV/AIDS Management Strengthening to HAMU
Activity: Expanding and Improving Access to Tertiary Finance
Sub‐Activity: Developing a Financially Sustainable and Equitable Scholarship and Loan System
Activity: Cross‐Project Support
Sub‐Activity: RSRC Technical Assistance
Relevant indicators may be added in the next iteration of the M&E Plan.the M&E Plan.
10 | Annex 1

CI CodeIndicator
LevelIndicator Name Definition
Unit of
Measure
Disaggre‐
gation
Primary Data
Source
Responsible
Party
Frequency of
ReportingAdditional Information
MCA Namibia M&E Plan
Annex 1: Indicator Documentation Table
Outcome Leisure tourist arrivalsThe total number of leisure tourist arrivals
recorded per calendar year.Number
Foreign Arrival
RecordsMET
Annual
(starting in
Year 4)
Outcome Tourist arrivalsThe total number of tourist arrivals recorded per
calendar year.Number
Foreign Arrival
RecordsMET
Annual
(starting in
Year 4)
Outcome Jobs in tourism
The number of direct jobs existing in the last 12
months within the tourism industry by companies
involved in travel and tourism activities, such as
hospitality, lodging, food service, equipment rental,
guiding, sport hunting, airlines, etc., as defined by
NTB.
Number
Employment
Distribution
Model
NTB
Annual
(starting in
Year 3)
Given the weaknesses of the NLFS‐sourced
unemployment rate (as identified by the Data Quality
Review (DQR) consultant in the Government Data
Quality Review and in Round 2 of the bi‐annual ex‐post
reviews), which informs this indicator, movement in the
values of this indicator should be cautiously interpreted.
Process Galton Gate Plan complete
The date on which the plan to upgrade the Galton
Road from restricted access to public access is
completed.
Date MET MET Once
ProcessGalton Gate Plan
implemented
The total percentage completion of
implementation of GG Plan to upgrade the Galton
Road from restricted access to public access.
Percentage MET MET
Quarterly
(starting in
Year 2)
This indicator is calculated by dividing the number of
milestones that have been met by the total number to
be met in the Galton Gate Plan and then multiplying by
100.
Process
% of Conditions Precedents
and Performance Targets
met for Etosha National Park
activity
The percentage of Conditions Precedents and
Performance Targets met for the Etosha National
Park activity (1st CP and its 7 performance targets).
Percentage MET MET Quarterly
ProcessOpening of Galton Gate for
general tourist use
The operational date on which Galton Gate is
opened for general self‐drive tourist use without
restriction (i.e., without them having to have made
reservations at Dolomite Camp or having to be
driven by a tour operator with access privileges).
Date MET MET Once
OutcomeEntries and exits through
Galton Gate
The number of entries plus exits through Galton
Gate.Number
Galton Gate
entry/exit
records
MET
Quarterly
(starting in
Year 4)
This indicator will be reported as cumulative within a
year but level across years.
OutcomeTourists to Etosha National
Park
The annual number of paying visitors to Etosha
National Park.Number
ENP Park Entry
RecordsMET
Quarterly
(starting in
Year 3)
This indicator will be reported as cumulative within a
year but level across years.
OutcomeEtosha National Park gross
revenue from gate receipts
The annual total gross revenue generated by ENP
from gate receipts (refunds are not included).
Namibian
Dollars
ENP Park
Revenue
Records
MET
Annual
(starting in
Year 3)
Refunds are not included as their total value across all
parks is low and determining which refunds go to which
park would be too time‐consuming a task.
Outcome
Etosha National Park gross
revenue from conservancy‐
sourced concession fees
The annual total gross revenue generated by ENP
from concessions paid by conservancies.
Namibian
Dollars
Concession
Fee RecordsMET
Annual
(starting in
Year 4)
Sub‐Activity: ENP Management Reform and Investment Promotion
Tourism Project
Multiple Activities
Activity: Improving Management and Infrastructure in Etosha National Park
11 | Annex 1

CI CodeIndicator
LevelIndicator Name Definition
Unit of
Measure
Disaggre‐
gation
Primary Data
Source
Responsible
Party
Frequency of
ReportingAdditional Information
MCA Namibia M&E Plan
Annex 1: Indicator Documentation Table
Process
Value of signed contracts for
design/supervisory services
for ENP housing
units/management
structures
The value of contracts MCA‐N has signed with
contractors for design/supervisory services on ENP
housing units/management structures.
US Dollars IPMS MCA‐N
Quarterly
(starting in
Year 2)
An exchange rate of NAD 7 to USD 1 will be maintained
for reporting purposes.
Typically the value of cumulative indicators does not
decrease over time. Therefore the decrease in target
values between Years 2 and 3 must be explained. It is
due to the timing of the adjustment, which happened in
Year 3 and targets could not be adjusted retrospectively.
Process
Value disbursed against
design/supervisory contracts
for ENP housing
units/management
structures
Actual value disbursed against the contracts for
construction, rehabilitation and equipment for ENP
housing units/management structures.
US Dollars IPMS MCA‐N
Quarterly
(starting in
Year 2)
An exchange rate of NAD 7 to USD 1 will be maintained
for reporting purposes.
Process
% disbursed against
design/supervisory contracts
for ENP housing
units/management
structures
The amount disbursed against signed contracts for
design/supervisory services for ENP housing
units/management structures.
Percentage IPMS MCA‐N
Quarterly
(starting in
Year 2)
Process
Value of signed contracts for
construction, rehabilitation
and equipment for ENP
housing units/management
structures
Value of signed contracts for ENP housing
units/management structures construction or
rehabilitation and/or equipping. If the value of the
contract changes, the amount of the change (either
+ or ‐) should be reported in the quarter that the
change occurred. Cost sharing by others (e.g., co
financing by other donors or government) should
not be included.
US Dollars IPMS MCA‐N
Quarterly
(starting in
Year 4)
An exchange rate of NAD 7 to USD 1 will be maintained
for reporting purposes.
Process
Value disbursed against
construction, rehabilitation
and equipment contracts for
ENP housing
units/management
structures
Actual value disbursed against the contracts for
construction, rehabilitation and equipment for ENP
housing units/management structures.
US Dollars IPMS MCA‐N
Quarterly
(starting in
Year 4)
An exchange rate of NAD 7 to USD 1 will be maintained
for reporting purposes.
Process
% disbursed against
construction, rehabilitation
and equipment contracts for
ENP housing
units/management
structures
The aggregate amount disbursed divided by all
signed contracts for ENP housing
units/management structures works and/or
equipping. Denominator = Value of signed
contracts for ENP housing units/management
structures as defined above. Numerator = Amount
of money disbursed on the signed contracts for
ENP housing units/management structures
works/equipping. This is a proxy indicator for
physical completion of ENP housing
units/management structures works. However,
since the numerator includes industry standard
advance payments and mobilization fees, it does
not correlate perfectly with physical progress.
Percentage IPMS MCA‐N
Quarterly
(starting in
Year 4)
Sub‐Activity: ENP Management Centres and Staff Housing
12 | Annex 1

CI CodeIndicator
LevelIndicator Name Definition
Unit of
Measure
Disaggre‐
gation
Primary Data
Source
Responsible
Party
Frequency of
ReportingAdditional Information
MCA Namibia M&E Plan
Annex 1: Indicator Documentation Table
Process
Galton Gate Construction:
Schedule Performance Index
(SPI)
The ratio of budgeted cost of work scheduled
compared to budgeted cost of work accomplished.Number
Construction
Supervisory
Firm Reports
MCA‐N
Quarterly
(starting in
Year 4)
SPI is a component of earned value management. An
acceptable range for this indicator is between 0.9 and
1.1. A value outside of this range indicates a work
progress issue.
ProcessGalton Gate Construction:
Cost Performance Index (CPI)
The ratio of expected construction costs compared
to actual construction costs.Number
Construction
Supervisory
Firm Reports
MCA‐N
Quarterly
(starting in
Year 4)
CPI is a component of earned value management. An
acceptable range for this indicator is between 0.9 and
1.1. A value outside of this range reflects a mismatch
between planned and actual budget, resulting e.g., from
insufficient scope definition.
Process
Ombika Gate Construction:
Schedule Performance Index
(SPI)
The ratio of budgeted cost of work scheduled
compared to budgeted cost of work accomplished.Number
Construction
Supervisory
Firm Reports
MCA‐N
Quarterly
(starting in
Year 4)
SPI is a component of earned value management. An
acceptable range for this indicator is between 0.9 and
1.1. A value outside of this range indicates a work
progress issue.
ProcessOmbika Gate Construction:
Cost Performance Index (CPI)
The ratio of expected construction costs compared
to actual construction costs.Number
Construction
Supervisory
Firm Reports
MCA‐N
Quarterly
(starting in
Year 4)
CPI is a component of earned value management. An
acceptable range for this indicator is between 0.9 and
1.1. A value outside of this range reflects a mismatch
between planned and actual budget, resulting e.g., from
insufficient scope definition.
OutputPercentage of housing
structures completed
The proportion of all staff housing structures
expected to be built that are completed, expressed
as a percentage.
Percentage
Construction
Supervisory
Firm Reports
MCA‐N
Quarterly
(starting in
Year 4)
OutputOccupancy rate of new
housing units
The proportion of completed new housing units
occupied by MET park staff, expressed as a
percentage.
Percentage MET MET
Quarterly
(starting in
Year 4)
Output
North American tourism
businesses that offer
Namibian tours or tour
packages
The number of North American tourism businesses
(travel agents, tour operators, adventure travel
companies, etc.) that offer tours, tour packages, or
organized trips with Namibia as a principal or
secondary destination.
Number
NADM
Consultant's
report
NADM
Consultant
Annual
(starting in
Year 3)
OutputNamibian travel trade
business persons trained
Number of individual persons from Namibian travel
trade businesses trained in online travel and
tourism marketing. The modules of the training are
specified in the NADM Training Manual to be
handed over to NTB after the completion of the
project: A person is considered trained when
he/she participated in at least one training module.
Number
NADM
Consultant's
report
NADM
Consultant
Quarterly
(starting in
Year 4)
OutcomeLeisure tourist arrivals from
the North American market
The number of leisure tourist arrivals from the
targeted North American market (United States
and Canada) per year.
NumberForeign Arrival
RecordsMET
Annual
(starting in
Year 4)
The target for this indicator accounts for a substantial
decline in leisure tourist arrivals from the North
American market in 2011, so although the target
represents a decrease from the baseline value, it also
reflects an improvement over the most recent historical
period, for which data were available.
OutcomeTourist arrivals from the
North American market
The number of tourist arrivals from the targeted
North American market (United States and Canada)
per year.
NumberForeign Arrival
RecordsMET
Annual
(starting in
Year 4)
Sub‐Activity: Destination Marketing North America
Sub‐Activity: ENP Maintenance and Game Translocation Equipment
Relevant indicators were not added in time (i.e., before their targets were already achieved) to be included in the M&E Plan.
Activity: Marketing Namibia in Tourism
13 | Annex 1

CI CodeIndicator
LevelIndicator Name Definition
Unit of
Measure
Disaggre‐
gation
Primary Data
Source
Responsible
Party
Frequency of
ReportingAdditional Information
MCA Namibia M&E Plan
Annex 1: Indicator Documentation Table
Output
Domestic and regional tourist
routes developed and
marketed to the public
The number of domestic and regional tourist routes
developed and marketed to public with MCA‐N
support.
Number
Route Develop‐
ment
Consultant
Route Develop‐
ment
Consultant
Quarterly
(starting in
Year 4)
Though a cumulative indicator, Years 3 and 4 do not
carry the target from Year 2 as adjustments were made
after Year 2 had ended, and it would not have been
appropriate to change them retrospectively.
ProcessReleases of NTB website
completedThe number of releases of NTB website completed. Number NTB NTB Annual
Output Unique visits on NTB website The number of unique visits on the NTB website. NumberGoogle
AnalyticsNTB
Quarterly
(starting in
Year 3)
Note that quarterly figures are reported cumulatively
within each Compact year, though the indicator is level
across years.
Outcome
Unique visits on NTB website
from the North American
market
The number of unique visits on NTB website from
the North American market (United States and
Canada).
NumberGoogle
AnalyticsNTB
Quarterly
(starting in
Year 3)
Note that quarterly figures are reported cumulatively
within each Compact year, though the indicator is level
across years.
OutcomeAverage time spent on the
NTB website
The average length of time spent on the NTB
website per visit.Seconds
AnalyticsNTB
Quarterly
(starting in
Year 3)
Note that quarterly figures reflect average times through
that quarter of that Compact year.
OutcomeRegistered users of the NTB
website
The number of visitors to the NTB website who
enter the website and then register as a user (to
receive updates).
NumberGoogle
AnalyticsNTB
Quarterly
(starting in
Year 3)
ProcessConservancy Needs
Assessment completed
The date on which the Conservancy Needs
Assessment is considered to be complete by MCA‐
N.
Date MCA‐N MCA‐N Once
Process
Value of grants issued by the
Conservancy Development
Support Grant Fund
The value of grants issued by the Conservancy
Development Support Grant Fund.
Namibian
DollarsMCA‐N MCA‐N
Quarterly
(starting in
Year 3)
Output
Game translocated to
conservancies with MCA‐N
support
The number of game translocated to conservancies
with MCA‐N funded equipment or through grants.Number MET MET
Annual
(starting in
Year 2)
Includes all game species, rare and otherwise.
Output
Rare game translocated to
conservancies with MCA‐N
support
The number of animals from the following game
species translocated to conservancies with MCA‐N
funded equipment or through grants: white rhino,
black rhino, disease‐free buffalo, roan, sable and
black‐faced Impala, tsessebe as well as all the
wetland species (hippo, waterbuck, red lechwe,
reedbuck, oribi, sitatunga and puku).
Number MET MET
Annual
(starting in
Year 2)
There are many external factors governing
translocations of rare wildlife , including demand,
success of capture activities, approval from MET, and
conservancy capacity to manage rare game. Therefore,
there is a chance that in any particular year, the targets
may not be met due to factors beyond the control of
MCA‐N.
A worksheet with the numbers disaggregated by species
is to be provided when reporting on this indicator.
Outcome
Amount of new private
sector investment secured by
MCA‐N‐assisted
conservancies
The total amount of new private sector investment
related to tourism from all sources in all 31
conservancies during a 12 month period, not
including funds from the MCA‐N Conservancy
Development Support Grant Fund.
Namibian
Dollars
NACSO /
CBNRM
Database
CDSS
Consultant
Annual
(starting in
Year 3)
Sub‐Activity: Conservancy Support ‐ Ecotourism Development Packages
Sub‐Activity: Regional and Communal Tourism Products
Sub‐Activity: Interactive Website (includes NTB Website and Online Marketing)
Activity: Ecotourism Development for Communal Conservancies
Sub‐Activity: Conservancy Support ‐ Needs Assessment
14 | Annex 1
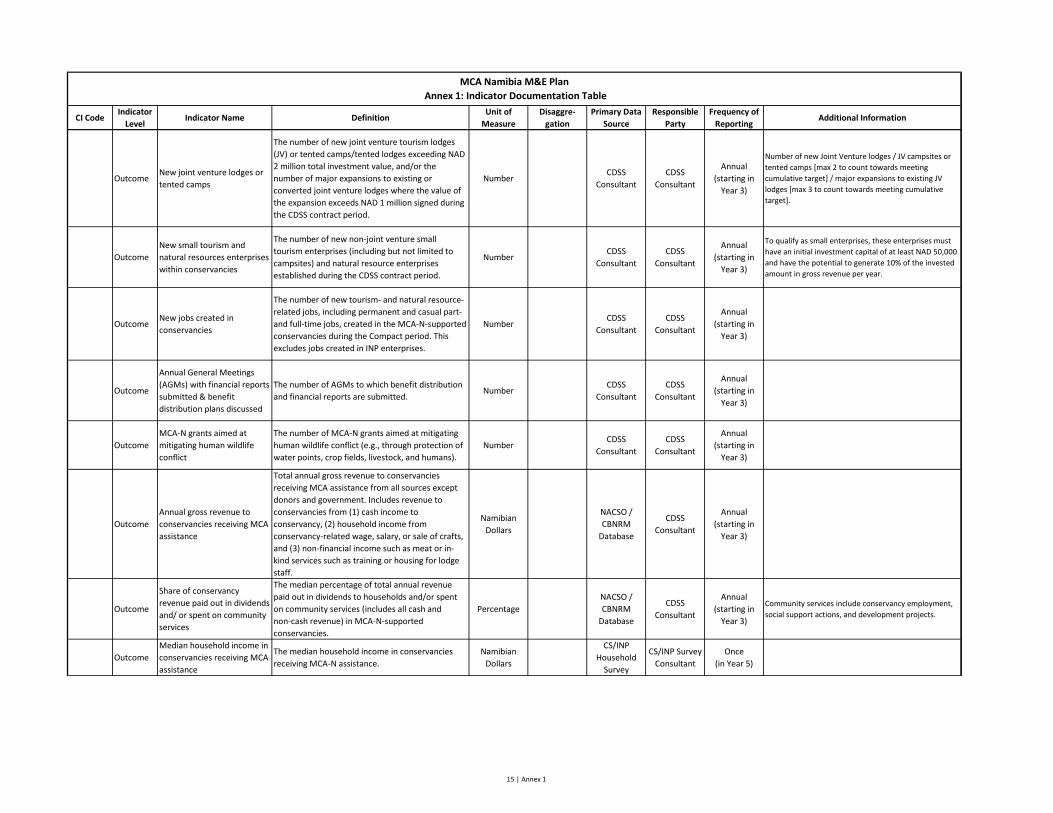
CI CodeIndicator
LevelIndicator Name Definition
Unit of
Measure
Disaggre‐
gation
Primary Data
Source
Responsible
Party
Frequency of
ReportingAdditional Information
MCA Namibia M&E Plan
Annex 1: Indicator Documentation Table
OutcomeNew joint venture lodges or
tented camps
The number of new joint venture tourism lodges
(JV) or tented camps/tented lodges exceeding NAD
2 million total investment value, and/or the
number of major expansions to existing or
converted joint venture lodges where the value of
the expansion exceeds NAD 1 million signed during
the CDSS contract period.
NumberCDSS
Consultant
CDSS
Consultant
Annual
(starting in
Year 3)
Number of new Joint Venture lodges / JV campsites or
tented camps [max 2 to count towards meeting
cumulative target] / major expansions to existing JV
lodges [max 3 to count towards meeting cumulative
target].
Outcome
New small tourism and
natural resources enterprises
within conservancies
The number of new non‐joint venture small
tourism enterprises (including but not limited to
campsites) and natural resource enterprises
established during the CDSS contract period.
NumberCDSS
Consultant
CDSS
Consultant
Annual
(starting in
Year 3)
To qualify as small enterprises, these enterprises must
have an initial investment capital of at least NAD 50,000
and have the potential to generate 10% of the invested
amount in gross revenue per year.
OutcomeNew jobs created in
conservancies
The number of new tourism‐ and natural resource‐
related jobs, including permanent and casual part‐
and full‐time jobs, created in the MCA‐N‐supported
conservancies during the Compact period. This
excludes jobs created in INP enterprises.
NumberCDSS
Consultant
CDSS
Consultant
Annual
(starting in
Year 3)
Outcome
Annual General Meetings
(AGMs) with financial reports
submitted & benefit
distribution plans discussed
The number of AGMs to which benefit distribution
and financial reports are submitted.Number
CDSS
Consultant
CDSS
Consultant
Annual
(starting in
Year 3)
Outcome
MCA‐N grants aimed at
mitigating human wildlife
conflict
The number of MCA‐N grants aimed at mitigating
human wildlife conflict (e.g., through protection of
water points, crop fields, livestock, and humans).
NumberCDSS
Consultant
CDSS
Consultant
Annual
(starting in
Year 3)
Outcome
Annual gross revenue to
conservancies receiving MCA
assistance
Total annual gross revenue to conservancies
receiving MCA assistance from all sources except
donors and government. Includes revenue to
conservancies from (1) cash income to
conservancy, (2) household income from
conservancy‐related wage, salary, or sale of crafts,
and (3) non‐financial income such as meat or in‐
kind services such as training or housing for lodge
staff.
Namibian
Dollars
NACSO /
CBNRM
Database
CDSS
Consultant
Annual
(starting in
Year 3)
Outcome
Share of conservancy
revenue paid out in dividends
and/ or spent on community
services
The median percentage of total annual revenue
paid out in dividends to households and/or spent
on community services (includes all cash and
non‐cash revenue) in MCA‐N‐supported
conservancies.
Percentage
NACSO /
CBNRM
Database
CDSS
Consultant
Annual
(starting in
Year 3)
Community services include conservancy employment,
social support actions, and development projects.
Outcome
Median household income in
conservancies receiving MCA
assistance
The median household income in conservancies
receiving MCA‐N assistance.
Namibian
Dollars
CS/INP
Household
Survey
CS/INP Survey
Consultant
Once
(in Year 5)
15 | Annex 1
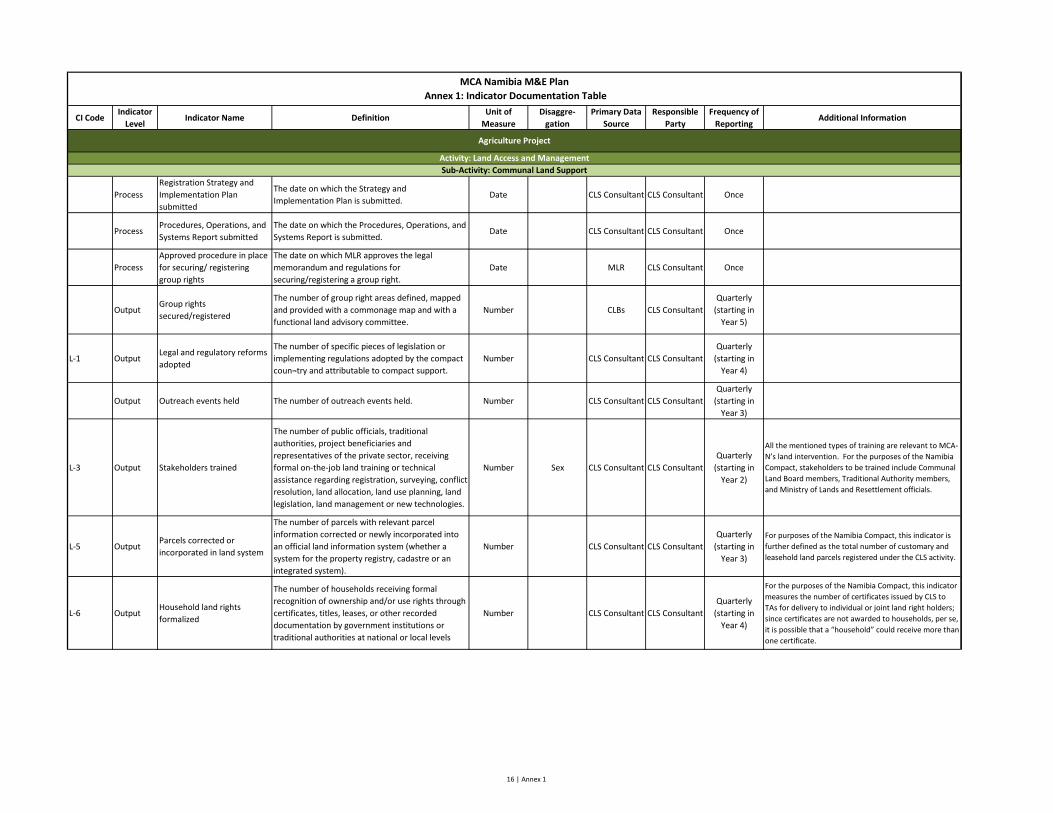
CI CodeIndicator
LevelIndicator Name Definition
Unit of
Measure
Disaggre‐
gation
Primary Data
Source
Responsible
Party
Frequency of
ReportingAdditional Information
MCA Namibia M&E Plan
Annex 1: Indicator Documentation Table
Process
Registration Strategy and
Implementation Plan
submitted
The date on which the Strategy and
Implementation Plan is submitted.Date CLS Consultant CLS Consultant Once
ProcessProcedures, Operations, and
Systems Report submitted
The date on which the Procedures, Operations, and
Systems Report is submitted.Date CLS Consultant CLS Consultant Once
Process
Approved procedure in place
for securing/ registering
group rights
The date on which MLR approves the legal
memorandum and regulations for
securing/registering a group right.
Date MLR CLS Consultant Once
OutputGroup rights
secured/registered
The number of group right areas defined, mapped
and provided with a commonage map and with a
functional land advisory committee.
Number CLBs CLS Consultant
Quarterly
(starting in
Year 5)
L‐1 OutputLegal and regulatory reforms
adopted
The number of specific pieces of legislation or
implementing regulations adopted by the compact
coun¬try and attributable to compact support.
Number CLS Consultant CLS Consultant
Quarterly
(starting in
Year 4)
Output Outreach events held The number of outreach events held. Number CLS Consultant CLS Consultant
Quarterly
(starting in
Year 3)
L‐3 Output Stakeholders trained
The number of public officials, traditional
authorities, project beneficiaries and
representatives of the private sector, receiving
formal on‐the‐job land training or technical
assistance regarding registration, surveying, conflict
resolution, land allocation, land use planning, land
legislation, land management or new technologies.
Number Sex CLS Consultant CLS Consultant
Quarterly
(starting in
Year 2)
All the mentioned types of training are relevant to MCA‐
N’s land intervention. For the purposes of the Namibia
Compact, stakeholders to be trained include Communal
Land Board members, Traditional Authority members,
and Ministry of Lands and Resettlement officials.
L‐5 OutputParcels corrected or
incorporated in land system
The number of parcels with relevant parcel
information corrected or newly incorporated into
an official land information system (whether a
system for the property registry, cadastre or an
integrated system).
Number CLS Consultant CLS Consultant
Quarterly
(starting in
Year 3)
For purposes of the Namibia Compact, this indicator is
further defined as the total number of customary and
leasehold land parcels registered under the CLS activity.
L‐6 OutputHousehold land rights
formalized
The number of households receiving formal
recognition of ownership and/or use rights through
certificates, titles, leases, or other recorded
documentation by government institutions or
traditional authorities at national or local levels
Number CLS Consultant CLS Consultant
Quarterly
(starting in
Year 4)
For the purposes of the Namibia Compact, this indicator
measures the number of certificates issued by CLS to
TAs for delivery to individual or joint land right holders;
since certificates are not awarded to households, per se,
it is possible that a “household” could receive more than
one certificate.
Agriculture Project
Activity: Land Access and Management
Sub‐Activity: Communal Land Support
16 | Annex 1

CI CodeIndicator
LevelIndicator Name Definition
Unit of
Measure
Disaggre‐
gation
Primary Data
Source
Responsible
Party
Frequency of
ReportingAdditional Information
MCA Namibia M&E Plan
Annex 1: Indicator Documentation Table
Process Selection of RIAs completed
The date on which the final selection of RIAs (i.e.,
areas where the CBRLM facilitator will start
working) is made.
Date MCA‐N MCA‐N Once
OutputWater infrastructure
supported
The total number of water infrastructure points
supported by the CBRLM sub‐activity, either by
new ones being newly built or existing ones being
upgraded.
NumberCBRLM
Consultant
CBRLM
ConsultantQuarterly
OutputGrazing areas doing
combined herding
The number of grazing area (GA) communities that
have agreed to combined herding, which is where
two or more cattle‐owning households using the
GA agree to bring the cattle that graze in that GA
together on a daily basis and herd them in a
compact group through the day before returning to
individual household kraals for the night.
NumberCBRLM
Consultant
CBRLM
Consultant
Annual
(starting in
Year 3)
This is the step that precedes the completion of a
documented grazing plan and map of the grazing area.
Also note that at least two households getting together
to herd as indicated in the definition is sufficient to
indicate interest in adopting a grazing plan.
A GA is defined as the area within a recognized
boundary within which grazing resources are found.
Output
Grazing areas with
documented grazing plan and
map
The number of GAs with documented grazing plan
and map of the grazing area, which is divided into
sections for each month of the year. The plan
indicates which sections will be grazed in each
month by the combined herd.
NumberCBRLM
Consultant
CBRLM
Consultant
Quarterly
(starting in
Year 3)
This step occurs after combined herding has started.
Output
Grazing areas with
documented plans for
changing herd composition
The number of GAs with documented plans for
destocking and restocking herds based on expected
resource availability and best‐practices for
improving herd productivity (e.g., ideal bull:female
ratios).
NumberCBRLM
Consultant
CBRLM
Consultant
Quarterly
(starting in
Year 3)
Output
Grazing areas with
documented combined
management plans
The number of GAs with plans that incorporate
grazing management, herding, herd structure,
marketing, health, and GA fund plans into a
coordinated and interlinked whole that will be
documented in the GA Book (where the actions
taken and agreed in relation to all elements of the
CBRLM approach are recorded).
NumberCBRLM
Consultant
CBRLM
Consultant
Quarterly
(starting in
Year 3)
OutputParticipating households
registered in the programme
The total number of households that participate in
and register with the CBRLM programme.Number
CBRLM
Consultant
CBRLM
Consultant
Quarterly
(starting in
Year 2)
Sub‐Activity: Community Based Rangeland and Livestock Management
17 | Annex 1

CI CodeIndicator
LevelIndicator Name Definition
Unit of
Measure
Disaggre‐
gation
Primary Data
Source
Responsible
Party
Frequency of
ReportingAdditional Information
MCA Namibia M&E Plan
Annex 1: Indicator Documentation Table
OutputField facilitators certified in
rangeland management
The number of field facilitators who complete
training and are awarded certificates under the
CBRLM sub‐activity.
Number SexCBRLM
Consultant
CBRLM
Consultant
Annual
(starting in
Year 4)
Training refers to the transfer of knowledge and skills in
the principles and technologies related to CBRLM. It
also relates to the development of the capacity of the
field facilitators to communicate the CBRLM message to
communities and to work with them to implement a
CBRLM approach tailored to the specific needs and
circumstances of those communities. This set of
knowledge and skills is gained through classroom
training, workshop‐like training events, teaching
materials, in‐field support and coaching from experts,
and practical learning by doing with communities.
Assessment of competency will take place over the
course of the project and a final assessment of each field
facilitator will be made towards the end of the contract.
Outcome Bare ground
The difference between treatment and control in
the proportion of ground not covered by different
types of plants, litter, or rock.
Percentage
CBRLM
Rangeland
Assessment
USDAOnce
(in Year 5)
OutcomeSoil surface in large inter‐
canopy gaps
The difference between treatment and control in
the proportion of soil surface in large inter‐canopy
gaps.
Percentage
CBRLM
Rangeland
Assessment
USDAOnce
(in Year 5)
Outcome Foliar cover
The difference between treatment and control in
the proportion of the ground covered by the
vertical projection of the aerial portion of plants.
Percentage
CBRLM
Rangeland
Assessment
USDAOnce
(in Year 5)
Process
Value of signed contracts for
design/supervisory services
for SVOs
The value of contracts MCA‐N has signed with
contractors for design/supervisory services on the
SVOs.
US Dollars IPMS MCA‐N
Quarterly
(starting in
Year 2)
An exchange rate of NAD 7 to USD 1 will be maintained
for reporting purposes.
Process
Value disbursed against
design/supervisory contracts
for SVOs
Actual value disbursed against the contracts for
construction, rehabilitation and equipment for
SVOs.
US Dollars IPMS MCA‐N
Quarterly
(starting in
Year 2)
An exchange rate of NAD 7 to USD 1 will be maintained
for reporting purposes.
Process
% disbursed against
design/supervisory contracts
for SVOs
The amount disbursed against signed contracts for
design/supervisory services for SVOs.Percentage IPMS MCA‐N
Quarterly
(starting in
Year 2)
ProcessValue of signed contracts for
construction of SVOs
Value of signed contracts for SVOs construction. If
the value of the contract changes, the amount of
the change (either + or ‐) should be reported in the
quarter that the change occurred. Cost sharing by
others (e.g., co financing by other donors or
government) should not be included.
US Dollars IPMS MCA‐N
Quarterly
(starting in
Year 4)
An exchange rate of NAD 7 to USD 1 will be maintained
for reporting purposes.
Though a cumulative indicator, the targets for Years 3
through 5 are lower than that of Year 2 as adjustments
were made after Year 2 had ended, and it would not
have been appropriate to change them retrospectively.
Process
Value disbursed against
construction contracts for
SVOs
Actual value disbursed against the contracts for
construction for SVOs.US Dollars IPMS MCA‐N
Quarterly
(starting in
Year 4)
An exchange rate of NAD 7 to USD 1 will be maintained
for reporting purposes.
Activity: Livestock Support
Sub‐Activities: Preparatory Studies for Infrastructure and Construction of Vet Centres and Quarantine Camps (SVOs and Q‐Camps)
18 | Annex 1

CI CodeIndicator
LevelIndicator Name Definition
Unit of
Measure
Disaggre‐
gation
Primary Data
Source
Responsible
Party
Frequency of
ReportingAdditional Information
MCA Namibia M&E Plan
Annex 1: Indicator Documentation Table
Process
% disbursed against
construction contracts for
SVOs
The aggregate amount disbursed divided by all
signed contracts for SVO works. Denominator =
Value of signed contracts for SVOs as defined
above. Numerator = Amount of money disbursed
on the signed contracts for SVO works. This is a
proxy indicator for physical completion of SVO
works. However, since the numerator includes
industry standard advance payments and
mobilization fees, it does not correlate perfectly
with physical progress.
Percentage IPMS MCA‐N
Quarterly
(starting in
Year 4)
OutputNew state veterinary offices
(SVOs) constructedThe number of new SVOs that are fully constructed. Number
Construction
Supervisory
Firm Reports
MCA‐N
Quarterly
(starting in
Year 4)
Output Q‐Camps rehabilitatedThe number of Q‐Camps for which rehabilitation
has been completed.Number
Construction
Supervisory
Firm Reports
MCA‐N
Quarterly
(starting in
Year 4)
OutcomeNew state veterinary offices
(SVOs) operational
The number of new SVOs that are completely
constructed, equipped, staffed, and conducting
business.
Number DVS MAWF
Quarterly
(starting in
Year 5)
ProcessNamLITS 2.0 complete and
fully operational
The date on which the Namibia Livestock
Identification and Traceability System (NamLITS)
database for data from the NCAs is fully
operational and able to populated with data (i.e.,
Release 4 in place).
Date DVS MAWF Once
Output Cattle tagged with RFID tagsThe number of cattle tagged as part of the
traceability activity.Number NamLITS MAWF
Quarterly
(starting in
Year 2)
Process
Value of grant agreements
signed under the Livestock
Efficiency Fund
The value of grant agreements signed under the
Livestock Efficiency Fund.US Dollars MCA‐N MCA‐N
Quarterly
(starting in
Year 2)
An exchange rate of NAD 7 to USD 1 will be maintained
for reporting purposes.
Sub‐Activity: Livestock Traceability System
Sub‐Activity: Livestock Market Efficiency Fund
19 | Annex 1
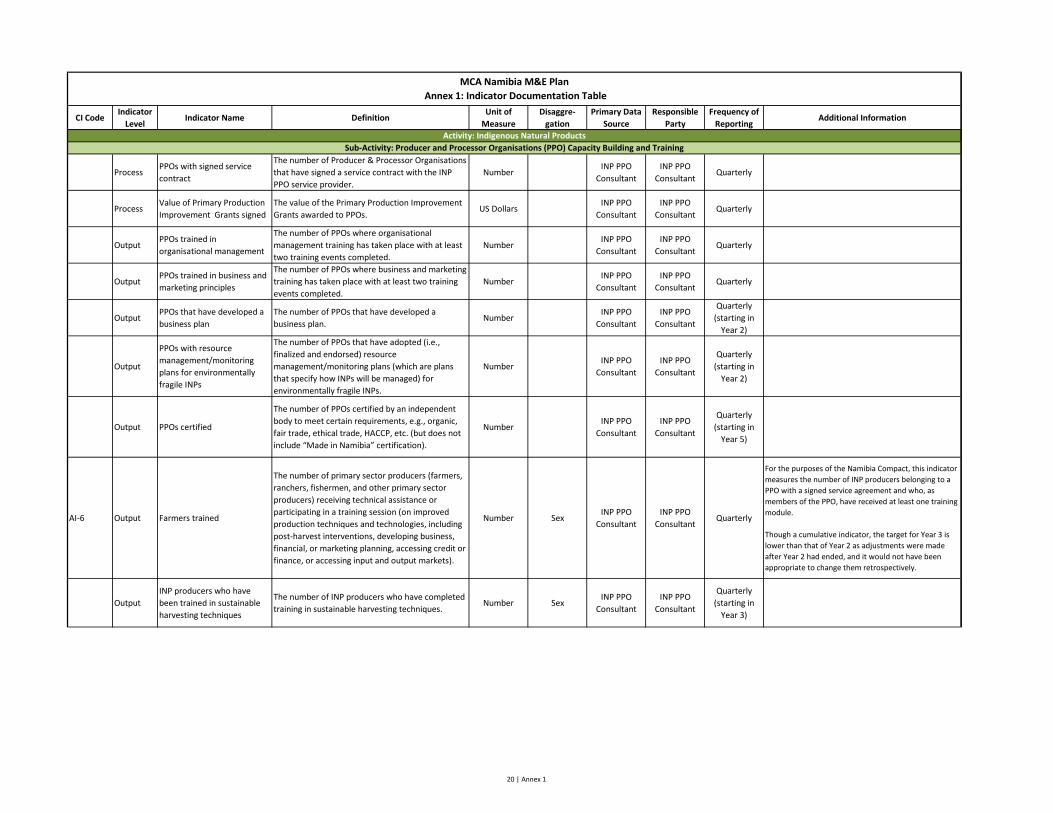
CI CodeIndicator
LevelIndicator Name Definition
Unit of
Measure
Disaggre‐
gation
Primary Data
Source
Responsible
Party
Frequency of
ReportingAdditional Information
MCA Namibia M&E Plan
Annex 1: Indicator Documentation Table
ProcessPPOs with signed service
contract
The number of Producer & Processor Organisations
that have signed a service contract with the INP
PPO service provider.
NumberINP PPO
Consultant
INP PPO
ConsultantQuarterly
ProcessValue of Primary Production
Improvement Grants signed
The value of the Primary Production Improvement
Grants awarded to PPOs.US Dollars
INP PPO
Consultant
INP PPO
ConsultantQuarterly
OutputPPOs trained in
organisational management
The number of PPOs where organisational
management training has taken place with at least
two training events completed.
NumberINP PPO
Consultant
INP PPO
ConsultantQuarterly
OutputPPOs trained in business and
marketing principles
The number of PPOs where business and marketing
training has taken place with at least two training
events completed.
NumberINP PPO
Consultant
INP PPO
ConsultantQuarterly
OutputPPOs that have developed a
business plan
The number of PPOs that have developed a
business plan.Number
INP PPO
Consultant
INP PPO
Consultant
Quarterly
(starting in
Year 2)
Output
PPOs with resource
management/monitoring
plans for environmentally
fragile INPs
The number of PPOs that have adopted (i.e.,
finalized and endorsed) resource
management/monitoring plans (which are plans
that specify how INPs will be managed) for
environmentally fragile INPs.
NumberINP PPO
Consultant
INP PPO
Consultant
Quarterly
(starting in
Year 2)
Output PPOs certified
The number of PPOs certified by an independent
body to meet certain requirements, e.g., organic,
fair trade, ethical trade, HACCP, etc. (but does not
include “Made in Namibia” certification).
NumberINP PPO
Consultant
INP PPO
Consultant
Quarterly
(starting in
Year 5)
AI‐6 Output Farmers trained
The number of primary sector producers (farmers,
ranchers, fishermen, and other primary sector
producers) receiving technical assistance or
participating in a training session (on improved
production techniques and technologies, including
post‐harvest interventions, developing business,
financial, or marketing planning, accessing credit or
finance, or accessing input and output markets).
Number SexINP PPO
Consultant
INP PPO
ConsultantQuarterly
For the purposes of the Namibia Compact, this indicator
measures the number of INP producers belonging to a
PPO with a signed service agreement and who, as
members of the PPO, have received at least one training
module.
Though a cumulative indicator, the target for Year 3 is
lower than that of Year 2 as adjustments were made
after Year 2 had ended, and it would not have been
appropriate to change them retrospectively.
Output
INP producers who have
been trained in sustainable
harvesting techniques
The number of INP producers who have completed
training in sustainable harvesting techniques.Number Sex
INP PPO
Consultant
INP PPO
Consultant
Quarterly
(starting in
Year 3)
Activity: Indigenous Natural Products
Sub‐Activity: Producer and Processor Organisations (PPO) Capacity Building and Training
20 | Annex 1
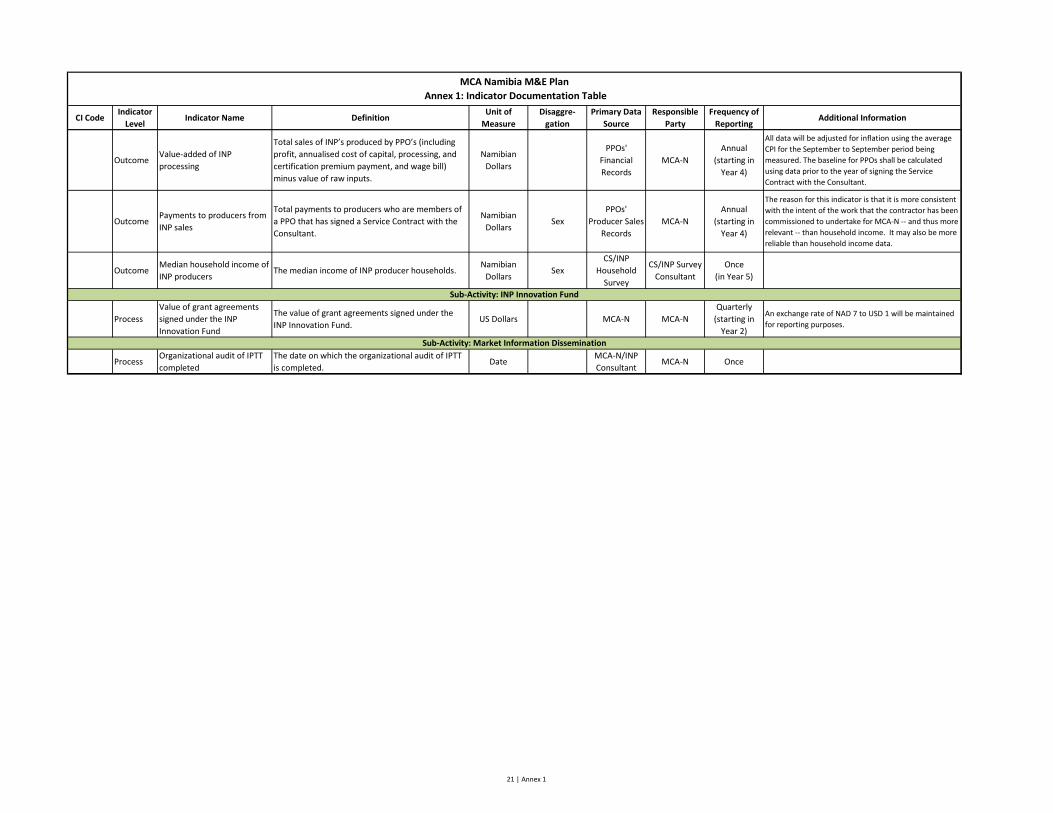
CI CodeIndicator
LevelIndicator Name Definition
Unit of
Measure
Disaggre‐
gation
Primary Data
Source
Responsible
Party
Frequency of
ReportingAdditional Information
MCA Namibia M&E Plan
Annex 1: Indicator Documentation Table
OutcomeValue‐added of INP
processing
Total sales of INP’s produced by PPO’s (including
profit, annualised cost of capital, processing, and
certification premium payment, and wage bill)
minus value of raw inputs.
Namibian
Dollars
PPOs'
Financial
Records
MCA‐N
Annual
(starting in
Year 4)
All data will be adjusted for inflation using the average
CPI for the September to September period being
measured. The baseline for PPOs shall be calculated
using data prior to the year of signing the Service
Contract with the Consultant.
OutcomePayments to producers from
INP sales
Total payments to producers who are members of
a PPO that has signed a Service Contract with the
Consultant.
Namibian
DollarsSex
PPOs'
Producer Sales
Records
MCA‐N
Annual
(starting in
Year 4)
The reason for this indicator is that it is more consistent
with the intent of the work that the contractor has been
commissioned to undertake for MCA‐N ‐‐ and thus more
relevant ‐‐ than household income. It may also be more
reliable than household income data.
OutcomeMedian household income of
INP producersThe median income of INP producer households.
Namibian
DollarsSex
CS/INP
Household
Survey
CS/INP Survey
Consultant
Once
(in Year 5)
Process
Value of grant agreements
signed under the INP
Innovation Fund
The value of grant agreements signed under the
INP Innovation Fund.US Dollars MCA‐N MCA‐N
Quarterly
(starting in
Year 2)
An exchange rate of NAD 7 to USD 1 will be maintained
for reporting purposes.
ProcessOrganizational audit of IPTT
completed
The date on which the organizational audit of IPTT
is completed.Date
MCA‐N/INP
ConsultantMCA‐N Once
Sub‐Activity: INP Innovation Fund
Sub‐Activity: Market Information Dissemination
21 | Annex 1

Year 1 Year 2 Year 3 Year 4 Year 5
Oct‐2009 to Sep‐
2010
Oct‐2010 to Sep‐
2011
Oct‐2011 to Sep‐
2012
Oct‐2012 to Sep‐
2013
Oct‐2013 to Sep‐
2014
Goal Poverty Rate Percentage Level 27.6%
(2003/2004)20.0% 20.0%
Goal Unemployment Rate Percentage Level 51.2%
(2008)33.6% 33.6%
Goal Median Household IncomeNamibian
DollarsLevel
43,520
(2003/2004)55,269 55,269
MCA Namibia M&E Plan
Annex 2: Table of Indicator Baselines and Targets
Indicator
LevelIndicator Name
Unit of
Measure
Indicator
Classification
Baseline
(year)
End of Compact
Target
Goal Indicators
Note: The Goal Indicators are informed by Vision 2030 and NDP3 and reflect the expectation that MCA Namibia Programme will contribute to the goals of Vision 2030. However, the MCA Namibia Programme
is not of sufficient scale or scope to independently achieve these goals.
1 | Annex 2

Year 1 Year 2 Year 3 Year 4 Year 5
Oct‐2009 to Sep‐
2010
Oct‐2010 to Sep‐
2011
Oct‐2011 to Sep‐
2012
Oct‐2012 to Sep‐
2013
Oct‐2013 to Sep‐
2014
MCA Namibia M&E Plan
Annex 2: Table of Indicator Baselines and Targets
Indicator
LevelIndicator Name
Unit of
Measure
Indicator
Classification
Baseline
(year)
End of Compact
Target
Process
Value of signed educational facility
construction, rehabilitation, and equipping
contracts
US Dollars Cumulative0
(2009)72,993,740 89,382,730 90,382,730 90,382,730
Process
Percent disbursed of educational facility
construction, rehabilitation, and equipping
contracts
Percentage Level 0%
(2009)66% 83% 100% 100%
OutputEducational facilities constructed or
rehabilitatedNumber Cumulative
0
(2009)23 55 57 57
ProcessValue of signed contracts for
design/supervisory services for 47 schoolsUS Dollars Cumulative
0
(2009)7,930,000 7,930,000 7,930,000 7,930,000 7,930,000 7,930,000
Process
Value disbursed against
design/supervisory contracts for 47
schools
US Dollars Cumulative0
(2009)2,450,000 4,130,000 5,940,000 7,360,000 7,930,000 7,930,000
Process% disbursed against design/supervisory
contracts for 47 schoolsPercentage Level
0%
(2009)31% 52% 75% 93% 100% 100%
Process
Value of signed contracts for construction,
rehabilitation and equipment for 47
schools
US Dollars Cumulative0
(2009)12,910,000 45,670,000 55,493,740 57,675,768 58,675,768 58,675,768
Process
Value disbursed against construction,
rehabilitation and equipment contracts for
47 schools
US Dollars Cumulative0
(2009)1,030,000 20,710,000 35,540,023 51,010,164 58,675,768 58,675,768
Process
% disbursed against construction,
rehabilitation and equipment contracts for
47 schools
Percentage Level 0%
(2009)8% 45% 64% 88% 100% 100%
Output
Educational facilities constructed,
rehabilitated, equipped in the 47 schools
sub‐activity
Number Cumulative0
(2009)13 23 45 47 47
Output
% of schools with positions filled to teach
Information, Communication and
Technology (ICT) Literacy
Percentage Level 100% 100% 100%
Sub‐Activity: Improving the Quality of General Education (47 schools)
Education Project Indicators
Activity: Multiple Education Activities
Activity: Improving the Quality of General Education
2 | Annex 2

Year 1 Year 2 Year 3 Year 4 Year 5
Oct‐2009 to Sep‐
2010
Oct‐2010 to Sep‐
2011
Oct‐2011 to Sep‐
2012
Oct‐2012 to Sep‐
2013
Oct‐2013 to Sep‐
2014
MCA Namibia M&E Plan
Annex 2: Table of Indicator Baselines and Targets
Indicator
LevelIndicator Name
Unit of
Measure
Indicator
Classification
Baseline
(year)
End of Compact
Target
OutputLearners (any level) participating in the 47
schools sub‐activityNumber Level
26,857
(2009)26,857 26,857 27,861 28,393 28,947 28,947
Outcome Teacher qualification ‐ 47 schools Percentage Level 85%
(2008)85.0% 85.0% 86.7% 88.4% 90.2% 90.2%
Outcome
Percentage of learners attaining “Basic
Achievement” or higher on the Grade 5
NSAT – English – 47 schools
Percentage Level 30%
(2009)35% 40% 40%
Outcome
Percentage of learners attaining “Basic
Achievement” or higher on the Grade 5
NSAT – Mathematics – 47 schools
Percentage Level 44%
(2009)49% 54% 54%
OutcomePass Rate of JSC learners (grade 10) ‐ Math
‐ 47 SchoolsPercentage Level
34.1%
(2008)49.1% 58.9% 58.9%
OutcomePass Rate of JSC learners (grade 10) ‐
Science ‐ 47 SchoolsPercentage Level
38.6%
(2008)55.5% 66.6% 66.6%
OutcomePass Rate of JSC learners (grade 10) ‐
English ‐ 47 SchoolsPercentage Level
39.3%
(2008)56.6% 67.9% 67.9%
OutcomePass Rate of NSSC learners (grade 12) ‐
Math ‐ 47 schoolsPercentage Level
29.8%
(2008)42.9% 51.4% 51.4%
OutcomePass Rate of NSSC learners (grade 12) ‐
Science ‐ 47 schoolsPercentage Level
31.6%
(2008)45.5% 54.7% 54.7%
OutcomePass Rate of NSSC learners (grade 12) ‐
English ‐ 47 schoolsPercentage Level
50.8%
(2008)73.1% 87.8% 87.8%
Process Textbook procurement process reformed Date Date Jan‐14 Jan‐14
OutputPeople trained in facilities maintenance
managementNumber Cumulative
0
(2009)200 200 200
Output
Regional Continuous Professional
Development (CPD) Coordinating
Committees
Number Cumulative0
(2009)13 13 13 13
OutputRegions where Master Trainers have been
trainedNumber Cumulative
0
(2009)3 13 13
OutputEducators trained in instructional
leadershipNumber Cumulative
0
(2009)50 50
Sub‐Activity: Policy, Operational, and Administrative Support (to MoE)
3 | Annex 2
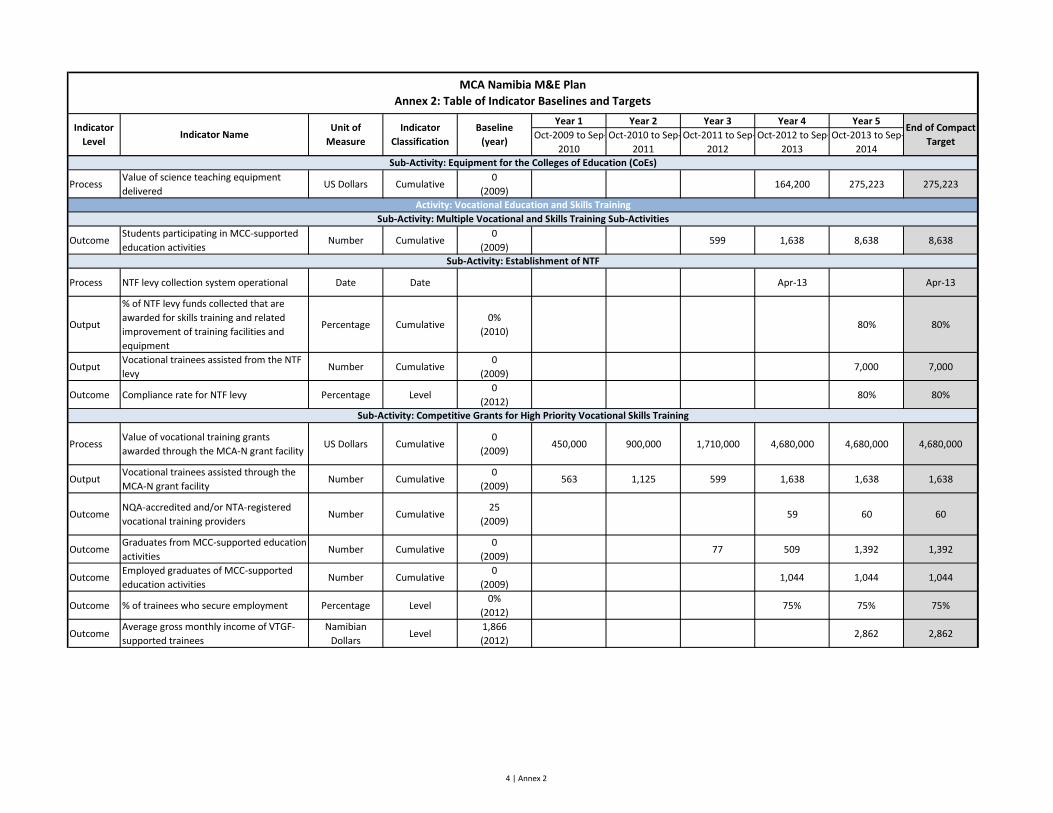
Year 1 Year 2 Year 3 Year 4 Year 5
Oct‐2009 to Sep‐
2010
Oct‐2010 to Sep‐
2011
Oct‐2011 to Sep‐
2012
Oct‐2012 to Sep‐
2013
Oct‐2013 to Sep‐
2014
MCA Namibia M&E Plan
Annex 2: Table of Indicator Baselines and Targets
Indicator
LevelIndicator Name
Unit of
Measure
Indicator
Classification
Baseline
(year)
End of Compact
Target
ProcessValue of science teaching equipment
deliveredUS Dollars Cumulative
0
(2009)164,200 275,223 275,223
OutcomeStudents participating in MCC‐supported
education activitiesNumber Cumulative
0
(2009)599 1,638 8,638 8,638
Process NTF levy collection system operational Date Date Apr‐13 Apr‐13
Output
% of NTF levy funds collected that are
awarded for skills training and related
improvement of training facilities and
equipment
Percentage Cumulative0%
(2010)80% 80%
OutputVocational trainees assisted from the NTF
levyNumber Cumulative
0
(2009)7,000 7,000
Outcome Compliance rate for NTF levy Percentage Level 0
(2012)80% 80%
ProcessValue of vocational training grants
awarded through the MCA‐N grant facility US Dollars Cumulative
0
(2009)450,000 900,000 1,710,000 4,680,000 4,680,000 4,680,000
OutputVocational trainees assisted through the
MCA‐N grant facilityNumber Cumulative
0
(2009)563 1,125 599 1,638 1,638 1,638
OutcomeNQA‐accredited and/or NTA‐registered
vocational training providersNumber Cumulative
25
(2009)59 60 60
OutcomeGraduates from MCC‐supported education
activitiesNumber Cumulative
0
(2009)77 509 1,392 1,392
OutcomeEmployed graduates of MCC‐supported
education activitiesNumber Cumulative
0
(2009)1,044 1,044 1,044
Outcome % of trainees who secure employment Percentage Level 0%
(2012)75% 75% 75%
OutcomeAverage gross monthly income of VTGF‐
supported trainees
Namibian
DollarsLevel
1,866
(2012)2,862 2,862
Activity: Vocational Education and Skills Training
Sub‐Activity: Establishment of NTF
Sub‐Activity: Competitive Grants for High Priority Vocational Skills Training
Sub‐Activity: Equipment for the Colleges of Education (CoEs)
Sub‐Activity: Multiple Vocational and Skills Training Sub‐Activities
4 | Annex 2

Year 1 Year 2 Year 3 Year 4 Year 5
Oct‐2009 to Sep‐
2010
Oct‐2010 to Sep‐
2011
Oct‐2011 to Sep‐
2012
Oct‐2012 to Sep‐
2013
Oct‐2013 to Sep‐
2014
MCA Namibia M&E Plan
Annex 2: Table of Indicator Baselines and Targets
Indicator
LevelIndicator Name
Unit of
Measure
Indicator
Classification
Baseline
(year)
End of Compact
Target
ProcessValue of signed contracts for
design/supervisory services for COSDECsUS Dollars Cumulative
0
(2009)2,020,000 2,020,000 1,600,000 1,600,000 1,600,000 1,600,000
ProcessValue disbursed against
design/supervisory contracts for COSDECsUS Dollars Cumulative
0
(2009)670,000 920,000 1,000,000 1,500,000 1,600,000 1,600,000
Process% disbursed against design/supervisory
contracts for COSDECsPercentage Level
0%
(2009)33% 46% 63% 94% 100% 100%
ProcessValue of signed contracts for construction,
rehabilitation and equipment for COSDECsUS Dollars Cumulative
0
(2009)7,150,000 14,206,962 14,206,962 14,206,962
Process
Value disbursed against construction,
rehabilitation and equipment contracts for
COSDECs
US Dollars Cumulative0
(2009)6,028,481 14,206,962 14,206,962
Process
% disbursed against construction,
rehabilitation and equipment contracts for
COSDECs
Percentage Level 0%
(2009)42% 100% 100%
Output COSDECS completed Number Cumulative0
(2009)8 8 8
Output Arts and Crafts Centres completed Number Cumulative0
(2009)1 1
Output COSDEC staff trained in management Number Cumulative0
(2009)15 15 15 15
Process Textbook storage plan complete Date Date 31‐Oct‐09 31‐Oct‐09
Process Textbook baseline study complete Date Date 31‐Mar‐10 31‐Mar‐10
Output Textbooks delivered Number Cumulative0
(2009)695,164 695,164 695,164 695,164 1,300,000 1,300,000
OutputEducators trained to be textbook
management trainersNumber Cumulative
0
(2009)100 100 100
OutputEducators trained to be textbook
utilization trainersNumber Cumulative
0
(2009)100 100 100
Sub‐Activity: Construction and Upgrading of 9 Community Skills and Development Centres
Sub‐Activity: COSDECs Management Training
Activity: Improving Access to and Management of Textbooks
Sub‐Activities: Procurement of Priority Textbooks and Procurement of General Textbooks
Sub‐Activity: Textbook Management Training
5 | Annex 2

Year 1 Year 2 Year 3 Year 4 Year 5
Oct‐2009 to Sep‐
2010
Oct‐2010 to Sep‐
2011
Oct‐2011 to Sep‐
2012
Oct‐2012 to Sep‐
2013
Oct‐2013 to Sep‐
2014
MCA Namibia M&E Plan
Annex 2: Table of Indicator Baselines and Targets
Indicator
LevelIndicator Name
Unit of
Measure
Indicator
Classification
Baseline
(year)
End of Compact
Target
ProcessValue of signed contracts for
design/supervisory services for RSRCsUS Dollars Cumulative
0
(2009)2,040,000 2,040,000 2,040,000 2,040,000 2,040,000 2,040,000
ProcessValue disbursed against
design/supervisory contracts for RSRCsUS Dollars Cumulative
0
(2009)600,000 1,160,000 1,310,000 1,640,000 2,040,000 2,040,000
Process% disbursed against design/supervisory
contracts for RSRCsPercentage Level
0%
(2009)29% 57% 64% 80% 100% 100%
ProcessValue of signed contracts for construction,
rehabilitation and equipment for RSRCsUS Dollars Cumulative
0
(2009)4,580,000 9,220,000 17,500,000 17,500,000 17,500,000 17,500,000
Process
Value disbursed against construction,
rehabilitation and equipment contracts for
RSRCs
US Dollars Cumulative0
(2009)2,070,000 12,500,000 17,000,000 17,500,000 17,500,000
Process
% disbursed against construction,
rehabilitation and equipment contracts for
RSRCs
Percentage Level 0%
(2009)0% 22% 71% 97% 100% 100%
Output RSRCs completed Number Cumulative0
(2009)2 3 3
Output % of positions at RSRCs staffed Percentage Level 0%
(2009)60% 100% 100%
Output RSRCs opened to visitors Number Cumulative0
(2009)3 3
Outcome Visits to MCA‐N assisted RSRCs Number Level 0
(2009)240,000 240,000
Outcome
Library loans of books and learning and
study materials from MCA‐N assisted
RSRCs
Number Level 0
(2009)32,000 32,000
Outcome
Library loans of books and learning and
study materials from MCA‐N assisted
mobile units
Number Level 0
(2009)1,980 1,980
Sub‐Activity: RSRC Technical Assistance
Relevant indicators may be added in the next iteration of the M&E Plan.the M&E Plan.
Sub‐Activity: Construction of RSRCs
Activity: Investment in RSRCs
6 | Annex 2

Year 1 Year 2 Year 3 Year 4 Year 5
Oct‐2009 to Sep‐
2010
Oct‐2010 to Sep‐
2011
Oct‐2011 to Sep‐
2012
Oct‐2012 to Sep‐
2013
Oct‐2013 to Sep‐
2014
MCA Namibia M&E Plan
Annex 2: Table of Indicator Baselines and Targets
Indicator
LevelIndicator Name
Unit of
Measure
Indicator
Classification
Baseline
(year)
End of Compact
Target
ProcessNamibia Student Financial Assistance Fund
policy in placeDate Date Nov‐12 Nov‐12
Process Modified NSFAF MIS complete Date Date Jun‐13 Jun‐13
OutputEducators trained to be HIV/AIDS
awareness trainersNumber Cumulative
0
(2009)41 41
Activity: Expanding and Improving Access to Tertiary Finance
Sub‐Activity: Developing a Financially Sustainable and Equitable Scholarship and Loan System
Activity: Cross‐Project Support
Sub‐Activity: HIV/AIDS Management Strengthening to HAMU
7 | Annex 2

Year 1 Year 2 Year 3 Year 4 Year 5
Oct‐2009 to Sep‐
2010
Oct‐2010 to Sep‐
2011
Oct‐2011 to Sep‐
2012
Oct‐2012 to Sep‐
2013
Oct‐2013 to Sep‐
2014
MCA Namibia M&E Plan
Annex 2: Table of Indicator Baselines and Targets
Indicator
LevelIndicator Name
Unit of
Measure
Indicator
Classification
Baseline
(year)
End of Compact
Target
Outcome Leisure tourist arrivals Number Level 416,991
(2010)442,633 453,699 453,699
Outcome Tourist arrivals Number Level 984,099
(2010)1,106,782 1,155,480 1,155,480
Outcome Jobs in tourism Number Level 21,500
(2010)22,000 22,836 23,841 23,841
Process Galton Gate Plan complete Date Date 30‐Sep‐10 30‐Sep‐10
Process Galton Gate Plan implemented Percentage Cumulative0%
(2009)25% 70% 79% 100% 100%
Process
% of Conditions Precedents and
Performance Targets met for Etosha
National Park activity
Percentage Cumulative0%
(2009)50% 100% 100% 100% 100% 100%
ProcessOpening of Galton Gate for general tourist
useDate Date 31‐Jan‐13 31‐Jan‐13
Outcome Entries and exits through Galton Gate Number Level 1,582
(2010)10,000 15,000 15,000
Outcome Tourists to Etosha National Park Number Level 179,365
(2010)242,000 265,134 276,800 276,800
OutcomeEtosha National Park gross revenue from
gate receipts
Namibian
DollarsLevel
19,648,166
(2010)19,500,000 26,513,418 27,680,008 27,680,008
OutcomeEtosha National Park gross revenue from
conservancy‐sourced concession fees
Namibian
DollarsLevel
0
(2010)330,000 330,000
Process
Value of signed contracts for
design/supervisory services for ENP
housing units/management structures
US Dollars Cumulative0
(2009)4,350,000 3,057,093 3,057,093 3,057,093 3,057,093
Process
Value disbursed against
design/supervisory contracts for ENP
housing units/management structures
US Dollars Cumulative0
(2009)700,000 1,800,000 2,200,000 3,025,570 3,025,570
Tourism Project
Multiple Activities
Activity: Improving Management and Infrastructure in Etosha National Park
Sub‐Activity: ENP Management Reform and Investment Promotion
Sub‐Activity: ENP Management Centres and Staff Housing
8 | Annex 2

Year 1 Year 2 Year 3 Year 4 Year 5
Oct‐2009 to Sep‐
2010
Oct‐2010 to Sep‐
2011
Oct‐2011 to Sep‐
2012
Oct‐2012 to Sep‐
2013
Oct‐2013 to Sep‐
2014
MCA Namibia M&E Plan
Annex 2: Table of Indicator Baselines and Targets
Indicator
LevelIndicator Name
Unit of
Measure
Indicator
Classification
Baseline
(year)
End of Compact
Target
Process
% disbursed against design/supervisory
contracts for ENP housing
units/management structures
Percentage Level 0%
(2009)16% 59% 72% 99% 99%
Process
Value of signed contracts for construction,
rehabilitation and equipment for ENP
housing units/management structures
US Dollars Cumulative0
(2009)30,865,708 30,865,708 30,865,708
Process
Value disbursed against construction,
rehabilitation and equipment contracts for
ENP housing units/management
structures
US Dollars Cumulative0
(2009)18,000,000 30,865,708 30,865,708
Process
% disbursed against construction,
rehabilitation and equipment contracts for
ENP housing units/management
structures
Percentage Level 0%
(2009)58% 100% 100%
ProcessGalton Gate Construction: Schedule
Performance Index (SPI)Number Level 1 1 1
ProcessGalton Gate Construction: Cost
Performance Index (CPI)Number Level 1 1 1
ProcessOmbika Gate Construction: Schedule
Performance Index (SPI)Number Level 1 1 1
ProcessOmbika Gate Construction: Cost
Performance Index (CPI)Number Level 1 1 1
OutputPercentage of housing structures
completedPercentage Cumulative
0%
(2009)100% 100%
Output Occupancy rate of new housing units Percentage Cumulative0%
(2009)100% 100%
Relevant indicators were not added in time (i.e., before their targets were already achieved) to be included in the M&E Plan.
Sub‐Activity: ENP Maintenance and Game Translocation Equipment
9 | Annex 2

Year 1 Year 2 Year 3 Year 4 Year 5
Oct‐2009 to Sep‐
2010
Oct‐2010 to Sep‐
2011
Oct‐2011 to Sep‐
2012
Oct‐2012 to Sep‐
2013
Oct‐2013 to Sep‐
2014
MCA Namibia M&E Plan
Annex 2: Table of Indicator Baselines and Targets
Indicator
LevelIndicator Name
Unit of
Measure
Indicator
Classification
Baseline
(year)
End of Compact
Target
OutputNorth American tourism businesses that
offer Namibian tours or tour packagesNumber Level
106
(2011)121 126 131 131
OutputNamibian travel trade business persons
trainedNumber Level
0
(2011)485 800 800
OutcomeLeisure tourist arrivals from the North
American marketNumber Level
17,246
(2010)15,258 15,715 15,715
OutcomeTourist arrivals from the North American
marketNumber Level
22,793
(2010)23,136 23,483 23,483
OutputDomestic and regional tourist routes
developed and marketed to the publicNumber Cumulative
0
(2009)2 3 3
Process Releases of NTB website completed Number Cumulative0
(2009)1 2 2 2 2 2
Output Unique visits on NTB website Number Level 125,685
(2010/2011)248,684 282,605 282,605
OutputUnique visits on NTB website from the
North American marketNumber Level
29,793
(2010/2011)38,714 40,649 40,649
Outcome Average time spent on the NTB website Seconds Level 249
(2010)
Outcome Registered users of the NTB website Number Level 560 1,739 1,976 1,976
Activity: Marketing Namibia in Tourism
Sub‐Activity: Destination Marketing North America
Sub‐Activity: Regional and Communal Tourism Products
Sub‐Activity: Interactive Website (includes NTB Website and Online Marketing)
10 | Annex 2

Year 1 Year 2 Year 3 Year 4 Year 5
Oct‐2009 to Sep‐
2010
Oct‐2010 to Sep‐
2011
Oct‐2011 to Sep‐
2012
Oct‐2012 to Sep‐
2013
Oct‐2013 to Sep‐
2014
MCA Namibia M&E Plan
Annex 2: Table of Indicator Baselines and Targets
Indicator
LevelIndicator Name
Unit of
Measure
Indicator
Classification
Baseline
(year)
End of Compact
Target
ProcessConservancy Needs Assessment
completedDate Date 31‐May‐10 31‐May‐10
ProcessValue of grants issued by the Conservancy
Development Support Grant Fund
Namibian
DollarsCumulative
0
(2010)10,037,706 36,017,651 59,045,329 59,045,329
OutputGame translocated to conservancies with
MCA‐N supportNumber Cumulative
0
(2009)445 1,305 2,135 2,135 2,135
OutputRare game translocated to conservancies
with MCA‐N support Number Cumulative
0
(2009)161 471 651 651 651
OutcomeAmount of new private sector investment
secured by MCA‐N‐assisted conservancies
Namibian
DollarsCumulative
0
(2009)20,000,000 33,000,000 40,000,000 40,000,000
Outcome New joint venture lodges or tented camps Number Cumulative0
(2009)5 8 12 12
OutcomeNew small tourism and natural resources
enterprises within conservanciesNumber Level
0
(2009)7 7 10 10
Outcome New jobs created in conservancies Number Level 0
(2009)60 120 120 120
Outcome
Annual General Meetings (AGMs) with
financial reports submitted & benefit
distribution plans discussed
Number Level 0
(2009)14 18 25 25
OutcomeMCA‐N grants aimed at mitigating human
wildlife conflictNumber Cumulative
0
(2009)4 6 8 8
OutcomeAnnual gross revenue to conservancies
receiving MCA assistance
Namibian
DollarsLevel
30,833,276
(2010)28,495,913 31,758,274 32,683,273 33,608,271 33,608,271
Outcome
Share of conservancy revenue paid out in
dividends and/ or spent on community
services
Percentage Level 21%
(2010)22% 23% 24% 24%
OutcomeMedian household income in
conservancies receiving MCA assistance
Namibian
DollarsLevel
5,450
(2011)TBD TBD
Activity: Ecotourism Development for Communal Conservancies
Sub‐Activity: Conservancy Support ‐ Needs Assessment
Sub‐Activity: Conservancy Support ‐ Ecotourism Development Packages
11 | Annex 2

Year 1 Year 2 Year 3 Year 4 Year 5
Oct‐2009 to Sep‐
2010
Oct‐2010 to Sep‐
2011
Oct‐2011 to Sep‐
2012
Oct‐2012 to Sep‐
2013
Oct‐2013 to Sep‐
2014
MCA Namibia M&E Plan
Annex 2: Table of Indicator Baselines and Targets
Indicator
LevelIndicator Name
Unit of
Measure
Indicator
Classification
Baseline
(year)
End of Compact
Target
ProcessRegistration Strategy and Implementation
Plan submitted Date Date 30‐Nov‐11 30‐Nov‐11
ProcessProcedures, Operations, and Systems
Report submittedDate Date 30‐Sep‐11 30‐Sep‐11
ProcessApproved procedure in place for securing/
registering group rightsDate Date 30‐Sep‐13 30‐Sep‐13
Output Group rights secured/registered Number Cumulative0
(2009)3 3
Output Legal and regulatory reforms adopted Number Cumulative0
(2009)2 9 9
Output Outreach events held Number Cumulative0
(2009)87 196 331 331
Output Stakeholders trained Number Cumulative0
(2009)500 600 1,776 1,936 1,936
OutputParcels corrected or incorporated in land
systemNumber Cumulative
0
(2009)7,307 10,807 10,807
Output Household land rights formalized Number Cumulative0
(2009)1,500 5,080 5,080
Process Selection of RIAs completed Date Date 31‐Jul‐10 31‐Jul‐10
Output Water infrastructure supported Number Level 0
(2009)68 68
Output Grazing areas doing combined herding Number Level 0
(2009)15 25 45 45
OutputGrazing areas with documented grazing
plan and mapNumber Level
0
(2009)15 25 45 45
OutputGrazing areas with documented plans for
changing herd compositionNumber Level
0
(2009)10 20 35 35
OutputGrazing areas with documented combined
management plansNumber Level
0
(2009)10 20 30 30
Agriculture Project
Activity: Land Access and Management
Sub‐Activity: Communal Land Support
Sub‐Activity: Community Based Rangeland and Livestock Management
12 | Annex 2
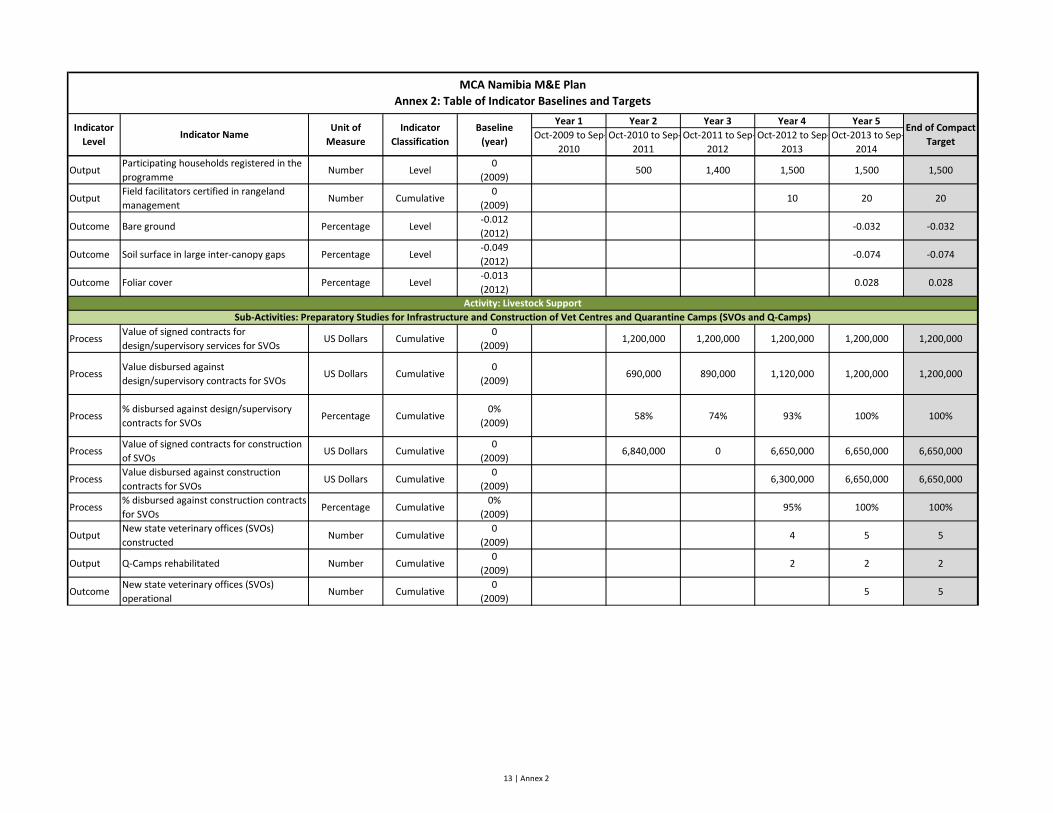
Year 1 Year 2 Year 3 Year 4 Year 5
Oct‐2009 to Sep‐
2010
Oct‐2010 to Sep‐
2011
Oct‐2011 to Sep‐
2012
Oct‐2012 to Sep‐
2013
Oct‐2013 to Sep‐
2014
MCA Namibia M&E Plan
Annex 2: Table of Indicator Baselines and Targets
Indicator
LevelIndicator Name
Unit of
Measure
Indicator
Classification
Baseline
(year)
End of Compact
Target
OutputParticipating households registered in the
programmeNumber Level
0
(2009)500 1,400 1,500 1,500 1,500
OutputField facilitators certified in rangeland
managementNumber Cumulative
0
(2009)10 20 20
Outcome Bare ground Percentage Level ‐0.012
(2012)‐0.032 ‐0.032
Outcome Soil surface in large inter‐canopy gaps Percentage Level ‐0.049
(2012)‐0.074 ‐0.074
Outcome Foliar cover Percentage Level ‐0.013
(2012)0.028 0.028
ProcessValue of signed contracts for
design/supervisory services for SVOsUS Dollars Cumulative
0
(2009)1,200,000 1,200,000 1,200,000 1,200,000 1,200,000
ProcessValue disbursed against
design/supervisory contracts for SVOsUS Dollars Cumulative
0
(2009)690,000 890,000 1,120,000 1,200,000 1,200,000
Process% disbursed against design/supervisory
contracts for SVOsPercentage Cumulative
0%
(2009)58% 74% 93% 100% 100%
ProcessValue of signed contracts for construction
of SVOsUS Dollars Cumulative
0
(2009)6,840,000 0 6,650,000 6,650,000 6,650,000
ProcessValue disbursed against construction
contracts for SVOsUS Dollars Cumulative
0
(2009)6,300,000 6,650,000 6,650,000
Process% disbursed against construction contracts
for SVOsPercentage Cumulative
0%
(2009)95% 100% 100%
OutputNew state veterinary offices (SVOs)
constructedNumber Cumulative
0
(2009)4 5 5
Output Q‐Camps rehabilitated Number Cumulative0
(2009)2 2 2
OutcomeNew state veterinary offices (SVOs)
operationalNumber Cumulative
0
(2009)5 5
Sub‐Activities: Preparatory Studies for Infrastructure and Construction of Vet Centres and Quarantine Camps (SVOs and Q‐Camps)
Activity: Livestock Support
13 | Annex 2

Year 1 Year 2 Year 3 Year 4 Year 5
Oct‐2009 to Sep‐
2010
Oct‐2010 to Sep‐
2011
Oct‐2011 to Sep‐
2012
Oct‐2012 to Sep‐
2013
Oct‐2013 to Sep‐
2014
MCA Namibia M&E Plan
Annex 2: Table of Indicator Baselines and Targets
Indicator
LevelIndicator Name
Unit of
Measure
Indicator
Classification
Baseline
(year)
End of Compact
Target
ProcessNamLITS 2.0 complete and fully
operationalDate Date 14‐Jun‐13 14‐Jun‐13
Output Cattle tagged with RFID tags Number Cumulative0
(2009)700,000 800,000 1,000,000 1,000,000
ProcessValue of grant agreements signed under
the Livestock Efficiency FundUS Dollars Cumulative
0
(2009)1,500,000 2,500,000 6,102,000 6,102,000 6,102,000
Process PPOs with signed service contract Number Cumulative0
(2009)13 15 40 60 60 60
ProcessValue of Primary Production Improvement
Grants signedUS Dollars Cumulative
0
(2009)20,000 40,000 120,000 180,000 200,000 200,000
OutputPPOs trained in organisational
managementNumber Cumulative
0
(2009)10 15 35 55 60 60
OutputPPOs trained in business and marketing
principlesNumber Cumulative
0
(2009)10 15 30 55 60 60
Output PPOs that have developed a business plan Number Cumulative0
(2009)13 20 40 48 48
Output
PPOs with resource
management/monitoring plans for
environmentally fragile INPs
Number Cumulative0
(2009)10 15 30 30 30
Output PPOs certified Number Cumulative0
(2009)2 2
Output Farmers trained Number Cumulative0
(2009)3,750 6,250 5,000 7,000 7,000 7,000
OutputINP producers who have been trained in
sustainable harvesting techniquesNumber Cumulative
0
(2009)750 1,250 1,250 1,250
Outcome Value‐added of INP processingNamibian
DollarsLevel
296,029
(2009)310,830 355,235 355,235
Outcome Payments to producers from INP salesNamibian
DollarsLevel
1,179,319
(2009)1,924,319 4,174,319 4,174,319
OutcomeMedian household income of INP
producers
Namibian
DollarsLevel
7,220
(2011)TBD TBD
Sub‐Activity: Livestock Traceability System
Sub‐Activity: Livestock Market Efficiency Fund
Activity: Indigenous Natural Products
Sub‐Activity: Producer and Processor Organisations (PPO) Capacity Building and Training
14 | Annex 2

Year 1 Year 2 Year 3 Year 4 Year 5
Oct‐2009 to Sep‐
2010
Oct‐2010 to Sep‐
2011
Oct‐2011 to Sep‐
2012
Oct‐2012 to Sep‐
2013
Oct‐2013 to Sep‐
2014
MCA Namibia M&E Plan
Annex 2: Table of Indicator Baselines and Targets
Indicator
LevelIndicator Name
Unit of
Measure
Indicator
Classification
Baseline
(year)
End of Compact
Target
ProcessValue of grant agreements signed under
the INP Innovation FundUS Dollars Cumulative
0
(2009)610,000 1,220,000 2,210,576 2,210,576 2,210,576
Process Organizational audit of IPTT completed Date Date 15‐Sep‐11 15‐Sep‐11
Sub‐Activity: Market Information Dissemination
Sub‐Activity: INP Innovation Fund
15 | Annex 2

Annex 3
This section documents substantive changes to the assumptions (starting with the
September 2012 revision) and summarizes all indicator, baseline, and target modifications
(from the first revision to date).
***
Changes to Assumptions
July 2014 The following change to the Assumptions table in section 9.1 was made in the July 2014 revision: Assumption Modification Form
Date July 2014
Project/Activity Agriculture/Development of INPs
Assumption • There are private and public sector actors interested in developing the INP sector.
Modification Type • Deletion of assumption.
Justification • This assumption is implied in other assumptions and is therefore not necessary.
June 2013 The following changes to the Assumptions table in section 9.1 were made in the June 2013 revision: Assumption Modification Form
Date June 2013
Project/Activity Education/Improving the Quality of General Education
Assumption
• Improved teacher housing will attract certified teachers to schools they otherwise would not teach in. Certified teachers provide higher quality teaching, which improves learning outcomes, which, in turn increases learners’ income over the long‐term.• With the manuals and training in school maintenance as a part of project activities, staff will have the capacity to maintain the physical learning environment. Material resources for school maintenance will be provided by the Namibian government through the yearly education budget.
Modification Type • Addition of assumptions.
Justification • To add relevant assumptions that are necessary (but not sufficient) conditionsfor the desired progress to be achieved.
Assumption Modification Form
Date June 2013
Project/Activity Education/Improving Access to and Management of Textbooks
Assumption • Textbook distribution will be equitable.

Modification Type • Addition of assumption.
Justification • To add a relevant assumption that is a necessary (but not sufficient) condition for the desired progress to be achieved.
Assumption Modification Form
Date June 2013
Project/Activity Education/Expanding Vocational and Skills Training
Assumption
• Training programs will be widely available (i.e., to all language/ethnic groups, both sexes, etc.). • Through Industry Skills Committees, private industry will be involved in determining high‐demand sectors and defining skills needs within those sectors.
Modification Type • Addition of assumption.
Justification • To add a relevant assumption that is a necessary (but not sufficient) condition for the desired progress to be achieved.
Assumption Modification Form
Date June 2013
Project/Activity Education/Cross‐Project Support (Support to HAMU)
Assumption • Consolidated and coordinated HIV/AIDS training will be more effective than a less‐coordinated approach.
Modification Type • Addition of assumption.
Justification • To add a relevant assumption that is a necessary (but not sufficient) condition for the desired progress to be achieved.
Assumption Modification Form
Date June 2013
Project/Activity Tourism/Conservancy Development Support
Assumption
• Training and technical assistance to conservancy committees and managers result in sustainable improvements in governance, tourism management and business skills development for the wider conservancy; conservancies will have a transition plan in the event of a change in conservancy leadership. • Women members of conservancies will be included in conservancy management
Modification Type • Addition of assumptions.
Justification • To add relevant assumptions that are necessary (but not sufficient) conditions for the desired progress to be achieved.
Assumption Modification Form
Date June 2013
Project/Activity Agriculture/Land Access and Management
Assumption • There is political will within GRN to accept and implement recommended policy reforms.
Modification Type • Addition of assumption.
Justification • To add a relevant assumption that is a necessary (but not sufficient) condition for the desired progress to be achieved.

September 2012 The following changes to the Assumptions table in section 9.1 were made in the September 2012 revision: Assumption Modification Form
Date September 2012
Project/Activity Agriculture/Land Access and Management
Assumption Sufficient water infrastructure is in place to foster participation in the CBRLM sub‐activity.
Modification Type • Addition of assumption.
Justification • To add a relevant assumption that is a necessary (but not sufficient) condition for the desired progress to be achieved.
Assumption Modification Form
Date September 2012
Project/Activity Agriculture/Land Access and Management
Assumption Livestock health/condition is highly dependent on rangeland quality and rangeland condition.
Modification Type • Addition of assumption.
Justification • To add a relevant assumption that is a necessary (but not sufficient) condition for the desired progress to be achieved.
Assumption Modification Form
Date September 2012
Project/Activity Agriculture/Land Access and Management
Assumption Improved rangeland management and livestock health will not motivate farmers to increase their livestock herd size.
Modification Type • Deletion of assumption.
Justification
• To remove an assumption that does not need to hold in order for the desired progress to be achieved. Farmers may increase (or decrease) their herds as a result of the intervention but, as long as herd size decision are informed by the resource base, the outcomes of interest are not at risk.
Assumption Modification Form
Date September 2012
Project/Activity Agriculture/Livestock Support
Assumption Tagging cattle will be recognized by the World Organisation for Animal Health as an important step towards achieving disease‐free status in the NCAs.
Modification Type
• Change of assumption to “Traceability will be implemented by the Government of the Republic of Namibia and recognized by the World Organisation for Animal Health as an important step towards achieving disease‐ free status in the NCAs.”
Justification
• To highlight that traceability as a whole (of which tagging is only one component) has to be implemented and recognition given by the World Organisation for Animal Health (note that this recognition will likely not happen within the Compact period but MCA‐N’s intervention is contributing to its achievement) in order for the long‐term outcomes of interest to be achieved.
Assumption Modification Form
Date September 2012
Project/Activity Agriculture/Land Access and Management
Assumption A constraint to increased marketing and off‐take of livestock is lack of disease‐free status and marketing opportunities, and this constraint can be addressed

through specific interventions that increase the efficiency of the marketing process.
Modification Type
• Change of assumption to “A constraint to increased marketing and off‐take of livestock is lack of marketing opportunities, and this constraint can be addressed through specific interventions that increase the efficiency of the marketing process.”
Justification
• To correct the mistaken assumption that disease‐free status is a necessary condition for the achievement of the outcomes of interest. Even in the absence of disease‐free status being granted in the NCAs, increased marketing and off‐take of livestock can be achieved if the marketing opportunities exist.
***
Changes to Indicators
July 2014 In the July 2014 iteration of the M&E Plan, the changes made to the indicator information tables mainly focused on:
refining, correcting, or otherwise adjusting indicator information based on data quality reviews and other new information.
In addition to the revisions reflected in the below indicator modification forms, Annex 1 notes that were no longer applicable or otherwise not useful were deleted. Note that indicators highlighted in red are MCC Common Indicators15.
Education Project Indicators Multiple Activities Indicator Modification Form
Date July 2014
Project/Activity Education/Multiple Activities
Indicator % disbursed of educational facility construction, rehabilitation, and equipping contracts
Modification Type • Change indicator classification from “Cumulative” to “Level”.
Justification • To avoid double‐counting issue in MCC MIS when figures are entered as cumulative.
Improving the Quality of General Education (sub‐activity: Improving the Quality of Education in Schools (47 schools)) Indicator Modification Form
Date July 2014
Project/Activity Education/ Improving the Quality of General Education (sub‐activity: Improving the Quality of Education in Schools (47 schools))
Indicator % disbursed against construction, rehabilitation and equipment contracts for 47 schools
Modification Type • Change indicator classification from “Cumulative” to “Level”.
Justification • To avoid double‐counting issue in MCC MIS when figures are entered as cumulative.
15 See MCC’s Guidance on Common Indicators, May 2012, Version 1.0.

Indicator Modification Form
Date July 2014
Project/Activity Education/ Improving the Quality of General Education (sub‐activity: Improving the Quality of Education in Schools (47 schools))
Indicator % disbursed against design/supervisory contracts for 47 schools
Modification Type • Change indicator classification from “Cumulative” to “Level”.
Justification • To avoid double‐counting issue in MCC MIS when figures are entered as cumulative.
Indicator Modification Form
Date July 2014
Project/Activity Education/Improving the Quality of General Education (sub‐activity: Improving the Quality of Education in Schools (47 schools))
Indicator Education facilities constructed, rehabilitated, equipped in the 47 school sub‐activity
Modification Type • Adjustment of Year 5 target value, per table below.
Justification
• To reflect the expanded scope of implementation back to 47 schools. In the March 2012 M&E Plan revision, the target was set at 45 because MCA‐N was not going to intervene at Max Makushe and Okahandja Secondary anymore, but later a decision was made for them to receive support (for Max Makushe, that support took the form of 6 new classrooms plus equipment while Okahandja received equipment).
Indicator Unit Baseline Year 1 Year 2 Year 3 Year 4 Year 5
Previous
Education facilities…
16
# 0 13 23 45 45
Modified
Education facilities…17
# 0 0 13 23 45 47
Indicator Modification Form
Date July 2014
Project/Activity Education/Improving the Quality of General Education (sub‐activity: Improving the Quality of Education in Schools (47 schools))
Indicator Learners (any level) participating in the 47 schools sub‐activity
Modification Type
• Adjustment of the baseline.• Modification of targets.
Justification
• To reflect the current reality that some schools where MCA‐N is intervening split during the Compact period and therefore figures of learners participating in those schools have to be adjusted to only take into account the schools where MCA‐N is intervening. This is also in line with the Data Quality Review team’s finding in their Round 3 bi‐annual review.
• To reflect the reality that the targets should be reviewed given the adjustment of the baseline. The basis for setting the original targets was never documented; however, since the indicator is linked to the ERR for this Activity, these targets were aligned with enrolment projections in the ERR.
Indicator Unit Baseline Year 1 Year 2 Year 3 Year 4 Year 5
Original
Learners…18 Number 27,936 27,936 27,936 28,436 29,436 30,561
16 Education facilities constructed, rehabilitated, equipped in the 47 schools sub‐activity 17 Education facilities constructed, rehabilitated, equipped in the 47 schools sub‐activity 18 Learners (any level) participating in the 47 schools sub‐activity

(2009)
Modified
Learners …19 Number 26,857(2009)
26,857
26,857
27,861 28,393 28,947
Improving the Quality of General Education (sub‐activity: Policy, Operational and Administrative Support) Indicator Modification Form
Date July 2014
Project/Activity Education/Improving the Quality of General Education (sub‐activity: Policy, Operational and Administrative Support)
Indicator
Educators trained in instructional leadership, defined as “The number of school leaders (notably inspectors of education, heads of departments, advisory teachers, cluster centre heads and school principals) who are trained in all three sessions of school leadership training offered under the instructional leadership consultancy.” (unit: #; level: output; classification: cumulative; source: Instructional Leadership Consultant reports; responsible party: Instructional Leadership Consultant; frequency: Quarterly; baseline: 0 (2009); targets: n/a (Year 1), n/a (Year 2), n/a (Year 3), n/a (Year 4), 50 (Year 5)) (Note that the target was set based on the plans at inception, as reflected in the Inception Report by the Instructional Leadership consultant.)
Modification Type • Addition of indicator.
Justification • To track implementation of the support to the Ministry of Education for instructional leadership which, if well absorbed, could have a notable impact on educational outcomes in Namibia.
Vocational Education and Skills Training (sub‐activity: Competitive Grants for High Priority Vocational Skills Training) Indicator Modification Form
Date July 2014
Project/Activity Education/Vocational Education and Skills Training (sub‐activity: Competitive Grants for High Priority Vocational Skills Training)
Indicator Enrolment in vocational/skills training
Modification Type • Deletion of indicator.
Justification • To comply with the Data Quality Review Team’s Round 3 Bi‐Annual Review recommendation that the indicator is not fit for purpose and should be dropped.
Indicator Modification Form
Date July 2014
Project/Activity Education/Vocational and Skills Training (sub‐activity: Competitive Grants for High Priority Vocational Skills Training)
Indicator Average gross monthly income of VTGF trainees.
Modification Type
• Provision of target values for Year 5 as per table below.
19 Learners (any level) participating in the 47 schools sub‐activity

Justification
• To provide target value for Year 5 in the interests of transparency and accountability. The Year 5 target value is estimated as a future value (FV) of the average gross monthly income in Year 5. It is calculated as: FV = BV*[1+(i/n)]n where BV is the baseline year average gross monthly income, is the incremental rate calculated as (mpoti‐mprti)/(mprti) where mpoti is monthly post‐training income, if employed, and mprti is monthly pre‐training income, if employed (based on the MCC‐estimated ERR calculations) for given monthly periods n. The Year 5 target for average gross monthly income thus calculated as: 1,866*[1+((2,756‐1,925)/1,925)/24)]24, = 2,862.
Indicator Unit Baseline Year 1 Year 2 Year 3 Year 4 Year 5
Previous
Average…20 Namibian Dollars
1,866(2012)
TBD
Modified
Average…21 Namibian Dollars
1,866(2012)
2,862 (2014)
Vocational Education and Skills Training (sub‐activity: Construction and Upgrading of 9 Community Skills and Development Centres)
Indicator Modification Form
Date July 2014
Project/Activity Education/Vocational Education and Skills Training (sub‐activity: Construction and Upgrading of 9 Community Skills and Development Centres)
Indicator % disbursed against construction, rehabilitation and equipment contracts for COSDECs
Modification Type
• Change indicator classification from “Cumulative” to “Level”.
Justification • To avoid double‐counting issue in MCC MIS when figures are entered as cumulative.
Investment in Regional Study and Resource Centres (sub‐activity: Construction of RSRCs) Indicator Modification Form
Date July 2014
Project/Activity Education/Investment in Regional Study and Resource Centres (sub‐activity: Construction of RSRCs)
Indicator % disbursed against design/supervisory contracts for RSRCs
Modification Type • Change indicator classification from “Cumulative” to “Level”.
Justification • To avoid double‐counting issue in MCC MIS when figures are entered as cumulative.
20 Average gross monthly income of VTGF trainees. 21 Average gross monthly income of VTGF trainees.
Indicator Modification Form
Date July 2014
Project/Activity Education/Vocational Education and Skills Training (sub‐activity: Construction and Upgrading of 9 Community Skills and Development Centres)
Indicator % disbursed against design/supervisory contracts for COSDECs
Modification Type
• Change indicator classification from “Cumulative” to “Level”.
Justification • To avoid double‐counting issue in MCC MIS when figures are entered as cumulative.

Indicator Modification Form
Date July 2014
Project/Activity Education/Investment in Regional Study and Resource Centres (sub‐activity: Construction of RSRCs)
Indicator % disbursed against construction, rehabilitation and equipment contracts for RSRCs
Modification Type • Change indicator classification from “Cumulative” to “Level”.
Justification • To avoid double‐counting issue in MCC MIS when figures are entered as cumulative.
Tourism Project Indicators Improving Management and Infrastructure in Etosha National Park (sub‐activity: ENP Management Centres and Staff Housing) Indicator Modification Form
Date July 2014
Project/Activity Tourism/Improving Management and Infrastructure in Etosha National Park (sub‐activity: ENP Management Centres and Staff Housing)
Indicator % disbursed against design/supervisory contracts for ENP housing units/management structures
Modification Type • Change indicator classification from “Cumulative” to “Level”.
Justification • To avoid double‐counting issue in MCC MIS when figures are entered as cumulative.
Indicator Modification Form
Date July 2014
Project/Activity Tourism/Improving Management and Infrastructure in Etosha National Park (sub‐activity: ENP Management Centres and Staff Housing)
Indicator % disbursed against construction, rehabilitation and equipment contracts for ENP housing units/management structures
Modification Type • Change indicator classification from “Cumulative” to “Level”.
Justification • To avoid double‐counting issue in MCC MIS when figures are entered as cumulative.
Marketing Namibia in Tourism (sub‐activity: Interactive Website (includes NTB Website and Online Marketing)) Indicator Modification Form
Date July 2014
Project/Activity Tourism/Marketing Namibia in Tourism (sub‐activity: Interactive Website)
Indicator Unique visits on NTB website from the North American market
Modification Type • Change indicator level from “Outcome” to “Output”.
Justification • To accurately reflect the level of the indicator.
Agriculture Project Indicators Land Access and Management (sub‐activity: Communal Land Support) Indicator Modification Form
Date July 2014
Project/Activity Agriculture/Land Access and Management (sub‐activity: CLS)
Indicator Household land rights formalized
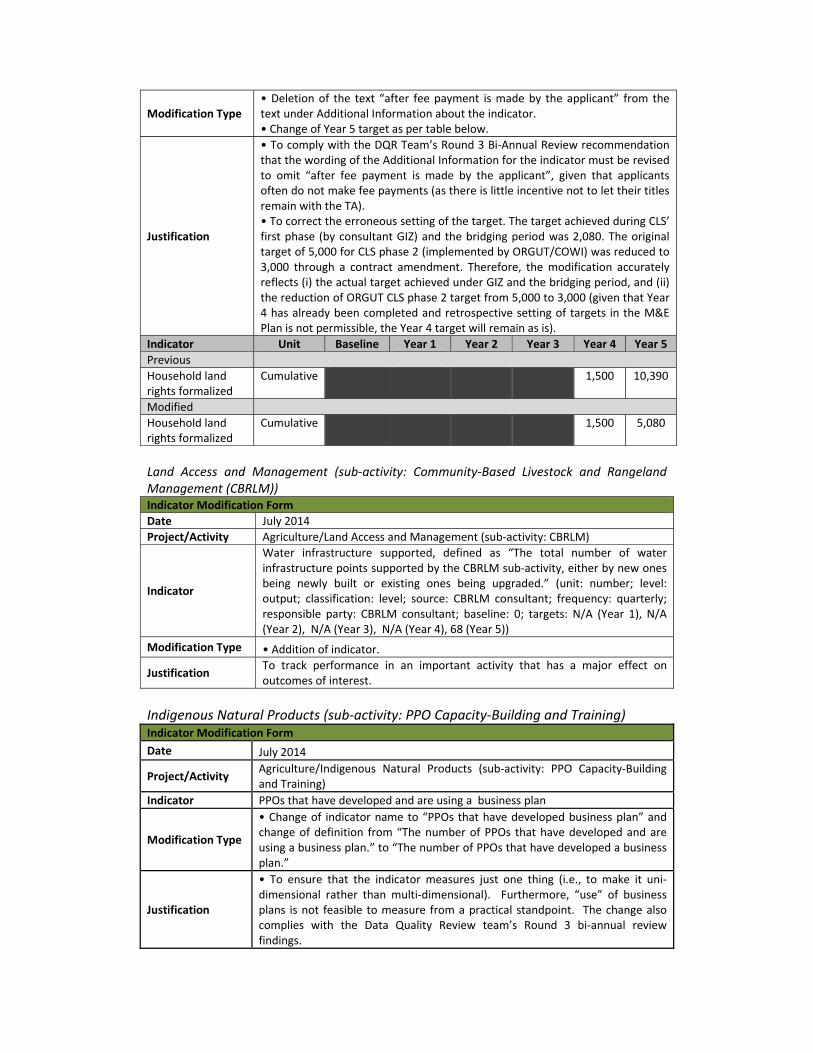
Modification Type • Deletion of the text “after fee payment is made by the applicant” from the text under Additional Information about the indicator. • Change of Year 5 target as per table below.
Justification
• To comply with the DQR Team’s Round 3 Bi‐Annual Review recommendation that the wording of the Additional Information for the indicator must be revised to omit “after fee payment is made by the applicant”, given that applicants often do not make fee payments (as there is little incentive not to let their titles remain with the TA). • To correct the erroneous setting of the target. The target achieved during CLS’ first phase (by consultant GIZ) and the bridging period was 2,080. The original target of 5,000 for CLS phase 2 (implemented by ORGUT/COWI) was reduced to 3,000 through a contract amendment. Therefore, the modification accurately reflects (i) the actual target achieved under GIZ and the bridging period, and (ii) the reduction of ORGUT CLS phase 2 target from 5,000 to 3,000 (given that Year 4 has already been completed and retrospective setting of targets in the M&E Plan is not permissible, the Year 4 target will remain as is).
Indicator Unit Baseline Year 1 Year 2 Year 3 Year 4 Year 5
Previous
Household land rights formalized
Cumulative 1,500 10,390
Modified
Household land rights formalized
Cumulative 1,500 5,080
Land Access and Management (sub‐activity: Community‐Based Livestock and Rangeland Management (CBRLM)) Indicator Modification Form
Date July 2014
Project/Activity Agriculture/Land Access and Management (sub‐activity: CBRLM)
Indicator
Water infrastructure supported, defined as “The total number of water infrastructure points supported by the CBRLM sub‐activity, either by new ones being newly built or existing ones being upgraded.” (unit: number; level: output; classification: level; source: CBRLM consultant; frequency: quarterly; responsible party: CBRLM consultant; baseline: 0; targets: N/A (Year 1), N/A (Year 2), N/A (Year 3), N/A (Year 4), 68 (Year 5))
Modification Type • Addition of indicator.
Justification To track performance in an important activity that has a major effect onoutcomes of interest.
Indigenous Natural Products (sub‐activity: PPO Capacity‐Building and Training) Indicator Modification Form
Date July 2014
Project/Activity Agriculture/Indigenous Natural Products (sub‐activity: PPO Capacity‐Building and Training)
Indicator PPOs that have developed and are using a business plan
Modification Type
• Change of indicator name to “PPOs that have developed business plan” and change of definition from “The number of PPOs that have developed and are using a business plan.” to “The number of PPOs that have developed a business plan.”
Justification
• To ensure that the indicator measures just one thing (i.e., to make it uni‐dimensional rather than multi‐dimensional). Furthermore, “use” of business plans is not feasible to measure from a practical standpoint. The change also complies with the Data Quality Review team’s Round 3 bi‐annual review findings.

10 | Annex 3
June 2013 In the June 2013 iteration of the M&E Plan, the changes made to the indicator information tables focused on:
almost completely eliminating TBDs;
refining, correcting, or otherwise adjusting indicator information (including but not limited to indicator names and definitions, and baseline and target values) based on data quality reviews, new information, and changing realities on the ground; and
adding indicators on the basis of gaps in the program logic/results chain and as components of activities becoming better defined.
In addition to the revisions reflected in the below indicator modification forms, Annex 1 notes that were no longer applicable or otherwise not useful were deleted. Note that indicators highlighted in red are MCC Common Indicators22.
Education Project Indicators Improving the Quality of General Education (sub‐activity: Improving the Quality of Education in Schools (47 schools)) Indicator Modification Form
Date June 2013
Project/Activity Education/Improving the Quality of General Education (sub‐activity: Improving the Quality of Education in Schools (47 schools))
Indicator
% of schools with positions filled to teach Information, Communication and Technology (ICT) Literacy, defined as “Percentage of MCA‐N‐supported schools with temporary or permanent teachers hired to teach ICT Literacy at schools where ICT facilities/equipment are provided by MCA‐N.” (unit: %; level: output; classification: level; source: MoE IPA reports; responsible party: MoE; frequency: quarterly; baseline: 0 (2009); targets: n/a (year 1), n/a (Year 2), n/a (Year 3), 100% (Year 4), 100% (Year 5))
Modification Type • Addition of indicator.
Justification
• Though MCA‐N does not have direct control over school staffing levels, it is of interest to track the ICT teaching staff levels for the schools which are provided with computer equipment (all MCA‐N‐assisted schools are targeted to receive ICT equipment) to ensure appropriate deployment of the investment and to help assure that the desired outcomes are achieved.
Indicator Modification Form
Date June 2013
Project/Activity Education/Improving the Quality of General Education (sub‐activity: Improving the Quality of Education in Schools (47 schools))
Indicator Learners (any level) participating in the 47 schools sub‐activity
Modification Type
• Change of definition from “The number of learners enrolled or participating in educational programs in the 47 schools” to “The number of learners enrolled or participating in educational programs in the 47 schools plus any new schools that split from the original schools and are co‐located.”
Justification • To ensure a consistent base from which to track the change in enrolment that is associated with the support from MCA‐N.
22 See MCC’s Guidance on Common Indicators, May 2012, Version 1.0.

11 | Annex 3
Indicator Modification Form
Date June 2013
Project/Activity Education/Improving the Quality of General Education (sub‐activity: Improving
the Quality of Education in Schools (47 schools))
Indicator Teacher qualification – 47 schools
Modification Type
• Change of definition from “% of teachers in the 47 schools who have a
teacher qualification of Code 4, 5, or 6 for Professional Qualification in the
Annual Education Census” to “% of teachers (in the 47 schools plus any new
schools that split from the original schools and are co‐located) who have a
teacher qualification of Code 4, 5, or 6 for Professional Qualification in the
Annual Education Census.”
Justification • To ensure a consistent base from which to track the change in teacher
qualifications that is associated with the support from MCA‐N.
Indicator Modification Form
Date June 2013
Project/Activity Education/Improving the Quality of General Education (sub‐activity: Improving the Quality of Education in Schools (47 schools))
Indicator Pass rate of NSSC learners (grade 12) – Science – 47 schools
Modification Type
• Change of definition from “The percentage of learners achieving D or better in ordinary level Physical and Life Science (at the 9 of the 47 schools that include 12th grade)” to “The percentage of learners achieving D or better in ordinary level Physical Science (at the 9 of the 47 schools that include 12th grade).”
Justification • To reflect the reality that schools do not offer Life Science in grade 12.
Improving the Quality of General Education (sub‐activity: Policy, Operational, and Administrative Support (to MoE)) Indicator Modification Form
Date June 2013
Project/Activity Education/Improving the Quality of General Education (sub‐activity: Policy, Operational, and Administrative Support (to MoE))
Indicator Textbook procurement process reformed
Modification Type
• Change of definition from “Textbook procurement unit is in place, staff oriented, textbook policy is reviewed and the system declared ready to be tested with the procurement of MCA‐N’s second tranche of textbooks” to “Textbook procurement unit is in place, staff oriented, textbook policy is reviewed and the system partially tested with the procurement of MCA‐N’s third tranche of textbooks.”
Justification
• To reflect the reality that the system was not tested with the second tranche of textbooks. In fact, not even the third tranche of textbooks will fully test the system as the system will not be considered tested and successfully reformed until MoE uses it from beginning to end to successfully procure and deliver textbooks, which will only happen post‐Compact. In the third tranche, MCA‐N support will provide for the procurement of the books and their delivery to the regions from where MoE will have to deliver them to schools; therefore, only part of the system (i.e., where MoE steps in to implement) is truly being tested, thus the “partially” in the definition.
Indicator Modification Form
Date June 2013
Project/Activity Education/Improving the Quality of General Education (sub‐activity: Policy, Operational, and Administrative Support (to MoE))

12 | Annex 3
Indicator
Regions where Master Trainers have been trained, defined as “The number of regions where CPD Master Trainers have been trained and thus capacitated to implement training programs (a key measure of whether the CPDCCs are operating properly).” (unit: #; level: output; classification: cumulative; source: CPD unit; responsible party: UNAM; frequency: quarterly; baseline: 0 (2009); targets: n/a (Year 1), n/a (Year 2), n/a (Year 3), 3 (Year 4), 13 (Year 5))
Modification Type • Addition of indicator.
Justification • To track whether the regional CPDCCs are capacitated to operate properly, which is the underlying reason why they have so far not been doing so.
Improving the Quality of General Education (sub‐activity: Equipment for the Colleges of Education (CoEs)2) Indicator Modification Form
Date June 2013
Project/Activity Education/Improving the Quality of General Education (sub‐activity: Equipment for the Colleges of Education))
Indicator Value of science teaching equipment delivered
Modification Type • Change of targets per the table below
Justification • To correct erroneous data.
Indicator Unit Baseline Year 1 Year 2 Year 3 Year 4 Year 5
Previous
Value of…23 US
Dollars 0
(2009) 306,890 306,890
Modified
Value of…24 US
Dollars 0
(2009) 164,200 275,223
Vocational and Skills Training (sub‐activity: Establishment of NTF) Indicator Modification Form
Date June 2013
Project/Activity Education/Vocational and Skills Training (sub‐activity: Establishment of NTF)
Indicator % of NTF levy funds collected that are awarded as vocational training grants
Modification Type
• Change of indicator name from “% of NTF levy funds collected that are awarded as vocational training grants” to “% of NTF levy funds collected that are awarded for skills training and related improvement of training facilities and equipment.” • Change of definition from “The value of NTF levy funds collected that are awarded expressed as a proportion of the total value of levy funds collected. The calculation is done by dividing the value of vocational training grant funds awarded from the NTF by the total value of levy funds collected and expressing the resultant proportion as a percentage” to “The value of NTF levy funds collected for skills training and related improvement of training facilities and equipment that are awarded expressed as a proportion of the total value of levy funds collected. The calculation is done by dividing the value of NTF levy funds collected that are awarded for skills training and related improvement of training facilities and equipment by the total value of levy funds collected and expressing the resultant proportion as a percentage.” • Addition of note to Annex 1 stating that “The Year 5 target for this indicator is no longer considered attainable during the Compact period, given delays in implementation. However, it could not be changed as delays in implementation are not included in the 4 reasons laid out in MCC’s M&E Policy that justify changing end‐Compact targets. And given that M&E will continue post‐Compact,
23 Value of science teaching equipment delivered 24 Value of science teaching equipment delivered

13 | Annex 3
we are able to continue monitoring when or whether the end of Compact target is ultimately reached.” • Removal of Year 4 target as per the table below.
Justification
• To reflect that the indicator is tracking all skills training and not only vocational training. • To be consistent with the revised indicator name and similarly reflect that the indicator is tracking all skills training and not only vocational training. • To explain why a target that is no longer considered attainable is being maintained in the M&E Plan. •To reflect the fact that the levy will not be operational (and thus not collecting funds and awarding grants) in Year 4. Given delays in implementation, it may not even be operational until late into Year 5.
Indicator Unit Baseline Year 1 Year 2 Year 3 Year 4 Year 5
Previous
% of NTF…25 % 0 20 80
Modified
% of NTF…26 % 0 80
Indicator Modification Form
Date June 2013
Project/Activity Education/Vocational and Skills Training (sub‐activity: Establishment of NTF)
Indicator Vocational trainees assisted from the NTF levy
Modification Type
• Notation of “Sex” under the Disaggregation column in Annex 1. • Addition of note to Annex 1 stating that “The Year 5 target for this indicator is no longer considered attainable during the Compact period, given delays in implementation. However, it could not be changed as delays in implementation are not included in the 4 reasons laid out in MCC’s M&E Policy that justify changing end‐Compact targets. And given that M&E will continue post‐Compact, we are able to continue monitoring when or whether the end of Compact target is ultimately reached.”
Justification • To denote that this indicator will be disaggregated by sex.• To explain why a target that is no longer considered attainable is being maintained in the M&E Plan.
Indicator Modification Form
Date June 2013
Project/Activity Education/Vocational and Skills Training (sub‐activity: Establishment of NTF)
Indicator Compliance rate for NTF levy
Modification Type
• Change of primary data source from “Collecting Agency” to “NTA”. • Change of reporting frequency from “Annual (starting in Year 4)” to “Annual (starting in Year 5)”. • Addition of note to Annex 1 stating that “The Year 5 target for this indicator is no longer considered attainable during the Compact period, given delays in implementation. However, it could not be changed as delays in implementation are not included in the 4 reasons laid out in MCC’s M&E Policy that justify changing end‐Compact targets. And given that M&E will continue post‐Compact, we are able to continue monitoring when or whether the end of Compact target is ultimately reached.” • Removal of Year 4 target as per the table below.
25 % of NTF levy funds collected that are awarded as vocational training grants 26 % of NTF levy funds collected that are awarded for skills training
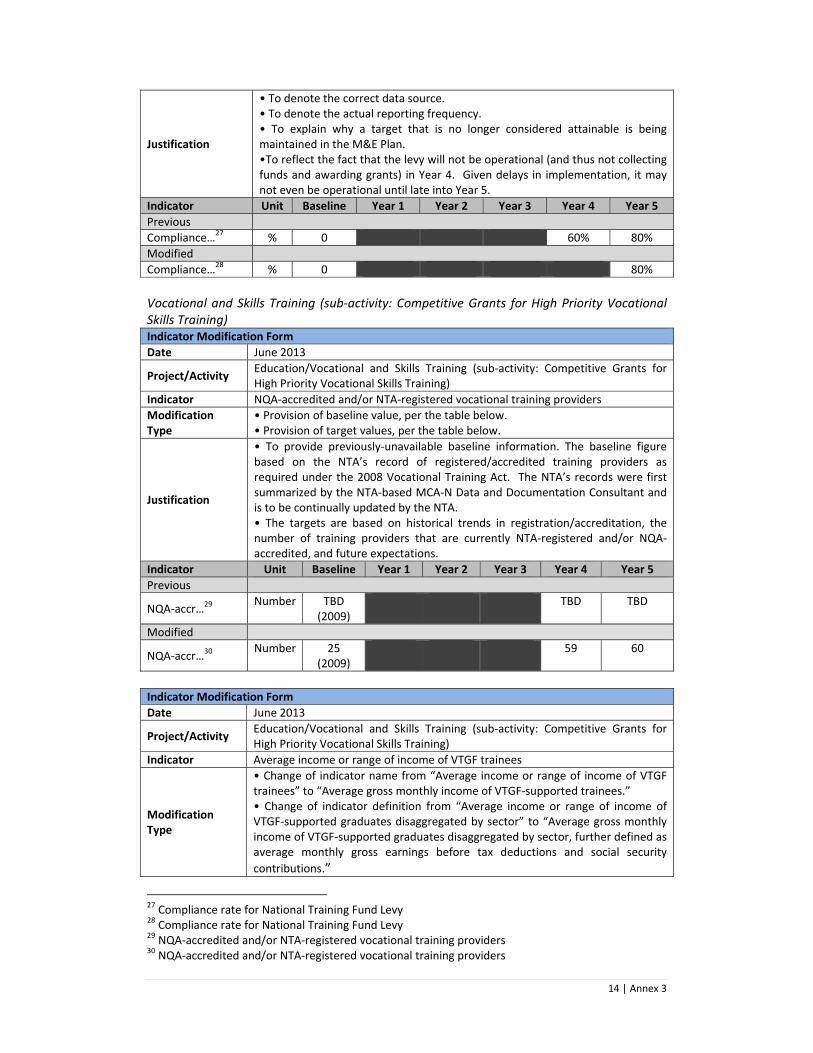
14 | Annex 3
Justification
• To denote the correct data source.• To denote the actual reporting frequency. • To explain why a target that is no longer considered attainable is being maintained in the M&E Plan. •To reflect the fact that the levy will not be operational (and thus not collecting funds and awarding grants) in Year 4. Given delays in implementation, it may not even be operational until late into Year 5.
Indicator Unit Baseline Year 1 Year 2 Year 3 Year 4 Year 5
Previous
Compliance…27 % 0 60% 80%
Modified
Compliance…28 % 0 80%
Vocational and Skills Training (sub‐activity: Competitive Grants for High Priority Vocational Skills Training) Indicator Modification Form
Date June 2013
Project/Activity Education/Vocational and Skills Training (sub‐activity: Competitive Grants for High Priority Vocational Skills Training)
Indicator NQA‐accredited and/or NTA‐registered vocational training providers
Modification Type
• Provision of baseline value, per the table below.• Provision of target values, per the table below.
Justification
• To provide previously‐unavailable baseline information. The baseline figure based on the NTA’s record of registered/accredited training providers as required under the 2008 Vocational Training Act. The NTA’s records were first summarized by the NTA‐based MCA‐N Data and Documentation Consultant and is to be continually updated by the NTA. • The targets are based on historical trends in registration/accreditation, the number of training providers that are currently NTA‐registered and/or NQA‐accredited, and future expectations.
Indicator Unit Baseline Year 1 Year 2 Year 3 Year 4 Year 5
Previous
NQA‐accr…29 Number TBD
(2009) TBD TBD
Modified
NQA‐accr…30 Number 25
(2009) 59 60
Indicator Modification Form
Date June 2013
Project/Activity Education/Vocational and Skills Training (sub‐activity: Competitive Grants for High Priority Vocational Skills Training)
Indicator Average income or range of income of VTGF trainees
Modification Type
• Change of indicator name from “Average income or range of income of VTGF trainees” to “Average gross monthly income of VTGF‐supported trainees.” • Change of indicator definition from “Average income or range of income of VTGF‐supported graduates disaggregated by sector” to “Average gross monthly income of VTGF‐supported graduates disaggregated by sector, further defined as average monthly gross earnings before tax deductions and social security
contributions.”
27 Compliance rate for National Training Fund Levy 28 Compliance rate for National Training Fund Levy 29 NQA‐accredited and/or NTA‐registered vocational training providers 30 NQA‐accredited and/or NTA‐registered vocational training providers

15 | Annex 3
• Addition of note in Annex 1, explaining that “The baseline figure reflects all of the training cohorts to date, i.e. 2011 to 2013. However, 2012 remains as the documented baseline year since multiple years cannot be supported by MCC’s MIS into which this information is uploaded.” • Provision of baseline value, as per the table below.
Justification
• To precisely name the indicator so it accurately reflects the result being measured. • To precisely define the indicator so it accurately reflects the result being measured. • To clarify which years the baseline data were drawn from. • To lay out the previously‐unavailable baseline value. The baseline figure was provided by the Tracer Survey of Qualified Vocational Training Applicants Consultant. It was calculated from primary data collected from VTGF‐supported trainees through an ongoing tracer survey. More details on how the baseline was calculated: In the tracer survey questionnaire, for question D.1731, enumerators ask respondents for their income range as some respondents are reluctant to provide their exact income. In order to calculate the average income for the purposes of this M&E Plan, the midpoints of those ranges were applied. For the highest range category, the maximum wage of NAD5,000 was used for the estimation as there is no midpoint value; the selection of this value was further informed by a study conducted by Jauch, H. & Muchena, (2011)32 that reported that the monthly salaries of the majority of Namibian workers range between NAD1,000 and NAD5,000, thus making NAD5,000 a reasonable maximum for the population of interest.
Indicator Unit Baseline Year 1 Year 2 Year 3 Year 4 Year 5
Previous
Average…33 Namibian Dollars
TBD(2012)
TBD TBD
Modified
Average…34 Namibian Dollars
1,866(2012)
TBD
Vocational and Skills Training (sub‐activity: COSDECs Management training) Indicator Modification Form
Date June 2013
Project/Activity Education/Vocational and Skills Training (sub‐activity: COSDECs Management training)
Indicator COSDEC staff trained in management
Modification Type
• Change the indicator definition from “The number of COSDEC staff who participates in management training” to “The number of individual COSDEC management staff who participate in one or more management training modules delivered by the COSDEC Strategic Planning Support consultant.” • Addition of a note in Annex 1 stating that “COSDEC management staff includes personnel in the following positions at each COSDEC: Head of Center, SME Coordinator, OPS Manager, Finance and Administration Manager and Support Manager who has oversight responsibilities for the COSDECs. The training modules offered include the following: Pre‐Assessment of Trainees, Annual Work Planning, Activity Based Budgeting, Service Level Agreements, Minimum Standards, and Job Profiling and Assessment.”
Justification •Both changes are intended to clarify who the target of the intervention is and
31 “What is your average current monthly gross income (across all jobs/for your job)?” 32 Jauch, H. & Muchena, D. (2011), Eds. Tearing Us Apart: Inequalities in Southern Africa. Johannesburg: Open Society for Southern Africa, p. 360. 33 Average income or range of income of VTGF trainees 34 Average gross monthly income of VTGF‐supported trainees

16 | Annex 3
at what point they are considered to be “trained”.
Improving Access to and Management of Adequate Textbooks (sub‐activities: Procurement of Priority and General Textbooks) Indicator Modification Form
Date June 2013
Project/Activity Education/Improving Access to and Management of Adequate Textbooks (sub‐activities: Procurement of Priority and General Textbooks)
Indicator Textbooks delivered
Modification Type • Provision of target for Year 5, per below table.
Justification • To reflect the target for Year 5, which is based on the estimated number of books that can be procured given the need and the available budgetary provision.
Indicator Unit Baseline Year 1 Year 2 Year 3 Year 4 Year 5
Previous
Textbooks…35 Number 0
(2009) 695,164 695,164 695,164 695,164 TBD
Modified
Textbooks…36 Number
0(2009)
695,164 695,164 695,164 695,164 1,300,000
Investment in Regional Study and Resource Centers (sub‐activity: Construction of RSRCs) Indicator Modification Form
Date June 2013
Project/Activity Education/Investment in Regional Study and Resource Centers (sub‐activity: Construction of RSRCs)
Indicator RSRCs completed and opened for visitors
Modification Type
• Change of indicator name from “RSRCs completed and opened for visitors” to “RSRCs completed.” •Change of indicator definition from “The number of RSRCs open to visitors” to “The number of RSRCs that are fully constructed (i.e., practical completion achieved).” • Change of level from outcome to output. • Change of data source from MoE/MCA‐N to “Construction Supervisory Firm Report.”
Justification
• To reflect what is actually being measured.• To provide an appropriate definition. • To reflect the appropriate level. • To reflect the actual data source.
Indicator Modification Form
Date June 2013
Project/Activity Education/Investment in Regional Study and Resource Centers (sub‐activity: Construction of RSRCs)
Indicator
• % of positions at RSRCs staffed, defined as “The percentage of existing staff positions that have been filled with full‐time staff for all RSRCs that are completed and open to visitors. This is calculated as the total number of RSRC staff positions filled with full‐time staff divided by the total existing staff positions for all completed RCRCs staff positions, multiplied by 100 (to obtain the percentage).” (unit: %; indicator level: output; classification: level; source: MoE IPA reports; frequency: quarterly; responsible party: MoE; baseline: 0%
35 Textbooks delivered 36 Textbooks delivered
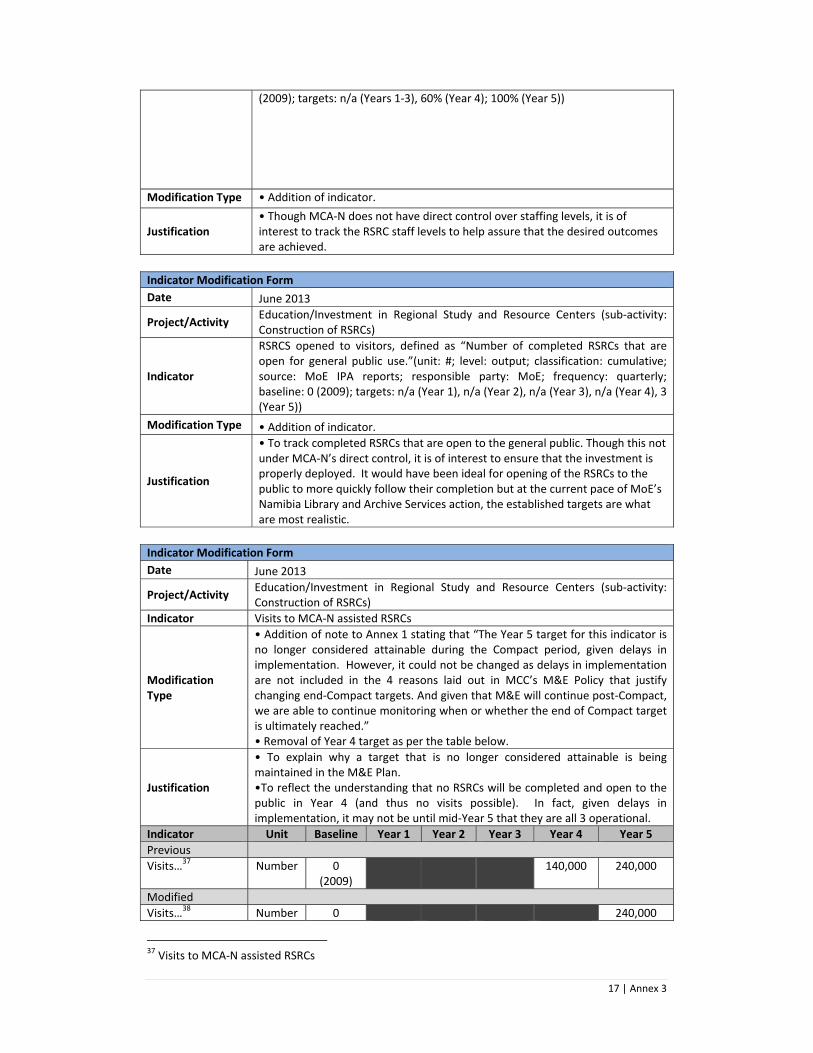
17 | Annex 3
(2009); targets: n/a (Years 1‐3), 60% (Year 4); 100% (Year 5))
Modification Type • Addition of indicator.
Justification • Though MCA‐N does not have direct control over staffing levels, it is of interest to track the RSRC staff levels to help assure that the desired outcomes are achieved.
Indicator Modification Form
Date June 2013
Project/Activity Education/Investment in Regional Study and Resource Centers (sub‐activity: Construction of RSRCs)
Indicator
RSRCS opened to visitors, defined as “Number of completed RSRCs that are open for general public use.”(unit: #; level: output; classification: cumulative; source: MoE IPA reports; responsible party: MoE; frequency: quarterly; baseline: 0 (2009); targets: n/a (Year 1), n/a (Year 2), n/a (Year 3), n/a (Year 4), 3 (Year 5))
Modification Type • Addition of indicator.
Justification
• To track completed RSRCs that are open to the general public. Though this not under MCA‐N’s direct control, it is of interest to ensure that the investment is properly deployed. It would have been ideal for opening of the RSRCs to the public to more quickly follow their completion but at the current pace of MoE’s Namibia Library and Archive Services action, the established targets are what are most realistic.
Indicator Modification Form
Date June 2013
Project/Activity Education/Investment in Regional Study and Resource Centers (sub‐activity: Construction of RSRCs)
Indicator Visits to MCA‐N assisted RSRCs
Modification Type
• Addition of note to Annex 1 stating that “The Year 5 target for this indicator is no longer considered attainable during the Compact period, given delays in implementation. However, it could not be changed as delays in implementation are not included in the 4 reasons laid out in MCC’s M&E Policy that justify changing end‐Compact targets. And given that M&E will continue post‐Compact, we are able to continue monitoring when or whether the end of Compact target is ultimately reached.” • Removal of Year 4 target as per the table below.
Justification
• To explain why a target that is no longer considered attainable is being maintained in the M&E Plan. •To reflect the understanding that no RSRCs will be completed and open to the public in Year 4 (and thus no visits possible). In fact, given delays in implementation, it may not be until mid‐Year 5 that they are all 3 operational.
Indicator Unit Baseline Year 1 Year 2 Year 3 Year 4 Year 5
Previous
Visits…37 Number 0(2009)
140,000 240,000
Modified
Visits…38 Number 0 240,000
37 Visits to MCA‐N assisted RSRCs

18 | Annex 3
(2009)
Indicator Modification Form
Date June 2013
Project/Activity Education/Investment in Regional Study and Resource Centers (sub‐activity: Construction of RSRCs)
Indicator Library loans of books and learning and study materials from MCA‐N assisted RSRCs
Modification Type
• Addition of note to Annex 1 stating that “The Year 5 target for this indicator is no longer considered attainable during the Compact period, given delays in implementation. However, it could not be changed as delays in implementation are not included in the 4 reasons laid out in MCC’s M&E Policy that justify changing end‐Compact targets. And given that M&E will continue post‐Compact, we are able to continue monitoring when or whether the end of Compact target is ultimately reached.” • Removal of Year 4 target as per the table below.
Justification
• To explain why a target that is no longer considered attainable is being maintained in the M&E Plan. •To reflect the understanding that no RSRCs will be completed and open to the public in Year 4 (and thus no library loans possible). In fact, given delays in implementation, it may not be until mid‐Year 5 that they are all 3 operational.
Indicator Unit Baseline Year 1 Year 2 Year 3 Year 4 Year 5
Previous
Library…39 # 0(2009)
20,000 32,000
Modified
Library…40 # 0(2009)
32,000
Indicator Modification Form
Date June 2013
Project/Activity Education/Investment in Regional Study and Resource Centers (sub‐activity: Construction of RSRCs)
Indicator
Library loans of books and learning and study materials from MCA‐N assisted mobile units, defined as “Number of books and materials loaned per year from MCA‐N supported mobile units.” (unit: #; level: outcome; classification: level; source: MoE IPA reports; responsible party: MoE; frequency: quarterly; baseline: 0 (2009); targets: n/a (Year 1), n/a (Year 2), n/a (Year 3), n/a (Year 4), 1,980 (Year 5))
Modification Type • Addition of indicator.
Justification
• To track the materials loaned through mobile units, which are an important element of the intervention. A Nanyang Technological University study of library users in Singapore indicated that the loan rate (defined number of books borrowed per visitor per visit) varied from about 0.45 in urban areas to 0.15 in peri‐urban areas. For rural Namibia, where reading culture is still nascent, a lower rate of 0.025 is applied as the best guess estimate for the target estimation for Year 5. The total number of books and materials loaned per year from MCA‐N supported mobile units in Year 5 was calculated as the product of the estimated loan rate (0.025) and total number of the mobile unit visitors (78,200). The number of mobile unit visitors is estimated on the assumption that 300 people will visit the 2 mobile units each day for 22 days per month for
38 Visits to MCA‐N assisted RSRCs 39 Library loans of books and learning and study materials from MCA‐N assisted RSRCs 40 Library loans of books and learning and study materials from MCA‐N assisted RSRCs
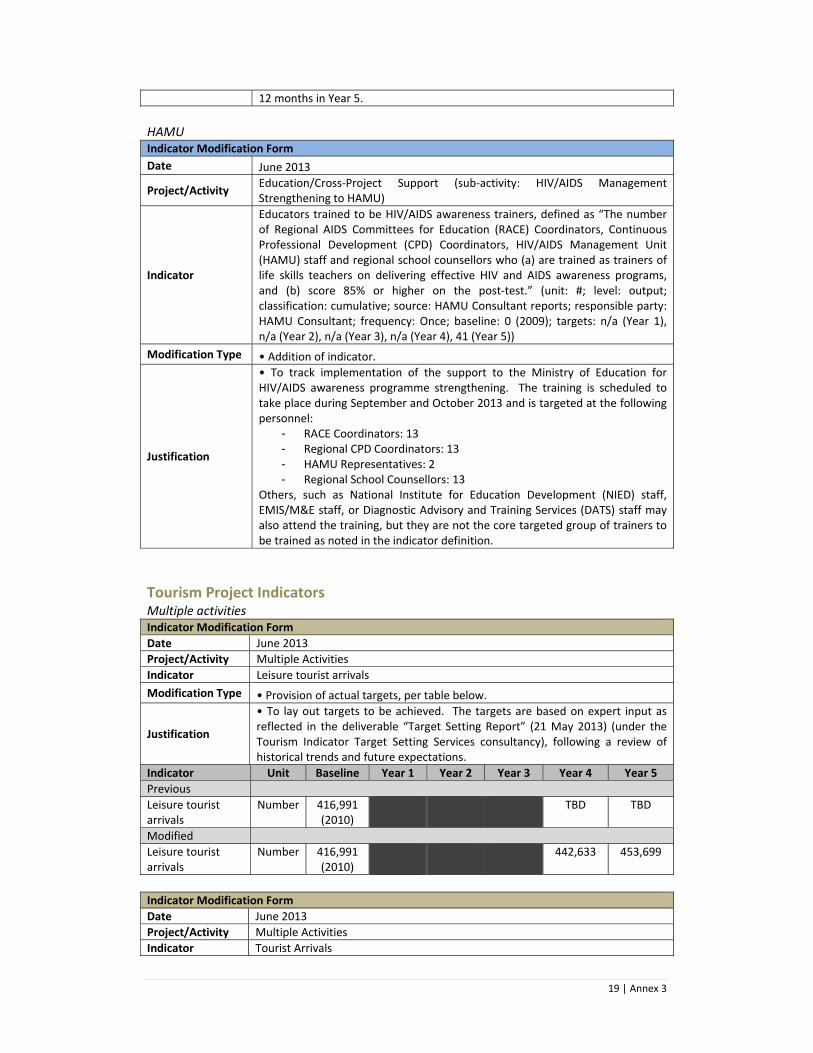
19 | Annex 3
12 months in Year 5.
HAMU Indicator Modification Form
Date June 2013
Project/Activity Education/Cross‐Project Support (sub‐activity: HIV/AIDS Management Strengthening to HAMU)
Indicator
Educators trained to be HIV/AIDS awareness trainers, defined as “The number of Regional AIDS Committees for Education (RACE) Coordinators, Continuous Professional Development (CPD) Coordinators, HIV/AIDS Management Unit (HAMU) staff and regional school counsellors who (a) are trained as trainers of life skills teachers on delivering effective HIV and AIDS awareness programs, and (b) score 85% or higher on the post‐test.” (unit: #; level: output; classification: cumulative; source: HAMU Consultant reports; responsible party: HAMU Consultant; frequency: Once; baseline: 0 (2009); targets: n/a (Year 1), n/a (Year 2), n/a (Year 3), n/a (Year 4), 41 (Year 5))
Modification Type • Addition of indicator.
Justification
• To track implementation of the support to the Ministry of Education for HIV/AIDS awareness programme strengthening. The training is scheduled to take place during September and October 2013 and is targeted at the following personnel:
- RACE Coordinators: 13 - Regional CPD Coordinators: 13 - HAMU Representatives: 2 - Regional School Counsellors: 13
Others, such as National Institute for Education Development (NIED) staff, EMIS/M&E staff, or Diagnostic Advisory and Training Services (DATS) staff may also attend the training, but they are not the core targeted group of trainers to be trained as noted in the indicator definition.
Tourism Project Indicators Multiple activities Indicator Modification Form
Date June 2013
Project/Activity Multiple Activities
Indicator Leisure tourist arrivals
Modification Type • Provision of actual targets, per table below.
Justification
• To lay out targets to be achieved. The targets are based on expert input as reflected in the deliverable “Target Setting Report” (21 May 2013) (under the Tourism Indicator Target Setting Services consultancy), following a review of historical trends and future expectations.
Indicator Unit Baseline Year 1 Year 2 Year 3 Year 4 Year 5
Previous
Leisure tourist arrivals
Number 416,991(2010)
TBD TBD
Modified
Leisure tourist arrivals
Number 416,991(2010)
442,633 453,699
Indicator Modification Form
Date June 2013
Project/Activity Multiple Activities
Indicator Tourist Arrivals

20 | Annex 3
Modification Type • Provision of actual targets, per table below.
Justification
• To lay out targets to be achieved. The targets are based on expert input as reflected in the deliverable “Target Setting Report” (21 May 2013) (under the Tourism Indicator Target Setting Services consultancy), following a review of historical trends and future expectations.
Indicator Unit Baseline Year 1 Year 2 Year 3 Year 4 Year 5
Previous
Tourist Arrivals Number 984,099(2010)
TBD TBD
Modified
Tourist Arrivals Number 984,099(2010)
1,106,782 1,155,480
Indicator Modification Form
Date June 2013
Project/Activity Multiple Activities
Indicator Jobs created through tourism
Modification Type
• Change of indicator name to “Jobs in tourism”.• Change of definition from “The number of direct jobs created in the last 12 months within the tourism industry by companies involved in travel and tourism activities, such as hospitality, lodging, food service, equipment rental, guiding, sport hunting, airlines, etc., as defined by NTB” to “The number of direct jobs existing in the last 12 months within the tourism industry by companies involved in travel and tourism activities, such as hospitality, lodging, food service, equipment rental, guiding, sport hunting, airlines, etc., as defined by NTB.” • Change of baseline year from “2009” to “2010” and corresponding adjustment of baseline value. • Provision of actual targets, per table below.
Justification
• To reflect the estimated jobs created within the reporting period. • To accurately reflect what the indicator is measuring. • To report a baseline value closer to the start of Compact implementation, with the assumption that it provides a truer baseline. • To lay out targets to be achieved. The targets are based on expert input as reflected in the deliverable “Target Setting Report” (21 May 2013) (under the Tourism Indicator Target Setting Services consultancy), following a review of historical trends and future expectations.
Indicator Unit Baseline Year 1 Year 2 Year 3 Year 4 Year 5
Previous
Jobs created through tourism
Number 22,000(2009)
22,000 23,100 24,200
Modified
Jobs in tourism Number 21,500(2010)
22,000 22,836 23,841
Improving Management and Infrastructure in Etosha National Park (sub‐activity: ENP Management Reform and Investment Promotion) Indicator Modification Form
Date June 2013
Project/Activity Tourism/Improving Management and Infrastructure in Etosha National Park (sub‐activity: ENP Management Reform and Investment Promotion)
Indicator Galton Gate Plan implemented
Modification Type
• Adjustment of targets, per table below. • Addition of note to Annex 1 stating that “This indicator is calculated by dividing the number of milestones that have been met by the total number to be met in the Galton Gate Plan and then multiplying by 100.”

21 | Annex 3
Justification • To update targets to be achieved in line with the revised and current approved Galton Gate Plan (version of December 2012). • To explain how the indicator is calculated.
Indicator Unit Baseline Year 1 Year 2 Year 3 Year 4 Year 5
Previous
Galton…41 Percentage 0%(2009)
25% 70% 91% 100%
Modified
Galton…42 Percentage 0%(2009)
25% 70% 79% 100%
Indicator Modification Form
Date June 2013
Project/Activity Tourism/Improving Management and Infrastructure in Etosha National Park (sub‐activity: ENP Management Reform and Investment Promotion)
Indicator Entries and exits through Galton Gate
Modification Type • Change of baseline year, per table below, and corresponding adjustment of baseline value. • Change of targets, per table below.
Justification
• To report a baseline value closer to the start of Compact implementation, with the assumption that it provides a truer baseline. • To reflect projected performance of ENP, as measured by this indicator. The targets are based on expert input as reflected in the deliverable “Target Setting Report” (21 May 2013) (under the Tourism Indicator Target Setting Services consultancy), following a review of historical trends and future expectations.
Indicator Unit Baseline Year 1 Year 2 Year 3 Year 4 Year 5
Previous
Entries and exits…43 Number 1,504
(2008) 1,600 2,000
Modified
Entries and exits…44 Number 1,582(2010)
10,000 15,000
Indicator Modification Form
Date June 2013
Project/Activity Tourism/Improving Management and Infrastructure in Etosha National Park (sub‐activity: ENP Management Reform and Investment Promotion)
Indicator Tourists to Etosha National Park
Modification Type
• Change of baseline year, per table below, and corresponding adjustment of baseline value. • Change of targets, per table below.
Justification
• To report a baseline value closer to the start of Compact implementation, with the assumption that it provides a truer baseline. • To reflect projected performance of ENP, as measured by this indicator. The targets are based on expert input as reflected in the deliverable “Target Setting Report” (21 May 2013) (under the Tourism Indicator Target Setting Services consultancy), following a review of historical trends and future expectations.
41 Galton Gate Plan implemented 42 Galton Gate Plan implemented 43 Entries and exits through Galton Gate 44 Entries and exits through Galton Gate

22 | Annex 3
Indicator Unit Baseline Year 1 Year 2 Year 3 Year 4 Year 5
Previous
Tourists…45 Number 200,000(2007)
242,000 266,200 293,000
Modified
Tourists…46 Number 179,365(2010)
242,000 265,134 276,800
Indicator Modification Form
Date June 2013
Project/Activity Tourism/Improving Management and Infrastructure in Etosha National Park (sub‐activity: ENP Management Reform and Investment Promotion)
Indicator Etosha National Park gross revenue from gate receipts
Modification Type
• Change of baseline year, per table below, and corresponding adjustment of baseline value. • Change of targets, per table below.
Justification
• To report a baseline value closer to the start of Compact implementation, with the assumption that it provides a truer baseline. • To reflect projected performance of ENP, as measured by this indicator. The targets are based on expert input as reflected in the deliverable “Target Setting Report” (21 May 2013) (under the Tourism Indicator Target Setting Services consultancy), following a review of historical trends and future expectations.
Indicator Unit Baseline Year 1
Year 2
Year 3 Year 4 Year 5
Previous
Etosha…47 Namibian Dollars
19,200,000(2008)
19,500,000 19,750,000 20,000,000
Modified
Etosha…48 Namibian Dollars
19,648,166(2010)
19,500,000 26,513,418 27,680,008
Indicator Modification Form
Date June 2013
Project/Activity Tourism/Improving Management and Infrastructure in Etosha National Park (sub‐activity: ENP Management Reform and Investment Promotion)
Indicator Etosha National Park gross revenue from conservancy‐sourced concession fees
Modification Type • Change of baseline year, per table below.• Provision of actual targets, per table below.
Justification
• To report a baseline value closer to the start of Compact implementation, with the assumption that it provides a truer baseline. • To lay out target to be achieved. The target is based on what is indicated in the Hai//om Concession Agreement Contract under the financial and indicators section.
Indicator Unit Baseline Year 1 Year 2 Year 3 Year 4 Year 5
Previous
Etosha…49 Namibian Dollars
0(2009)
TBD TBD
Modified
Etosha…50 Namibian 0 330,000
45 Tourists to Etosha National Park 46 Tourists to Etosha National Park 47 Etosha National Park gross revenue from gate receipts 48 Etosha National Park gross revenue from gate receipts 49 Etosha National Park gross revenue from conservancy‐sourced concession fees

23 | Annex 3
Dollars (2010)
Improving Management and Infrastructure in Etosha National Park (sub‐activity: ENP Management Centres and Staff Housing) Indicator Modification Form
Date June 2013
Project/Activity Tourism/Improving Management and Infrastructure in Etosha National Park (sub‐activity: ENP Management Centres and Staff Housing)
Indicator Galton Gate Construction: Schedule Performance Index (SPI)
Modification Type
• Addition of indicator that is defined as “The ratio of budgeted cost of work scheduled compared to budgeted cost of work accomplished.” (unit: #; level: process; classification: level; source: Construction Supervisory Firm Reports; responsible party: MCA‐N; frequency: Quarterly (starting in Year 4); baseline: n/a; targets: n/a (Year 1), n/a (Year 2), n/a (Year 3), 1 (Year 4), 1 (Year 5)) • Addition of note in Annex 1 stating that “SPI is a component of earned value management. An acceptable range for this indicator is between 0.9 and 1.1. A value outside of this range indicates a work progress issue.”
Justification • To track construction performance at ENP and help monitor related completion risks. • To explain how to interpret indicator progress.
Indicator Modification Form
Date June 2013
Project/Activity Tourism/Improving Management and Infrastructure in Etosha National Park (sub‐activity: ENP Management Centres and Staff Housing)
Indicator Galton Gate Construction: Cost Performance Index (CPI)
Modification Type
• Addition of indicator that is defined as “The ratio of expected construction costs compared to actual construction costs.” (unit: #; level: process; classification: level; source: Construction Supervisory Firm Reports; responsible party: MCA‐N; frequency: Quarterly (starting in Year 4); baseline: n/a; targets: n/a (Year 1), n/a (Year 2), n/a (Year 3), 1 (Year 4), 1 (Year 5)) • Addition of note in Annex 1 stating that “CPI is a component of earned value management. An acceptable range for this indicator is between 0.9 and 1.1. A value outside of this range reflects a mismatch between planned and actual budget, resulting e.g., from insufficient scope definition.”
Justification • To track construction performance at ENP and help monitor related completion risks. • To explain how to interpret indicator progress.
Indicator Modification Form
Date June 2013
Project/Activity Tourism/Improving Management and Infrastructure in Etosha National Park (sub‐activity: ENP Management Centres and Staff Housing)
Indicator Ombika Gate Construction: Schedule Performance Index (SPI)
Modification Type
• Addition of indicator that is defined as “The ratio of budgeted cost of work scheduled compared to budgeted cost of work accomplished.” (unit: #; level: process; classification: level; source: Construction Supervisory Firm Reports; responsible party: MCA‐N; frequency: Quarterly (starting in Year 4); baseline: n/a; targets: targets: n/a (Year 1), n/a (Year 2), n/a (Year 3), 1 (Year 4), 1 (Year 5)) • Addition of note in Annex 1 stating that “SPI is a component of earned value management. An acceptable range for this indicator is between 0.9 and 1.1. A value outside of this range indicates a work progress issue.”
50 Etosha National Park gross revenue from conservancy‐sourced concession fees

24 | Annex 3
Justification • To track construction performance at ENP and help monitor related completion risks. • To explain how to interpret indicator progress.
Indicator Modification Form
Date June 2013
Project/Activity Tourism/Improving Management and Infrastructure in Etosha National Park (sub‐activity: ENP Management Centres and Staff Housing)
Indicator Ombika Gate Construction: Cost Performance Index (CPI)
Modification Type
• Addition of indicator that is defined as “The ratio of expected construction costs compared to actual construction costs.” (unit: #; level: process; classification: level; source: Construction Supervisory Firm Reports; responsible party: MCA‐N; frequency: Quarterly (starting in Year 4); baseline: n/a; targets: targets: n/a (Year 1), n/a (Year 2), n/a (Year 3), 1 (Year 4), 1 (Year 5)) • Addition of note in Annex 1 stating that “CPI is a component of earned value management. An acceptable range for this indicator is between 0.9 and 1.1. A value outside of this range reflects a mismatch between planned and actual budget, resulting e.g., from insufficient scope definition.”
Justification • To track construction performance at ENP and help monitor related completion risks. • To explain how to interpret indicator progress.
Marketing Namibia in Tourism (sub‐activity: Destination Marketing North America) Indicator Modification Form
Date June 2013
Project/Activity Tourism/Marketing Namibia in Tourism (sub‐activity: Destination Marketing North America)
Indicator Namibian travel trade business persons trained
Modification Type
• Addition of indicator that is defined as “Number of individual persons from Namibian travel trade businesses trained in online travel and tourism marketing. The modules of the training are specified in the NADM Training Manual to be handed over to NTB after the completion of the project: A person is considered trained when he/she participated in at least one training module.” (unit: Number; level: output; classification: cumulative; source: NADM Consultant’s Reports; responsible party: NADM Consultant; frequency: Quarterly (starting in Year 4); baseline: 0 (2011); targets: n/a (Year 1), n/a (Year 2), n/a (Year 3), 485 (Year 4), 800 (Year 5))
Justification
• To track performance in an important output of interest. These targets also reflect the performance targets laid out in section F.1 of NADM Training Strategy Report. The actual targets were set on the basis of 456 trade business people trained to date, with 30 more to be trained before September 2013 and 314 more to be trained in Year 5.
Indicator Modification Form
Date June 2013
Project/Activity Tourism/Marketing Namibia in Tourism (sub‐activity: Destination Marketing North America)
Indicator Leisure tourist arrivals from the North American market
Modification Type
• Provision of targets, per table below. • Addition of note to Annex 1 that states “The target for this indicator accounts for a substantial decline in leisure tourist arrivals from the North American market in 2011, so although the target represents a decrease from the baseline value, it also reflects an improvement over the most recent historical period, for which data were available.”
Justification • To lay out targets to be achieved. The targets are based on expert input as

25 | Annex 3
reflected in the deliverable “Target Setting Report” (21 May 2013) (under the Tourism Indicator Target Setting Services consultancy), following a review of historical trends and future expectations. • To explain why the targets for this indicator are lower than the baseline value, which is otherwise counterintuitive.
Indicator Unit Baseline Year 1 Year 2 Year 3 Year 4 Year 5
Previous
Leisure…51 Number 17,246(2010)
TBD TBD
Modified
Leisure…52 Number 17,246(2010)
15,258 15,715
Indicator Modification Form
Date June 2013
Project/Activity Tourism/Marketing Namibia in Tourism (sub‐activity: Destination Marketing North America)
Indicator Tourist arrivals from the North American market
Modification Type • Provision of targets, per table below.
Justification
• To lay out targets to be achieved. The targets are based on expert input as reflected in the deliverable “Target Setting Report” (21 May 2013) (under the Tourism Indicator Target Setting Services consultancy), following a review of historical trends and future expectations.
Indicator Unit Baseline Year 1 Year 2 Year 3 Year 4 Year 5
Previous
Tourist…53 Number 22,793(2010)
TBD TBD
Modified
Tourist…54 Number 22,793(2010)
23,136 23,483
Marketing Namibia in Tourism (sub‐activity: Regional and Communal Tourism Products) Indicator Modification Form
Date June 2013
Project/Activity Tourism/Marketing Namibia in Tourism (sub‐activity: Regional and Communal Tourism Products)
Indicator Domestic and regional tourist routes developed and marketed to the public
Modification Type
• Change of indicator definition from “The number of domestic and regional tourist routes developed and marketed to public” to “The number of domestic and regional tourist routes developed and marketed to public with MCA‐N support.” • Correction of the data source from “NTB” to “Route Development Consultant”. • Change of responsible party from “NTB” to “Route Development Consultant”. • Adjustment of baseline value, per table below. • Adjustment of targets, per table below.
Justification
• For the purpose of specificity and clarity, this indicator is only measuring routes that are developed and marketed with MCA‐N support. • To reflect the actual data source. • To reflect the party actually responsible for reporting on this indicator. • To apply the value that is in line with the changed definition.
51 Leisure tourist arrivals from the North American market 52 Leisure tourist arrivals from the North American market 53 Tourist arrivals from the North American market 54 Tourist arrivals from the North American market
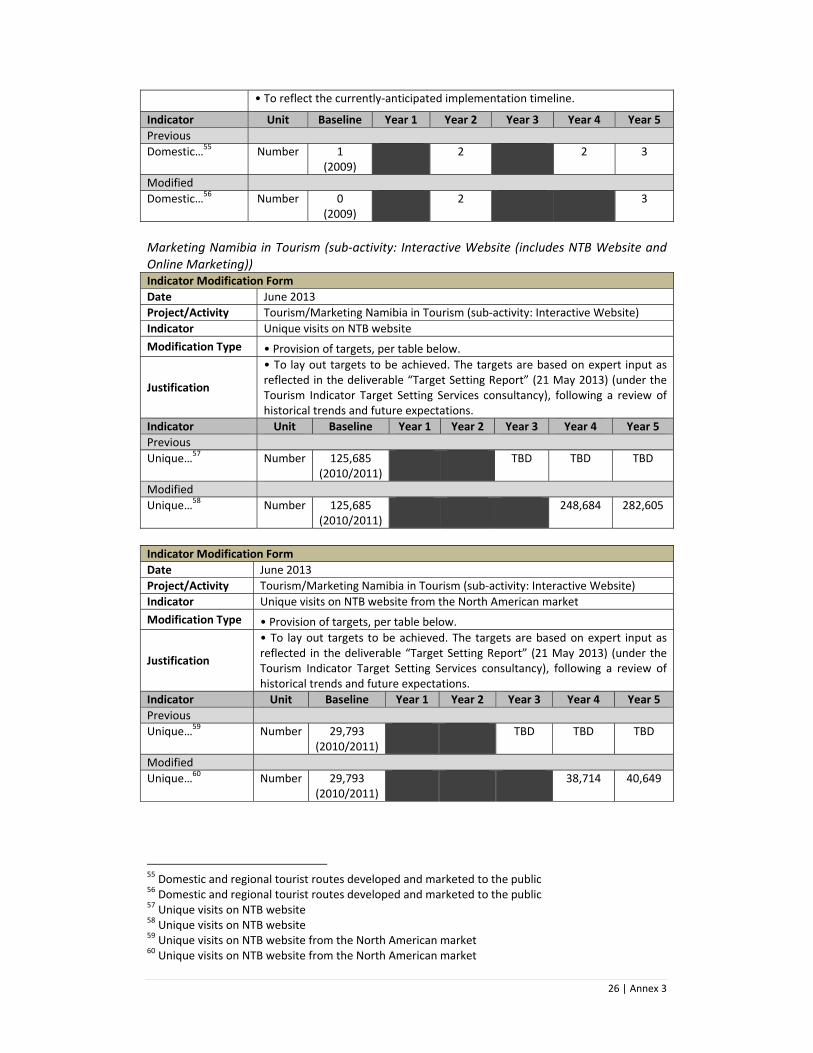
26 | Annex 3
• To reflect the currently‐anticipated implementation timeline.
Indicator Unit Baseline Year 1 Year 2 Year 3 Year 4 Year 5
Previous
Domestic…55 Number 1(2009)
2 2 3
Modified
Domestic…56 Number 0(2009)
2 3
Marketing Namibia in Tourism (sub‐activity: Interactive Website (includes NTB Website and Online Marketing)) Indicator Modification Form
Date June 2013
Project/Activity Tourism/Marketing Namibia in Tourism (sub‐activity: Interactive Website)
Indicator Unique visits on NTB website
Modification Type • Provision of targets, per table below.
Justification
• To lay out targets to be achieved. The targets are based on expert input as reflected in the deliverable “Target Setting Report” (21 May 2013) (under the Tourism Indicator Target Setting Services consultancy), following a review of historical trends and future expectations.
Indicator Unit Baseline Year 1 Year 2 Year 3 Year 4 Year 5
Previous
Unique…57 Number 125,685
(2010/2011) TBD TBD TBD
Modified
Unique…58 Number 125,685(2010/2011)
248,684 282,605
Indicator Modification Form
Date June 2013
Project/Activity Tourism/Marketing Namibia in Tourism (sub‐activity: Interactive Website)
Indicator Unique visits on NTB website from the North American market
Modification Type • Provision of targets, per table below.
Justification
• To lay out targets to be achieved. The targets are based on expert input as reflected in the deliverable “Target Setting Report” (21 May 2013) (under the Tourism Indicator Target Setting Services consultancy), following a review of historical trends and future expectations.
Indicator Unit Baseline Year 1 Year 2 Year 3 Year 4 Year 5
Previous
Unique…59 Number 29,793(2010/2011)
TBD TBD TBD
Modified
Unique…60 Number 29,793(2010/2011)
38,714 40,649
55 Domestic and regional tourist routes developed and marketed to the public 56 Domestic and regional tourist routes developed and marketed to the public 57 Unique visits on NTB website 58 Unique visits on NTB website 59 Unique visits on NTB website from the North American market 60 Unique visits on NTB website from the North American market

27 | Annex 3
Indicator Modification Form
Date June 2013
Project/Activity Tourism/Marketing Namibia in Tourism (sub‐activity: Interactive Website)
Indicator Average time spend on the NTB website
Modification Type
• Change of indicator unit from minutes to seconds (and adjustment of corresponding baseline and historical target values). • Removal of targets, per table below.
Justification • To make it more straightforward to track and calculate in the ITT. • To reflect that there is no solid basis for setting targets but that MCA‐N is still interested in continuing to track the figures reported against this indicator.
Indicator Unit Baseline Year 1 Year 2 Year 3 Year 4 Year 5
Previous
Average…61 Minutes 4:09(2010)
4:46 5:29 6:19
Modified
Average…62 Seconds 249(2010)
Indicator Modification Form
Date June 2013
Project/Activity Tourism/Marketing Namibia in Tourism (sub‐activity: Interactive Website)
Indicator Registered users of the NTB website
Modification Type • Adjustment of targets, per table below
Justification
• To provide targets based on a more solid basis than previously possible with the capacity that was then at hand. The targets are based on expert input as reflected in the deliverable “Target Setting Report” (21 May 2013) (under the Tourism Indicator Target Setting Services consultancy), following a review of historical trends and future expectations.
Indicator Unit Baseline Year 1 Year 2 Year 3 Year 4 Year 5
Previous
Registered…63 Number 560 625 670
Modified
Registered…64 Number 560 1,739 1,976
Ecotourism Development for Communal Conservancies (sub‐activity: Conservancy Support – Ecotourism Development Packages) Indicator Modification Form
Date June 2013
Project/Activity Tourism/Ecotourism Development for Communal Conservancies (sub‐activity: Conservancy Support – Ecotourism Development Packages)
Indicator New joint venture lodges or tented camps
Modification Type
• Change of definition from “The number of new joint venture tourism lodges, joint venture campsites or tented camps exceeding NAD $3 million total investment value, and/or the number of major expansions to existing or converted joint venture lodges exceeding NAD $6 million total investment value established during the CDSS contract period” to “The number of new joint venture tourism lodges (JV) or tented camps/tented lodges exceeding NAD 2 million total investment value, and/or the number of major expansions to existing or converted joint venture lodges where the value of the expansion exceeds NAD 1 million signed during the CDSS contract period.”
61 Average time spend on the NTB website 62 Average time spend on the NTB website 63 Registered users of the NTB website 64 Registered users of the NTB website

28 | Annex 3
Justification • To recognize that with the continued poor investment climate, investors are less willing to make major investments in fixed infrastructure; therefore, it is necessary to lower the threshold in order to capture most of MCA‐N’s contribution.
Indicator Modification Form
Date June 2013
Project/Activity Tourism/Ecotourism Development for Communal Conservancies (sub‐activity: Conservancy Support – Ecotourism Development Packages)
Indicator New small tourism and natural resources enterprises within conservancies
Modification Type • Change of classification from cumulative to level.
Justification • To reflect the appropriate classification, given that it is possible for enterprises to open and close.
Indicator Modification Form
Date June 2013
Project/Activity Tourism/Ecotourism Development for Communal Conservancies (sub‐activity: Conservancy Support – Ecotourism Development Packages)
Indicator New jobs created in conservancies
Modification Type
• Change classification from cumulative to level.• Change definition from “The number of new jobs, including permanent and casual part‐ and full‐time jobs, created annually in the MCA‐N‐supported conservancies” to “The number of new tourism‐ and natural resource‐related jobs, including permanent and casual part‐ and full‐time jobs, created in the MCA‐N‐supported conservancies during the Compact period. This excludes jobs created in INP enterprises.” • Change the source from “NACSO /CBNRM Database” to “CDSS Consultant”
Justification
• To reflect the appropriate classification, given that jobs can be both created and lost. • To clarify which jobs are being included, that it’s those from natural resources‐related activities and not only tourism (but this does not warrant an increase of the target values as it is simply a clarification). • To reflect the correct source of data.
Indicator Modification Form
Date June 2013
Project/Activity Tourism/Ecotourism Development for Communal Conservancies (sub‐activity: Conservancy Support – Ecotourism Development Packages)
Indicator Annual General Meetings (AGMs) with financial reports submitted and benefit distribution plans discussed
Modification Type • Change classification from cumulative to level.
Justification • To reflect the appropriate classification.
Indicator Modification Form
Date June 2013
Project/Activity Tourism/Ecotourism Development for Communal Conservancies (sub‐activity: Conservancy Support – Ecotourism Development Packages)
Indicator Share of conservancy revenue paid out in dividends and/ or spent on community services
Modification Type
• Change the definition from “The percent of total annual revenue paid out in dividends to households and/or spent on community services (includes all cash and non‐cash revenue) in MCA‐N‐supported conservancies” to “The median percentage of total annual revenue paid out in dividends to households and/or spent on community services (includes all cash and non‐cash revenue) in MCA‐N‐supported conservancies.”

29 | Annex 3
Justification • To report using median (versus mean), which reduces the effects of individual outliers that can skew the data.
Agriculture Project Indicators Land Access and Management (sub‐activity: Communal Land Support (CLS)) Indicator Modification Form
Date June 2013
Project/Activity Agriculture/Land Access and Management (sub‐activity: CLS)
Indicator Approved procedure in place for securing/registering group rights
Modification Type
• Change of indicator definition from “The date on which MLR approves a procedure for securing/registering group rights” to “The date on which MLR approves the legal memorandum and regulations for securing/registering a group right.” • Provision of target date, per table below.
Justification
• To specify what the “procedure” entails, laying out that the CLS implementer will be formulating a legal memorandum and regulations for securing/registering group rights. • To strengthen accountability by establishing the target to be achieved, which was previously unavailable. The target date reflects the reasonable period in which the legal memorandum and regulations for securing/registering group rights might be approved, given the challenges that are being faced.
Indicator Unit Baseline Year 1 Year 2 Year 3 Year 4 Year 5
Previous
Approved…65 Date TBD
Modified
Approved…66 Date 30‐Sep‐13
Indicator Modification Form
Date June 2013
Project/Activity Agriculture/Land Access and Management (sub‐activity: CLS)
Indicator Group rights secured/registered
Modification Type
• Adjustment of reporting frequency from “Quarterly (starting in Year 4)” to “Quarterly (starting in Year 5)”. • Adjustment of baseline from n/a to 0 and provision of baseline year, per table below. • Adjustment of targets, as per table below.
Justification
• To match the timing of reporting with the expected timing of when results will become evident. • To provide the appropriate baseline and specify the baseline year. • To reflect the slower‐than‐anticipated pace of implementation to achieve this challenging result.
Indicator Unit Baseline Year 1 Year 2 Year 3 Year 4 Year 5
Previous
Group …67 Number 2 3
Modified
Group…68 Number 0(2009)
3
65 Approved procedures in place for securing/registering group rights 66 Approved procedures in place for securing/registering group rights 67 Group rights secured/registered 68 Group rights secured/registered

30 | Annex 3
Indicator Modification Form
Date June 2013
Project/Activity Agriculture/Land Access and Management (sub‐activity: CLS)
Indicator Legal and regulatory reforms adopted
Modification Type
• Addition of indicator, defined as “The number of specific pieces of legislation or implementing regulations adopted by the compact country and attributable to compact support.” (unit: #; level: output; classification: cumulative; source: CLS Consultant; responsible party: CLS Consultant; frequency: quarterly (starting in Year 4); baseline: 0 (2009); targets: n/a (Year 1), n/a (Year 2), n/a (Year 3), 2 (Year 4), 9 (Year 5))
Justification
• To better track performance of this sub‐activity by including an indicator that tracks the improvement in land tenure security and is an MCC Common Indicator (L‐1). Targets were set on the basis of expectations for actual project achievement.
Indicator Modification Form
Date June 2013
Project/Activity Agriculture/Land Access and Management (sub‐activity: CLS)
Indicator Outreach events held
Modification Type • Adjustment of baseline from n/a to 0 and provision of baseline year, per table below. • Adjustment of targets for Years 4 and 5, per table below.
Justification
• To provide the appropriate baseline and specify the baseline year. • To reflect updated targets for Year 4 and Year 5 based on the faster‐ and more intense‐than‐anticipated pace of implementation of this component of the CLS sub‐activity. These targets also reflect the performance targets laid out in section GCC 6.1 and section 1.1.1 of Appendix A of the new CLS Consultant’s contract. The actual targets were set on the basis of 131 outreach events already achieved and 200 outreach/mobilization meetings planned to be carried out in the NCAs under the CLS Consultant’s current contract.
Indicator Unit Baseline Year 1 Year 2 Year 3 Year 4 Year 5
Previous
Outreach events held
Number 87 117 132
Modified
Outreach events held
Number 0(2009)
87 196 331
Indicator Modification Form
Date June 2013
Project/Activity Agriculture/Land Access and Management (sub‐activity: CLS)
Indicator Stakeholders trained
Modification Type • Adjustment of baseline from n/a to 0 and provision of baseline year, per table below. • Adjustment of targets, as per table below.
Justification
• To provide the appropriate baseline and specify the baseline year. • To update targets for Year 4 and Year 5, which reflect the performance targets laid out in section GCC 6.1 and section 1.1.1 of Appendix A of the CLS Consultant’s current contract. The actual targets were set on the basis of 7 CLB training events with approximately 20 participants per training event, 12 TA training events with an average of 50 participants per training event, 4 MLR staff training events with 30 participants per training event to be carried in the NCAs under the CLS Consultant’s current contract, in addition to the previously‐achieved 1,076 stakeholders trained. The previous targets were

31 | Annex 3
based on erroneous estimations of the number of TA participants.
Indicator Unit Baseline Year 1 Year 2 Year 3 Year 4 Year 5
Previous
Stakeholders trained Number 500 600 800 1,200
Modified
Stakeholders trained Number 0(2009)
500 600 1,776 1,936
Indicator Modification Form
Date June 2013
Project/Activity Agriculture/Land Access and Management (sub‐activity: CLS)
Indicator Parcels corrected or incorporated in land system
Modification Type • Adjustment of baseline from n/a to 0 and provision of baseline year, per table below. • Provision of targets for Year 4 and 5, as per table below.
Justification
• To provide the appropriate baseline and specify the baseline year. • To lay out targets to be achieved. The targets are based on the performance targets set in section GCC 6.1 and section 1.1.1 of Appendix A of the CLS Consultant’s current contract, and those targets were set on the basis of past experience and the amount of time left for project implementation up to CLS Consultant’s contract end.
Indicator Unit Baseline Year 1 Year 2 Year 3 Year 4 Year 5
Previous
Parcels…69 Number TBD TBD
Modified
Parcels…70 Number 0(2009)
7,307 10,807
Indicator Modification Form
Date June 2013
Project/Activity Agriculture/Land Access and Management (sub‐activity: CLS)
Indicator Household land rights formalized
Modification Type
• Addition of indicator, defined as “The number of households receiving formal recognition of ownership and/or use rights through certificates, titles, leases, or other recorded documentation by government institutions or traditional authorities at national or local levels”, with addition of note to Annex 1 stating that “For the purposes of the Namibia Compact, this indicator measures the number of certificates issued by CLS to TAs for delivery to individual or joint land right holders after fee payment is made by the applicant; since certificates are not awarded to households, per se, it is possible that a “household” could receive more than one certificate.” (unit: #; level: output; classification: cumulative; source: CLS Consultant; responsible party: CLS Consultant; frequency: quarterly (starting in Year 4); baseline: 0 (2009); targets: n/a (2010), n/a (2011), n/a (2012), 1,500 (2013), 10,390 (2014))
Justification
• To better track performance of this sub‐activity by including an indicator that tracks the improvement in land tenure security and is an MCC Common Indicator (L‐6). Targets were set on the basis of expectations for actual project achievement.
69 Parcels corrected or incorporated in land system 70 Parcels corrected or incorporated in land system

32 | Annex 3
Land Access and Management (sub‐activity: Community‐Based Livestock and Rangeland Management (CBRLM)) Indicator Modification Form
Date June 2013
Project/Activity Agriculture/Land Access and Management (sub‐activity: CBRLM)
Indicator Bare ground
Modification Type
• Change of indicator definition from “The proportion of the ground covered by different types of plants, litter, or rock as opposed to unprotected bare ground” to “The difference between treatment and control in the proportion of ground not covered by different types of plants, litter, or rock.” • Provision of baseline value, per table below. • Provision of targets, per table below.
Justification • To accurately reflect what is actually being measured. • To provide baseline value as established by the baseline rangeland assessment. The baseline value was established by calculating the difference between the baseline treatment value and the baseline control value; in this case: baseline = 0.204 ‐ 0.216 = ‐0.012. • To lay out targets to be achieved. The target was established using the following formula: treatment‐control difference in 2014, corrected for difference in 2012: (TMT2014‐TMT2012) ‐ (CTRL2014‐CTRL2012) ≤ X. X = (TMT2012‐CTRL2012) ‐ 10% of 2012 treatment. According to the MCC‐contracted rangeland expert, 10% is the smallest change that is still likely to be regarded by most rangeland ecologists as biologically meaningful when translated to an absolute change.
Indicator Unit Baseline Year 1 Year 2 Year 3 Year 4 Year 5
Previous
Bare ground Percentage TBD(2012)
TBD
Modified
Bare ground Percentage ‐0.012(2012)
‐0.032
Indicator Modification Form
Date June 2013
Project/Activity Agriculture/Land Access and Management (sub‐activity: CBRLM)
Indicator Soil surface in large inter‐canopy gaps
Modification Type
• Change of indicator definition from “The proportion of soil surface in large inter‐canopy gaps” to “The difference between treatment and control in the proportion of soil surface in large inter‐canopy gaps.” • Provision of baseline value, per table below. • Provision of actual targets, per table below.
Justification • To accurately reflect what is actually being measured. • To provide baseline value as established by the baseline rangeland assessment. The baseline value was established by calculating the difference between the baseline treatment value and the baseline control value; in this case: baseline = 0.254 ‐ 0.303 = ‐0.049. • To lay out targets to be achieved. The target was established using the following formula: treatment‐control difference in 2014, corrected for difference in 2012: (TMT2014‐TMT2012) ‐ (CTRL2014‐CTRL2012) ≤ X. X = (TMT2012‐CTRL2012) ‐ 10% of 2012 treatment. According to the MCC‐contracted rangeland expert, 10% is the smallest change that is still likely to be regarded by most rangeland ecologists as biologically meaningful when translated to an absolute change.

33 | Annex 3
Indicator Unit Baseline Year 1 Year 2 Year 3 Year 4 Year 5
Previous
Proportion… 71 Percentage TBD(2012)
TBD
Modified
Proportion… 72 Percentage ‐0.049(2012)
‐0.074
Indicator Modification Form
Date June 2013
Project/Activity Agriculture/Land Access and Management (sub‐activity: CBRLM)
Indicator Soil aggregate stability
Modification Type • Deletion of indicator.
Justification • This indicator is not meaningful in and of itself. Instead, it will be used separately to facilitate the interpretation of other indicators at the high density sites.
Indicator Modification Form
Date June 2013
Project/Activity Agriculture/Land Access and Management (sub‐activity: CBRLM)
Indicator Foliar cover
Modification Type
• Addition of indicator that is defined as “The difference between treatment and control in the proportion of the ground covered by the vertical projection of the aerial portion of plants.” (unit: %; level: outcome; classification: level; source: CBRLM Rangeland Assessment; frequency: Once (in Year 5); responsible party: USDA; baseline ‐0.013 (2012); targets: N/A (Year 1), N/A (Year 2), N/A (Year 3), N/A (Year 4), 0.028 (Year 5))
Justification
• To track performance in an important outcome of interest (i.e., rangeland health). The baseline was established based on the findings of the baseline rangeland assessment, by calculating the difference between the baseline treatment value and the baseline control value, in this case: baseline = 0.413 ‐ 0.426 = ‐0.013. The target was established using the following formula: treatment‐control difference in 2014, corrected for difference in 2012: (TMT2014‐TMT2012) ‐ (CTRL2014‐CTRL2012) ≥ X. X = (TMT2012‐CTRL2012) + 10% of 2012 treatment. According to the MCC‐contracted rangeland expert, 10% is the smallest change that is still likely to be regarded by most rangeland ecologists as biologically meaningful when translated to an absolute change.
Livestock Support (sub‐activity: Preparatory Studies for Infrastructure of Vet Centres and Quarantine Camps (SVOs and Q‐Camps)) Indicator Modification Form
Date June 2013
Project/Activity Livestock Support (sub‐activity: Preparatory Studies for Infrastructure of Vet Centres and Quarantine Camps (SVOs and Q‐Camps))
Indicator New state veterinary offices (SVOs) constructed
Modification Type • Adjustment of Year 4 target, per table below.
Justification • To reflect the slower‐than‐anticipated pace of construction by the contractor.
71 Proportion of soil surface in large inter‐canopy gaps 72 Proportion of soil surface in large inter‐canopy gaps

34 | Annex 3
Indicator Unit Baseline Year 1 Year 2 Year 3 Year 4 Year 5
Previous
New… 73 Number 0(2009)
5 5
Modified
New… 74 Number 0(2009)
4 5
Indigenous Natural Products (sub‐activity: Producer and Processor Organisations (PPO) Capacity Building and Training) Indicator Modification Form
Date June 2013
Project/Activity Agriculture/Indigenous Natural Products (sub‐activity: PPO Capacity Building and Training)
Indicator PPOs that have developed and are using a business plan
Modification Type • Adjustment of target values, per the table below.
Justification
• To correct erroneous data and reflect the actual number of PPOs for which business plans have been found to be relevant and that the Consultant is working towards. Business plans are only relevant for PPOs associated with Eudafano Women’s Cooperative and Tulongeni Twahangana Cooperative; Use of Resources (specifying how resources will be harvested sustainably) will be developed for other PPOs, in particular those working on Devil’s Claw.
Indicator Unit Baseline Year 1 Year 2 Year 3 Year 4 Year 5
Current
PPOs that have …75 # 0 13 20 50 60
Modified
PPOs that have…76 # 0 13 20 40 48
Indicator Modification Form
Date June 2013
Project/Activity Agriculture/Indigenous Natural Products (sub‐activity: PPO Capacity Building and Training)
Indicator PPOs with resource management/monitoring plans for environmentally fragile INPs
Modification Type
• Change of definition from “The number of PPOs that have adopted (i.e., finalized and endorsed) resource management/monitoring plans, which are plans that specify how INPs will be managed” to “The number of PPOs that have adopted (i.e., finalized and endorsed) resource management/monitoring plans (which are plans that specify how INPs will be managed) for environmentally fragile INPs.”
Justification
• To specify the types of PPOs for which resource management/monitoring plans are relevant. Development and adoption of Resource Management/Monitoring Plans are for INPS that are environmentally fragile, i.e., for harvesting Devil’s Claw; Marula, Ximenia and Commiphora are not destructively harvested.
September 2012
73 New State veterinary offices (SVOs) constructed 74 New State veterinary offices (SVOs) constructed 75 PPOs that have developed and are using a business plan 76 PPOs that have developed and are using a business plan
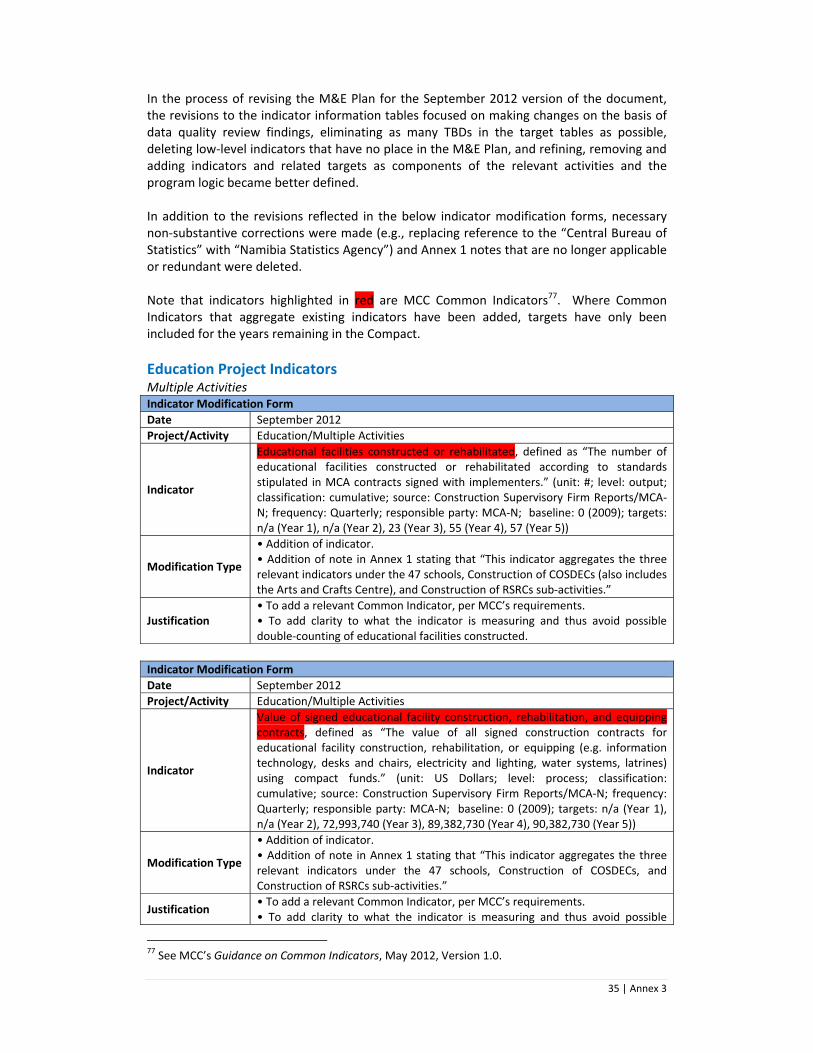
35 | Annex 3
In the process of revising the M&E Plan for the September 2012 version of the document, the revisions to the indicator information tables focused on making changes on the basis of data quality review findings, eliminating as many TBDs in the target tables as possible, deleting low‐level indicators that have no place in the M&E Plan, and refining, removing and adding indicators and related targets as components of the relevant activities and the program logic became better defined. In addition to the revisions reflected in the below indicator modification forms, necessary non‐substantive corrections were made (e.g., replacing reference to the “Central Bureau of Statistics” with “Namibia Statistics Agency”) and Annex 1 notes that are no longer applicable or redundant were deleted. Note that indicators highlighted in red are MCC Common Indicators77. Where Common Indicators that aggregate existing indicators have been added, targets have only been included for the years remaining in the Compact.
Education Project Indicators Multiple Activities Indicator Modification Form
Date September 2012
Project/Activity Education/Multiple Activities
Indicator
Educational facilities constructed or rehabilitated, defined as “The number of educational facilities constructed or rehabilitated according to standards stipulated in MCA contracts signed with implementers.” (unit: #; level: output; classification: cumulative; source: Construction Supervisory Firm Reports/MCA‐N; frequency: Quarterly; responsible party: MCA‐N; baseline: 0 (2009); targets: n/a (Year 1), n/a (Year 2), 23 (Year 3), 55 (Year 4), 57 (Year 5))
Modification Type
• Addition of indicator.• Addition of note in Annex 1 stating that “This indicator aggregates the three relevant indicators under the 47 schools, Construction of COSDECs (also includes the Arts and Crafts Centre), and Construction of RSRCs sub‐activities.”
Justification • To add a relevant Common Indicator, per MCC’s requirements. • To add clarity to what the indicator is measuring and thus avoid possible double‐counting of educational facilities constructed.
Indicator Modification Form
Date September 2012
Project/Activity Education/Multiple Activities
Indicator
Value of signed educational facility construction, rehabilitation, and equipping contracts, defined as “The value of all signed construction contracts for educational facility construction, rehabilitation, or equipping (e.g. information technology, desks and chairs, electricity and lighting, water systems, latrines) using compact funds.” (unit: US Dollars; level: process; classification: cumulative; source: Construction Supervisory Firm Reports/MCA‐N; frequency: Quarterly; responsible party: MCA‐N; baseline: 0 (2009); targets: n/a (Year 1), n/a (Year 2), 72,993,740 (Year 3), 89,382,730 (Year 4), 90,382,730 (Year 5))
Modification Type
• Addition of indicator.• Addition of note in Annex 1 stating that “This indicator aggregates the three relevant indicators under the 47 schools, Construction of COSDECs, and Construction of RSRCs sub‐activities.”
Justification • To add a relevant Common Indicator, per MCC’s requirements. • To add clarity to what the indicator is measuring and thus avoid possible
77 See MCC’s Guidance on Common Indicators, May 2012, Version 1.0.

36 | Annex 3
double‐counting of contractual commitments for education infrastructure.
Indicator Modification Form
Date September 2012
Project/Activity Education/Multiple Activities
Indicator
Percent disbursed of educational facility construction, rehabilitation, and equipping contracts, defined as “The total amount of all signed construction contracts for education facility works or equipping divided by the total value of all signed contracts.” (unit: %; level: process; classification: cumulative; source: Construction Supervisory Firm Reports/MCA‐N; frequency: Quarterly; responsible party: MCA‐N; baseline: 0 (2009); targets: n/a (Year 1), n/a (Year 2), 66% (Year 3), 83% (Year 4), 100% (Year 5))
Modification Type
• Addition of indicator.• Addition of note in Annex 1 stating that “This indicator aggregates relevant indicators under the 47 schools, Construction of COSDECs, and Construction of RSRCs sub‐activities.”
Justification • To add a relevant Common Indicator, per MCC’s requirements. • To add clarity to what the indicator is measuring.
Improving the Quality of General Education (sub‐activity: Improving the Quality of Education in Schools (47 schools)) Indicator Modification Form
Date September 2012
Project/ Activity Education/Improving the Quality of General Education (sub‐activity: Improving the Quality of Education in Schools (47 schools))
Indicator Percentage of learners attaining “Basic Achievement” or higher on the Grade 5 NSAT – English – 47 schools
Modification Type • Adjustment of reporting period from “Annually” to “Years 3 and 5”.
Justification • To accurately reflect the timing of data collection and reporting to match when the Grade 5 NSATs are taken and data are actually available.
Indicator Modification Form
Date September 2012
Project/ Activity Education/Improving the Quality of General Education (sub‐activity: Improving the Quality of Education in Schools (47 schools))
Indicator Percentage of learners attaining “Basic Achievement” or higher on the Grade 5 NSAT – Mathematics – 47 schools
Modification Type • Adjustment of reporting period from “Annually” to “Year 3, 5”.
Justification • To accurately reflect the timing of data collection and reporting to match when the Grade 5 NSATs are taken and data are actually available.
Indicator Modification Form
Date September 2012
Project/ Activity Education/Improving the Quality of General Education (sub‐activity: Improving the Quality of Education in Schools (47 schools))
Indicator Pass rate of JSC learners (grade 10) – Math – 47 schools
Modification Type • Adjustment of timing of reporting against targets, per table below.
Justification
• To remove inconsistency between Annexes 1 and 2 of the March 2012 M&E Plan and, more importantly, to reflect that tracking of this indicator will be done in Years 4 and 5 since it would not make sense to report on the indicator earlier given its level (outcome level and, therefore, changes only expected further into Compact implementation).

37 | Annex 3
Indicator Unit Baseline Year 1 Year 2 Year 3 Year 4 Year 5
Previous
Pass rate…78 % 34.1% 34.1% 34.1% 40.9% 49.1% 58.9%
Modified
Pass rate…79 % 34.1% 49.1% 58.9%
Indicator Modification Form
Date September 2012
Project/ Activity Education/Improving the Quality of General Education (sub‐activity: Improving the Quality of Education in Schools (47 schools))
Indicator Pass rate of JSC learners (grade 10) – Science – 47 schools
Modification Type • Adjustment of timing of reporting against targets, per table below.
Justification
• To remove inconsistency between Annexes 1 and 2 of the March 2012 M&E Plan and, more importantly, to reflect that tracking of this indicator will be done in Years 4 and 5 since it would not make sense to report on the indicator earlier given its level (outcome level and, therefore, changes only expected further into Compact implementation).
Indicator Unit Baseline Year 1 Year 2 Year 3 Year 4 Year 5
Previous
Pass rate…80 % 38.6% 38.6% 38.6% 46.3% 55.5% 66.6%
Modified
Pass rate…81 % 38.6% 55.5% 66.6%
Indicator Modification Form
Date September 2012
Project/ Activity Education/Improving the Quality of General Education (sub‐activity: Improving the Quality of Education in Schools (47 schools))
Indicator Pass rate of JSC learners (grade 10) – English – 47 schools
Modification Type • Adjustment of timing of reporting against targets, per table below.
Justification
• To remove inconsistency between Annexes 1 and 2 of the March 2012 M&E Plan and, more importantly, to reflect that tracking of this indicator will be done in Years 4 and 5 since it would not make sense to report on the indicator earlier given its level (outcome level and, therefore, changes only expected further into Compact implementation).
Indicator Unit Baseline Year 1 Year 2 Year 3 Year 4 Year 5
Previous
Pass rate…82 % 39.3% 39.3% 39.3% 47.2% 56.6% 67.9%
Modified
Pass rate…83 % 39.3% 56.6% 67.9%
Indicator Modification Form
Date September 2012
Project/ Activity Education/Improving the Quality of General Education (sub‐activity: Improving the Quality of Education in Schools (47 schools))
Indicator Pass rate of NSSC learners (grade 12) – Math – 47 schools
Modification Type • Adjustment of timing of reporting against targets, per table below.
Justification • To remove inconsistency between Annexes 1 and 2 of the March 2012 M&E
78 Pass rate of JSC learners (grade 10)‐Math‐47 schools 79 Pass rate of JSC learners (grade 10)‐Math‐47 schools 80 Pass rate of JSC learners (grade 10)‐Science‐47 schools 81 Pass rate of JSC learners (grade 10)‐Science‐47 schools 82 Pass rate of JSC learners (grade 10)‐English‐47 schools 83 Pass rate of JSC learners (grade 10)‐English‐47 schools

38 | Annex 3
Plan and, more importantly, to reflect that tracking of this indicator will be done in Years 4 and 5 since it would not make sense to report on the indicator earlier given its level (outcome level and, therefore, changes only expected further into Compact implementation).
Indicator Unit Baseline Year 1 Year 2 Year 3 Year 4 Year 5
Previous
Pass rate…84 % 29.8% 29.8% 29.8% 35.7% 42.9% 51.4%
Modified
Pass rate…85 % 29.8% 42.9% 51.4%
Indicator Modification Form
Date September 2012
Project/ Activity Education/Improving the Quality of General Education (sub‐activity: Improving the Quality of Education in Schools (47 schools))
Indicator Pass rate of NSSC learners (grade 12) – Science – 47 schools
Modification Type • Adjustment of timing of reporting against targets, per table below.
Justification
• To remove inconsistency between Annexes 1 and 2 of the March 2012 M&E Plan and, more importantly, to reflect that tracking of this indicator will be done in Years 4 and 5 since it would not make sense to report on the indicator earlier given its level (outcome level and, therefore, changes only expected further into Compact implementation).
Indicator Unit Baseline Year 1 Year 2 Year 3 Year 4 Year 5
Previous
Pass rate…86 % 31.6% 31.6% 31.6% 38.0% 45.5% 54.7%
Modified
Pass rate…87 % 31.6% 45.5% 54.7%
Indicator Modification Form
Date September 2012
Project/ Activity Education/Improving the Quality of General Education (sub‐activity: Improving the Quality of Education in Schools (47 schools))
Indicator Pass rate of NSSC learners (grade 12) – English – 47 schools
Modification Type • Adjustment of timing of reporting against targets, per table below.
Justification
• To remove inconsistency between Annexes 1 and 2 of the March 2012 M&E Plan and, more importantly, to reflect that tracking of this indicator will be done in Years 4 and 5 since it would not make sense to report on the indicator earlier given its level (outcome level and, therefore, changes only expected further into Compact implementation).
Indicator Unit Baseline Year 1 Year 2 Year 3 Year 4 Year 5
Previous
Pass rate…88 % 50.8% 50.8% 50.8% 60.9% 73.1% 87.8%
Modified
Pass rate…89 % 50.8% 73.1% 87.8%
84 Pass rate of NSSC learners (grade 12)‐Math‐47 schools 85 Pass rate of NSSC learners (grade 12)‐Math‐47 schools 86 Pass rate of NSSC learners (grade 12)‐Science‐47 schools 87 Pass rate of NSSC learners (grade 12)‐Science‐47 schools 88 Pass rate of NSSC learners (grade 12)‐English‐47 schools 89 Pass rate of NSSC learners (grade 12)‐English‐47 schools

39 | Annex 3
Improving the Quality of General Education (sub‐activity: Policy, Operational, and Administrative Support) Indicator Modification Form
Date September 2012
Project/Activity Education/Improving the Quality of General Education (sub‐activity: Policy, Operational, and Administrative Support)
Indicator People trained in facilities maintenance management
Modification Type • Adjustment of timing and value of targets, per table below.
Justification • To reflect the realities of the delay that was caused by a re‐bid for this consultancy and a change in the expected training schedule.
Indicator Unit Baseline Year 1 Year 2 Year 3 Year 4 Year 5
Previous
People trained…90 # 0 100 100 200
Modified
People trained…91 # 0 200 200
Indicator Modification Form
Date September 2012
Project/Activity Education/Improving the Quality of General Education (sub‐activity: Policy, Operational, and Administrative Support)
Indicator Regional Continuous Professional Development (CPD) Coordinating Committees
Modification Type • Change indicator level from outcome to output.
Justification • To reflect the appropriate level of the indicator.
Improving the Quality of General Education (sub‐activity: COE Equipment) Indicator Modification Form
Date September 2012
Project/Activity Education/Improving the Quality of General Education (sub‐activity: Colleges of Education equipment)
Indicator
Value of science teaching equipment delivered, defined as “The value of science teaching equipment delivered to UNAM.” (unit: US Dollars; level: process; classification: cumulative; source: MCA‐N; frequency: Annually in Year 4, 5; responsible party: MCA‐N; baseline: 0 (2009); targets: N/A (Year 1), N/A (Year 2), N/A (Year 3), 306,890 (Year 4), 306,890 (Year 5))
Modification Type • Addition of indicator.
Justification • To track progress in this sub‐activity.
Vocational and Skills Training Indicator Modification Form
Date September 2012
Project/Activity Education/Vocational and Skills Training (Multiple Vocational and Skills Training Sub‐Activities)
Indicator
Students participating in MCC‐supported education activities, defined as “The number of students enrolled or participating in MCC‐supported educational schooling programs.” (unit: #; level: outcome; classification: cumulative; source: NTA/MCA‐N; frequency: Quarterly; responsible party: MCA‐N; gender disaggregation: yes; baseline: 0 (2009); targets: n/a (Year 1), n/a (Year 2), 599 (Year 3), 1,638 (Year 4), 8,638 (Year 5))
90 People trained in facilities maintenance management 91 People trained in facilities maintenance management

40 | Annex 3
Modification Type
• Addition of indicator.• Addition of note in Annex 1 stating that “This indicator aggregates the two relevant indicators under the Establishment of the NTF and Competitive Grants for High Priority Vocational Skills Training sub‐activities.”
Justification • To add a relevant Common Indicator, per MCC’s requirements. • To add clarity to what the indicator is measuring and thus avoid possible double‐counting of participating trainees.
Vocational and Skills Training (sub‐activity: Establishment of NTF) Indicator Modification Form
Date September 2012
Project/Activity Education/Vocational and Skills Training (sub‐activity: Establishment of NTF)
Indicator Contract signed for NTA Advisor
Modification Type • Deletion of indicator.
Justification • To remove a low‐level milestone that does not need to be tracked in the M&E Plan.
Indicator Modification Form
Date September 2012
Project/Activity Education/Vocational and Skills Training (sub‐activity: Establishment of NTF)
Indicator NTF levy collection system operational
Modification Type • Addition of definition stated as follows: “The date upon which the NTF levycollection system is completely set up and ready to start collecting levy payments.”
Justification • To add missing information about how the indicator is defined.
Vocational and Skills Training (sub‐activity: Competitive Grants for High Priority Vocational Skills Training) Indicator Modification Form
Date September 2012
Project/Activity Education/Vocational and Skills Training (sub‐activity: Competitive Grants for High Priority Vocational Skills Training)
Indicator Value of Vocational Training Grants awarded through the MCA‐N Grant Facility
Modification Type • Change of indicator level from output to process.
Justification • To use the appropriate level.
Indicator Modification Form
Date September 2012
Project/Activity Education/Vocational and Skills Training (sub‐activity: Competitive Grants for High Priority Vocational Skills Training)
Indicator VTGF‐supported individuals who have completed training
Modification Type
• Change of indicator name to “Graduates from MCC‐supported education activities”. • Change of indicator definition from “The total number of trainees who complete vocational training and graduate with formal certifications awarded through the MCA‐N grant facility” to “The number of students graduating from the highest grade (year) for that educational level in MCC‐supported education schooling programs.” • Change of indicator level from “Output” to “Outcome”. • Addition of a note in Annex 1 stating that “For the purposes of the Namibia Compact, this indicator measures the total number of trainees funded through the MCA‐N grant facility who complete vocational training and graduate with formal certifications awarded.” • Change of baseline year and value to “2009” and “0”, per table below.

41 | Annex 3
• Adjustment of targets, per the table below.
Justification
• To conform to MCC’s relevant Common Indicator (E‐7).• To conform to the Common Indicator’s definition. • To conform to the Common Indicator’s level. • To provide clarity as to how the Common Indicator is being applied in the Namibian vocational education/skills training sector context. • To reflect the actual baseline year and value. • To correctly reflect the targets based on the anticipated number of trainees multiplied by the 85% target pass rate, according to how the initial targets were set but now taking into account the lag between trainees enrolling in a program and graduating from that program.
Indicator Unit Baseline Year 1 Year 2 Year 3 Year 4 Year 5
Previous
VTGF‐supported…92
# TBD 509 1,392 1,392
Modified
Graduates from…93 # 0 77 509 1,392
Indicator Modification Form
Date September 2012
Project/Activity Education/Vocational and Skills Training (sub‐activity: Competitive Grants for High Priority Vocational Skills Training)
Indicator
NQA‐accredited and/or NTA‐registered vocational training providers, defined as “The number of NQA‐accredited and/or NTA‐registered vocational training providers.” (unit: #; level: outcome; classification: level; source: NTA and NQA; frequency: Annually; responsible party: NTA and NQA; baseline: TBD (2009); targets: N/A (2010), N/A (2011), N/A (2012), TBD (2013), TBD (2014))
Modification Type • Addition of indicator.
Justification • In order to determine the number of NQA‐accredited and NTA‐registered Training Providers (TPs) in Namibia, with the presumption that MCA‐N’s effort with contribute to wider formal participation in the sector.
Indicator Modification Form
Date September 2012
Project/Activity Education/Vocational and Skills Training (sub‐activity: Competitive Grants for High Priority Vocational Skills Training)
Indicator Net enrolment
Modification Type
• Change of indicator name to “Enrolment in vocational/skills training” with a related change in definition from “The total net number of unique students (headcount) who enrol in one or more courses in the academic year, disaggregated by COSDEC, VTC, private service provider.” to “The total number of students who enrol in one or more vocational courses in the calendar year with NQA‐accredited or NTA‐registered vocational training providers (VTPs).” • Change of source from “NTA” to “NTA and NQA”. • Change of baseline and target values, per table below. • Addition of a note that reads “In cases where a VTP is both NQA‐accredited and NTA‐registered and the enrolment data from the two sources do not match, the NQA‐sourced data will take precedence.”
Justification
• To follow up on the DQR findings (Round 2 of the bi‐annual ex‐post reviews) that data reported against this indicator, as previously conceived, are limited by possible double‐counting and by the unreliability of reporting by non‐accredited/‐registered TPs. (A return to net enrolment may be considered
92 VTGF‐supported individuals who have completed training 93 Graduates from MCC‐supported education activities

42 | Annex 3
after the Vocational Education Management Information System (VETMIS) that has been in the pipeline for quite some time now is in place and has been tested.) • To additionally reflect NQA as one of the data sources. • To reflect baseline and target values based on the definitional change. • To provide clarification and transparency as to which data source takes precedence in cases of discrepancies. The NQA‐sourced data take precedence given that VTPs have a higher administrative burden to meet with the NQA and a greater incentive to report accurately to that institution as being accredited by the national quality standards‐setting entity carries greater weight (e.g., in terms of attracting students) than simply being registered with the NTA.
Indicator Unit Baseline Year 1 Year 2 Year 3 Year 4 Year 5
Original
Net enrolment # 4,619 5,119 5,619 6,619 8,619 10,197
Modified
Enrolment in vocational/skills training
# TBD TBD TBD
Indicator Modification Form
Date September 2012
Project/Activity Education/ Vocational and Skills Training (sub‐activity: Competitive Grants for High Priority Vocational Skills Training)
Indicator
Employed graduates of MCC‐supported education activities, defined as “The number of MCC‐supported training program graduates employed in their field of study within one year after graduation.” (unit: #; level: outcome; classification: cumulative; source: Tracer Survey of Vocational Trainees; frequency: Annually in Year 4, 5; responsible party: Vocational Education evaluator; baseline: 0 (2009); targets: N/A (Year 1), N/A (Year 2), N/A (Year 3), 1,044 (Year 4), 1,044 (Year 5))
Modification Type
• Addition of indicator. (Note that the targets were set by multiplying the targets in the related “% of trainees who secure employment” indicator (i.e., 75% in Years 4 and 5) with the targets in the “VTGF‐supported individuals who have completed training” indicator (i.e., 1,392 in Years 4 and 5).)
Justification • To add a relevant Common Indicator (E‐8), per MCC’s requirements.
Vocational and Skills Training (sub‐activity: Construction and Upgrading of 9 Community Skills and Development Centres) Indicator Modification Form
Date September 2012
Project/Activity Education/Vocational and Skills Training (sub‐activity: Construction and Upgrading of 9 Community Skills and Development Centres)
Indicator Value disbursed against design/supervisory contracts for COSDECs
Modification Type
• Adjustment of target values, per the table below.
Justification • To reflect the current expectations for disbursements against said contracts.
Indicator Unit Baseline Year 1 Year 2 Year 3 Year 4 Year 5
Previous
Value …94 US Dollars
0 670,000 920,000 1,000,000 1,600,000 1,600,000
Modified
Value …95 US 0 670,000 920,000 1,000,000 1,500,000 1,600,000
94 Value disbursed against design/supervisory contracts for COSDECs 95 Value disbursed against design/supervisory contracts for COSDECs

43 | Annex 3
Dollars
Indicator Modification Form
Date September 2012
Project/Activity Education/Vocational and Skills Training (sub‐activity: Construction and Upgrading of 9 Community Skills and Development Centres)
Indicator % disbursed against design/supervisory contracts for COSDECs
Modification Type • Adjustment of target values, per the table below.
Justification • To reflect the current expectations for disbursements against said contracts.
Indicator Unit Baseline Year 1 Year 2 Year 3 Year 4 Year 5
Previous
% disbursed …96 % 0 33% 46% 63% 100% 100%
Modified
% disbursed …97 % 0 33% 46% 63% 94% 100%
Indicator Modification Form
Date September 2012
Project/Activity Education/Vocational and Skills Training (sub‐activity: Construction andUpgrading of 9 Community Skills and Development Centres)
Indicator
Arts and Craft Centres completed, defined as “The number of Arts and Crafts Centres that are fully completed.” (unit: #; level: output; classification: cumulative; source: Construction Supervisory Firm Reports; frequency: Quarterly (starting in Year 5); responsible party: MCA‐N; baseline: n/a (2009); targets: N/A (Year 1), N/A (Year 2), N/A (Year 3), N/A (Year 4), 1 (Year 5))
Modification Type • Addition of indicator and its related information.
Justification • To track progress towards the completion of the Arts and Craft Centre.
Vocational and Skills Training (sub‐activity: COSDECs Management Training)
Indicator Modification Form
Date September 2012
Project/Activity Education/Vocational and Skills Training (sub‐activity: COSDECS Management training)
Indicator COSDEC Consultant/ TA contract signed
Modification Type • Deletion of indicator.
Justification • To remove a low‐level milestone indicator that does not need to be reflected in the M&E Plan.
Indicator Modification Form
Date September 2012
Project/Activity Education/Vocational and Skills Training (sub‐activity: COSDECS Management Training)
Indicator COSDEC, VTC and NTA staff trained in admin/management
Modification Type
• Change of indicator name to “COSDEC staff trained in management” and related change in definition to “The number of COSDEC staff who participate in management training.” • Change of source from “MCA‐N” to “Consultant’s Report”. Change of baseline year from “2009/2010” to “2009”. • Adjustment of target values, per the table below.
Justification • To reflect the actual intervention, which is aimed at COSDECs’ management training, per the sub‐activity name. • To reflect the actual data source.
96 % disbursed against design/supervisory contracts for COSDECs 97 % disbursed against design/supervisory contracts for COSDECs

44 | Annex 3
• To correct erroneous data and reflect the actual number of relevant people anticipated to be trained and, given the cumulative nature of the indicator, to reflect the target value through Year 5.
Indicator Unit Baseline Year 1 Year 2 Year 3 Year 4 Year 5
Previous
COSDEC …98 # 0 (2009/2010)
20
Modified
COSDEC …99 # 0 (2009)
15 15 15
Improving Access to and Management of Adequate Textbooks (sub‐activities: Procurement of Priority and General Textbooks) Indicator Modification Form
Date September 2012
Project/Activity Education/Improving Access to and Management of Adequate Textbooks (sub‐activities: Procurement of Priority and General Textbooks)
Indicator First textbook procurement contract signed
Modification Type • Deletion of indicator.
Justification • To remove a low level milestone indicator that does not need to be tracked in the M&E Plan.
Textbook Management Training Indicator Modification Form
Date September 2012
Project/Activity Education/Improving Access to and Management of Adequate Textbooks (sub‐activity: Textbook Management Training)
Indicator Educators trained to be textbook management trainers
Modification Type • Updating of targets, per the table below.
Justification • To update targets to reflect current expectations about implementation progress.
Indicator Unit Baseline Year 1 Year 2 Year 3 Year 4 Year 5
Previous
Educators trained …100 # 0 100 100 100
Modified
Educators trained…101 # 0 100 100
Indicator Modification Form
Date September 2012
Project/Activity Education/Improving Access to and Management of Adequate Textbooks (sub‐activity: Textbook Management Training)
Indicator Educators trained to be textbook utilization trainers
Modification Type • Updating of targets, per the table below.
Justification • To lay out targets that reflects current expectations of implementation progress.
Indicator Unit Baseline Year 1 Year 2 Year 3 Year 4 Year 5
Previous
Educators trained …102 # 0 100 100 100
98 COSDEC, VTC and NTA staff trained in admin/management 99 COSDEC, VTC and NTA staff trained in admin/management 100 Educators trained to be textbook management trainers 101 Educators trained to be textbook management trainers

45 | Annex 3
Modified
Educators trained…103 # 0 100 100
Expanding and Improving Access to Tertiary Finance (sub‐activity: Developing a Financially Sustainable and Equitable Scholarship and Loan System) Indicator Modification Form
Date September 2012
Project/Activity Education/Expanding and Improving Access to Tertiary Finance (sub‐activity: Developing a Financially Sustainable and Equitable Scholarship and Loan System)
Indicator Modified NSFAF MIS completed.
Modification Type • Adjustment of target date, per the table below.
Justification • To reflect the longer‐than‐initially‐anticipated timeline for the implementation of the NSFAF MIS, given the challenges that are being experienced.
Indicator Unit Baseline Year 1 Year 2 Year 3 Year 4 Year 5
Previous
Modified NSFAF MIS completed
Date Nov‐12
Modified
Modified NSFAF MIS completed
Date Jun‐13
Tourism Project Indicators Multiple activities Indicator Modification Form
Date September 2012
Project/Activity Tourism/Multiple Activities
Indicator Leisure tourist arrivals
Modification Type • Adjustment of baseline year and baseline and target values, per the table below (and related adjustment in reporting frequency to “Annually (starting in Year 4)”).
Justification • To bring the baseline closer to the start of the sub‐activity’s implementationand reflect the years for which targets are to be set (targets to be set in the next M&E Plan revision).
Indicator Unit Baseline Year 1 Year 2 Year 3 Year 4 Year 5
Previous
Leisure tourist arrivals
# 474,426 (2007)
594,326 640,683 690,657
Modified
Tourist arrivals # 416,991(2010)
TBD TBD
Indicator Modification Form
Date September 2012
Project/Activity Tourism/Multiple Activities
Indicator
Tourist arrivals, defined as “The total number of tourist arrivals recorded per calendar year.” (unit: #; level: outcome; classification: level; source: MET; frequency: Annually (starting in Year 4); responsible party: MET; baseline: 984,099 (2010); targets: n/a (Year 1); n/a (Year 2); n/a (Year 3); TBD (Year 4);
102 Educators trained to be textbook utilization trainers 103 Educators trained to be textbook utilization trainers

46 | Annex 3
TBD (Year 5))
Modification Type • Addition of indicator.
Justification • To include an indicator that tracks arrival numbers in the broader tourist market that the activities under the MCA‐N Tourism Project may also affect, though not as directly as leisure tourists that are the focus of the intervention.
Improving Management and Infrastructure in Etosha National Park (sub‐activity: ENP Management Reform and Investment Promotion) Indicator Modification Form
Date September 2012
Project/Activity Tourism/Improving Management and Infrastructure in Etosha National Park (sub‐activity: ENP Management Reform and Investment Promotion)
Indicator Opening of Galton Gate for general tourist use
Modification Type
• Change of definition from “The date on which Galton Gate is opened for general tourist use (self‐drive tourists).” to “The operational date on which Galton Gate is opened for general self‐drive tourist use without restriction (i.e., without them having to have made reservations at Dolomite Camp or having to be driven by a tour operator with access privileges).” • Adjustment of target, per table below.
Justification • To accurately specify what the indicator and its existing target date refer to. • To reflect the currently‐anticipated date by which the target will be achieved.
Indicator Unit Baseline Year 1 Year 2 Year 3 Year 4 Year 5
Previous
Opening of…104 Date 31‐Jul‐14
Modified
Opening of…105 Date 31‐Jan‐13
Indicator Modification Form
Date September 2012
Project/ Activity Tourism/Improving Management and Infrastructure in Etosha National Park (sub‐activity: ENP Management Reform and Investment Promotion)
Indicator Entries and exits through Galton Gate
Modification Type
• Adjustment of the frequency of reporting from “Quarterly in Year 1, 2, 3, 4, 5” to “Quarterly in Year 4 and 5”. • Addition of a note to Annex 1 stating “This indicator will be reported as cumulative within a year but level across years.”
Justification
• To remove inconsistency between Annexes 1 and 2 of the March 2012 M&E Plan and accurately reflect that tracking of this indicator will be done quarterly in Years 4 and 5 when movement in the indicator’s values are expected to become evident. • To add detail and clarity to how reporting will be done.
Indicator Modification Form
Date September 2012
Project/Activity Tourism/Improving Management and Infrastructure in Etosha National Park (sub‐activity: ENP Management Reform and Investment Promotion)
Indicator Etosha National Park Gross Revenue
Modification Type
• Change of indicator name to “Etosha National Park gross revenue from gate receipts” with related change in definition from “The annual total gross revenue generated by ENP, including gate receipts and concession fees” to “The annual total gross revenue generated by ENP from gate receipts (refunds
104 Opening of Galton Gate for general tourist use 105 Opening of Galton Gate for general tourist use

47 | Annex 3
are not included)” and a note in Annex 1 stating that “Refunds are not includedas their total value across all parks is low and determining which refunds go to which park would be a time consuming task.”
Justification
• To more precisely reflect what the indicator is measuring and to follow up on the DQR team’s recommendation (in Round 1 of the ex‐post reviews) to remove concession fees from the indicator as they are not directly related to Park visitors (revenue from whom is of interest with this indicator). In addition, concession fees make the indicator more complicated to interpret, are not always straightforward to distinguish by park, and made up only 5% of total revenue in 2010/11.
Indicator Modification Form
Date September 2012
Project/Activity Tourism/ Improving Management and Infrastructure in Etosha National Park (sub‐activity: ENP Management Reform and Investment Promotion)
Indicator
Etosha National Park gross revenue from conservancy‐sourced concession fees, defined as “The annual total gross revenue generated by ENP from concessions paid by conservancies.” (unit: Namibian Dollars; level: outcome; classification: level; source: Concession Fee Records; frequency: Annually in Year 4, 5; responsible party: MET; baseline: 0 (2009); targets: n/a (Year 1); n/a (Year 2); n/a (Year 3); TBD (Year 4); TBD (Year 5))
Modification Type • Addition of indicator.
Justification
• To include an indicator that tracks revenue from conservancy‐sourcedconcession fees and thus reflect achievement (or lack thereof) in an important component to the MCA‐N intervention under the Tourism Project. Concessions, concession fees, and the related private sector investment are essential to the original program logics of the ENP and CS sub‐activities.
Improving Management and Infrastructure in Etosha National Park (sub‐activity: ENP Management Centres and Staff Housing) Indicator Modification Form
Date September 2012
Project/Activity Tourism/Improving Management and Infrastructure in Etosha National Park (sub‐activity: ENP Management Centres and Staff Housing)
Indicator Value of signed contracts for design/supervisory for ENP housing units/management structures
Modification Type
• Adjustment of target values, per the table below.
Justification • To reflect the higher‐than‐originally‐expected cumulative total due to the higher‐than‐anticipated value of the contract that was signed.
Indicator Unit Baseline Year 1 Year 2 Year 3 Year 4 Year 5
Previous
Value of…106 US Dollars
0 4,350,000 2,500,000 2,500,000 2,500,000
Modified
Value of…107 US Dollars
0 4,350,000 3,057,093 3,057,093 3,057,093
Indicator Modification Form
Date September 2012
Project/Activity Tourism/Improving Management and Infrastructure in Etosha National Park (sub‐activity: ENP Management Centres and Staff Housing)
106 Value of signed contracts for design/supervisory for ENP housing units/management structures 107 Value of signed contracts for design/supervisory for ENP housing units/management structures

48 | Annex 3
Indicator Value disbursed against design/supervisory contracts for ENP housing units/management structures
Modification Type
• Adjustment of target values, per the table below.
Justification
• To reflect the higher‐than‐originally‐expected cumulative total due to the higher‐than‐anticipated value of the contract that was signed. (Note that the disbursed amount will be less than contract value due to optional services to be exercised by Ministry after end‐Compact.)
Indicator Unit Baseline Year 1 Year 2 Year 3 Year 4 Year 5
Previous
Value disbursed…108
US Dollars
0 700,000 1,800,000 2,200,000 2,500,000
Modified
Value disbursed…109
US Dollars
0 700,000 1,800,000 2,200,000 3,025,570
Indicator Modification Form
Date September 2012
Project/Activity Tourism/Improving Management and Infrastructure in Etosha National Park (sub‐activity: ENP Management Centres and Staff Housing)
Indicator % disbursed design/supervisory contracts for ENP housing units/management structures
Modification Type • Adjustment of targets.
Justification • To reflect the adjustments in the numerator and denominator (see tables above).
Indicator Unit Baseline Year 1 Year 2 Year 3 Year 4 Year 5
Previous
% disbursed…110 % 0 16% 72% 88% 100%
Modified
% disbursed…111 % 0 16% 59% 72% 99%
Indicator Modification Form
Date September 2012
Project/Activity Tourism/Improving Management and Infrastructure in Etosha National Park (sub‐activity: ENP Management Centres and Staff Housing)
Indicator Value disbursed against construction, rehabilitation and equipment for ENP housing units/management structures
Modification Type • Adjustment of Year 4’s target value, per the table below.
Justification • To reflect the later‐than‐expected start of disbursement (due to the outstanding CP not having been satisfied).
Indicator Unit Baseline Year 1 Year 2 Year 3 Year 4 Year 5
Previous
Value disbursed…112
US Dollars
0 23,400,000 30,865,708
108 Value disbursed against design/supervisory contracts for ENP housing units/management structures 109 Value disbursed against design/supervisory contracts for ENP housing units/management structures 110 % disbursed design/supervisory contracts for ENP housing units/management structures 111 % disbursed design/supervisory contracts for ENP housing units/management structures 112 Value disbursed against construction, rehabilitation and equipment for ENP housing units/management structures

49 | Annex 3
Modified
Value disbursed…113
US Dollars
0 18,000,000 30,865,708
Indicator Modification Form
Date September 2012
Project/Activity Tourism/Improving Management and Infrastructure in Etosha National Park (sub‐activity: ENP Management Centres and Staff Housing)
Indicator % disbursed against construction and equipment for ENP housing units/management structures
Modification Type • Adjustment of targets.
Justification • To reflect the adjustments in the numerator (see table above).
Indicator Unit Baseline Year 1 Year 2 Year 3 Year 4 Year 5
Previous
% disbursed…114
% 0 76% 100%
Modified
% disbursed…115
% 0 58% 100%
Indicator Modification Form
Date September 2012
Project/Activity Tourism/Improving Management and Infrastructure in Etosha National Park (sub‐activity: ENP Management Centres and Staff Housing)
Indicator Percentage of housing structures completed
Modification Type • Provision of actual targets, per table below.
Justification • To lay out targets to be achieved. The construction of houses is only expected to start in September 2013 due to later‐than‐anticipated contract signing (due to the outstanding CP) and be completed in June 2014.
Indicator Unit Baseline Year 1 Year 2 Year 3 Year 4 Year 5
Previous
Percentage of…116 % 0 TBD TBD TBD
Modified
Percentage of …117 % 0 100%
Indicator Modification Form
Date September 2012
Project/Activity Tourism/Improving Management and Infrastructure in Etosha National Park (sub‐activity: ENP Management Centres and Staff Housing)
Indicator Occupancy rate of new housing units
Modification Type • Update of targets, per table below.
Justification • To reflect anticipated implementation. The houses are expected to be complete in June 2014, with full occupancy following by September 2014.
Indicator Unit Baseline Year 1 Year 2 Year 3 Year 4 Year 5
Previous
Occupancy…118 % 0 42% 100%
Modified
Occupancy…119 % 0 100%
113 Value disbursed against construction, rehabilitation and equipment for ENP housing units/management structures 114 % disbursed against construction and equipment for ENP housing units/management structures 115 % disbursed against construction and equipment for ENP housing units/management structures 116 Percentage of housing structures completed 117 Percentage of housing structures completed 118 Occupancy rate of new housing units

50 | Annex 3
Improving Management and Infrastructure in Etosha National Park (sub‐activity: ENP Maintenance and Game Translocation Equipment) Indicator Modification Form
Date September 2012
Project/Activity Tourism/Improving Management and Infrastructure in Etosha National Park (sub‐activity: ENP Maintenance and Game Translocation Equipment)
Indicator Kilometers of roads and fire breaks in within Etosha National Park maintained by MET
Modification Type • Deletion of indicator.
Justification • Data source not reliable and its interpretation unclear, per DQR findings (in Round 2 of the bi‐annual ex‐post reviews).
Indicator Modification Form
Date September 2012
Project/Activity Tourism/Improving Management and Infrastructure in Etosha National Park (sub‐activity: ENP Maintenance and Game Translocation Equipment)
Indicator Kilometers of roads and fire breaks in conservancies adjacent to ENPmaintained by MET
Modification Type • Deletion of indicator.
Justification • Data source not reliable and its interpretation unclear, per DQR findings (in Round 2 of the bi‐annual ex‐post reviews).
Marketing Namibia in Tourism (sub‐activity: Destination Marketing North America) Indicator Modification Form
Date September 2012
Project/Activity Tourism/Marketing Namibia in Tourism (sub‐activity: Destination Marketing North America)
Indicator Tourist arrivals from the North American market
Modification Type
• Change of indicator name to “Leisure tourist arrivals from the North American market”. • Adjustment of baseline year and baseline and target values, per the table below.
Justification
• To more precisely reflect in the indicator name what the indicator is measuring, per its definition. • To bring the baseline closer to the start of the sub‐activity’s implementation. (Actual target values to be set in the next M&E Plan revision.)
Indicator Unit Baseline Year 1 Year 2 Year 3 Year 4 Year 5
Previous
Tourist arrivals…120
# 19,342 (2007)
24,000 27,000 30,000
Modified
Leisure tourist…121 # 17,246(2010)
TBD TBD
Indicator Modification Form
Date September 2012
Project/Activity Tourism/ Marketing Namibia in Tourism (sub‐activity: Destination Marketing North America)
Indicator Tourist arrivals from the North American market, defined as “The total number
119 Occupancy rate of new housing units 120 Tourist arrivals from the North American market 121 Leisure tourist arrivals from the North American market
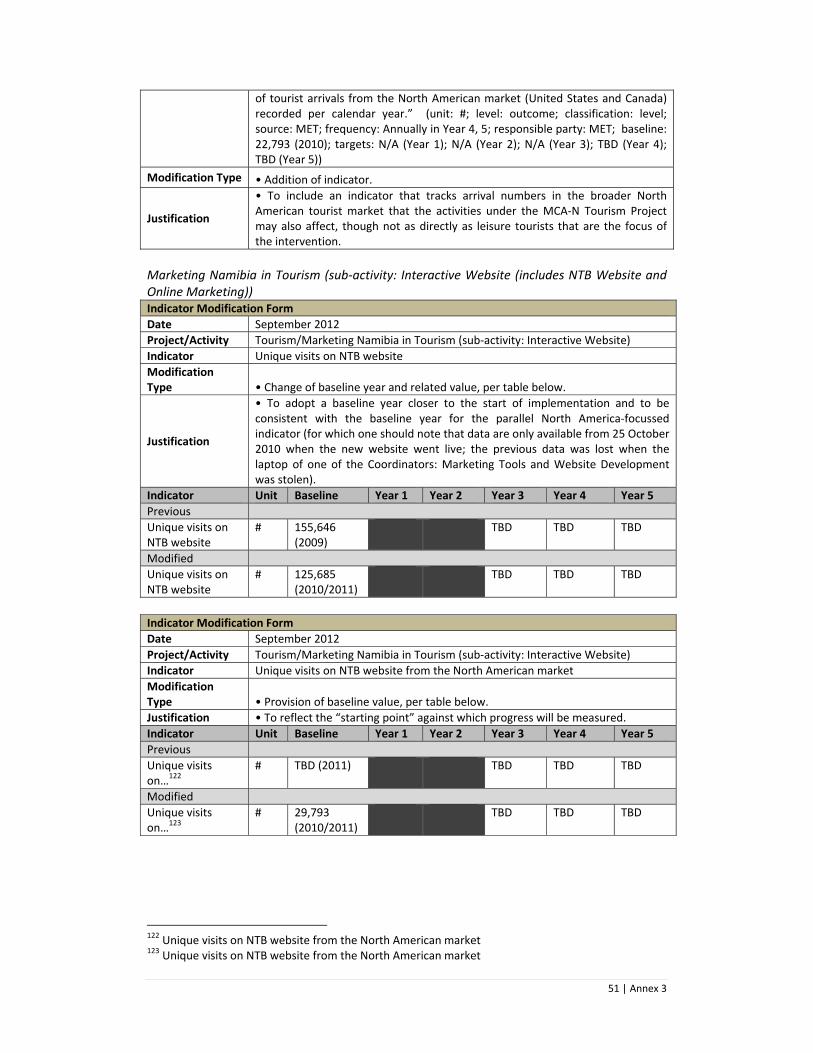
51 | Annex 3
of tourist arrivals from the North American market (United States and Canada) recorded per calendar year.” (unit: #; level: outcome; classification: level; source: MET; frequency: Annually in Year 4, 5; responsible party: MET; baseline: 22,793 (2010); targets: N/A (Year 1); N/A (Year 2); N/A (Year 3); TBD (Year 4); TBD (Year 5))
Modification Type • Addition of indicator.
Justification
• To include an indicator that tracks arrival numbers in the broader North American tourist market that the activities under the MCA‐N Tourism Project may also affect, though not as directly as leisure tourists that are the focus of the intervention.
Marketing Namibia in Tourism (sub‐activity: Interactive Website (includes NTB Website and Online Marketing)) Indicator Modification Form
Date September 2012
Project/Activity Tourism/Marketing Namibia in Tourism (sub‐activity: Interactive Website)
Indicator Unique visits on NTB website
Modification Type • Change of baseline year and related value, per table below.
Justification
• To adopt a baseline year closer to the start of implementation and to be consistent with the baseline year for the parallel North America‐focussed indicator (for which one should note that data are only available from 25 October 2010 when the new website went live; the previous data was lost when the laptop of one of the Coordinators: Marketing Tools and Website Development was stolen).
Indicator Unit Baseline Year 1 Year 2 Year 3 Year 4 Year 5
Previous
Unique visits on NTB website
# 155,646 (2009)
TBD TBD TBD
Modified
Unique visits on NTB website
# 125,685(2010/2011)
TBD TBD TBD
Indicator Modification Form
Date September 2012
Project/Activity Tourism/Marketing Namibia in Tourism (sub‐activity: Interactive Website)
Indicator Unique visits on NTB website from the North American market
Modification Type • Provision of baseline value, per table below.
Justification • To reflect the “starting point” against which progress will be measured.
Indicator Unit Baseline Year 1 Year 2 Year 3 Year 4 Year 5
Previous
Unique visits on…
122
# TBD (2011) TBD TBD TBD
Modified
Unique visits on…123
# 29,793(2010/2011)
TBD TBD TBD
122 Unique visits on NTB website from the North American market 123 Unique visits on NTB website from the North American market

52 | Annex 3
Ecotourism Development for Communal Conservancies (sub‐activity: Conservancy Support – Ecotourism Development Packages) Indicator Modification Form
Date September 2012
Project/Activity Tourism/ Ecotourism Development for Communal Conservancies (sub‐activity: Conservancy Support)
Indicator Value of grants issued by the Conservancy Development Support Grant Fund
Modification Type • Change of indicator level from outcome to process.
Justification • To use the appropriate level.
Indicator Modification Form
Date September 2012
Project/Activity Tourism/Ecotourism Development for Communal Conservancies (sub‐activity: Conservancy Support)
Indicator New Joint Venture lodges or tented camps
Modification Type • Adjustment of Year 5 target, per table below.
Justification • To reflect what can realistically be achieved given the current pace of implementation and what has been contractually agreed to with the implementer via a recent contract amendment.
Indicator Unit Baseline Year 1 Year 2 Year 3 Year 4 Year 5
Previous
New Joint 124… # 0 5 8 10
Modified
New Joint125 … # 0 5 8 12
Indicator Modification Form
Date September 2012
Project/Activity Tourism/Ecotourism Development for Communal Conservancies (sub‐activity: Conservancy Support)
Indicator New small tourism and natural resources enterprises within conservancies
Modification Type • Adjustment of Year 4 and Year 5 targets, per table below.
Justification • To reflect what can realistically be achieved given the current pace of implementation and what has been contractually agreed to with the implementer via a recent contract amendment.
Indicator Unit Baseline Year 1 Year 2 Year 3 Year 4 Year 5
Previous
New small 126… # 0 7 12 15
Modified
New small127 … # 0 7 7 10
Indicator Modification Form
Date September 2012
Project/Activity Tourism/Ecotourism Development for Communal Conservancies (sub‐activity: Conservancy Support)
Indicator Annual General Meetings (AGMs) with financial reports submitted and benefit distribution plans discussed
Modification Type • Adjustment of Year 5 target, per table below.
124New Joint Venture lodges or tented camps 125New Joint Venture lodges or tented camps 126New small tourism and natural resources enterprises within conservancies 127New small tourism and natural resources enterprises within conservancies

53 | Annex 3
Justification
• To reflect what can realistically be achieved and per implementer’s contracttarget. Even though the conservancies decide when and how to conduct the AGM, the CDSS team should provide the necessary capacity for more conservancies to be able to undertake AGMs with financial reports submitted and benefit distribution plans discussed.)
Indicator Unit Baseline Year 1 Year 2 Year 3 Year 4 Year 5
Previous
Annual…128 # 0 14 18 22
Modified
Annual…129 # 0 14 18 25
Indicator Modification Form
Date September 2012
Project/Activity Tourism/Ecotourism Development for Communal Conservancies (sub‐activity: Conservancy Support)
Indicator Median household income in conservancies receiving MCA assistance
Modification Type • Change reporting frequency from “Annually in Year 2,3,4,5” to “Year 5”. • Provision of baseline value, per table below.
Justification • To reflect the actual reporting frequency (based on when data collection will be undertaken). • To reflect baseline data, which are now available.
Indicator Unit Baseline Year 1 Year 2 Year 3 Year 4 Year 5
Previous
Median130… Namibian Dollars
TBD TBD
Modified
Median131
… Namibian Dollars
5,450 TBD
Agriculture Project Indicators Land Access and Management (sub‐activity: Communal Land Support (CLS)) Indicator Modification Form
Date September 2012
Project/Activity Agriculture/Land Access and Management (sub‐activity: CLS)
Indicator Communal Land Support facilitator contract awarded
Modification Type • Deletion of indicator.
Justification • To remove a low‐level process indicator that does not need to be tracked in the M&E Plan.
Indicator Modification Form
Date September 2012
Project/Activity Agriculture/Land Access and Management (sub‐activity: CLS)
Indicator Approved procedure in place for securing/registering rural land management areas
128Annual General Meetings (AGMs) with financial reports submitted and benefit distribution plans discussed 129Annual General Meetings (AGMs) with financial reports submitted and benefit distribution plans discussed 130Median household income in conservancies receiving MCA assistance
131Median household income in conservancies receiving MCA assistance

54 | Annex 3
Modification Type
• Change the indicator name from “Approved procedure in place for securing/registering rural land management areas” to “Approved procedure in place for securing/registering group rights” with parallel change in definition. • Change of target, per table below.
Justification
• To use the appropriate terminology as rural land management areas are only a sub‐set of the broader concept of group rights that is of interest. • To reflect the current uncertainty about the date upon which this milestone will be achieved, pending the transition to a new CLS implementer. After the new contractor comes on board in the first part of 2013, it should be possible to revisit this item and set a target that is realistic.
Indicator Unit Baseline Year 1 Year 2 Year 3 Year 4 Year 5
Previous
Approved…132 Date 31‐May‐12
Modified
Approved…133 Date TBD
Indicator Modification Form
Date September 2012
Project/Activity Agriculture/Land Access and Management (sub‐activity: CLS)
Indicator Rural land management areas secured/registered
Modification Type
• Change of indicator name from “Rural land management areas secured/registered” to “Group rights secured/registered” with a parallel change to the definition. • Change of indicator level from “Process” to “Output”.
Justification • To use the appropriate terminology as rural land management areas are only a sub‐set of the broader concept of group rights that is of interest. • To use the appropriate level.
Indicator Modification Form
Date September 2012
Project/Activity Agriculture/Land Access and Management (sub‐activity: CLS)
Indicator Parcels corrected or incorporated in land system
Modification Type • Adjustment of timing of targets, per table below.
Justification
• A target cannot be set for Year 3 (and the Year 4 and 5 targets remain TBD) pending the transition to a new CLS implementer. Note that the previous cumulative end‐of‐Compact target (of 10,500 parcels) is also changed to TBD because of updated information about the universe of parcels that have not been incorporated into the land system. Year 4 and 5 targets, to be established after the new implementer is contracted, will reflect this new information along with what can be feasibly accomplished within the remaining Compact period.
Indicator Unit Baseline Year 1 Year 2 Year 3 Year 4 Year 5
Previous
Parcels …134 # 0 TBD TBD TBD
Modified
Parcels…135 # 0 TBD TBD
Indicator Modification Form
Date September 2012
Project/Activity Agriculture/Land Access and Management (sub‐activity: CLS)
Indicator Average number of days to register a land right
132 Approved procedure in place for securing/registering rural land management rights 133 Approved procedure in place for securing/registering group rights 134 Parcels corrected or incorporated in land system 135 Parcels corrected or incorporated in land system

55 | Annex 3
Modification Type • Deletion of indicator.
Justification
• The data are not meaningful (e.g., in some periods, registering rights is not a priority and the figures would not tell the true story). Moreover, the registration of parcels will not continue at a significant level post‐Compact as most available parcels to be registered will have been registered, with little registration activity required beyond that.
Indicator Modification Form
Date September 2012
Project/Activity Agriculture/Land Access and Management (sub‐activity: CLS)
Indicator Percentage of rights registered
Modification Type • Deletion of indicator.
Justification
• The data are not meaningful (e.g., in some periods, registering rights is not a priority and the figures would not tell the true story). Moreover, the registration of parcels will not continue at a significant level post‐Compact as most available parcels to be registered will have been registered, with little registration activity required beyond that.
Land Access and Management (sub‐activity: Community‐Based Livestock and Rangeland Management (CBRLM)) Indicator Modification Form
Date September 2012
Project/Activity Agriculture/Land Access and Management (sub‐activity: CBRLM)
Indicator CBRLM facilitator contract signed
Modification Type • Deletion of indicator.
Justification • To remove a low‐level milestone indicator that does not need to be tracked in the M&E Plan.
Indicator Modification Form
Date September 2012
Project/Activity Agriculture/Land Access and Management (sub‐activity: CBRLM)
Indicator Participating households registered in the programme
Modification Type • Change of classification from “Cumulative” to “Level”.
Justification • To use the appropriate classification, given that it is more meaningful to track the trend over time (i.e., the number of actively participating households) than to know the running total of households that have ever participated.
Indicator Modification Form
Date September 2012
Project/Activity Agriculture/Land Access and Management (sub‐activity: CBRLM)
Indicator Field facilitators certified in rangeland management
Modification Type • Adjustment of target values, per the table below.
Justification
• To reflect planned implementation in the target. Originally, field facilitators were only going to be certified towards the end of the Compact. However, assessments took place earlier than anticipated and it is expected that some field facilitators will be certified by December 2012.
Indicator Unit Baseline Year 1 Year 2 Year 3 Year 4 Year 5
Previous
Field facilitators…136
# 20
136 Field facilitators certified in rangeland management

56 | Annex 3
Modified
Filed facilitators…137
# 10 20
Indicator Modification Form
Date September 2012
Project/Activity Agriculture/Land Access and Management (sub‐activity: CBRLM)
Indicator
Bare ground, defined as “The proportion of the ground covered by different types of plants, litter, or rock as opposed to unprotected bare ground.” (unit: %; level: outcome; classification: level; source: CBRLM Rangeland Assessment; frequency: Year 5; responsible party: USDA; baseline TBD (2012); targets: N/A (Year 1), N/A (Year 2), N/A (Year 3), N/A (Year 4), TBD (Year 5))
Modification Type • Addition of indicator.
Justification • To track performance in an important outcome of interest (i.e., rangeland health).
Indicator Modification Form
Date September 2012
Project/Activity Agriculture/Land Access and Management (sub‐activity: CBRLM)
Indicator
Soil surface in large inter‐canopy gaps, defined as “The proportion of soil surface in large inter‐canopy gaps.” (unit: %; level: outcome; classification: level; source: CBRLM Rangeland Assessment; frequency: Year 5; responsible party: USDA; baseline TBD (2012); targets: N/A (Year 1), N/A (Year 2), N/A (Year 3), N/A (Year 4), TBD (Year 5))
Modification Type • Addition of indicator.
Justification • To track performance in an important outcome of interest (i.e., rangeland health).
Indicator Modification Form
Date September 2012
Project/Activity Agriculture/Land Access and Management (sub‐activity: CBRLM)
Indicator
Soil aggregate stability, defined as “The average soil aggregate stability (range 1‐6 from stability kit).” (unit: #; level: outcome; classification: level; source: CBRLM Rangeland Assessment; frequency: Year 5; responsible party: USDA; baseline TBD (2012); targets: N/A (Year 1), N/A (Year 2), N/A (Year 3), N/A (Year 4), TBD (Year 5))
Modification Type • Addition of indicator.
Justification • To track performance in an important outcome of interest (i.e., rangeland health).
Indicator Modification Form
Date September 2012
Project/Activity Agriculture/Land Access and Management (sub‐activity: CBRLM)
Indicator Off‐take rate (from sales)
Modification Type • Deletion of indicator.
Justification
• To remove indicators for which no relevant data source is currently available. To the extent possible, measures arising from the realigned evaluation approach will be included, as explained in sections 3.2 and 4.4 of the narrative section of the September 2012 version of the M&E Plan.
137 Field facilitators certified in rangeland management

57 | Annex 3
Indicator Modification Form
Date September 2012
Project/Activity Agriculture/Land Access and Management (sub‐activity: CBRLM)
Indicator Average weight of three‐year old cattle
Modification Type • Deletion of indicator
Justification
• To remove indicators for which no relevant data source is currently available. To the extent possible, measures arising from the realigned evaluation approach will be included, as explained in sections 3.2 and 4.4 of the narrative section of the September 2012 version of the M&E Plan.
Indicator Modification Form
Date September 2012
Project/Activity Agriculture/Land Access and Management (sub‐activity: CBRLM)
Indicator % of herd that are male cattle older than 5 years
Modification Type • Deletion of indicator
Justification
• To remove indicators for which no relevant data source is currently available. To the extent possible, measures arising from the realigned evaluation approach will be included, as explained in sections 3.2 and 4.4 of the narrative section of the September 2012 version of the M&E Plan.
Indicator Modification Form
Date September 2012
Project/Activity Agriculture/Land Access and Management (sub‐activity: CBRLM)
Indicator Average annual household income
Modification Type • Deletion of indicator
Justification
• To remove indicators for which no relevant data source is currently available. To the extent possible, measures arising from the realigned evaluation approach will be included, as explained in sections 3.2 and 4.4 of the narrative section of the September 2012 version of the M&E Plan.
Livestock Support (sub‐activities: Preparatory Studies for Infrastructure and Construction of Vet Centres and Quarantine Camps (SVOs and Q‐Camps)) Indicator Modification Form
Date September 2012
Project/Activity Agriculture/Livestock Support (sub‐activity: Construction of SVOs and Q‐Camps)
Indicator
New state veterinary offices (SVOs) constructed, defined as “The number of new state veterinary offices (SVOs) that are fully constructed” (unit: #; level: output; classification: cumulative; source: Construction Supervisory Firm Reports; frequency: Quarterly; responsible party: MCA‐N; baseline: N/A (2009); targets: N/A (2010), N/A (2011), N/A (2012), 5 (2013), 5 (2014)
Modification Type • Addition of indicator.
Justification • To reflect an important milestone before the SVOs become operational.
Indicator Modification Form
Date September 2012
Project/Activity Agriculture/Livestock Support (sub‐activity: Construction of SVOs and Q‐Camps)
Indicator New state veterinary offices (SVOs) operational
Modification Type • Change the level of the indicator from “output” to “outcome”.
Justification • To place the indicator at the appropriate level, given that SVOs becoming operational represents a higher‐level result than an “output”.

58 | Annex 3
Indicator Modification Form
Date September 2012
Project/Activity Agriculture/Livestock Support (sub‐activity: Construction of SVOs and Q‐Camps)
Indicator Q‐Camps completed
Modification Type • Change of indicator name from “Q‐Camps completed” to “Q‐Camps rehabilitated” with a parallel change in the definition.
Justification • To accurately reflect what the intervention actually involves.
Livestock Support (sub‐activity: Livestock Traceability System) Indicator Modification Form
Date September 2012
Project/Activity Agriculture/Livestock Support (sub‐activity: Livestock Traceability System)
Indicator Request for Proposal (RfP) for livestock tags published
Modification Type • Deletion of indicator.
Justification • To remove a low‐level process indicator that has already been achieved and does not need to be tracked in the higher‐level M&E Plan.
Indicator Modification Form
Date September 2012
Project/Activity Agriculture/Livestock Support (sub‐activity: Livestock Traceability System)
Indicator NamLITS 2.0 complete and fully operational
Modification Type
• Change the definition from “The date on which the Namibia Livestock Identification and Traceability System (NamLITS) database for data from the NCAs is fully operational and able to populated with data (i.e., Release 3 in place)” to “The date on which the Namibia Livestock Identification and Traceability System (NamLITS) database for data from the NCAs is fully operational and able to be populated with data (i.e., Release 4 in place).” • Adjustment of target values, per the table below.
Justification
• To reflect planned implementation in the definition. Originally, functionality was supposed to be added into the system in Release 3, and the system would have been fully operational when Release 3 was commissioned. However, a contract amendment caused some functionality to be removed from Releases 2 and 3 and put into Release 4. Thus, the system will only be fully operational when Release 4 is commissioned, which is currently scheduled for 14 June 2013. • To reflect planned implementation in the target. (See explanation in the bullet above.)
Indicator Unit Baseline Year 1 Year 2 Year 3 Year 4 Year 5
Previous
NamLITS 2.0…138 Date 1‐Sep‐12
Modified
NamLITS 2.0…139
Date 14‐Jun‐13
Indicator Modification Form
Date September 2012
Project/Activity Agriculture/Livestock Support (sub‐activity: Livestock Traceability System)
Indicator Cattle inspections in the previous 12 months in the NCAs by a DVS animal health technician
Modification Type • Deletion of indicator.
Justification • Per DQR findings (in Round 1 of the bi‐annual reviews), inspections are not well defined in the NCAs and therefore data collected are not reliable. (Note
138 NamLITS 2.0 complete and fully operational 139 NamLITS 2.0 complete and fully operational
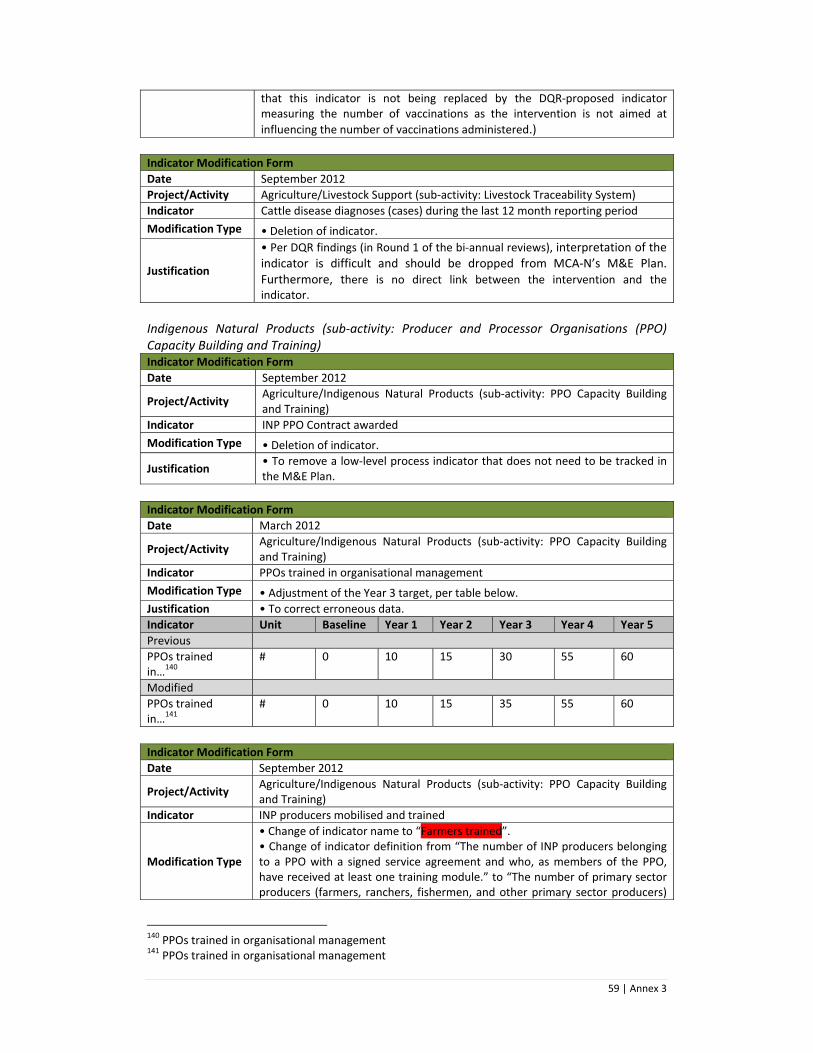
59 | Annex 3
that this indicator is not being replaced by the DQR‐proposed indicator measuring the number of vaccinations as the intervention is not aimed at
influencing the number of vaccinations administered.)
Indicator Modification Form
Date September 2012
Project/Activity Agriculture/Livestock Support (sub‐activity: Livestock Traceability System)
Indicator Cattle disease diagnoses (cases) during the last 12 month reporting period
Modification Type • Deletion of indicator.
Justification
• Per DQR findings (in Round 1 of the bi‐annual reviews), interpretation of the indicator is difficult and should be dropped from MCA‐N’s M&E Plan. Furthermore, there is no direct link between the intervention and the indicator.
Indigenous Natural Products (sub‐activity: Producer and Processor Organisations (PPO) Capacity Building and Training) Indicator Modification Form
Date September 2012
Project/Activity Agriculture/Indigenous Natural Products (sub‐activity: PPO Capacity Building and Training)
Indicator INP PPO Contract awarded
Modification Type • Deletion of indicator.
Justification • To remove a low‐level process indicator that does not need to be tracked in the M&E Plan.
Indicator Modification Form
Date March 2012
Project/Activity Agriculture/Indigenous Natural Products (sub‐activity: PPO Capacity Building and Training)
Indicator PPOs trained in organisational management
Modification Type • Adjustment of the Year 3 target, per table below.
Justification • To correct erroneous data.
Indicator Unit Baseline Year 1 Year 2 Year 3 Year 4 Year 5
Previous
PPOs trained in…140
# 0 10 15 30 55 60
Modified
PPOs trained in…141
# 0 10 15 35 55 60
Indicator Modification Form
Date September 2012
Project/Activity Agriculture/Indigenous Natural Products (sub‐activity: PPO Capacity Building and Training)
Indicator INP producers mobilised and trained
Modification Type
• Change of indicator name to “Farmers trained”.• Change of indicator definition from “The number of INP producers belonging to a PPO with a signed service agreement and who, as members of the PPO, have received at least one training module.” to “The number of primary sector producers (farmers, ranchers, fishermen, and other primary sector producers)
140 PPOs trained in organisational management 141 PPOs trained in organisational management

60 | Annex 3
receiving technical assistance or participating in a training session (on improved production techniques and technologies, including post‐harvest interventions, developing business, financial, or marketing planning, accessing credit or finance, or accessing input and output markets).” • Addition of a note in Annex 1 stating that “For the purposes of the Namibia Compact, this indicator measures the number of INP producers belonging to a PPO with a signed service agreement and who, as members of the PPO, have received at least one training module.”
Justification
• To conform to MCC’s relevant Common Indicator (AI‐6).• To conform to the Common Indicator’s definition. • To provide clarity as to how the Common Indicator is being applied in the Namibian INP sector context.
Indicator Modification Form
Date September 2012
Project/Activity Agriculture/Indigenous Natural Products (sub‐activity: PPO Capacity Building and Training)
Indicator Value‐added of INP processing
Modification Type
• Provision of baseline, per table below.• Provision of actual target values, per table below. • Change of responsible party from “INP Consultant” to “MCA‐N”. • Change of reporting frequency from “Bi‐annually” to “Year 4, 5”.
Justification
• To reflect the baseline figure based on data that is now available. • To reflect target values that have been agreed to with the implementer via a contract amendment. (The targets are based on the original formulae with the only difference being the shift from Year 3 to Year 4 for the BL+5% target.) • To accurately reflect the responsible party. • To accurately reflect the reporting frequency, per contract.
Indicator Unit Baseline Year 1 Year 2 Year 3 Year 4 Year 5
Previous
Value‐added…142 Namibian Dollars
TBD BL+5% BL+20%
Modified
Value added…143 Namibian Dollars
296,029 310,830 355,235
Indicator Modification Form
Date September 2012
Project/Activity Agriculture/Indigenous Natural Products (sub‐activity: PPO Capacity Building and Training)
Indicator Income to producers from INP sales
Modification Type
• Change of indicator name to “Payments to producers from INP sales”. • Provision of baseline, per table below. • Provision of actual target values, per table below. • Change of responsible party from “INP Consultant” to “MCA‐N”. • Change of reporting frequency from “Bi‐annually” to “Year 4, 5”.
Justification
• To reflect the fact that it is not income but rather payment to producers that is being tracked. • To reflect the baseline figure based on data that is now available. • To reflect target values that have been agreed to with the implementer via a contract amendment. (The targets are based on the original formulae with the only difference being the shift from Year 3 to Year 4 for the BL+N$750,000
142 Value added of INP processing 143 Value added of INP processing

61 | Annex 3
target.) • To accurately reflect the responsible party. • To accurately reflect the reporting frequency, which is contractually agreed to.
Indicator Unit Baseline Year 1
Year 2
Year 3 Year 4 Year 5
Previous
Income to…144 Namibian Dollars
TBD BL+N$750,000 BL+N$3mil
Modified
Payments…145 Namibian Dollars
1,174,319 1,924,319 4,174,319
Indicator Modification Form
Date September 2012
Project/Activity Agriculture/Indigenous Natural Products (sub‐activity: PPO Capacity Building and Training)
Indicator
Median household income of INP producers, defined as “The median income of INP producer households.” (unit: Namibian Dollars; level: outcome; classification: level; source: CS/INP Household Survey; frequency: Year 5; responsible party: CS/INP Survey Consultant; baseline: N$7,220 (2010/2011); targets: N/A (Year 1); N/A (Year 2); N/A (Year 3); N/A (Year 4); TBD (Year 5))
Modification Type • Addition of indicator.
Justification • To track median income of INP producer households, which the program logic indicates should increase as a result of the MCA‐N investment.
Indicator Unit Baseline Year 1 Year 2 Year 3 Year 4 Year 5
New
Income of …..146 Namibian Dollars
7,220 TBD
Indicator Modification Form
Date September 2012
Project/Activity Agriculture/Indigenous Natural Products (sub‐activity: PPO Capacity Building and Training)
Indicator Income of households from INP production and sales
Modification Type • Deletion of indicator.
Justification • To remove redundancy with the separate producer sales record‐sourced indicator measuring income from INP sales.
Indigenous Natural Products (sub‐activity: INP Innovation Fund) Indicator Modification Form
Date September 2012
Project/Activity Agriculture/Indigenous Natural Products (sub‐activity: INP Innovation Fund)
Indicator Value of grant agreements signed under the INP Innovation Fund
Modification Type • Change of indicator level from output to process.
Justification • To use the appropriate level.
144 Income to producers from INP sales 145 Payments to producers from INP sales 146 Income of households from INP production and sales

62 | Annex 3
March 2012 In the March 2012 iteration of the M&E Plan, the revisions to the indicator information tables focused on refining the indicators and their definitions, removing as many TBDs as practicable at this stage, correcting or adjusting baseline and target values based on new information and changing realities on the ground, and deleting any indicators that were not adding value (e.g., if their values could not be calculated or if they did not adequately capture the underlying concept) or were otherwise deemed inappropriate (e.g., where they did not fit along the results chain). Changes were also made on the basis of data quality reviews. In addition to the revisions reflected in the below indicator modification forms, all units for indicators that were not otherwise changing were written out in accordance with MCC’s guidance on the ITT (as revised in February 2011), reference to objective level indicators were changed to outcome level, and Annex 1 notes that are no longer applicable or redundant were deleted. Note that cells highlighted in red contain MCC Common Indicators. Later revisions of the M&E Plan will focus on further eliminating TBDs in the target tables on the basis of new information (e.g., survey data becoming available) and refining, removing, and adding indicators as components of activities becoming better defined and related program logics are updated. Additional MCC Common Indicators will also be incorporated, where applicable to the MCA‐N Compact.
Goal Indicators Indicator Modification Form
Date March 2012
Project/Activity Goal
Indicator Median household income, Poverty rate, Unemployment rate
Modification Type Addition of a note to Annex 1 stating the following: “The indicator should be disaggregated by area (Northern Communal Areas (NCAs) versus rest of the country), if practicable.”
Justification MCA‐N’s efforts are focused mainly in the NCAs (and, in light of this, the Government Data Quality Review report makes the same recommendation).
Education Project Indicators Multiple Activities Indicator Modification Form
Date March 2012
Project/Activity Education/ Multiple Activities
Indicator
National Pass Rate of JSC learners (grade 10) – English – Entire Country National Pass Rate of JSC learners (grade 10) – Math – Entire Country National Pass Rate of JSC learners (grade 10) – Science – Entire Country National Pass Rate of NSSC learners (grade 12) – English – Entire Country National Pass Rate of NSSC learners (grade 12) – Math – Entire Country National Pass Rate of NSSC learners (grade 12) – Science – Entire Country
Modification Type Deletion of indicators.
Justification
Given that MCA‐N’s interventions are not focused on impacting national‐level pass rates, these indicators are being deleted. However, while not being tracked in the M&E Plan, where their equivalent is being reported at the 47 school level, these national figures will be tracked internally to provide context/comparison.

63 | Annex 3
Indicator Modification Form
Date March 2012
Project/Activity Education/Multiple Activities
Indicator Promotion rate of 5
thGrade learners – Entire Country
Promotion rate of 7th Grade learners – Entire Country
Modification Type Deletion of indicators.
Justification
In Namibia’s context, the promotion rate is not meaningful in that some learners (those who have repeated a grade once) are allowed into the next grade even if they have not met the promotion requirement for the next grade. Therefore, they are not a reliable measure of education quality, which will be better captured by the National Standardized Achievement Test (NSAT) indicators added in this revision. These indicators are also not applied in the Ministry of Education’s ETSIP Logical Framework. Additionally, the DQR team also raised questions as to whether these indicators are likely to change (sufficiently) in response to the MCA‐N activities and whether any changes can be attributed to MCA‐N, further putting into question their relevance. Furthermore, the deletion of the indicators is in line with the removal of such national‐level education indicators, over which MCA‐N’s interventions will not have a direct influence, in this revision of the M&E Plan.
Improving the Quality of General Education (sub‐activity: Improving the Quality of Education in Schools (47 schools)) Indicator Modification Form
Date March 2012
Project/Activity Education/Multiple Activities and Improving the Quality of General Education (sub‐activity: Improving the Quality of Education in Schools (47 schools))
Indicator
Percentage of learners attaining “Basic Achievement” or higher on the Grade 5 NSAT – English – 47 schools (unit: %; level: outcome; classification: level; source: DNEA; frequency: annually; responsible party: MoE; baseline: 30% (2009); targets: 35% (2011), 40% (2013)) Percentage of learners attaining “Basic Achievement” or higher on the Grade 5 NSAT – Mathematics – 47 schools (unit: %; level: outcome; classification: level; source: DNEA; frequency: annually; responsible party: MoE; baseline: 44% (2009); targets: 49% (2011), 54% (2013))
Modification Type
Addition of indicators and their related information. Note that the indicator definitions will be identical to the indicator names. Targets for the 47 schools are established on the basis of MOE’s guidance for school‐level target‐setting as reflected on page 28 of 48 in the document “SDP and PAAI: A Practical Guide” (July 2008) (the acronym SDP stands for School Development Plan, while PAAI stands for Plan of Action for Academic Improvement). A note in Annex 1 will clarify that “For the purposes of this indicator, 47 schools refers only to the 36 out of 47 schools that offer Grade 5.”
Justification To include meaningful indicators that are more (a) directly relevant to MCA‐N’s activities and (b) valid than the promotion‐related indicators being removed in this revision.
Indicator Modification Form
Date March 2012
Project/Activity Education/Multiple Activities and Improving the Quality of General Education (sub‐activity: Improving the Quality of Education in Schools (47 schools))
Indicator
Percentage of learners who are new entrants in Grade 5 – Entire Country Percentage of learners who are new entrants in Grade 8 – Entire Country Percentage of learners who are new entrants in Grade 5 – 47 schools Percentage of learners who are new entrants in Grade 8 – 47 schools

64 | Annex 3
Modification Type Deletion of indicators.
Justification
In Namibia’s context, the percentage of new entrants to a grade is not meaningful in that some learners (those who have repeated a grade once) are allowed into the next grade even if they have not met the promotion requirement for the next grade. Therefore, the indicators are not a reliable measure of education quality, which will be better captured by the NSAT indicators added in this revision. These indicators are also not used in the Ministry of Education’s ETSIP Logical Framework. Additionally, the DQR team also raised questions as to whether these indicators are likely to change (sufficiently) in response to the MCA‐N activities and whether any changes can be attributed to MCA‐N, further putting into question their relevance. Furthermore, the deletion of the indicators is in line with the removal of such national‐level education indicators, over which MCA‐N’s interventions will not have a direct influence, in this revision of the M&E Plan.
Improving the Quality of General Education (sub‐activity: Improving the Quality of Education in Schools (47 schools)) Indicator Modification Form
Date March 2012
Project/ Activity
Education/Improving the Quality of General Education (sub‐activity: Improving the Quality of Education in Schools (47 schools))
Indicator Value of signed contracts for construction, rehabilitation and equipment for 47 schools
Modification Type
• Change of unit from “US$ mil” to “US Dollars”.• Adjustment of target values, per table below.
Justification
• To conform to MCC’s guidance on the ITT.• To reflect current expectations of the pace of implementation. The overall total amount is lower than initially anticipated as bidding prices came in lower than expected.
Indicator Unit Base‐line
Year 1 Year 2 Year 3 Year 4 Year 5
Original
Value of…147 US$ mil
0 12.91 45.67 52.13 62.08 62.08
Modified
Value of…148 US Dollars
0 12,910,000 45,670,000 55,493,740 57,675,768 58,675,768
Indicator Modification Form
Date March 2012
Project/ Activity
Education/Improving the Quality of General Education (sub‐activity: Improving the Quality of Education in Schools (47 schools))
Indicator Value disbursed against construction, rehabilitation and equipment for 47 schools
Modification Type
• Change of unit from “US$ mil” to “US Dollars”.• Adjustment of target values, per table below.
Justification
• To conform to MCC’s guidance on the ITT.• To reflect current expectations of the pace of implementation. The total cumulative disbursement is changed to reflect new lower expected total value of contracts (see indicator modification table above).
147 Value of signed contracts for construction, rehabilitation and equipment for 47 schools 148 Value of signed contracts for construction, rehabilitation and equipment for 47 schools

65 | Annex 3
Indicator Unit Baseline
Year 1 Year 2 Year 3 Year 4 Year 5
Original
Value disbursed…149
US$ mil
0 1.03 20.71 51.29 61.81 62.08
Modified
Value disbursed…150
US Dollars
0 1,030,000
20,710,000
35,540,023
51,010,164
58,675,768
Indicator Modification Form
Date March 2012
Project/Activity Education/Improving the Quality of General Education (sub‐activity: Improving the Quality of Education in Schools (47 schools))
Indicator % disbursed against construction, rehabilitation and equipment for 47 schools
Modification Type Adjustment of target values, per table below.
Justification To reflect the current pace of implementation, which is ramping up slower than initially anticipated.
Indicator Unit Baseline Year 1 Year 2 Year 3 Year 4 Year 5
Original
% disbursed…151 % 0 8.0% 45.3% 98.4% 99.6% 100%
Modified
% disbursed…152 % 0 8% 45% 64% 87% 100%
Indicator Modification Form
Date March 2012
Project/Activity Education/Improving the Quality of General Education (sub‐activity: Improving the Quality of Education in Schools (47 schools))
Indicator Education facilities constructed, rehabilitated, equipped in the 47 school sub‐activity
Modification Type Adjustment of target values.
Justification
To reflect the slower‐than‐expected pace of implementation due to a procurement process that involved rebidding of tenders, and reduced overall target as 2 of the 47 of the schools to be constructed, rehabilitated, equipped will be the responsibility of MoE.
Indicator Unit Baseline Year 1 Year 2 Year 3 Year 4 Year 5
Original
Education facilities…153
# 0 N/A 13 39 47 47
Modified
Education facilities…154
# 0 0 13 23 45 45
Indicator Modification Form
Date March 2012
Project/Activity Education/Improving the Quality of General Education (sub‐activity: Improving
149 Value disbursed against construction, rehabilitation and equipment for 47 schools 150 Value disbursed against construction, rehabilitation and equipment for 47 schools 151 % disbursed against construction, rehabilitation and equipment for 47 schools 152 % disbursed against construction, rehabilitation and equipment for 47 schools 153 Education facilities constructed, rehabilitated, equipped in the 47 school sub‐activity 154 Education facilities constructed, rehabilitated, equipped in the 47 school sub‐activity

66 | Annex 3
the Quality of Education in Schools (47 schools))
Indicator Number of students (any level) participating in the 47 schools sub‐activity
Modification Type • Change of indicator name to “Learners (any level) participating in the 47 schools sub‐activity”, with the corresponding change in the indicator definition.• Change of indicator’s classification from cumulative to level.
Justification • To employ the terminology used in Namibia’s education sector. • To reflect what is practicable (it is not possible for the data source to report on the number of unique learners or to report on new enrolments each year).
Improving the Quality of General Education (sub‐activity: Policy, Operational, and Administrative Support) Indicator Modification Form
Date March 2012
Project/Activity Education/Improving the Quality of General Education (sub‐activity: Policy, Operational, and Administrative Support)
Indicator
Regional Continuous Professional Development (CPD) Coordinating Committees, defined as “Number of Regional CPDCCs established with members identified and oriented” (unit: #; level: outcome; classification: cumulative; source: CPD unit/University of Namibia (UNAM); frequency: annually; responsible party: CPD unit/UNAM; baseline: 0; targets: N/A (2010), N/A (2011), 13 (2012), 13 (2013), 13 (2014))
Modification Type Addition of indicator.
Justification To track progress on the CPD activities. It is expected that each region in Namibia (thus the cumulative target of 13) will have a CPD Coordinating Committee in order to implement CPD activities at the regional level.
Indicator Modification Form
Date March 2012
Project/Activity Education/Improving the Quality of General Education (sub‐activity: Policy, Operational, and Administrative Support)
Indicator
People trained in facilities maintenance management, defined as “Number of education works inspectors, inspectors of education, and school management staff who are trained as trainers in facility maintenance management” (unit: #; level: output; classification: cumulative; source: MoE/PAD and GS, CPD unit/UNAM and MCA‐N Contractor’s report; frequency: annually; responsible party: MoE/PAD and GS, CPD unit/UNAM and MCA‐N contractor; gender disaggregation: yes; baseline: 0; targets: N/A (2010), N/A (2011), 100 (2012), 100 (2013), 200 (2014))
Modification Type Addition of an indicator.
Justification To track the implementation of an important component of this sub‐activity. It is expected that 200 people (as dictated by the available budget) will be trained as trainers in facilities maintenance management.
Indicator Modification Form
Date March 2012
Project/Activity Education/Improving the Quality of General Education (sub‐activity: Policy, Operational, and Administrative Support)
Indicator
Textbook procurement process reformed, defined as “Textbook procurement unit is in place, staff oriented, textbook policy is reviewed and the system declared ready to be tested with the procurement of MCA‐N’s second tranche of textbooks” (unit: Date; level: process; classification: date; source: Consultant’s report; frequency: once, when completed; responsible party: MCA‐N; baseline: N/A; target: January 2014)

67 | Annex 3
Modification Type Addition of indicator.
Justification To track an important textbook policy reform that needs to take place in order for a sustainable and equitable textbook procurement system to be possible.
Vocational and Skills Training (sub‐activity: Establishment of NTF) Indicator Modification Form
Date March 2012
Project/Activity Education/Vocational and Skills Training (sub‐activity: Establishment of NTF)
Indicator NTF Levy collection system operational
Modification Type • Change of target, per table below.
Justification • To reflect the revised expectation that the NTF will not be operational until April 2013, in Year 4.
Indicator Unit Baseline Year 1 Year 2 Year 3 Year 4 Year 5
Original
NTF Levy…155 Date 0 0 0 30‐Jun‐12
0 0
Modified
NTF Levy…156 Date Apr‐13
Indicator Modification Form
Date March 2012
Project/Activity Education/Vocational and Skills Training (sub‐activity: Establishment of NTF)
Indicator Compliance rate for National Training Fund Levy
Modification Type
• Change of reporting frequency from “Year 3, 4, 5” to “Year 4, 5”. • Provision of actual targets per the table below, based on GOPA Project Manager (to establish and implement the NTF) Kieron Gargan’s assessment of what a fair estimation might be (Year 4) and the norm in different countries (Year 5).
Justification • To reflect the reality that the NTF will not be operational until Year 4 and thus the compliance rate will not be calculable until then. • To provide previously‐unavailable target values.
Indicator Unit Baseline Year 1 Year 2 Year 3 Year 4 Year 5
Original
Compliance…157 % N/A TBD TBD TBD TBD TBD
Modified
Compliance…158 % 0 60% 80%
Indicator Modification Form
Date March 2012
Project/Activity Education/Vocational and Skills Training (sub‐activity: Establishment of NTF)
Indicator Value of Vocational Training Grants awarded through the NTF Levy
Modification Type
• Change of indicator name to “% of NTF levy funds collected that are awarded as vocational training grants”. • Change of indicator definition from “Amount of grant agreements signed with training services providers using NTF levy” to “Value of NTF levy funds collected that are awarded expressed as a proportion of the total value of levy funds collected. The calculation is done by dividing the value of vocational training grant funds awarded from the NTF by the total value of levy funds collected and
155 NTF Levy collection system operational 156 NTF Levy collection system operational 157 Compliance rate for National Training Fund Levy 158 Compliance rate for National Training Fund Levy

68 | Annex 3
expressing the resultant proportion as a percentage.”• Change of indicator unit per the table below. • Provision of targets per the table below. • Addition of a note to Annex 1 stating that “It is expected that 20% of companies will pay 80% of the levy.” This is per the expressed expectation of GOPA Project Manager (to establish and implement the NTF) Kieron Gargan.
Justification
• To reflect what the indicator is actually measuring.• To define what the indicator is actually measuring. • To be consistent with the indicator name and definition. • To provide previously‐unavailable target values. The targets are based on estimations by GOPA Project Manager (to establish and implement the NTF) Kieron Gargan, who noted that the targets must be a proportion of the collected amount as projections of the actual amount cannot be made. • To add additional information to the documentation of the indicator.
Indicator Unit Baseline Year 1 Year 2 Year 3 Year 4 Year 5
Original
Value of…159 US$ 0 TBD TBD TBD TBD TBD
Modified
% of NTF…160
% 0 20 80
Indicator Modification Form
Date March 2012
Project/Activity Education/Vocational and Skills Training (sub‐activity: Establishment of NTF)
Indicator Number of Vocational Trainees assisted through the NTF Levy
Modification Type
• Change of indicator name to “Vocational trainees assisted from the NTF Levy”, with the corresponding change in the indicator definition. • Change of unit, per the table below. • Change of baseline and targets per the table below, based on input from GOPA Project Manager (to establish and implement the NTF) Kieron Gargan who estimates 3,500 trainees by April 2014 and another 3,500 by June 2014.
Justification
• To reduce unnecessary verbiage and to distinguish between the assistance coming via the Levy versus assistance channeled through the Levy. • To conform to MCC’s guidance on the ITT. • To reflect the timing of implementation.
Indicator Unit Baseline Year 1 Year 2 Year 3 Year 4 Year 5
Original
Number of…161 # of trainees
0 TBD TBD TBD TBD TBD
Modified
Vocational…162 # 0 7,000
Vocational and Skills Training (sub‐activity: Construction and Upgrading of 9 Community Skills and Development Centres) Indicator Modification Form
Date March 2012
Project/Activity Education/Vocational and Skills Training (sub‐activity: Construction and Upgrading of 9 Community Skills and Development Centres)
Indicator Value of signed contracts for design/supervisory services for COSDECs
Modification • Change of unit from “US$ mil” to “US Dollars”.
159 Value of Vocational Training Grants awarded through the NTF Levy 160 % of NTF levy funds collected that are awarded as vocational training grants 161 Number of Vocational Trainees assisted through the NTF Levy 162 Vocational trainees assisted from the NTF Levy

69 | Annex 3
Type • Adjustment of target values, per the table below.• Addition of a note to Annex 1 stating that “Typically the value of cumulative indicators does not decrease over time. Therefore the decrease in target values between Years 2 and 3 must be explained. It is due to the timing of the adjustment, which happened in Year 3 and targets could not be adjusted retrospectively.”
Justification
• To conform to MCC’s guidance on the ITT.• To reflect the lower‐than‐expected bidding price (especially as the Arts and Crafts Centre is no longer part of this procurement). • To provide explanatory information for the record.
Indicator Unit Baseline Year 1 Year 2 Year 3 Year 4 Year 5
Original
Value of…163 US$ mil
0 2.02 2.06 2.06 2.06 2.06
Modified
Value of…164 US Dollars
0 2,020,000 2,020,000 1,600,000 1,600,000 1,600,000
Indicator Modification Form
Date March 2012
Project/Activity Education/Vocational and Skills Training (sub‐activity: Construction and Upgrading of 9 Community Skills and Development Centres)
Indicator Value disbursed against supervisory/design services for COSDECs
Modification Type
• Change of unit from “US$ mil” to “US Dollars”.• Adjustment of target values, per the table below.
Justification • To conform to MCC’s guidance on the ITT.• To reflect current expectations of the pace of implementation and the lower contract value (see modification form for indicator on value of signed contracts).
Indicator Unit Baseline Year 1 Year 2 Year 3 Year 4 Year 5
Original
Value disbursed…165
US$ mil
0 0.67 0.92 1.50 1.91 2.06
Modified
Value disbursed…166
US Dollars
0 670,000 920,000 1,000,000 1,600,000 1,600,000
Indicator Modification Form
Date March 2012
Project/Activity Education/Vocational and Skills Training (sub‐activity: Construction and Upgrading of 9 Community Skills and Development Centres)
Indicator % disbursed against supervisory/design services for COSDECs
Modification Type • Correction and adjustment of target values, per the table below.
Justification
• For purposes of accuracy and to reflect the current pace of implementation, which is rolling out slower than initially expected for Year 3 but faster for Year 4 as construction is expected to be completed earlier since the Arts and Craft Centre is no longer part of this procurement.
Indicator Unit Baseline Year 1 Year 2 Year 3 Year 4 Year 5
Original
% disbursed…167 % 0 N/A 45% 73% 93% 100%
163 Value of signed contracts for design/supervisory services for COSDECs 164 Value of signed contracts for design/supervisory services for COSDECs 165 Value disbursed against supervisory/design services for COSDECs 166 Value disbursed against supervisory/design services for COSDECs 167 % disbursed against supervisory/design services for COSDECs

70 | Annex 3
Modified
% disbursed…168 % 0 33% 45% 63% 100% 100%
Indicator Modification Form
Date March 2012
Project/Activity Education/Vocational and Skills Training (sub‐activity: Construction and Upgrading of 9 Community Skills and Development Centres)
Indicator Value of signed contracts for construction and equipment for COSDECs
Modification Type
• Change of unit from “US$ mil” to “US Dollars”.• Adjustment of target values, per the table below. • Addition of note to Annex 1 stating that “Typically the value of cumulative indicators does not decrease over time. Therefore the decrease in target values between Years 2 and 3 must be explained. It is due to the timing of the adjustment, which happened in Year 3 and targets could not be adjusted retrospectively.”
Justification
• To conform to MCC’s guidance on the ITT.• To reflect the reality that contracts are not being signed at the pace initially expected due to the delay in the procurement process and cumulative costs will be higher than initially expected because there was a cost‐affecting change in the design of COSDECS. • To provide explanatory information for the record.
Indicator Unit Baseline Year 1 Year 2 Year 3 Year 4 Year 5
Original
Value of…169 US$ mil
0 7.15 12.61 12.61 12.61
Modified
Value of…170
US Dollars
0 7,150,000 0 14,206,962 14,206,962
Indicator Modification Form
Date March 2012
Project/Activity Education/Vocational and Skills Training (sub‐activity: Construction and Upgrading of 9 Community Skills and Development Centres)
Indicator Value disbursed against construction and equipment for COSDECs
Modification Type • Change of unit from “US$ mil” to “US Dollars”.• Adjustment of target values, per the table below.
Justification
• To conform to MCC’s guidance on the ITT.• To reflect the current pace of implementation, which is rolling out slower than initially expected due to the delay in the procurement process and higher than expected cost because there was a cost‐affecting change in the design of COSDECS.
Indicator Unit Baseline Year 1 Year 2 Year 3 Year 4 Year 5
Original
Value disbursed…171
US$ mil
0 N/A N/A 6.46 11.32 12.61
Modified
Value disbursed…172
US Dollars
0 6,028,481 14,206,962
168 % disbursed against supervisory/design services for COSDECs 169 Value of signed contracts for construction and equipment for COSDECs 170 Value of signed contracts for construction and equipment for COSDECs 171 Value disbursed against construction and equipment for COSDECs 172 Value disbursed against construction and equipment for COSDECs

71 | Annex 3
Indicator Modification Form
Date March 2012
Project/Activity Education/Vocational and Skills Training (sub‐activity: Construction and Upgrading of 9 Community Skills and Development Centres)
Indicator % disbursed against construction and equipment for COSDECs
Modification Type • Adjustment of target values, per the table below.
Justification • To reflect the current pace of implementation, which is rolling out slower than initially expected (for reasons behind the slower rollout, see modification forms for indicators on value of signed contracts and value disbursed).
Indicator Unit Baseline Year 1 Year 2 Year 3 Year 4 Year 5
Original
% disbursed…173 % 0 N/A N/A 51% 90% 100%
Modified
% disbursed…174 % 0 42% 100%
Indicator Modification Form
Date March 2012
Project/Activity Education/Vocational and Skills Training (sub‐activity: Construction and Upgrading of 9 Community Skills and Development Centres)
Indicator Total number COSDECs completed
Modification Type
• Change of indicator name to “COSDECs completed”.• Reformatting of unit, per table below. • Adjustment of targets, per the table below.
Justification
• To remove unnecessary verbiage.• To conform to MCC’s guidance on the ITT. • To reflect the current implementation expectations and reflect that the Arts and Crafts Centre is no longer counted among the COSDECs.
Indicator Unit Baseline Year 1 Year 2 Year 3 Year 4 Year 5
Original
Total number COSDECs completed
# of COSDECs
0 0 0 5 9 9
Modified
COSDECs completed
# 0 0 0 0 8 8
Vocational and Skills Training (sub‐activity: Competitive Grants for High Priority Vocational Skills Training) Indicator Modification Form
Date March 2012
Project/Activity Education/Vocational and Skills Training (sub‐activity: Competitive Grants for High Priority Vocational Skills Training)
Indicator Value of Vocational Training Grants awarded through the MCA‐N Grant Facility
Modification Type
• Reformatting of the unit, per the table below.• Adjustment of targets, per the table below.
Justification
• To conform to MCC’s guidance on the ITT.• To reflect the cumulative nature of the indicator (the previous targets were reflected as incremental rather than cumulative) and to reflect the pace of planned implementation (grant disbursement). The overall modified total is
173 % disbursed against construction and equipment for COSDECs 174 % disbursed against construction and equipment for COSDECs

72 | Annex 3
slightly lower than the original total of US$4.75 million due to budget modifications and rounding.
Indicator Unit Baseline Year 1 Year 2 Year 3 Year 4 Year 5
Original
Value of…175
US$ mil
0 0.45 0.9 1.5 1.0 0.9
Modified
Value of…176 US Dollars
0 450,000 900,000 1,710,000 4,680,000 4,680,000
Indicator Modification Form
Date March 2012
Project/Activity Education/Vocational and Skills Training (sub‐activity: Competitive Grants for High Priority Vocational Skills Training)
Indicator Number of Vocational Trainees assisted through the MCA‐N Grant Facility
Modification Type
• Change of indicator name to “Vocational trainees assisted through the MCA‐N Vocational Training Grant Fund”. • Reformatting of unit, per table below. • Adjustment of targets per the table below. • Addition of a note to Annex 1 stating that “Typically the value of cumulative indicators does not decrease over time. Therefore the decrease in target values between Years 2 and 3 must be explained. It is due to the timing of the adjustment, which happened in Year 3 and targets could not be adjusted retrospectively.”
Justification
• To reduce unnecessary verbiage.• To conform to MCC’s guidance on the ITT. • To correct previous targets which were erroneous, reflect the slower‐than‐expected take‐up, and the cumulative nature of the indicator (the previous targets were reflected as incremental rather than cumulative). Note that the cost calculator, which ranges between N$16,000 to N$20,000 per trainee depending on the field/course, was not used as it has not been formalized by the Namibia Training Authority (NTA) and has never been used by the NTA to calculate vocational education training with the exception of a test for the cost of the bridging programme. However, an average unit cost assumption of N$20,000 (US$2,857.14) per trainee was used to calculate revised targets with the realization that courses at some institutions will be cheaper (e.g., COSDECs), but some will be more expensive (e.g., the Namibia Institute of Mining and Technology). • To add explanatory information to the indicator’s documentation.
Indicator Unit Baseline Year 1 Year 2 Year 3 Year 4 Year 5
Original
Number of…177 # of trainees
0 562.5 1,125 1,875 1,250 1,063
Modified
Vocational…178 # 0 563 1,125 599 1,638 1,638
Indicator Modification Form
Date March 2012
Project/Activity Education/Vocational and Skills Training (sub‐activity: Competitive Grants for High Priority Vocational Skills Training)
175 Value of Vocational Training Grants awarded through the MCA‐N Grant Facility 176 Value of Vocational Training Grants awarded through the MCA‐N Grant Facility 177 Number of Vocational Trainees assisted through the MCA‐N Grant Facility 178 Vocational trainees assisted through the MCA‐N Vocational Training Grant Fund
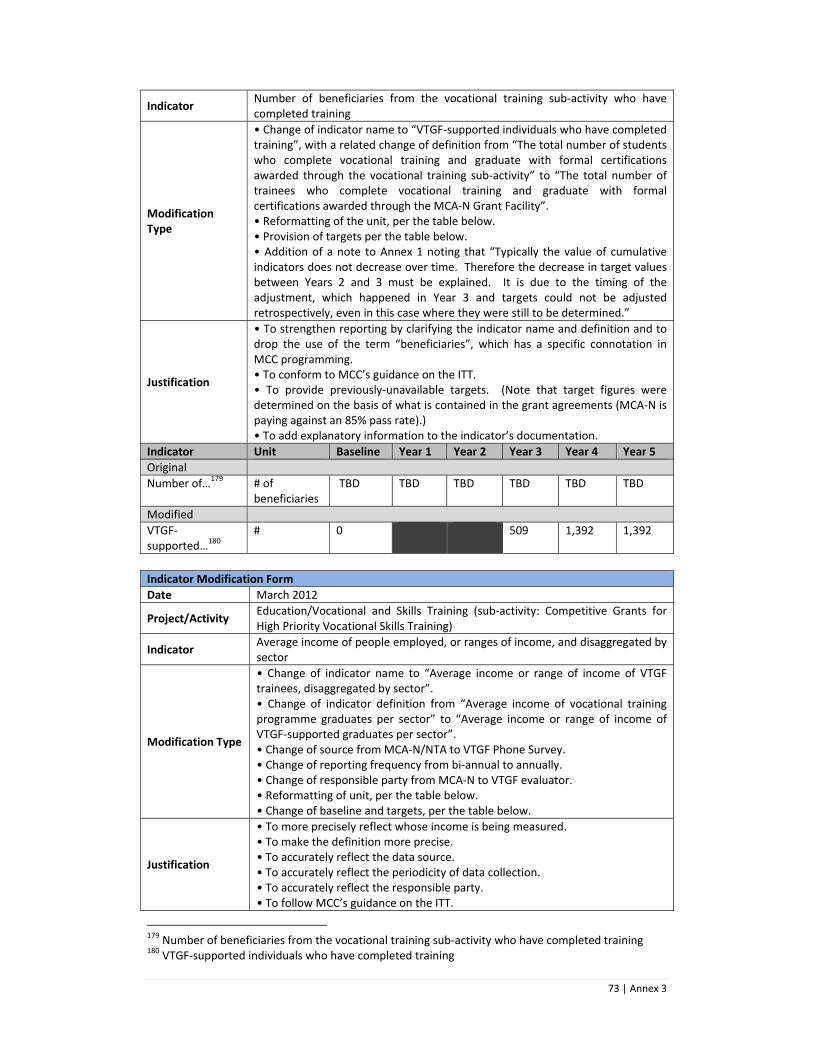
73 | Annex 3
Indicator Number of beneficiaries from the vocational training sub‐activity who have completed training
Modification Type
• Change of indicator name to “VTGF‐supported individuals who have completed training”, with a related change of definition from “The total number of students who complete vocational training and graduate with formal certifications awarded through the vocational training sub‐activity” to “The total number of trainees who complete vocational training and graduate with formal certifications awarded through the MCA‐N Grant Facility”. • Reformatting of the unit, per the table below. • Provision of targets per the table below. • Addition of a note to Annex 1 noting that “Typically the value of cumulative indicators does not decrease over time. Therefore the decrease in target values between Years 2 and 3 must be explained. It is due to the timing of the adjustment, which happened in Year 3 and targets could not be adjusted retrospectively, even in this case where they were still to be determined.”
Justification
• To strengthen reporting by clarifying the indicator name and definition and to drop the use of the term “beneficiaries”, which has a specific connotation in MCC programming. • To conform to MCC’s guidance on the ITT. • To provide previously‐unavailable targets. (Note that target figures were determined on the basis of what is contained in the grant agreements (MCA‐N is paying against an 85% pass rate).) • To add explanatory information to the indicator’s documentation.
Indicator Unit Baseline Year 1 Year 2 Year 3 Year 4 Year 5
Original
Number of…179 # of beneficiaries
TBD TBD TBD TBD TBD TBD
Modified
VTGF‐supported…180
# 0 509 1,392 1,392
Indicator Modification Form
Date March 2012
Project/Activity Education/Vocational and Skills Training (sub‐activity: Competitive Grants for High Priority Vocational Skills Training)
Indicator Average income of people employed, or ranges of income, and disaggregated by sector
Modification Type
• Change of indicator name to “Average income or range of income of VTGF trainees, disaggregated by sector”. • Change of indicator definition from “Average income of vocational training programme graduates per sector” to “Average income or range of income of VTGF‐supported graduates per sector”. • Change of source from MCA‐N/NTA to VTGF Phone Survey. • Change of reporting frequency from bi‐annual to annually. • Change of responsible party from MCA‐N to VTGF evaluator. • Reformatting of unit, per the table below. • Change of baseline and targets, per the table below.
Justification
• To more precisely reflect whose income is being measured.• To make the definition more precise. • To accurately reflect the data source. • To accurately reflect the periodicity of data collection. • To accurately reflect the responsible party. • To follow MCC’s guidance on the ITT.
179 Number of beneficiaries from the vocational training sub‐activity who have completed training 180 VTGF‐supported individuals who have completed training

74 | Annex 3
• To reflect the point at which data are expected to become available (data collection for the VTGF survey only began in December 2011 and initial calculations are expected to become available in 2012).
Indicator Unit Baseline Year 1 Year 2 Year 3 Year 4 Year 5
Original
Average income …181
N$ TBD TBD TBD TBD TBD TBD
Modified
Average income…182
Namibian dollars
TBD (2011/12)
TBD TBD
Indicator Modification Form
Date March 2012
Project/Activity Education/Vocational and Skills Training (sub‐activity: Competitive Grants for High Priority Vocational Skills Training)
Indicator No. of trainees who secure 6 months of income during the 12 months’ period after course completion for Vocational Education graduates (disaggregated by COSDEC, VTC, private provider, and other)
Modification Type
• Change of indicator name to “% of trainees who secure employment” and change of definition to “Proportion of MCA‐N‐assisted trainees who secure at least 6 months of paid employment (formal, informal, and self‐employment) during the 12‐month period following successful course completion (disaggregated by COSDEC, VTC, private provider, and other)”. • Change of source from MCA‐N/NTA to VTGF Phone Survey. • Change of reporting frequency from bi‐annual to annually. • Change of responsible party from MCA‐N to VTGF evaluator. • Replacement of TBDs with targets.
Justification
• Indicator name change (and related definition and unit) is to make the indicator more meaningful and precise. • To accurately reflect the data source. • To accurately reflect the periodicity of data collection. • To accurately reflect the responsible party. • To provide actual targets on the basis of grantees’ required targeted milestones and also to reflect the point at which data are expected to become available (data collection for the VTGF survey only began in December 2011 and initial calculations are expected to become available in 2012 – and probably later for this particular indicator as at least 12 months must pass after course completion before follow‐up data can be collected and calculations made).
Indicator Unit Baseline Year 1 Year 2 Year 3 Year 4 Year 5
Original
No. of trainees …183
# of trainees
TBD TBD TBD TBD TBD TBD
Modified
% of trainees …184 % 0 75% 75%
181 Average income of people employed, or ranges of income, and disaggregated by sector 182 Average income or range of income of VTGF trainees, disaggregated by sector 183 No. of trainees who secure 6 months of income during the 12 months' period after course completion for Vocational Education graduates (disaggregated by COSDEC, VTC, private provider, and other) 184 % of trainees assisted through MCA‐N’s Vocational Training Grant Facility who secure 6 months of income during the 12 months' period after successful course completion (disaggregated by COSDEC, VTC, private provider, and other)

75 | Annex 3
Improving Access to and Management of Adequate Textbooks (sub‐activities: Procurement of Priority and General Textbooks) Indicator Modification Form
Date March 2012
Project/Activity Education/Improving Access to and Management of Adequate Textbooks (sub‐activities: Procurement of Priority and General Textbooks)
Indicator Learner‐Textbook Ratio of 1 to 1 – disaggregated by Science, Maths and EnglishLearner‐Textbook Ratio of 1 to 2 – disaggregated by Science, Maths and English
Modification Type Deletion of indicators.
Justification
The value of these indicators has always been problematic to calculate: o Determining the ratio of learners to textbooks is meaningless to begin with,
given that there are multiple books per subject and each teacher can order whichever books he/she wants. Also, sometimes the books are present in the classroom but not used as new ones may replace them. All this results in figures that far exceed the one‐to‐one ratio (i.e., there are multiple books per learner), but these inflated ratios do not mean they are (all) the appropriate books or that they are utilized, and they are therefore not a true reflection of the situation.
o Calculating the indicator as a proportion of schools with such ratios only complicates matters further.
Therefore, these indicators are proposed to be deleted. More appropriate indicators that capture the impact of the textbooks intervention will be added to the M&E Plan once the DQR team’s review of these indicators has been completed and the sub‐activity’s program logic finalized.
Improving Access to and Management of Adequate Textbooks (sub‐activities: Textbook Management Training) Indicator Modification Form
Date March 2012
Project/Activity Education/Improving Access to and Management of Adequate Textbooks (sub‐activity: Textbook Management Training)
Indicator Textbook management/utilization training report received from Contractor
Modification Type Deletion of indicator.
Justification The training report is a low‐level deliverable that will be tracked at the contract management level; it is not of sufficient significance to be tracked in the M&E Plan.
Indicator Modification Form
Date March 2012
Project/Activity Education/Improving Access to and Management of Adequate Textbooks (sub‐activity: Textbook Management Training)
Indicator Number of teachers and managers trained in textbook management, utilization and storage
Modification Type
• Splitting of indicator into two indicators, with the first of two to be named “Educators trained to be textbook management trainers”, defined as “Total number of educators who have received training to be trainers in textbook management”. • Reformatting of the unit, per the table below. • Updating of targets, per the table below.
Justification • To more precisely name and define the indicator so that they accurately

76 | Annex 3
reflect the intervention in question, which is not meant to train teachers but rather to train 100 advisory teachers, cluster center heads, and regional staff who will in turn train teachers. The trainings in textbook management and, separately, in textbook utilization are separate initiatives and the target participants are not exactly the same (cluster and regional staff for textbook management versus advisory teacher for textbook utilization); therefore, they need to be tracked separately. The values for the newly‐named indicator will also be more reliable and readily calculated. • To conform to MCC’s guidance on the ITT. • To lay out targets that reflect current expectations of implementation progress.
Indicator Unit Baseline Year 1 Year 2 Year 3 Year 4 Year 5
Original indicator
Number of teachers…185
# trained
0 0 6,455 6,455 6,455 0
Modified
Educators trained…186 # 0 100 100 100
Indicator Modification Form
Date March 2012
Project/Activity Education/Improving Access to and Management of Adequate Textbooks (sub‐activity: Textbook Management Training)
Indicator Number of teachers and managers trained in textbook management, utilization and storage
Modification Type
• Splitting of indicator into two indicators, with the second of two to be named “Educators trained to be textbook utilization trainers”, defined as “Total number of educators who have received training to be trainers in textbook utilization”. • Reformatting of the unit, per the table below. • Updating of targets, per the table below.
Justification
• To more precisely name and define the indicator so that they accurately reflect the intervention in question, which is not meant to train teachers but rather to train 100 advisory teachers, cluster center heads, and regional staff who will in turn train teachers. The trainings in textbook management and, separately, in textbook utilization are separate initiatives and the target participants are not exactly the same (cluster and regional staff for textbook management versus advisory teacher for textbook utilization); therefore, they need to be tracked separately. The values for the newly‐named indicator will also be more reliable and readily calculated. • To conform to MCC’s guidance on the ITT. • To lay out targets that reflect current expectations of implementation progress.
Indicator Unit Baseline Year 1 Year 2 Year 3 Year 4 Year 5
Original indicator
Number of teachers…187
# trained
0 0 6,455 6,455 6,455 0
Modified
Educators trained…188 # 0 100 100 100
185 Number of teachers and managers trained in textbook management, utilization and storage 186 Educators trained in delivering textbook management training 187 Number of teachers and managers trained in textbook management, utilization and storage 188 Educators trained in delivering textbook utilization training

77 | Annex 3
Investment in Regional Study and Resource Centers (sub‐activity: Construction of RSRCs) Indicator Modification Form
Date March 2012
Project/ Activity
Education/Investment in Regional Study and Resource Centers (sub‐activity: Construction of RSRCs)
Indicator Value of signed contracts for construction, rehabilitation and equipment for RSRCs
Modification Type
• Change of unit from “US$ mil” to “US Dollars”.• Adjustment of target values, per the table below.
Justification • To conform to MCC’s guidance on the ITT.• To reflect the pace of implementation; contract amounts are higher than originally expected due to bids being priced higher than originally budgeted.
Indicator Unit Baseline Year 1 Year 2 Year 3 Year 4 Year 5
Original
Value of…189 US$ mil
0 4.58 9.22 15.88 15.88 15.88
Modified
Value of…190 US Dollars
0 4,580,000 9,220,000 17,500,000 17,500,000 17,500,000
Indicator Modification Form
Date March 2012
Project/Activity Education/Investment in Regional Study and Resource Centers (sub‐activity: Construction of RSRCs)
Indicator Value disbursed against construction, rehabilitation and equipment for RSRCs
Modification Type
• Change of unit from “US$ mil” to “US Dollars”.• Adjustment of target values, per the table below.
Justification
• To conform to MCC’s guidance on the ITT.• To reflect the pace of implementation; in Year 3, amounts disbursed are lower than originally expected due to a slower implementation rate than initially anticipated but the values disbursed in Years 4 and 5 are higher than initially expected to match the increased contract values that resulted from bids priced higher than anticipated.
Indicator Unit Baseline Year 1
Year 2 Year 3 Year 4 Year 5
Original
Value disbursed…191
US$ 0 N/A 2.07 13.57 14.67 15.88
Modified
Value disbursed…192
US Dollars
0 0 2,070,000 12,500,000 17,000,000 17,500,000
Indicator Modification Form
Date March 2012
Project/Activity Education/Investment in Regional Study and Resource Centers (sub‐activity: Construction of RSRCs)
Indicator % disbursed against construction and equipment for RSRCs
Modification Type • Correction and adjustment of target values, per the table below.
189 Value of signed contracts for construction, rehabilitation and equipment for RSRCs 190 Value of signed contracts for construction, rehabilitation and equipment for RSRCs 191 Value disbursed against construction, rehabilitation and equipment for RSRCs 192 Value disbursed against construction, rehabilitation and equipment for RSRCs

78 | Annex 3
Justification
• For purposes of accuracy and to reflect the pace of implementation, which is rolling out slower than initially expected for Year 3 (for reasons behind the slower rollout, see modification forms for indicators on value of signed contracts and value disbursed) but faster for Year 4 as construction is expected to be completed earlier in line with the revised work plan.
Indicator Unit Baseline Year 1 Year 2 Year 3 Year 4 Year 5
Original
% disbursed…193 % 0 N/A 22% 85% 92% 100%
Modified
% disbursed…194 % 0 0% 22% 71% 97% 100%
Indicator Modification Form
Date March 2012
Project/Activity Education/Investment in Regional Study and Resource Centers (sub‐activity: Construction of RSRCs)
Indicator Number of RSRCs completed and open for visitors
Modification Type • Change of indicator name to “RSRCs completed and open for visitors”. • Reformatting of unit, per table below. • Adjustment of targets, per table below.
Justification
• To remove unnecessary verbiage.• To conform to MCC guidance on the ITT. • To reflect the current pace of implementation, which is slower than expected due to delays in the bidding process.
Indicator Unit Baseline Year 1 Year 2 Year 3 Year 4 Year 5
Original indicator
Number of RSRCs completed and open for visitors
# of RSRCs
N/A N/A N/A 2 3 3
Modified
RSRCs completed and open for visitors
# 0 2 3
Indicator Modification Form
Date March 2012
Project/Activity Education/Investment in Regional Study and Resource Centers (sub‐activity: Construction of RSRCs)
Indicator Number of visits to MCA‐N assisted RSRCs
Modification Type
• Change of indicator name to “Visits to MCA‐N‐assisted RSRCs”. • Change of indicator classification from cumulative to level. • Reformatting of unit, per table below. • Correction and adjustment of annual targets.
Justification
• To remove unnecessary verbiage.• To use the appropriate classification. • To conform to MCC guidance on the ITT. • To reflect the cumulative nature of the indicator (the previous targets were reflected as incremental). The timing of the first year for which a target is provided reflects the timing of when RSRCs are expected to be completed and open for visitors, which is later than expected due to delays in the bidding process.
193 % disbursed against construction and equipment for RSRCs 194 % disbursed against construction and equipment for RSRCs

79 | Annex 3
Indicator Unit Baseline Year 1 Year 2 Year 3 Year 4 Year 5
Original
Number of…195 # of visits
N/A N/A N/A 60,000 80,000 100,000
Modified
Visits to…196 # 0 140,000 240,000
Indicator Modification Form
Date March 2012
Project/Activity Education/Investment in Regional Study and Resource Centers (sub‐activity: Construction of RSRCs)
Indicator Number of library loans of books and learning and study materials from MCA‐N assisted RSRCs
Modification Type
• Change of indicator name to “Library loans of books and learning and study materials from MCA‐N assisted RSRCs”. • Reformatting of unit, per table below. • Provision of targets, per table below.
Justification
• To remove unnecessary verbiage.• To conform to MCC guidance on the ITT. • To provide previously‐missing information on expected circulation figures. Targets were calculated as follows by the education sector lead in the Resident MCC office: Average circulation per library for 2011 was 4,932, with the highest circulation being 5,000 at the Greenwell Matongo library in Windhoek. Generally circulation numbers have been declining by on average 20%, but it is hoped that with the expanded services being provided at the RSRCs and the increased capacity and the larger catchment areas in which they are located the decline should be able to be countered and circulation increased by 25% between 2013 and 2014 in line with the proposed increase in library usage already in the ITT. The suggestion is to estimate circulation for 2013 at 20,000, assuming that both RSRCs completed in 2013 will have double the national circulation average due to the size and extensive collection), with the target in 2014 being 32,000 (20,000 (Oshakati and Helao Nafidi) + 25% (annual increase for Oshakati and Helao Nafidi) + 7,000 (Gobabis a far smaller catchment population)).
Indicator Unit Baseline Year 1 Year 2 Year 3 Year 4 Year 5
Original indicator
Number of…197 # of library loans
N/A N/A N/A TBD TBD TBD
Modified
Library loans…198 # 0 20,000 32,000
Expanding and Improving Access to Tertiary Finance (sub‐activity: Developing a Financially Sustainable and Equitable Scholarship and Loan System) Indicator Modification Form
Date March 2012
Project/Activity Education/Expanding and Improving Access to Tertiary Finance (sub‐activity: Developing a Financially Sustainable and Equitable Scholarship and Loan System)
195 Number of visits to MCA‐N assisted RSRCs 196 Visits to MCA‐N assisted RSRCs 197 Number of library loans of books and learning and study materials from MCA‐N assisted RSRCs 198 Library loans of books and learning and study materials from MCA‐N assisted RSRCs

80 | Annex 3
Indicator
Namibia Student Financial Assistance Fund policy in place, defined as “The date on which the revised Namibia Student Financial Assistance Fund policy is approved by Cabinet” (unit: Date; level: process; classification: date; source: Cabinet Secretariat and MoE; frequency: once, when in place; responsible party: MOE; baseline: N/A; targets: N/A (2010), N/A (2011), N/A (2012), November 2012 (2013), N/A (2014))
Modification Type Addition of indicator.
Justification To track an important policy reform that needs to take place in order for a sustainable and equitable scholarship and loan system to be possible.
Indicator Modification Form
Date March 2012
Project/Activity Education/Expanding and Improving Access to Tertiary Finance (sub‐activity: Developing a Financially Sustainable and Equitable Scholarship and Loan System)
Indicator
Modified NSFAF MIS completed, defined as “The date on which the modified NSFAF MIS is considered complete and the system is operational” (unit: Date; level: process; classification: date; source: NSFAF Consultant; frequency: once, when completed; responsible party: MCA‐N; baseline: N/A; targets: N/A (2010), N/A (2011), N/A (2012), November 2012 (2013), N/A (2014))
Modification Type Addition of indicator.
Justification To track the implementation of the NSFAF MIS.
Tourism Project Indicators Multiple activities Indicator Modification Form
Date March 2012
Project/Activity Tourism/Multiple activities
Indicator Number of leisure tourist arrivals
Modification Type
• Change of indicator name to “Leisure tourist arrivals”.• Reformatting of unit, per table below. • Removal of targets, per table below. • Correction of End of Compact column in Annex 2.
Justification
• To remove unnecessary verbiage.• To conform to MCC’s guidance on the ITT. • To remove targets for years in which reporting was not planned. • For purposes of accuracy, the End of Compact column in Annex 2 of the M&E Plan is to be corrected to reflect the same figure as the Year 5 figure; as a level indicator, the End of Compact target is the Year 5 target, rather than the cumulative figure of 2,988,420 that is in the current (February 2011) version of the M&E Plan.
Indicator Unit Baseline Year 1 Year 2 Year 3 Year 4 Year 5
Original
Number of…199 # of arrivals
474,426 511,431 551,323 594,326 640,683 690,657
Modified
Number of… # 474,426 594,326 640,683 690,657
199 Number of leisure tourist arrivals

81 | Annex 3
Indicator Modification Form
Date March 2012
Project/Activity Tourism/Multiple activities
Indicator Jobs created through tourism
Modification Type Provision of target values for Years 3‐5, per table below.
Justification
To replace TBDs with actual figures, reflecting expectations of impact. Targets were generated via two steps: (1) obtaining national targets calculated by NTB from the Tourism Satellite Account model and (2) inflating those targets by an additional 10% to account for MCA‐N’s impact.
Indicator Unit Baseline Year 1 Year 2 Year 3 Year 4 Year 5
Original
Jobs created through tourism
# 22,000(2009)
N/A N/A TBD TBD TBD
Modified
Jobs created through tourism
# 22,000(2009)
22,000 23,100 24,200
Indicator Modification Form
Date March 2012
Project/Activity Tourism/Multiple Activities
Indicator Levy Income
Modification Type Deletion of indicator.
Justification
The DQR team found that data collected for levy income suffers from severe quality constraints, including underreporting by accommodation establishments and limited capacity at NTB to monitor reporting and enforce corrective action (even if the penalty were high enough to incentivize establishments to report more accurately). Furthermore, MCA‐N’s intervention is not directly aimed at increasing NTB’s levy income and many factors, in addition to those listed above, could interfere with the numbers reported. Therefore, the data reported against this indicator provide a false indication of the underlying phenomenon that it is supposed to represent. The other indicators of the Tourism Project’s multiple‐activity impact (e.g., tourist arrivals) are sufficient to provide an accurate picture.
Improving Management and Infrastructure in Etosha National Park (sub‐activity: ENP Management Reform and Investment Promotion) Indicator Modification Form
Date March 2012
Project/Activity Tourism/Improving Management and Infrastructure in Etosha National Park (sub‐activity: ENP Management Reform and Investment Promotion)
Indicator % of Conditions Precedents and Performance Targets met for ENP activity
Modification Type • Update of target values for Years 3‐5, per table below.
Justification • To reflect the cumulative nature of indicator.
Indicator Unit Baseline Year 1 Year 2 Year 3 Year 4 Year 5
Original
% of Conditions…200
% N/A 50% 100% N/A N/A N/A
Modified
% of % 0 50% 100% 100% 100% 100%
200 % of Conditions Precedents and Performance Targets met for ENP activity

82 | Annex 3
Conditions…201
Indicator Modification Form
Date March 2012
Project/Activity Tourism/Improving Management and Infrastructure in Etosha National Park (sub‐activity: ENP Management Reform and Investment Promotion)
Indicator Galton Gate Plan implemented
Modification Type
• Change the definition from “Completion of plan’s implementation to upgrade the Galton Road from restricted access to public access” to “Total percentage completion of plan’s implementation to upgrade the Galton Road from restricted access to public access”, calculated by totaling the number of milestones that should be met per quarter (should be 33 by end‐Compact) and using a percentage basis to track this indicator cumulatively. This is depicted in the table below for illustration purposes:
Quarter Target # of Milestones
to be completed
# of Milestones actually
completed
Total Complete to date out
of 33
Target % Complete
(Cumulative)
Actual % Complete
(Cumulative)
2010 Q3 2 2 2 6% 6%
Q4 4 4 6 18% 18%
2011 Q1 2 2 8 24% 24%
Q2 7 0 8 45% 24%
Q3 3 1 9 55% 27%
Q4 1 0 9 58% 27%
2012 Q1 2 64%
Q2 0 64%
Q3 0 64%
Q4 2 70%
2013 Q1 1 73%
Q2 2 79%
Q3 1 82%
Q4 3 91%
2014 Q1 2 97%
Q2 0 97%
Q3 0 97%
Q4 1 100%
The table can be updated on a quarterly basis to calculate the total for that quarter.
Justification
• To address the disconnect between the quarterly targets for this indicator and its cumulative nature (i.e., the targets increase annually from 25% in Y2 to 100% in Y5 but each quarterly target is essentially 100%) and make the indicator a more useful management tool.
Indicator Unit Baseline Year 1 Year 2 Year 3 Year 4 Year 5
Original
Galton Gate Plan implemented
% N/A N/A 25% 50% 75% 100%
Modified
Galton Gate Plan implemented
% 0 25% 70% 91% 100%
201 % of Conditions Precedents and Performance Targets met for ENP activity

83 | Annex 3
Indicator Modification Form
Date March 2012
Project/Activity Tourism/Improving Management and Infrastructure in Etosha National Park (sub‐activity: ENP Management Centres and Staff Housing)
Indicator ENP Environmental Carrying Capacity and Investment Opportunities determined
Modification Type Deletion of indicator.
Justification
Whether or not the ENP Environmental Carrying Capacity and Investment Opportunities Study will be conducted and used to inform decision‐making is entirely at the discretion of the Ministry of Environment and Tourism. Because MCA‐N’s activities are not intended to have a direct bearing on its accomplishment, the indicator is not an appropriate performance measure for this M&E Plan.
Indicator Modification Form
Date March 2012
Project/Activity Tourism/Improving Management and Infrastructure in Etosha National Park (sub‐activity: ENP Management Reform and Investment Promotion)
Indicator Ratio of junior staff to senior staff assigned to western area of park
Modification Type Deletion of indicator.
Justification
The ENP sub‐activity has already accomplished the milestone of getting a new staffing structure approved. However, because the intervention is not aimed at ensuring the appropriate staffing levels/assignments, which is entirely in the hands of the Ministry, the “Ratio of junior staff to senior staff assigned to western area of park” indicator is not appropriate to track as a measure of progress in this sub‐activity.
Indicator Modification Form
Date March 2012
Project/Activity Tourism/Improving Management and Infrastructure in Etosha National Park (sub‐activity: ENP Management Reform and Investment Promotion)
Indicator Number of visitors to Etosha National Park
Modification Type Change of indicator name to “Tourists to Etosha National Park”.
Justification To remove unnecessary verbiage and to be consistent with the terminology used in the Namibian tourism sector, which makes use of the term “tourists” rather than to “visitors”.
Indicator Modification Form
Date March 2012
Project/Activity Tourism/Improving Management and Infrastructure in Etosha National Park (sub‐activity: ENP Management Reform and Investment Promotion)
Indicator Etosha National Park Gross Revenue
Modification Type
• Change of baseline year from “2007” to “2008” and provision of corresponding baseline value. • Reformatting of unit, per table below. • Change of targets, per table below.
Justification
• To report a baseline value closer to the start of Compact implementation, with the assumption that it provides a truer baseline. • To conform to MCC’s guidance on the ITT. • The original baseline revenue figure could not be verified, and all indications are that it was incorrect (i.e., it did not represent the reality of ENP gross revenue). From the efforts of one of the DQRs, a verifiable baseline figure was found. Targets were set using similar absolute increases as the initial targets.

84 | Annex 3
Indicator Unit Baseline Year 1
Year 2
Year 3 Year 4 Year 5
Original
Etosha National Park Gross Revenue
N$ million
2.96 (2007)
N/A N/A 3.63 3.88 4.14
Modified
Etosha National Park Gross Revenue
Namibian Dollars
19,200,000 (2008)
19,500,000 19,750,000 20,000,000
Improving Management and Infrastructure in Etosha National Park (sub‐activity: ENP Management Centres and Staff Housing) Indicator Modification Form
Date March 2012
Project/Activity Tourism/Improving Management and Infrastructure in Etosha National Park (sub‐activity: ENP Management Centres and Staff Housing)
Indicator Value of signed contracts for design/supervisory for ENP housing units/management structures
Modification Type
• Change of unit from “US$ mil” to “US Dollars”.• Adjustment of target values, per the table below. • Addition of a note to Annex 1 stating that “Typically the value of cumulative indicators does not decrease over time. Therefore the decrease in target values between Years 2 and 3 must be explained. It is due to the timing of the adjustment, which happened in Year 3 and targets could not be adjusted retrospectively.”
Justification
• To conform to MCC’s guidance on the ITT.• To reflect the pace of implementation; contracts are not being signed at the pace initially expected due to the outstanding CP and the anticipated cumulative total is lower than originally expected due to the lower‐than‐anticipated value of the contract that was signed. • To provide explanatory information for the record.
Indicator Unit Baseline Year 1 Year 2 Year 3 Year 4 Year 5
Original
Value of…202 US$ mil
0 N/A 4.35 4.35 4.35 4.35
Modified
Value of…203 US Dollars
0 4,350,000 2,500,000 2,500,000 2,500,000
Indicator Modification Form
Date March 2012
Project/Activity Tourism/Improving Management and Infrastructure in Etosha National Park (sub‐activity: ENP Management Centres and Staff Housing)
Indicator Value disbursed against design/supervisory contracts for ENP housing units/management structures
Modification Type
• Change of unit from “US$ mil” to “US Dollars”.• Adjustment of target values, per the table below.
Justification • To conform to MCC’s guidance on the ITT.• To reflect the pace of implementation; disbursements against contracts are behind schedule due to the outstanding CP and the anticipated cumulative total
202 Value of signed contracts for design/supervisory for ENP housing units/management structures 203 Value of signed contracts for design/supervisory for ENP housing units/management structures

85 | Annex 3
is less than originally expected due to the lower‐than‐anticipated cumulative total value of contracts (see table above).
Indicator Unit Baseline Year 1 Year 2 Year 3 Year 4 Year 5
Original
Value disbursed…204
US$ mil
0 N/A 0.70 3.13 4.00 4.35
Modified
Value disbursed…205
US Dollars
0 700,000 1,800,000 2,200,000 2,500,000
Indicator Modification Form
Date March 2012
Project/Activity Tourism/Improving Management and Infrastructure in Etosha National Park (sub‐activity: ENP Management Centres and Staff Housing)
Indicator % disbursed design/supervisory contracts for ENP housing units/management structures
Modification Type • Adjustment of targets.
Justification • To reflect the adjustments in the numerator and denominator (see tables above).
Indicator Unit Baseline Year 1 Year 2 Year 3 Year 4 Year 5
Original
% disbursed…206 % 0 0% 16% 72% 92% 100%
Modified
% disbursed…207 % 0 16% 72% 88% 100%
Indicator Modification Form
Date March 2012
Project/Activity Tourism/Improving Management and Infrastructure in Etosha National Park (sub‐activity: ENP Management Centres and Staff Housing)
Indicator Value of signed contracts for construction, rehabilitation and equipment for ENP housing units/management structures
Modification Type • Change of unit from “US$ mil” to “US Dollars”.• Adjustment of target values, per the table below.
Justification
• To conform to MCC’s guidance on the ITT.• To reflect the pace of implementation; contracts are not being signed at the pace initially expected due to the outstanding CP and the final estimated costs appear higher than originally documented due to the inclusion of works not initially accounted for.
Indicator Unit Baseline Year 1 Year 2 Year 3 Year 4 Year 5
Original
Value of…208
US$ mil
0 N/A N/A 25.57 25.57 25.57
Modified
Value of…209 US 0 30,865,708 30,865,708
204 Value disbursed against design/supervisory contracts for ENP housing units/management structures 205 Value disbursed against design/supervisory contracts for ENP housing units/management structures 206 % disbursed design/supervisory contracts for ENP housing units/management structures 207 % disbursed design/supervisory contracts for ENP housing units/management structures 208 Value of signed contracts for construction, rehabilitation and equipment for ENP housing units/management structures 209 Value of signed contracts for construction, rehabilitation and equipment for ENP housing units/management structures

86 | Annex 3
Dollars
Indicator Modification Form
Date March 2012
Project/Activity Tourism/Improving Management and Infrastructure in Etosha National Park (sub‐activity: ENP Management Centres and Staff Housing)
Indicator Value disbursed against construction, rehabilitation and equipment for ENP housing units/management structures
Modification Type • Change of unit from “US$ mil” to “US Dollars”.• Adjustment of target values, per the table below.
Justification
• To conform to MCC’s guidance on the ITT.• To reflect the pace of implementation; disbursements against contracts are slightly behind schedule due to the outstanding CP and the final estimated costs appear higher than originally documented due to the inclusion of works not initially accounted for.
Indicator Unit Baseline Year 1 Year 2 Year 3 Year 4 Year 5
Original
Value disbursed…210
US$ mil
0 N/A N/A 9.25 24.94 25.57
Modified
Value disbursed…211
US Dollars
0 23,400,000 30,865,708
Indicator Modification Form
Date March 2012
Project/Activity Tourism/Improving Management and Infrastructure in Etosha National Park (sub‐activity: ENP Management Centres and Staff Housing)
Indicator % disbursed against construction and equipment for ENP housing units/management structures
Modification Type • Adjustment of targets.
Justification • To reflect the adjustments in the numerator and denominator (see tables above).
Indicator Unit Baseline Year 1 Year 2 Year 3 Year 4 Year 5
Original
% disbursed…212 % 0 N/A N/A 36% 98% 100%
Modified
% disbursed…213 % 0 76% 100%
Indicator Modification Form
Date March 2012
Project/Activity Tourism/Improving Management and Infrastructure in Etosha National Park (sub‐activity: ENP Management Centres and Staff Housing)
Indicator Occupancy rate of new housing units completed
Modification Type
• Adjustment of targets, per table below.• Add a note to Notes column in Annex 1 stating the following: “The expectation (as expressed by the Director: Infrastructure on 24 May 2011) is that by December 2013, occupancy should be at 40% and then at 95‐100% by May 2014.”
210 Value disbursed against construction, rehabilitation and equipment for ENP housing units/management structures 211 Value disbursed against construction, rehabilitation and equipment for ENP housing units/management structures 212 % disbursed against construction and equipment for ENP housing units/management structures 213 % disbursed against construction and equipment for ENP housing units/management structures

87 | Annex 3
Justification
• To reflect reality that the houses will not be completed until 23 September 2013 due to the slower‐than‐expected pace of implementation which, in turn, is due to delays caused by the outstanding Condition Precedent on park concessions (the new deadline for the CP to be met is June 2012). • To document the basis of the new targets.
Indicator Unit Baseline Year 1 Year 2 Year 3 Year 4 Year 5
Original
Occupancy…214 % N/A N/A N/A 75% 85% 100%
Modified
Occupancy…215 % 0 40% 100%
Improving Management and Infrastructure in Etosha National Park (sub‐activity: ENP Maintenance and Game Translocation Equipment) Indicator Modification Form
Date March 2012
Project/Activity Tourism/Improving Management and Infrastructure in Etosha National Park (sub‐activity: ENP Maintenance and Game Translocation Equipment)
Indicator Number of kilometers of roads and fire breaks in conservancies adjacent to ENP maintained by MET
Modification Type • Correction of target figures, per table below.
Justification • To reflect the cumulative nature of the indicator.
Indicator Unit Baseline Year 1 Year 2 Year 3 Year 4 Year 5
Original
Number of…216 km 250 0 350 400 450 500
Modified
Number of …217 km 250 0 350 750 1200 1700
Indicator Modification Form
Date March 2012
Project/Activity Tourism/Improving Management and Infrastructure in Etosha National Park (sub‐activity: ENP Maintenance and Game Translocation Equipment)
Indicator Number of game translocated to conservancies with MCA‐N support
Modification Type
• Move the indicator from the Improving Management and Infrastructure in Etosha National Park activity to the Ecotourism Development for Communal Conservancies activity. • Reformatting of unit, per table below. • Correction of baseline. • Adjustment of target figures.
Justification
• To position the indicator under the correct activity.• To conform to MCC guidance on the ITT. • For purposes of accuracy; since this indicator tracks the number of game translocated with MCA‐N‐support, the correct baseline figure is zero. • To correctly reflect the target values as cumulative, per the indicator’s classification, and to reflect the increased number of game expected to be translocated over and above those originally documented due to the faster pace of the implementation expected during Years 3 and 4 and reflecting that there might not be any translocations in Year 5.
214 Occupancy rate of new housing units completed 215 Occupancy rate of new housing units completed 216 Number of kilometers of roads and fire breaks in conservancies adjacent to ENP maintained by MET 217 Number of kilometers of roads and fire breaks in conservancies adjacent to ENP maintained by MET

88 | Annex 3
Indicator Unit Baseline Year 1 Year 2 Year 3 Year 4 Year 5
Original
Number of game…218
# of animals translocated
416 0 445 476 510 545
Modified
Number of game…
# 0 445 1,305 2,135 2,135
Indicator Modification Form
Date March 2012
Project/Activity Tourism/Improving Management and Infrastructure in Etosha National Park (sub‐activity: ENP Maintenance and Game Translocation Equipment)
Indicator Number of rare game (segregated by species) translocated to conservancies with MCA‐N support
Modification Type
• Move the indicator from the Improving Management and Infrastructure in Etosha National Park activity to the Ecotourism Development for Communal Conservancies activity. • Change indicator name to “Rare game translocated to conservancies with MCA‐N support”. • Change of definition from “Number of rare game translocated to conservancies with MCA‐N funded equipment or through grants” to “Number of animals from the following game species translocated to conservancies with MCA‐N funded equipment or through grants: white rhino, black rhino, disease‐free buffalo, roan, sable and black‐faced Impala, tsessebe as well as all the wetland species (hippo, waterbuck, red lechwe, reedbuck, oribi, sitatunga and puku).” • Reformatting of unit, per table below. • Correction of baseline. • Adjustment of target figures.
Justification
• To position the indicator under the correct activity.• To remove reference to segregation that is not reported on in the ITT. • To adopt a definition that is more in line with what would be considered “rare” game. • To conform to MCC guidance on the ITT. • For purposes of accuracy; since this indicator tracks the number of game translocated with MCA‐N‐support, the correct baseline figure is zero. • To correctly reflect the target values as cumulative, per the indicator’s classification, and to reflect the decreased number of rare game expected to be translocated from those originally documented due to revised expectations submitted by the translocation technician at the Ministry of Environment and Tourism based on current rare game availability projections.
Indicator Unit Baseline Year 1 Year 2 Year 3 Year 4 Year 5
Original
Number of game…219
# of animals translocated
122 140 161 186 213 245
Modified
Number of game…220
# 0 161 471 651 651
218 Number of game translocated to conservancies with MCA‐N support 219 Number of rare game (segregated by species) translocated to conservancies with MCA‐N support 220 Number of rare game translocated to conservancies with MCA‐N support

89 | Annex 3
Marketing Namibia in Tourism (sub‐activity: Interactive Website (includes NTB Website and Online Marketing)) Indicator Modification Form
Date March 2012
Project/Activity Tourism/Marketing Namibia in Tourism (sub‐activity: Interactive Website)
Indicator Number of unique visits on NTB website
Modification Type
•Change of indicator name to “Unique visits on the NTB website”. •To expand the definition of the indicator so that it reads as follows: “Number of unique visits on the NTB website”, with an Annex 1 note that quarterly figures are reported cumulatively within each Compact year, though the indicator is level across years. • Reformatting of unit, per table below. • Adjusting baseline and establishing targets, per table below.
Justification
•To remove unnecessary verbiage.• To add clarity to how the indicator is reported. • To conform to MCC’s guidance on the ITT. • To lay out targets to be achieved. Targets were calculated on the basis of the change between 2008 and 2009, assuming a linear progression of unique visits to the website.
Indicator Unit Baseline Year 1 Year 2 Year 3 Year 4 Year 5
Original
Number of unique visits on NTB website
# of visits
144,637 (2008)
TBD TBD TBD TBD TBD
Modified
Unique visits on NTB website
# 155,646 (2009)
TBD TBD TBD
Indicator Modification Form
Date March 2012
Project/Activity Tourism/Marketing Namibia in Tourism (sub‐activity: Interactive Website)
Indicator Unique visits on NTB website from the North American market
Modification Type
Addition of indicator, defined as “The number of unique visits on NTB website from the North American market (United States and Canada)” (unit: #; level: outcome; classification: level; source: NTB; frequency: quarterly; responsible party: NTB; baseline TBD (2011); targets: N/A (2010), N/A (2011), TBD (2012), TBD (2013), TBD (2014); level indicator; source: NTB). A note in Annex 1 will state that quarterly figures are reported cumulatively within each Compact year, though the indicator is level across years.
Justification
To better track performance of this sub‐activity by including an indicator more directly related to the intervention. Targets were calculated on the basis of the change between October to December 2010 (the initial three month period after the new website launched), assuming a linear progression of unique visits to the website. An earlier baseline than the one proposed cannot be set as the old website did not have data that could be disaggregated by origin of website visitor.
Indicator Modification Form
Date March 2012
Project/Activity Tourism/Marketing Namibia in Tourism (sub‐activity: Interactive Website)
Indicator Average time spent on the NTB website
Modification Type
Addition of indicator, defined as “Average time spent on the NTB website per visit” (unit: minutes and seconds; level: outcome; classification: level; source: NTB; frequency: quarterly; responsible party: NTB; baseline 4:09 (2010); targets: N/A (2010), N/A (2011), 4:46 (2012), 5:29 (2013), 6:19 (2014); level

90 | Annex 3
indicator; source: NTB). (Note that quarterly figures reflect average times through that quarter of that Compact year, though the indicator is level across years.)
Justification
To better track performance of this sub‐activity by including an indicator more directly related to the intervention. The revamp of the NTB website is aimed at attracting users not only to the website (as measured by the unique visit indicators) but also to stay on it longer while exploring its more captivating content. The baseline was established using the average time spent on the website in the first three months (October, November, and December) after the website went live in 2010. An earlier baseline than the one proposed cannot be set as the old website did not capture these data. Targets were set assuming an increase of 15% in the average time to be spent on the website.
E.g. target for year 3 =
Indicator Modification Form
Date March 2012
Project/Activity Tourism/Marketing Namibia in Tourism (sub‐activity: Interactive Website)
Indicator Conversion rates on NTB website
Modification Type • Change of indicator name to “Registered users of the NTB website”. • Provision of targets, per table below.
Justification
• Name change in order to have an indicator name that matches the definition, which is “Number of visitors to the NTB website that register to receive updates”. This is how the indicator has been reported to date. • To lay out targets to be achieved. Targets established assuming the same log‐linear trend as indicated by the actual to date (which should be a reasonable assumption at this stage).
Indicator Unit Baseline Year 1 Year 2 Year 3 Year 4 Year 5
Original
Conversion rates on NTB website
# N/A N/A TBD TBD TBD TBD
Modified
Registered users of the NTB website
# 0 560 625 670
Marketing Namibia in Tourism (sub‐activity: Destination Marketing North America) Indicator Modification Form
Date January 2012
Project/Activity Tourism/Marketing Namibia in Tourism (sub‐activity: Destination Marketing North America)
Indicator Number of North American tourism business (travel agencies and tour operators) that offer Namibia tours or tour package.
Modification Type
• Change of baseline data source from “NTB” to “NADM facilitator” (i.e., the project implementer). • Reformatting of unit, per table below. • Updating of the baseline. • Provision of targets, per table below
Justification • For purposes of accuracy (i.e., to reflect the actual data source).
min46:4sec60min77.0min4
min,77.460
sec 286.35
sec 286.3537.35sec249sec15%sec249target
249sec9sec 60sec)(4min min 09:4

91 | Annex 3
• To conform to MCC’s guidance on the ITT.• To provide a more up‐to‐date and verifiable baseline figure, which was obtained from baseline research that the NADM sub‐activity implementer did at the onset of the project (and subsequently revised upwards from 88 to 106). • To lay out targets to be achieved. Targets were set by the project implementer assuming 15 tour operators will be added in the first year of the project and 5 more tour operators added in each of the remaining two years.
Indicator Unit Baseline Year 1 Year 2 Year 3 Year 4 Year 5
Original
Number of…221 # of businesses
30(2008)
N/A N/A 45 50 55
Modified
Number of…222 # 106(2011)
121 126 131
Marketing Namibia in Tourism (sub‐activity: Regional and Communal Tourism Products) Indicator Modification Form
Date March 2012
Project/Activity Tourism/Marketing Namibia in Tourism (sub‐activity: Regional and Communal Tourism Products)
Indicator Number of regional tourist routes developed and marketed to public
Modification Type
• Change of indicator name to “Domestic and regional tourist routes developed and marketed to the public”. • Change of indicator definition from “Number of regional tourist routes developed and marketed to public” to “Number of domestic and regional tourist routes developed and marketed to public”. • Reformatting of unit, per table below. • Update of targets, per table below. • Addition of note to Annex 1 explaining the discrepancy between the targets in Years 2 and 3 as follows “Though a cumulative indicator, the target for Year 4 is equal to that of Year 2 as adjustments were made after Year 2 had ended, and it would not have been appropriate to change them retrospectively.”
Justification
• To accurately reflect the types of routes being developed.• To match the definition with the indicator name. • To conform to MCC guidance on the ITT. • To reflect current implementation expectations. The TOR for this assignment, that may conduct an audit of tourism sites and then develop and market at least two tourism routes within Namibia/Regionally, has only recently been finalized and the actual route development work has not yet begun. However, through this revision MCC recognizes that the original scope of this activity, which envisioned developing five tourism routes, was more ambitious than budget and time allow for and that the Namibian/Regional tourism market can absorb. Currently there is only one semi‐functional tourism route in Namibia, the Cape Namibia Route, and despite branding, web development and outreach efforts, this route does not play a significant role in tourism planning or marketing in Namibia. Therefore, expectations that within a two year period and with a limited budget, five new routes could successfully be developed, branded, and launched are not realistic, especially with a slight decrease in overall figures in the period from Compact Development/Signing to this revision. As a result, the scope in terms of numbers of routes has been decreased from a total of four new routes for a cumulative total
221 Number of North American tourism routes developed (travel agencies and tour operators) that offer Namibia tours or tour package. 222 Number of North American tourism routes developed (travel agencies and tour operators) that offer Namibia tours or tour package.

92 | Annex 3
of five to two new routes for a cumulative total of three.• To add explanatory information to aspects that might seem confusing in the indicator’s documentation.
Indicator Unit Baseline Year 1 Year 2 Year 3 Year 4 Year 5
Original
Number of…223 # routes
1 N/A 2 3 4 5
Modified
Domestic and regional…224
# 1 2 0 2 3
Indicator Modification Form
Date March 2012
Project/Activity Tourism/Marketing Namibia in Tourism (sub‐activity: Regional and Communal Tourism Products)
Indicator Occupancy rate at lodges along newly‐developed domestic and regional tourist routes
Modification Type Deletion of indicator.
Justification
The intervention is not directly aimed at increasing the occupancy rate of lodgesalong the newly‐developed tourist routes. Furthermore, given that the tourist routes have not been established yet, it is impractical to expect to measure changes in this indicator during the Compact period.
Ecotourism Development for Communal Conservancies (sub‐activity: Conservancy Support – Ecotourism Development Packages) Indicator Modification Form
Date March 2012
Project/Activity Tourism/Ecotourism Development for Communal Conservancies (sub‐activity: Conservancy Support)
Indicator Value of grants issued by the Conservancy Grant Fund.
Modification Type
Change of indicator name to “Value of grants issued by the Conservancy Development Support Grant Fund”, with the related change in definition.
Justification To refer to the grant fund with its actual name.
Indicator Modification Form
Date March 2012
Project/Activity Tourism/Ecotourism Development for Communal Conservancies (sub‐activity: Conservancy Support)
Indicator Amount of private sector investment secured cumulatively by MCA‐assisted conservancies
Modification Type
• Change of indicator name to “Amount of new private sector investment secured by MCA‐N‐assisted conservancies”, with the related insertion of the word “new” in the definition. • Reformatting of unit, per table below. • Change of baseline value from “TBD” to zero. • Change of baseline source to “N/A”. • Provision of absolute values for targets.
Justification • To more accurately reflect what is being measured.• To conform to MCC guidance on the ITT.
223 Number of regional tourist routes developed and marketed to public 224 Domestic and regional tourist routes developed and marketed to the public

93 | Annex 3
• To reflect the actual baseline in light of the indicator name and definition change.• To reflect the inapplicability of the baseline source in light of the change in baseline value. • To provide new targets in light of the change in indicator name and definition and in light of the baseline value. The overall reduction in targets by two thirds in each year is in consideration of changes in the market that indicate that private investors are not as responsive as they were initially projected to be.
Indicator Unit Baseline Year 1 Year 2 Year 3 Year 4 Year 5
Original
Amount of…225 N$ TBD N/A N/A BL+30,000,000
BL+50,000,000
BL+60,000,000
Modified
Amount of…226 Namibian Dollars
0 20,000,000 33,000,000 40,000,000
Indicator Modification Form
Date March 2012
Project/Activity Tourism/Ecotourism Development for Communal Conservancies (sub‐activity: Conservancy Support)
Indicator Number of visitors per year to MCA‐N assisted conservancies
Modification Type Deletion of indicator.
Justification It is not possible to collect data on visitors to conservancies because conservancies have open boundaries and do not track these data.
Indicator Modification Form
Date March 2012
Project/Activity Tourism/Ecotourism Development for Communal Conservancies (sub‐activity: Conservancy Support)
Indicator Number of measures taken through MCA‐N grants to prevent human wildlife conflict
Modification Type
•Change of indicator name to “MCA‐N grants aimed at mitigating human wildlife conflict”. • Change of definition from “Protection of water points, crop fields, livestock, and humans through grants” to “Number of MCA‐N grants aimed at mitigating human wildlife conflict (e.g., through protection of water points, crop fields, livestock, and humans).” • Adjustment of targets.
Justification
• To reflect a more measurable indicator.• To provide a definition that corresponds with the new indicator name. • To reflect the fewer number of measures anticipated to be taken; the drop in number is due to the change in implementation strategy (these measures are no longer going to be carried out on a conservancy by conservancy basis but rather as region‐level initiatives which are expected to be overall fewer).
Indicator Unit Baseline Year 1 Year 2 Year 3 Year 4 Year 5
Original
Number of…227 # N/A N/A N/A 6 10 15
Modified
MCA‐N grants…228 # 0 4 6 8
225 Amount of private sector investment secured cumulatively by MCA‐assisted conservancies 226 Amount of private sector investment secured by MCA‐assisted conservancies 227 Number of measures taken through MCA‐N grants to prevent human wildlife conflict 228 MCA‐N grants aimed at mitigating human wildlife conflict

94 | Annex 3
Indicator Modification Form
Date March 2012
Project/Activity Tourism/Ecotourism Development for Communal Conservancies (sub‐activity: Conservancy Support)
Indicator Number of new Joint Venture lodges/ JV campsites or tented camps
Modification Type • Change the indicator name to “New Joint Venture lodges or tented camps”.
Justification • To remove reference to JV campsites, which fits more appropriately with the indicator “Number of new small conservancy enterprises…” (see next indicator modification table below).
Indicator Unit Baseline Year 1 Year 2 Year 3 Year 4 Year 5
Original
Number of new229…
# N/A N/A N/A 5 8 10
Modified
New Joint230 … # 0 5 8 10
Indicator Modification Form
Date March 2012
Project/Activity Tourism/Ecotourism Development for Communal Conservancies (sub‐activity: Conservancy Support)
Indicator Number of new small conservancy enterprises, including natural resources enterprises
Modification Type
• Change of indicator name to “New small tourism and natural resources enterprises within conservancies”. • Change of definition from “The number of new non‐joint venture small natural resource and tourism based enterprises established during the CDSS contract period” to “Number of new non‐joint venture small tourism enterprises (including but not limited to campsites) and natural resource enterprises established during the CDSS contract period.”
Justification • To reflect the inclusion of tourism enterprises and add clarity and specificity to the indicator name. • To add clarity to what is included in the measurement of the indicator.
Indicator Modification Form
Date March 2012
Project/Activity Tourism/Ecotourism Development for Communal Conservancies (sub‐activity: Conservancy Support)
Indicator Number of Annual General Meetings (AGMs) with financial reports submitted and benefit distribution plans discussed
Modification Type Adjustment of targets.
Justification
To correct the previous targets to be in line with what can realistically be achieved (i.e., not all MCA‐N‐assisted conservancies will achieve the milestone of having AGMs with financial reports and benefit distribution plans, which was erroneously assumed when the original targets were set).
Indicator Unit Baseline Year 1 Year 2 Year 3 Year 4 Year 5
Original
Number of231… # N/A N/A N/A 10 17 31
Modified
Number of232 … # 0 14 18 22
229Number of new Joint Venture lodges/ JV campsites or tented camps 230New Joint Venture lodges or tented camps 231Number of Annual General Meetings (AGMs) with financial reports submitted and benefit distribution plans discussed

95 | Annex 3
Indicator Modification Form
Date March 2012
Project/ Activity
Tourism/Ecotourism Development for Communal Conservancies (sub‐activity: Conservancy Support)
Indicator Annual gross revenue to conservancies receiving MCA assistance
Modification Type
• Change of baseline data source from “State of Conservancy Reports 2010, Conservancy Annual Budget” to “State of the Conservancies database”. • Clarification of dollars being referred to in the unit, per table below. • Change of baseline year – and corresponding baseline value – from 2008 to 2010 (which is the year implementation started). • Updating of the target figures as a result of the change in the baseline value. • Correction of End of Compact figure in Annex 2 to match the Year 5 total.
Justification
• To more accurately record the baseline data source.• To enhance clarity and support common understanding on which dollars were being referred while at the same time conforming to MCC’s guidance on the ITT. • To use a baseline year which is closer to the start of the CS sub‐activity’s implementation which, all else being equal, should be a better indication of the situation pre‐intervention. • To provide target values in line with the changed baseline figure, applying a reduced percent increase (BL+3%, BL+6%, and BL+9% versus BL+5%, BL+10%, and BL+15% in Compact years Y3, Y4, and Y5, respectively) from baseline to Year 5, given the external factors that are acting to the intervention’s disadvantage (global economic crisis/recession and its impacts on tourism). • To correctly reflect the level nature of the indicator (the End of Compact target figure is currently calculated as cumulative but is supposed to be level).
Indicator Unit Baseline Year 1
Year 2 Year 3 Year 4 Year 5
Original
Annual gross…233
$ 27,665,935 (2008)
N/A 28,495,913 29,350,790 30,231,314 31,138,254
Modified
Annual gross…234
Namibian Dollars
30,833,276 (2010)
28,495,913 31,758,274 32,683,273 33,608,271
Indicator Modification Form
Date March 2012
Project/Activity Tourism/Ecotourism Development for Communal Conservancies (sub‐activity: Conservancy Support)
Indicator Share of conservancy revenue paid out in dividends and/ or spent on community services
Modification Type
• Change of indicator definition from “% of total annual revenue paid out in dividends to households and/ or spent on community services (includes all cash revenue)” to “The percent of total annual revenue paid out in dividends to households and/or spent on community services (includes all cash and non‐cash revenue) in MCA‐N supported conservancies.” • Change of baseline year to 2010 (which is the year implementation started). • Change of baseline data source from “State of Conservancy Reports 2008 & Conservancy Annual Budget” to “State of Conservancy database”. • Change of baseline and target values.
Justification • To take into account both cash and non‐cash benefits, rather than only cash
232Number of Annual General Meetings (AGMs) with financial reports submitted and benefit distribution plans discussed 233 Annual gross revenue to conservancies receiving MCA assistance 234 Annual gross revenue to conservancies receiving MCA assistance

96 | Annex 3
(non‐cash revenue/dividends are an important benefit to conservancy communities) and to specify that the conservancies in question are the MCA‐N supported conservancies. • To use a baseline year that is closer to the start of implementation of the CDSS intervention. • To reflect the actual source of the baseline value. • To take into account the new indicator definition and baseline year.
Indicator Unit Baseline Year 1 Year 2 Year 3 Year 4 Year 5
Original
Share of…235 % 7% (2008) N/A N/A 8% 8.5% 9%
Modified
Share of…236 % 21% (2010)
22% 23% 24%
Indicator Modification Form
Date March 2012
Project/Activity Tourism/Ecotourism Development for Communal Conservancies (sub‐activity: Conservancy Support)
Indicator Number of new jobs in tourism created in conservancies
Modification Type
• Change of indicator name to “New jobs created in conservancies”. • Change of indicator definition from “The number of new tourism jobs created annually in the 31 MCA‐N conservancies” to “Number of new jobs, including permanent and casual part‐ and full‐time jobs, created annually in the MCA‐N‐supported conservancies”. • To revise the baseline and targets, per the table below. • Change of baseline source to “N/A”.
Justification
• To reflect that all new jobs created in conservancies are included, rather than just tourism jobs. • To add clarity to what is being measured. • To take into account that only new jobs created during the Compact are being tracked and therefore the baseline is zero. • To reflect the inapplicability of the baseline source in light of the change in baseline value.
Indicator Unit Baseline Year 1 Year 2 Year 3 Year 4 Year 5
Original
Number of new…237
# 130 N/A N/A BL+60 BL+120 BL+120
Modified
New jobs…238 # 0 60 120 120
Indicator Modification Form
Date March 2012
Project/Activity Tourism/Ecotourism Development for Communal Conservancies (sub‐activity: Conservancy Support)
Indicator Median Household income in conservancies receiving MCA assistance
Modification Type
• Clarification of dollars being referred to in the unit, per table below. • Change of baseline year from 2010 to 2011. • Correction of the data source from “Joint HH Survey with ICEMA” to “CS/INP household survey”. • Change of responsible party from MCA‐N to CS/INP evaluator.
235 Share of conservancy revenue paid out in dividends and/ or spent on community services 236 Share of conservancy revenue paid out in dividends and/ or spent on community services 237Number of new jobs in tourism created in conservancies 238New jobs created in conservancies

97 | Annex 3
• Change of targets per table below (but actual figures to be provided after data from baseline survey becomes available).
Justification
• To enhance clarity and support common understanding while at the same time conforming to MCC’s guidance on the ITT. • To accurately reflect the baseline period being captured. • To accurately reflect the data source. • To accurately reflect the responsible party. • To accurately reflect the periodicity of reporting as well as allow the formatting to conform to MCC’s guidance on the ITT.
Indicator Unit Baseline Year 1 Year 2 Year 3 Year 4 Year 5
Original
Median…239 $ TBD N/A TBD TBD TBD TBD
Modified
Median… Namibian Dollars
TBD (2011)
TBD
Agriculture Project Indicators Multiple Activities Indicator Modification Form
Date March 2012
Project/Activity Agriculture/Multiple Activities
Indicator Value of sales of cattle slaughtered in abattoirs in the Northern Communal Areas
Modification Type Deletion of indicator.
Justification
Given the characteristics of the livestock market in the NCAs (i.e., high levels of non‐Meatco‐ and non‐abattoir‐based slaughter, presence of numerous cattle sourced from the south, etc.), this indicator is not an accurate measure of the underlying concept of interest.
Indicator Modification Form
Date March 2012
Project/Activity Agriculture/Multiple Activities
Indicator Number of cattle slaughtered in abattoirs in the Northern Communal Areas
Modification Type Deletion of indicator.
Justification
Given the characteristics of the livestock market in the NCAs (i.e., high levels of non‐Meatco‐ and non‐abattoir‐based slaughter, presence of numerous cattle sourced from the south, etc.), this indicator is not an accurate measure of the underlying concept of interest.
Land Access and Management (sub‐activity: Communal Land Support (CLS)) Indicator Modification Form
Date March 2012
Project/Activity Agriculture/Land Access and Management (sub‐activity: CLS)
Indicator Number of Communal Land Board members and Traditional Authority members trained
Modification Type
• Change of indicator name to “Stakeholders trained”.• Change of indicator definition from “Number of Communal Land Board members and Traditional Authority members trained” to “The number of public officials, traditional authorities, project beneficiaries and representatives of the private sector, receiving formal on‐the‐job land training or technical assistance
239 Median Household income in conservancies receiving MCA assistance

98 | Annex 3
regarding registration, surveying, conflict resolution, land allocation, land use planning, land legislation, land management or new technologies”. • Addition of a note in Annex 1 stating that “All the mentioned types of training are relevant to MCA‐N’s land intervention. For the purposes of the Namibia Compact, stakeholders to be trained include Communal Land Board members, Traditional Authority members, and Ministry of Lands and Resettlement officials. ” • Correction of unit formatting, per table below. • Adjustment of targets, per table below.
Justification
• To conform to an MCC common indicator. • To conform to an MCC common indicator’s common definition. Note that CLS project only counts people as trained once they have completed 70% of the modules. Each target group (TA, CLB, MLR staff) has a curriculum which is designed specifically to meet their needs. • To add clarifying detail to the indicator’s documentation. • To conform to MCC’s guidance on the ITT. • The original target of 2,000 exceeded the actual number of people in the groups targeted for training. The revised targets reflect current projections based on confirmations of the total existing number of TAs (600), CLB members (400) and MLR staff (around 200) in the NCAs to be trained. (Figures provided by the CLS Team Leader.)
Indicator Unit Baseline Year 1 Year 2 Year 3 Year 4 Year 5
Original
Number of …240 # of members
N/A 0 500 1,000 1,500 2,000
Modified
Stakeholders trained
# 0 0 500 600 800 1,200
Indicator Modification Form
Date March 2012
Project/Activity Agriculture/Land Access and Management (sub‐activity: CLS)
Indicator Number of outreach events held
Modification Type • Change of indicator name to “Outreach events held”.• Provision of targets, per table below.
Justification
• To eliminate unnecessary verbiage.• To lay out targets in line with implementation expectations. Targets were set based on the CLS work plan and previous achievements of the project. Note that the Year 3 target includes 37 outreach events held in Year 2.
Indicator Unit Baseline Year 1 Year 2 Year 3 Year 4 Year 5
Original
Number of …241
# N/A TBD TBD TBD TBD TBD
Modified
Outreach…242 # 0 87 117 132
Indicator Modification Form
Date March 2012
Project/Activity Agriculture/Land Access and Management (sub‐activity: CLS)
Indicator Total number of parcels registered
Modification Type • Change of indicator name to read “Parcels corrected or incorporated in land system”, with related change in the definition from “Total number of land
240 Number of Communal Land Board members and Traditional Authority members trained 241 Number of outreach events held 242 Outreach events held

99 | Annex 3
parcels registered under the CLS activity” to “The number of parcels with relevant parcel information corrected or newly incorporated into an official land information system (whether a system for the property registry, cadastre or an integrated system).” A clarifying note would be added to Annex 1 stating that “For purposes of the Namibia Compact, this indicator is further defined as the total number of customary and leasehold land parcels registered under the CLS activity.” • Change of indicator level from outcome to output. • Reformatting of unit, per table below. • Adjustment of targets for Years 1 and 2, per table below.
Justification
• To make this indicator consistent with MCC’s Common Indicator terminology since it is a common indicator that will be aggregated across MCC Compact countries for external results‐reporting. • To conform to MCC’s Guidance on Common Indicators for this indicator (given that it is a common indicator). • To conform to MCC’ guidance on the ITT. • To conform to MCC’s guidance on the ITT and to reflect that Year 2 will not have a target, given that the period has passed. Note that this sub‐activity’s design is being refined (e.g., part of the new approach to CLS implementation is to be less concerned with registering parcels and more focused on system reform) and, after that process is complete, targets for Years 3 through 5 will change. (Note that a total of 258 applications had been registered as of December 2011.)
Indicator Unit Baseline Year 1 Year 2 Year 3 Year 4 Year 5
Original
Total number…243 # of parcels
N/A N/A TBD TBD TBD TBD
Modified
Total number…244 # 0 TBD TBD TBD
Indicator Modification Form
Date March 2012
Project/Activity Agriculture/Land Access and Management (sub‐activity: CLS)
Indicator Total number of hectares (of all parcels) registered
Modification Type Deletion of indicator.
Justification
The project is not aiming to register as many hectares as possible (and it is generally not as focused as it initially was on registration anymore). The number of parcels registered is already being captured and is adequate for the purpose of tracking this work and, since parcels would not be selected on the basis of their size, this indicator adds little additional value to the measuring of project impact.
Indicator Modification Form
Date March 2012
Project/Activity Agriculture/Land Access and Management (sub‐activity: CLS)
Indicator Approved procedure in place for registration of group rights
Modification Type
Change the indicator name to “Approved procedure in place for securing/registering rural land management areas”, with the definition “The date on which MLR approves a procedure for securing/registering rural land management areas”.
Justification To more accurately convey the concept of communities securing the commonage for community use as part of managing their rural land (rather
243 Total number of parcels registered 244 Total number of customary and leasehold parcels registered
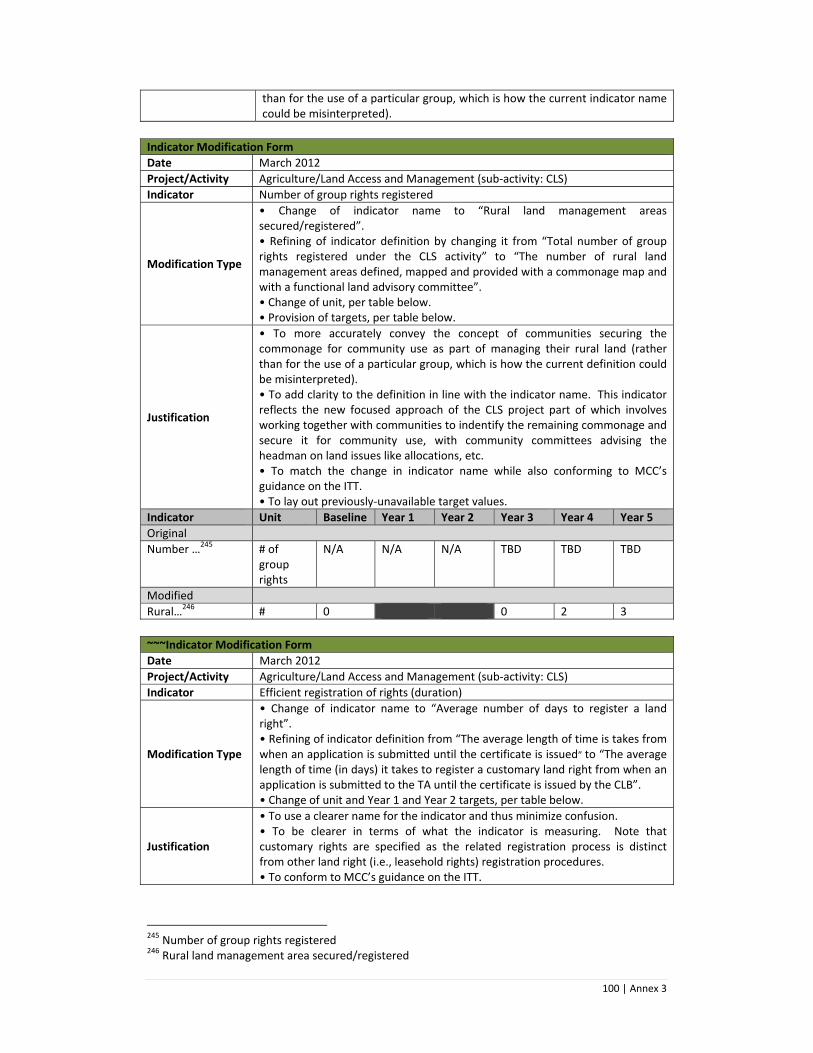
100 | Annex 3
than for the use of a particular group, which is how the current indicator name could be misinterpreted).
Indicator Modification Form
Date March 2012
Project/Activity Agriculture/Land Access and Management (sub‐activity: CLS)
Indicator Number of group rights registered
Modification Type
• Change of indicator name to “Rural land management areas secured/registered”. • Refining of indicator definition by changing it from “Total number of group rights registered under the CLS activity” to “The number of rural land management areas defined, mapped and provided with a commonage map and with a functional land advisory committee”. • Change of unit, per table below. • Provision of targets, per table below.
Justification
• To more accurately convey the concept of communities securing the commonage for community use as part of managing their rural land (rather than for the use of a particular group, which is how the current definition could be misinterpreted). • To add clarity to the definition in line with the indicator name. This indicator reflects the new focused approach of the CLS project part of which involves working together with communities to indentify the remaining commonage and secure it for community use, with community committees advising the headman on land issues like allocations, etc. • To match the change in indicator name while also conforming to MCC’s guidance on the ITT. • To lay out previously‐unavailable target values.
Indicator Unit Baseline Year 1 Year 2 Year 3 Year 4 Year 5
Original
Number …245 # of group rights
N/A N/A N/A TBD TBD TBD
Modified
Rural…246 # 0 0 2 3
~~~Indicator Modification Form
Date March 2012
Project/Activity Agriculture/Land Access and Management (sub‐activity: CLS)
Indicator Efficient registration of rights (duration)
Modification Type
• Change of indicator name to “Average number of days to register a land right”. • Refining of indicator definition from “The average length of time is takes from when an application is submitted until the certificate is issued” to “The average length of time (in days) it takes to register a customary land right from when an application is submitted to the TA until the certificate is issued by the CLB”. • Change of unit and Year 1 and Year 2 targets, per table below.
Justification
• To use a clearer name for the indicator and thus minimize confusion. • To be clearer in terms of what the indicator is measuring. Note that customary rights are specified as the related registration process is distinct from other land right (i.e., leasehold rights) registration procedures. • To conform to MCC’s guidance on the ITT.
245 Number of group rights registered 246 Rural land management area secured/registered

101 | Annex 3
Indicator Unit Baseline Year 1 Year 2 Year 3 Year 4 Year 5
Original
Efficient …247 # of days
TBD TBD TBD TBD TBD TBD
Modified
Average…248 # TBD TBD TBD TBD
Indicator Modification Form
Date March 2012
Project/Activity Agriculture/Land Access and Management (sub‐activity: CLS)
Indicator Efficient registration of rights (rate)
Modification Type
• Change of indicator name to “Percentage of rights registered”. • Refining of indicator definition from “The number of rights that are registered expressed as a percentage of the number of applications that are received in a given quarter” to “The number of customary rights that are registered in a given quarter expressed as a percentage of the number of pending applications at that point”.
Justification
• To use a clearer name for the indicator and thus minimize confusion. • To be clearer in terms of what the indicator is measuring. Note that customary rights are specified as the related registration process is distinct from other land right (i.e., leasehold rights) registration procedures.
Indicator Unit Baseline Year 1 Year 2 Year 3 Year 4 Year 5
Original
Efficient …249 % TBD TBD TBD TBD TBD TBD
Modified
Efficient…250 % TBD TBD TBD TBD
Land Access and Management (sub‐activity: Community‐Based Livestock and Rangeland Management (CBRLM)) Indicator Modification Form
Date March 2012
Project/Activity Agriculture/Land Access and Management (sub‐activity: CBRLM)
Indicator Number of days trainers on site at RIAs during the previous 3 months
Modification Type Deletion of indicator.
Justification To remove a low‐level process indicator that is more of a contract management tool than a measure of actual progress.
Indicator Modification Form
Date March 2012
Project/Activity Agriculture/Land Access and Management (sub‐activity: CBRLM)
Indicator Community exchange visits
Modification Type Deletion of indicator.
Justification
To remove a low‐level process indicator that can be tracked by the contract manager but does not need to be reflected in the M&E Plan. Furthermore, this indicator does not speak to the sub‐activity’s objectives – not to mention that its targets are very easily attainable without saying anything meaningful about achievement.
247 Efficient registration of rights (duration) 248 Average number of days to register a land right 249 Efficient registration of rights (rate) 250 Efficient registration of customary rights (rate)

102 | Annex 3
Indicator Modification Form
Date March 2012
Project/Activity Agriculture/Land Access and Management (sub‐activity: CBRLM)
Indicator Number of grazing area management implementation agreements
Modification Type
• Change of indicator name to “Grazing areas doing combined herding”. • Change of indicator definition from “Total number of Grazing Area Land Use Plan Implementation Agreements signed and in force” to “The number of grazing area (GA*) communities that have agreed to combined herding, which is where two or more cattle‐owning households using the GA agree to bring the cattle that graze in that GA together on a daily basis and herd them in a compact group through the day before returning to individual household kraals for the night.” Note that this is the step that precedes the completion of a documented grazing plan and map of the grazing area (see table below). Also note that at least two households getting together to herd as indicated in the definition is sufficient to indicate interest in adopting a grazing plan. *A GA is defined as the area within a recognized boundary within which grazing resources are found. • Change of indicator level from process to output. • Change of indicator classification from cumulative to level. • Provision of targets, per the table below.
Justification
• To employ the terms used in sub‐activity implementation (this is just a change in terminology not a fundamental change in what is being done in CBRLM implementation). • To add clarity as to what the indicator is measuring. • To reflect the indicator at its appropriate level based on the sub‐activity’s project logic/results chain. • To use the appropriate classification in light of the desire to know the number at a given point in time rather than the cumulative number (particularly given the possibility of attrition). • To lay out previously‐missing target values in line with implementation expectations.
Indicator Unit Baseline Year 1 Year 2 Year 3 Year 4 Year 5
Original
Number of…251 # N/A N/A TBD TBD TBD TBD
Modified
Number of…252 # 0 15 25 45
Indicator Modification Form
Date March 2012
Project/Activity Agriculture/Land Access and Management (sub‐activity: CBRLM)
Indicator Number of Grazing Areas that have completed a Rangeland Management Plan
Modification Type
• Change of indicator name to “Grazing areas with documented grazing plan and map”. • Change of indicator definition from “Total number of grazing areas that have completed a Rangeland Management Plan under CBRLM sub‐activity” to “The number of GAs with documented grazing plan and map of the grazing area, which is divided into sections for each month of the year. The plan indicates which sections will be grazed in each month by the combined herd.” Note that this step occurs after combined herding has started. • Change of indicator level from process to output. • Change of indicator classification from cumulative to level. • Provision of targets, per table below.
251 Number of grazing area management implementation agreements 252 Number of grazing areas doing combined herding

103 | Annex 3
Justification
• To employ the terms used in sub‐activity implementation (this is just a change in terminology not a fundamental change in what is being done in CBRLM implementation). • To add clarity as to what the indicator is measuring. • To reflect the indicator at its appropriate level based on the sub‐activity’s project logic/results chain. • To use the appropriate classification in light of the desire to know the number at a given point in time rather than the cumulative number (particularly given the possibility of attrition). • To lay out previously‐missing target values in line with implementation expectations.
Indicator Unit Baseline Year 1 Year 2 Year 3 Year 4 Year 5
Original
Number of…253 # N/A N/A TBD TBD TBD TBD
Modified
Number of…254 # 0 15 25 45
Indicator Modification Form
Date March 2012
Project/Activity Agriculture/Land Access and Management (sub‐activity: CBRLM)
Indicator Number of Grazing Areas that have completed a Livestock Management Plan
Modification Type
• Change of indicator name to “Grazing areas with documented plans for changing herd composition”. • Change of indicator definition from “Total number of Grazing Areas that have completed a Livestock Management Plan under the CBRLM sub‐activity” to “The number of GAs with documented plans for destocking and restocking herds based on expected resource availability and best‐practices for improving herd productivity (e.g., ideal bull:female ratios).” • Change of indicator level from process to output. • Change of indicator classification from cumulative to level. • Provision of targets, per table below.
Justification
• To employ the terms used in sub‐activity implementation (this is just a change in terminology not a fundamental change in what is being done in CBRLM implementation). • To add clarity as to what the indicator is measuring. • To reflect the indicator at its appropriate level based on the sub‐activity’s project logic/results chain. • To use the appropriate classification in light of the desire to know the number at a given point in time rather than the cumulative number (particularly given the possibility of attrition). • To lay out previously‐missing target values in line with implementation expectations.
Indicator Unit Baseline Year 1 Year 2 Year 3 Year 4 Year 5
Original
Number of…255 # N/A N/A TBD TBD TBD TBD
Modified
Number of…256 # 0 10 20 35
253 Number of Grazing Areas that have completed a Rangeland Management Plan 254 Number of grazing area with documented grazing plan and map 255 Number of Grazing Areas that have completed a Livestock Management Plan 256 Number of grazing area with documented plans for changing herd composition

104 | Annex 3
Indicator Modification Form
Date March 2012
Project/Activity Agriculture/Land Access and Management (sub‐activity: CBRLM)
Indicator Number of Grazing Areas that have completed a Business Management Plan
Modification Type
• Change of indicator name to “Grazing areas with documented combined management plans”. • Change indicator definition from “Total number of Grazing Areas that have completed a Livestock Management Plan under the CBRLM sub‐activity” to “The number of GAs with plans that incorporate grazing management, herding, herd structure, marketing, health, and GA fund plans into a coordinated and interlinked whole that will be documented in the GA Book (where the actions taken and agreed in relation to all elements of the CBRLM approach are recorded).” • Change of indicator level from process to output. • Change of indicator classification from cumulative to level. • Provision of targets, per table below.
Justification
• To employ the terms used in sub‐activity implementation (this is just a change in terminology not a fundamental change in what is being done in CBRLM implementation). • To add clarity as to what the indicator is measuring. • To reflect the indicator at its appropriate level based on the sub‐activity’s project logic/results chain. • To use the appropriate classification in light of the desire to know the number at a given point in time rather than the cumulative number (particularly given the possibility of attrition). • To lay out previously‐missing target values in line with implementation expectations.
Indicator Unit Baseline Year 1 Year 2 Year 3 Year 4 Year 5
Original
Number of…257 # N/A N/A TBD TBD TBD TBD
Modified
Number of…258 # 0 10 20 30
Indicator Modification Form
Date March 2012
Project/Activity Agriculture/Land Access and Management (sub‐activity: CBRLM)
Indicator Number of land use plans in place
Modification Type Deletion of indicator
Justification
In Namibia, the term “land use plan” has a specific connotation and is viewed strictly as the government effort to plan land usage at the levels of conservancies, constituencies and regions. The CBRLM project works with much smaller communities at the village/settlement level and, beyond grazing zonation (which is captured in other CBRLM indicators), the project does not aim to perform land use planning in the sense in which it is understood in Namibia.
Indicator Modification Form
Date March 2012
Project/Activity Agriculture/Land Access and Management (sub‐activity: CBRLM)
Indicator Number of land use plan violations
Modification Type Deletion of indicator.
257 Number of Grazing Areas that have completed a Business Management Plan 258 Number of grazing area with documented combined management plan

105 | Annex 3
Justification The CBRLM project does not aim to engage in land use planning, in the sense in which it is understood in Namibia. Furthermore, even if it referred to grazing zonation plans, this indicator is impractical to define and track.
Indicator Modification Form
Date March 2012
Project/Activity Agriculture/Land Access and Management (sub‐activity: CBRLM)
Indicator Number of trainers certified
Modification Type
• Change of indicator name to “Field facilitators certified in rangeland management”. • Change of indicator definition from “Number of trainers who complete training and are awarded certificates under the CBRLM sub‐activity” to “The number of field facilitators who complete training and are awarded certificates under the CBRLM sub‐activity”. Note that training refers to the transfer of knowledge and skills in the principles and technologies related to CBRLM. It also relates to the development of the capacity of the field facilitators to communicate the CBRLM message to communities and to work with them to implement a CBRLM approach tailored to the specific needs and circumstances of those communities. This set of knowledge and skills is gained through classroom training, workshop‐like training events, teaching materials, in‐field support and coaching from experts, and practical learning by doing with communities. Assessment of competency will take place over the course of the project and a final assessment of each field facilitator will be made at the end of the contract. • Reformatting of the unit, per table below. • Update of targets, per table below.
Justification
• To employ the terms used in sub‐activity implementation (this is just a change in terminology not a fundamental change in what is being done in CBRLM implementation). • To add clarity as to what the indicator is measuring. • To conform to MCC’s guidance on the ITT. • To lay out previously‐missing target values in line with the trainer certification process, which is an ongoing process that does not reach finality until the last year of implementation of the CBRLM sub‐activity.
Indicator Unit Baseline Year 1 Year 2 Year 3 Year 4 Year 5
Original
Number of…259 # of certifications
N/A N/A 20 N/A N/A N/A
Modified
Number of…260 # 0 20
Indicator Modification Form
Date March 2012
Project/Activity Agriculture/Land Access and Management (sub‐activity: CBRLM)
Indicator Number of certifications of completion of training
Modification Type Deletion of indicator.
Justification To reflect the reality that certifications of completion will not be issued to participating households.
Indicator Modification Form
Date March 2012
Project/Activity Agriculture/Land Access and Management (sub‐activity: CBRLM)
259 Number of trainers certified 260 Number of field facilitators certified in rangeland management

106 | Annex 3
Indicator Average weight of three‐year‐old cattle
Modification Type
• Change of indicator’s baseline source from “CBRLM survey” to “CBRLM cattle assessment”. • Change of responsible party from “CBRLM facilitator” to “CBRLM evaluator”. • Change of baseline year from “2010” to “2011”. • Change of reporting frequency from “Year 3, 4, 5” to “Year 5”, with related change in the table per below.
Justification
• To record the actual baseline source.• To record the actual responsible party. • To record the actual baseline year. • To record the actual reporting frequency based on the expected timing of the assessment’s data collection rounds.
Indicator Unit Baseline Year 1 Year 2 Year 3 Year 4 Year 5
Original
Average weight of three‐year‐old cattle
kg TBD (2012)
N/A N/A 280 300 360
Modified
Average weight of three‐year‐old cattle
kg TBD (2011)
360
Note that this indicator and its targets are being revisited pending a contract amendment for the sub‐activity’s implementer and related changes will be reflected in the next revision of the M&E Plan.
Indicator Modification Form
Date March 2012
Project/Activity Agriculture/Land Access and Management (sub‐activity: CBRLM)
Indicator Off‐take rate (from sales)
Modification Type
• Update of definition from “(All cattle sold by a Participating Household over the previous 12 months) / (Herd Size at beginning of period)” to “The result of the following calculation: (All cattle sold by surveyed households over the previous 12 months) / (Herd size at beginning of period).” • Update of reporting frequency from “Year 4, 5” to “Year 5”. • Update of baseline year from “2010/2011” to “2011”. • Provision of baseline value, per table below.
Justification
• To accurately reflect how the calculation is made.• To record the actual baseline source. • To record the actual baseline year. • To record the actual reporting frequency based on the expected timing of the assessment’s data collection rounds.
Indicator Unit Baseline Year 1 Year 2 Year 3 Year 4 Year 5
Original
Off‐take rate (from sales)
% TBD (2010/2011)
N/A N/A N/A N/A 10%
Modified
Off‐take rate (from sales)
% 3.7 (2011) TBD
Note that given the availability of accurate baseline information and a pending a contract amendment for the sub‐activity’s implementer, the appropriate target for this indicator is under discussion and will be reflected in the next revision of the M&E Plan.
Indicator Modification Form
Date March 2012
Project/Activity Agriculture/Land Access and Management (sub‐activity: CBRLM)
Indicator Increase in average annual household income

107 | Annex 3
Modification Type
• Change of indicator name to “Average annual household income”. • Change of indicator definition from “[(Average income for participating households for the previous 12 months)*(Average consumer price index for the previous 12 months)] / [(Average consumer price index for the 12 months covered by the baseline household income survey) – (Baseline average income for participating households)]” to “Total average household income (in constant dollars) over the 12 months preceding the administration of the CBRLM household survey”. • Change of indicator classification from cumulative to level. • Update of reporting frequency from “Year 4, 5” to “Year 5”. • Change of the responsible party from “CBRLM survey facilitator” to “CBRLM evaluator”. • Updating of baseline year from “2010/2011” to “2011”. • Reformatting of unit, per table below. • Provision of baseline value, per table below.
Justification
• To reflect the changed approach to measuring well‐being as measured by income. Average annual income is a more standard measure. • To reflect how the newly‐named indicator is defined. • To use the appropriate classification. • To record the actual reporting frequency based on the expected timing of the assessment’s data collection rounds. • To record the actual responsible party. • To record the actual baseline year. • To conform to MCC’s guidance on the ITT. • To provide a previously‐unavailable baseline value. Average annual household income was calculated using the following variables from the baseline survey: income earned at jobs outside of the farm (monthly); income earned from non‐labour, non‐agricultural sources such as remittances (annual); income generated from the sale of crops (annual); income generated from the sale of animal by‐products (annual); and income generated from the sale of livestock (annual). The amount of income earned monthly was changed into an annual measure. This measure represents total household income, not per capita income, thus household weights were not used.
Indicator Unit Baseline Year 1 Year 2 Year 3 Year 4 Year 5
Original
Increase in…261 N$ TBD (2010/2011)
N/A N/A N/A N/A 5,300
Modified
Average an…262 Namibian Dollars
11,064(2011)
TBD
Note that given the availability of accurate baseline information and a pending a contract amendment for the sub‐activity’s implementer, the appropriate target for this indicator is under discussion and will be reflected in the next revision of the M&E Plan.
Livestock Support (sub‐activities: Preparatory Studies for Infrastructure and Construction of Vet Centres and Quarantine Camps (SVOs and Q‐Camps)) Indicator Modification Form
Date March 2012
Project/Activity Agriculture/Livestock Support (sub‐activity: Construction of SVOs and Q‐Camps)
Indicator Value of signed contracts for construction for SVOs
261 Increase in average annual household income 262 Average annual household income

108 | Annex 3
Modification Type
• Change indicator name to “Value of signed contracts for construction of SVOs”. • Reformatting of unit, per table below. • Adjustment of targets, per table below. • Addition of note to Annex 1 explaining the discrepancy between the targets in Years 2 through 5 as follows “Though a cumulative indicator, the targets for Years 3 through 5 are lower than that of Year 2 as adjustments were made after Year 2 had ended, and it would not have been appropriate to change them retrospectively.” • Removal of red shading of the indicator to de‐signify MCC Common Indicator.
Justification
• To be grammatically correct.• To conform to MCC’s guidance on the ITT. • To reflect the current expectations of the pace of implementation. The total cumulative target value is lower than originally documented as Quarantine Camps were included in the initial calculations and now, correctly (in accordance with the definition), are not. • To add explanatory information to the indicator’s documentation. • To conform to MCC practice with regard to identifying the MCC Common Indicators. Red shading of an indicator signifies that it is an MCC Common indicator, which this indicator is not.
Indicator Unit Base‐line
Year 1 Year 2 Year 3 Year 4 Year 5
Original
Value of…263 US$ mil
0 N/A 6.84 6.84 6.84 6.84
Modified
Value of…264 US Dollars
0 6,840,000 0 6,650,000 6,650,000
Indicator Modification Form
Date March 2012
Project/Activity Agriculture/Livestock Support (sub‐activity: Construction of SVOs and Q‐Camps)
Indicator Value disbursed against construction contracts for SVOs
Modification Type
• Reformatting of unit, per table below.• Adjustment of targets, per table below. • Removal of red shading of the indicator to de‐signify MCC Common Indicator.
Justification
• To conform to MCC’s guidance on the ITT.• To reflect the current expectations of the pace of implementation. The total cumulative target value is lower than originally documented as Quarantine Camps were included in the initial calculations and now, correctly (in accordance with the definition), are not. • To conform to MCC practice with regard to identifying the MCC Common Indicators. Red shading of an indicator signifies that it is an MCC Common indicator, which this indicator is not.
Indicator Unit Baseline Year 1 Year 2 Year 3 Year 4 Year 5
Original
Value disbursed…265
US$ mil
0 N/A N/A 6.59 6.84 6.84
Modified
Value disbursed…266
US Dollars
0 6,300,000 6,650,000
263 Value of signed contracts for construction for SVOs 264 Value of signed contracts for construction of SVOs 265 Value disbursed against construction contracts for SVOs

109 | Annex 3
Indicator Modification Form
Date March 2012
Project/Activity Agriculture/Livestock Support (sub‐activity: Construction of SVOs and Q‐Camps)
Indicator % disbursed against construction contracts for SVOs
Modification Type • Change of indicator classification from incremental to cumulative. • Adjustment of targets, per table below. • Removal of red shading of the indicator to de‐signify MCC Common Indicator.
Justification
• To use the appropriate classification.• To match the changes made in the numerator and denominator (see tables above). • To conform to MCC practice with regard to identifying the MCC Common Indicators. Red shading of an indicator signifies that it is an MCC Common indicator, which this indicator is not.
Indicator Unit Baseline Year 1 Year 2 Year 3 Year 4 Year 5
Original
% disbursed…267 % 0 N/A N/A 96% 100% 100%
Modified
% disbursed…268 % 0 95% 100%
Indicator Modification Form
Date March 2012
Project/Activity Agriculture/Livestock Support (sub‐activity: Construction of SVOs and Q‐Camps)
Indicator Number of new state veterinary offices (SVOs) operational
Modification Type • Reformatting of unit, per table below.• Change of indicator classification from incremental to cumulative. • Update targets, per table below.
Justification
• To conform to MCC’s guidance on the ITT.• To apply MCC’s preferred practice to have all indicators classified as either level or cumulative. • To reflect the revised implementation schedule, which is slower than originally anticipated due to late approval by the Implementing Partner, which delayed procurement process.
Indicator Unit Baseline Year 1 Year 2 Year 3 Year 4 Year 5
Original
Number of…269 # of centres
0 N/A N/A 3 0 2
Modified
Number of… # 0 0 5
Indicator Modification Form
Date March 2012
Project/Activity Agriculture/Livestock Support (sub‐activity: Construction of SVOs and Q‐Camps)
Indicator Q‐Camps completed
Modification Type Addition of indicator that is defined as “Number of Q‐Camps completed”
Justification
To track progress on Q‐Camps since they are no longer included in the contracts for SVOs. (unit: number; level: output; classification: cumulative; source: Construction Supervisory Firm Reports; frequency: quarterly; responsible party: MCA‐N; baseline 0; targets: N/A (2010), N/A (2011), N/A (2012), 2 (2013), 2 (2014).
266 Value disbursed against construction contracts for SVOs 267 % disbursed against construction contracts for SVOs 268 % disbursed against construction contracts for SVOs 269 Number of new state veterinary offices (SVOs) operational

110 | Annex 3
Livestock Support (sub‐activity: Livestock Traceability System) Indicator Modification Form
Date March 2012
Project/Activity Agriculture/Livestock Support (sub‐activity: Livestock Traceability System)
Indicator Number of cattle disease diagnoses (cases) during the last 12 months reporting period by DVS
Modification Type Change the indicator classification from “incremental” to “level” and adjust the End of Compact target values accordingly.
Justification To apply MCC’s preferred practice to have all indicators classified as either level or cumulative.
Indicator Modification Form
Date March 2012
Project/Activity Agriculture/Livestock Support (sub‐activity: Livestock Traceability System)
Indicator NCA module of NamLITS database fully operational
Modification Type
• Change indicator name to “NamLITS 2.0 complete and fully operational”. • Change indicator definition from “Module of Namlits database for data from the NCAs fully operational and able to be populated with data” to “The date on which the Namibia Livestock Identification and Traceability System (NamLITS) database for data from the NCAs is fully operational and able to be populated with data (i.e., Release 3 in place)”. • Update target, per table below.
Justification
To reflect the reality that as NamLITS 2.0 is not being developed as a module of regular NamLITS as originally intended, but it is itself a free‐standing system that will eventually cover the entire livestock population in Namibia and to accurately reflect the expected timing, per the relevant contract.
Indicator Unit Baseline Year 1 Year 2 Year 3 Year 4 Year 5
Original
NCA module…270 Date N/A N/A 30‐Sep‐11
N/A N/A N/A
Modified
NamLITS…271 Date 1‐Sep‐12
Indicator Modification Form
Date March 2012
Project/Activity Agriculture/Livestock Support (sub‐activity: Livestock Traceability System)
Indicator Trial run of traceability system completed
Modification Type Deletion of indicator.
Justification There will not be a single trial run, per se. The trial run is incorporated in the indicator on the NamLITS system being operational, in that several trial runs will be completed before the system can be declared operational.
Livestock (sub‐activity: Livestock Market Efficiency Fund (LMEF)) Indicator Modification Form
Date March 2012
Project/Activity Agriculture/Livestock Support (sub‐activity: LMEF)
Indicator Concept papers submitted for first round of grant selection for the Livestock Efficiency Fund
270 NCA module of NamLITS database fully operational 271 NamLITS 2.0 complete and fully operational
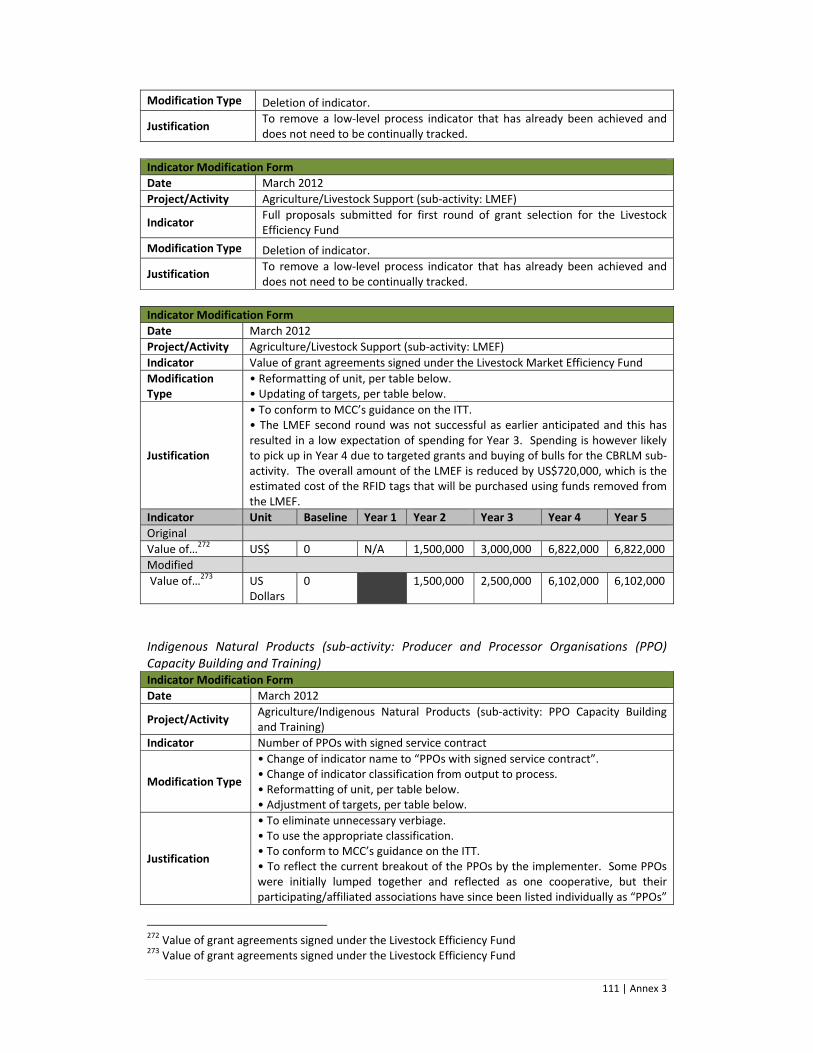
111 | Annex 3
Modification Type Deletion of indicator.
Justification To remove a low‐level process indicator that has already been achieved and does not need to be continually tracked.
Indicator Modification Form
Date March 2012
Project/Activity Agriculture/Livestock Support (sub‐activity: LMEF)
Indicator Full proposals submitted for first round of grant selection for the Livestock Efficiency Fund
Modification Type Deletion of indicator.
Justification To remove a low‐level process indicator that has already been achieved and does not need to be continually tracked.
Indicator Modification Form
Date March 2012
Project/Activity Agriculture/Livestock Support (sub‐activity: LMEF)
Indicator Value of grant agreements signed under the Livestock Market Efficiency Fund
Modification Type
• Reformatting of unit, per table below.• Updating of targets, per table below.
Justification
• To conform to MCC’s guidance on the ITT.• The LMEF second round was not successful as earlier anticipated and this has resulted in a low expectation of spending for Year 3. Spending is however likely to pick up in Year 4 due to targeted grants and buying of bulls for the CBRLM sub‐activity. The overall amount of the LMEF is reduced by US$720,000, which is the estimated cost of the RFID tags that will be purchased using funds removed from the LMEF.
Indicator Unit Baseline Year 1 Year 2 Year 3 Year 4 Year 5
Original
Value of…272 US$ 0 N/A 1,500,000 3,000,000 6,822,000 6,822,000
Modified
Value of…273 US Dollars
0 1,500,000 2,500,000 6,102,000 6,102,000
Indigenous Natural Products (sub‐activity: Producer and Processor Organisations (PPO) Capacity Building and Training) Indicator Modification Form
Date March 2012
Project/Activity Agriculture/Indigenous Natural Products (sub‐activity: PPO Capacity Building and Training)
Indicator Number of PPOs with signed service contract
Modification Type
• Change of indicator name to “PPOs with signed service contract”. • Change of indicator classification from output to process. • Reformatting of unit, per table below. • Adjustment of targets, per table below.
Justification
• To eliminate unnecessary verbiage.• To use the appropriate classification. • To conform to MCC’s guidance on the ITT. • To reflect the current breakout of the PPOs by the implementer. Some PPOs were initially lumped together and reflected as one cooperative, but their participating/affiliated associations have since been listed individually as “PPOs”
272 Value of grant agreements signed under the Livestock Efficiency Fund 273 Value of grant agreements signed under the Livestock Efficiency Fund

112 | Annex 3
in their own right. Therefore, though the target numbers appear to have increased, they in fact represent the same population of entities.
Indicator Unit Baseline Year 1 Year 2 Year 3 Year 4 Year 5
Original
Number of…274
# of producers
N/A 13 15 25 30 30
Modified
PPOs with…275 # 0 13 15 40 60 60
Indicator Modification Form
Date March 2012
Project/Activity Agriculture/Indigenous Natural Products (sub‐activity: PPO Capacity Building and Training)
Indicator Number of Primary Production Improvement Grants awarded
Modification Type Deletion of indicator.
Justification To remove a low‐level process indicator that does not add considerable value. The value of Primary Production Improvement Grants awarded is more relevant to track and is already included in the M&E Plan.
Indicator Modification Form
Date March 2012
Project/Activity Agriculture/Indigenous Natural Products (sub‐activity: PPO Capacity Building and Training)
Indicator Number of INP producers selected, mobilised and trained
Modification Type
• Change of indicator name to “INP producers mobilised and trained”. • Change of definition from “The number of producers that have been selected, mobilised and trained” to “The number of INP producers belonging to a PPO with a signed service agreement and who, as members of the PPO, have received at least one training module.” • Reformatting of unit, per table below. • Adjustment of targets, per table below. • Addition of note to Annex 1 explaining the discrepancy between the targets in Years 2 and 3 as follows “Though a cumulative indicator, the target for Year 3 is lower than that of Year 2 as adjustments were made after Year 2 had ended, and it would not have been appropriate to change them retrospectively.”
Justification
• To reflect the reality that producers are not “selected”, per se. • To add clarity with regard to who is being counted. • To conform to MCC’s guidance on the ITT. • To adjust targets to the expected rate of implementation (which is ramping up slower than expected) and number of producers that exist (the implementer informed MCA‐N in late November 2011 that new data indicated that 2,000 fewer registered harvesters exist and may participate in the project than expected). Therefore, the targets should be adjusted accordingly. • To add explanatory information to the indicator’s documentation.
Indicator Unit Baseline Year 1 Year 2 Year 3 Year 4 Year 5
Original
Number of…276 # of INP producers
N/A 3,750 6,250 8,500 9,000 9,000
Modified
INP producers…277 # 0 3,750 6,250 5,000 7,000 7,000
274 Number of PPOs with signed service contracts 275 PPOs with signed service contracts 276 Number of INP producers selected, mobilized and trained 277 INP producers mobilised and trained

113 | Annex 3
Indicator Modification Form
Date March 2012
Project/Activity Agriculture/Indigenous Natural Products (sub‐activity: PPO Capacity Building and Training)
Indicator Number of new and improved INP production and processing technologies introduced to processors
Modification Type Deletion of indicator.
Justification Indicator is not valid as it does not reflect the aim of the intervention and is not measurable.
Indicator Modification Form
Date March 2012
Project/Activity Agriculture/Indigenous Natural Products (sub‐activity: PPO Capacity Building and Training)
Indicator Number of PPOs that have developed and are using a business plan
Modification Type
• Change indicator name to “PPOs that have developed and are using business plans”. • Change of indicator classification from process to output. • Reformatting of the unit, per table below. • Updating of targets, per table below.
Justification
• To eliminate unnecessary verbiage.• To use the appropriate classification. • To conform to MCC’s guidance on the ITT. • To reflect the reality that PPO associations will be counted as individual PPOs and not lumped together into one PPO as they were originally tabulated.
Indicator Unit Baseline Year 1 Year 2 Year 3 Year 4 Year 5
Original
Number of…278 # of PPOs N/A N/A 13 30 30 30
Modified
PPOs that have…279 # 0 13 20 50 60
Indicator Modification Form
Date March 2012
Project/Activity Agriculture/Indigenous Natural Products (sub‐activity: PPO Capacity Building and Training)
Indicator Number of PPOs certified
Modification Type
• Change of indicator name to “PPOs certified”.• Change of indicator definition to “The number of PPOs certified by an independent body to meet certain requirements, e.g., organic, fair trade, ethical trade, HACCP, etc. (but does not include “Made in Namibia” certification).”
Justification • To eliminate unnecessary verbiage.• To add clarity as to what is being measured and thus strengthen reporting.
Indicator Modification Form
Date March 2012
Project/Activity Agriculture/Indigenous Natural Products (sub‐activity: PPO Capacity Building and Training)
Indicator Number of PPOs trained in business and marketing principles
Modification Type • Change of indicator name to “PPOs trained in business and marketing principles”.
278 Number of PPOs that have developed and are using a business plan 279 PPOs that have developed and are using a business plan

114 | Annex 3
• Change of definition from “The number of Producer and Processor Organisations that have been trained in business and marketing principles” to “The number of PPOs where business and marketing training has taken place with at least two training events completed.” • Reformatting of the unit, per table below. • Updating of targets, per table below.
Justification
• To eliminate unnecessary verbiage.• To be more precise about what how “trained” is defined. The target number of training events was selected on the basis of the outcome of the sub‐activity implementer’s Training Needs Assessment and training plans for 2011. According to the plans, all PPOs receiving support should get at least 2 modules of training. • To conform to MCC’s guidance on the ITT. • To reflect the reality that PPO associations will be counted as individual PPOs and not lumped together into one PPO as they were originally tabulated.
Indicator Unit Baseline Year 1 Year 2 Year 3 Year 4 Year 5
Original
Number of…280 # of PPOs N/A 10 15 30 30 30
Modified
PPOs trained in…
281
# 0 10 15 30 55 60
Indicator Modification Form
Date March 2012
Project/Activity Agriculture/Indigenous Natural Products (sub‐activity: PPO Capacity Building and Training)
Indicator Number of PPOs trained in organisational management
Modification Type
• Change indicator name to “PPOs trained in organisational management”. • Change indicator definition from “The number of Producer and Processor Organisations that have been trained in organizational management” to “The number of PPOs where organisational management training has taken place with at least two training events completed”. • Reformatting of the unit, per table below. • Updating of targets, per table below.
Justification
• To eliminate unnecessary verbiage.• To be more precise about what how “trained” is defined. The target number of training events was selected on the basis of the outcome of the sub‐activity implementer’s Training Needs Assessment and training plans for 2011. According to the plans, all PPOs receiving support should get at least 2 modules of training. • To conform to MCC’s guidance on the ITT. • To reflect the reality that PPO associations will be counted as individual PPOs and not lumped together into one PPO as they were originally tabulated.
Indicator Unit Baseline Year 1 Year 2 Year 3 Year 4 Year 5
Original
Number of…282 # of PPOs N/A 10 15 30 30 30
Modified
PPOs trained in…283
# 0 10 15 30 55 60
280 Number of PPOs trained in business and marketing principles 281 PPOs trained in business and marketing principles 282 Number of PPOs trained in organisational management 283 PPOs trained in organisational management

115 | Annex 3
Indicator Modification Form
Date March 2012
Project/Activity Agriculture/Indigenous Natural Products (sub‐activity: PPO Capacity Building and Training)
Indicator
INP producers who have been trained in sustainable harvesting techniques, with the definition “The number of INP producers who have completed training in sustainable harvesting techniques” (unit: #; level: output; classification: cumulative; source: MCA‐N/INP facilitator; frequency: quarterly; responsible party: MCA‐N; baseline: N/A; targets: N/A (2010), N/A (2011), 750 (2012), 1,250 (2013), 1,750 (2014))
Modification Type Addition of indicator.
Justification To track progress on an important component of the sub‐activity.
Indicator Modification Form
Date March 2012
Project/Activity Agriculture/Indigenous Natural Products (sub‐activity: PPO Capacity Building and Training)
Indicator Number of Resource Management/Monitoring Plans
Modification Type
• Change of indicator name to “PPOs with resource management/monitoring plans for environmentally fragile INPs”. • Change of indicator definition to “The number of PPOs that have adopted (i.e., finalized and endorsed) resource management/monitoring plans, which are plans that specify how INPs will be managed.” • Change of indicator classification from process to output.
Justification • To be consistent with the unit of interest being the PPO.• To be more precise with regard to what is being measured. • To use the appropriate classification.
Indicator Unit Baseline Year 1 Year 2 Year 3 Year 4 Year 5
Original
Number of…284 # of plans N/A N/A 10 15 30 30
Modified
PPOs with…285 # 0 10 15 30 30
Indigenous Natural Products (sub‐activity: INP Innovation Fund (INP‐IF)) Indicator Modification Form
Date March 2012
Project/Activity Agriculture/Indigenous Natural Products (sub‐activity: INP‐IF)
Indicator Concept papers submitted for first round of grant selection
Modification Type Deletion of indicator.
Justification To remove a low‐level process indicator that has already been achieved and does not need to be continually tracked.
Indicator Modification Form
Date March 2012
Project/Activity Agriculture/Indigenous Natural Products (sub‐activity: INP‐IF)
Indicator Full proposals submitted for first round of grant selection
Modification Type Deletion of indicator.
Justification To remove a low‐level process indicator that has already been achieved and does not need to be continually tracked.
284 Number of Resource Management/Monitoring Plans 285 PPOs with Resource Management/Monitoring Plans
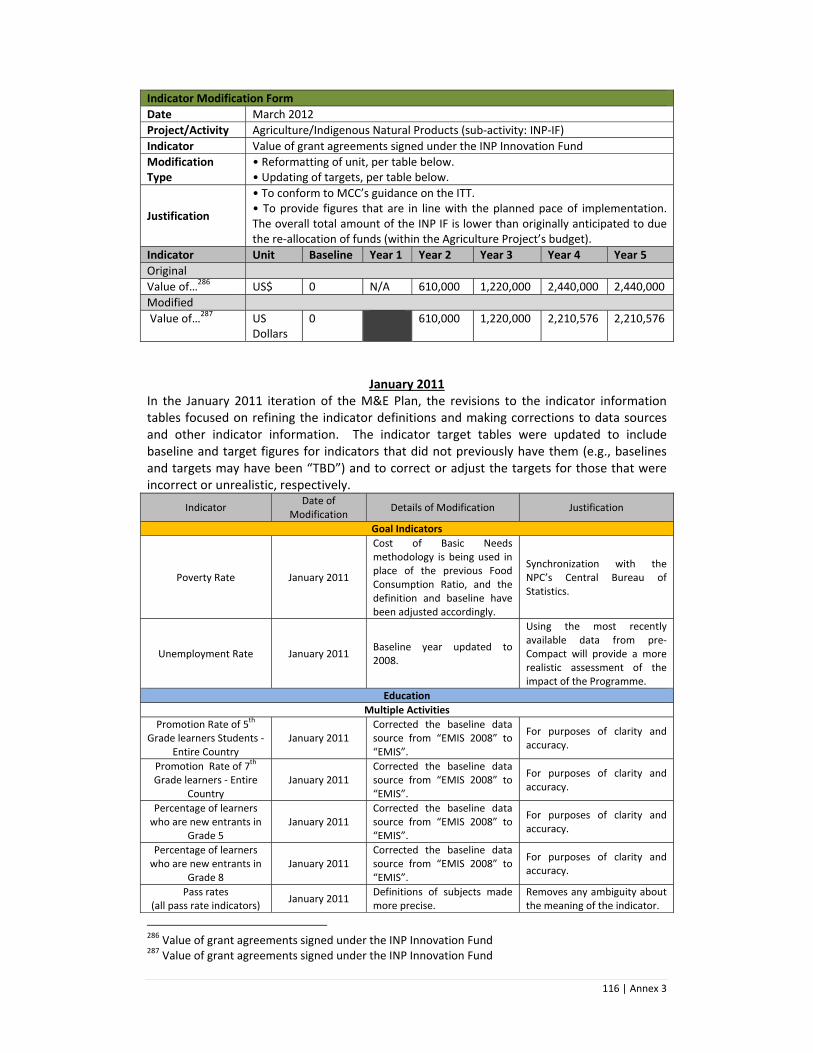
116 | Annex 3
Indicator Modification Form
Date March 2012
Project/Activity Agriculture/Indigenous Natural Products (sub‐activity: INP‐IF)
Indicator Value of grant agreements signed under the INP Innovation Fund
Modification Type
• Reformatting of unit, per table below.• Updating of targets, per table below.
Justification
• To conform to MCC’s guidance on the ITT.• To provide figures that are in line with the planned pace of implementation. The overall total amount of the INP IF is lower than originally anticipated to due the re‐allocation of funds (within the Agriculture Project’s budget).
Indicator Unit Baseline Year 1 Year 2 Year 3 Year 4 Year 5
Original
Value of…286 US$ 0 N/A 610,000 1,220,000 2,440,000 2,440,000
Modified
Value of…287 US Dollars
0 610,000 1,220,000 2,210,576 2,210,576
January 2011 In the January 2011 iteration of the M&E Plan, the revisions to the indicator information tables focused on refining the indicator definitions and making corrections to data sources and other indicator information. The indicator target tables were updated to include baseline and target figures for indicators that did not previously have them (e.g., baselines and targets may have been “TBD”) and to correct or adjust the targets for those that were incorrect or unrealistic, respectively.
Indicator Date of
Modification Details of Modification Justification
Goal Indicators
Poverty Rate January 2011
Cost of Basic Needs methodology is being used in place of the previous Food Consumption Ratio, and the definition and baseline have been adjusted accordingly.
Synchronization with the NPC’s Central Bureau of Statistics.
Unemployment Rate January 2011 Baseline year updated to 2008.
Using the most recently available data from pre‐Compact will provide a more realistic assessment of the impact of the Programme.
Education
Multiple Activities
Promotion Rate of 5th Grade learners Students ‐
Entire Country January 2011
Corrected the baseline data source from “EMIS 2008” to “EMIS”.
For purposes of clarity and accuracy.
Promotion Rate of 7th Grade learners ‐ Entire
Country January 2011
Corrected the baseline data source from “EMIS 2008” to “EMIS”.
For purposes of clarity and accuracy.
Percentage of learners who are new entrants in
Grade 5 January 2011
Corrected the baseline data source from “EMIS 2008” to “EMIS”.
For purposes of clarity and accuracy.
Percentage of learners who are new entrants in
Grade 8 January 2011
Corrected the baseline data source from “EMIS 2008” to “EMIS”.
For purposes of clarity and accuracy.
Pass rates (all pass rate indicators)
January 2011 Definitions of subjects made more precise.
Removes any ambiguity about the meaning of the indicator.
286 Value of grant agreements signed under the INP Innovation Fund 287 Value of grant agreements signed under the INP Innovation Fund

117 | Annex 3
Indicator Date of
Modification Details of Modification Justification
Baseline figures corrected. The baseline figures were previously incorrect (making the related targets incorrect as well), and it goes without saying that having accurate figures is important.
47 schools
Promotion Rate of 5th Grade learners ‐ 47
Schools January 2011 Deleted.
Indicator was not be meaningful due to the methodological problems of calculating promotion rates for a subset of schools.
Promotion Rate of 7th
Grade learners ‐ 47 schools
January 2011 Deleted.
Indicator was not be meaningful due to the methodological problems of calculating promotion rates for a subset of schools.
Percent of learners who are new entrants in Grade 5 ‐ 47 schools
January 2011 Corrected the baseline data source from “EMIS 2008” to “EMIS”.
For purposes of clarity and accuracy.
Percent of learners who are new entrants in Grade 8 ‐ 47 schools
January 2011 Corrected the baseline data source from “EMIS 2008” to “EMIS”.
For purposes of clarity and accuracy.
Pass rates (all pass rate indicators)
January 2011
Definitions of subjects made more precise. Baseline figures corrected.
Removes any ambiguity about the meaning of the indicator. The baseline figures were previously incorrect (making the related targets incorrect as well), and it goes without saying that having accurate figures is important.
Teacher qualification ‐ 47 schools
January 2011 Corrected the baseline data source from “EMIS database” to “EMIS”.
For purposes of consistency.
Value of signed contracts for construction, rehabilitation and
equipment for 47 schools
January 2011 Targets adjusted. To provide the most up‐to‐date estimates..
Value disbursed against construction,
rehabilitation and equipment contracts for
47 schools
January 2011 Targets adjusted. To provide the most up‐to‐date estimates..
Value of signed contracts for design/supervisory services for 47 schools
January 2011 Targets corrected. Indicator note added.
For purposes of accuracy. To provide clarity.
Value disbursed against design/ supervisory
contracts January 2011 Targets adjusted.
To be more realistic to the situation on the ground.
Educational facilities constructed,
rehabilitated, equipped in the 47 schools sub‐
activity
January 2011 Year 2009/2010 target adjusted to read “N/A” rather than “0”.
For purposes of clarity and accuracy, and per MCC’s preferred practice.
Number of students (any level) participating in the 47 schools sub‐activity
January 2011 Corrected the baseline data source from “EMIS database” to “EMIS”.
For purposes of consistency.
Vocational Training
Average income of January 2011 Source of indicator To be accurate about the

118 | Annex 3
Indicator Date of
Modification Details of Modification Justification
people employed, or ranges of incomes, and disaggregated by sector
information changed from M&E Survey to MCA‐N/NTA. Indicator note revised.
source of data as the M&E Survey will not take place as previously envisioned. To commit to establishing targets in the September 2011 iteration of the M&E Plan.
No. of trainees who secure 6 months of income during the 12 months' period after course completion for Vocational Education
graduates
January 2011
Source of indicator information changed from M&E Survey to MCA‐N/NTA. Indicator note revised.
To be accurate about the source of data as the M&E Survey will not take place as previously envisioned. To commit to establishing targets in the September 2011 iteration of the M&E Plan.
Number of COSDEC, VTC and NTA staff trained in admin/management
January 2011 Targets adjusted to read “N/A” rather than “0” when they are not applicable.
Per MCC’s preferred practice.
Compliance rate for National Training Fund
Levy January 2011
Targets adjusted to read “N/A” rather than “0” when they are not applicable.
Per MCC’s preferred practice.
Value of Vocational Training Grants Awarded through the MCA‐N
Grant Facility
January 2011 N$ changed to US$. To capture the amount in the correct currency.
Value of Vocational Training Grants Awarded through the MCA‐N
Grant Facility
January 2011 Classification of indicator changed from “Incremental” to “Cumulative”.
Per pending MCC policy change to have all indicators be classified as either “Level” or “Cumulative”.
Value of Vocational Training Grants Awarded through the NTF Levy
January 2011
Name of indicator revised from “Value of Vocational Training Grants Awarded through the NTF Levy and Facility” to “Value of Vocational Training Grants Awarded through the NTF Levy”. Classification of indicator changed from “Incremental” to “Cumulative”.
For purposes of accuracy, to specify that it is the NTF Levy and not the MCA‐N Grant Facility that is meant. Per pending MCC policy change to have all indicators be classified as either “Level” or “Cumulative”.
Number of Vocational Trainees assisted through the MCA‐N Grant Facility
January 2011 Classification of indicator changed from “Incremental” to “Cumulative”.
Per pending MCC policy change to have all indicators be classified as either “Level” or “Cumulative”.
Number of Vocational Trainees assisted through
the NTF levy January 2011
Classification of indicator changed from “Incremental” to “Cumulative”.
Per pending MCC policy change to have all indicators be classified as either “Level” or “Cumulative”.
Value of signed contracts for construction, rehabilitation and
equipment for COSDECs
January 2011
Year 2009/2010 target adjusted to read “N/A” rather than “0”. Targets adjusted.
For purposes of clarity and accuracy, and per MCC’s preferred practice. To provide the most up‐to‐date estimates.
Value disbursed against construction,
rehabilitation and equipment contracts for
January 2011
Year 2009/2010 target adjusted to read “N/A” rather than “0”.
For purposes of clarity and accuracy, and per MCC’s preferred practice.

119 | Annex 3
Indicator Date of
Modification Details of Modification Justification
COSDECs Targets adjusted.
To provide the most up‐to‐date estimates.
Value of signed contracts for design/supervisory services for COSDECs
January 2011 Targets adjusted. To provide the most up‐to‐date estimates.
Value disbursed against design/supervisory
contracts for COSDECs January 2011 Targets adjusted.
To provide the most up‐to‐date estimates.
Number of beneficiaries from the vocational
training sub‐activity who have completed training.
January 2011 Level of indicator changed to “Output” from “2009”.
For purposes of accuracy.
Textbooks
Learner‐Textbook Ratio of 1 to 1 ‐ disaggregated by Science, Maths and
English
January 2011 Indicator note added. To provide clarity on way forward re targets.
Learner‐Textbook Ratio of 1 to 2 ‐ disaggregated by Science, Maths and
English
January 2011 Indicator note added. To provide clarity on way forward re targets.
Number of textbooks delivered
January 2011
Reporting frequency corrected from “Year 1, 4, 5” to “Years 1 and 5”. Baseline source changed from “MOE” to “MCA‐N”. Indicator note added. Targets adjusted to read“N/A” rather than “TBD” when they are not applicable.
For purposes of accuracy. For purposes of accuracy. To provide clarity on way forward re targets. For purposes of accuracy, as the delivery of textbooks is “N/A” for the stated years and only “TBD” for Year 5 and end‐of‐Compact.
Number of teachers and managers trained in
textbook management, utilisation and storage
January 2011
Frequency of reporting provided. Classification of indicator changed from “Incremental” to “Cumulative”.
To provide additional information. Per pending MCC policy change to have all indicators be classified as either “Level” or “Cumulative”.
Textbook management/utilisation training report received
from Contractor.
January 2011
Data source corrected from ”MOE” to “MCA‐N”. Targets adjusted to read “N/A” rather than “0” when they are not applicable.
For purposes of accuracy. For purposes of accuracy and per MCC’s preferred practice.
Textbook storage plan complete
January 2011 Targets adjusted to read “N/A” rather than “0” when they are not applicable.
For purposes of accuracy and per MCC’s preferred practice.
First textbook procurement contract
signed January 2011
Targets adjusted to read “N/A” rather than “0” when they are not applicable.
For purposes of accuracy and per MCC’s preferred practice.
Textbook baseline study completed
January 2011 Targets adjusted to read “N/A” rather than “0” when they are not applicable.
For purposes of accuracy and per MCC’s preferred practice.
Regional Study and Resource Centres
Number of library loans January 2011 Targets adjusted to read For purposes of accuracy and

120 | Annex 3
Indicator Date of
Modification Details of Modification Justification
of books and learning and study materials from MCA‐N assisted RSRCs
“N/A” rather than “0” when they are not applicable.
per MCC’s preferred practice.
Number of visits to MCA‐N assisted RSRCs
January 2011
Targets adjusted to read “N/A” rather than “0” when they are not applicable. Classification of indicator changed from “Incremental” to “Cumulative”.
For purposes of accuracy and per MCC’s preferred practice. Per pending MCC policy change to have all indicators be classified as either “Level” or “Cumulative”.
Number of RSRCs completed & open for
visitors January 2011
Targets adjusted to read “N/A” rather than “0” when they are not applicable. Reporting frequency changed from “Annually” to “Year 3, 4, 5”.
For purposes of accuracy and per MCC’s preferred practice. For purposes of accuracy.
Value of signed contracts for construction, rehabilitation and
equipment for RSRCs
January 2011 Targets adjusted. To provide the most up‐to‐date estimates..
Value disbursed against design/supervisory contracts for RSRCs
January 2011
Year 2009/2010 target adjusted to read “N/A” rather than “0”. Targets adjusted.
For purposes of clarity and accuracy, and per MCC’s preferred practice. To provide the most up‐to‐date estimates..
Value of signed contracts for design/supervisory services for RSRCs
January 2011 Targets corrected. For purposes of accuracy.
Value disbursed against design/supervisory contracts for RSRCs
January 2011 Targets adjusted. To provide the most up‐to‐date estimates..
Tertiary Finance and Continuous Professional Development
n/a January 2011
Description revised to updated to read “Tertiary Finance and CPD” rather than “Tertiary Finance and HAMU” and the revision timeframe changed from September 2010 to September 2011.
For purposes of accuracy.
Tourism
Multiple Activities
Number of leisure tourist arrivals
January 2011
Data source corrected from “NTB, communication to CT, May 2009” to “MET”, and responsible party changed from “NTB” to “MET”. Baseline figure corrected.
For purposes of accuracy. For purposes of accuracy.
Jobs created through tourism
January 2011
Indicator notes updated to reflect up‐to‐date status. Baseline figure and year corrected based on official documents. Targets adjusted to read “N/A” rather than “TBD” when they are not applicable.
For purposes of accuracy. For purposes of accuracy. For purposes of accuracy and per MCC’s preferred practice.
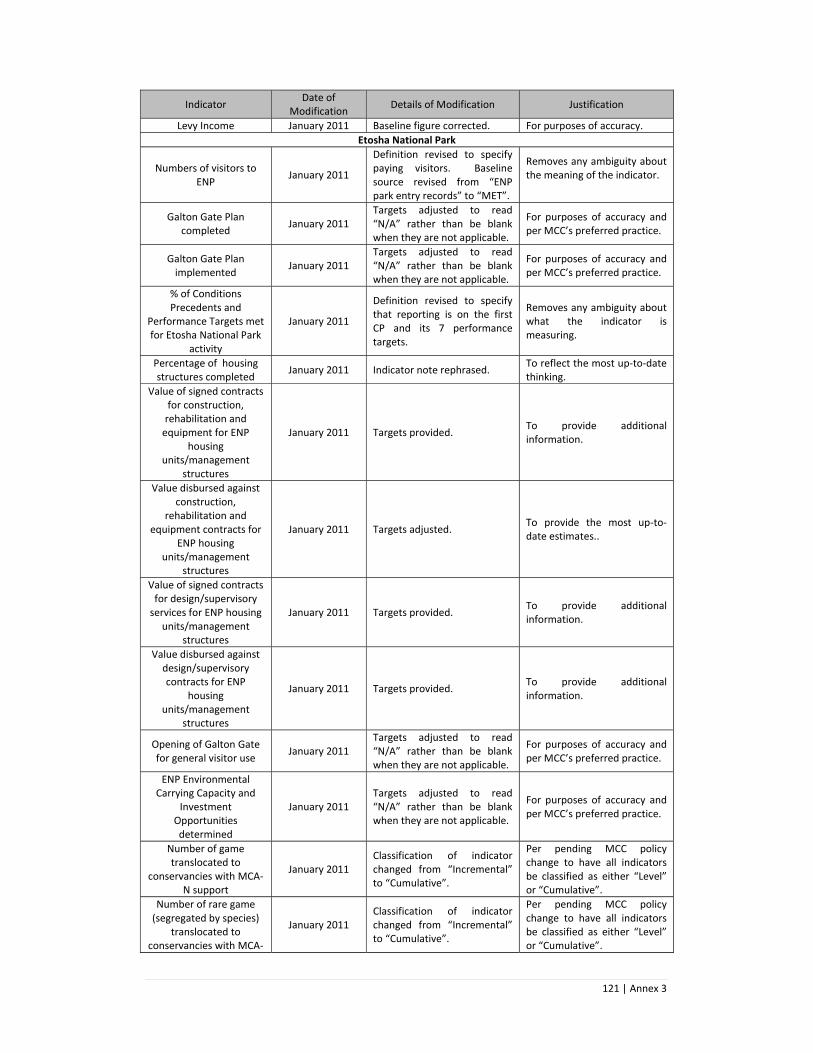
121 | Annex 3
Indicator Date of
Modification Details of Modification Justification
Levy Income January 2011 Baseline figure corrected. For purposes of accuracy.
Etosha National Park
Numbers of visitors to ENP
January 2011
Definition revised to specify paying visitors. Baseline source revised from “ENP park entry records” to “MET”.
Removes any ambiguity about the meaning of the indicator.
Galton Gate Plan completed
January 2011 Targets adjusted to read “N/A” rather than be blank when they are not applicable.
For purposes of accuracy and per MCC’s preferred practice.
Galton Gate Plan implemented
January 2011 Targets adjusted to read “N/A” rather than be blank when they are not applicable.
For purposes of accuracy and per MCC’s preferred practice.
% of Conditions Precedents and
Performance Targets met for Etosha National Park
activity
January 2011
Definition revised to specify that reporting is on the first CP and its 7 performance targets.
Removes any ambiguity about what the indicator is measuring.
Percentage of housing structures completed
January 2011 Indicator note rephrased. To reflect the most up‐to‐date thinking.
Value of signed contracts for construction, rehabilitation and equipment for ENP
housing units/management
structures
January 2011 Targets provided. To provide additional information.
Value disbursed against construction,
rehabilitation and equipment contracts for
ENP housing units/management
structures
January 2011 Targets adjusted. To provide the most up‐to‐date estimates..
Value of signed contracts for design/supervisory services for ENP housing
units/management structures
January 2011 Targets provided. To provide additional information.
Value disbursed against design/supervisory contracts for ENP
housing units/management
structures
January 2011 Targets provided. To provide additional information.
Opening of Galton Gate for general visitor use
January 2011 Targets adjusted to read “N/A” rather than be blank when they are not applicable.
For purposes of accuracy and per MCC’s preferred practice.
ENP Environmental Carrying Capacity and
Investment Opportunities determined
January 2011 Targets adjusted to read “N/A” rather than be blank when they are not applicable.
For purposes of accuracy and per MCC’s preferred practice.
Number of game translocated to
conservancies with MCA‐N support
January 2011 Classification of indicator changed from “Incremental” to “Cumulative”.
Per pending MCC policy change to have all indicators be classified as either “Level” or “Cumulative”.
Number of rare game (segregated by species)
translocated to conservancies with MCA‐
January 2011 Classification of indicator changed from “Incremental” to “Cumulative”.
Per pending MCC policy change to have all indicators be classified as either “Level” or “Cumulative”.

122 | Annex 3
Indicator Date of
Modification Details of Modification Justification
N support
Number of kilometres of roads and fire breaks in conservancies adjacent to ENP maintained by
MET
January 2011
Classification of indicator changed from “Incremental” to “Cumulative”. Baseline year provided. 2009/10 target adjusted to read “0” rather than be blank.
Per pending MCC policy change to have all indicators be classified as either “Level” or “Cumulative”. To be comprehensive. To be more appropriate.
Number of kilometres of roads and fire breaks within ENP maintained
by MET
January 2011
Classification of indicator changed from “Level” to “Cumulative”. Indicator note edited.
To be more appropriate. To lay out next steps within time‐bound period.
Marketing in Tourism
Tourist arrivals from the North American market
January 2011
Source and responsible party for data changed to “MET” from “NTB”. Baseline source similarly changed. Indicator note deleted. Target figures provided.
For purposes of accuracy. For purposes of accuracy. To provide additional information.
Occupancy rate at lodges along newly‐developed domestic and regional
tourist routes
January 2011 Targets adjusted to read “N/A” rather than be blank when they are not applicable.
For purposes of accuracy and per MCC’s preferred practice.
Number of unique visits on NTB website
January 2011 Source for data abbreviated. For purposes of consistency.
Conversion rates on NTB website
January 2011
Baseline information changed from “TBD” to “N/A”. Source for data abbreviated.
For purposes of accuracy. For purposes of consistency.
Number of regional tourism routes
developed and marketed to public
January 2011 Source for data abbreviated. For purposes of consistency.
Number of releases of NTB website completed
January 2011 Corrected Year 2013/14 target to read “2” rather than “N/A”.
For purposes of accuracy.
Number of North American tourism businesses (travel agencies and tour
operators) that offer Namibian tours or tour
packages
January 2011 Provided targets. To provide additional information.
Conservancy Support
Median Household income in conservancies receiving MCA assistance
January 2011 Year 2009/10 target adjusted to read “N/A” rather than be blank.
For purposes of accuracy and per MCC’s preferred practice.
Share of conservancy revenue paid out in
dividends and/ or spent on community services
January 2011
Level of indicator corrected to “Outcome” from “Objective”. Frequency of data collection changed from “Annually in Year 1, 2, 3, 4, 5” to “Annually
For purposes of accuracy. For purposes of accuracy.

123 | Annex 3
Indicator Date of
Modification Details of Modification Justification
in Year 3, 4, 5”. Responsible party corrected to read “CDSS Consultant with support from NACSO” rather than “NACSO”. Indicator note added.
For purposes of accuracy. To clarify meaning of community services.
Amount of private sector investment secured cumulatively by MCA‐assisted conservancies
January 2011
Baseline year and source updated. Classification of indicator changed from “Incremental” to “Cumulative”. Targets provided.
Using the most recently available data from pre‐Compact will provide a more realistic assessment of the impact of the activity. Per pending MCC policy change to have all indicators be classified as either “Level” or “Cumulative”. To provide additional information.
Number of new Joint Venture lodges / JV campsites or tented
camps
January 2011 New indicator added. To provide additional information available from a data collection effort.
Number of new small conservancy enterprises,
including natural resources enterprises
January 2011 New indicator added. To provide additional information available from a data collection effort.
Number of new jobs in tourism created in conservancies
January 2011 New indicator added. To provide additional information available from a data collection effort.
Number of visitors per year to MCA‐assisted
conservancies January 2011
Baseline information updated. Targets updated. Indicator information updated.
For purposes of accuracy. To provide additional information. For purposes of accuracy.
Number of measures taken through MCA‐N
grants to prevent human wildlife conflict
January 2011
Baseline information updated. Targets updated. Indicator information updated.
For purposes of accuracy. To provide additional information. For purposes of accuracy.
Value of grants issued by the Conservancy Grant
Fund January 2011
Baseline information updated. Targets updated. Indicator information updated.
For purposes of accuracy. To provide additional information. For purposes of accuracy.
Number of Annual General Meetings
(AGMs) with financial reports submitted &
benefit distribution plans discussed
January 2011
Baseline information updated. Targets updated. Indicator information updated.
For purposes of accuracy. To provide additional information. For purposes of accuracy.
Conservancy Needs Assessment Completed
January 2011 Baseline information updated. For purposes of accuracy.

124 | Annex 3
Indicator Date of
Modification Details of Modification Justification
Agriculture
Multiple Activities
Value of sales of cattle slaughtered in abattoirs
in the Northern Communal Areas
January 2011
Indicator name rephrased. Indicator note added. Baseline figure corrected. Targets adjusted to read “N/A” rather than be blank when they are not applicable.
To be more appropriate. To provide details on current thinking. For purposes of accuracy. For purposes of accuracy and per MCC’s preferred practice.
Number of cattle slaughtered in abattoirs the Northern Communal
Areas
January 2011
Indicator name rephrased. Indicator definition rephrased.
To be more appropriate. For purposes of clarity and accuracy.
Livestock
Number of cattle inspections in the
previous 12 months in the NCAs by a DVS
animal health technician
January 2011
Data source abbreviated. Indicator note updated. Year 2009/10 target adjusted to read “N/A” rather than be blank.
For consistency. For purposes of accuracy. For purposes of accuracy and per MCC’s preferred practice.
Number of cattle disease diagnoses (cases) during
the last 12‐month reporting period by DVS
January 2011
Indicator name and definition rephrased. Indicator unit changed according to new phrasing. Data source abbreviated. Indicator note updated. Year 2009/10 target adjusted to read “N/A” rather than be blank.
For purposes of technical accuracy. For purposes of accuracy. For consistency. For clarity. For purposes of accuracy and per MCC’s preferred practice.
Number of cattle tagged with RFID tags
January 2011
Indicator name rephrased. Targets adjusted to read “N/A” rather than be blank when they are not applicable.
For clarity. For purposes of accuracy and per MCC’s preferred practice.
Value of signed contracts for construction for SVOs
January 2011
Targets adjusted to read “N/A” rather than “0” when they are not applicable. Target figures adjusted.
For purposes of accuracy and per MCC’s preferred practice. To provide the most up‐to‐date estimates.
Value disbursed against construction contracts
for SVOs January 2011
Targets adjusted to read “N/A” rather than “0” when they are not applicable. Target figures adjusted.
For purposes of accuracy and per MCC’s preferred practice. To provide the most up‐to‐date estimates.
Value of signed contracts for design/supervisory
services for SVOs January 2011
Targets adjusted to read “N/A” rather than “0” when they are not applicable. Target figures adjusted.
For purposes of accuracy and per MCC’s preferred practice. To provide the most up‐to‐

125 | Annex 3
Indicator Date of
Modification Details of Modification Justification
date estimates.
Value disbursed against design/supervisory contracts for SVOs
January 2011
Targets adjusted to read “N/A” rather than “0” when they are not applicable. Targets adjusted.
For purposes of accuracy and per MCC’s preferred practice. To provide the most up‐to‐date estimates.
Concept papers submitted for first round
of grant selection January 2011
Targets adjusted to read “N/A” rather than be blank when they are not applicable. Indicator note deleted.
For purposes of accuracy andper MCC’s preferred practice. No longer applicable.
Full proposals submitted for first round of grant
selection January 2011
Targets adjusted to read “N/A” rather than be blank when they are not applicable. Indicator note deleted.
For purposes of accuracy and per MCC’s preferred practice. No longer applicable.
Value of grant agreements signed under the Livestock Efficiency
Fund
January 2011
Year 2009/2010 target adjusted to read “N/A” rather than be blank. Target figures in out‐years adjusted. Indicator note deleted.
For purposes of accuracy and per MCC’s preferred practice. To provide the most up‐to‐date estimates. No longer applicable.
CBRLM
Increase in average annual household
income January 2011
Baseline year corrected from “2010” to “2010/2011”. Targets adjusted to read “N/A” rather than be blank when they are not applicable.
To be accurate. For purposes of accuracy and per MCC’s preferred practice.
Off‐take rate (from sales) January 2011
Indicator name and definition rephrased. Indicator note rephrased. Data source and responsible party corrected from “CBRLM facilitator and CBRLM survey” and “CBRLM facilitator; CBRLM survey facilitator” to read “CBRLM survey” and “CBRLM survey facilitator”, respectively..
For clarity. For clarity. For accuracy.
% of herd that are male cattle older than 5 years
January 2011
Indicator source and responsibility updated to reflected cattle condition and herd composition assessment and the related facilitator rather than the CBRLM facilitator and CBRLM survey facilitator. Indicator note rephrased. Targets adjusted to read “N/A” rather than be blank when they are not applicable.
For accuracy. For clarity. For purposes of accuracy and per MCC’s preferred practice.
Average weight of three‐ January 2011 Targets adjusted to read For purposes of accuracy and

126 | Annex 3
Indicator Date of
Modification Details of Modification Justification
year‐old cattle “N/A” rather than be blank when they are not applicable.
per MCC’s preferred practice.
Selection of RIAs Completed
January 2011
Indicator note deleted. Targets adjusted to read “N/A” rather than be blank when they are not applicable.
To remove information that no longer adds value. For purposes of accuracy and per MCC’s preferred practice.
Land Use Plan Implementation Rate/ Number of Land Use
Plans in place
January 2011
Indicator name and unit rephrased. Baseline figure set to “N/A” rather than “0”. Year 2009/10 target adjusted to read “N/A” rather than be blank, and remaining targets set to “TBD”.
Number of Land Use Plan violations
January 2011 New indicator added. To provide additional information possibly available from a data collection effort.
Number of trainers certified
January 2011
Indicator data source and responsible party corrected from “CLB Consultant” to “CBRLM facilitator”. Baseline information set to “N/A” rather than “0”, and targets adjusted to read “N/A” rather than be blank when they are not applicable.
For purposes of accuracy. For purposes of accuracy and per MCC’s preferred practice.
Number of days trainers on site at RIAs during the
previous 3 months January 2011
Indicator data source and responsible party corrected from “CLB Consultant” to “CBRLM facilitator”. Baseline information set to “N/A” rather than “0”, and targets adjusted to read “N/A” rather than be blank when they are not applicable.
For purposes of accuracy. For purposes of accuracy and per MCC’s preferred practice.
Number of Grazing Area Management
Implementation Agreements
January 2011
Indicator name and notes rephrased to reflect Grazing Area level of intervention rather than RIA. Indicator data source and responsible party corrected from “CLB Consultant” to “CBRLM facilitator”. Baseline information set to “N/A” rather than “0”, and targets adjusted to read “N/A” or “TBD”, as appropriate.
For purposes of accuracy. For purposes of accuracy. For purposes of accuracy and per MCC’s preferred practice.
Number of participating households registered in
the programme January 2011
Indicator data source and responsible party corrected from “CLB Consultant” to “CBRLM facilitator”.
For purposes of accuracy.

127 | Annex 3
Indicator Date of
Modification Details of Modification Justification
Baseline information set to “N/A” rather than “0”, and targets adjusted to read “N/A” rather than be blank when they are not applicable.
For purposes of accuracy and per MCC’s preferred practice.
# of certifications of completion of training
January 2011
Indicator data source and responsible party corrected from “CLB Consultant” to “CBRLM facilitator”. Baseline information set to “N/A” rather than “0”, and targets adjusted to read “N/A” rather than be blank when they are not applicable.
For purposes of accuracy. For purposes of accuracy and per MCC’s preferred practice.
Number of RIAs that have completed a Land
Use plan January 2011 Deleted.
Land use plans at the RIA level not applicable given the Grazing Area level of intervention.
Number of Grazing Areas that have completed a Rangeland Management
Plan
January 2011
Indicator name and notes rephrased to reflect Grazing Area level of intervention rather than RIA. Indicator data source and responsible party corrected from “CLB Consultant” to “CBRLM facilitator”. Baseline information set to “N/A” rather than “0”, and targets adjusted to read “N/A” or “TBD”, as appropriate.
For purposes of accuracy. For purposes of accuracy. For purposes of accuracy and per MCC’s preferred practice.
Number of Grazing Areas that have completed a Livestock Management
Plan
January 2011
Indicator name and notes rephrased to reflect Grazing Area level of intervention rather than RIA. Indicator data source and responsible party corrected from “CLB Consultant” to “CBRLM facilitator”. Baseline information set to “N/A” rather than “0”, and targets adjusted to read “N/A” or “TBD”, as appropriate.
For purposes of accuracy. For purposes of accuracy. For purposes of accuracy and per MCC’s preferred practice.
Number of Grazing Areas that have completed a Business Management
Plan
January 2011
Indicator name and notes rephrased to reflect Grazing Area level of intervention rather than RIA. Indicator data source and responsible party corrected from “CLB Consultant” to “CBRLM facilitator”. Baseline information set to “N/A” rather than “0”, and
For purposes of accuracy. For purposes of accuracy. For purposes of accuracy and per MCC’s preferred practice.
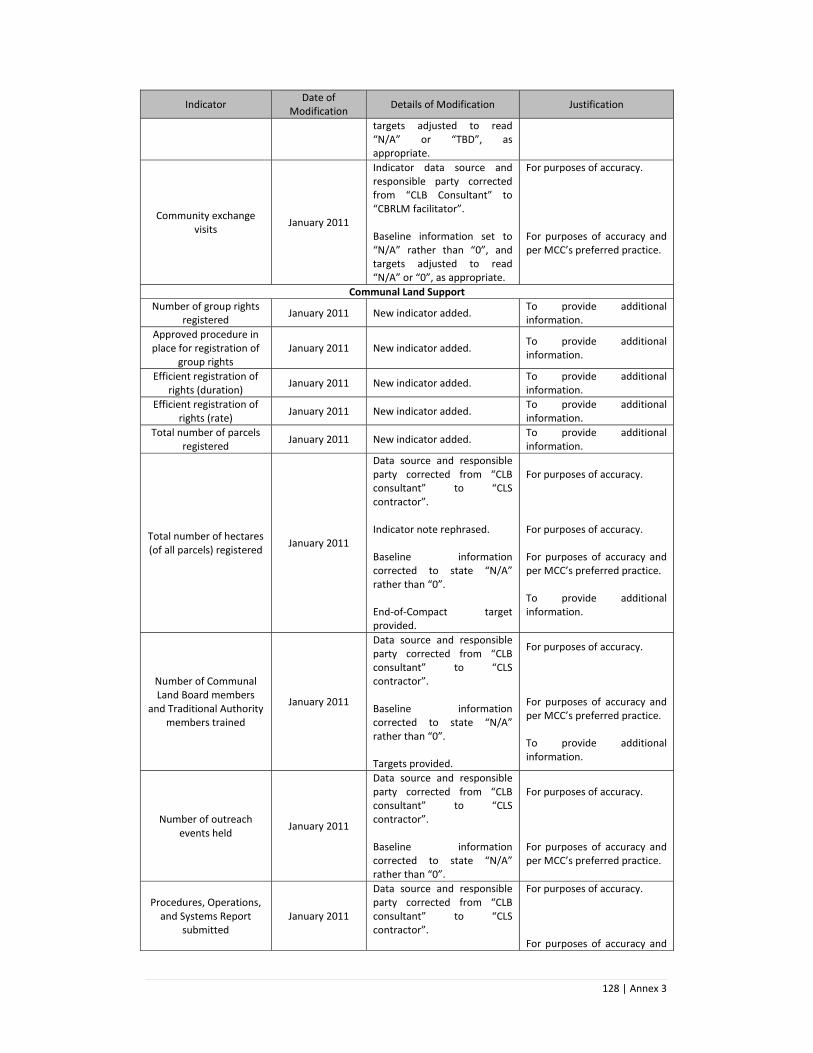
128 | Annex 3
Indicator Date of
Modification Details of Modification Justification
targets adjusted to read “N/A” or “TBD”, as appropriate.
Community exchange visits
January 2011
Indicator data source and responsible party corrected from “CLB Consultant” to “CBRLM facilitator”. Baseline information set to “N/A” rather than “0”, and targets adjusted to read “N/A” or “0”, as appropriate.
For purposes of accuracy. For purposes of accuracy and per MCC’s preferred practice.
Communal Land Support
Number of group rights registered
January 2011 New indicator added. To provide additional information.
Approved procedure in place for registration of
group rights January 2011 New indicator added.
To provide additional information.
Efficient registration of rights (duration)
January 2011 New indicator added. To provide additional information.
Efficient registration of rights (rate)
January 2011 New indicator added. To provide additional information.
Total number of parcels registered
January 2011 New indicator added. To provide additional information.
Total number of hectares (of all parcels) registered
January 2011
Data source and responsible party corrected from “CLB consultant” to “CLS contractor”. Indicator note rephrased. Baseline information corrected to state “N/A” rather than “0”. End‐of‐Compact target provided.
For purposes of accuracy. For purposes of accuracy. For purposes of accuracy and per MCC’s preferred practice. To provide additional information.
Number of Communal Land Board members
and Traditional Authority members trained
January 2011
Data source and responsible party corrected from “CLB consultant” to “CLS contractor”. Baseline information corrected to state “N/A” rather than “0”. Targets provided.
For purposes of accuracy. For purposes of accuracy and per MCC’s preferred practice. To provide additional information.
Number of outreach events held
January 2011
Data source and responsible party corrected from “CLB consultant” to “CLS contractor”. Baseline information corrected to state “N/A” rather than “0”.
For purposes of accuracy. For purposes of accuracy and per MCC’s preferred practice.
Procedures, Operations, and Systems Report
submitted January 2011
Data source and responsible party corrected from “CLB consultant” to “CLS contractor”.
For purposes of accuracy. For purposes of accuracy and

129 | Annex 3
Indicator Date of
Modification Details of Modification Justification
Targets adjusted to read “N/A” rather than be blank when they are not applicable.
per MCC’s preferred practice.
Registration Strategy and Implementation Plan
Submitted January 2011
Data source and responsible party corrected from “CLB consultant” to “CLS contractor”. Targets adjusted to read “N/A” rather than be blank when they are not applicable.
For purposes of accuracy. For purposes of accuracy and per MCC’s preferred practice.
Communal Land Support facilitator contract
awarded January 2011
Targets adjusted to read “N/A” rather than be blank when they are not applicable.
For purposes of accuracy and per MCC’s preferred practice.
Indigenous Natural Products
Income of households from INP production and
sales January 2011
Rephrase indicator data source and responsible party to reflect CS/INP survey and related facilitator. Rephrase indicator notes and unit (to 2010 constant N$). Update baseline year and source to reflect timing of CS/INP survey. Targets provided.
For purposes of accuracy. For consistency. For purposes of accuracy. To provide additional information.
Income to producers from INP sales
January 2011 New indicator added. To provide additional information available from a data collection effort.
Value‐added of INP processing
January 2011
Rephrase indicator definition and notes and update indicator source, frequency, and responsibility. Targets adjusted to read “N/A” rather than be blank when they are not applicable.
For purposes of accuracy. For purposes of accuracy and per MCC’s preferred practice.
Number of new and improved INP production
and processing technologies introduced
to processors
January 2011
Baseline information corrected to state “N/A” rather than “0”. Targets adjusted to read “N/A” rather than be blank when they are not applicable.
For purposes of accuracy and per MCC’s preferred practice. For purposes of accuracy and per MCC’s preferred practice.
INP PPO Contract Awarded
January 2011 Targets adjusted to read “N/A” rather than be blank when they are not applicable.
For purposes of accuracy and per MCC’s preferred practice.
Concept papers submitted for first round
of grant selection January 2011
Targets adjusted to read “N/A” rather than be blank when they are not applicable. End of Compact target corrected from “TBD” to reflect the relevant target date.
For purposes of accuracy and per MCC’s preferred practice. For purposes of accuracy.
Full proposals submitted for first round of grant
January 2011 Targets adjusted to read “N/A” rather than be blank
For purposes of accuracy and per MCC’s preferred practice.

130 | Annex 3
Indicator Date of
Modification Details of Modification Justification
selection when they are not applicable.
Value of grant agreements signed under the INP Innovation Fund
January 2011
Year 2009/2010 target adjusted to read “N/A” rather than be blank. Targets in out‐years adjusted.
For purposes of accuracy and per MCC’s preferred practice. To provide the most up‐to‐date estimates.
Organizational audit of IPTT completed
January 2011 Targets adjusted to read “N/A” rather than be blank when they are not applicable.
For purposes of accuracy and per MCC’s preferred practice.
Number of PPOs with signed service contract
January 2011 Targets revised. To be more realistic.
Number of INP producers selected and mobilized
January 2011 Targets revised. To be more realistic.
Value of Primary Production Improvement
Grants signed January 2011 Targets revised. To be more realistic.
Number of Primary Production Improvement
Grants awarded January 2011 Targets revised. To be more realistic.
Number of PPOs that have developed and are using a business plan
January 2011
Indicator name and definition rephrased. Indicator note added. Targets revised.
To add clarity. For purposes of clarity. To be more realistic.
Number of PPOs trained in organisational management
January 2011 Targets revised. To be more realistic.
Number of PPOs trained in business and
marketing principles January 2011 Targets revised. To be more realistic.
Number of Resource Management/Monitoring
Plans January 2011
Year 2009/10 target adjusted to read “N/A” rather than be blank.
For purposes of accuracy and per MCC’s preferred practice.
Number of PPOs certified January 2011 Targets adjusted to read “N/A” rather than be blank when they are not applicable.
For purposes of accuracy and per MCC’s preferred practice.
March 2010 In the March 2010 revision of the M&E Plan, the indicator information tables were made explicit regarding the disaggregation by gender. Certain other modifications were made for reasons laid out in the below table.
Indicator Date of
Modification
Details of Modification Justification
Education
47 Schools
Enrollment rate March 2010 Rephrased to (# of students any
level participating in 47 schools)
To give it clearer focus on
the 47 schools sub‐
activity
% of contracted
construction, works
disbursed for 47 schools
March 2010 Rephrased to (% of contracted
construction, rehabilitation and
equipotent disbursed for 47
Synchronisation with
MCC common indicators
clearer focus on
"construction,

131 | Annex 3
Indicator Date of
Modification
Details of Modification Justification
schools) rehabilitation and
equipment"
Value of signed contracts
for works for 47 schools
March 2010 Rephrased to (Value of signed
contracts for construction,
rehabilitation and equipotent for
47 schools)
Synchronisation with
MCC common indicators
clearer focus on
"construction,
rehabilitation and
equipment"
Total # of sites
completed
March 2010 Rephrased to (Educational
facilities constructed,
rehabilitated, equipped in the 47
schools sub‐activity)
Synchronization with
MCC common indicators
clearer focus on
"construction,
rehabilitation and
equipment"
Vocational Training
Employment level of
Vocational education
trainees two years after
completion of
coursework
March 2010 Deleted Old indicator lacked
clarity
% of contracted
construction works
disbursed for COSDECs)
March 2010 Rephrased to (% of contracted
construction, rehabilitation and
equipment disbursed for
COSDECs)
Synchronization with
MCC common indicators
clearer focus on
"construction,
rehabilitation and
equipment"
Value of signed contracts
for construction works
for COSDECs)
March 2010 Rephrased to (Value of signed
contracts for construction,
rehabilitation and equipment for
COSDECs)
Synchronization with
MCC common indicators
clearer focus on
"construction,
rehabilitation and
equipment"
Value of Vocational
Training Grants Awarded
through the MCA‐N
Grant Facility
March 2010 Indicator Split to separate MCA‐N
grant from NTF levy
Need to separate NTF
levy from MCA‐N grant
funding
Value of Vocational
Training Grants Awarded
through the NTF Levy
and Facility
March 2010 New indicator created by
separating MCA‐N grant facility
from NTF Levy funding
Need to separate NTF
levy from MCA‐N grant
funding
Number of Vocational
Trainees assisted through
the MCA‐N Grant Facility
March 2010 Indicator Split to separate MCA‐N
grant from NTF levy
Need to separate NTF
levy from MCA‐N grant
funding

132 | Annex 3
Indicator Date of
Modification
Details of Modification Justification
Number of Vocational
Trainees assisted through
the NTF levy
March 2010 New indicator created by
separating MCA‐N grant facility
beneficiaries from NTF Levy
funding
Need to separate NTF
levy from MCA‐N grant
funding
# of instructors Trained
and certified
March 2010 Deleted No specific focus on
instructor training in this
sub‐activity
Number of beneficiaries
from the vocational
training sub‐activity who
have graduated.
March 2010 New indicator Replaced (enrollment
rate)
Textbooks
Training of trainers in the
administration of
textbook usage and
storage training
complete
March 2010 Deleted Redundant on other
indicators already In the
plan
Regional Study Resource Centers
% of contracted
construction works
disbursed for RSRCs
March 2010 Rephrased to (% of contracted
construction and equipment
disbursed for RSRCs
Synchronization with
MCC common indicators
clearer focus on
"construction and
equipment"
Value of signed
contracts for
construction works
disbursed for RSRCs
March 2010 Rephrased to (Value of signed
contracts for construction and
equipment for RSRCs)
Synchronization with
MCC common indicators
clearer focus on
"construction and
equipment"
Tourism
# of NTB websites
completed
March 2010 End of compact target revised
downward from 4 to 2
Budgetary issue and re‐
negotiation forcing a
reduction in phases from
4 to 2
% of budgeted amount
contracted for works
March 2010 Rephrased Rephrased to allow new
definition to be
consistent with the
correct formula for
calculation purposes
Jobs created through
tourism
March 2010 changed from being "cumulative"
to a "level" type indicator
To allow comparison over
time
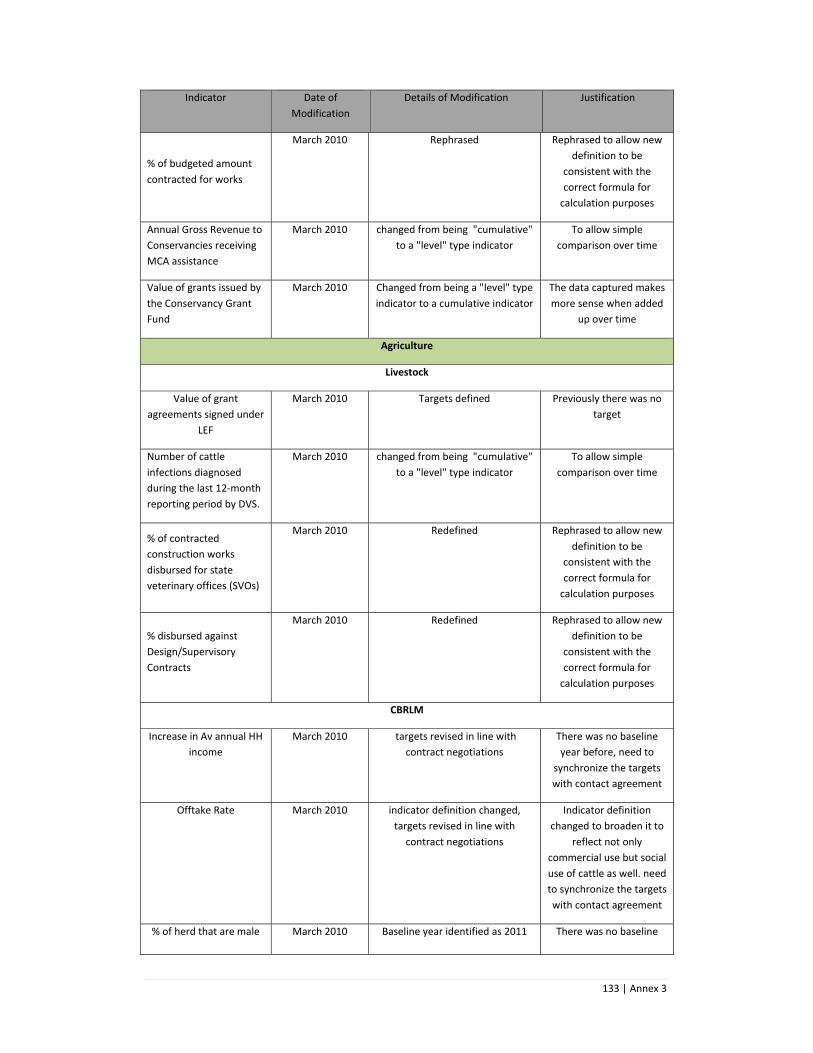
133 | Annex 3
Indicator Date of
Modification
Details of Modification Justification
% of budgeted amount
contracted for works
March 2010 Rephrased Rephrased to allow new
definition to be
consistent with the
correct formula for
calculation purposes
Annual Gross Revenue to
Conservancies receiving
MCA assistance
March 2010 changed from being "cumulative"
to a "level" type indicator
To allow simple
comparison over time
Value of grants issued by
the Conservancy Grant
Fund
March 2010 Changed from being a "level" type
indicator to a cumulative indicator
The data captured makes
more sense when added
up over time
Agriculture
Livestock
Value of grant
agreements signed under
LEF
March 2010 Targets defined Previously there was no
target
Number of cattle
infections diagnosed
during the last 12‐month
reporting period by DVS.
March 2010 changed from being "cumulative"
to a "level" type indicator
To allow simple
comparison over time
% of contracted
construction works
disbursed for state
veterinary offices (SVOs)
March 2010 Redefined Rephrased to allow new
definition to be
consistent with the
correct formula for
calculation purposes
% disbursed against
Design/Supervisory
Contracts
March 2010 Redefined Rephrased to allow new
definition to be
consistent with the
correct formula for
calculation purposes
CBRLM
Increase in Av annual HH
income
March 2010 targets revised in line with
contract negotiations
There was no baseline
year before, need to
synchronize the targets
with contact agreement
Offtake Rate March 2010 indicator definition changed,
targets revised in line with
contract negotiations
Indicator definition
changed to broaden it to
reflect not only
commercial use but social
use of cattle as well. need
to synchronize the targets
with contact agreement
% of herd that are male March 2010 Baseline year identified as 2011 There was no baseline

134 | Annex 3
Indicator Date of
Modification
Details of Modification Justification
cattle older than 5 years year before
Av weight of 3 year old
cattle
March 2010 targets revised in line with
contract negotiations
There was no baseline
year before, need to
synchronize the targets
with contact agreement
Selection of RIAs March 2010 Indicator name changed from OVS
to RIAs
Use of OVS stopped but
RIAs is the approach
Land Use Plan
Implementation Rate
March 2010 New indicator added Strengthen reporting
Number of trainers
certified
March 2010 New indicator added Strengthen reporting
Number of days trainers
on site at RIAs during the
previous 3 months
March 2010 New indicator added Strengthen reporting
Number of RIAs Land Use
Plan Implementation
Agreements
March 2010 New indicator added Strengthen reporting
Number of participating
Households registered in
the programme
March 2010 New indicator added Strengthen reporting
Number of RIAs that
have completed a Land
Use plan
March 2010 New indicator added Strengthen reporting
Number of RIAs that
have completed a
Rangeland Management
Plan
March 2010 New indicator added Strengthen reporting
Number of RIAs that
have completed a
Livestock Management
Plan
March 2010 New indicator added Strengthen reporting
Number of RIAs that
have completed a
Business Management
Plan
March 2010 New indicator added Strengthen reporting
Community exchange
visits
March 2010 New indicator added Strengthen reporting
Land Use Plan
Implementation Rate
March 2010 Revised targets Need to synchronize the
targets with contract
agreement

135 | Annex 3
Indicator Date of
Modification
Details of Modification Justification
INP
Income of households
from INP production and
Sales
March 2010 Revised targets and baseline Need to synchronize the
targets with contract
agreement
Value added of INP
production
March 2010 Revised targets and baseline Need to synchronize the
targets with contract
agreement
Number of INP producers
with signed service
contract
March 2010 New indicator added Strengthen reporting
# of registered INP
producers and harvesters
March 2010 Rephrased to (Number of INP
producers selected and mobilized)
Re‐worded to capture
not only registered
members but those who
actively participate in
production and
harvesting
# of producer and
processor groups trained
March 2010 Deleted New indicators added
that are more specific
about the different
aspects of training
Value of Primary
production improvement
Grants signed
March 2010 New indicator added Strengthen reporting by
providing a new focus on
unique aspects of the INP
sub‐activity
Number of Primary
production improvement
Grants signed
March 2010 New indicator added Strengthen reporting by
providing a new focus on
unique aspects of the INP
sub‐activity
Number of PPOs that
have adopted a business
plan
March 2010 New indicator added Strengthen reporting by
providing a new focus on
unique aspects of the INP
sub‐activity
Number of PPOs trained
in organisational
Management
March 2010 New indicator added Strengthen reporting by
providing a new focus on
unique aspects of the INP
sub‐activity
Number of PPOs trained
in business and
marketing principles
March 2010 New indicator added Strengthen reporting by
providing a new focus on
unique aspects of the INP
sub‐activity
Number of Resource
Management/Monitoring
Plans
March 2010 New indicator added Strengthen reporting by
providing a new focus on
unique aspects of the INP
sub‐activity

136 | Annex 3
Indicator Date of
Modification
Details of Modification Justification
Number of PPOs certified March 2010 New indicator added Strengthen reporting by
providing a new focus on
unique aspects of the INP
sub‐activity
Number of Female
producer and processor
group members trained
March 2010 New indicator added Needed as part of MCA‐
N's commitment to
Gender issues

1 | Annex 4
Annex 4
This annex lays out the detailed programme logic at the Compact‐wide outcome level and by each Project’s sub‐activity.
Short-, medium-, and long-term outcomes Compact goal
• Enhanced learning and cognitive development at
MCA‐N‐targeted schools• Increased access to quality vocational and skills
training
• Reduced gaps in the current provision of books,
and increased efficiency in textbook procurement
and delivery
• Increased use of information for formal
education, informal learning, business, and
research
• Expanded and improved access to tertiary finance
• Strengthen HIV/AIDS prevention and
management in the sector
• Improved management efficiency of ENP
• Increased international awareness of Namibia as
a tourist destination
• Improved management of and increased income
to communal conservancies
• Improved land tenure security and efficiency of
land tenure administration
• Increased community adoption of sustainable
rangeland management, animal husbandry, and
marketing techniques and methodologies
• Established systems for disease control,
improved livestock quality, and better market
access
• Improved production of and market access for
INPs
MCA‐N COMPACT LOGIC
Poverty reduction through economic growth
Education
Project
Tourism
Project
Note: The outcomes and goal indicators are informed by Vision 2030 and NDP3 and are in line with NDP4, and they reflect the expectation that MCA Namibia Programme will
contribute to the goals of Vision 2030. However, the MCA Namibia Programme is not of sufficient scale or scope to independently achieve these goals.
Agriculture
Project
Increased
competence of the
Namibian
workforce,
improved tourism
management and
awareness of
Namibia as a tourist
destination, and
increased
productivity of
agricultural and non‐
agricultural
enterprises in rural
areas.
Programme
ObjectiveCompact Goal
Poverty reduction through
economic growth, as
measured by the following
indicators:
• Poverty rate
• Unemployment rate
• Median household income

2 | Annex 4

3 | Annex 4

4 | Annex 4
ACTIVITY: VOCATIONAL AND SKILLS TRAINING
Activity goal: Increased access to vocational and skills training
PROCESS OUTPUT SHORT‐TERM OUTCOME MEDIUM‐TERM OUTCOME LONG‐TERM OUTCOME
Description Indicators
Trainees benefiting
from the funds
Students participating in MCC‐
supported education activities
Description Indicators Description Indicators
New collection
system in place
NTF Levy collection system
operational
New collection
system effective
Compliance rate for National
Training Fund Levy
Description Indicators
Funds collected and
used for voc ed
% of NTF levy funds collected that
are awarded for skil ls training and
related improvement of training
facil ities and equipment
Description Indicators
Trainees benefiting
from the funds
Vocational trainees assisted from
the NTF Levy
Description Indicators Description Indicators Description Indicators
Funds awarded for
high‐priority voc ed
training
Value of vocational training grants
awarded through the MCA‐N grant
facil ity
Trainees benefiting
from the funds
Vocational trainees assisted
through the MCA‐N Vocational
Training Grant Fund
NQA‐accredited and/or NTA‐
registered vocational training
providers
no voc ed enrolment indicator in
the M&E Plan (due to data quality
concerns)
Description Indicators Description Indicators Description Indicators
Trainees benefiting
from the funds
Graduates from MCC‐supported
education activities
Employed graduates of MCC‐
supported education activitiesIncreased income
Average gross monthly income
of VTGF‐supported trainees
% of trainees who secure
employment
Description Indicators Description Indicators
Value of signed contracts for
design/supervisory services for
COSDECs
COSDECs
constructed and
rehabilitated
COSDECs completed
Value disbursed against
design/supervisory contracts for
COSDECs
% disbursed against
design/supervisory contracts for
COSDECs
Description Indicators
Value of signed contracts for
construction, rehabil itation and
equipment for COSDECs
Arts and Crafts
Centres constructed
and rehabilitated
Arts and Crafts Centres completed
Value disbursed against
construction, rehabil itation and
equipment contracts for COSDECs
% disbursed against construction,
rehabil itation and equipment
contracts for COSDECs
Description Indicators Description Indicators
COSDEC
management
trained
COSDEC staff trained in
management
COSDECs better
managed
no related indicators in the M&E
Plan
Sub‐Activity:
Competitive
Grants for High
Priority
Vocational
Skills Training
Multiple
Vocational and
Skills Training
Sub‐Activities
Sub‐Activity:
Establishment
of NTF
Increased
participation in the
official voc ed
system
Better employment
prospects
Construction and
rehabilitation of
COSDECs
Sub‐Activity:
Construction
and Upgrading
of 9
Community
Skills and
Development
Centres
Sub‐Activity:
COSDECs
Management
Training

5 | Annex 4

6 | Annex 4

7 | Annex 4

8 | Annex 4
ACTIVITY: MARKETING NAMIBIA IN TOURISM
Activity goal: Increased international awareness of Namibia as a tourist destination
PROCESS OUTPUT SHORT‐TERM OUTCOME MEDIUM‐TERM OUTCOME LONG‐TERM OUTCOME
Description Indicators Description Indicators Description Indicators
Investment in
improved
marketing of
Namibia as a tourist
destination
no related indicators in the M&E
Plan
Exposure of
Namibia as a tourist
destination
North American tourism
businesses that offer Namibian
tours or tour packages
Leisure tourist arrivals from the
North American market
Tourist arrivals from the North
American market
Description Indicators Description Indicators
Namibian tourism
industry capacitated
in business
marketing
Namibian travel trade business
persons trained
Increased
effectiveness of
Namibian travel
trade businesses'
marketing
no related indicators in the M&E
Plan
Description Indicators Description Indicators
Tourist routes
developed and
marketed
Domestic and regional tourist
routes developed and marketed to
the public
Increased number
of tourists visiting
the routes
no related indicators in the M&E
Plan
Description Indicators Description Indicators
NTB website
establishedReleases of NTB website completed
Increased visits to
the NTB websiteUnique visits on NTB website
Description Indicators Description Indicators
Increased North
American visits to
the NTB website
Unique visits on NTB website from
the North American market
Average time spent on the NTB
website
Registered users of the NTB website
Sub‐Activity:
Destination
Marketing
North America
Sub‐Activity:
Regional and
Communal
Sub‐Activity:
Interactive
Website
(includes NTB
Website and
Online
Marketing)
Improved user
experience on the
website
Increased number
of North American
tourists to Namibia

9 | Annex 4

10 | Annex 4

11 | Annex 4

12 | Annex 4

1 | Annex 5
Annex 5
A map of the MCA‐N intervention areas can be found on the next page.

19
//Karas//Karas
HardapHardap
KuneneKunene
ErongoErongo
OmahekeOmaheke
OtjozondjupaOtjozondjupa
KavangoKavango
KhomasKhomas
OshikotoOshikotoOmusatiOmusati
ZambeziZambezi
OshanaOshana
OhangwenaOhangwena
23 22
7
1
6
17
9
5
13
3
10
11
4
8
2
14
1631
20
18
21
12
29
30Rundu
Ngoma
Wenela
Muhembo
Ruacana Omahenene Oshikango
Ariamsvlei
Oranjemund
Noordoewer
Velloorsdrif
Klein Menase
Dobe (Tsumkwe)
Sendelingsdrift
Buitepos/ Mamuno
Velverdiend / Mata Mata
Olifantsrus
Ombika GateGalton Gate
King Nehale Gate
Von Lindquist Gate
l
lV
XVVl
Xl
ll
lV
Vlllll
XlV
V
XXX
XVll
XlV
Xll
Vlll
Xll
XVlll
XVl
Etosha National Park
MCA-N Intervention
Areas
Zoomed in View 3
na Omahenene Oshikango
Ombika Gate
Galton Gate
King Nehale Gate
Von
Olifantsrus
l
lV
Vll
lll
Vl
ll V
XlV
XVlll
XX
XV
Omusati Region
Oshikoto Region
Kunene Region
Oshana Region
Ohangwena Region
Otjozondjupa Region
Etosha National Park
XVll
XV
Zoomed in View 4
Zoomed in View 2
Zoomed in View 5
24
25
26
2827
31
29
30
31
Ngoma
Wenela
Zoomed in View 1
TOURISM
Improving Etosha Management and Infrastructure
POVERTY RATE BY REGION (%)
AGRICULTURE
Communal Land Support
Livestock Support
Community Based Rangelandand Livestock Management
Indigenous Natural Products (Supported PPO's)
Conservancy Development Support Services
Marketing Namibia in Tourism
EDUCATION
Quality of General Education
Vocational and Skills Training
Regional Study and Resource Centres
l Ongandjera Community Fore Xl Kapinga Kamwalye East
ll Oshiku Shithilonde East Xll Ambrosius Haingura
lll Uukwaluudhi North Xll Satotwa
lV Okaulukwa XlV Ombazu
V King Nehale XV Ombombo-Masitu
Vl Onkumbula XVl Otjombande
Vll Epembe XVll Orupupa
Vlll Kahenge XVlll Ehirovipuka
lV Kaguni West XlV Ehirovipuka
X George Mukoya XX Otjindjeresse