millennium energy llc - nrel · millennium energy llc i brightfield ... the use of solar power can...
TRANSCRIPT
MILLENNIUM ENERGY LLC26596 Columbine Glen Avenue
Golden, CO 80401(303) 526-2972
www.millennium-energy.net
FINAL REPORT
Technical and Economic Feasibility AssessmentOf a
Brightfield Photovoltaic Power Plant at Miramar Landfill
Submitted to:National Renewable Energy Laboratory
1617 Cole BoulevardGolden, CO 80401
Prepared under:Task Ordering Agreement # KDC-0-30470-00
Task Order # KADC-0-30470-01With the National Renewable Energy Laboratory
Submitted by:Millennium Energy LLC
26596 Columbine Glen Ave.Golden, CO 80401
(303) [email protected]
www.millennium-energy.net
February, 2001
*this report was generated with renewable energy from solar and wind resources
NREL/BK-710-30478

Millennium Energy LLC i Brightfield Feasibility AssessmentFebruary, 2001 NREL Task Ordering Agreement # KDC-0-30470-00
EXECUTIVE SUMMARY
The Brightfields Initiative: An OverviewA Brightfield is a solar power station (photovoltaic panels connected in arrays to generate electricity) that isplaced onto a Brownfield1 site for the dual purpose of power generation and electricity reliability. ABrightfield is most effective at producing electricity when Californians need it most – during hot sunny dayswhen the use of electricity peaks. A Brightfield can be installed quickly (6 – 8 months construction time), cangenerate immediate power that will not fluctuate in price, and can provide relief to the energy system duringpeak demand periods, such as those being experienced in San Diego. A Brightfield will provide San Diegocitizens with the opportunity to generate environmentally benign electricity and maintain local control overenergy revenues (instead of exporting these funds to non-CA energy providers). As the City is both an ownerand renter of many Brownfield sites throughout San Diego, the City has an opportunity to transform theseproperties into innovative, environmentally benign, and economically viable power generating assets for theenergy-stressed residents of San Diego.
Brightfields Opportunities for San DiegoBrightfield electricity can be sold for a price of approximately 16 cents per kilowatt-hour (kWh), whenincluding all potential economic incentives and buy-downs. This price will achieve payback periods rangingfrom ten to twenty years, depending upon which Brightfield option examined by this study is selected.Current retail prices of electricity supplied to the San Diego region are between eighteen and twenty-twocents per kWh. The power exchange rate (wholesale cost of power) average from July to December 2000 wasfourteen cents per kWh; this average rate was nine cents per kWh for the full year of 2000.2 In partnershipwith the City of San Diego’s Department of Environmental Services, the U.S. Department of Energy hasundertaken a detailed technology and economic feasibility study to determine the viability of developing up toa one megawatt (MW) Brightfield at the City of San Diego Landfill site located adjacent to the Marine CorpsAir Station-Miramar.3 The placement of solar arrays on landfills within San Diego City limits can convertthese sites from non-revenue generating City property into a revenue and electricity-generating asset for theCity of San Diego. In addition, with expected continued shortfalls in electricity generation supplies likely, aBrightfield could be a cost-effective means of enhancing electricity reliability and reducing electricity pricevolatility while meeting Clean Air requirements. This study has determined that a Brightfield can be aneconomically viable option for power production.
1 A brownfield is an abandoned, contaminated, or underutilized property that has an active potential for reuse; these include landfill sites.2 http://www.sdge.com/EIC/html/loss_factors. htm3 System size may utilize 6.5 acres per 1MW of Crystalline Silicon photovoltaics versus 13 acres per 1 MW of Amorphous or Thin-film photovoltaics.
Monthly SDG&E Region PX vs. Retail Prices
0.00
0.05
0.10
0.15
0.20
0.25
0.30
Dec-99 Jan-00 Feb-00 Mar-00 Apr-00 May-00 Jun-00 Jul-00 Aug-00 Sep-00 Oct-00 Nov-00Month
$/kW
hr
Monthly PX Prices Monthly Retail Prices
San Diego Zonal Energy Prices and PV ProductionJune 2000
0.000.100.200.300.400.500.600.700.800.901.00
1 2 3 4 5 6 7 8 9 10 11 12 13 14 15 16 17 18 19 20 21 22 23 24Hour
Hourly Average ($/kWhr) Peak Day ($/kWhr) PV System Production (MWhr)
PV Production
Hourly Avg. Price

Millennium Energy LLC ii Brightfield Feasibility AssessmentFebruary, 2001 NREL Task Ordering Agreement # KDC-0-30470-00
San Diego’s Energy ContextCalifornia experienced 78 electricity alerts during a six-month period from July to December 2000 4, withalerts occurring daily in January of 2001. Wholesale electricity price spikes during the summer of 2000 wereas high as 75 cents/kWh, wholesale prices since June 2000 have averaged more than 14 cents/kWh andaveraged 26 cents/kWh in January of 2001. San Diego is clearly facing a need for increased electricity supply,and this can be partially achieved through increased power generation from solar energy. As the population inthe San Diego region is projected to increase by more than one million residents by 2020, additional powersupplies will clearly be needed. The use of solar power can generate zero-emissions electricity and can helpthe City to bypass many of the environmental hurdles that currently block the development of new powerplants, such as the costs of meeting environmental compliance requirements due to the region’s continuedproblems in meeting State and Federal air quality standards. In addition, a solar powered Brightfield canprovide a fixed electricity cost; with volatile electricity prices on the upward swing, solar generation can alsoprovide an economic backstop against peak power electricity spikes.
Analysis of San Diego Brightfields OptionsThe following information indicates that solar-electric generation is competitive when compared with someelectricity prices charged by San Diego Gas and Electric.5 Investment in a solar-electric system necessitates ahigh capital cost which, when financed with a fixed interest rate, becomes a fixed annual cost over the financeperiod. When the savings are compared to volatile energy prices, the overall solar-electric system economicsbecome difficult to predict. An analysis of the current San Diego energy context versus contemplatedBrightfields options is included in the Brightfields feasibility assessment for the Miramar Landfill. Results aredescribed in the sections below.
Possible Federal Incentives and State Buy-downs• CERRA (State/CEC): CA Emerging Renewables Resource Account maintains a $1,000,000 limit per
individual project with a limit of $500,000 from any single block of buy-down funds.6
• Note on CERRA: There are decreasing incentives and buy-down benefits for systems sized greater than500 kW (see graph). Thus, two separate 500 kWsystems (1 MW total) will garner $2 million in totalincentives/buy-down versus $1 million ofincentives/buy-down for a one MW plant (see graph).
• AB 970 (State/CEC): peak load reduction grantprogram offering $250/kW.
• AQ (Regional): air-quality management district creditoffers 0.28 cents/kWh.
• REPI (Federal): Renewable Energy ProductionIncentive offers 1.8 cents/kWh for electricityproduced by system. This incentive is available toany political subdivision of a State (i.e. publicutilities / City Landfill operations) that owns oroperates a qualified renewable energy facility that generates electricity; sale must affect interstatecommerce.
4 45 stage one alerts: < 7% of electricity reserves available for use; 32 stage two alerts: <5% of electricity reserves available for use; 1 stage three alert:<1.5% of electricity reserves available for use. http://www.caiso.com.5 Emergency legislation enacted in August 2000 forced current consumer energy unit cost payments to lower than pre-summer 2000 levels.Responsibility for repayment of the resultant $9 billion debt accumulated during this period has not yet been determined.6 Guidelines are available at http://www.energy. ca.gov/renewables/documents/500-97-011V3. PDF
California Emerging Technology Buy-Down as a Function of System Size
012345
100
200
300
400
500
600
700
800
900
1000
Solar-Electric System Size (kW)
$/W
att Installed Cost for City
Sys. Size & Effect of Buy-Down
Millennium Energy LLC iii Brightfield Feasibility AssessmentFebruary, 2001 NREL Task Ordering Agreement # KDC-0-30470-00
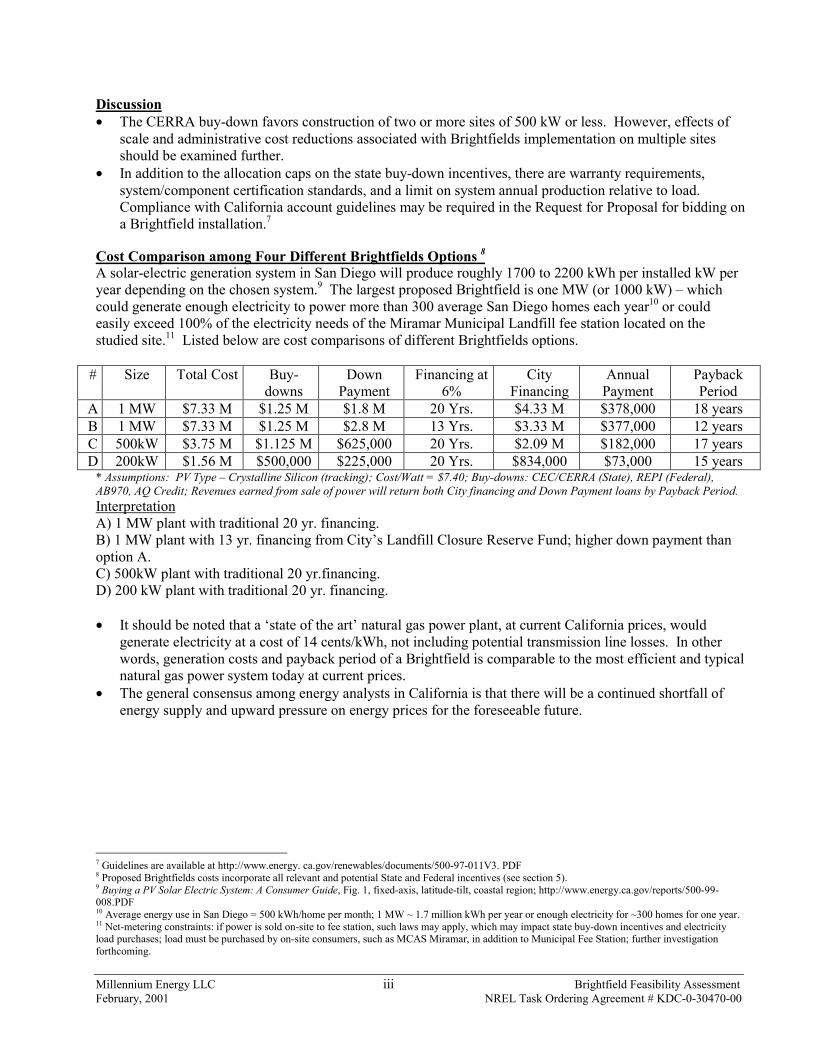
Discussion• The CERRA buy-down favors construction of two or more sites of 500 kW or less. However, effects of
scale and administrative cost reductions associated with Brightfields implementation on multiple sitesshould be examined further.
• In addition to the allocation caps on the state buy-down incentives, there are warranty requirements,system/component certification standards, and a limit on system annual production relative to load.Compliance with California account guidelines may be required in the Request for Proposal for bidding ona Brightfield installation.7
Cost Comparison among Four Different Brightfields Options 8A solar-electric generation system in San Diego will produce roughly 1700 to 2200 kWh per installed kW peryear depending on the chosen system.9 The largest proposed Brightfield is one MW (or 1000 kW) – whichcould generate enough electricity to power more than 300 average San Diego homes each year10 or couldeasily exceed 100% of the electricity needs of the Miramar Municipal Landfill fee station located on thestudied site.11 Listed below are cost comparisons of different Brightfields options.
# Size Total Cost Buy-downs
DownPayment
Financing at6%
CityFinancing
AnnualPayment
PaybackPeriod
A 1 MW $7.33 M $1.25 M $1.8 M 20 Yrs. $4.33 M $378,000 18 yearsB 1 MW $7.33 M $1.25 M $2.8 M 13 Yrs. $3.33 M $377,000 12 yearsC 500kW $3.75 M $1.125 M $625,000 20 Yrs. $2.09 M $182,000 17 yearsD 200kW $1.56 M $500,000 $225,000 20 Yrs. $834,000 $73,000 15 years
* Assumptions: PV Type – Crystalline Silicon (tracking); Cost/Watt = $7.40; Buy-downs: CEC/CERRA (State), REPI (Federal),AB970, AQ Credit; Revenues earned from sale of power will return both City financing and Down Payment loans by Payback Period.InterpretationA) 1 MW plant with traditional 20 yr. financing.B) 1 MW plant with 13 yr. financing from City’s Landfill Closure Reserve Fund; higher down payment thanoption A.C) 500kW plant with traditional 20 yr.financing.D) 200 kW plant with traditional 20 yr. financing.
• It should be noted that a ‘state of the art’ natural gas power plant, at current California prices, wouldgenerate electricity at a cost of 14 cents/kWh, not including potential transmission line losses. In otherwords, generation costs and payback period of a Brightfield is comparable to the most efficient and typicalnatural gas power system today at current prices.
• The general consensus among energy analysts in California is that there will be a continued shortfall ofenergy supply and upward pressure on energy prices for the foreseeable future.
7 Guidelines are available at http://www.energy. ca.gov/renewables/documents/500-97-011V3. PDF8 Proposed Brightfields costs incorporate all relevant and potential State and Federal incentives (see section 5).9 Buying a PV Solar Electric System: A Consumer Guide, Fig. 1, fixed-axis, latitude-tilt, coastal region; http://www.energy.ca.gov/reports/500-99-008.PDF10 Average energy use in San Diego = 500 kWh/home per month; 1 MW ~ 1.7 million kWh per year or enough electricity for ~300 homes for one year.11 Net-metering constraints: if power is sold on-site to fee station, such laws may apply, which may impact state buy-down incentives and electricityload purchases; load must be purchased by on-site consumers, such as MCAS Miramar, in addition to Municipal Fee Station; further investigationforthcoming.

Millennium Energy LLC iv Brightfield Feasibility AssessmentFebruary, 2001 NREL Task Ordering Agreement # KDC-0-30470-00
Table of Contents
EXECUTIVE SUMMARY .................................................................................................................................................i
1 INTRODUCTION ......................................................................................................................................................1
1.1 THE SAN DIEGO ENERGY SITUATION ....................................................................................................................11.2 THE BENEFITS OF PV POWER IN THE SAN DIEGO REGION.....................................................................................2
2 TECHNICAL ANALYSIS.........................................................................................................................................2
2.1 SYSTEM SITING REQUIREMENTS............................................................................................................................32.1.1 Site Options...................................................................................................................................................32.1.2 Utility Grid Connection Proximity and Requirements..................................................................................32.1.3 Land Requirements for 1 MW Photovoltaic Power Plant.............................................................................42.1.4 Minimum Support Structure Requirements...................................................................................................42.1.5 Limitations of Physical Installation on a Military Site .................................................................................5
2.1.5.1 Reflectivity of PV Panels ........................................................................................................................................... 52.1.5.2 Jet Vibration and PV Performance............................................................................................................................. 52.1.5.3 Jet Fuel Buildup and PV Performance ....................................................................................................................... 62.1.5.4 PV Power Production and EMF................................................................................................................................. 6
2.2 PRELIMINARY SYSTEM DESIGN .............................................................................................................................62.3 PV SYSTEM OPTIMIZATION ...................................................................................................................................7
3 ECONOMIC ANALYSIS ..........................................................................................................................................8
3.1 PROJECT COSTS .....................................................................................................................................................83.2 "BASE CASE" ECONOMIC ANALYSIS .....................................................................................................................9
3.2.1 "Base Case" Economic Analysis Methodology.............................................................................................93.2.2 Results of "Base Case" Economic Analyses................................................................................................10
3.3 ECONOMIC INCENTIVES.......................................................................................................................................123.3.1 California Energy Commission "Emerging Renewables Buy-Down Program" .........................................123.3.2 CEC Peak Load Reduction Grant Program ...............................................................................................133.3.3 Customer Credit..........................................................................................................................................143.3.4 Federal Renewable Energy Production Incentive Program.......................................................................143.3.5 San Diego Regional Air Quality Management District Air Quality Credit Trading Program ...................143.3.6 Empowerment Zone Tax Credits.................................................................................................................153.3.7 Brownfield Economic Incentives.................................................................................................................15
3.3.7.1 Supplemental Environmental Projects (SEP). .......................................................................................................... 153.3.7.2 General Obligation (GO) Bonds. ............................................................................................................................. 153.3.7.3 EPA Brownfields Showcase Communities. ............................................................................................................. 15
3.4 "BEST CASE" ECONOMIC ANALYSES...................................................................................................................163.4.1 Results of "Best Case" Economic Analyses.................................................................................................163.4.2 Alternative Finance and Funding Scenarios ..............................................................................................18
4 ECONOMIC VALUE AND VALUE-ADDED BENEFITS..................................................................................19
4.1 ON-SITE ENERGY CONSUMPTION/SALES.............................................................................................................194.1.1 Miramar Landfill Fee Station .....................................................................................................................194.1.2 Marine Corps Air Station - Miramar Purchases from a PV Plant at the Miramar Landfill.......................194.1.3 PV Power as a Peak Load Reduction Strategy ...........................................................................................194.1.4 PV Power Sales Strategies..........................................................................................................................204.1.5 Additional Value Added Benefits ................................................................................................................21
5 CONCLUSIONS AND RECOMMENDATIONS..................................................................................................21
5.1 CONCLUSIONS .....................................................................................................................................................215.2 RECOMMENDATIONS ...........................................................................................................................................225.3 SIGNIFICANT FOLLOW-UP STEPS..........................................................................................................................22

Millennium Energy LLC v Brightfield Feasibility AssessmentFebruary, 2001 NREL Task Ordering Agreement # KDC-0-30470-00
APPENDIX A: PV SYSTEM DESIGN SPECIFICATIONS AND ASSOCIATED COMPONENT COSTSAPPENDIX B: PRELIMINARY SYSTEM DESIGN SCHEMATICSAPPENDIX C: ECONOMIC ANALYSIS SPREADSHEETS FOR BASE CASE SCENARIO OF PV SYSTEM OPTIONS UTILIZING THE13-YEAR FINANCING MECHANISMAPPENDIX D: ECONOMIC ANALYSIS SPREADSHEETS FOR BASE CASE SCENARIO OF PV SYSTEM OPTIONS UTILIZING THE20-YEAR FINANCING MECHANISMAPPENDIX E: ECONOMIC ANALYSIS SPREADSHEETS FOR BEST CASE SCENARIO OF PV SYSTEM OPTIONS UTILIZING THE13-YEAR FINANCING MECHANISMAPPENDIX F: ECONOMIC ANALYSIS SPREADSHEETS FOR BEST CASE SCENARIO OF PV SYSTEM OPTIONS UTILIZING THE
20-YEAR FINANCING MECHANISMAPPENDIX G: ECONOMIC ANALYSIS SPREADSHEETS FOR BEST CASE SCENARIO OF PV SYSTEM OPTIONS UTILIZING THE10-YEAR FINANCING AND DIRECT PURCHASE OPTIONS
SUPPLEMENTAL APPENDIX: ECONOMIC ANALYSIS SPREADSHEETS FOR SAN DIEGO BRIGHTFIELD BASE CASE ANDBEST CASE SCENARIOS OF 500 KW PV SYSTEM OPTIONS UTILIZING THE 13-YEAR AND 20-YEAR FINANCINGMECHANISMS AND POWER SALES VALUATIONS OF $0.19 AND $0.22 PER KWH
PROPOSAL APPLICATION: FOR CITY OF SAN DIEGO'S PROPOSED BRIGHTFIELD PROJECTSOLAR POWER PLANT AT MIRAMAR LANDFILL
Millennium Energy LLC 1 Brightfield Feasibility AssessmentFebruary, 2001 NREL Task Ordering Agreement # KDC-0-30470-00
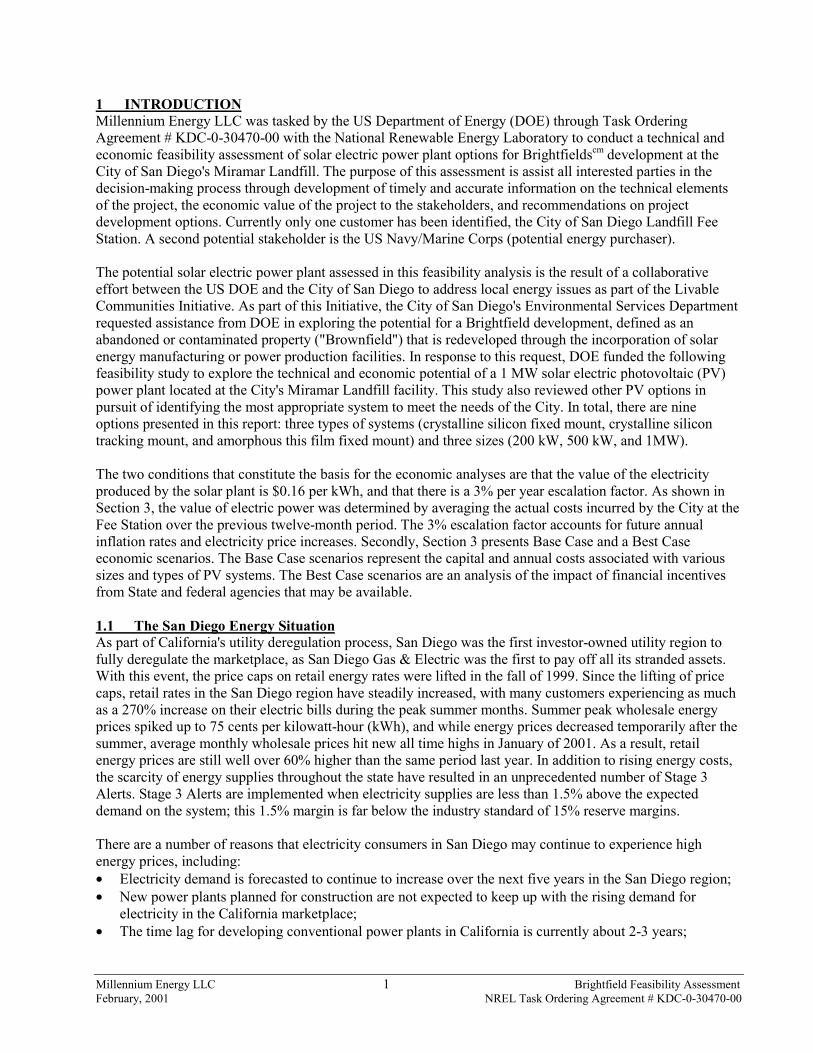
1 INTRODUCTIONMillennium Energy LLC was tasked by the US Department of Energy (DOE) through Task OrderingAgreement # KDC-0-30470-00 with the National Renewable Energy Laboratory to conduct a technical andeconomic feasibility assessment of solar electric power plant options for Brightfieldscm development at theCity of San Diego's Miramar Landfill. The purpose of this assessment is assist all interested parties in thedecision-making process through development of timely and accurate information on the technical elementsof the project, the economic value of the project to the stakeholders, and recommendations on projectdevelopment options. Currently only one customer has been identified, the City of San Diego Landfill FeeStation. A second potential stakeholder is the US Navy/Marine Corps (potential energy purchaser).
The potential solar electric power plant assessed in this feasibility analysis is the result of a collaborativeeffort between the US DOE and the City of San Diego to address local energy issues as part of the LivableCommunities Initiative. As part of this Initiative, the City of San Diego's Environmental Services Departmentrequested assistance from DOE in exploring the potential for a Brightfield development, defined as anabandoned or contaminated property ("Brownfield") that is redeveloped through the incorporation of solarenergy manufacturing or power production facilities. In response to this request, DOE funded the followingfeasibility study to explore the technical and economic potential of a 1 MW solar electric photovoltaic (PV)power plant located at the City's Miramar Landfill facility. This study also reviewed other PV options inpursuit of identifying the most appropriate system to meet the needs of the City. In total, there are nineoptions presented in this report: three types of systems (crystalline silicon fixed mount, crystalline silicontracking mount, and amorphous this film fixed mount) and three sizes (200 kW, 500 kW, and 1MW).
The two conditions that constitute the basis for the economic analyses are that the value of the electricityproduced by the solar plant is $0.16 per kWh, and that there is a 3% per year escalation factor. As shown inSection 3, the value of electric power was determined by averaging the actual costs incurred by the City at theFee Station over the previous twelve-month period. The 3% escalation factor accounts for future annualinflation rates and electricity price increases. Secondly, Section 3 presents Base Case and a Best Caseeconomic scenarios. The Base Case scenarios represent the capital and annual costs associated with varioussizes and types of PV systems. The Best Case scenarios are an analysis of the impact of financial incentivesfrom State and federal agencies that may be available.
1.1 The San Diego Energy SituationAs part of California's utility deregulation process, San Diego was the first investor-owned utility region tofully deregulate the marketplace, as San Diego Gas & Electric was the first to pay off all its stranded assets.With this event, the price caps on retail energy rates were lifted in the fall of 1999. Since the lifting of pricecaps, retail rates in the San Diego region have steadily increased, with many customers experiencing as muchas a 270% increase on their electric bills during the peak summer months. Summer peak wholesale energyprices spiked up to 75 cents per kilowatt-hour (kWh), and while energy prices decreased temporarily after thesummer, average monthly wholesale prices hit new all time highs in January of 2001. As a result, retailenergy prices are still well over 60% higher than the same period last year. In addition to rising energy costs,the scarcity of energy supplies throughout the state have resulted in an unprecedented number of Stage 3Alerts. Stage 3 Alerts are implemented when electricity supplies are less than 1.5% above the expecteddemand on the system; this 1.5% margin is far below the industry standard of 15% reserve margins.
There are a number of reasons that electricity consumers in San Diego may continue to experience highenergy prices, including:• Electricity demand is forecasted to continue to increase over the next five years in the San Diego region;• New power plants planned for construction are not expected to keep up with the rising demand for
electricity in the California marketplace;• The time lag for developing conventional power plants in California is currently about 2-3 years;

Millennium Energy LLC 2 Brightfield Feasibility AssessmentFebruary, 2001 NREL Task Ordering Agreement # KDC-0-30470-00
• The region is served by a single natural gas pipeline that is near capacity and is also experiencing highcommodity costs - thus reducing the likelihood of constructing natural gas peaking plants in the region;
• Nationwide, commodity prices for natural gas continue to increase as demand outstrips supply;• There are only two transmission lines that connect San Diego to regional and statewide transmission
lines, thus increasing the likelihood of a "bottleneck" in the transmission system which can constrain theamount of energy imported into the region; and
• There are few available generation sites located near SDG&E transmission lines within the county;• Restrictions on air pollution emissions in the San Diego air basin restrict the potential for developing new
conventional power plants in the basin.The use of distributed energy resources, such as photovoltaics, can provide a partial solution to theseconcerns.
1.2 The Benefits of PV Power in the San Diego RegionThe graphs illustrated below demonstrate the economic drivers behind the benefits of PV power. The firstgraph on the left indicates the wholesale price of power in the San Diego Region Power Exchange (PX), andthe corresponding retail price of power as calculated from SDG&E's General Service "A" Rate Schedule. Thisgraph indicates the steady increase in energy prices and price volatility since the lifting of the price cap in theSan Diego region; prices have risen steadily since May of 2000, leveled off in early winter, and have reachednew highs in January of 2001. The number of Stage 3 Alerts in January was unprecedented, and occurredduring a period that was expected to ease the burden of higher prices and scarce energy supplies associatedwith the on-going energy crisis.
Further illustrating the price volatility experienced in the region, the graph on the right illustrates the averagehourly energy price in June 2000, contrasted with the hourly price of power on the peak day of the samemonth. During this peak day, energy prices at the PX reached the 75 cent per kilowatt-hour level during eightof the on-peak hours. This graph also indicates the projected energy output of a PV power plant (crystallinesilicon array with tracking system) in the San Diego region on this same peak day in June. It should be notedthat the energy output from a PV plant is "fixed price", and the value of this fixed price energy in today'smarketplace is conservatively estimated at 16 cents per kWh. As can be seen, the energy output of a PV plantis highly coincident with the highest hourly energy prices of the month; thus confirming the "fit" of solarresources as part of an effective peak shaving strategy for the San Diego region.
2 TECHNICAL ANALYSISThe following sections detail the technical components of the proposed PV power plant at Miramar Landfilland include the system siting requirements, system optimization characteristics, and preliminary designconsiderations.
Monthly SDG&E Region PX vs. Retail Prices
0.00
0.05
0.10
0.15
0.20
0.25
0.30
0.35
Jan-00
Feb-00
Mar-00
Apr-00
May-00
Jun-00
Jul-00
Aug-00
Sep-00
Oct-00
Nov-00
Dec-00
Jan-01
Month
$/kW
hr
Monthly PX Prices Monthly Retail Prices
San Diego Zonal Energy Prices and PV ProductionJune 2000
0.00
0.10
0.20
0.30
0.40
0.50
0.60
0.70
0.80
0.90
1.00
1 2 3 4 5 6 7 8 9 10 11 12 13 14 15 16 17 18 19 20 21 22 23 24Hour
Hourly Average ($/kWhr) Peak Day ($/kWhr) PV System Production (MWhr)

Millennium Energy LLC 3 Brightfield Feasibility AssessmentFebruary, 2001 NREL Task Ordering Agreement # KDC-0-30470-00
2.1 System Siting Requirements2.1.1 Site OptionsThe Miramar Landfill site is an ideal location for photovoltaic power generation, as the San Diego region hasexcellent solar insolation levels in general, and the inland Miramar site has better insolation levels than localcoastal areas that are more prone to foggy conditions that reduce PV module efficiencies. Each of the siteoptions evaluated at the Miramar Landfill has excellent solar access, with no obstructions from buildings,trees, hills, or other barriers. Thus, maximum solar gain can be had during all of the plants operating hours. Inaddition, the Brightfield concept is one of only a few plausible options for development at the landfill site.Two site options were considered for the placement of the proposed PV system. Site One is located in closeproximity to an existing cogeneration plant and Site Two is at the Fee Station.
SITE ONE: Initial efforts under the system siting analysis focused on the development of a 1 MW PV plantapproximately 1500 feet south of the cogeneration plant at the City's Sludge Dewatering Plant. While this siteis desirable due to its location adjacent to the cogeneration plant and grid tie-in point, and the high degree ofvisibility from Highway 52, follow-up analyses indicated that this site might not be optimal. This is due to thefact that the utility tie-in voltage is 4160 Volts AC (VAC), while the PV system's optimal tie in voltage is 480VAC. While the power from the PV plant could be "stepped up" to meet these high voltage requirements, itwould add considerably to the capital cost of the project. In addition, contractual arrangements to integratewith the cogeneration plant operations may be: 1) complex due to the existing contractual arrangements theCity has with a third party re-seller of power from the cogeneration plant, 2) difficult to negotiate, and 3) timeconsuming. Furthermore, the City would not receive any cost saving benefits from the solar power plant atthis site. This is due to the fact that the City currently receives free energy for some of the site operations andpays a low price for energy for the plant operations; this energy is provided by the on-site cogeneration plantas part of the City's contractual arrangement with a third party re-seller. However, this site remains an optionif the potential contractual hurdles and high voltage issues can be overcome.
SITE TWO: Based on further analyses of the site characteristics at the Miramar landfill, it was determinedthat an alternative site for a PV power plant is a site adjacent to the Fee Station at the northern end of thelandfill. This site appears to be a more favorable option as there is an available load to serve (albeit a smallone that would consume about 2 1/2% of annual output of a 1 MW PV plant), and the tie-in voltage to thedistribution system at this site is believed to be 480 VAC (this needs to be confirmed with SDG&E, but 480VAC is the most common voltage used on single phase distribution lines). This is the optimal tie-in voltagefor the proposed solar plant. In addition, the Fee Station currently purchases power from Sempra Energy. Areview of the electric bills for this account shows an increase in monthly average energy charges fromapproximately 10 cents/kWh in May to 26 cents/kWh in August, while estimates for the site's January billindicate energy charges near 30 cents/kWh. Based on the prevailing market conditions of the twelve-monthperiod from January through December of 2000, it is estimated that the Fee Station will continue to incur anannual average energy cost of 16 cents/kWh in the future. Again, this is a conservative estimate based on theprevious twelve-month period, which includes five months of "pre-crisis" energy prices of 10 cents/kWh orless. Analyses conducted for this site indicate that the PV array can be sited near the Fee Station, and maypotentially provide cost-effective power to the site on a year-to-year basis.
2.1.2 Utility Grid Connection Proximity and RequirementsSites One and Two are in close proximity (2000 feet or less) to potential utility tie-in points. Regardless of thesite selected, an engineering feasibility study will be required by San Diego Gas & Electric to determineinterconnection requirements and line load capacity. Any power generation facility constructed at MiramarLandfill will be required to meet SDG&E's standard interconnection requirements (i.e., IEEE, UL, anti-islanding, and over/under frequency and voltage specifications) to tie-in to its transmission and distributionsystem. In addition, SDG&E will need to conduct analyses of each of the potential tie-in points to determineif the transmission or distribution line can accommodate the addition of up to 1 MW of capacity on these linesfrom the PV plant. At the completion of its study, SDG&E will provide the City with tie-in and hook-up

Millennium Energy LLC 4 Brightfield Feasibility AssessmentFebruary, 2001 NREL Task Ordering Agreement # KDC-0-30470-00
requirements and fees, detailed interconnection requirements, and the hourly availability and cost of reservingcapacity on the line. SDG&E charges a nominal fee of approximately $800 for each study. It is recommendedthat the City immediately proceed with the SDG&E studies for each of the proposed site options as soon asthe system design parameters are finalized. A copy of the interconnection application form andinterconnection requirements is available from SDG&E.
It should also be noted that the system designs developed for this feasibility study utilized listed componentsaccepted by the California Energy Commission (CEC). The modules, inverters for grid-tie, and balance ofsystem components specified in this study will satisfy the interconnection requirements by nature of theirlisting on CEC approved product list.
2.1.3 Land Requirements for 1 MW Photovoltaic Power PlantAs part of the site assessment for a 1 MW photovoltaic power plant at Miramar Landfill, Millennium Energycalculated the land requirements for the three system types under consideration. The three system types,which are described in detail later in this report, include:• 1 MW of crystalline silicon modules on a stationary fixed axis mount; and• 1 MW of crystalline silicon modules on a horizontal axis tracking mount; and• 1 MW of amorphous silicon ("thin film") modules on a stationary fixed axis mount.
Based on the system designs developed for this potential project, a 1 MW crystalline silicon array wouldrequire approximately 6.5 acres of available land, and 1 MW thin film array would require about 13 acres ofavailable land. There is no appreciable difference in land requirements between a fixed tilt stationary mountarray and a horizontal single axis tracking system. In addition to the 1 MW option, Millennium Energy alsoconsidered alternative system sizes of 500 kW and 200 kW. The acreage requirements for all system typesand sizes considered by this feasibility study are summarized in the table below.
Crystalline Silicon Crystalline Silicon Amorphous Thin Film Fixed Mount Tracking Mount Fixed Mount
PV System Option PV System Acreage Requirements1 megawatt 6.5 6.5 13
500 kilowatts 3.25 3.25 6.5200 kilowatts 1.3 1.3 2.6
Regardless of the system size or type selected, it does not appear that land space requirements are a constraintto project development. However, this assumes that the Marine Corps Air Station - Miramar (MCAS-MIRAMAR) Committee for Land and Airspace Management Policy (CLAMP) approves the City'sapplication for use of the land for PV power production, and that all other environmental and operatingpermits required for plant construction and operation are secured.
2.1.4 Minimum Support Structure RequirementsIndependent of the system type selected (stationary fixed axis or tracking) it will require a mounting supportstructure. Mounting structures are typically made of steel, and are designed to meet parameters allowing for90 mph 3-second gust and 50 year design wind speeds. Installation of the mounting structure will requireminor excavation into the landfill cap. However, the base of the mounting structure only needs to be buriedapproximately 2-4 feet below ground, which may be shallower than the final cap depth. Prior to finalizing thePV plant site, the City should determine the cap depth at the specific site to ensure that the mounting structuredoes not penetrate the landfill cap. Minimal disturbance to the existing landfill site would occur as a result ofsite preparation and installation activities, and would be limited to minor grading and minor excavationassociated with setting the mounting structure. Landfill sites have limited options for development, primarily

Millennium Energy LLC 5 Brightfield Feasibility AssessmentFebruary, 2001 NREL Task Ordering Agreement # KDC-0-30470-00
due to concerns of soil settlement. Since settlement defines the very nature of landfills, further investigationsshould be undertaken to determine impacts on the system and ongoing maintenance requirements.
Alternatives to steel support structures include modules that can be placed directly on the ground with a matbacking; however, significant reduction of peak power output would be experienced with ground-placedmodules (hence diminishing project economics). In addition, there may be issues associated with dirt build upfrom heavy rain and run off (further degrading module performance), and impacts on landfill maintenance.
2.1.5 Limitations of Physical Installation on a Military SiteThe City of San Diego's Miramar Landfill is located on property leased from the U.S. Department of Navy.There is approximately 45 years remaining on the lease. As such, MCAS-Miramar has identified severalpotential limitations to the construction of a PV plant at this site, and Millennium Energy was requested toaddress these potential issues as part of this feasibility study. These potential concerns include:• The reflectivity of PV modules, which may interfere with flight operations at the neighboring MCAS-
Miramar;• Vibrations from jets at the Air Station interfering with PV system performance;• Jet fuel build up on modules degrading module performance; and• Electro-magnetic fields (EMF) generated from PV plant operations.Each of these concerns is addressed in the following sections.
2.1.5.1 Reflectivity of PV PanelsMillennium Energy confirmed that recent studies indicate that PV panel reflectivity does not pose any threatto pilot visibility. A recent study conducted by the Smithsonian Institute for the Dulles Airport Air and SpaceMuseum on-site PV installation concluded that reflectivity of PV panels is a non-issue for air traffic. Toillustrate this point, Millennium Energy staff took aerial photos (see below) of a small PV array from thesame altitude and angle as highly reflective objects (such as galvanized steel roofs) in the same area. Whilenot definitive by scientific standards, the results do indicate that PV panels pose no threat to visibility, whileconcerns over reflectivity are much greater from other materials such as steel roofs, auto glass, and buildingglazing.
Aerial View of PV Arrays Aerial View of Galvanized Roofs
2.1.5.2 Jet Vibration and PV PerformancePotential concerns have been raised with respect to the impact that vibrations from jets taking off and landingat the neighboring MCAS-Miramar may have a negative impact on PV system performance. MillenniumEnergy contacted a number of experts from industry and the National Renewable Energy Laboratory staff and

Millennium Energy LLC 6 Brightfield Feasibility AssessmentFebruary, 2001 NREL Task Ordering Agreement # KDC-0-30470-00
inquired on this potential issue. Each of the individuals contacted confirmed that vibrations from jet enginesdo not have any impact on PV system performance.
2.1.5.3 Jet Fuel Buildup and PV PerformanceSome concerns have been raised with respect to build up of jet fuel on the PV modules and its impact onmodule performance. Jet fuel and other foreign substances do have a negative impact on PV moduleperformance, and this impact can be significant in terms of reducing module efficiencies. However, it is notknown if, or to what extent, this is an issue at the Miramar Landfill site. Therefore, it is recommended that theCity place a plate of glass or other similar substrate flat on the ground at each of the site options andperiodically examine the glass to determine if jet fuel and/or other foreign substances are accumulating at thesite -- and if so, to what extent.
2.1.5.4 PV Power Production and EMFElectro-magnetic fields, or EMF, result from the electricity generation from any source or transmission ofelectricity along power lines. The concern over EMF is not whether it exists, but rather the specific levels thatare generated. The levels of EMF generated by the proposed PV plant will be insignificant and pose no harmto human health or environment. The additional loads from the output of the PV plant on the transmission anddistribution lines existing at the Miramar Landfill will be minimal compared to the loads currently carried bythese lines, and these do not pose any EMF issues.
2.2 Preliminary System DesignAs one of the first steps in conducting the feasibility study for the PV power plant at the Miramar Landfill,Millennium Energy developed preliminary system designs for three system options. These options had thefollowing general characteristics:• Crystalline silicon modules on a stationary fixed axis mount; and• Crystalline silicon modules on a horizontal axis tracking mount; and• Amorphous silicon ("thin film") modules on a stationary fixed axis mount.
All of the equipment used in developing the system design was based on CEC approved modules andinverters. The only exception to this was the specification of the Trace Technologies 100 kW line-tiedinverter, which is expected to be on the CEC approved product list by the spring of 2001. In addition to thethree system types, Millennium Energy also developed design specifications for three system sizes (1 MW,500 kW, and 200 kW) corresponding to the three system types. A complete listing of the systemspecifications for the 1 MW, 500 kW and 200 kW system size options is provided in Appendix A.
Each of the system types and sizes was designed to optimize performance for annual energy output (i.e.,modules facing due south) and to maximize reliability. For example, in designing the 1 MW system it wasdetermined that ten x 100 kW arrays would increase the reliability of the system. If any one array should fail,the system would still be operating at 90% capacity. With respect to the module types specified in the systemdesign, it should be noted that trade-offs do exist between thin film and crystalline silicon modules including:• thin film modules cost considerably less (~$3.00/watt) than crystalline silicon modules (~$4.00/watt);• thin film modules typically carry a warranty of 10 years and an expected life of 20 years, while crystalline
silicon modules typically carry a warranty of 20-25 years and an expected life of 30 years;• thin film modules require two times the array surface area for the same level of power output of
crystalline silicon modules, and as such require additional hardware and mounting equipment which addsto the cost of the system; and
• thin film modules do not lend themselves to be used in conjunction with a tracking system, as they aremore fragile, and require additional mounting hardware. This would not be preferred on a dynamicsurface such as a landfill.

Millennium Energy LLC 7 Brightfield Feasibility AssessmentFebruary, 2001 NREL Task Ordering Agreement # KDC-0-30470-00
There are also trade-offs that exist between the use of fixed mount and tracking mount structures. Trackingmount structures, which tilt the modules at a constant angle to maximize the efficiency of the modules, canincrease system output of the same module types by up to 18%. The trade-off is that tracking mounts are moreexpensive, but recent advances in the technology have reduced this incremental cost to about 2% above afixed mount structure.
To illustrate the design of the various systems analyzed by this feasibility study, a number of preliminarydesign schematics were developed for the 1 MW plant options (including sub-array schematics), and havebeen included in this study with permission from Shingleton Engineering. These schematics, which areprovided in Appendix B, include:• 1 MW crystalline silicon array with tracking mount site plan and system schematic;• 1 MW crystalline silicon array with tracking mount detailed system schematic;• 115 kW crystalline array with tracking mount sub-array detailed system schematic;• 311 kW crystalline silicon sub-array with tracking mount/fixed mount detailed module schematics;• 298 kW crystalline silicon sub-array with tracking mount/fixed mount panel schematics;• 288 kW amorphous sub-array with tracking mount/fixed mount detailed system schematics;• Aerial view schematic of 110 kW crystalline silicon sub-array with fixed mount;• Sub-grade view schematic of 110 kW crystalline silicon sub-array with fixed mount;• Front view of 110 kW crystalline silicon sub-array with fixed mount schematic;• Aerial view schematic of 1 MW crystalline silicon array with tracking mount system; and• Detailed schematic of tracking mount assembly.
2.3 PV System OptimizationOnce the three PV system designs were developed for the 1 MW, 500 kW, and 200 kW options, MillenniumEnergy modeled the output of each PV system and size option. Millennium Energy utilized the Maui SolarSoftware package for optimizing the design and modeling the annual energy output. The table below providesthe results of these modeling scenarios. In addition, this table presents an energy equivalent in terms of homesserved by the output of each PV system and size option, based on the annual average energy consumption ofhomes in the San Diego region (6,700 kWh/year).
Crystalline Silicon Crystalline Silicon Amorphous Thin Film Fixed Mount Tracking Mount Fixed Mount
PV System Option Annual Energy Output (kWh/yr.)1 megawatt 1,903,050 2,241,576 1,644,958
500 kilowatts 929,632 1,093,952 810,982200 kilowatts 368,664 433,535 321,043
"Energy Equivalent" Represented as # of Homes Served1 megawatt 284 335 246
500 kilowatts 139 163 121200 kilowatts 55 65 48
In addition to modeling the annual energy output of each of the system types and sizes, Millennium alsomodeled the monthly energy output of each system type and size. The following graph illustrates the monthlyenergy output of the nine PV system options modeled for this study. As can be seen from this graph, thecrystalline silicon module options provide more energy on a monthly basis than the amorphous option, andthe crystalline silicon modules with tracking system option clearly maximizes the performance of the modulesover the fixed mount option.

Millennium Energy LLC 8 Brightfield Feasibility AssessmentFebruary, 2001 NREL Task Ordering Agreement # KDC-0-30470-00
3 ECONOMIC ANALYSISUpon completion of the system design and technical analysis of the various PV system options for theMiramar Landfill site, Millennium Energy conducted an economic analysis of each system option. The resultsof these analyses are presented in the following sections. Section 3.1 details the capital and operating costrequirements of each PV system option, Section 3.2 details the economic analyses of these "base case"scenarios of each PV system option, Section 3.3 examines the potential economic incentives available toassist in reducing capital and operating costs, and Section 3.4 details the economic analyses of the "best case"scenarios incorporating readily available economic incentives.
3.1 Project CostsAs a first step in developing detailed cost estimates of each PV plant option, Millennium Energy developedcost estimates for each of the system components independent of industry input. These system costcomponents include:• PV modules;• PV module mounting hardware;• Line-tie inverters;• Balance of system components (i.e., hardware, wiring, disconnects, metering and NEC required
components);• Shipping;• Site preparation and installation; and• Plant commissioning.
Monthly Energy Output of PV System Options
0
50,000
100,000
150,000
200,000
250,000
JAN FEB MAR APR MAY JUN JUL AUG SEP OCT NOV DEC
Month
kilo
Wat
t-hou
rs
1 MW Crystalline Silicon Tracking 1 MW Crystalline Silicon Fixed 1 MW Amorphous Fixed500 kW Crystalline Silicon Tracking 500 kW Crystalline Silicon Fixed 500 kW Amorphous Fixed200 kW Crystalline Silicon Tracking 200 kW Crystalline Silicon Fixed 200 kW Amorphous Fixed

Millennium Energy LLC 9 Brightfield Feasibility AssessmentFebruary, 2001 NREL Task Ordering Agreement # KDC-0-30470-00
As a second step, Millennium solicited cost estimates for these same components from PV systemmanufacturers and integrators. The resulting system capital cost estimates internally developed byMillennium and externally solicited from industry were directly in line with each other. The individual systemcomponent costs for each of the nine system options analyzed are provided in Appendix A. It should be notedthat these costs do not include permitting, insurance, or annual utility hook-up fees. The estimated systemcapital costs for each option analyzed is presented in the table below.
System Capital Cost ($) Crystalline Silicon Crystalline Silicon Amorphous Thin Film
PV System Option Fixed Mount Tracking Mount Fixed Mount1 megawatt $7,184,000 $7,334,000 $5,622,000
500 kilowatts $3,672,000 $3,747,000 $2,903,000200 kilowatts $1,529,000 $1,559,000 $1,221,000
In addition to the estimated system capital costs, annual operations and maintenance (O&M) costs werecalculated for each system option at the rate of $0.005/kWh. Annual O&M includes periodic system testingand analysis, cleaning of modules, and other routine O&M functions.
3.2 "Base Case" Economic AnalysisIn evaluating the economics of the PV system options for the Miramar Landfill, a net present value analysiswas conducted for the "base case" scenario for each PV system type and size. The "base case" scenario wasdefined by the project costs detailed in section 3.1, and the project benefits accruing from the sales of plantenergy or displacement of utility energy purchases. The "base case" scenario does not include the benefits ofany economic incentives. Available economic incentives are evaluated under the "best case" scenario detailedin section 3.4.
3.2.1 "Base Case" Economic Analysis MethodologyIn conducting these "base case" analyses, the net present value of the project benefits was derived through thesummation of the projected annual revenues from energy generated by the plant over its expected thirty yearlife. These revenues were calculated based upon an assumption that the value of the energy generated in thebase year of operations was equal to 16 cents/kWh (i.e., the commodity price of energy sold from the plant, orthe cost of utility provided energy displaced from the on-site PV plant, is equal to 16 cents per kWh). Thisvalue was calculated based on prevailing market conditions in the San Diego region from January throughDecember 2000. The SDG&E General Service "A" rate tariff was used as a proxy for this assessment. Thisassumption for the value of power generated is a conservative estimate based on a mix of high and lowmonthly average energy prices during this period ranging from a low of under 10 cents/kWh to a high of over26 cents/kWh. It should be noted that as recently as January of 2001, average monthly retail energy priceshave reached nearly 30 cents/kWh. After the base year, a 3% per year energy price escalator was included inthe analysis to account for future energy price increases and inflation. These annual revenues were thendiscounted by the appropriate discount rate tied to the financing option, and then summed over the thirty-yearperiod.
Similarly, the net present value of the project costs was derived through the summation of the PV plant's fixedand annual costs over the thirty period. These costs include the down payment, annual financing payments,and annual O&M expenditures ($0.005/kWh/year). It should be noted that the O&M expenditures have beencalculated based on the O&M requirements for the PV system components only. Actual O&M costs may behigher due to the additional engineering costs associated with maintaining a PV system on top of the dynamicsurfaces common to landfills. The first step in calculating these costs was to determine the annual financingpayment. This was accomplished by matching the projected annual revenues to an annual payment such thatthe annual finance payment and O&M expenditures do not exceed the annual revenues, thereby maintaining

Millennium Energy LLC 10 Brightfield Feasibility AssessmentFebruary, 2001 NREL Task Ordering Agreement # KDC-0-30470-00
positive or neutral cash flow for the project over the finance period. After this iterative process resulted in theannual payment, the principle amount of the loan was determined based on the interest rate of the financeoption. The principle loan amount was then subtracted from the system capital cost to determine the downpayment of the system. Finally, the down payment, and the annual project costs were discounted by theappropriate discount rate, again tied to the financing option, and summed over the thirty- year period.
The net present value methodology detailed above was replicated for each system option with one exception.Since amorphous thin film modules have an expected life of twenty years (compared to the thirty yearexpected life of crystalline silicon modules), the amorphous PV system options were evaluated over thetwenty-year period, as opposed to the thirty-year period for crystalline silicon modules.
In conducting the base case economic analyses, two financing options were modeled for each PV system typeand size. The City proposes to finance the project internally, and has two financing options available. The firstoption is to utilize Landfill Closure Reserve Fund monies. To utilize the Landfill Closure Reserve Fundoption, the loan must be paid back within 13 years, thus defining the finance period. The annual interest rateon these funds is 6.0%. Since there is no opportunity cost associated with these funds the discount rate iseffectively zero; this zero value was assumed for the discount rate under this financing option. The secondfinancing option available to the City includes a 20-year financing term, 6% interest rate, and a discount rateof 4.5%.
Finally, once the net present cost and benefits were analyzed for each of the financing options, calculationswere performed to determine the overall net present value of the PV plant, the cost of generation, the benefit-to-cost ratio and the payback period. These calculations were performed for each of nine PV system optionsconsidered by this study. The methodologies for calculating these economic values are:• Net Present Value of PV System = Net Present Value of Benefits - Net Present Value of Costs• Cost of Generation = Net Present Cost of PV System / Total kWh Generated Over the Life of the System• Benefit-to-Cost Ratio = Net Present Benefit of PV System / Net Present Cost of PV System• Payback Period = The period of time required for the project benefits to equal the project costs
(determined by a cash flow analysis)
Documentation of all the analyses and calculations conducted for the base case scenarios are provided inAppendices C and D of this report.
3.2.2 Results of "Base Case" Economic AnalysesBased on the methodology detailed in Section 3.2.1, economic analyses were conducted for all nine PVsystem options considered by this study. In addition, all nine of these of these options were analyzed based onthe two financing options currently available to the City. The results of these calculations are presented in thetwo tables below. The first table presents the economic analysis results for the nine PV system options underthe 13-year financing mechanism, and the second table presents the economic results of these same systemsunder the 20-year financing mechanism.

Millennium Energy LLC 11 Brightfield Feasibility AssessmentFebruary, 2001 NREL Task Ordering Agreement # KDC-0-30470-00
Base Case Economic Analysis Results - 13 Year Financing OptionDown Payment Net Present Value Generation Cost Benefit/Cost Ratio Payback Period
PV System Option Requirement ($/kWh) (years)1 megawatt
Crystalline Silicon (Tracking) $4,350,000 $7,919,843 $0.136 1.87 16Crystalline Silicon (Fixed) $4,600,000 $5,804,790 $0.152 1.67 18Amorphous Silicon (Fixed) $3,400,000 $243,488 $0.208 1.04 16
500 kilowattsCrystalline Silicon (Tracking) $2,350,000 $3,628,740 $0.143 1.77 17Crystalline Silicon (Fixed) $2,400,000 $2,668,408 $0.158 1.61 18Amorphous Silicon (Fixed) $1,800,000 ($14,783) $0.216 0.99 17
200 kilowattsCrystalline Silicon (Tracking) $1,000,000 $1,413,896 $0.145 1.75 17Crystalline Silicon (Fixed) $1,050,000 $997,344 $0.164 1.55 19Amorphous Silicon (Fixed) $1,800,000 ($70,000) $0.226 0.95 18
Base Case Economic Analysis Results - 20 Year Financing OptionDown Payment Net Present Value Generation Cost Benefit/Cost Ratio Payback Period
PV System Option Requirement ($/kWh) (years)1 megawatt
Crystalline Silicon (Tracking) $3,400,000 $312,937 $0.120 1.04 25Crystalline Silicon (Fixed) $3,850,000 ($652,975) $0.136 0.92 30Amorphous Silicon (Fixed) $2,750,000 ($1,708,656) $0.186 0.72 20+
500 kilowattsCrystalline Silicon (Tracking) $1,900,000 ($79,698) $0.128 0.98 27Crystalline Silicon (Fixed) $2,050,000 ($475,844) $0.142 0.88 30+Amorphous Silicon (Fixed) $1,500,000 ($971,943) $0.194 0.69 20+
200 kilowattsCrystalline Silicon (Tracking) $800,000 ($68,815) $0.130 0.96 28Crystalline Silicon (Fixed) $900,000 ($259,589) $0.149 0.84 30+Amorphous Silicon (Fixed) $700,000 ($451,933) $0.204 0.66 20+
A number of observations can be made with respect to the above results. First, there is a significant differencein project economics between the 13-year and 20-year financing options. Due to the fact that the LandfillClosure Reserve Fund option needs to be repaid in thirteen years, the down payment requirements aresignificantly higher, as less principle can be financed over the shorter period. This results in lower interestpayments over the finance period, and therefore enhanced project economics for the 13-year finance option.This is the most significant difference between the two finance options, and can be summarized as the trade-off between the higher down payment requirement and lower interest payments over the term of the 13-yearfinance option versus the lower down payment and higher interest payments over the term of the 20-yearfinance option. In addition, the zero value used for the discount rate also improves the economics of the 13-year finance option.
A few additional observations can be made regarding the net present value and benefit-to-cost ratios of the PVsystem options. First, prudent economic guidance dictates that no projects should be considered with anegative net present value and/or a benefit-to-cost ratio of less than 1.0. Not surprisingly, all the PV optionswith negative net present values also have a benefit-to-cost ratio of less than 1.0. This guidance eliminates all

Millennium Energy LLC 12 Brightfield Feasibility AssessmentFebruary, 2001 NREL Task Ordering Agreement # KDC-0-30470-00
but one of the PV system options under the 20-year finance mechanism (1 MW crystalline silicon withtracking mount), and the two smaller (200 kW/500 kW) amorphous systems under the 13-year option.Of the remaining systems, all have favorable (albeit not optimal) economic valuations, and pass the economicscreening criteria for project feasibility. It should be noted however, that the payback periods of all the PVsystem options analyzed exceed their respective finance period. This means that while the loan may be paidoff in year 13 or 20, depending on the finance option, project revenues will continue to be required to paydown the initial down payment. Once the specified payback year has been reached, then the system will befully paid for, and positive cash flow will result for the remaining life of the system.
Based on the above economic results, a number of PV system options result in positive economic valuations.It is apparent from these "base case" economic valuation results that the most favorable system type is thecrystalline silicon with tracking mount system, followed by the crystalline silicon with fixed mount system,with the amorphous system providing marginally positive economic valuations in only one case. The PVsystems which pass the initial economic screening criteria under this base case, in descending order ofeconomic value are:• 1 MW Crystalline Silicon (Tracking) w/ 13-year financing;• 500 kW Crystalline Silicon (Tracking) w/ 13-year financing;• 200 kW Crystalline Silicon (Tracking) w/ 13-year financing;• 1 MW Crystalline Silicon (Fixed) w/ 13-year financing;• 500 kW Crystalline Silicon (Fixed) w/ 13-year financing;• 200 kW Crystalline Silicon (Fixed) w/ 13-year financing;• 1 MW Crystalline Silicon (Tracking) w/ 20-year financing; and• 1 MW Amorphous (Fixed) w/ 13-year financing.
While these PV system options do provide positive economic benefits to the City under the "base case"scenario, there are a number of economic incentives and hardware buy-down monies available to enhancethese project economics. These incentives and buy-down mechanisms are described in the following section.
3.3 Economic IncentivesThe following sections detail the economic incentives available to increase the economic potential of theproposed PV system options. It should be noted that the availability and applicability of these incentivesvaries, and therefore a range of financial impacts is presented.
3.3.1 California Energy Commission "Emerging Renewables Buy-Down Program"The California Energy Commission currently has in place an "Emerging Renewables Buy Down Program"program whereby system costs are reimbursed at the rate of $2.50 per watt for the first 200 kW and then$2.00/Watt for the next 250 kW for a total of 450 kW, with a $1 million dollar cap on the one-time payment.If the City opted to build one of the smaller plant options (i.e., 200 kW or 500 kW) and increase the systemsize at a later date, only the initial PV plant would be eligible for this cash rebate. Based on discussions withthe CEC, the City of San Diego would be eligible for this system discount. However, there are a number ofrequirements that must be met in order to receive the buy-down monies. These requirements include:• The system's electricity production may not exceed 125% of the site's historical/current electricity needs;• The PV system installer/integrator must provide a minimum full five-year system warranty;• A licensed contractor must install the system on the premises; and• The PV system components (i.e., modules, inverters, and balance of system components) must be
comprised of products specified in the CEC's approved product list.
The one requirement that stands out with respect to obtaining these funds is that the system's energyproduction may not exceed 125% of the site's historic or current electricity needs. For example, should the PVplant be sited near the Fee Station, this account would utilize only about 2.5% of the annual energy output of

Millennium Energy LLC 13 Brightfield Feasibility AssessmentFebruary, 2001 NREL Task Ordering Agreement # KDC-0-30470-00
a 1 MW PV plant - far less than the buy-down program requirements stipulate. Therefore, in order to accessthese monies, the City will need to identify additional on-site loads that could utilize this power. Based onconversations with CEC staff, the definition of an on-site load is one that is on the same property. SinceMCAS-Miramar is on the same property as the Miramar Landfill, this entity could assist in meeting the on-site consumption requirements of the program if they were to purchase some of the output of the PV plant.One issue that still needs to be clarified, however, is whether the MCAS-Miramar site still qualifies as an on-site load if the power has to be "wheeled" over transmission and/or distribution lines to reach the site. None ofthe potential PV plant sites are directly interconnected with MCAS-Miramar. A summary of the economics ofMCAS-Miramar purchases from the proposed plant is detailed later in this feasibility.
Since the buy-down has a tiered rebate structure, the greatest economic impact from these monies will be onthe 200 kW option ($2.50/W rebate), followed by the 500 kW option ($2.50/W rebate for this first 200 kWand $2.00/W for next 200 kW). Since the rebates are capped at $1 million for 450 kW, the benefits of this $1million rebate will spread over any increased system sizes. For example, the $1 million rebate applied to a 1MW system would result in an effective rebate level of $1/W. In evaluating the economic impacts on the PVsystem options studied, the following economic incentive total were applied towards the total system cost:• 200 kW: $500,000• 500 kW: $1,000,000• 1 MW: $1,000,000
It is recommended that full compliance with all program guidelines be required as part of any Request forProposal developed to for system components and installation of the proposed PV system; full programguidelines are available at - http://www.energy.ca.gov/renewables/documents/500-97-011V3.PDF.
3.3.2 CEC Peak Load Reduction Grant ProgramIn addition to the CEC Emerging Renewables Buydown Program, the CEC also recently implemented a PeakLoad Reduction Grant Program that provides funding to support renewable energy projects that reduce peakloads in California. This program provides an incentive of $250/kW for new generation, and the facility mustbe operational by June 1, 2001. One of the advantages of PV plants is that they can be constructed andoperational with significantly shorter lead times than most other generation sources, possibly six to eightmonths or less, once all permitting and site approvals are completed. Applications to this program were dueon December 14, 2000. For renewable energy resources, such as PV, the minimum system size required toqualify for the grant is 500 kW.
One of the few restrictions on this grant funding is that the project must receive no other CEC grant orcontract funds with one exception. A renewable energy project may receive “buydown funding” from theEmerging Renewables Buydown Program. However, the project shall not have received approval forbuydown funding by the date that the AB 970 grant proposal is submitted. If a project is approved to receivefunding from both programs, in no case may the total funding from both sources exceed the total project cost.
While the City did not apply for this CEC grant, recent conversations with CEC staff indicate that a newround of grant solicitations, with similar funding levels, will be issued in summer of 2001. Since it is believedthat the proposed PV plant will qualify for this grant, the funding levels have been included in the economicanalysis of PV system options. The following grant amounts were applied towards the total system cost in theeconomic analyses completed for this project:• 200 kW: $0• 500 kW: $125,000• 1 MW: $250,000

Millennium Energy LLC 14 Brightfield Feasibility AssessmentFebruary, 2001 NREL Task Ordering Agreement # KDC-0-30470-00
It is recommended that the City monitor this grant program over the coming months, review the awards fromthe first round, and apply for grant funds in the summer of 2001 if it is believed that the implementationschedule tied to the grant funds can be met.
3.3.3 Customer CreditThe California Energy Commission has a program that provides "Customer Credits" to consumers whopurchase eligible Energy Commission-registered renewable power. Through this program, customers’electricity bill can be credited up to 1.0 cent for each kilowatt-hour of renewable electricity they consume.Payments to some customers have a ceiling of $1,000 per year per customer for the entire year. Some electricservice providers (ESPs) may reflect the value of the credit in their pricing scheme, while others may use thecredit to give customers a monthly bonus.
Companies that want to be eligible for CEC's "Customer Credits" for renewable energy must be registered bythe CEC and offer renewable power that meets CEC eligibility criteria. To be eligible for the CustomerCredits, the renewable electricity purchased must be produced within California and must not be utilityowned. A city within an investor-owned utility’s service territory can register to become an energy serviceprovider and then sell the electricity to customers who can receive the customer credit, or can sell the powerdirectly to a registered energy service provider who could then pass on the credit to their customers.
However, Assembly Bill 995 states that in 2002, public entities can no longer receive the customer credit forrenewable energy purchases. Since the City or MCAS-Miramar can not receive the "Customer Credits" after2001 for renewable energy purchases, these credits were not factored into the economic analysesincorporating economic incentives. Should the City sell the output of the PV plant to non-public entities, thesecredits can be applied thereby reducing the commodity cost by 1.0 cents per kWh.
3.3.4 Federal Renewable Energy Production Incentive ProgramAt the Federal level, the US DOE offers economic incentives via its Renewable Energy Production IncentiveProgram. The program currently offers a production credit of 1.8 cents per kWh. The program is structured intiers, and Tier 1 incentives are available for photovoltaic, wind, and closed loop biomass systems.Historically, all applicants for Tier 1 incentives have been fully funded. While these funds are subject toannual budget appropriations, the program is authorized through the year 2013. The payments are authorizedannually based on the prior year's energy production levels, and the incentive levels escalate annually basedon a formula tied to annual inflation rates. The City would be eligible to apply for these funds in December2001 for the prior year's energy production (through September 30, 2001), and then annually for each yearthat funds are appropriated. In conducting the economic analyses incorporating the impacts of incentives, theREPI credits were valued at 1.8 cents/kWh during the base year. An escalation factor of ~3% was added toeach subsequent year of plant operations over the expected thirteen year life of the REPI program. The 3%escalation factor was calculated based on historic escalation factors, which are tied to national inflationincreases, applied to the program over the past five years.
3.3.5 San Diego Regional Air Quality Management District Air Quality Credit Trading ProgramThe San Diego Regional Air Quality Management District (AQMD) manages an air quality credit tradingprogram to provide incentives for the reduction of NOx levels in the region. Based on current valuations ofthese incentives, approximately $0.0028 per kWh may be obtained as a result of the environmental benefitsaccrued through production of clean photovoltaic based power. For the purposes of this analysis the $0.0028cents per kWh represents a 50% discount to the full value of the credit, as it is likely that the power is notdisplacing electric generation within the AQMD region. The 0.0028 cents per kWh value was used in theeconomic analyses of the system incorporating all available economic incentives.

Millennium Energy LLC 15 Brightfield Feasibility AssessmentFebruary, 2001 NREL Task Ordering Agreement # KDC-0-30470-00
3.3.6 Empowerment Zone Tax CreditsThis feasibility study is only examining site options at the Miramar landfill, which is not in a designatedenterprise or empowerment zone; therefore, there are no tax credit or incentives available.
3.3.7 Brownfield Economic IncentivesThe following sections detail economic incentives that are available to Brownfield applications. None of theseeconomic incentives were included in the economic analyses of PV system options incorporating incentives,due to the fact that a municipal landfill does not meet the specific criteria of a Brownfield. However, if thedefinition is expanded, the City should consider applying for some of these incentives if it is determined thatit meets the eligibility requirements. If successful in securing any of the following options, overall projecteconomics will be enhanced even further.
3.3.7.1 Supplemental Environmental Projects (SEP).A Supplemental Environmental Project (SEP) is an environmental project that a violator voluntarily agrees toperform as part of the settlement of an enforcement action. Although the violator is not legally required toperform a SEP, his cash penalty may be lower if he chooses to perform an acceptable SEP. An acceptableSEP must improve, protect or reduce risks to public health or the environment. When a company volunteersto do a SEP, it must show that it can and will complete the project. EPA does not manage or control themoney for the project. EPA only provides oversight to ensure that the company does what it promises to do.
For example, if a company is facing civil penalties and fines due to an EPA enforcement action (usually air orwater pollution related), the company can offset up to 80% of the civil penalty and invest 1.2 times theamount mitigated into a SEP. In turn, violators can obtain tax credits and other incentives depending on howthey invest the money. A company in Denver recently agreed to a SEP and put $303,360 into escrow withExcel Energy for the development of new wind generation capacity.
3.3.7.2 General Obligation (GO) Bonds.The City can issue "GO" Bonds for the purpose of Brownfield redevelopment. Photovoltaic power at the sitemaybe a good candidate for "GO" bonds since the site may not be developable in a cost-effective manner thatresults in positive revenues to the City. However, a Brightfield application will generate positive cash flow,and could even go so far as to help in providing cash for other Brightfield development activities at other Citylandfill sites.
3.3.7.3 EPA Brownfields Showcase Communities.The EPA Brownfields Showcase Communities Program has three main goals:1) To promote environmental protection, economic redevelopment and community revitalization through the
assessment, cleanup and sustainable reuse of Brownfields;2) To link Federal, State, local and non-governmental action supporting community efforts to restore and
reuse Brownfields; and3) To develop national models demonstrating the positive results of public and private collaboration
addressing Brownfields challenges.In October 2000, the second round of Showcase Communities was selected. The Brownfields assessmentpilots (each funded up to $200,000 over two years) test cleanup and redevelopment planning models, directspecial efforts toward removing regulatory barriers without sacrificing protectiveness, and facilitatecoordinated environmental cleanup and redevelopment efforts at the federal, state, tribal, and local levels. Itis expected that applications for 2002 funding will be available late in fiscal year 2002. Any entity is eligibleto apply to be a showcase community.
Millennium Energy LLC 16 Brightfield Feasibility AssessmentFebruary, 2001 NREL Task Ordering Agreement # KDC-0-30470-00
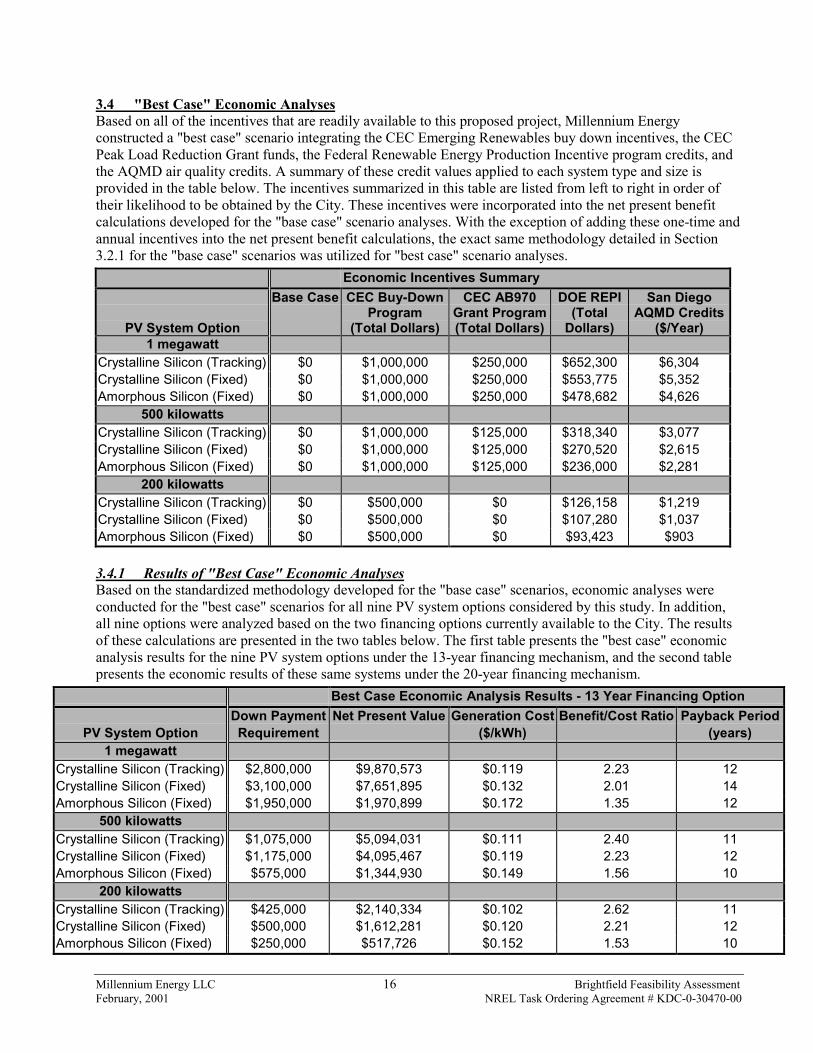
3.4 "Best Case" Economic AnalysesBased on all of the incentives that are readily available to this proposed project, Millennium Energyconstructed a "best case" scenario integrating the CEC Emerging Renewables buy down incentives, the CECPeak Load Reduction Grant funds, the Federal Renewable Energy Production Incentive program credits, andthe AQMD air quality credits. A summary of these credit values applied to each system type and size isprovided in the table below. The incentives summarized in this table are listed from left to right in order oftheir likelihood to be obtained by the City. These incentives were incorporated into the net present benefitcalculations developed for the "base case" scenario analyses. With the exception of adding these one-time andannual incentives into the net present benefit calculations, the exact same methodology detailed in Section3.2.1 for the "base case" scenarios was utilized for "best case" scenario analyses.
Economic Incentives Summary
PV System Option
Base Case CEC Buy-DownProgram
(Total Dollars)
CEC AB970Grant Program(Total Dollars)
DOE REPI(Total
Dollars)
San DiegoAQMD Credits
($/Year)1 megawatt
Crystalline Silicon (Tracking) $0 $1,000,000 $250,000 $652,300 $6,304Crystalline Silicon (Fixed) $0 $1,000,000 $250,000 $553,775 $5,352Amorphous Silicon (Fixed) $0 $1,000,000 $250,000 $478,682 $4,626
500 kilowattsCrystalline Silicon (Tracking) $0 $1,000,000 $125,000 $318,340 $3,077Crystalline Silicon (Fixed) $0 $1,000,000 $125,000 $270,520 $2,615Amorphous Silicon (Fixed) $0 $1,000,000 $125,000 $236,000 $2,281
200 kilowattsCrystalline Silicon (Tracking) $0 $500,000 $0 $126,158 $1,219Crystalline Silicon (Fixed) $0 $500,000 $0 $107,280 $1,037Amorphous Silicon (Fixed) $0 $500,000 $0 $93,423 $903
3.4.1 Results of "Best Case" Economic AnalysesBased on the standardized methodology developed for the "base case" scenarios, economic analyses wereconducted for the "best case" scenarios for all nine PV system options considered by this study. In addition,all nine options were analyzed based on the two financing options currently available to the City. The resultsof these calculations are presented in the two tables below. The first table presents the "best case" economicanalysis results for the nine PV system options under the 13-year financing mechanism, and the second tablepresents the economic results of these same systems under the 20-year financing mechanism.
Best Case Economic Analysis Results - 13 Year Financing OptionDown Payment Net Present Value Generation Cost Benefit/Cost Ratio Payback Period
PV System Option Requirement ($/kWh) (years)1 megawatt
Crystalline Silicon (Tracking) $2,800,000 $9,870,573 $0.119 2.23 12Crystalline Silicon (Fixed) $3,100,000 $7,651,895 $0.132 2.01 14Amorphous Silicon (Fixed) $1,950,000 $1,970,899 $0.172 1.35 12
500 kilowattsCrystalline Silicon (Tracking) $1,075,000 $5,094,031 $0.111 2.40 11Crystalline Silicon (Fixed) $1,175,000 $4,095,467 $0.119 2.23 12Amorphous Silicon (Fixed) $575,000 $1,344,930 $0.149 1.56 10
200 kilowattsCrystalline Silicon (Tracking) $425,000 $2,140,334 $0.102 2.62 11Crystalline Silicon (Fixed) $500,000 $1,612,281 $0.120 2.21 12Amorphous Silicon (Fixed) $250,000 $517,726 $0.152 1.53 10

Millennium Energy LLC 17 Brightfield Feasibility AssessmentFebruary, 2001 NREL Task Ordering Agreement # KDC-0-30470-00
Best Case Economic Analysis Results - 20 Year Financing OptionDown Payment Net Present Value Generation Cost Benefit/Cost Ratio Payback Period
PV System Option Requirement ($/kWh) (years)1 megawatt
Crystalline Silicon (Tracking) $1,800,000 $2,095,371 $0.103 1.30 18Crystalline Silicon (Fixed) $2,100,000 $1,031,796 $0.116 1.16 21Amorphous Silicon (Fixed) $1,200,000 $1,111,090 $0.113 1.30 17
500 kilowattsCrystalline Silicon (Tracking) $625,000 $1,307,939 $0.094 1.42 16Crystalline Silicon (Fixed) $675,000 $855,882 $0.103 1.30 18Amorphous Silicon (Fixed) $225,000 $560,063 $0.112 1.31 13
200 kilowattsCrystalline Silicon (Tracking) $225,000 $533,180 $0.093 1.44 15Crystalline Silicon (Fixed) $325,000 $325,634 $0.104 1.28 18Amorphous Silicon (Fixed) $100,000 $214,662 $0.113 1.30 14
A number of observations can be made with respect to the above results. Similar to the base case analyses, itis apparent that there is a significant difference in project economics between the 13-year and 20-yearfinancing options. The higher down payment requirements of the 13-year financing option significantlyenhance the project economics as less principle is financed over the shorter period. This results in increasednet present value valuations, higher benefit-to-cost ratios, and shorter payback periods compared to the 20-year finance option.
It should be noted that the generation costs are lower under the 20-year finance option. This is a result of thefact that a zero value was assumed for the discount rate in the 13-year option; therefore the "present worthfactor" or discounting of future costs and benefits to account for the time value of money is held constant at avalue of 1. This results in a significantly higher net present cost of the system over its lifetime for the 13-yearfinance option and a correspondingly higher cost of generation.
Overall, the project economics are positive for all PV system and financing options considered under this"best case" scenario. All net present values are positive, nearly all generation costs are below the estimatedvalue of power of 16 cents/kWh (with one exception), all benefit to cost ratios are greater than 1.0, and nearlyall options provide a payback within its respective payback period (with two exceptions). With all economicindicators positive for nearly every option, the trade off occurs between acquiring the significant capital tomeet the down payment requirements of the 13-year finance option vs. accepting lower economic returns(although still positive) through reducing the down payment and financing over 20 years. Thus, if the downpayment requirements are too extensive under the 13-year finance option, economic benefits can still beaccrued through utilizing the 20-year financing mechanism. While the down payment requirements under the20-year option are still significant, they are substantially less than the requirements under the 13-year option.
Another observation worth noting from these results is that within their respective financing options, the 200kW and 500 kW system options have nearly identical economic impacts in terms of generation costs, benefit-to-cost ratios, and payback periods. This is a result of the fact that the impact of the CEC buy-down monies isthe same for the 200 kW and 500 kW systems ($2/W); but the 200 kW system is too small to qualify for theAB970 Peak Load Reduction Grant funds. Therefore, a 500 kW system will return the same relative level ofeconomic impacts as a 200 kW system financed under the same mechanism. It should also be noted thatbecause the CEC buy-down monies are capped at $1 million per project, the benefits of these monies havedecreasing benefits as the system size increases over 450 kW. For example, the $1 million cap results in abuy-down of $2/w for the 500 kW system, but only $1/w for the 1 MW system. As a result, the 500 kW

Millennium Energy LLC 18 Brightfield Feasibility AssessmentFebruary, 2001 NREL Task Ordering Agreement # KDC-0-30470-00
system options are more economically attractive than the 1 MW system options in terms of generation costs,benefit-to-cost ratios and payback periods. From a purely economic perspective, the 500 kW system optiondelivers the greatest value of the three PV system options, under most of the scenarios evaluated.
Finally, with respect to system types, the crystalline silicon with tracking mount systems provide enhancedeconomics over the crystalline silicon with fixed mount system under all of the "best case" scenariosevaluated. This is purely a function of the increased energy output of the tracking system option, and thecorresponding economic benefits accruing from increased energy sales. In addition, the crystalline siliconwith tracking system options also provide greater economic benefits when compared to the amorphous withfixed mount system options under nearly all the scenarios analyzed. Again, this is a function of the increasedbenefits accruing through the increased energy output of the crystalline silicon with tracking system option; aswell as the fact that the expected life of the plant of crystalline silicon option is 30 years versus the 20 yearexpected life of the amorphous system option.
3.4.2 Alternative Finance and Funding ScenariosIn addition to the 13 and 20 year financing options, Millennium Energy also conducted an analysis of twoalternative scenarios to demonstrate the economic impacts of financing over a 10-year period with LandfillClosure Reserve Funds and a direct purchase of the system with no financing. Due to the fact that the use ofLandfill Closure Reserve Funds will require 10 year financing starting in 2001, a best case scenario wasdeveloped for the 500 kW crystalline silicon tracking system option financed with Landfill Closure ReserveFunds over a 10-year period. In addition, another best case scenario was developed for the same PV systemoption with no financing, that is, a direct purchase of the system. The results of these analyses are presented inthe table below.
Best Case Economic Analysis Results10 Year Financing and No Financing Options
Down Payment Net Present Value Generation Cost Benefit/Cost Ratio Payback PeriodPV System Option Requirement ($/kWh) (years)
500 kilowattsCrystalline Silicon (Tracking) $1,350,000 $5,372,826 $0.103 2.60 11* - 10 year financing optionCrystalline Silicon (Tracking) $2,712,000 $1,588,218 $0.085 1.57 16* - direct purchase (purchase price)
The are two main observations that can be made on these analyses. First, while the ten-year option provideson of the best economic valuations of all options studied, this is due to the fact that over half the system costis paid for in the down payment. This combination of high down payment and short finance period provideshighly favorable economic valuations for net present value and benefit to cost ratio. However, it is alsoimportant to note that payback period is longer than finance period.
The second observation that can be made is related to the direct purchase option. While the economicvaluations provided by these options are not as favorable as some of the other financing options, this is due tothe fact that the capital costs are paid up-front prior to development. Due to this fact, the entire capital cost ofthe system is fully valued in year one, and is not discounted in the cash flow analysis over the 30-year period.Again, this is a function of the discount rate factor which takes in to account that money is worth more in thepresent than in the future. However, the generation cost resulting from the direct purchase of the plant islowest of all options evaluated. This is a result of the fact that this option is the lowest total cost option, sincethere is no finance interest charged.

Millennium Energy LLC 19 Brightfield Feasibility AssessmentFebruary, 2001 NREL Task Ordering Agreement # KDC-0-30470-00
4 ECONOMIC VALUE AND VALUE-ADDED BENEFITSA number of options were evaluated under this study to estimate the economic benefits of the proposedproject, as well as to specify value-added benefits provided by the plant. These benefits are described in thefollowing sections.
4.1 On-Site Energy Consumption/Sales4.1.1 Miramar Landfill Fee StationIn order to quantify the benefits of on-site usage of PV power at the Fee Station, an analysis was conducted todetermine the "break-even" cost of PV produced energy when used to displace utility provided energy. Incalculating the commodity price of utility provided power, a billing analysis for the Fee Station account wasconducted for the period from January through December 2000. Based on this analysis, it was determined thatthe average annual price of utility energy during this period was 16 cents/kWh. This commodity price wasthen designated as the "break-even" cost. That is, when the commodity price of energy generated by the PVplant is valued at 16 cents/kWh, and displaces utility provided energy priced at 16 cents per kWh, the result isa "break-even" transaction. Should the utility price of energy increase above the 16 cents/kWh level, then netsavings are provided to the Fee Station. For example, during January 2001, average utility energy prices at theFee Station account were approximately 30 cents/kWh, and estimated consumption was approximately 5,750kWh for a total energy cost of $1,725. If PV power was available to the Fee Station at 16 cents/kWh, the Citywould have saved ~$800 (over 45%) on its energy related utility costs for this account during January. Itshould be noted that the Fee Station's annual energy consumption is equivalent to only 2.5% of the annualoutput of a 1 MW plant. Since the Fee Station is on the SDG&E General Service "A" rate schedule.Therefore, if other accounts of the same tariff can be identified and accessed, similar reductions in energybills during these high cost months could be experienced.
4.1.2 Marine Corps Air Station - Miramar Purchases from a PV Plant at the Miramar LandfillMillennium Energy conducted a detailed review and analysis of MCAS-Miramar's energy consumption andcosts, based on data provided by energy program staff at the base. MCAS-Miramar purchases its powerthrough the Public Works Command (PWC) and not directly from SDG&E. PWC charges MCAS-Miramarvia a time-of-use (T-O-U) rate tariff for base, peak, and semi-peak energy consumption periods, and alsocharges for peak demand and non-coincident demand. After an analysis of the rates charged to MCAS-Miramar by the PWC for the sites monthly energy consumption for each T-O-U period was completed, it wasdetermined that MCAS-Miramar currently pays an annual average cost for energy of $0.065 per kWh. Thisannual average cost is a blended cost incorporating both energy and demand charges. Even if energy anddemand from the proposed PV plant at the landfill is sold to MCAS-Miramar only during the peak and semi-peak periods, the electricity provided would be displacing load that is currently served by the PWC at a rate of$0.079 per kWh. Therefore, purchases of PV power by MCAS-Miramar in the $0.16-$0.17 per kWh wouldnot be cost-effective based on the current rate schedule.
However, it is apparent that the rates currently charged by the PWC do not reflect current market conditionsin the San Diego region. MCAS-Miramar is aware of this situation, and realizes that it may be faced withsignificant rate increases in the near future. Therefore, it is recommended that the City work with the MCAS-Miramar energy program staff, and monitor any future rate increases to determine if the purchase of PVpower from the landfill would be cost-effective based on the new rates.
4.1.3 PV Power as a Peak Load Reduction StrategyA number of options exist for the utilization of power from the proposed PV power plant, and in fact, it couldprovide additional economic benefits to selected customers when sold as part of a peak reduction strategy.For example, the demand (or kilowatt) component of power sales have not been factored into the economicanalyses for this effort, as the analyses have focused on General Service tariff accounts (i.e., the Fee Station)that are not charged for electrical demand. Large commercial, industrial, and government facilities typicallyare charged for their peak demand usage, and as the San Diego region has seen, these charges have escalated

Millennium Energy LLC 20 Brightfield Feasibility AssessmentFebruary, 2001 NREL Task Ordering Agreement # KDC-0-30470-00
dramatically in recent months. As illustrated earlier in this report, the peak power output of a PV plant in SanDiego is highly coincident with the highest cost utility peak demand periods. Customers with utility demandcharges could subscribe to the demand and energy output from the plant to reduce these peak demand costsand hedge against future price volatility.
One large facility with a demand charge and/or a time-of-use tariff opting to purchase power from theproposed solar plant (i.e., MCAS-Miramar) could account for a significant amount of its total output. In thisinstance, a win-win situation would be achieved in that the City would obtain a single customer to dedicatethe output of the plant to, and the customer would be provided with economic benefits from reduced energyand demand costs - and lock in a hedge against future price volatility.
4.1.4 PV Power Sales StrategiesOther options for utilization of the output of the plant include direct sales to customers in the San Diegoregion. This would require the City to become a municipal utility. However, since the City already operates asa utility in several areas already (i.e., refuse collection and disposal, sewage treatment) many of therequirements of operating as a utility are already in place (i.e., billing and accounting).
Currently, residential rates in San Diego are "capped" at 6.5 cents per kWh. However, this "cap" onresidential rates is seen by many as artificial since the rates are capped for three years at the 6.5 cent/kWhlevel, but at the end of the three year period residential customers will be charged the difference between thecapped rate and actual cost of power consumed -- plus an interest rate for the balance carried over the threeyear period. Assuming that the capped rate and the actual cost of energy consumed are equal over the threeyear period (which most industry analysts do not anticipate), a typical residential customer that purchases theoutput of the proposed plant at 17 cents/kWh (estimated based on 16 cent/kWh commodity price, 1/cent perkWh CEC rebate, and 2 cents/kWh to account for distribution, administrative, and transaction costs) wouldexperience an annual increase in their utility bills of $700. Since this is obviously not an economicaltransaction for the consumer, this scenario is highly unlikely. Conversely, if the actual future cost of power inthe region mirrors the current rates in the region (16-30 cents per kWh), residential consumers could purchasethe power for a break-even transaction, or even at net savings on their utility bills.
The direct sales strategy discussed above assumes an "all or nothing" purchase by the consumer. However, ifthe power were sold in 100 kWh per month blocks (just under 15% of average residential usage), theincremental cost on the consumers utility bill would be ~$10.50 per month. The following table summarizesthe "energy equivalent" of customers required to fully utilize the output of the PV plant options considered bythis study when purchasing the output in 100 kWh/month blocks. If this option is considered, the City shouldinvestigate the legality of such a scenario as current restructuring laws prohibit customers from having morethan one energy service provider per account. However, this law may not apply to the City if it becomes amunicipal utility.
Crystalline Silicon Crystalline Silicon Amorphous Thin Film Fixed Mount Tracking Mount Fixed Mount
PV System Option Energy Equivalent - # of Customers Purchasing 100 kWh/mo.1 megawatt 1,586 1,868 1,371
500 kilowatts 775 912 676200 kilowatts 307 361 268
Another alternative considered under the sales options was direct sales to green power marketers. While thisscenario may warrant further evaluation, Millennium contacted several green power marketers operating inCalifornia to determine their interest in purchasing solar power resources from the San Diego region. Whileall were interested in purchasing solar power (since few green power marketers have any solar in their

Millennium Energy LLC 21 Brightfield Feasibility AssessmentFebruary, 2001 NREL Task Ordering Agreement # KDC-0-30470-00
resource portfolios), none were willing to pay more than 10 cents/kWh. This option is not economicallyviable for the City based on the economics of the proposed solar plant at Miramar Landfill.
Finally, the City may also want to consider the option of selling the output of the PV plant directly into thePower Exchange. While current market conditions indicate that selling the power directly into the PowerExchange may result in immediate profits and positive cash flow, the future of the California electricitymarket is highly uncertain and extreme volatility in energy prices may continue to exist. Therefore, sellingdirectly into the exchange would be a high risk option, especially if future energy prices were to drop belowthe 16 cent/kWh level; prices below this level would result in negative cash flow for the plant and would notaccrue sufficient revenues to meet the finance payment requirement. In addition, selling into the marketreduces one of the major benefits provided by solar power - price stability. Since PV plants have no fuel orother variable costs, the energy from a PV plant can be sold at fixed prices under long-term contracts. Fixedprice long-term contracts are the lowest risk option since they guarantee a positive revenue stream fromenergy sales. This strategy also provides advantages to the customer by providing a long-term hedge againstfuture price volatility - a value-added benefit in addition to any energy price savings resulting from the long-term fixed price contract.
Under any of the direct sales strategies that require transmitting power through the grid, additional costs willbe incurred for these sales including, but not limited to, power scheduling and transmission wheeling charges,administrative costs, and transaction costs. Discussions should be initiated with SDG&E to determine theamount of these additional costs if direct sales strategies are pursued. In addition, it is also important to notethat the implementation of any direct sales strategies to off-site customers will result in the loss of the CECEmerging Renewables Buy Down Program incentives; however, if these direct sales are made to non-publicentities, the loss of this incentive will be partially offset by 1cent/kWh customer credit available from theCEC.
4.1.5 Additional Value Added BenefitsIn addition to the value added benefits of a PV power discussed throughout this report (i.e., hedging againstfuture price volatility, peak power reduction, Brownfield redevelopment, economic development, and positiveenvironmental impacts), there is one other value-added benefit that should be considered in evaluating theviability of PV power plant options in the San Diego region. This additional value-added benefit is the voltagesupport distributed energy options such as PV provide to the local transmission and distribution grid. Whilethis has no monetary value to the City, SDG&E may accrue benefits on its stressed T&D system through theadditional localized voltage support provided by PV power plants. While this additional voltage support isminimal from just one 1 MW PV plant, these benefits may become appreciable if additional distributedgeneration plants are brought on line in the future. While a 1 MW PV power plant is unlikely to prevent alocalized power black out, the proliferation of distributed energy options on the localized grid may have animpact in the future. As PV and other distributed energy options become valued on a more equal basis withconventional peaking power plants (such as natural gas combustion turbines) the value added benefits of PVplants are more likely to be transferred to tangible monetary benefits. The development of a PV power plant atMiramar Landfill is an important first step in San Diego towards moving the market for PV technologies fromsmall-scale green power applications to utility-scale power plant applications.
5 CONCLUSIONS AND RECOMMENDATIONS5.1 ConclusionsAs can be seen from the analyses presented in this report, the development of a PV power plant at MiramarLandfill is both technically and economically feasible. With respect to the technical issues assessed throughthis feasibility study, there are no technical barriers to development of a plant at the site. There still remain anumber of critical issues to be resolved, such as developing an interconnection and wheeling agreement withSDG&E, obtaining approval from the CLAMP on the use of the site for producing PV power, and finalizingthe location of the site at the landfill.

Millennium Energy LLC 22 Brightfield Feasibility AssessmentFebruary, 2001 NREL Task Ordering Agreement # KDC-0-30470-00
In reviewing the "best case" scenario results of the economic analyses of the PV system options considered bythis study, it is possible that economic benefits may be accrued by the City from developing, owning, andoperating a PV facility. The acquisition of CEC buy-down funds, CEC customer credits, CEC Peak LoadReduction Grant funds, Federal Renewable Energy Production Incentives, and regional air quality credits willsignificantly enhance the overall project economics, and will make the difference between whether or not theproject is economically feasible.
5.2 RecommendationsBased on the economic analyses performed on nearly all the scenarios developed, the crystalline silicon withtracking system provides superior economic performance over the same system with a fixed mount and theamorphous thin film option. In addition, it was determined that no significant economic differences (in termsof generation cost, benefit-to-cost ratio, and payback periods) existed between the 200 kW and 500 kWsystem options. Therefore, if the down payment requirements can be met, it is recommended that the Citypursue the 500 kW system option if deciding between developing a 200 kW and 500 kW system. While theeconomic valuations are the same, greater net revenues will be obtained through the 500 kW system options.
However, there was a discernable difference in the economic valuations between the 500 kW and 1 MW plantoptions. Due to the impact of the CEC buy-down funds, the 500 kW system provides increased economicvalue and is more cost-effective than the 1 MW option. Whether to pursue development of a 500 kW systemor a 1 MW system will require a management decision based on whether the City should develop the mostcost-effective option (500 kW) or an option that is still cost-effective but is larger in size and results in morenet revenue to the City. One alternative to the 500 kW vs. 1 MW decision would be to start with the 500 kWsystem and add another 500 kW at a later date. In this manner the CEC buy-down funds will be maximized,and all other economic incentives can still be obtained for the additional 500 kW upon completion.
One of the critical factors that will need to be addressed by the City is securing the down paymentrequirement. Even under the 20-year financing mechanism, the down payment requirements for a 1 MWsystem range from $1.2-2.1 million dollars. Therefore, the amount of down payment monies available willlikely determine not only the financing mechanism utilized (13 vs. 20 year) but the size of the system as well(200 kW, 500 kW, or 1 MW).
It should be noted, again, that the economic analyses performed by this study are based on several keyassumptions such as: 1) a value of PV energy sales of 16 cents per kWh in the San Diego region, 2) a 3%annual energy price escalation factor, and 3) various interest rates and financing term parameters. Should anyof these variables change, even slightly, the results of these analyses can change significantly. Therefore, it isrecommended that the City review all of its financing options, and continue to closely monitor the energymarket in the San Diego region for any significant changes in energy prices which may have an impact onoverall project economics.
In addition, the City should review its options for utilizing the output of the proposed plant, and identifyopportunities for selling both demand and energy to consumers in the region, preferably to one largecustomer. Ideally, sales of demand and energy by the City to MCAS-Miramar would provide a win-winsituation to both entities - while demonstrating a municipal/Federal partnership to address commoncommunity energy goals and objectives.
5.3 Significant Follow-up StepsIt is highly recommended that the City take action to complete and/or resolve the following issues:• Initiate dialogue with SDG&E to discuss interconnection requirements and costs, wheeling capacity
availability and costs, direct sales transaction costs, and the time required to complete the process;• Go forward with an application to the CEC's Peak Load Reduction Grant and Emerging Renewables
Buy-Down programs to secure funds to buy down the up-front capital cost of the plant;

Millennium Energy LLC 23 Brightfield Feasibility AssessmentFebruary, 2001 NREL Task Ordering Agreement # KDC-0-30470-00
• Proceed with the CLAMP application process and then the associated Federal processes;• Proceed with all internal processes required for completion prior to plant construction (i.e., land use
permitting, environmental permitting, etc.); and• Identify the customers and confirm specific details of the power purchase transaction.
Finally, in an effort to keep project costs as low as possible, and economics as favorable as possible, the Citymay also want to consider developing 2-3 500 kW PV plants at various Brownfield sites operated by the City.For example, if the City were to develop a 500 kW PV plant at the Miramar Landfill, Balboa Park Landfill,and the Chollas Landfill then the City could reduce the cost of each of these smaller plants by $1 M each(when compared to a 1 MW plant) through the acquisition of CEC Emerging Renewables buy-down funds.Since the 500 kW system options provide the best economic valuations of all three plant sizes considered bythis study, it may be economically prudent to develop several 500 kW system rather than one l MW system.Through a strategy of sustained and orderly development of solar plants in the region, an increased number ofsmaller plants can be cost-effectively developed within the region as opposed to a single less cost-effectivelarge plant. Smaller plants with larger proportionate buy down levels will result in lower energy productioncosts, lower down payment requirements, overall enhanced economics, as well as provide the additional valueadded benefits afforded by multiple distributed generation systems.
Millennium Energy LLC Brightfield Feasibility AssessmentFebruary, 2001 NREL Task Ordering Agreement # KDC-0-30470-00
Appendix A:PV System Design Specifications
AndAssociated Component Costs

Millennium Energy LLC Brightfield Feasibility AssessmentFebruary, 2001 NREL Task Ordering Agreement # KDC-0-30470-00
1 MW Design Specifications and Associated Component Costs
Crystalline Modules with Fixed Mount PV System• 4,320 x 300 watt crystalline silicon modules (432 parallel strings of 10 in series) in 10 sub-arrays. Cost @
~ $4.00/w = $5,184,000.• 10 x Trace 100 kW line tie inverters. Cost @ 61,000/inverter ~ $610,000.• Elevation angled fixed mount structure. Cost ~ $350-400,000.• Balance of system components (hardware, wiring, disconnects, metering and NEC required components),
freight and installation. Cost ~ $1-1.25 MTotal System Capital Cost ~ $7,184,000.
Crystalline Modules with Tracking Mount PV System• 4,320 x 300 watt crystalline silicon modules (432 parallel strings of 10 in series) in 10 sub-arrays. Cost @
~$4.00/w = $5,184,000.• 10 x Trace 100 kW line tie inverters. Cost @ 61,000/inverter ~ $610,000.• Single axis azimuth tracking mount structure. Cost ~ $550,000• Balance of system components (hardware, wiring, disconnects, metering and NEC required components),
freight and installation. Cost ~ $1-1.25 MTotal System Capital Cost ~ $7,384,000.
Amorphous Thin Film Modules with Fixed Mount PV System• 25,930 x 43 watt amorphous thin film modules (5,186 parallel strings of 5 in series) in 10 sub-arrays. Cost
@ ~ $3.00/w = $3,121,972.• 10 x Trace 100 kW line tie inverters. Cost @ 61,000/inverter ~ $610,000.• Elevation angled fixed mount structure. Cost ~ $650,000.• Balance of system components (hardware, wiring, disconnects, metering and NEC required components),
freight and installation. Cost ~ $1-1.35 MTotal System Capital Cost ~ $5,622,000.
500 kW Design Specifications and Associated Component Costs
Crystalline Modules with Fixed Mount PV System• 2,160 x 300 watt crystalline silicon modules (216 parallel strings of 10 in series) in 5 sub-arrays. Cost @
~ $4.00/w = $2,592,000.• 5 x Trace 100 kW line tie inverters. Cost @ 61,000/inverter ~ $305,000.• Elevation angled fixed mount structure. Cost ~ $175-200,000.• Balance of system components (hardware, wiring, disconnects, metering and NEC required components),
freight and installation. Cost ~ $600-750,000• Total System Capital Cost ~ $3,672,000.
Crystalline Modules with Tracking Mount PV System• 2,160 x 300 watt crystalline silicon modules (216 parallel strings of 10 in series) in 5 sub-arrays. Cost @
~ $4.00/w = $2,592,000.• 5 x Trace 100 kW line tie inverters. Cost @ 61,000/inverter ~ $305,000.• Single axis azimuth tracking mount structure. Cost ~ $325,000• Balance of system components (hardware, wiring, disconnects, metering and NEC required components),
freight and installation. Cost ~ $625 - 750,000Total System Capital Cost ~ $3,837,000.

Millennium Energy LLC Brightfield Feasibility AssessmentFebruary, 2001 NREL Task Ordering Agreement # KDC-0-30470-00
Amorphous Thin Film Modules with Fixed Mount PV System• 12,965 x 43 watt amorphous thin film modules (2,593 parallel strings of 5 in series) in 5 sub-arrays. Cost
@ ~ $3.00/w = $1,672,485.• 5 x Trace 100 kW line tie inverters. Cost @ 61,000/inverter ~ $305,000.• Elevation angled fixed mount structure. Cost ~ $325,000.• Balance of system components (hardware, wiring, disconnects, metering and NEC required components),
freight and installation. Cost ~ $600-810,000.Total System Capital Cost ~ $2,903,000.
200 kW Design Specifications and Associated Component Costs
Crystalline Modules with Fixed Mount PV System• 864 x 300 watt crystalline silicon modules (432 parallel strings of 10 in series) in 2 sub-arrays. Cost @ ~
$4.00/w = $1,036,800.• 2 x Trace 100 kW line tie inverters. Cost @ 61,000/inverter ~ $122,000.• Elevation angled fixed mount structure. Cost ~ $70-80,000.• Balance of system components (hardware, wiring, disconnects, metering and NEC required components),
freight and installation. Cost ~ $300-375,000.Total System Capital Cost ~ $1,529,000.
Crystalline Modules with Tracking Mount PV System• 864 x 300 watt crystalline silicon modules (432 parallel strings of 10 in series) in 2 sub-arrays. Cost @ ~
$4.00/w = $1,036,800.• 2 x Trace 100 kW line tie inverters. Cost @ 61,000/inverter ~ $122,000.• Single axis azimuth tracking mount structure. Cost ~ $100,000• Balance of system components (hardware, wiring, disconnects, metering and NEC required components),
freight and installation. Cost ~ $300-375,000Total System Capital Cost ~ $1,559,000.
Amorphous Thin Film Modules with Fixed Mount PV System• 5,186 x 43 watt amorphous thin film modules (1,037 parallel strings of 5 in series) in 2 sub-arrays. Cost
@ ~ $3.00/w = $668,994.• 2 x Trace 100 kW line tie inverters. Cost @ 61,000/inverter ~ $122,000.• Elevation angled fixed mount structure. Cost ~ $130,000.• Balance of system components (hardware, wiring, disconnects, metering and NEC required components),
freight and installation. Cost ~ $300-400,000.Total System Capital Cost ~ $1,221,000.

Millennium Energy LLC Brightfield Feasibility AssessmentFebruary, 2001 NREL Task Ordering Agreement # KDC-0-30470-00
Appendix B:Preliminary System Design Schematics

115KWAC MAXTRACKER BLOCKX 9 BLOCKS PER MAXTRACKER= 1.0 MWAC MAXTRACKER
SAN DIEGO BRIGHTFIELDS 1 MW PV POWER PLANT
NORTH 582'
488'-3"
10' CLEAR
15' CLEAR
A
B
C
D
SHINGLETON ENGINEERINGCAD GENERATED DRAWING,DO NOT MANUALLY UPDATE
SCALE
SIZE DWG. NO.A SHEET OF
DATEDRAWN
UNLESS OTHERWISE SPECIFIEDDIMENSIONS ARE IN INCHESTOLERANCES ARE:
FRACTIONS DECIMALS ANGLES+ 1/16 .XX .02 1
.XXX .010
MATERIAL
FINISH
--
--
DO NOT SCALE DRAWING
1345678
SAN DIEGO BRIGHTFIELDS PV PROJECT
A
B
C
D
12345678
THE INFORMATION IN THIS DRAWING IS THE SOLE PROPERTY OFSHINGLETON ENGINEERING. ANY REPRODUCTION IN PART OR WHOLE WITHOUTTHE WRITTEN PERMISSION OF SHINGLETON ENGINEERING IS PROHIBITED.
JGS 10/8/00 MaxTracker TM
US PATENT NO. 6,058,930
1:1800 1 MWAC MAXTRACKER PLAN
2
1 3SDBF-001-A
REVISION DATE:[email protected]

NORTHAS AN EXAMPLE:300W PV MODULEX 2 MODULES PER PANELX 24 PANELS PER ROWX 10 ROWS= 480 PV MODULES PER ROW= 144KWDC X .80 = 115KWAC
1/2HP MAXTRACKER DRIVE AND CONTROLLER
NOTES:1) PRELIMINARY - NOT FOR CONSTRUCTION2) DIMENSIONS ARE APPROXIMATE3) 300W PV MODULES SHOWN AS AN EXAMPLE. MAXTRACKER MAY READILYACCOMMODATE ALTERNATIVE MODULES OR MULTIPLE PV MODULE TYPES.
19'-6"
8'-6"
11'
184'
156'-1"
A
B
C
D
SHINGLETON ENGINEERINGCAD GENERATED DRAWING,DO NOT MANUALLY UPDATE
SCALE
SIZE DWG. NO.A SHEET OF
DATEDRAWN
UNLESS OTHERWISE SPECIFIEDDIMENSIONS ARE IN INCHESTOLERANCES ARE:
FRACTIONS DECIMALS ANGLES+ 1/16 .XX .02 1
.XXX .010
MATERIAL
FINISH
--
--
DO NOT SCALE DRAWING
1345678
SAN DIEGO BRIGHTFIELDS PV PROJECT
A
B
C
D
12345678
THE INFORMATION IN THIS DRAWING IS THE SOLE PROPERTY OFSHINGLETON ENGINEERING. ANY REPRODUCTION IN PART OR WHOLE WITHOUTTHE WRITTEN PERMISSION OF SHINGLETON ENGINEERING IS PROHIBITED.
JGS 10/7/00 MaxTracker TM
US PATENT NO. 6,058,930
1:360 115KWAC MAXTRACKER
2
3 3SDBF-001-A
REVISION DATE:[email protected]

SAN DIEGO BRIGHTFIELDS 3 MW PV POWER PLANT
NORTH
115KWAC MAXTRACKER BLOCKX 26 BLOCKS PER MAXTRACKER= 3.0 MWAC MAXTRACKER
15' CLEAR
10' CLEAR
1179'
820'-5"
A
B
C
D
SHINGLETON ENGINEERINGCAD GENERATED DRAWING,DO NOT MANUALLY UPDATE
SCALE
SIZE DWG. NO.A SHEET OF
DATEDRAWN
UNLESS OTHERWISE SPECIFIEDDIMENSIONS ARE IN INCHESTOLERANCES ARE:
FRACTIONS DECIMALS ANGLES+ 1/16 .XX .02 1
.XXX .010
MATERIAL
FINISH
--
--
DO NOT SCALE DRAWING
1345678
SAN DIEGO BRIGHTFIELDS PV PROJECT
A
B
C
D
12345678
THE INFORMATION IN THIS DRAWING IS THE SOLE PROPERTY OFSHINGLETON ENGINEERING. ANY REPRODUCTION IN PART OR WHOLE WITHOUTTHE WRITTEN PERMISSION OF SHINGLETON ENGINEERING IS PROHIBITED.
JGS 10/7/00 MaxTracker TM
US PATENT NO. 6,058,930
1:1800 3MWAC MAXTRACKER PLAN
2
2 3SDBF-001-A
REVISION DATE:[email protected]

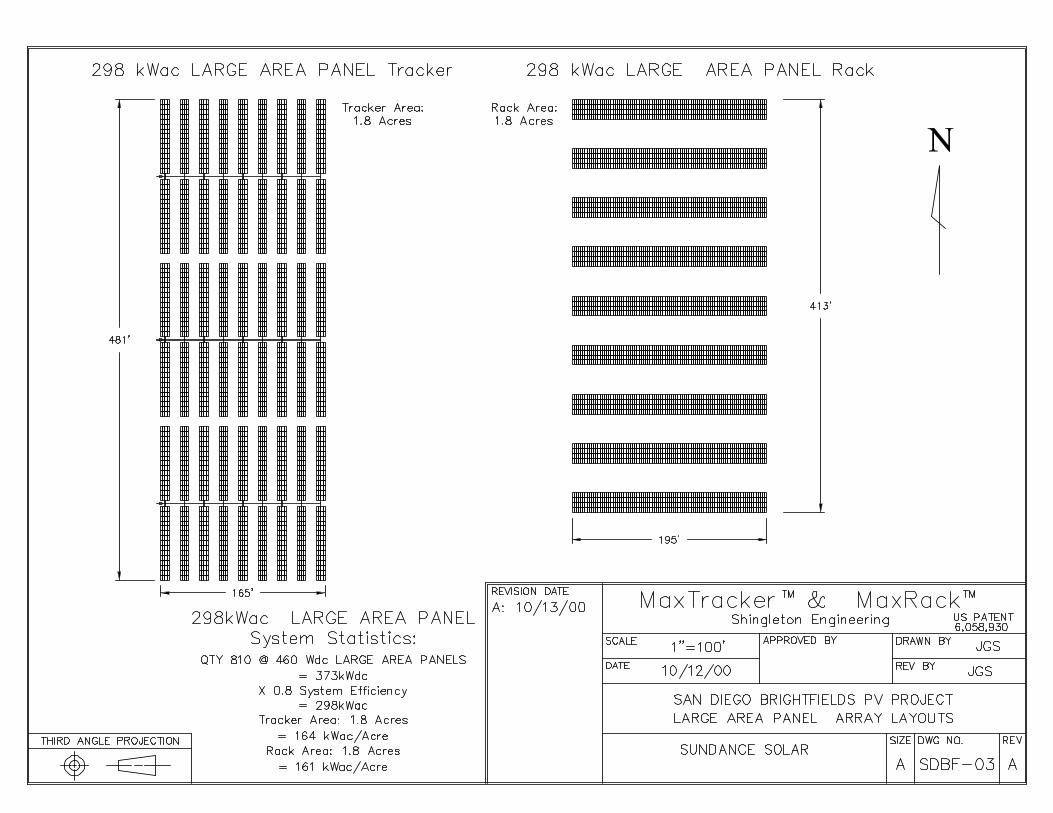


A
B
C
D
SHINGLETON ENGINEERINGCAD GENERATED DRAWING,DO NOT MANUALLY UPDATE
SCALE
SIZE DWG. NO.A SHEET OF
DATEDRAWN
UNLESS OTHERWISE SPECIFIEDDIMENSIONS ARE IN INCHESTOLERANCES ARE:
FRACTIONS DECIMALS ANGLES+ 1/16 .XX .02 1
.XXX .010
MATERIAL
FINISH
--
--
DO NOT SCALE DRAWING
1345678
SALINE PROJECT
A
B
C
D
12345678
THE INFORMATION IN THIS DRAWING IS THE SOLE PROPERTY OFSHINGLETON ENGINEERING. ANY REPRODUCTION IN PART OR WHOLE WITHOUTTHE WRITTEN PERMISSION OF SHINGLETON ENGINEERING IS PROHIBITED.
JGS 9/15/00 MaxRack TM
1:192 ARRAY AERIAL
2
1 1BPSL-4-A
REVISION DATE:[email protected]

A
B
C
D
SHINGLETON ENGINEERINGCAD GENERATED DRAWING,DO NOT MANUALLY UPDATE
SCALE
SIZE DWG. NO.A SHEET OF
DATEDRAWN
UNLESS OTHERWISE SPECIFIEDDIMENSIONS ARE IN INCHESTOLERANCES ARE:
FRACTIONS DECIMALS ANGLES+ 1/16 .XX .02 1
.XXX .010
MATERIAL
FINISH
--
--
DO NOT SCALE DRAWING
1345678
SALINE PROJECT
A
B
C
D
12345678
THE INFORMATION IN THIS DRAWING IS THE SOLE PROPERTY OFSHINGLETON ENGINEERING. ANY REPRODUCTION IN PART OR WHOLE WITHOUTTHE WRITTEN PERMISSION OF SHINGLETON ENGINEERING IS PROHIBITED.
JGS 9/15/00 MaxRack TM
1:192 ARRAY AERIAL
2
1 1BPSL-5-A
REVISION DATE:[email protected]

169'-3 3/4"
NOTES:
1) PRELIMINARY - NOT FOR CONSTRUCTION.2) DESIGN BASIS 90MPH 3-SEC GUST IAW ASCE 7-95 AND UBC; UBC SOIL CLASS 4.
A
B
C
D
SHINGLETON ENGINEERINGCAD GENERATED DRAWING,DO NOT MANUALLY UPDATE
SCALE
SIZE DWG. NO.A SHEET OF
DATEDRAWN
UNLESS OTHERWISE SPECIFIEDDIMENSIONS ARE IN INCHESTOLERANCES ARE:
FRACTIONS DECIMALS ANGLES+ 1/16 .XX .02 1
.XXX .010
MATERIAL
FINISH
--
--
DO NOT SCALE DRAWING
1345678
SALINE PROJECT
A
B
C
D
12345678
THE INFORMATION IN THIS DRAWING IS THE SOLE PROPERTY OFSHINGLETON ENGINEERING. ANY REPRODUCTION IN PART OR WHOLE WITHOUTTHE WRITTEN PERMISSION OF SHINGLETON ENGINEERING IS PROHIBITED.
JGS 9/15/00 MaxRack TM
1:200 FRONT VIEW
2
1 1BPSL-1-A
REVISION DATE:[email protected]

NOTES:1) THESE DRAWINGS INLLUSTRATE THE GENERIC MAXTRACKER ASSEMBLY DETAILS. THE PV MODULE TYPE, NUMBER OF ROWS, NUMBER OF DRIVES, NUMBER OF PIERS AND OTHER DETAILS WILL VARY FOR SPECIFIC PROJECTS. 2) CONSULT THE PROJECT ARRAY LAYOUT, FOUNDATION LAYOUT AND DETAIL DRAWINGS, AND THE PROJECT BILL-OF-MATERIALS FOR ALL SPECIFIC PROJECT DETAILS.
MAXTRACKER ROW(10-ROW MAXTRACKER SHOWN)
MAXTRACKER STRUT
AERIAL VIEW DETAILMTA-002
A
B
C
D
SHINGLETON ENGINEERINGCAD GENERATED DRAWING,DO NOT MANUALLY UPDATE
SCALE
SIZE DWG. NO.A SHEET OF
DATEDRAWN
UNLESS OTHERWISE SPECIFIEDDIMENSIONS ARE IN INCHESTOLERANCES ARE:
FRACTIONS DECIMALS ANGLES+ 1/16 .XX .02 1
.XXX .010
MATERIAL
FINISH
--
--
DO NOT SCALE DRAWING
1345678
MAXTRACKER ASSEMBLY
A
B
C
D
12345678
THE INFORMATION IN THIS DRAWING IS THE SOLE PROPERTY OFSHINGLETON ENGINEERING. ANY REPRODUCTION IN PART OR WHOLE WITHOUTTHE WRITTEN PERMISSION OF SHINGLETON ENGINEERING IS PROHIBITED.
JGS 8/29/00 MaxTracker TM
US PATENT NO. 6,058,930
1:288 AERIAL VIEW
2
1 1MTA-001-A
REVISION DATE:[email protected]

MTA-004DRIVE DETAIL
MTA-003BEARING PIER DETAIL
NOTES:1) THESE DRAWINGS INLLUSTRATE THE GENERIC MAXTRACKER ASSEMBLY DETAILS. THE PV MODULE TYPE, NUMBER OF ROWS, NUMBER OF DRIVES, NUMBER OF PIERS AND OTHER DETAILS WILL VARY FOR SPECIFIC PROJECTS. 2) CONSULT THE PROJECT ARRAY LAYOUT, FOUNDATION LAYOUT AND DETAIL DRAWINGS, AND THE PROJECT BILL-OF-MATERIALS FOR ALL SPECIFIC PROJECT DETAILS. 3) GENERIC DRAWING MAY SHOW COMPONENTS PROVIDED BY OTHERS.4) PV MODULES NOT SHOWN FOR CLARITY.
TORQUE TUBE
PANEL RAIL
RIGID STRUT
END STRUT
BEARING PIER DRIVE PIER
BEARING PIER
A
B
C
D
SHINGLETON ENGINEERINGCAD GENERATED DRAWING,DO NOT MANUALLY UPDATE
SCALE
SIZE DWG. NO.A SHEET OF
DATEDRAWN
UNLESS OTHERWISE SPECIFIEDDIMENSIONS ARE IN INCHESTOLERANCES ARE:
FRACTIONS DECIMALS ANGLES+ 1/16 .XX .02 1
.XXX .010
MATERIAL
FINISH
--
--
DO NOT SCALE DRAWING
1345678
MAXTRACKER ASSEMBLY
A
B
C
D
12345678
THE INFORMATION IN THIS DRAWING IS THE SOLE PROPERTY OFSHINGLETON ENGINEERING. ANY REPRODUCTION IN PART OR WHOLE WITHOUTTHE WRITTEN PERMISSION OF SHINGLETON ENGINEERING IS PROHIBITED.
JGS 8/29/00 MaxTracker TM
US PATENT NO. 6,058,930
1:36 AERIAL VIEW DETAIL
2
1 1MTA-002-A
REVISION DATE:[email protected]

Millennium Energy LLC Brightfield Feasibility AssessmentFebruary, 2001 NREL Task Ordering Agreement # KDC-0-30470-00
Appendix C:Economic Analysis Spreadsheets
ForBase Case Scenario of PV System Options
Utilizing the 13-Year Financing Mechanism

Year kWh Ave. Cost Value of Present Value Present Value Net Cash Net Cash PaybackGenerated $/kWh Energy Factor* of Benefits Flow w/o DP Flow w/ DP (Cost=$7.384M)
0 0 1.0000 $0.00 $0.00 -$4,350,000.00 $0.001 2241576 0.16 $358,652.16 1.0000 $358,652.16 -$486,947.72 $4,602.28 $358,652.162 2241576 0.1648 $369,411.72 1.0000 $369,411.72 -$476,188.16 $15,361.84 $728,063.883 2241576 0.169744 $380,494.08 1.0000 $380,494.08 -$465,105.80 $26,444.20 $1,108,557.964 2241576 0.17483632 $391,908.90 1.0000 $391,908.90 -$453,690.98 $37,859.02 $1,500,466.865 2241576 0.18008141 $403,666.17 1.0000 $403,666.17 -$441,933.71 $49,616.29 $1,904,133.036 2241576 0.185483852 $415,776.15 1.0000 $415,776.15 -$429,823.73 $61,726.27 $2,319,909.187 2241576 0.191048367 $428,249.44 1.0000 $428,249.44 -$417,350.44 $74,199.56 $2,748,158.618 2241576 0.196779818 $441,096.92 1.0000 $441,096.92 -$404,502.96 $87,047.04 $3,189,255.539 2241576 0.202683213 $454,329.83 1.0000 $454,329.83 -$391,270.05 $100,279.95 $3,643,585.36
10 2241576 0.208763709 $467,959.72 1.0000 $467,959.72 -$377,640.16 $113,909.84 $4,111,545.0811 2241576 0.215026621 $481,998.51 1.0000 $481,998.51 -$363,601.37 $127,948.63 $4,593,543.5912 2241576 0.221477419 $496,458.47 1.0000 $496,458.47 -$349,141.41 $142,408.59 $5,090,002.0613 2241576 0.228121742 $511,352.22 1.0000 $511,352.22 -$334,247.66 $157,302.34 $5,601,354.2814 2241576 0.234965394 $526,692.79 1.0000 $526,692.79 $515,484.91 $515,484.91 $6,128,047.0715 2241576 0.242014356 $542,493.57 1.0000 $542,493.57 $531,285.69 $531,285.69 $6,670,540.6416 2241576 0.249274787 $558,768.38 1.0000 $558,768.38 $547,560.50 $547,560.50 $7,229,309.0217 2241576 0.25675303 $575,531.43 1.0000 $575,531.43 $564,323.55 $564,323.55 $7,804,840.4518 2241576 0.264455621 $592,797.37 1.0000 $592,797.37 $581,589.49 $581,589.49 $8,397,637.8219 2241576 0.27238929 $610,581.29 1.0000 $610,581.29 $599,373.41 $599,373.41 $9,008,219.1220 2241576 0.280560968 $628,898.73 1.0000 $628,898.73 $617,690.85 $617,690.85 $9,637,117.8521 2241576 0.288977798 $647,765.70 1.0000 $647,765.70 $636,557.82 $636,557.82 $10,284,883.5522 2241576 0.297647131 $667,198.67 1.0000 $667,198.67 $655,990.79 $655,990.79 $10,952,082.2123 2241576 0.306576545 $687,214.63 1.0000 $687,214.63 $676,006.75 $676,006.75 $11,639,296.8424 2241576 0.315773842 $707,831.07 1.0000 $707,831.07 $696,623.19 $696,623.19 $12,347,127.9025 2241576 0.325247057 $729,066.00 1.0000 $729,066.00 $717,858.12 $717,858.12 $13,076,193.9026 2241576 0.335004469 $750,937.98 1.0000 $750,937.98 $739,730.10 $739,730.10 $13,827,131.8827 2241576 0.345054603 $773,466.12 1.0000 $773,466.12 $762,258.24 $762,258.24 $14,600,597.9928 2241576 0.355406241 $796,670.10 1.0000 $796,670.10 $785,462.22 $785,462.22 $15,397,268.0929 2241576 0.366068428 $820,570.20 1.0000 $820,570.20 $809,362.32 $809,362.32 $16,217,838.3030 2241576 0.377050481 $845,187.31 1.0000 $845,187.31 $833,979.43 $833,979.43 $17,063,025.61
Totals 67247280 $17,063,025.61 $17,063,025.61* Discount Rate= 0.0%
Year Annual PV Annual O&M Total Annual Present Value Present Value Annual PV Annual O&M Total Annual Present Value Present ValueSys. Payment* Costs Costs Factor** of Costs Sys. Payment*** Costs Costs Factor** of Costs
0 $4,350,000.00 $0.00 $4,350,000.00 1.0000 $4,350,000.00 $0.00 $0.00 $0.00 1.0000 $0.00001 $342,842.00 $11,207.88 $354,049.88 1.0000 $354,049.88 $834,392.00 $11,207.88 $845,599.88 1.0000 $845,599.882 $342,842.00 $11,207.88 $354,049.88 1.0000 $354,049.88 $834,392.00 $11,207.88 $845,599.88 1.0000 $845,599.883 $342,842.00 $11,207.88 $354,049.88 1.0000 $354,049.88 $834,392.00 $11,207.88 $845,599.88 1.0000 $845,599.884 $342,842.00 $11,207.88 $354,049.88 1.0000 $354,049.88 $834,392.00 $11,207.88 $845,599.88 1.0000 $845,599.885 $342,842.00 $11,207.88 $354,049.88 1.0000 $354,049.88 $834,392.00 $11,207.88 $845,599.88 1.0000 $845,599.886 $342,842.00 $11,207.88 $354,049.88 1.0000 $354,049.88 $834,392.00 $11,207.88 $845,599.88 1.0000 $845,599.887 $342,842.00 $11,207.88 $354,049.88 1.0000 $354,049.88 $834,392.00 $11,207.88 $845,599.88 1.0000 $845,599.888 $342,842.00 $11,207.88 $354,049.88 1.0000 $354,049.88 $834,392.00 $11,207.88 $845,599.88 1.0000 $845,599.889 $342,842.00 $11,207.88 $354,049.88 1.0000 $354,049.88 $834,392.00 $11,207.88 $845,599.88 1.0000 $845,599.88
10 $342,842.00 $11,207.88 $354,049.88 1.0000 $354,049.88 $834,392.00 $11,207.88 $845,599.88 1.0000 $845,599.8811 $342,842.00 $11,207.88 $354,049.88 1.0000 $354,049.88 $834,392.00 $11,207.88 $845,599.88 1.0000 $845,599.8812 $342,842.00 $11,207.88 $354,049.88 1.0000 $354,049.88 $834,392.00 $11,207.88 $845,599.88 1.0000 $845,599.8813 $342,842.00 $11,207.88 $354,049.88 1.0000 $354,049.88 $834,392.00 $11,207.88 $845,599.88 1.0000 $845,599.8814 $0.00 $11,207.88 $11,207.88 1.0000 $11,207.88 $0.00 $11,207.88 $11,207.88 1.0000 $11,207.8815 $0.00 $11,207.88 $11,207.88 1.0000 $11,207.88 $0.00 $11,207.88 $11,207.88 1.0000 $11,207.8816 $0.00 $11,207.88 $11,207.88 1.0000 $11,207.88 $0.00 $11,207.88 $11,207.88 1.0000 $11,207.8817 $0.00 $11,207.88 $11,207.88 1.0000 $11,207.88 $0.00 $11,207.88 $11,207.88 1.0000 $11,207.8818 $0.00 $11,207.88 $11,207.88 1.0000 $11,207.88 $0.00 $11,207.88 $11,207.88 1.0000 $11,207.8819 $0.00 $11,207.88 $11,207.88 1.0000 $11,207.88 $0.00 $11,207.88 $11,207.88 1.0000 $11,207.8820 $0.00 $11,207.88 $11,207.88 1.0000 $11,207.88 $0.00 $11,207.88 $11,207.88 1.0000 $11,207.8821 $0.00 $11,207.88 $11,207.88 1.0000 $11,207.88 $0.00 $11,207.88 $11,207.88 1.0000 $11,207.8822 $0.00 $11,207.88 $11,207.88 1.0000 $11,207.88 $0.00 $11,207.88 $11,207.88 1.0000 $11,207.8823 $0.00 $11,207.88 $11,207.88 1.0000 $11,207.88 $0.00 $11,207.88 $11,207.88 1.0000 $11,207.8824 $0.00 $11,207.88 $11,207.88 1.0000 $11,207.88 $0.00 $11,207.88 $11,207.88 1.0000 $11,207.8825 $0.00 $11,207.88 $11,207.88 1.0000 $11,207.88 $0.00 $11,207.88 $11,207.88 1.0000 $11,207.8826 $0.00 $11,207.88 $11,207.88 1.0000 $11,207.88 $0.00 $11,207.88 $11,207.88 1.0000 $11,207.8827 $0.00 $11,207.88 $11,207.88 1.0000 $11,207.88 $0.00 $11,207.88 $11,207.88 1.0000 $11,207.8828 $0.00 $11,207.88 $11,207.88 1.0000 $11,207.88 $0.00 $11,207.88 $11,207.88 1.0000 $11,207.8829 $0.00 $11,207.88 $11,207.88 1.0000 $11,207.88 $0.00 $11,207.88 $11,207.88 1.0000 $11,207.8830 $0.00 $11,207.88 $11,207.88 1.0000 $11,207.88 $0.00 $11,207.88 $11,207.88 1.0000 $11,207.88
Totals $8,806,946.00 $336,236.40 $9,143,182.40 $9,143,182.40 $10,847,096.00 $336,236.40 $11,183,332.40 $11,183,332.40* Financing of $3,034,000 for 13 years at a 6% interest rate and $4,350,000 downpayment** Discount Rate = 0.0%*** Financing of $7,384,000 for 13 years at a 6% interest rate and $0.0 downpayment
Net Present Value of PV System = Present Value of Benefits - Present Worth of Costs= $17,063,025.61- $9,143,182.40= $7,919,843.21
Cost of Generation =Total kWh Generated over Life of System
= $9,143,182.4067247280 kWh
= $0.136 /kWh
Benefit-Cost Ratio =
= $17,063,025.61$9,143,182.40
= 1.866
Payback = The period of time required for the profit or other benefits of the system toequal the cost of the initial investment.
= Year 16
Baseline Financial Analysis 1MW Crystalline Silicon (Tracking) PV Power Station
Net Present Benefit of the PV SystemNet Present Cost of the PV System
Present Value of Benefits
Net Present Cost of PV System
Baseline Financial Analysis 1MW Crystalline Silicon (Tracking) PV Power Station
Baseline Financial Analysis 1MW Crystalline Silicon (Tracking) PV Power Station
Present Value of Costs w/o Downpayment
Net Cash Flows
Net Present Cost of PV System

Year kWh Ave. Cost Value of Present Value Present Value Net Cash Net Cash PaybackGenerated $/kWh Energy Factor* of Benefits Flow w/o DP Flow w/ DP (Cost=$7.184M)
0 $0.00 $0.00 1.0000 $0.00 $0.00 -$4,600,000.00 $0.001 1903050 0.16 $304,488.00 1.0000 $304,488.00 -$516,819.25 $2,980.75 $304,488.002 1903050 0.1648 $313,622.64 1.0000 $313,622.64 -$507,684.61 $12,115.39 $618,110.643 1903050 0.169744 $323,031.32 1.0000 $323,031.32 -$498,275.93 $21,524.07 $941,141.964 1903050 0.17483632 $332,722.26 1.0000 $332,722.26 -$488,584.99 $31,215.01 $1,273,864.225 1903050 0.18008141 $342,703.93 1.0000 $342,703.93 -$478,603.32 $41,196.68 $1,616,568.146 1903050 0.185483852 $352,985.04 1.0000 $352,985.04 -$468,322.21 $51,477.79 $1,969,553.197 1903050 0.191048367 $363,574.60 1.0000 $363,574.60 -$457,732.65 $62,067.35 $2,333,127.788 1903050 0.196779818 $374,481.83 1.0000 $374,481.83 -$446,825.42 $72,974.58 $2,707,609.629 1903050 0.202683213 $385,716.29 1.0000 $385,716.29 -$435,590.96 $84,209.04 $3,093,325.91
10 1903050 0.208763709 $397,287.78 1.0000 $397,287.78 -$424,019.47 $95,780.53 $3,490,613.6811 1903050 0.215026621 $409,206.41 1.0000 $409,206.41 -$412,100.84 $107,699.16 $3,899,820.0912 1903050 0.221477419 $421,482.60 1.0000 $421,482.60 -$399,824.65 $119,975.35 $4,321,302.7013 1903050 0.228121742 $434,127.08 1.0000 $434,127.08 -$387,180.17 $132,619.83 $4,755,429.7814 1903050 0.234965394 $447,150.89 1.0000 $447,150.89 $437,635.64 $437,635.64 $5,202,580.6715 1903050 0.242014356 $460,565.42 1.0000 $460,565.42 $451,050.17 $451,050.17 $5,663,146.0916 1903050 0.249274787 $474,382.38 1.0000 $474,382.38 $464,867.13 $464,867.13 $6,137,528.4717 1903050 0.25675303 $488,613.85 1.0000 $488,613.85 $479,098.60 $479,098.60 $6,626,142.3318 1903050 0.264455621 $503,272.27 1.0000 $503,272.27 $493,757.02 $493,757.02 $7,129,414.6019 1903050 0.27238929 $518,370.44 1.0000 $518,370.44 $508,855.19 $508,855.19 $7,647,785.0420 1903050 0.280560968 $533,921.55 1.0000 $533,921.55 $524,406.30 $524,406.30 $8,181,706.5921 1903050 0.288977798 $549,939.20 1.0000 $549,939.20 $540,423.95 $540,423.95 $8,731,645.7922 1903050 0.297647131 $566,437.37 1.0000 $566,437.37 $556,922.12 $556,922.12 $9,298,083.1623 1903050 0.306576545 $583,430.49 1.0000 $583,430.49 $573,915.24 $573,915.24 $9,881,513.6524 1903050 0.315773842 $600,933.41 1.0000 $600,933.41 $591,418.16 $591,418.16 $10,482,447.0625 1903050 0.325247057 $618,961.41 1.0000 $618,961.41 $609,446.16 $609,446.16 $11,101,408.4726 1903050 0.335004469 $637,530.25 1.0000 $637,530.25 $628,015.00 $628,015.00 $11,738,938.7327 1903050 0.345054603 $656,656.16 1.0000 $656,656.16 $647,140.91 $647,140.91 $12,395,594.8928 1903050 0.355406241 $676,355.85 1.0000 $676,355.85 $666,840.60 $666,840.60 $13,071,950.7429 1903050 0.366068428 $696,646.52 1.0000 $696,646.52 $687,131.27 $687,131.27 $13,768,597.2630 1903050 0.377050481 $717,545.92 1.0000 $717,545.92 $708,030.67 $708,030.67 $14,486,143.18
Totals 57091500 $14,486,143.18 $14,486,143.18* Discount Rate = 0.0%
Year Annual PV Annual O&M Total Annual Present Value Present Value Annual PV Annual O&M Total Annual Present Value Present ValueSys. Payment* Costs Costs Factor** of Costs Sys. Payment*** Costs Costs Factor** of Costs
0 $4,600,000.00 $0.00 $4,600,000.00 1.0000 $4,600,000.00 $0.00 $0.00 $0.00 1.0000 $0.001 $291,992.00 $9,515.25 $301,507.25 1.0000 $301,507.25 $811,792.00 $9,515.25 $821,307.25 1.0000 $821,307.252 $291,992.00 $9,515.25 $301,507.25 1.0000 $301,507.25 $811,792.00 $9,515.25 $821,307.25 1.0000 $821,307.253 $291,992.00 $9,515.25 $301,507.25 1.0000 $301,507.25 $811,792.00 $9,515.25 $821,307.25 1.0000 $821,307.254 $291,992.00 $9,515.25 $301,507.25 1.0000 $301,507.25 $811,792.00 $9,515.25 $821,307.25 1.0000 $821,307.255 $291,992.00 $9,515.25 $301,507.25 1.0000 $301,507.25 $811,792.00 $9,515.25 $821,307.25 1.0000 $821,307.256 $291,992.00 $9,515.25 $301,507.25 1.0000 $301,507.25 $811,792.00 $9,515.25 $821,307.25 1.0000 $821,307.257 $291,992.00 $9,515.25 $301,507.25 1.0000 $301,507.25 $811,792.00 $9,515.25 $821,307.25 1.0000 $821,307.258 $291,992.00 $9,515.25 $301,507.25 1.0000 $301,507.25 $811,792.00 $9,515.25 $821,307.25 1.0000 $821,307.259 $291,992.00 $9,515.25 $301,507.25 1.0000 $301,507.25 $811,792.00 $9,515.25 $821,307.25 1.0000 $821,307.25
10 $291,992.00 $9,515.25 $301,507.25 1.0000 $301,507.25 $811,792.00 $9,515.25 $821,307.25 1.0000 $821,307.2511 $291,992.00 $9,515.25 $301,507.25 1.0000 $301,507.25 $811,792.00 $9,515.25 $821,307.25 1.0000 $821,307.2512 $291,992.00 $9,515.25 $301,507.25 1.0000 $301,507.25 $811,792.00 $9,515.25 $821,307.25 1.0000 $821,307.2513 $291,992.00 $9,515.25 $301,507.25 1.0000 $301,507.25 $811,792.00 $9,515.25 $821,307.25 1.0000 $821,307.2514 $0.00 $9,515.25 $9,515.25 1.0000 $9,515.25 $0.00 $9,515.25 $9,515.25 1.0000 $9,515.2515 $0.00 $9,515.25 $9,515.25 1.0000 $9,515.25 $0.00 $9,515.25 $9,515.25 1.0000 $9,515.2516 $0.00 $9,515.25 $9,515.25 1.0000 $9,515.25 $0.00 $9,515.25 $9,515.25 1.0000 $9,515.2517 $0.00 $9,515.25 $9,515.25 1.0000 $9,515.25 $0.00 $9,515.25 $9,515.25 1.0000 $9,515.2518 $0.00 $9,515.25 $9,515.25 1.0000 $9,515.25 $0.00 $9,515.25 $9,515.25 1.0000 $9,515.2519 $0.00 $9,515.25 $9,515.25 1.0000 $9,515.25 $0.00 $9,515.25 $9,515.25 1.0000 $9,515.2520 $0.00 $9,515.25 $9,515.25 1.0000 $9,515.25 $0.00 $9,515.25 $9,515.25 1.0000 $9,515.2521 $0.00 $9,515.25 $9,515.25 1.0000 $9,515.25 $0.00 $9,515.25 $9,515.25 1.0000 $9,515.2522 $0.00 $9,515.25 $9,515.25 1.0000 $9,515.25 $0.00 $9,515.25 $9,515.25 1.0000 $9,515.2523 $0.00 $9,515.25 $9,515.25 1.0000 $9,515.25 $0.00 $9,515.25 $9,515.25 1.0000 $9,515.2524 $0.00 $9,515.25 $9,515.25 1.0000 $9,515.25 $0.00 $9,515.25 $9,515.25 1.0000 $9,515.2525 $0.00 $9,515.25 $9,515.25 1.0000 $9,515.25 $0.00 $9,515.25 $9,515.25 1.0000 $9,515.2526 $0.00 $9,515.25 $9,515.25 1.0000 $9,515.25 $0.00 $9,515.25 $9,515.25 1.0000 $9,515.2527 $0.00 $9,515.25 $9,515.25 1.0000 $9,515.25 $0.00 $9,515.25 $9,515.25 1.0000 $9,515.2528 $0.00 $9,515.25 $9,515.25 1.0000 $9,515.25 $0.00 $9,515.25 $9,515.25 1.0000 $9,515.2529 $0.00 $9,515.25 $9,515.25 1.0000 $9,515.25 $0.00 $9,515.25 $9,515.25 1.0000 $9,515.2530 $0.00 $9,515.25 $9,515.25 1.0000 $9,515.25 $0.00 $9,515.25 $9,515.25 1.0000 $9,515.25
Totals $8,395,896.00 $285,457.50 $8,681,353.50 $8,681,353.50 $10,553,296.00 $285,457.50 $10,838,753.50 $10,838,753.50* Financing of $2,584,000 for 13 years at a 6% interest rate and $4,600,000 downpayment** Discount Rate = 0.0%*** Financing of $7,184,000 for 13 years at a 6% interest rate and $0.0 downpayment
Net Present Value of PV System = Present Value of Benefits - Present Value of Costs= $14,486,143.18- $8,681,353.50= $5,804,789.68
Cost of Generation =Total kWh Generated over Life of System
= $8,681,353.5057091500 kWh
= $0.152 /kWh
Benefit-Cost Ratio =
= $14,486,143.18$8,681,353.50
= 1.669
Payback = The period of time required for the profit or other benefits of the system toequal the cost of the initial investment.
= Year 18
Baseline Financial Analysis 1MW Crystalline Silicon PV Power Station(Fixed System)
Net Present Cost of the PV System
Present Value of Benefits
Net Present Cost of PV System Present Value of Costs w/o Downpayment
Net Cash Flows
Net Present Cost of PV System
Net Present Benefit of the PV System
Baseline Financial Analysis 1MW Crystalline Silicon PV Power Station(Fixed System)
Baseline Financial Analysis 1MW Crystalline Silicon PV Power Station(Fixed System)

Year kWh Ave. Cost Value of Present Value Present Value Net Cash Net Cash PaybackGenerated $/kWh Energy Factor* of Benefits Flow w/o DP Flow w/ DP (Cost=$5.622M)
0 0 $0.00 1.0000 $0.00 $0.00 -$3,400,000.00 $0.001 1644958 0.16 $263,193.28 1.0000 $263,193.28 -$380,317.51 $3,882.49 $263,193.282 1644958 0.1648 $271,089.08 1.0000 $271,089.08 -$372,421.71 $11,778.29 $534,282.363 1644958 0.169744 $279,221.75 1.0000 $279,221.75 -$364,289.04 $19,910.96 $813,504.114 1644958 0.17483632 $287,598.40 1.0000 $287,598.40 -$355,912.39 $28,287.61 $1,101,102.515 1644958 0.18008141 $296,226.36 1.0000 $296,226.36 -$347,284.43 $36,915.57 $1,397,328.876 1644958 0.185483852 $305,113.15 1.0000 $305,113.15 -$338,397.64 $45,802.36 $1,702,442.017 1644958 0.191048367 $314,266.54 1.0000 $314,266.54 -$329,244.25 $54,955.75 $2,016,708.558 1644958 0.196779818 $323,694.54 1.0000 $323,694.54 -$319,816.25 $64,383.75 $2,340,403.099 1644958 0.202683213 $333,405.37 1.0000 $333,405.37 -$310,105.42 $74,094.58 $2,673,808.4610 1644958 0.208763709 $343,407.53 1.0000 $343,407.53 -$300,103.26 $84,096.74 $3,017,216.0011 1644958 0.215026621 $353,709.76 1.0000 $353,709.76 -$289,801.03 $94,398.97 $3,370,925.7612 1644958 0.221477419 $364,321.05 1.0000 $364,321.05 -$279,189.74 $105,010.26 $3,735,246.8113 1644958 0.228121742 $375,250.68 1.0000 $375,250.68 -$268,260.11 $115,939.89 $4,110,497.4914 1644958 0.234965394 $386,508.20 1.0000 $386,508.20 $378,283.41 $378,283.41 $4,497,005.7015 1644958 0.242014356 $398,103.45 1.0000 $398,103.45 $389,878.66 $389,878.66 $4,895,109.1516 1644958 0.249274787 $410,046.55 1.0000 $410,046.55 $401,821.76 $401,821.76 $5,305,155.7017 1644958 0.25675303 $422,347.95 1.0000 $422,347.95 $414,123.16 $414,123.16 $5,727,503.6618 1644958 0.264455621 $435,018.39 1.0000 $435,018.39 $426,793.60 $426,793.60 $6,162,522.0519 1644958 0.27238929 $448,068.94 1.0000 $448,068.94 $439,844.15 $439,844.15 $6,610,590.9920 1644958 0.280560968 $461,511.01 1.0000 $461,511.01 $453,286.22 $453,286.22 $7,072,102.00
Totals 32899160 $7,072,102.00 $7,072,102.00* Discount Rate = 0.0%
Year Annual PV Annual O&M Total Annual Present Value Present Value Annual PV Annual O&M Total Annual Present Value Present ValueSys. Payment* Costs Costs Factor** of Costs Sys. Payment*** Costs Costs Factor** of Costs
0 $3,400,000.00 $0.00 $3,400,000.00 1.0000 $3,400,000.00 $0.00 $0.00 $0.00 1.0000 $0.001 $251,086.00 $8,224.79 $259,310.79 1.0000 $259,310.79 $635,286.00 $8,224.79 $643,510.79 1.0000 $643,510.792 $251,086.00 $8,224.79 $259,310.79 1.0000 $259,310.79 $635,286.00 $8,224.79 $643,510.79 1.0000 $643,510.793 $251,086.00 $8,224.79 $259,310.79 1.0000 $259,310.79 $635,286.00 $8,224.79 $643,510.79 1.0000 $643,510.794 $251,086.00 $8,224.79 $259,310.79 1.0000 $259,310.79 $635,286.00 $8,224.79 $643,510.79 1.0000 $643,510.795 $251,086.00 $8,224.79 $259,310.79 1.0000 $259,310.79 $635,286.00 $8,224.79 $643,510.79 1.0000 $643,510.796 $251,086.00 $8,224.79 $259,310.79 1.0000 $259,310.79 $635,286.00 $8,224.79 $643,510.79 1.0000 $643,510.797 $251,086.00 $8,224.79 $259,310.79 1.0000 $259,310.79 $635,286.00 $8,224.79 $643,510.79 1.0000 $643,510.798 $251,086.00 $8,224.79 $259,310.79 1.0000 $259,310.79 $635,286.00 $8,224.79 $643,510.79 1.0000 $643,510.799 $251,086.00 $8,224.79 $259,310.79 1.0000 $259,310.79 $635,286.00 $8,224.79 $643,510.79 1.0000 $643,510.7910 $251,086.00 $8,224.79 $259,310.79 1.0000 $259,310.79 $635,286.00 $8,224.79 $643,510.79 1.0000 $643,510.7911 $251,086.00 $8,224.79 $259,310.79 1.0000 $259,310.79 $635,286.00 $8,224.79 $643,510.79 1.0000 $643,510.7912 $251,086.00 $8,224.79 $259,310.79 1.0000 $259,310.79 $635,286.00 $8,224.79 $643,510.79 1.0000 $643,510.7913 $251,086.00 $8,224.79 $259,310.79 1.0000 $259,310.79 $635,286.00 $8,224.79 $643,510.79 1.0000 $643,510.7914 $0.00 $8,224.79 $8,224.79 1.0000 $8,224.79 $0.00 $8,224.79 $8,224.79 1.0000 $8,224.7915 $0.00 $8,224.79 $8,224.79 1.0000 $8,224.79 $0.00 $8,224.79 $8,224.79 1.0000 $8,224.7916 $0.00 $8,224.79 $8,224.79 1.0000 $8,224.79 $0.00 $8,224.79 $8,224.79 1.0000 $8,224.7917 $0.00 $8,224.79 $8,224.79 1.0000 $8,224.79 $0.00 $8,224.79 $8,224.79 1.0000 $8,224.7918 $0.00 $8,224.79 $8,224.79 1.0000 $8,224.79 $0.00 $8,224.79 $8,224.79 1.0000 $8,224.7919 $0.00 $8,224.79 $8,224.79 1.0000 $8,224.79 $0.00 $8,224.79 $8,224.79 1.0000 $8,224.7920 $0.00 $8,224.79 $8,224.79 1.0000 $8,224.79 $0.00 $8,224.79 $8,224.79 1.0000 $8,224.79
Totals $6,664,118.00 $164,495.80 $6,828,613.80 $6,828,613.80 $8,258,718.00 $164,495.80 $8,423,213.80 $8,423,213.80* Financing of $2,222,000 for 13 years at a 6% interest rate and $3,400,000 downpayment** Discount Rate = 0.0%*** Financing of $5,622,000 for 13 years at a 6% interest rate and $0.00 downpayment
Net Present Value of PV System = Present Value of Benefits - Present Worth of Costs= $7,072,102.00- $6,828,613.80= $243,488.20
Cost of Generation =Total kWh Generated over Life of System
= $6,828,613.8032899160 kWh
= $0.208 /kWh
Benefit-Cost Ratio =
= $7,072,102.00$6,828,613.80
= 1.036
Payback = The period of time required for the profit or other benefits of the system toequal the cost of the initial investment.
= Year 16
Baseline Financial Analysis 1MW Amorphous Silicon PV Power Station
Net Cash Flows
Present Value of Costs w/o Downpayment
Net Present Cost of the PV System
Net Present Cost of PV System
Baseline Financial Analysis 1MW Amorphous Silicon PV Power Station
Baseline Financial Analysis 1MW Amorphous Silicon PV Power Station
Present Value of Benefits
Net Present Cost of PV System
Net Present Benefit of the PV System

Year kWh Ave. Cost Value of Present Value Present Value Net Cash Net Cash PaybackGenerated $/kWh Energy Factor* of Benefits Flow w/o DP Flow w/ DP (Cost=$3.837M)
0 0 1.0000 $0.00 $0.00 -$2,350,000.00 $0.001 1093952 0.16 $175,032.32 1.0000 $175,032.32 -$264,018.44 $1,531.56 $175,032.322 1093952 0.1648 $180,283.29 1.0000 $180,283.29 -$258,767.47 $6,782.53 $355,315.613 1093952 0.169744 $185,691.79 1.0000 $185,691.79 -$253,358.97 $12,191.03 $541,007.404 1093952 0.17483632 $191,262.54 1.0000 $191,262.54 -$247,788.22 $17,761.78 $732,269.945 1093952 0.18008141 $197,000.42 1.0000 $197,000.42 -$242,050.34 $23,499.66 $929,270.366 1093952 0.185483852 $202,910.43 1.0000 $202,910.43 -$236,140.33 $29,409.67 $1,132,180.797 1093952 0.191048367 $208,997.74 1.0000 $208,997.74 -$230,053.02 $35,496.98 $1,341,178.538 1093952 0.196779818 $215,267.68 1.0000 $215,267.68 -$223,783.08 $41,766.92 $1,556,446.219 1093952 0.202683213 $221,725.71 1.0000 $221,725.71 -$217,325.05 $48,224.95 $1,778,171.9110 1093952 0.208763709 $228,377.48 1.0000 $228,377.48 -$210,673.28 $54,876.72 $2,006,549.3911 1093952 0.215026621 $235,228.80 1.0000 $235,228.80 -$203,821.96 $61,728.04 $2,241,778.1912 1093952 0.221477419 $242,285.67 1.0000 $242,285.67 -$196,765.09 $68,784.91 $2,484,063.8613 1093952 0.228121742 $249,554.24 1.0000 $249,554.24 -$189,496.52 $76,053.48 $2,733,618.1014 1093952 0.234965394 $257,040.86 1.0000 $257,040.86 $251,571.10 $251,571.10 $2,990,658.9615 1093952 0.242014356 $264,752.09 1.0000 $264,752.09 $259,282.33 $259,282.33 $3,255,411.0516 1093952 0.249274787 $272,694.65 1.0000 $272,694.65 $267,224.89 $267,224.89 $3,528,105.7017 1093952 0.25675303 $280,875.49 1.0000 $280,875.49 $275,405.73 $275,405.73 $3,808,981.1918 1093952 0.264455621 $289,301.76 1.0000 $289,301.76 $283,832.00 $283,832.00 $4,098,282.9519 1093952 0.27238929 $297,980.81 1.0000 $297,980.81 $292,511.05 $292,511.05 $4,396,263.7520 1093952 0.280560968 $306,920.23 1.0000 $306,920.23 $301,450.47 $301,450.47 $4,703,183.9921 1093952 0.288977798 $316,127.84 1.0000 $316,127.84 $310,658.08 $310,658.08 $5,019,311.8322 1093952 0.297647131 $325,611.67 1.0000 $325,611.67 $320,141.91 $320,141.91 $5,344,923.5023 1093952 0.306576545 $335,380.03 1.0000 $335,380.03 $329,910.27 $329,910.27 $5,680,303.5324 1093952 0.315773842 $345,441.43 1.0000 $345,441.43 $339,971.67 $339,971.67 $6,025,744.9525 1093952 0.325247057 $355,804.67 1.0000 $355,804.67 $350,334.91 $350,334.91 $6,381,549.6226 1093952 0.335004469 $366,478.81 1.0000 $366,478.81 $361,009.05 $361,009.05 $6,748,028.4327 1093952 0.345054603 $377,473.17 1.0000 $377,473.17 $372,003.41 $372,003.41 $7,125,501.6028 1093952 0.355406241 $388,797.37 1.0000 $388,797.37 $383,327.61 $383,327.61 $7,514,298.9729 1093952 0.366068428 $400,461.29 1.0000 $400,461.29 $394,991.53 $394,991.53 $7,914,760.2630 1093952 0.377050481 $412,475.13 1.0000 $412,475.13 $407,005.37 $407,005.37 $8,327,235.39
Totals 32818560 $8,327,235.39 $8,327,235.39* Discount Rate= 0.0%
Year Annual PV Annual O&M Total Annual Present Value Present Value Annual PV Annual O&M Total Annual Present Value Present ValueSys. Payment* Costs Costs Factor** of Costs Sys. Payment*** Costs Costs Factor** of Costs
0 $2,350,000.00 $0.00 $2,350,000.00 1.0000 $2,350,000.00 $0.00 $0.00 $0.00 1.0000 $0.00001 $168,031.00 $5,469.76 $173,500.76 1.0000 $173,500.76 $433,581.00 $5,469.76 $439,050.76 1.0000 $439,050.762 $168,031.00 $5,469.76 $173,500.76 1.0000 $173,500.76 $433,581.00 $5,469.76 $439,050.76 1.0000 $439,050.763 $168,031.00 $5,469.76 $173,500.76 1.0000 $173,500.76 $433,581.00 $5,469.76 $439,050.76 1.0000 $439,050.764 $168,031.00 $5,469.76 $173,500.76 1.0000 $173,500.76 $433,581.00 $5,469.76 $439,050.76 1.0000 $439,050.765 $168,031.00 $5,469.76 $173,500.76 1.0000 $173,500.76 $433,581.00 $5,469.76 $439,050.76 1.0000 $439,050.766 $168,031.00 $5,469.76 $173,500.76 1.0000 $173,500.76 $433,581.00 $5,469.76 $439,050.76 1.0000 $439,050.767 $168,031.00 $5,469.76 $173,500.76 1.0000 $173,500.76 $433,581.00 $5,469.76 $439,050.76 1.0000 $439,050.768 $168,031.00 $5,469.76 $173,500.76 1.0000 $173,500.76 $433,581.00 $5,469.76 $439,050.76 1.0000 $439,050.769 $168,031.00 $5,469.76 $173,500.76 1.0000 $173,500.76 $433,581.00 $5,469.76 $439,050.76 1.0000 $439,050.7610 $168,031.00 $5,469.76 $173,500.76 1.0000 $173,500.76 $433,581.00 $5,469.76 $439,050.76 1.0000 $439,050.7611 $168,031.00 $5,469.76 $173,500.76 1.0000 $173,500.76 $433,581.00 $5,469.76 $439,050.76 1.0000 $439,050.7612 $168,031.00 $5,469.76 $173,500.76 1.0000 $173,500.76 $433,581.00 $5,469.76 $439,050.76 1.0000 $439,050.7613 $168,031.00 $5,469.76 $173,500.76 1.0000 $173,500.76 $433,581.00 $5,469.76 $439,050.76 1.0000 $439,050.7614 $0.00 $5,469.76 $5,469.76 1.0000 $5,469.76 $0.00 $5,469.76 $5,469.76 1.0000 $5,469.7615 $0.00 $5,469.76 $5,469.76 1.0000 $5,469.76 $0.00 $5,469.76 $5,469.76 1.0000 $5,469.7616 $0.00 $5,469.76 $5,469.76 1.0000 $5,469.76 $0.00 $5,469.76 $5,469.76 1.0000 $5,469.7617 $0.00 $5,469.76 $5,469.76 1.0000 $5,469.76 $0.00 $5,469.76 $5,469.76 1.0000 $5,469.7618 $0.00 $5,469.76 $5,469.76 1.0000 $5,469.76 $0.00 $5,469.76 $5,469.76 1.0000 $5,469.7619 $0.00 $5,469.76 $5,469.76 1.0000 $5,469.76 $0.00 $5,469.76 $5,469.76 1.0000 $5,469.7620 $0.00 $5,469.76 $5,469.76 1.0000 $5,469.76 $0.00 $5,469.76 $5,469.76 1.0000 $5,469.7621 $0.00 $5,469.76 $5,469.76 1.0000 $5,469.76 $0.00 $5,469.76 $5,469.76 1.0000 $5,469.7622 $0.00 $5,469.76 $5,469.76 1.0000 $5,469.76 $0.00 $5,469.76 $5,469.76 1.0000 $5,469.7623 $0.00 $5,469.76 $5,469.76 1.0000 $5,469.76 $0.00 $5,469.76 $5,469.76 1.0000 $5,469.7624 $0.00 $5,469.76 $5,469.76 1.0000 $5,469.76 $0.00 $5,469.76 $5,469.76 1.0000 $5,469.7625 $0.00 $5,469.76 $5,469.76 1.0000 $5,469.76 $0.00 $5,469.76 $5,469.76 1.0000 $5,469.7626 $0.00 $5,469.76 $5,469.76 1.0000 $5,469.76 $0.00 $5,469.76 $5,469.76 1.0000 $5,469.7627 $0.00 $5,469.76 $5,469.76 1.0000 $5,469.76 $0.00 $5,469.76 $5,469.76 1.0000 $5,469.7628 $0.00 $5,469.76 $5,469.76 1.0000 $5,469.76 $0.00 $5,469.76 $5,469.76 1.0000 $5,469.7629 $0.00 $5,469.76 $5,469.76 1.0000 $5,469.76 $0.00 $5,469.76 $5,469.76 1.0000 $5,469.7630 $0.00 $5,469.76 $5,469.76 1.0000 $5,469.76 $0.00 $5,469.76 $5,469.76 1.0000 $5,469.76
Totals $4,534,403.00 $164,092.80 $4,698,495.80 $4,698,495.80 $5,636,553.00 $164,092.80 $5,800,645.80 $5,800,645.80* Financing of $1,487,000 for 13 years at a 6% interest rate and $2,350,000 downpaymen** Discount Rate = 0.0%*** Financing of $3,837,000 for 13 years at a 6% interest rate and $0.0 downpayment
Net Present Value of PV System = Present Value of Benefits - Present Worth of Costs= $8,327,235.39- $4,698,495.80= $3,628,739.59
Cost of Generation =Total kWh Generated over Life of System
= $4,698,495.8032818560 kWh
= $0.143 /kWh
Benefit-Cost Ratio =
= $8,327,235.39$4,698,495.80
= 1.772
Payback = The period of time required for the profit or other benefits of the system toequal the cost of the initial investment.
= Year 17
Net Present Benefit of the PV SystemNet Present Cost of the PV System
Net Present Cost of PV System Present Value of Costs w/o Downpayment
Baseline Financial Analysis 500 kW Crystalline Silicon (Tracking) PV Power Station
Net Present Cost of PV System
Baseline Financial Analysis 500 kW Crystalline Silicon (Tracking) PV Power Station
Present Value of Benefits Net Cash Flows
Baseline Financial Analysis 500 kW Crystalline Silicon (Tracking) PV Power Station

Year kWh Ave. Cost Value of Present Value Present Value Net Cash Net Cash PaybackGenerated $/kWh Energy Factor* of Benefits Flow w/o DP Flow w/ DP (Cost=$3.672M)
0 $0.00 $0.00 1.0000 $0.00 $0.00 -$2,400,000.00 $0.001 929632 0.16 $148,741.12 1.0000 $148,741.12 -$270,843.04 $356.96 $148,741.122 929632 0.1648 $153,203.35 1.0000 $153,203.35 -$266,380.81 $4,819.19 $301,944.473 929632 0.169744 $157,799.45 1.0000 $157,799.45 -$261,784.71 $9,415.29 $459,743.934 929632 0.17483632 $162,533.44 1.0000 $162,533.44 -$257,050.72 $14,149.28 $622,277.375 929632 0.18008141 $167,409.44 1.0000 $167,409.44 -$252,174.72 $19,025.28 $789,686.816 929632 0.185483852 $172,431.72 1.0000 $172,431.72 -$247,152.44 $24,047.56 $962,118.537 929632 0.191048367 $177,604.68 1.0000 $177,604.68 -$241,979.48 $29,220.52 $1,139,723.218 929632 0.196779818 $182,932.82 1.0000 $182,932.82 -$236,651.34 $34,548.66 $1,322,656.029 929632 0.202683213 $188,420.80 1.0000 $188,420.80 -$231,163.36 $40,036.64 $1,511,076.82
10 929632 0.208763709 $194,073.42 1.0000 $194,073.42 -$225,510.74 $45,689.26 $1,705,150.2511 929632 0.215026621 $199,895.63 1.0000 $199,895.63 -$219,688.53 $51,511.47 $1,905,045.8812 929632 0.221477419 $205,892.50 1.0000 $205,892.50 -$213,691.66 $57,508.34 $2,110,938.3713 929632 0.228121742 $212,069.27 1.0000 $212,069.27 -$207,514.89 $63,685.11 $2,323,007.6414 929632 0.234965394 $218,431.35 1.0000 $218,431.35 $213,783.19 $213,783.19 $2,541,438.9915 929632 0.242014356 $224,984.29 1.0000 $224,984.29 $220,336.13 $220,336.13 $2,766,423.2816 929632 0.249274787 $231,733.82 1.0000 $231,733.82 $227,085.66 $227,085.66 $2,998,157.1017 929632 0.25675303 $238,685.83 1.0000 $238,685.83 $234,037.67 $234,037.67 $3,236,842.9318 929632 0.264455621 $245,846.41 1.0000 $245,846.41 $241,198.25 $241,198.25 $3,482,689.3419 929632 0.27238929 $253,221.80 1.0000 $253,221.80 $248,573.64 $248,573.64 $3,735,911.1420 929632 0.280560968 $260,818.45 1.0000 $260,818.45 $256,170.29 $256,170.29 $3,996,729.6021 929632 0.288977798 $268,643.01 1.0000 $268,643.01 $263,994.85 $263,994.85 $4,265,372.6022 929632 0.297647131 $276,702.30 1.0000 $276,702.30 $272,054.14 $272,054.14 $4,542,074.9023 929632 0.306576545 $285,003.37 1.0000 $285,003.37 $280,355.21 $280,355.21 $4,827,078.2724 929632 0.315773842 $293,553.47 1.0000 $293,553.47 $288,905.31 $288,905.31 $5,120,631.7425 929632 0.325247057 $302,360.07 1.0000 $302,360.07 $297,711.91 $297,711.91 $5,422,991.8126 929632 0.335004469 $311,430.87 1.0000 $311,430.87 $306,782.71 $306,782.71 $5,734,422.6827 929632 0.345054603 $320,773.80 1.0000 $320,773.80 $316,125.64 $316,125.64 $6,055,196.4828 929632 0.355406241 $330,397.01 1.0000 $330,397.01 $325,748.85 $325,748.85 $6,385,593.5029 929632 0.366068428 $340,308.92 1.0000 $340,308.92 $335,660.76 $335,660.76 $6,725,902.4230 929632 0.377050481 $350,518.19 1.0000 $350,518.19 $345,870.03 $345,870.03 $7,076,420.62
Totals 27888960 $7,076,420.62 $7,076,420.62* Discount Rate = 0.0%
Year Annual PV Annual O&M Total Annual Present Value Present Value Annual PV Annual O&M Total Annual Present Value Present ValueSys. Payment* Costs Costs Factor** of Costs Sys. Payment*** Costs Costs Factor** of Costs
0 $2,400,000.00 $0.00 $2,400,000.00 1.0000 $2,400,000.00 $0.00 $0.00 $0.00 1.0000 $0.001 $143,736.00 $4,648.16 $148,384.16 1.0000 $148,384.16 $414,936.00 $4,648.16 $419,584.16 1.0000 $419,584.162 $143,736.00 $4,648.16 $148,384.16 1.0000 $148,384.16 $414,936.00 $4,648.16 $419,584.16 1.0000 $419,584.163 $143,736.00 $4,648.16 $148,384.16 1.0000 $148,384.16 $414,936.00 $4,648.16 $419,584.16 1.0000 $419,584.164 $143,736.00 $4,648.16 $148,384.16 1.0000 $148,384.16 $414,936.00 $4,648.16 $419,584.16 1.0000 $419,584.165 $143,736.00 $4,648.16 $148,384.16 1.0000 $148,384.16 $414,936.00 $4,648.16 $419,584.16 1.0000 $419,584.166 $143,736.00 $4,648.16 $148,384.16 1.0000 $148,384.16 $414,936.00 $4,648.16 $419,584.16 1.0000 $419,584.167 $143,736.00 $4,648.16 $148,384.16 1.0000 $148,384.16 $414,936.00 $4,648.16 $419,584.16 1.0000 $419,584.168 $143,736.00 $4,648.16 $148,384.16 1.0000 $148,384.16 $414,936.00 $4,648.16 $419,584.16 1.0000 $419,584.169 $143,736.00 $4,648.16 $148,384.16 1.0000 $148,384.16 $414,936.00 $4,648.16 $419,584.16 1.0000 $419,584.16
10 $143,736.00 $4,648.16 $148,384.16 1.0000 $148,384.16 $414,936.00 $4,648.16 $419,584.16 1.0000 $419,584.1611 $143,736.00 $4,648.16 $148,384.16 1.0000 $148,384.16 $414,936.00 $4,648.16 $419,584.16 1.0000 $419,584.1612 $143,736.00 $4,648.16 $148,384.16 1.0000 $148,384.16 $414,936.00 $4,648.16 $419,584.16 1.0000 $419,584.1613 $143,736.00 $4,648.16 $148,384.16 1.0000 $148,384.16 $414,936.00 $4,648.16 $419,584.16 1.0000 $419,584.1614 $0.00 $4,648.16 $4,648.16 1.0000 $4,648.16 $0.00 $4,648.16 $4,648.16 1.0000 $4,648.1615 $0.00 $4,648.16 $4,648.16 1.0000 $4,648.16 $0.00 $4,648.16 $4,648.16 1.0000 $4,648.1616 $0.00 $4,648.16 $4,648.16 1.0000 $4,648.16 $0.00 $4,648.16 $4,648.16 1.0000 $4,648.1617 $0.00 $4,648.16 $4,648.16 1.0000 $4,648.16 $0.00 $4,648.16 $4,648.16 1.0000 $4,648.1618 $0.00 $4,648.16 $4,648.16 1.0000 $4,648.16 $0.00 $4,648.16 $4,648.16 1.0000 $4,648.1619 $0.00 $4,648.16 $4,648.16 1.0000 $4,648.16 $0.00 $4,648.16 $4,648.16 1.0000 $4,648.1620 $0.00 $4,648.16 $4,648.16 1.0000 $4,648.16 $0.00 $4,648.16 $4,648.16 1.0000 $4,648.1621 $0.00 $4,648.16 $4,648.16 1.0000 $4,648.16 $0.00 $4,648.16 $4,648.16 1.0000 $4,648.1622 $0.00 $4,648.16 $4,648.16 1.0000 $4,648.16 $0.00 $4,648.16 $4,648.16 1.0000 $4,648.1623 $0.00 $4,648.16 $4,648.16 1.0000 $4,648.16 $0.00 $4,648.16 $4,648.16 1.0000 $4,648.1624 $0.00 $4,648.16 $4,648.16 1.0000 $4,648.16 $0.00 $4,648.16 $4,648.16 1.0000 $4,648.1625 $0.00 $4,648.16 $4,648.16 1.0000 $4,648.16 $0.00 $4,648.16 $4,648.16 1.0000 $4,648.1626 $0.00 $4,648.16 $4,648.16 1.0000 $4,648.16 $0.00 $4,648.16 $4,648.16 1.0000 $4,648.1627 $0.00 $4,648.16 $4,648.16 1.0000 $4,648.16 $0.00 $4,648.16 $4,648.16 1.0000 $4,648.1628 $0.00 $4,648.16 $4,648.16 1.0000 $4,648.16 $0.00 $4,648.16 $4,648.16 1.0000 $4,648.1629 $0.00 $4,648.16 $4,648.16 1.0000 $4,648.16 $0.00 $4,648.16 $4,648.16 1.0000 $4,648.1630 $0.00 $4,648.16 $4,648.16 1.0000 $4,648.16 $0.00 $4,648.16 $4,648.16 1.0000 $4,648.16
Totals $4,268,568.00 $139,444.80 $4,408,012.80 $4,408,012.80 $5,394,168.00 $139,444.80 $5,533,612.80 $5,533,612.80* Financing of $1,272,000 for 13 years at a 6% interest rate and $2,400,000 downpayment** Discount Rate = 0.0%*** Financing of $3,672,000 for 13 years at a 6% interest rate and $0.0 downpayment
Net Present Value of PV System = Present Value of Benefits - Present Value of Costs= $7,076,420.62- $4,408,012.80= $2,668,407.82
Cost of Generation =Total kWh Generated over Life of System
= $4,408,012.8027888960 kWh
= $0.158 /kWh
Benefit-Cost Ratio =
= $7,076,420.62$4,408,012.80
= 1.605
Payback = The period of time required for the profit or other benefits of the system toequal the cost of the initial investment.
= Year 18
Net Present Benefit of the PV SystemNet Present Cost of the PV System
Baseline Financial Analysis 500 kW Crystalline Silicon PV Power Station(Fixed System)
Net Present Cost of PV System
Baseline Financial Analysis 500 kW Crystalline Silicon PV Power Station(Fixed System)
Net Present Cost of PV System Present Value of Costs w/o Downpayment
Baseline Financial Analysis 500 kW Crystalline Silicon PV Power Station(Fixed System)
Present Value of Benefits Net Cash Flows

Year kWh Ave. Cost Value of Present Value Present Value Net Cash Net Cash PaybackGenerated $/kWh Energy Factor* of Benefits Flow w/o DP Flow w/ DP (Cost=$2.903M)
0 0 $0.00 1.0000 $0.00 $0.00 -$1,800,000.00 $0.001 810982 0.16 $129,757.12 1.0000 $129,757.12 -$202,336.79 $1,063.21 $129,757.122 810982 0.1648 $133,649.83 1.0000 $133,649.83 -$198,444.08 $4,955.92 $263,406.953 810982 0.169744 $137,659.33 1.0000 $137,659.33 -$194,434.58 $8,965.42 $401,066.284 810982 0.17483632 $141,789.11 1.0000 $141,789.11 -$190,304.80 $13,095.20 $542,855.395 810982 0.18008141 $146,042.78 1.0000 $146,042.78 -$186,051.13 $17,348.87 $688,898.176 810982 0.185483852 $150,424.07 1.0000 $150,424.07 -$181,669.84 $21,730.16 $839,322.247 810982 0.191048367 $154,936.79 1.0000 $154,936.79 -$177,157.12 $26,242.88 $994,259.028 810982 0.196779818 $159,584.89 1.0000 $159,584.89 -$172,509.02 $30,890.98 $1,153,843.929 810982 0.202683213 $164,372.44 1.0000 $164,372.44 -$167,721.47 $35,678.53 $1,318,216.3510 810982 0.208763709 $169,303.61 1.0000 $169,303.61 -$162,790.30 $40,609.70 $1,487,519.9611 810982 0.215026621 $174,382.72 1.0000 $174,382.72 -$157,711.19 $45,688.81 $1,661,902.6812 810982 0.221477419 $179,614.20 1.0000 $179,614.20 -$152,479.71 $50,920.29 $1,841,516.8813 810982 0.228121742 $185,002.63 1.0000 $185,002.63 -$147,091.28 $56,308.72 $2,026,519.5114 810982 0.234965394 $190,552.71 1.0000 $190,552.71 $186,497.80 $186,497.80 $2,217,072.2115 810982 0.242014356 $196,269.29 1.0000 $196,269.29 $192,214.38 $192,214.38 $2,413,341.5016 810982 0.249274787 $202,157.37 1.0000 $202,157.37 $198,102.46 $198,102.46 $2,615,498.8717 810982 0.25675303 $208,222.09 1.0000 $208,222.09 $204,167.18 $204,167.18 $2,823,720.9518 810982 0.264455621 $214,468.75 1.0000 $214,468.75 $210,413.84 $210,413.84 $3,038,189.7019 810982 0.27238929 $220,902.81 1.0000 $220,902.81 $216,847.90 $216,847.90 $3,259,092.5120 810982 0.280560968 $227,529.90 1.0000 $227,529.90 $223,474.99 $223,474.99 $3,486,622.41
Totals 16219640 $3,486,622.41 $3,486,622.41* Discount Rate = 0.0%
Year Annual PV Annual O&M Total Annual Present Value Present Value Annual PV Annual O&M Total Annual Present Value Present ValueSys. Payment* Costs Costs Factor** of Costs Sys. Payment*** Costs Costs Factor** of Costs
0 $1,800,000.00 $0.00 $1,800,000.00 1.0000 $1,800,000.00 $0.00 $0.00 $0.00 1.0000 $0.001 $124,639.00 $4,054.91 $128,693.91 1.0000 $128,693.91 $328,039.00 $4,054.91 $332,093.91 1.0000 $332,093.912 $124,639.00 $4,054.91 $128,693.91 1.0000 $128,693.91 $328,039.00 $4,054.91 $332,093.91 1.0000 $332,093.913 $124,639.00 $4,054.91 $128,693.91 1.0000 $128,693.91 $328,039.00 $4,054.91 $332,093.91 1.0000 $332,093.914 $124,639.00 $4,054.91 $128,693.91 1.0000 $128,693.91 $328,039.00 $4,054.91 $332,093.91 1.0000 $332,093.915 $124,639.00 $4,054.91 $128,693.91 1.0000 $128,693.91 $328,039.00 $4,054.91 $332,093.91 1.0000 $332,093.916 $124,639.00 $4,054.91 $128,693.91 1.0000 $128,693.91 $328,039.00 $4,054.91 $332,093.91 1.0000 $332,093.917 $124,639.00 $4,054.91 $128,693.91 1.0000 $128,693.91 $328,039.00 $4,054.91 $332,093.91 1.0000 $332,093.918 $124,639.00 $4,054.91 $128,693.91 1.0000 $128,693.91 $328,039.00 $4,054.91 $332,093.91 1.0000 $332,093.919 $124,639.00 $4,054.91 $128,693.91 1.0000 $128,693.91 $328,039.00 $4,054.91 $332,093.91 1.0000 $332,093.9110 $124,639.00 $4,054.91 $128,693.91 1.0000 $128,693.91 $328,039.00 $4,054.91 $332,093.91 1.0000 $332,093.9111 $124,639.00 $4,054.91 $128,693.91 1.0000 $128,693.91 $328,039.00 $4,054.91 $332,093.91 1.0000 $332,093.9112 $124,639.00 $4,054.91 $128,693.91 1.0000 $128,693.91 $328,039.00 $4,054.91 $332,093.91 1.0000 $332,093.9113 $124,639.00 $4,054.91 $128,693.91 1.0000 $128,693.91 $328,039.00 $4,054.91 $332,093.91 1.0000 $332,093.9114 $0.00 $4,054.91 $4,054.91 1.0000 $4,054.91 $0.00 $4,054.91 $4,054.91 1.0000 $4,054.9115 $0.00 $4,054.91 $4,054.91 1.0000 $4,054.91 $0.00 $4,054.91 $4,054.91 1.0000 $4,054.9116 $0.00 $4,054.91 $4,054.91 1.0000 $4,054.91 $0.00 $4,054.91 $4,054.91 1.0000 $4,054.9117 $0.00 $4,054.91 $4,054.91 1.0000 $4,054.91 $0.00 $4,054.91 $4,054.91 1.0000 $4,054.9118 $0.00 $4,054.91 $4,054.91 1.0000 $4,054.91 $0.00 $4,054.91 $4,054.91 1.0000 $4,054.9119 $0.00 $4,054.91 $4,054.91 1.0000 $4,054.91 $0.00 $4,054.91 $4,054.91 1.0000 $4,054.9120 $0.00 $4,054.91 $4,054.91 1.0000 $4,054.91 $0.00 $4,054.91 $4,054.91 1.0000 $4,054.91
Totals $3,420,307.00 $81,098.20 $3,501,405.20 $3,501,405.20 $4,264,507.00 $81,098.20 $4,345,605.20 $4,345,605.20* Financing of $1,103,000 for 13 years at a 6% interest rate and $1,800,000 downpayment** Discount Rate = 0.0%*** Financing of $2,903,000 for 13 years at a 6% interest rate and $0.00 downpayment
Net Present Value of PV System = Present Value of Benefits - Present Worth of Costs= $3,486,622.41- $3,501,405.20= -$14,782.79
Cost of Generation =Total kWh Generated over Life of System
= $3,501,405.2016219640 kWh
= $0.216 /kWh
Benefit-Cost Ratio =
= $3,486,622.41$3,501,405.20
= 0.996
Payback = The period of time required for the profit or other benefits of the system toequal the cost of the initial investment.
= Year 17
Net Present Benefit of the PV SystemNet Present Cost of the PV System
Net Present Cost of PV System Present Value of Costs w/o Downpayment
Baseline Financial Analysis 500 kW Amorphous Silicon PV Power Station
Net Present Cost of PV System
Baseline Financial Analysis 500 kW Amorphous Silicon PV Power Station
Present Value of Benefits Net Cash Flows
Baseline Financial Analysis 500 kW Amorphous Silicon PV Power Station

Year kWh Ave. Cost Value of Present Value Present Value Net Cash Net Cash PaybackGenerated $/kWh Energy Factor* of Benefits Flow w/o DP Flow w/ DP (Cost=$1.559M)
0 0 1.0000 $0.00 $0.00 -$1,000,000.00 $0.001 433535 0.16 $69,365.60 1.0000 $69,365.60 -$108,969.08 $4,030.93 $69,365.602 433535 0.1648 $71,446.57 1.0000 $71,446.57 -$106,888.11 $6,111.89 $140,812.173 433535 0.169744 $73,589.97 1.0000 $73,589.97 -$104,744.71 $8,255.29 $214,402.134 433535 0.17483632 $75,797.66 1.0000 $75,797.66 -$102,537.01 $10,462.99 $290,199.805 433535 0.18008141 $78,071.59 1.0000 $78,071.59 -$100,263.08 $12,736.92 $368,271.396 433535 0.185483852 $80,413.74 1.0000 $80,413.74 -$97,920.93 $15,079.07 $448,685.137 433535 0.191048367 $82,826.15 1.0000 $82,826.15 -$95,508.52 $17,491.48 $531,511.298 433535 0.196779818 $85,310.94 1.0000 $85,310.94 -$93,023.74 $19,976.26 $616,822.239 433535 0.202683213 $87,870.27 1.0000 $87,870.27 -$90,464.41 $22,535.59 $704,692.4910 433535 0.208763709 $90,506.37 1.0000 $90,506.37 -$87,828.30 $25,171.70 $795,198.8711 433535 0.215026621 $93,221.57 1.0000 $93,221.57 -$85,113.11 $27,886.89 $888,420.4312 433535 0.221477419 $96,018.21 1.0000 $96,018.21 -$82,316.46 $30,683.54 $984,438.6513 433535 0.228121742 $98,898.76 1.0000 $98,898.76 -$79,435.92 $33,564.08 $1,083,337.4114 433535 0.234965394 $101,865.72 1.0000 $101,865.72 $99,698.05 $99,698.05 $1,185,203.1315 433535 0.242014356 $104,921.69 1.0000 $104,921.69 $102,754.02 $102,754.02 $1,290,124.8216 433535 0.249274787 $108,069.34 1.0000 $108,069.34 $105,901.67 $105,901.67 $1,398,194.1717 433535 0.25675303 $111,311.42 1.0000 $111,311.42 $109,143.75 $109,143.75 $1,509,505.5918 433535 0.264455621 $114,650.77 1.0000 $114,650.77 $112,483.09 $112,483.09 $1,624,156.3619 433535 0.27238929 $118,090.29 1.0000 $118,090.29 $115,922.62 $115,922.62 $1,742,246.6520 433535 0.280560968 $121,633.00 1.0000 $121,633.00 $119,465.32 $119,465.32 $1,863,879.6521 433535 0.288977798 $125,281.99 1.0000 $125,281.99 $123,114.31 $123,114.31 $1,989,161.6422 433535 0.297647131 $129,040.45 1.0000 $129,040.45 $126,872.77 $126,872.77 $2,118,202.0923 433535 0.306576545 $132,911.66 1.0000 $132,911.66 $130,743.99 $130,743.99 $2,251,113.7524 433535 0.315773842 $136,899.01 1.0000 $136,899.01 $134,731.34 $134,731.34 $2,388,012.7625 433535 0.325247057 $141,005.98 1.0000 $141,005.98 $138,838.31 $138,838.31 $2,529,018.7526 433535 0.335004469 $145,236.16 1.0000 $145,236.16 $143,068.49 $143,068.49 $2,674,254.9127 433535 0.345054603 $149,593.25 1.0000 $149,593.25 $147,425.57 $147,425.57 $2,823,848.1528 433535 0.355406241 $154,081.04 1.0000 $154,081.04 $151,913.37 $151,913.37 $2,977,929.2029 433535 0.366068428 $158,703.48 1.0000 $158,703.48 $156,535.80 $156,535.80 $3,136,632.6830 433535 0.377050481 $163,464.58 1.0000 $163,464.58 $161,296.91 $161,296.91 $3,300,097.26
Totals 13006050 $3,300,097.26 $3,300,097.26* Discount Rate= 0.0%
Year Annual PV Annual O&M Total Annual Present Value Present Value Annual PV Annual O&M Total Annual Present Value Present ValueSys. Payment* Costs Costs Factor** of Costs Sys. Payment*** Costs Costs Factor** of Costs
0 $1,000,000.00 $0.00 $1,000,000.00 1.0000 $1,000,000.00 $0.00 $0.00 $0.00 1.0000 $0.00001 $63,167.00 $2,167.68 $65,334.68 1.0000 $65,334.68 $176,167.00 $2,167.68 $178,334.68 1.0000 $178,334.682 $63,167.00 $2,167.68 $65,334.68 1.0000 $65,334.68 $176,167.00 $2,167.68 $178,334.68 1.0000 $178,334.683 $63,167.00 $2,167.68 $65,334.68 1.0000 $65,334.68 $176,167.00 $2,167.68 $178,334.68 1.0000 $178,334.684 $63,167.00 $2,167.68 $65,334.68 1.0000 $65,334.68 $176,167.00 $2,167.68 $178,334.68 1.0000 $178,334.685 $63,167.00 $2,167.68 $65,334.68 1.0000 $65,334.68 $176,167.00 $2,167.68 $178,334.68 1.0000 $178,334.686 $63,167.00 $2,167.68 $65,334.68 1.0000 $65,334.68 $176,167.00 $2,167.68 $178,334.68 1.0000 $178,334.687 $63,167.00 $2,167.68 $65,334.68 1.0000 $65,334.68 $176,167.00 $2,167.68 $178,334.68 1.0000 $178,334.688 $63,167.00 $2,167.68 $65,334.68 1.0000 $65,334.68 $176,167.00 $2,167.68 $178,334.68 1.0000 $178,334.689 $63,167.00 $2,167.68 $65,334.68 1.0000 $65,334.68 $176,167.00 $2,167.68 $178,334.68 1.0000 $178,334.6810 $63,167.00 $2,167.68 $65,334.68 1.0000 $65,334.68 $176,167.00 $2,167.68 $178,334.68 1.0000 $178,334.6811 $63,167.00 $2,167.68 $65,334.68 1.0000 $65,334.68 $176,167.00 $2,167.68 $178,334.68 1.0000 $178,334.6812 $63,167.00 $2,167.68 $65,334.68 1.0000 $65,334.68 $176,167.00 $2,167.68 $178,334.68 1.0000 $178,334.6813 $63,167.00 $2,167.68 $65,334.68 1.0000 $65,334.68 $176,167.00 $2,167.68 $178,334.68 1.0000 $178,334.6814 $0.00 $2,167.68 $2,167.68 1.0000 $2,167.68 $0.00 $2,167.68 $2,167.68 1.0000 $2,167.6815 $0.00 $2,167.68 $2,167.68 1.0000 $2,167.68 $0.00 $2,167.68 $2,167.68 1.0000 $2,167.6816 $0.00 $2,167.68 $2,167.68 1.0000 $2,167.68 $0.00 $2,167.68 $2,167.68 1.0000 $2,167.6817 $0.00 $2,167.68 $2,167.68 1.0000 $2,167.68 $0.00 $2,167.68 $2,167.68 1.0000 $2,167.6818 $0.00 $2,167.68 $2,167.68 1.0000 $2,167.68 $0.00 $2,167.68 $2,167.68 1.0000 $2,167.6819 $0.00 $2,167.68 $2,167.68 1.0000 $2,167.68 $0.00 $2,167.68 $2,167.68 1.0000 $2,167.6820 $0.00 $2,167.68 $2,167.68 1.0000 $2,167.68 $0.00 $2,167.68 $2,167.68 1.0000 $2,167.6821 $0.00 $2,167.68 $2,167.68 1.0000 $2,167.68 $0.00 $2,167.68 $2,167.68 1.0000 $2,167.6822 $0.00 $2,167.68 $2,167.68 1.0000 $2,167.68 $0.00 $2,167.68 $2,167.68 1.0000 $2,167.6823 $0.00 $2,167.68 $2,167.68 1.0000 $2,167.68 $0.00 $2,167.68 $2,167.68 1.0000 $2,167.6824 $0.00 $2,167.68 $2,167.68 1.0000 $2,167.68 $0.00 $2,167.68 $2,167.68 1.0000 $2,167.6825 $0.00 $2,167.68 $2,167.68 1.0000 $2,167.68 $0.00 $2,167.68 $2,167.68 1.0000 $2,167.6826 $0.00 $2,167.68 $2,167.68 1.0000 $2,167.68 $0.00 $2,167.68 $2,167.68 1.0000 $2,167.6827 $0.00 $2,167.68 $2,167.68 1.0000 $2,167.68 $0.00 $2,167.68 $2,167.68 1.0000 $2,167.6828 $0.00 $2,167.68 $2,167.68 1.0000 $2,167.68 $0.00 $2,167.68 $2,167.68 1.0000 $2,167.6829 $0.00 $2,167.68 $2,167.68 1.0000 $2,167.68 $0.00 $2,167.68 $2,167.68 1.0000 $2,167.6830 $0.00 $2,167.68 $2,167.68 1.0000 $2,167.68 $0.00 $2,167.68 $2,167.68 1.0000 $2,167.68
Totals $1,821,171.00 $65,030.25 $1,886,201.25 $1,886,201.25 $2,290,171.00 $65,030.25 $2,355,201.25 $2,355,201.25* Financing of $559,000 for 13 years at a 6% interest rate and $1,00,000 downpaymen** Discount Rate = 0.0%*** Financing of $1,559,000 for 13 years at a 6% interest rate and $0.0 downpayment
Net Present Value of PV System = Present Value of Benefits - Present Worth of Costs= $3,300,097.26- $1,886,201.25= $1,413,896.01
Cost of Generation =Total kWh Generated over Life of System
= $1,886,201.2513006050 kWh
= $0.145 /kWh
Benefit-Cost Ratio =
= $3,300,097.26$1,886,201.25
= 1.750
Payback = The period of time required for the profit or other benefits of the system toequal the cost of the initial investment.
= Year 17
Baseline Financial Analysis 200 kW Crystalline Silicon (Tracking) PV Power Station
Present Value of Benefits Net Cash Flows
Baseline Financial Analysis 200 kW Crystalline Silicon (Tracking) PV Power Station
Net Present Benefit of the PV SystemNet Present Cost of the PV System
Net Present Cost of PV System Present Value of Costs w/o Downpayment
Baseline Financial Analysis 200 kW Crystalline Silicon (Tracking) PV Power Station
Net Present Cost of PV System

Year kWh Ave. Cost Value of Present Value Present Value Net Cash Net Cash PaybackGenerated $/kWh Energy Factor* of Benefits Flow w/o DP Flow w/ DP (Cost=$1.529M)
0 0.00 $0.00 1.0000 $0.00 $0.00 -$1,050,000.00 $0.001 368664 0.16 $58,986.24 1.0000 $58,986.24 -$115,634.08 $3,015.92 $58,986.242 368664 0.1648 $60,755.83 1.0000 $60,755.83 -$113,864.49 $4,785.51 $119,742.073 368664 0.169744 $62,578.50 1.0000 $62,578.50 -$112,041.82 $6,608.18 $182,320.574 368664 0.17483632 $64,455.86 1.0000 $64,455.86 -$110,164.46 $8,485.54 $246,776.435 368664 0.18008141 $66,389.53 1.0000 $66,389.53 -$108,230.79 $10,419.21 $313,165.966 368664 0.185483852 $68,381.22 1.0000 $68,381.22 -$106,239.10 $12,410.90 $381,547.187 368664 0.191048367 $70,432.66 1.0000 $70,432.66 -$104,187.66 $14,462.34 $451,979.838 368664 0.196779818 $72,545.63 1.0000 $72,545.63 -$102,074.69 $16,575.31 $524,525.479 368664 0.202683213 $74,722.00 1.0000 $74,722.00 -$99,898.32 $18,751.68 $599,247.47
10 368664 0.208763709 $76,963.66 1.0000 $76,963.66 -$97,656.66 $20,993.34 $676,211.1411 368664 0.215026621 $79,272.57 1.0000 $79,272.57 -$95,347.75 $23,302.25 $755,483.7112 368664 0.221477419 $81,650.75 1.0000 $81,650.75 -$92,969.57 $25,680.43 $837,134.4613 368664 0.228121742 $84,100.27 1.0000 $84,100.27 -$90,520.05 $28,129.95 $921,234.7414 368664 0.234965394 $86,623.28 1.0000 $86,623.28 $84,779.96 $84,779.96 $1,007,858.0215 368664 0.242014356 $89,221.98 1.0000 $89,221.98 $87,378.66 $87,378.66 $1,097,080.0016 368664 0.249274787 $91,898.64 1.0000 $91,898.64 $90,055.32 $90,055.32 $1,188,978.6417 368664 0.25675303 $94,655.60 1.0000 $94,655.60 $92,812.28 $92,812.28 $1,283,634.2418 368664 0.264455621 $97,495.27 1.0000 $97,495.27 $95,651.95 $95,651.95 $1,381,129.5019 368664 0.27238929 $100,420.13 1.0000 $100,420.13 $98,576.81 $98,576.81 $1,481,549.6320 368664 0.280560968 $103,432.73 1.0000 $103,432.73 $101,589.41 $101,589.41 $1,584,982.3621 368664 0.288977798 $106,535.71 1.0000 $106,535.71 $104,692.39 $104,692.39 $1,691,518.0722 368664 0.297647131 $109,731.78 1.0000 $109,731.78 $107,888.46 $107,888.46 $1,801,249.8523 368664 0.306576545 $113,023.74 1.0000 $113,023.74 $111,180.42 $111,180.42 $1,914,273.5924 368664 0.315773842 $116,414.45 1.0000 $116,414.45 $114,571.13 $114,571.13 $2,030,688.0325 368664 0.325247057 $119,906.88 1.0000 $119,906.88 $118,063.56 $118,063.56 $2,150,594.9226 368664 0.335004469 $123,504.09 1.0000 $123,504.09 $121,660.77 $121,660.77 $2,274,099.0027 368664 0.345054603 $127,209.21 1.0000 $127,209.21 $125,365.89 $125,365.89 $2,401,308.2128 368664 0.355406241 $131,025.49 1.0000 $131,025.49 $129,182.17 $129,182.17 $2,532,333.7029 368664 0.366068428 $134,956.25 1.0000 $134,956.25 $133,112.93 $133,112.93 $2,667,289.9530 368664 0.377050481 $139,004.94 1.0000 $139,004.94 $137,161.62 $137,161.62 $2,806,294.89
Totals 11059920 $2,806,294.89 $2,806,294.89* Discount Rate = 0.0%
Year Annual PV Annual O&M Total Annual Present Value Present Value Annual PV Annual O&M Total Annual Present Value Present ValueSys. Payment* Costs Costs Factor** of Costs Sys. Payment*** Costs Costs Factor** of Costs
0 $1,050,000.00 $0.00 $1,050,000.00 1.0000 $1,050,000.00 $0.00 $0.00 $0.00 1.0000 $0.001 $54,127.00 $1,843.32 $55,970.32 1.0000 $55,970.32 $172,777.00 $1,843.32 $174,620.32 1.0000 $174,620.322 $54,127.00 $1,843.32 $55,970.32 1.0000 $55,970.32 $172,777.00 $1,843.32 $174,620.32 1.0000 $174,620.323 $54,127.00 $1,843.32 $55,970.32 1.0000 $55,970.32 $172,777.00 $1,843.32 $174,620.32 1.0000 $174,620.324 $54,127.00 $1,843.32 $55,970.32 1.0000 $55,970.32 $172,777.00 $1,843.32 $174,620.32 1.0000 $174,620.325 $54,127.00 $1,843.32 $55,970.32 1.0000 $55,970.32 $172,777.00 $1,843.32 $174,620.32 1.0000 $174,620.326 $54,127.00 $1,843.32 $55,970.32 1.0000 $55,970.32 $172,777.00 $1,843.32 $174,620.32 1.0000 $174,620.327 $54,127.00 $1,843.32 $55,970.32 1.0000 $55,970.32 $172,777.00 $1,843.32 $174,620.32 1.0000 $174,620.328 $54,127.00 $1,843.32 $55,970.32 1.0000 $55,970.32 $172,777.00 $1,843.32 $174,620.32 1.0000 $174,620.329 $54,127.00 $1,843.32 $55,970.32 1.0000 $55,970.32 $172,777.00 $1,843.32 $174,620.32 1.0000 $174,620.32
10 $54,127.00 $1,843.32 $55,970.32 1.0000 $55,970.32 $172,777.00 $1,843.32 $174,620.32 1.0000 $174,620.3211 $54,127.00 $1,843.32 $55,970.32 1.0000 $55,970.32 $172,777.00 $1,843.32 $174,620.32 1.0000 $174,620.3212 $54,127.00 $1,843.32 $55,970.32 1.0000 $55,970.32 $172,777.00 $1,843.32 $174,620.32 1.0000 $174,620.3213 $54,127.00 $1,843.32 $55,970.32 1.0000 $55,970.32 $172,777.00 $1,843.32 $174,620.32 1.0000 $174,620.3214 $0.00 $1,843.32 $1,843.32 1.0000 $1,843.32 $0.00 $1,843.32 $1,843.32 1.0000 $1,843.3215 $0.00 $1,843.32 $1,843.32 1.0000 $1,843.32 $0.00 $1,843.32 $1,843.32 1.0000 $1,843.3216 $0.00 $1,843.32 $1,843.32 1.0000 $1,843.32 $0.00 $1,843.32 $1,843.32 1.0000 $1,843.3217 $0.00 $1,843.32 $1,843.32 1.0000 $1,843.32 $0.00 $1,843.32 $1,843.32 1.0000 $1,843.3218 $0.00 $1,843.32 $1,843.32 1.0000 $1,843.32 $0.00 $1,843.32 $1,843.32 1.0000 $1,843.3219 $0.00 $1,843.32 $1,843.32 1.0000 $1,843.32 $0.00 $1,843.32 $1,843.32 1.0000 $1,843.3220 $0.00 $1,843.32 $1,843.32 1.0000 $1,843.32 $0.00 $1,843.32 $1,843.32 1.0000 $1,843.3221 $0.00 $1,843.32 $1,843.32 1.0000 $1,843.32 $0.00 $1,843.32 $1,843.32 1.0000 $1,843.3222 $0.00 $1,843.32 $1,843.32 1.0000 $1,843.32 $0.00 $1,843.32 $1,843.32 1.0000 $1,843.3223 $0.00 $1,843.32 $1,843.32 1.0000 $1,843.32 $0.00 $1,843.32 $1,843.32 1.0000 $1,843.3224 $0.00 $1,843.32 $1,843.32 1.0000 $1,843.32 $0.00 $1,843.32 $1,843.32 1.0000 $1,843.3225 $0.00 $1,843.32 $1,843.32 1.0000 $1,843.32 $0.00 $1,843.32 $1,843.32 1.0000 $1,843.3226 $0.00 $1,843.32 $1,843.32 1.0000 $1,843.32 $0.00 $1,843.32 $1,843.32 1.0000 $1,843.3227 $0.00 $1,843.32 $1,843.32 1.0000 $1,843.32 $0.00 $1,843.32 $1,843.32 1.0000 $1,843.3228 $0.00 $1,843.32 $1,843.32 1.0000 $1,843.32 $0.00 $1,843.32 $1,843.32 1.0000 $1,843.3229 $0.00 $1,843.32 $1,843.32 1.0000 $1,843.32 $0.00 $1,843.32 $1,843.32 1.0000 $1,843.3230 $0.00 $1,843.32 $1,843.32 1.0000 $1,843.32 $0.00 $1,843.32 $1,843.32 1.0000 $1,843.32
Totals $1,753,651.00 $55,299.60 $1,808,950.60 $1,808,950.60 $2,246,101.00 $55,299.60 $2,301,400.60 $2,301,400.60* Financing of $479,000 for 13 years at a 6% interest rate and $1,050,000 downpayment** Discount Rate = 0.0%*** Financing of $1,529,000 for 13 years at a 6% interest rate and $0.0 downpayment
Net Present Value of PV System = Present Value of Benefits - Present Value of Costs= $2,806,294.89- $1,808,950.60= $997,344.29
Cost of Generation =Total kWh Generated over Life of System
= $1,808,950.6011059920 kWh
= $0.164 /kWh
Benefit-Cost Ratio =
= $2,806,294.89$1,808,950.60
= 1.551
Payback = The period of time required for the profit or other benefits of the system toequal the cost of the initial investment.
= Year 19
Net Present Benefit of the PV SystemNet Present Cost of the PV System
Baseline Financial Analysis 200 kW Crystalline Silicon PV Power Station(Fixed System)
Net Present Cost of PV System
Baseline Financial Analysis 200 kW Crystalline Silicon PV Power Station(Fixed System)
Net Present Cost of PV System Present Value of Costs w/o Downpayment
Baseline Financial Analysis 200 kW Crystalline Silicon PV Power Station(Fixed System)
Present Value of Benefits Net Cash Flows

Year kWh Ave. Cost Value of Present Value Present Value Net Cash Net Cash PaybackGenerated $/kWh Energy Factor* of Benefits Flow w/o DP Flow w/ DP (Cost=$1.221M)
0 0 $0.00 1.0000 $0.00 $0.00 -$800,000.00 $0.001 321043 0.16 $51,366.88 1.0000 $51,366.88 -$88,211.34 $2,188.67 $51,366.882 321043 0.1648 $52,907.89 1.0000 $52,907.89 -$86,670.33 $3,729.67 $104,274.773 321043 0.169744 $54,495.12 1.0000 $54,495.12 -$85,083.09 $5,316.91 $158,769.894 321043 0.17483632 $56,129.98 1.0000 $56,129.98 -$83,448.24 $6,951.76 $214,899.875 321043 0.18008141 $57,813.88 1.0000 $57,813.88 -$81,764.34 $8,635.66 $272,713.746 321043 0.185483852 $59,548.29 1.0000 $59,548.29 -$80,029.92 $10,370.08 $332,262.037 321043 0.191048367 $61,334.74 1.0000 $61,334.74 -$78,243.47 $12,156.53 $393,596.788 321043 0.196779818 $63,174.78 1.0000 $63,174.78 -$76,403.43 $13,996.57 $456,771.569 321043 0.202683213 $65,070.03 1.0000 $65,070.03 -$74,508.19 $15,891.81 $521,841.5910 321043 0.208763709 $67,022.13 1.0000 $67,022.13 -$72,556.09 $17,843.91 $588,863.7111 321043 0.215026621 $69,032.79 1.0000 $69,032.79 -$70,545.42 $19,854.58 $657,896.5012 321043 0.221477419 $71,103.78 1.0000 $71,103.78 -$68,474.44 $21,925.56 $729,000.2813 321043 0.228121742 $73,236.89 1.0000 $73,236.89 -$66,341.33 $24,058.67 $802,237.1714 321043 0.234965394 $75,434.00 1.0000 $75,434.00 $73,828.78 $73,828.78 $877,671.1615 321043 0.242014356 $77,697.01 1.0000 $77,697.01 $76,091.80 $76,091.80 $955,368.1816 321043 0.249274787 $80,027.93 1.0000 $80,027.93 $78,422.71 $78,422.71 $1,035,396.1017 321043 0.25675303 $82,428.76 1.0000 $82,428.76 $80,823.55 $80,823.55 $1,117,824.8718 321043 0.264455621 $84,901.63 1.0000 $84,901.63 $83,296.41 $83,296.41 $1,202,726.4919 321043 0.27238929 $87,448.67 1.0000 $87,448.67 $85,843.46 $85,843.46 $1,290,175.1720 321043 0.280560968 $90,072.14 1.0000 $90,072.14 $88,466.92 $88,466.92 $1,380,247.30
Totals 6420860 $1,380,247.30 $1,380,247.30* Discount Rate = 0.0%
Year Annual PV Annual O&M Total Annual Present Value Present Value Annual PV Annual O&M Total Annual Present Value Present ValueSys. Payment* Costs Costs Factor** of Costs Sys. Payment*** Costs Costs Factor** of Costs
0 $800,000.00 $0.00 $800,000.00 1.0000 $800,000.00 $0.00 $0.00 $0.00 1.0000 $0.001 $47,573.00 $1,605.22 $49,178.22 1.0000 $49,178.22 $137,973.00 $1,605.22 $139,578.22 1.0000 $139,578.222 $47,573.00 $1,605.22 $49,178.22 1.0000 $49,178.22 $137,973.00 $1,605.22 $139,578.22 1.0000 $139,578.223 $47,573.00 $1,605.22 $49,178.22 1.0000 $49,178.22 $137,973.00 $1,605.22 $139,578.22 1.0000 $139,578.224 $47,573.00 $1,605.22 $49,178.22 1.0000 $49,178.22 $137,973.00 $1,605.22 $139,578.22 1.0000 $139,578.225 $47,573.00 $1,605.22 $49,178.22 1.0000 $49,178.22 $137,973.00 $1,605.22 $139,578.22 1.0000 $139,578.226 $47,573.00 $1,605.22 $49,178.22 1.0000 $49,178.22 $137,973.00 $1,605.22 $139,578.22 1.0000 $139,578.227 $47,573.00 $1,605.22 $49,178.22 1.0000 $49,178.22 $137,973.00 $1,605.22 $139,578.22 1.0000 $139,578.228 $47,573.00 $1,605.22 $49,178.22 1.0000 $49,178.22 $137,973.00 $1,605.22 $139,578.22 1.0000 $139,578.229 $47,573.00 $1,605.22 $49,178.22 1.0000 $49,178.22 $137,973.00 $1,605.22 $139,578.22 1.0000 $139,578.2210 $47,573.00 $1,605.22 $49,178.22 1.0000 $49,178.22 $137,973.00 $1,605.22 $139,578.22 1.0000 $139,578.2211 $47,573.00 $1,605.22 $49,178.22 1.0000 $49,178.22 $137,973.00 $1,605.22 $139,578.22 1.0000 $139,578.2212 $47,573.00 $1,605.22 $49,178.22 1.0000 $49,178.22 $137,973.00 $1,605.22 $139,578.22 1.0000 $139,578.2213 $47,573.00 $1,605.22 $49,178.22 1.0000 $49,178.22 $137,973.00 $1,605.22 $139,578.22 1.0000 $139,578.2214 $0.00 $1,605.22 $1,605.22 1.0000 $1,605.22 $0.00 $1,605.22 $1,605.22 1.0000 $1,605.2215 $0.00 $1,605.22 $1,605.22 1.0000 $1,605.22 $0.00 $1,605.22 $1,605.22 1.0000 $1,605.2216 $0.00 $1,605.22 $1,605.22 1.0000 $1,605.22 $0.00 $1,605.22 $1,605.22 1.0000 $1,605.2217 $0.00 $1,605.22 $1,605.22 1.0000 $1,605.22 $0.00 $1,605.22 $1,605.22 1.0000 $1,605.2218 $0.00 $1,605.22 $1,605.22 1.0000 $1,605.22 $0.00 $1,605.22 $1,605.22 1.0000 $1,605.2219 $0.00 $1,605.22 $1,605.22 1.0000 $1,605.22 $0.00 $1,605.22 $1,605.22 1.0000 $1,605.2220 $0.00 $1,605.22 $1,605.22 1.0000 $1,605.22 $0.00 $1,605.22 $1,605.22 1.0000 $1,605.22
Totals $1,418,449.00 $32,104.30 $1,450,553.30 $1,450,553.30 $1,793,649.00 $32,104.30 $1,825,753.30 $1,825,753.30* Financing of $421,000 for 13 years at a 6% interest rate and $800,000 downpayment** Discount Rate = 0.0%*** Financing of $1,221,000 for 13 years at a 6% interest rate and $0.00 downpayment
Net Present Value of PV System = Present Value of Benefits - Present Worth of Costs= $1,380,247.30- $1,450,553.30= -$70,306.00
Cost of Generation =Total kWh Generated over Life of System
= $1,450,553.306420860 kWh
= $0.226 /kWh
Benefit-Cost Ratio =
= $1,380,247.30$1,450,553.30
= 0.952
Payback = The period of time required for the profit or other benefits of the system toequal the cost of the initial investment.
= Year 18
Baseline Financial Analysis 200 kW Amorphous Silicon PV Power Station
Present Value of Benefits Net Cash Flows
Baseline Financial Analysis 200 kW Amorphous Silicon PV Power Station
Net Present Benefit of the PV SystemNet Present Cost of the PV System
Net Present Cost of PV System Present Value of Costs w/o Downpayment
Baseline Financial Analysis 200 kW Amorphous Silicon PV Power Station
Net Present Cost of PV System

Millennium Energy LLC Brightfield Feasibility AssessmentFebruary, 2001 NREL Task Ordering Agreement # KDC-0-30470-00
Appendix D:Economic Analysis Spreadsheets
ForBase Case Scenario of PV System Options
Utilizing the 20-Year Financing Mechanism

Year kWh Ave. Cost Value of Present Value Present Value Net Cash Net Cash PaybackGenerated $/kWh Energy Factor* of Benefits Flow w/o DP Flow w/ DP (Cost=$7.384M)
0 0 1.0000 $0.00 $0.00 -$3,400,000.00 $0.001 2241576 0.16 $358,652.16 0.9569 $343,194.25 -$283,663.93 $37.78 $343,194.252 2241576 0.1648 $369,411.72 0.9157 $338,270.32 -$261,598.05 $9,888.69 $681,464.573 2241576 0.169744 $380,494.08 0.8763 $333,426.96 -$240,630.76 $19,174.67 $1,014,891.534 2241576 0.17483632 $391,908.90 0.8386 $328,654.80 -$220,705.92 $27,922.21 $1,343,546.335 2241576 0.18008141 $403,666.17 0.8025 $323,942.10 -$201,769.78 $36,155.42 $1,667,488.436 2241576 0.185483852 $415,776.15 0.7679 $319,274.51 -$183,771.16 $43,895.83 $1,986,762.937 2241576 0.191048367 $428,249.44 0.7348 $314,677.69 -$166,684.42 $51,169.09 $2,301,440.628 2241576 0.196779818 $441,096.92 0.7032 $310,179.35 -$150,481.82 $58,002.92 $2,611,619.979 2241576 0.202683213 $454,329.83 0.6729 $305,718.54 -$135,093.32 $64,408.07 $2,917,338.5110 2241576 0.208763709 $467,959.72 0.6439 $301,319.26 -$120,494.91 $70,408.56 $3,218,657.7811 2241576 0.215026621 $481,998.51 0.6162 $297,007.48 -$106,660.63 $76,030.35 $3,515,665.2612 2241576 0.221477419 $496,458.47 0.5897 $292,761.56 -$93,546.60 $81,287.66 $3,808,426.8213 2241576 0.228121742 $511,352.22 0.5643 $288,556.06 -$81,112.74 $86,190.92 $4,096,982.8814 2241576 0.234965394 $526,692.79 0.54 $284,414.11 -$69,335.94 $90,763.26 $4,381,396.9815 2241576 0.242014356 $542,493.57 0.5167 $280,306.43 -$58,179.96 $95,011.26 $4,661,703.4116 2241576 0.249274787 $558,768.38 0.4945 $276,310.96 -$47,632.37 $98,976.99 $4,938,014.3717 2241576 0.25675303 $575,531.43 0.4732 $272,341.47 -$37,648.38 $102,645.95 $5,210,355.8518 2241576 0.264455621 $592,797.37 0.4528 $268,418.65 -$28,207.31 $106,038.83 $5,478,774.5019 2241576 0.27238929 $610,581.29 0.4333 $264,564.87 -$19,286.78 $109,178.00 $5,743,339.3720 2241576 0.280560968 $628,898.73 0.4146 $260,741.41 -$10,860.01 $112,060.60 $6,004,080.7921 2241576 0.288977798 $647,765.70 0.3968 $257,033.43 $252,586.14 $252,586.14 $6,261,114.2222 2241576 0.297647131 $667,198.67 0.3797 $253,335.33 $249,079.70 $249,079.70 $6,514,449.5523 2241576 0.306576545 $687,214.63 0.3634 $249,733.80 $245,660.85 $245,660.85 $6,764,183.3524 2241576 0.315773842 $707,831.07 0.3477 $246,112.86 $242,215.88 $242,215.88 $7,010,296.2125 2241576 0.325247057 $729,066.00 0.3327 $242,560.26 $238,831.40 $238,831.40 $7,252,856.4626 2241576 0.335004469 $750,937.98 0.3184 $239,098.65 $235,530.06 $235,530.06 $7,491,955.1227 2241576 0.345054603 $773,466.12 0.3047 $235,675.13 $232,260.08 $232,260.08 $7,727,630.2428 2241576 0.355406241 $796,670.10 0.2916 $232,309.00 $229,040.78 $229,040.78 $7,959,939.2429 2241576 0.366068428 $820,570.20 0.279 $228,939.09 $225,812.09 $225,812.09 $8,188,878.3330 2241576 0.377050481 $845,187.31 0.267 $225,665.01 $222,672.51 $222,672.51 $8,414,543.34
Totals 67247280 $17,063,025.61 $8,414,543.34* Discount Rate= 4.5%
Net Present Value of Costs without a DownpaymentYear Annual PV Annual O&M Total Annual Present Value Present Value Annual PV Annual O&M Total Annual Present Value Present Value
Sys. Payment* Costs Costs Factor** of Costs Sys. Payment*** Costs Costs Factor** of Costs0 $3,400,000.00 $0.00 $3,400,000.00 1.0000 $3,400,000.00 $0.00 $0.00 $0.00 1.0000 $0.001 $347,404.80 $11,207.88 $358,612.68 0.9569 $343,156.47 $643,884.80 $11,207.88 $655,092.68 0.9569 $626,858.192 $347,404.80 $11,207.88 $358,612.68 0.9157 $328,381.63 $643,884.80 $11,207.88 $655,092.68 0.9157 $599,868.373 $347,404.80 $11,207.88 $358,612.68 0.8763 $314,252.29 $643,884.80 $11,207.88 $655,092.68 0.8763 $574,057.724 $347,404.80 $11,207.88 $358,612.68 0.8386 $300,732.59 $643,884.80 $11,207.88 $655,092.68 0.8386 $549,360.725 $347,404.80 $11,207.88 $358,612.68 0.8025 $287,786.68 $643,884.80 $11,207.88 $655,092.68 0.8025 $525,711.886 $347,404.80 $11,207.88 $358,612.68 0.7679 $275,378.68 $643,884.80 $11,207.88 $655,092.68 0.7679 $503,045.677 $347,404.80 $11,207.88 $358,612.68 0.7348 $263,508.60 $643,884.80 $11,207.88 $655,092.68 0.7348 $481,362.108 $347,404.80 $11,207.88 $358,612.68 0.7032 $252,176.44 $643,884.80 $11,207.88 $655,092.68 0.7032 $460,661.179 $347,404.80 $11,207.88 $358,612.68 0.6729 $241,310.47 $643,884.80 $11,207.88 $655,092.68 0.6729 $440,811.8610 $347,404.80 $11,207.88 $358,612.68 0.6439 $230,910.70 $643,884.80 $11,207.88 $655,092.68 0.6439 $421,814.1811 $347,404.80 $11,207.88 $358,612.68 0.6162 $220,977.13 $643,884.80 $11,207.88 $655,092.68 0.6162 $403,668.1112 $347,404.80 $11,207.88 $358,612.68 0.5897 $211,473.90 $643,884.80 $11,207.88 $655,092.68 0.5897 $386,308.1513 $347,404.80 $11,207.88 $358,612.68 0.5643 $202,365.14 $643,884.80 $11,207.88 $655,092.68 0.5643 $369,668.8014 $347,404.80 $11,207.88 $358,612.68 0.54 $193,650.85 $643,884.80 $11,207.88 $655,092.68 0.54 $353,750.0515 $347,404.80 $11,207.88 $358,612.68 0.5167 $185,295.17 $643,884.80 $11,207.88 $655,092.68 0.5167 $338,486.3916 $347,404.80 $11,207.88 $358,612.68 0.4945 $177,333.97 $643,884.80 $11,207.88 $655,092.68 0.4945 $323,943.3317 $347,404.80 $11,207.88 $358,612.68 0.4732 $169,695.52 $643,884.80 $11,207.88 $655,092.68 0.4732 $309,989.8618 $347,404.80 $11,207.88 $358,612.68 0.4528 $162,379.82 $643,884.80 $11,207.88 $655,092.68 0.4528 $296,625.9719 $347,404.80 $11,207.88 $358,612.68 0.4333 $155,386.87 $643,884.80 $11,207.88 $655,092.68 0.4333 $283,851.6620 $347,404.80 $11,207.88 $358,612.68 0.4146 $148,680.82 $643,884.80 $11,207.88 $655,092.68 0.4146 $271,601.4321 $0.00 $11,207.88 $11,207.88 0.3968 $4,447.29 $0.00 $11,207.88 $11,207.88 0.3968 $4,447.2922 $0.00 $11,207.88 $11,207.88 0.3797 $4,255.63 $0.00 $11,207.88 $11,207.88 0.3797 $4,255.6323 $0.00 $11,207.88 $11,207.88 0.3634 $4,072.94 $0.00 $11,207.88 $11,207.88 0.3634 $4,072.9424 $0.00 $11,207.88 $11,207.88 0.3477 $3,896.98 $0.00 $11,207.88 $11,207.88 0.3477 $3,896.9825 $0.00 $11,207.88 $11,207.88 0.3327 $3,728.86 $0.00 $11,207.88 $11,207.88 0.3327 $3,728.8626 $0.00 $11,207.88 $11,207.88 0.3184 $3,568.59 $0.00 $11,207.88 $11,207.88 0.3184 $3,568.5927 $0.00 $11,207.88 $11,207.88 0.3047 $3,415.04 $0.00 $11,207.88 $11,207.88 0.3047 $3,415.0428 $0.00 $11,207.88 $11,207.88 0.2916 $3,268.22 $0.00 $11,207.88 $11,207.88 0.2916 $3,268.2229 $0.00 $11,207.88 $11,207.88 0.279 $3,127.00 $0.00 $11,207.88 $11,207.88 0.279 $3,127.0030 $0.00 $11,207.88 $11,207.88 0.267 $2,992.50 $0.00 $11,207.88 $11,207.88 0.267 $2,992.50
Totals $10,348,096.00 $336,236.40 $10,684,332.40 $8,101,606.80 $12,877,696.00 $336,236.40 $13,213,932.40 $8,558,218.64* Financing of $3,984,000 for 20 years at a 6.0% interest rate and $3,400,000 downpaymen** Discount Rate = 4.5%*** Financing of $7,384,000 for 20 years at a 6% interest rate and $0.0 downpayment
Net Present Value of PV System = Present Value of Benefits - Present Worth of Costs= $8,414,543.34- $8,101,606.80= $312,936.54
Cost of Generation =Total kWh Generated over Life of System
= $8,101,606.8067247280 kWh
= $0.120 /kWh
Benefit-Cost Ratio =
= $8,414,543.34$8,101,606.80
= 1.039
Payback = The period of time required for the profit or other benefits of the system toequal the cost of the initial investment.
= Year 25
Baseline Financial Analysis 1MW Crystalline Silicon (Tracking) PV Power Station
Net Present Cost of the PV System
Present Value of Benefits
Net Present Value of Costs with a Downpayment
Net Cash Flows
Net Present Cost of PV System
Net Present Benefit of the PV System
Baseline Financial Analysis 1MW Crystalline Silicon (Tracking) PV Power Station
Baseline Financial Analysis 1MW Crystalline Silicon (Tracking) PV Power Station

Year kWh Ave. Cost Value of Present Value Present Value Net Cash Net Cash PaybackGenerated $/kWh Energy Factor* of Benefits Flow w/o DP Flow w/ DP (Cost=$7.184M)
0 0 $0.00 1.0000 $0.00 $0.00 -$3,850,000.00 $0.001 1903050 0.16 $304,488.00 0.9569 $291,364.57 -$317,185.60 $4,064.86 $291,364.572 1903050 0.1648 $313,622.64 0.9157 $287,184.25 -$295,164.37 $12,254.44 $578,548.823 1903050 0.169744 $323,031.32 0.8763 $283,072.35 -$274,219.45 $19,971.99 $861,621.164 1903050 0.17483632 $332,722.26 0.8386 $279,020.89 -$254,295.21 $27,239.58 $1,140,642.055 1903050 0.18008141 $342,703.93 0.8025 $275,019.90 -$235,338.04 $34,077.26 $1,415,661.956 1903050 0.185483852 $352,985.04 0.7679 $271,057.22 -$217,296.51 $40,502.88 $1,686,719.177 1903050 0.191048367 $363,574.60 0.7348 $267,154.61 -$200,148.83 $46,538.22 $1,953,873.788 1903050 0.196779818 $374,481.83 0.7032 $263,335.63 -$183,871.48 $52,206.82 $2,217,209.409 1903050 0.202683213 $385,716.29 0.6729 $259,548.49 -$168,389.03 $57,516.96 $2,476,757.90
10 1903050 0.208763709 $397,287.78 0.6439 $255,813.60 -$153,681.08 $62,489.03 $2,732,571.4911 1903050 0.215026621 $409,206.41 0.6162 $252,152.99 -$139,725.59 $67,145.07 $2,984,724.4912 1903050 0.221477419 $421,482.60 0.5897 $248,548.29 -$126,477.35 $71,496.73 $3,233,272.7813 1903050 0.228121742 $434,127.08 0.5643 $244,977.91 -$113,894.34 $75,552.45 $3,478,250.6914 1903050 0.234965394 $447,150.89 0.54 $241,461.48 -$101,956.94 $79,331.86 $3,719,712.1715 1903050 0.242014356 $460,565.42 0.5167 $237,974.15 -$90,626.41 $82,840.12 $3,957,686.3216 1903050 0.249274787 $474,382.38 0.4945 $234,582.09 -$79,900.16 $86,113.38 $4,192,268.4117 1903050 0.25675303 $488,613.85 0.4732 $231,212.08 -$69,724.22 $89,138.48 $4,423,480.4918 1903050 0.264455621 $503,272.27 0.4528 $227,881.68 -$60,081.03 $91,932.99 $4,651,362.1719 1903050 0.27238929 $518,370.44 0.4333 $224,609.91 -$50,951.58 $94,515.90 $4,875,972.0820 1903050 0.280560968 $533,921.55 0.4146 $221,363.88 -$42,305.16 $96,884.35 $5,097,335.9621 1903050 0.288977798 $549,939.20 0.3968 $218,215.87 $214,440.22 $214,440.22 $5,315,551.8322 1903050 0.297647131 $566,437.37 0.3797 $215,076.27 $211,463.33 $211,463.33 $5,530,628.1023 1903050 0.306576545 $583,430.49 0.3634 $212,018.64 $208,560.80 $208,560.80 $5,742,646.7424 1903050 0.315773842 $600,933.41 0.3477 $208,944.55 $205,636.09 $205,636.09 $5,951,591.2925 1903050 0.325247057 $618,961.41 0.3327 $205,928.46 $202,762.74 $202,762.74 $6,157,519.7526 1903050 0.335004469 $637,530.25 0.3184 $202,989.63 $199,959.98 $199,959.98 $6,360,509.3827 1903050 0.345054603 $656,656.16 0.3047 $200,083.13 $197,183.84 $197,183.84 $6,560,592.5228 1903050 0.355406241 $676,355.85 0.2916 $197,225.36 $194,450.72 $194,450.72 $6,757,817.8829 1903050 0.366068428 $696,646.52 0.279 $194,364.38 $191,709.62 $191,709.62 $6,952,182.2630 1903050 0.377050481 $717,545.92 0.267 $191,584.76 $189,044.19 $189,044.19 $7,143,767.02
Totals 57091500 $14,486,143.18 $7,143,767.02* Discount Rate = 4.5%
Year Annual PV Annual O&M Total Annual Present Value Present Value Annual PV Annual O&M Total Annual Present Value Present ValueSys. Payment* Costs Costs Factor** of Costs Sys. Payment*** Costs Costs Factor** of Costs
0 $3,850,000.00 $0.00 $3,850,000.00 1.0000 $3,850,000.00 $0.00 $0.00 $0.00 1.0000 $0.00001 $290,724.80 $9,515.25 $300,240.05 0.9569 $287,299.70 $626,444.80 $9,515.25 $635,960.05 0.9569 $608,550.17182 $290,724.80 $9,515.25 $300,240.05 0.9157 $274,929.81 $626,444.80 $9,515.25 $635,960.05 0.9157 $582,348.61783 $290,724.80 $9,515.25 $300,240.05 0.8763 $263,100.36 $626,444.80 $9,515.25 $635,960.05 0.8763 $557,291.79184 $290,724.80 $9,515.25 $300,240.05 0.8386 $251,781.31 $626,444.80 $9,515.25 $635,960.05 0.8386 $533,316.09795 $290,724.80 $9,515.25 $300,240.05 0.8025 $240,942.64 $626,444.80 $9,515.25 $635,960.05 0.8025 $510,357.94016 $290,724.80 $9,515.25 $300,240.05 0.7679 $230,554.33 $626,444.80 $9,515.25 $635,960.05 0.7679 $488,353.72247 $290,724.80 $9,515.25 $300,240.05 0.7348 $220,616.39 $626,444.80 $9,515.25 $635,960.05 0.7348 $467,303.44478 $290,724.80 $9,515.25 $300,240.05 0.7032 $211,128.80 $626,444.80 $9,515.25 $635,960.05 0.7032 $447,207.10729 $290,724.80 $9,515.25 $300,240.05 0.6729 $202,031.53 $626,444.80 $9,515.25 $635,960.05 0.6729 $427,937.5176
10 $290,724.80 $9,515.25 $300,240.05 0.6439 $193,324.57 $626,444.80 $9,515.25 $635,960.05 0.6439 $409,494.676211 $290,724.80 $9,515.25 $300,240.05 0.6162 $185,007.92 $626,444.80 $9,515.25 $635,960.05 0.6162 $391,878.582812 $290,724.80 $9,515.25 $300,240.05 0.5897 $177,051.56 $626,444.80 $9,515.25 $635,960.05 0.5897 $375,025.641513 $290,724.80 $9,515.25 $300,240.05 0.5643 $169,425.46 $626,444.80 $9,515.25 $635,960.05 0.5643 $358,872.256214 $290,724.80 $9,515.25 $300,240.05 0.54 $162,129.63 $626,444.80 $9,515.25 $635,960.05 0.54 $343,418.427015 $290,724.80 $9,515.25 $300,240.05 0.5167 $155,134.03 $626,444.80 $9,515.25 $635,960.05 0.5167 $328,600.557816 $290,724.80 $9,515.25 $300,240.05 0.4945 $148,468.70 $626,444.80 $9,515.25 $635,960.05 0.4945 $314,482.244717 $290,724.80 $9,515.25 $300,240.05 0.4732 $142,073.59 $626,444.80 $9,515.25 $635,960.05 0.4732 $300,936.295718 $290,724.80 $9,515.25 $300,240.05 0.4528 $135,948.69 $626,444.80 $9,515.25 $635,960.05 0.4528 $287,962.710619 $290,724.80 $9,515.25 $300,240.05 0.4333 $130,094.01 $626,444.80 $9,515.25 $635,960.05 0.4333 $275,561.489720 $290,724.80 $9,515.25 $300,240.05 0.4146 $124,479.52 $626,444.80 $9,515.25 $635,960.05 0.4146 $263,669.036721 $0.00 $9,515.25 $9,515.25 0.3968 $3,775.65 $0.00 $9,515.25 $9,515.25 0.3968 $3,775.651222 $0.00 $9,515.25 $9,515.25 0.3797 $3,612.94 $0.00 $9,515.25 $9,515.25 0.3797 $3,612.940423 $0.00 $9,515.25 $9,515.25 0.3634 $3,457.84 $0.00 $9,515.25 $9,515.25 0.3634 $3,457.841924 $0.00 $9,515.25 $9,515.25 0.3477 $3,308.45 $0.00 $9,515.25 $9,515.25 0.3477 $3,308.452425 $0.00 $9,515.25 $9,515.25 0.3327 $3,165.72 $0.00 $9,515.25 $9,515.25 0.3327 $3,165.723726 $0.00 $9,515.25 $9,515.25 0.3184 $3,029.66 $0.00 $9,515.25 $9,515.25 0.3184 $3,029.655627 $0.00 $9,515.25 $9,515.25 0.3047 $2,899.30 $0.00 $9,515.25 $9,515.25 0.3047 $2,899.296728 $0.00 $9,515.25 $9,515.25 0.2916 $2,774.65 $0.00 $9,515.25 $9,515.25 0.2916 $2,774.646929 $0.00 $9,515.25 $9,515.25 0.279 $2,654.75 $0.00 $9,515.25 $9,515.25 0.279 $2,654.754830 $0.00 $9,515.25 $9,515.25 0.267 $2,540.57 $0.00 $9,515.25 $9,515.25 0.267 $2,540.5718
Totals $9,664,496.00 $285,457.50 $9,949,953.50 $7,786,742.11 $12,528,896.00 $285,457.50 $12,814,353.50 $8,303,787.87* Financing of $3,334,000 for 20 years at a 6% interest rate and $3,850,000 downpayment** Discount Rate = 4.5%*** Financing of $7,184,000 for 20 years at a 6% interest rate and $0.0 downpayment
Net Present Value of PV System = Present Value of Benefits - Present Value of Costs= $7,143,767.02- $7,786,742.11= -$642,975.08
Cost of Generation =Total kWh Generated over Life of System
= $7,786,742.1157091500 kWh
= $0.136 /kWh
Benefit-Cost Ratio =
= $7,143,767.02$7,786,742.11
= 0.917
Payback = The period of time required for the profit or other benefits of the system toequal the cost of the initial investment.
= Year 30
Baseline Financial Analysis 1MW Crystalline Silicon PV Power Station(Fixed System)
Net Cash Flows
Present Value of Costs w/o Downpayment
Baseline Financial Analysis 1MW Crystalline Silicon PV Power Station(Fixed System)
Net Present Cost of the PV System
Present Value of Benefits
Net Present Cost of PV System
Net Present Cost of PV System
Net Present Benefit of the PV System
Baseline Financial Analysis 1MW Crystalline Silicon PV Power Station(Fixed System)

Year kWh Ave. Cost Value of Present Value Present Value Net Cash Net Cash PaybackGenerated $/kWh Energy Factor* of Benefits Flow w/o DP Flow w/ DP (Cost=$5.622M)
0 0 $0.00 1.0000 $0.00 $0.00 -$2,750,000.00 $0.001 1644958 0.16 $263,193.28 0.9569 $251,849.65 -$225,129.78 $4,334.84 $251,849.652 1644958 0.1648 $271,089.08 0.9157 $248,236.27 -$208,206.47 $11,378.39 $500,085.923 1644958 0.169744 $279,221.75 0.8763 $244,682.02 -$192,121.27 $18,015.47 $744,767.944 1644958 0.17483632 $287,598.40 0.8386 $241,180.02 -$176,831.21 $24,265.07 $985,947.965 1644958 0.18008141 $296,226.36 0.8025 $237,721.65 -$162,295.06 $30,144.44 $1,223,669.616 1644958 0.185483852 $305,113.15 0.7679 $234,296.38 -$148,473.50 $35,668.92 $1,457,965.997 1644958 0.191048367 $314,266.54 0.7348 $230,923.05 -$135,347.70 $40,857.34 $1,688,889.058 1644958 0.196779818 $323,694.54 0.7032 $227,622.00 -$122,897.32 $45,730.04 $1,916,511.059 1644958 0.202683213 $333,405.37 0.6729 $224,348.48 -$111,067.41 $50,294.01 $2,140,859.5210 1644958 0.208763709 $343,407.53 0.6439 $221,120.11 -$99,840.34 $54,566.88 $2,361,979.6311 1644958 0.215026621 $353,709.76 0.6162 $217,955.95 -$89,197.06 $58,567.70 $2,579,935.5912 1644958 0.221477419 $364,321.05 0.5897 $214,840.12 -$79,103.62 $62,306.44 $2,794,775.7113 1644958 0.228121742 $375,250.68 0.5643 $211,753.96 -$69,528.82 $65,790.32 $3,006,529.6714 1644958 0.234965394 $386,508.20 0.54 $208,714.43 -$60,455.69 $69,036.31 $3,215,244.1015 1644958 0.242014356 $398,103.45 0.5167 $205,700.05 -$51,855.88 $72,048.78 $3,420,944.1616 1644958 0.249274787 $410,046.55 0.4945 $202,768.02 -$43,722.03 $74,859.07 $3,623,712.1817 1644958 0.25675303 $422,347.95 0.4732 $199,855.05 -$36,017.73 $77,455.63 $3,823,567.2318 1644958 0.264455621 $435,018.39 0.4528 $196,976.33 -$28,727.81 $79,853.63 $4,020,543.5619 1644958 0.27238929 $448,068.94 0.4333 $194,148.27 -$21,835.83 $82,069.51 $4,214,691.8320 1644958 0.280560968 $461,511.01 0.4146 $191,342.46 -$15,320.37 $84,100.71 $4,406,034.29
Totals 32899160 $7,072,102.00 $4,406,034.29* Discount Rate = 4.5%
Year Annual PV Annual O&M Total Annual Present Value Present Value Annual PV Annual O&M Total Annual Present Value Present ValueSys. Payment* Costs Costs Factor** of Costs Sys. Payment*** Costs Costs Factor** of Costs
0 $2,750,000.00 $0.00 $2,750,000.00 1.0000 $2,750,000.00 $0.00 $0.00 $0.00 1.0000 $0.001 $250,438.40 $8,224.79 $258,663.19 0.9569 $247,514.81 $490,238.40 $8,224.79 $498,463.19 0.9569 $476,979.432 $250,438.40 $8,224.79 $258,663.19 0.9157 $236,857.88 $490,238.40 $8,224.79 $498,463.19 0.9157 $456,442.743 $250,438.40 $8,224.79 $258,663.19 0.8763 $226,666.55 $490,238.40 $8,224.79 $498,463.19 0.8763 $436,803.294 $250,438.40 $8,224.79 $258,663.19 0.8386 $216,914.95 $490,238.40 $8,224.79 $498,463.19 0.8386 $418,011.235 $250,438.40 $8,224.79 $258,663.19 0.8025 $207,577.21 $490,238.40 $8,224.79 $498,463.19 0.8025 $400,016.716 $250,438.40 $8,224.79 $258,663.19 0.7679 $198,627.46 $490,238.40 $8,224.79 $498,463.19 0.7679 $382,769.887 $250,438.40 $8,224.79 $258,663.19 0.7348 $190,065.71 $490,238.40 $8,224.79 $498,463.19 0.7348 $366,270.758 $250,438.40 $8,224.79 $258,663.19 0.7032 $181,891.96 $490,238.40 $8,224.79 $498,463.19 0.7032 $350,519.329 $250,438.40 $8,224.79 $258,663.19 0.6729 $174,054.46 $490,238.40 $8,224.79 $498,463.19 0.6729 $335,415.8810 $250,438.40 $8,224.79 $258,663.19 0.6439 $166,553.23 $490,238.40 $8,224.79 $498,463.19 0.6439 $320,960.4511 $250,438.40 $8,224.79 $258,663.19 0.6162 $159,388.26 $490,238.40 $8,224.79 $498,463.19 0.6162 $307,153.0212 $250,438.40 $8,224.79 $258,663.19 0.5897 $152,533.68 $490,238.40 $8,224.79 $498,463.19 0.5897 $293,943.7413 $250,438.40 $8,224.79 $258,663.19 0.5643 $145,963.64 $490,238.40 $8,224.79 $498,463.19 0.5643 $281,282.7814 $250,438.40 $8,224.79 $258,663.19 0.54 $139,678.12 $490,238.40 $8,224.79 $498,463.19 0.54 $269,170.1215 $250,438.40 $8,224.79 $258,663.19 0.5167 $133,651.27 $490,238.40 $8,224.79 $498,463.19 0.5167 $257,555.9316 $250,438.40 $8,224.79 $258,663.19 0.4945 $127,908.95 $490,238.40 $8,224.79 $498,463.19 0.4945 $246,490.0517 $250,438.40 $8,224.79 $258,663.19 0.4732 $122,399.42 $490,238.40 $8,224.79 $498,463.19 0.4732 $235,872.7818 $250,438.40 $8,224.79 $258,663.19 0.4528 $117,122.69 $490,238.40 $8,224.79 $498,463.19 0.4528 $225,704.1319 $250,438.40 $8,224.79 $258,663.19 0.4333 $112,078.76 $490,238.40 $8,224.79 $498,463.19 0.4333 $215,984.1020 $250,438.40 $8,224.79 $258,663.19 0.4146 $107,241.76 $490,238.40 $8,224.79 $498,463.19 0.4146 $206,662.84
Totals $7,758,768.00 $164,495.80 $7,923,263.80 $6,114,690.78 $9,804,768.00 $164,495.80 $9,969,263.80 $6,484,009.18* Financing of $2,872,000 for 20 years at a 6% interest rate and $2,750,000 downpayment** Discount Rate = 4.5%*** Financing of $5,622,000 for 20 years at a 6% interest rate and $0.00 downpayment
Net Present Value of PV System = Present Value of Benefits - Present Worth of Costs= $4,406,034.29- $6,114,690.78= -$1,708,656.48
Cost of Generation =Total kWh Generated over Life of System
= $6,114,690.7832899160 kWh
= $0.186 /kWh
Benefit-Cost Ratio =
= $4,406,034.29$6,114,690.78
= 0.721
Payback = The period of time required for the profit or other benefits of the system toequal the cost of the initial investment.
= 20+ Years
Baseline Financial Analysis 1MW Amorphous Silicon PV Power Station
Baseline Financial Analysis 1MW Amorphous Silicon PV Power Station
Baseline Financial Analysis 1MW Amorphous Silicon PV Power Station
Net Cash Flows
Present Value of Costs w/o Downpayment
Net Present Cost of the PV System
Net Present Cost of PV System
Present Value of Benefits
Net Present Cost of PV System
Net Present Benefit of the PV System

Year kWh Ave. Cost Value of Present Value Present Value Net Cash Net Cash PaybackGenerated $/kWh Energy Factor* of Benefits Flow w/o DP Flow w/ DP (Cost=$3.837M)
0 0 1.0000 $0.00 $0.00 -$1,900,000.00 $0.001 1093952 0.16 $175,032.32 0.9569 $167,488.43 -$157,911.31 $627.88 $167,488.432 1093952 0.1648 $180,283.29 0.9157 $165,085.41 -$146,304.02 $5,409.16 $332,573.843 1093952 0.169744 $185,691.79 0.8763 $162,721.71 -$135,269.50 $9,915.89 $495,295.554 1093952 0.17483632 $191,262.54 0.8386 $160,392.77 -$124,778.33 $14,160.92 $655,688.325 1093952 0.18008141 $197,000.42 0.8025 $158,092.84 -$114,802.23 $18,155.97 $813,781.156 1093952 0.185483852 $202,910.43 0.7679 $155,814.92 -$105,314.21 $21,911.47 $969,596.077 1093952 0.191048367 $208,997.74 0.7348 $153,571.54 -$96,301.72 $25,439.94 $1,123,167.618 1093952 0.196779818 $215,267.68 0.7032 $151,376.23 -$87,751.26 $28,754.91 $1,274,543.849 1093952 0.202683213 $221,725.71 0.6729 $149,199.23 -$79,624.56 $31,861.51 $1,423,743.07
10 1093952 0.208763709 $228,377.48 0.6439 $147,052.26 -$71,909.90 $34,771.45 $1,570,795.3311 1093952 0.215026621 $235,228.80 0.6162 $144,947.99 -$64,594.62 $37,497.40 $1,715,743.3212 1093952 0.221477419 $242,285.67 0.5897 $142,875.86 -$57,655.26 $40,046.24 $1,858,619.1713 1093952 0.228121742 $249,554.24 0.5643 $140,823.46 -$51,070.24 $42,422.99 $1,999,442.6314 1093952 0.234965394 $257,040.86 0.54 $138,802.07 -$44,828.26 $44,638.94 $2,138,244.7015 1093952 0.242014356 $264,752.09 0.5167 $136,797.40 -$38,909.61 $46,697.24 $2,275,042.1016 1093952 0.249274787 $272,694.65 0.4945 $134,847.51 -$33,310.27 $48,618.49 $2,409,889.6117 1093952 0.25675303 $280,875.49 0.4732 $132,910.28 -$28,004.29 $50,395.48 $2,542,799.8918 1093952 0.264455621 $289,301.76 0.4528 $130,995.83 -$22,981.59 $52,038.31 $2,673,795.7219 1093952 0.27238929 $297,980.81 0.4333 $129,115.08 -$18,231.25 $53,557.89 $2,802,910.8120 1093952 0.280560968 $306,920.23 0.4146 $127,249.13 -$13,738.16 $54,952.77 $2,930,159.9421 1093952 0.288977798 $316,127.84 0.3968 $125,439.53 $123,269.13 $123,269.13 $3,055,599.4622 1093952 0.297647131 $325,611.67 0.3797 $123,634.75 $121,557.89 $121,557.89 $3,179,234.2123 1093952 0.306576545 $335,380.03 0.3634 $121,877.10 $119,889.39 $119,889.39 $3,301,111.3224 1093952 0.315773842 $345,441.43 0.3477 $120,109.98 $118,208.15 $118,208.15 $3,421,221.3025 1093952 0.325247057 $355,804.67 0.3327 $118,376.21 $116,556.42 $116,556.42 $3,539,597.5126 1093952 0.335004469 $366,478.81 0.3184 $116,686.85 $114,945.28 $114,945.28 $3,656,284.3727 1093952 0.345054603 $377,473.17 0.3047 $115,016.08 $113,349.44 $113,349.44 $3,771,300.4428 1093952 0.355406241 $388,797.37 0.2916 $113,373.31 $111,778.33 $111,778.33 $3,884,673.7529 1093952 0.366068428 $400,461.29 0.279 $111,728.70 $110,202.64 $110,202.64 $3,996,402.4530 1093952 0.377050481 $412,475.13 0.267 $110,130.86 $107,138.36 $108,670.43 $4,106,533.31
Totals 32818560 $8,327,235.39 $4,106,533.31* Discount Rate= 4.5%
Net Present Value of Costs without a DownpaymentYear Annual PV Annual O&M Total Annual Present Value Present Value Annual PV Annual O&M Total Annual Present Value Present Value
Sys. Payment* Costs Costs Factor** of Costs Sys. Payment*** Costs Costs Factor** of Costs0 $1,900,000.00 $0.00 $1,900,000.00 1.0000 $1,900,000.00 $0.00 $0.00 $0.00 1.0000 $0.001 $168,906.40 $5,469.76 $174,376.16 0.9569 $166,860.55 $334,586.40 $5,469.76 $340,056.16 0.9569 $325,399.742 $168,906.40 $5,469.76 $174,376.16 0.9157 $159,676.25 $334,586.40 $5,469.76 $340,056.16 0.9157 $311,389.433 $168,906.40 $5,469.76 $174,376.16 0.8763 $152,805.83 $334,586.40 $5,469.76 $340,056.16 0.8763 $297,991.214 $168,906.40 $5,469.76 $174,376.16 0.8386 $146,231.85 $334,586.40 $5,469.76 $340,056.16 0.8386 $285,171.105 $168,906.40 $5,469.76 $174,376.16 0.8025 $139,936.87 $334,586.40 $5,469.76 $340,056.16 0.8025 $272,895.076 $168,906.40 $5,469.76 $174,376.16 0.7679 $133,903.45 $334,586.40 $5,469.76 $340,056.16 0.7679 $261,129.137 $168,906.40 $5,469.76 $174,376.16 0.7348 $128,131.60 $334,586.40 $5,469.76 $340,056.16 0.7348 $249,873.278 $168,906.40 $5,469.76 $174,376.16 0.7032 $122,621.32 $334,586.40 $5,469.76 $340,056.16 0.7032 $239,127.499 $168,906.40 $5,469.76 $174,376.16 0.6729 $117,337.72 $334,586.40 $5,469.76 $340,056.16 0.6729 $228,823.79
10 $168,906.40 $5,469.76 $174,376.16 0.6439 $112,280.81 $334,586.40 $5,469.76 $340,056.16 0.6439 $218,962.1611 $168,906.40 $5,469.76 $174,376.16 0.6162 $107,450.59 $334,586.40 $5,469.76 $340,056.16 0.6162 $209,542.6112 $168,906.40 $5,469.76 $174,376.16 0.5897 $102,829.62 $334,586.40 $5,469.76 $340,056.16 0.5897 $200,531.1213 $168,906.40 $5,469.76 $174,376.16 0.5643 $98,400.47 $334,586.40 $5,469.76 $340,056.16 0.5643 $191,893.6914 $168,906.40 $5,469.76 $174,376.16 0.54 $94,163.13 $334,586.40 $5,469.76 $340,056.16 0.54 $183,630.3315 $168,906.40 $5,469.76 $174,376.16 0.5167 $90,100.16 $334,586.40 $5,469.76 $340,056.16 0.5167 $175,707.0216 $168,906.40 $5,469.76 $174,376.16 0.4945 $86,229.01 $334,586.40 $5,469.76 $340,056.16 0.4945 $168,157.7717 $168,906.40 $5,469.76 $174,376.16 0.4732 $82,514.80 $334,586.40 $5,469.76 $340,056.16 0.4732 $160,914.5718 $168,906.40 $5,469.76 $174,376.16 0.4528 $78,957.53 $334,586.40 $5,469.76 $340,056.16 0.4528 $153,977.4319 $168,906.40 $5,469.76 $174,376.16 0.4333 $75,557.19 $334,586.40 $5,469.76 $340,056.16 0.4333 $147,346.3320 $168,906.40 $5,469.76 $174,376.16 0.4146 $72,296.36 $334,586.40 $5,469.76 $340,056.16 0.4146 $140,987.2821 $0.00 $5,469.76 $5,469.76 0.3968 $2,170.40 $0.00 $5,469.76 $5,469.76 0.3968 $2,170.4022 $0.00 $5,469.76 $5,469.76 0.3797 $2,076.87 $0.00 $5,469.76 $5,469.76 0.3797 $2,076.8723 $0.00 $5,469.76 $5,469.76 0.3634 $1,987.71 $0.00 $5,469.76 $5,469.76 0.3634 $1,987.7124 $0.00 $5,469.76 $5,469.76 0.3477 $1,901.84 $0.00 $5,469.76 $5,469.76 0.3477 $1,901.8425 $0.00 $5,469.76 $5,469.76 0.3327 $1,819.79 $0.00 $5,469.76 $5,469.76 0.3327 $1,819.7926 $0.00 $5,469.76 $5,469.76 0.3184 $1,741.57 $0.00 $5,469.76 $5,469.76 0.3184 $1,741.5727 $0.00 $5,469.76 $5,469.76 0.3047 $1,666.64 $0.00 $5,469.76 $5,469.76 0.3047 $1,666.6428 $0.00 $5,469.76 $5,469.76 0.2916 $1,594.98 $0.00 $5,469.76 $5,469.76 0.2916 $1,594.9829 $0.00 $5,469.76 $5,469.76 0.279 $1,526.06 $0.00 $5,469.76 $5,469.76 0.279 $1,526.0630 $0.00 $5,469.76 $5,469.76 0.267 $1,460.43 $0.00 $11,207.88 $11,207.88 0.267 $2,992.50
Totals $5,278,128.00 $164,092.80 $5,442,220.80 $4,186,231.37 $6,691,728.00 $169,830.92 $6,861,558.92 $4,442,928.89* Financing of $1,937,000 for 20 years at a 6.0% interest rate and $1,900,000 downpayment** Discount Rate = 4.5%*** Financing of $3,837,000 for 20 years at a 6% interest rate and $0.0 downpayment
Net Present Value of PV System = Present Value of Benefits - Present Worth of Costs= $4,106,533.31- $4,186,231.37= -$79,698.06
Cost of Generation =Total kWh Generated over Life of System
= $4,186,231.3732818560 kWh
= $0.128 /kWh
Benefit-Cost Ratio =
= $4,106,533.31$4,186,231.37
= 0.981
Payback = The period of time required for the profit or other benefits of the system toequal the cost of the initial investment.
= Year 27
Baseline Financial Analysis 500 kW Crystalline Silicon (Tracking) PV Power Station
Present Value of Benefits Net Cash Flows
Baseline Financial Analysis 500 kW Crystalline Silicon (Tracking) PV Power Station
Net Present Cost of the PV System
Net Present Value of Costs with a Downpayment
Baseline Financial Analysis 500 kW Crystalline Silicon (Tracking) PV Power Station
Net Present Cost of PV System
Net Present Benefit of the PV System

Year kWh Ave. Cost Value of Present Value Present Value Net Cash Net Cash PaybackGenerated $/kWh Energy Factor* of Benefits Flow w/o DP Flow w/ DP (Cost=$3.672M)
0 0 $0.00 1.0000 $0.00 $0.00 -$2,050,000.00 $0.001 929632 0.16 $148,741.12 0.9569 $142,330.38 -$168,515.30 $2,540.15 $142,330.382 929632 0.1648 $153,203.35 0.9157 $140,288.31 -$157,173.68 $6,516.85 $282,618.693 929632 0.169744 $157,799.45 0.8763 $138,279.66 -$146,383.38 $10,264.01 $420,898.354 929632 0.17483632 $162,533.44 0.8386 $136,300.54 -$136,115.78 $13,792.35 $557,198.895 929632 0.18008141 $167,409.44 0.8025 $134,346.08 -$126,343.29 $17,111.61 $691,544.976 929632 0.185483852 $172,431.72 0.7679 $132,410.32 -$117,039.35 $20,230.45 $823,955.297 929632 0.191048367 $177,604.68 0.7348 $130,503.92 -$108,193.34 $23,159.51 $954,459.208 929632 0.196779818 $182,932.82 0.7032 $128,638.36 -$99,793.74 $25,910.29 $1,083,097.569 929632 0.202683213 $188,420.80 0.6729 $126,788.36 -$91,800.89 $28,486.71 $1,209,885.92
10 929632 0.208763709 $194,073.42 0.6439 $124,963.88 -$84,204.82 $30,898.74 $1,334,849.8011 929632 0.215026621 $199,895.63 0.6162 $123,175.69 -$76,994.76 $33,157.15 $1,458,025.4812 929632 0.221477419 $205,892.50 0.5897 $121,414.81 -$70,147.21 $35,267.56 $1,579,440.2913 929632 0.228121742 $212,069.27 0.5643 $119,670.69 -$63,640.22 $37,234.04 $1,699,110.9814 929632 0.234965394 $218,431.35 0.54 $117,952.93 -$57,464.21 $39,066.19 $1,817,063.9015 929632 0.242014356 $224,984.29 0.5167 $116,249.38 -$51,598.84 $40,766.46 $1,933,313.2916 929632 0.249274787 $231,733.82 0.4945 $114,592.37 -$46,044.25 $42,352.57 $2,047,905.6617 929632 0.25675303 $238,685.83 0.4732 $112,946.14 -$40,771.26 $43,817.98 $2,160,851.8018 929632 0.264455621 $245,846.41 0.4528 $111,319.25 -$35,771.27 $45,171.26 $2,272,171.0519 929632 0.27238929 $253,221.80 0.4333 $109,721.01 -$31,035.01 $46,421.70 $2,381,892.0620 929632 0.280560968 $260,818.45 0.4146 $108,135.33 -$26,546.05 $47,567.84 $2,490,027.3921 929632 0.288977798 $268,643.01 0.3968 $106,597.55 $104,753.16 $104,753.16 $2,596,624.9322 929632 0.297647131 $276,702.30 0.3797 $105,063.86 $103,298.96 $103,298.96 $2,701,688.8023 929632 0.306576545 $285,003.37 0.3634 $103,570.22 $101,881.08 $101,881.08 $2,805,259.0224 929632 0.315773842 $293,553.47 0.3477 $102,068.54 $100,452.38 $100,452.38 $2,907,327.5625 929632 0.325247057 $302,360.07 0.3327 $100,595.20 $99,048.75 $99,048.75 $3,007,922.7626 929632 0.335004469 $311,430.87 0.3184 $99,159.59 $97,679.62 $97,679.62 $3,107,082.3527 929632 0.345054603 $320,773.80 0.3047 $97,739.78 $96,323.48 $96,323.48 $3,204,822.1228 929632 0.355406241 $330,397.01 0.2916 $96,343.77 $94,988.37 $94,988.37 $3,301,165.8929 929632 0.366068428 $340,308.92 0.279 $94,946.19 $93,649.35 $93,649.35 $3,396,112.0830 929632 0.377050481 $350,518.19 0.267 $93,588.36 $92,347.30 $92,347.30 $3,489,700.44
Totals 27888960 $7,076,420.62 $3,489,700.44* Discount Rate = 4.5%
Year Annual PV Annual O&M Total Annual Present Value Present Value Annual PV Annual O&M Total Annual Present Value Present ValueSys. Payment* Costs Costs Factor** of Costs Sys. Payment*** Costs Costs Factor** of Costs
0 $2,050,000.00 $0.00 $2,050,000.00 1.0000 $2,050,000.00 $0.00 $0.00 $0.00 1.0000 $0.00001 $141,438.40 $4,648.16 $146,086.56 0.9569 $139,790.23 $320,198.40 $4,648.16 $324,846.56 0.9569 $310,845.67332 $141,438.40 $4,648.16 $146,086.56 0.9157 $133,771.46 $320,198.40 $4,648.16 $324,846.56 0.9157 $297,461.99503 $141,438.40 $4,648.16 $146,086.56 0.8763 $128,015.65 $320,198.40 $4,648.16 $324,846.56 0.8763 $284,663.04054 $141,438.40 $4,648.16 $146,086.56 0.8386 $122,508.19 $320,198.40 $4,648.16 $324,846.56 0.8386 $272,416.32525 $141,438.40 $4,648.16 $146,086.56 0.8025 $117,234.46 $320,198.40 $4,648.16 $324,846.56 0.8025 $260,689.36446 $141,438.40 $4,648.16 $146,086.56 0.7679 $112,179.87 $320,198.40 $4,648.16 $324,846.56 0.7679 $249,449.67347 $141,438.40 $4,648.16 $146,086.56 0.7348 $107,344.40 $320,198.40 $4,648.16 $324,846.56 0.7348 $238,697.25238 $141,438.40 $4,648.16 $146,086.56 0.7032 $102,728.07 $320,198.40 $4,648.16 $324,846.56 0.7032 $228,432.10109 $141,438.40 $4,648.16 $146,086.56 0.6729 $98,301.65 $320,198.40 $4,648.16 $324,846.56 0.6729 $218,589.2502
10 $141,438.40 $4,648.16 $146,086.56 0.6439 $94,065.14 $320,198.40 $4,648.16 $324,846.56 0.6439 $209,168.700011 $141,438.40 $4,648.16 $146,086.56 0.6162 $90,018.54 $320,198.40 $4,648.16 $324,846.56 0.6162 $200,170.450312 $141,438.40 $4,648.16 $146,086.56 0.5897 $86,147.24 $320,198.40 $4,648.16 $324,846.56 0.5897 $191,562.016413 $141,438.40 $4,648.16 $146,086.56 0.5643 $82,436.65 $320,198.40 $4,648.16 $324,846.56 0.5643 $183,310.913814 $141,438.40 $4,648.16 $146,086.56 0.54 $78,886.74 $320,198.40 $4,648.16 $324,846.56 0.54 $175,417.142415 $141,438.40 $4,648.16 $146,086.56 0.5167 $75,482.93 $320,198.40 $4,648.16 $324,846.56 0.5167 $167,848.217616 $141,438.40 $4,648.16 $146,086.56 0.4945 $72,239.80 $320,198.40 $4,648.16 $324,846.56 0.4945 $160,636.623917 $141,438.40 $4,648.16 $146,086.56 0.4732 $69,128.16 $320,198.40 $4,648.16 $324,846.56 0.4732 $153,717.392218 $141,438.40 $4,648.16 $146,086.56 0.4528 $66,147.99 $320,198.40 $4,648.16 $324,846.56 0.4528 $147,090.522419 $141,438.40 $4,648.16 $146,086.56 0.4333 $63,299.31 $320,198.40 $4,648.16 $324,846.56 0.4333 $140,756.014420 $141,438.40 $4,648.16 $146,086.56 0.4146 $60,567.49 $320,198.40 $4,648.16 $324,846.56 0.4146 $134,681.383821 $0.00 $4,648.16 $4,648.16 0.3968 $1,844.39 $0.00 $4,648.16 $4,648.16 0.3968 $1,844.389922 $0.00 $4,648.16 $4,648.16 0.3797 $1,764.91 $0.00 $4,648.16 $4,648.16 0.3797 $1,764.906423 $0.00 $4,648.16 $4,648.16 0.3634 $1,689.14 $0.00 $4,648.16 $4,648.16 0.3634 $1,689.141324 $0.00 $4,648.16 $4,648.16 0.3477 $1,616.17 $0.00 $4,648.16 $4,648.16 0.3477 $1,616.165225 $0.00 $4,648.16 $4,648.16 0.3327 $1,546.44 $0.00 $4,648.16 $4,648.16 0.3327 $1,546.442826 $0.00 $4,648.16 $4,648.16 0.3184 $1,479.97 $0.00 $4,648.16 $4,648.16 0.3184 $1,479.974127 $0.00 $4,648.16 $4,648.16 0.3047 $1,416.29 $0.00 $4,648.16 $4,648.16 0.3047 $1,416.294428 $0.00 $4,648.16 $4,648.16 0.2916 $1,355.40 $0.00 $4,648.16 $4,648.16 0.2916 $1,355.403529 $0.00 $4,648.16 $4,648.16 0.279 $1,296.84 $0.00 $4,648.16 $4,648.16 0.279 $1,296.836630 $0.00 $4,648.16 $4,648.16 0.267 $1,241.06 $0.00 $4,648.16 $4,648.16 0.267 $1,241.0587
Totals $4,878,768.00 $139,444.80 $5,018,212.80 $3,965,544.59 $6,403,968.00 $139,444.80 $6,543,412.80 $4,240,854.67* Financing of $1,622,000 for 20 years at a 6% interest rate and $2,050,000 downpayment** Discount Rate = 4.5%*** Financing of $3,672,000 for 20 years at a 6% interest rate and $0.0 downpayment
Net Present Value of PV System = Present Value of Benefits - Present Value of Costs= $3,489,700.44- $3,965,544.59= -$475,844.14
Cost of Generation =Total kWh Generated over Life of System
= $3,965,544.5927888960 kWh
= $0.142 /kWh
Benefit-Cost Ratio =
= $3,489,700.44$3,965,544.59
= 0.880
Payback = The period of time required for the profit or other benefits of the system toequal the cost of the initial investment.
= Year 30+
Net Present Benefit of the PV SystemNet Present Cost of the PV System
Baseline Financial Analysis 500 kW Crystalline Silicon PV Power Station(Fixed System)
Net Present Cost of PV System
Baseline Financial Analysis 500 kW Crystalline Silicon PV Power Station(Fixed System)
Net Present Cost of PV System Present Value of Costs w/o Downpayment
Baseline Financial Analysis 500 kW Crystalline Silicon PV Power Station(Fixed System)
Present Value of Benefits Net Cash Flows

Year kWh Ave. Cost Value of Present Value Present Value Net Cash Net Cash PaybackGenerated $/kWh Energy Factor* of Benefits Flow w/o DP Flow w/ DP (Cost=$2.903M)
0 0 $0.00 1.0000 $0.00 $0.00 -$1,500,000.00 $0.001 810982 0.16 $129,757.12 0.9569 $124,164.59 -$121,946.75 $3,215.77 $124,164.592 810982 0.1648 $133,649.83 0.9157 $122,383.15 -$113,131.69 $6,641.87 $246,547.743 810982 0.169744 $137,659.33 0.8763 $120,630.87 -$104,750.43 $9,869.61 $367,178.614 810982 0.17483632 $141,789.11 0.8386 $118,904.35 -$96,780.65 $12,908.23 $486,082.965 810982 0.18008141 $146,042.78 0.8025 $117,199.33 -$89,200.87 $15,766.13 $603,282.296 810982 0.185483852 $150,424.07 0.7679 $115,510.64 -$81,990.56 $18,450.76 $718,792.937 810982 0.191048367 $154,936.79 0.7348 $113,847.55 -$75,140.44 $20,971.40 $832,640.488 810982 0.196779818 $159,584.89 0.7032 $112,220.10 -$68,640.49 $23,338.07 $944,860.589 810982 0.202683213 $164,372.44 0.6729 $110,606.21 -$62,461.32 $25,554.00 $1,055,466.7910 810982 0.208763709 $169,303.61 0.6439 $109,014.59 -$56,594.24 $27,627.88 $1,164,481.3811 810982 0.215026621 $174,382.72 0.6162 $107,454.63 -$51,029.86 $29,569.10 $1,271,936.0112 810982 0.221477419 $179,614.20 0.5897 $105,918.49 -$45,750.29 $31,382.47 $1,377,854.5113 810982 0.228121742 $185,002.63 0.5643 $104,396.98 -$40,739.01 $33,071.43 $1,482,251.4914 810982 0.234965394 $190,552.71 0.54 $102,898.46 -$35,987.65 $34,644.35 $1,585,149.9515 810982 0.242014356 $196,269.29 0.5167 $101,412.34 -$31,481.10 $36,103.26 $1,686,562.2916 810982 0.249274787 $202,157.37 0.4945 $99,966.82 -$27,216.86 $37,463.74 $1,786,529.1117 810982 0.25675303 $208,222.09 0.4732 $98,530.69 -$23,174.70 $38,719.86 $1,885,059.8018 810982 0.264455621 $214,468.75 0.4528 $97,111.45 -$19,347.13 $39,879.11 $1,982,171.2519 810982 0.27238929 $220,902.81 0.4333 $95,717.19 -$15,726.06 $40,949.58 $2,077,888.4420 810982 0.280560968 $227,529.90 0.4146 $94,333.89 -$12,299.78 $41,929.90 $2,172,222.33
Totals 16219640 $3,486,622.41 $2,172,222.33* Discount Rate = 4.5%
Year Annual PV Annual O&M Total Annual Present Value Present Value Annual PV Annual O&M Total Annual Present Value Present ValueSys. Payment* Costs Costs Factor** of Costs Sys. Payment*** Costs Costs Factor** of Costs
0 $1,500,000.00 $0.00 $1,500,000.00 1.0000 $1,500,000.00 $0.00 $0.00 $0.00 1.0000 $0.001 $122,341.60 $4,054.91 $126,396.51 0.9569 $120,948.82 $253,141.60 $4,054.91 $257,196.51 0.9569 $246,111.342 $122,341.60 $4,054.91 $126,396.51 0.9157 $115,741.28 $253,141.60 $4,054.91 $257,196.51 0.9157 $235,514.843 $122,341.60 $4,054.91 $126,396.51 0.8763 $110,761.26 $253,141.60 $4,054.91 $257,196.51 0.8763 $225,381.304 $122,341.60 $4,054.91 $126,396.51 0.8386 $105,996.11 $253,141.60 $4,054.91 $257,196.51 0.8386 $215,684.995 $122,341.60 $4,054.91 $126,396.51 0.8025 $101,433.20 $253,141.60 $4,054.91 $257,196.51 0.8025 $206,400.206 $122,341.60 $4,054.91 $126,396.51 0.7679 $97,059.88 $253,141.60 $4,054.91 $257,196.51 0.7679 $197,501.207 $122,341.60 $4,054.91 $126,396.51 0.7348 $92,876.16 $253,141.60 $4,054.91 $257,196.51 0.7348 $188,988.008 $122,341.60 $4,054.91 $126,396.51 0.7032 $88,882.03 $253,141.60 $4,054.91 $257,196.51 0.7032 $180,860.599 $122,341.60 $4,054.91 $126,396.51 0.6729 $85,052.21 $253,141.60 $4,054.91 $257,196.51 0.6729 $173,067.5310 $122,341.60 $4,054.91 $126,396.51 0.6439 $81,386.71 $253,141.60 $4,054.91 $257,196.51 0.6439 $165,608.8311 $122,341.60 $4,054.91 $126,396.51 0.6162 $77,885.53 $253,141.60 $4,054.91 $257,196.51 0.6162 $158,484.4912 $122,341.60 $4,054.91 $126,396.51 0.5897 $74,536.02 $253,141.60 $4,054.91 $257,196.51 0.5897 $151,668.7813 $122,341.60 $4,054.91 $126,396.51 0.5643 $71,325.55 $253,141.60 $4,054.91 $257,196.51 0.5643 $145,135.9914 $122,341.60 $4,054.91 $126,396.51 0.54 $68,254.12 $253,141.60 $4,054.91 $257,196.51 0.54 $138,886.1215 $122,341.60 $4,054.91 $126,396.51 0.5167 $65,309.08 $253,141.60 $4,054.91 $257,196.51 0.5167 $132,893.4416 $122,341.60 $4,054.91 $126,396.51 0.4945 $62,503.07 $253,141.60 $4,054.91 $257,196.51 0.4945 $127,183.6717 $122,341.60 $4,054.91 $126,396.51 0.4732 $59,810.83 $253,141.60 $4,054.91 $257,196.51 0.4732 $121,705.3918 $122,341.60 $4,054.91 $126,396.51 0.4528 $57,232.34 $253,141.60 $4,054.91 $257,196.51 0.4528 $116,458.5819 $122,341.60 $4,054.91 $126,396.51 0.4333 $54,767.61 $253,141.60 $4,054.91 $257,196.51 0.4333 $111,443.2520 $122,341.60 $4,054.91 $126,396.51 0.4146 $52,403.99 $253,141.60 $4,054.91 $257,196.51 0.4146 $106,633.67
Totals $3,946,832.00 $81,098.20 $4,027,930.20 $3,144,165.80 $5,062,832.00 $81,098.20 $5,143,930.20 $3,345,612.20* Financing of $1,403,000 for 20 years at a 6% interest rate and $1,500,000 downpayment** Discount Rate = 4.5%*** Financing of $2,903,000 for 20 years at a 6% interest rate and $0.00 downpayment
Net Present Value of PV System = Present Value of Benefits - Present Worth of Costs= $2,172,222.33- $3,144,165.80= -$971,943.47
Cost of Generation =Total kWh Generated over Life of System
= $3,144,165.8016219640 kWh
= $0.194 /kWh
Benefit-Cost Ratio =
= $2,172,222.33$3,144,165.80
= 0.691
Payback = The period of time required for the profit or other benefits of the system toequal the cost of the initial investment.
= 20+ Years
Present Value of Costs w/o Downpayment
Baseline Financial Analysis 500 kW Amorphous Silicon PV Power Station
Baseline Financial Analysis 500 kW Amorphous Silicon PV Power Station
Present Value of Benefits Net Cash Flows
Baseline Financial Analysis 500 kW Amorphous Silicon PV Power Station
Net Present Cost of PV System
Net Present Benefit of the PV SystemNet Present Cost of the PV System
Net Present Cost of PV System

Year kWh Ave. Cost Value of Present Value Present Value Net Cash Net Cash PaybackGenerated $/kWh Energy Factor* of Benefits Flow w/o DP Flow w/ DP (Cost=$1.559M)
0 0 1.0000 $0.00 $0.00 -$800,000.00 $0.001 433535 0.16 $69,365.60 0.9569 $66,375.94 -$65,783.88 $969.46 $66,375.942 433535 0.1648 $71,446.57 0.9157 $65,423.62 -$61,045.97 $2,833.26 $131,799.563 433535 0.169744 $73,589.97 0.8763 $64,486.89 -$56,541.08 $4,589.61 $196,286.454 433535 0.17483632 $75,797.66 0.8386 $63,563.92 -$52,257.20 $6,243.54 $259,850.375 433535 0.18008141 $78,071.59 0.8025 $62,652.45 -$48,182.81 $7,799.59 $322,502.836 433535 0.185483852 $80,413.74 0.7679 $61,749.71 -$44,306.86 $9,261.85 $384,252.547 433535 0.191048367 $82,826.15 0.7348 $60,860.66 -$40,624.39 $10,635.26 $445,113.208 433535 0.196779818 $85,310.94 0.7032 $59,990.65 -$37,130.04 $11,925.19 $505,103.859 433535 0.202683213 $87,870.27 0.6729 $59,127.90 -$33,807.98 $13,133.52 $564,231.75
10 433535 0.208763709 $90,506.37 0.6439 $58,277.05 -$30,653.57 $14,264.90 $622,508.8111 433535 0.215026621 $93,221.57 0.6162 $57,443.13 -$27,661.78 $15,324.33 $679,951.9312 433535 0.221477419 $96,018.21 0.5897 $56,621.94 -$24,822.99 $16,314.49 $736,573.8813 433535 0.228121742 $98,898.76 0.5643 $55,808.57 -$22,128.30 $17,237.27 $792,382.4414 433535 0.234965394 $101,865.72 0.54 $55,007.49 -$19,573.25 $18,097.15 $847,389.9315 433535 0.242014356 $104,921.69 0.5167 $54,213.04 -$17,149.68 $18,895.32 $901,602.9716 433535 0.249274787 $108,069.34 0.4945 $53,440.29 -$14,856.33 $19,639.99 $955,043.2717 433535 0.25675303 $111,311.42 0.4732 $52,672.57 -$12,682.26 $20,328.18 $1,007,715.8318 433535 0.264455621 $114,650.77 0.4528 $51,913.87 -$10,623.46 $20,963.87 $1,059,629.7019 433535 0.27238929 $118,090.29 0.4333 $51,168.52 -$8,675.61 $21,551.40 $1,110,798.2220 433535 0.280560968 $121,633.00 0.4146 $50,429.04 -$6,832.39 $22,090.11 $1,161,227.2621 433535 0.288977798 $125,281.99 0.3968 $49,711.89 $48,851.76 $48,851.76 $1,210,939.1622 433535 0.297647131 $129,040.45 0.3797 $48,996.66 $48,173.59 $48,173.59 $1,259,935.8223 433535 0.306576545 $132,911.66 0.3634 $48,300.10 $47,512.37 $47,512.37 $1,308,235.9124 433535 0.315773842 $136,899.01 0.3477 $47,599.79 $46,846.09 $46,846.09 $1,355,835.7025 433535 0.325247057 $141,005.98 0.3327 $46,912.69 $46,191.51 $46,191.51 $1,402,748.3926 433535 0.335004469 $145,236.16 0.3184 $46,243.19 $45,553.01 $45,553.01 $1,448,991.5827 433535 0.345054603 $149,593.25 0.3047 $45,581.06 $44,920.57 $44,920.57 $1,494,572.6528 433535 0.355406241 $154,081.04 0.2916 $44,930.03 $44,297.94 $44,297.94 $1,539,502.6829 433535 0.366068428 $158,703.48 0.279 $44,278.27 $43,673.49 $43,673.49 $1,583,780.9530 433535 0.377050481 $163,464.58 0.267 $43,645.04 $40,652.54 $43,066.27 $1,627,425.99
Totals 13006050 $3,300,097.26 $1,627,425.99* Discount Rate= 4.5%
Net Present Value of Costs without a DownpaymentYear Annual PV Annual O&M Total Annual Present Value Present Value Annual PV Annual O&M Total Annual Present Value Present Value
Sys. Payment* Costs Costs Factor** of Costs Sys. Payment*** Costs Costs Factor** of Costs0 $800,000.00 $0.00 $800,000.00 1.0000 $800,000.00 $0.00 $0.00 $0.00 1.0000 $0.001 $66,184.80 $2,167.68 $68,352.48 0.9569 $65,406.48 $135,944.80 $2,167.68 $138,112.48 0.9569 $132,159.832 $66,184.80 $2,167.68 $68,352.48 0.9157 $62,590.36 $135,944.80 $2,167.68 $138,112.48 0.9157 $126,469.593 $66,184.80 $2,167.68 $68,352.48 0.8763 $59,897.27 $135,944.80 $2,167.68 $138,112.48 0.8763 $121,027.964 $66,184.80 $2,167.68 $68,352.48 0.8386 $57,320.39 $135,944.80 $2,167.68 $138,112.48 0.8386 $115,821.125 $66,184.80 $2,167.68 $68,352.48 0.8025 $54,852.86 $135,944.80 $2,167.68 $138,112.48 0.8025 $110,835.266 $66,184.80 $2,167.68 $68,352.48 0.7679 $52,487.87 $135,944.80 $2,167.68 $138,112.48 0.7679 $106,056.577 $66,184.80 $2,167.68 $68,352.48 0.7348 $50,225.40 $135,944.80 $2,167.68 $138,112.48 0.7348 $101,485.058 $66,184.80 $2,167.68 $68,352.48 0.7032 $48,065.46 $135,944.80 $2,167.68 $138,112.48 0.7032 $97,120.699 $66,184.80 $2,167.68 $68,352.48 0.6729 $45,994.38 $135,944.80 $2,167.68 $138,112.48 0.6729 $92,935.88
10 $66,184.80 $2,167.68 $68,352.48 0.6439 $44,012.16 $135,944.80 $2,167.68 $138,112.48 0.6439 $88,930.6211 $66,184.80 $2,167.68 $68,352.48 0.6162 $42,118.80 $135,944.80 $2,167.68 $138,112.48 0.6162 $85,104.9112 $66,184.80 $2,167.68 $68,352.48 0.5897 $40,307.45 $135,944.80 $2,167.68 $138,112.48 0.5897 $81,444.9313 $66,184.80 $2,167.68 $68,352.48 0.5643 $38,571.30 $135,944.80 $2,167.68 $138,112.48 0.5643 $77,936.8714 $66,184.80 $2,167.68 $68,352.48 0.54 $36,910.34 $135,944.80 $2,167.68 $138,112.48 0.54 $74,580.7415 $66,184.80 $2,167.68 $68,352.48 0.5167 $35,317.72 $135,944.80 $2,167.68 $138,112.48 0.5167 $71,362.7216 $66,184.80 $2,167.68 $68,352.48 0.4945 $33,800.30 $135,944.80 $2,167.68 $138,112.48 0.4945 $68,296.6217 $66,184.80 $2,167.68 $68,352.48 0.4732 $32,344.39 $135,944.80 $2,167.68 $138,112.48 0.4732 $65,354.8218 $66,184.80 $2,167.68 $68,352.48 0.4528 $30,950.00 $135,944.80 $2,167.68 $138,112.48 0.4528 $62,537.3319 $66,184.80 $2,167.68 $68,352.48 0.4333 $29,617.13 $135,944.80 $2,167.68 $138,112.48 0.4333 $59,844.1420 $66,184.80 $2,167.68 $68,352.48 0.4146 $28,338.94 $135,944.80 $2,167.68 $138,112.48 0.4146 $57,261.4321 $0.00 $2,167.68 $2,167.68 0.3968 $860.13 $0.00 $2,167.68 $2,167.68 0.3968 $860.1322 $0.00 $2,167.68 $2,167.68 0.3797 $823.07 $0.00 $2,167.68 $2,167.68 0.3797 $823.0723 $0.00 $2,167.68 $2,167.68 0.3634 $787.73 $0.00 $2,167.68 $2,167.68 0.3634 $787.7324 $0.00 $2,167.68 $2,167.68 0.3477 $753.70 $0.00 $2,167.68 $2,167.68 0.3477 $753.7025 $0.00 $2,167.68 $2,167.68 0.3327 $721.19 $0.00 $2,167.68 $2,167.68 0.3327 $721.1926 $0.00 $2,167.68 $2,167.68 0.3184 $690.19 $0.00 $2,167.68 $2,167.68 0.3184 $690.1927 $0.00 $2,167.68 $2,167.68 0.3047 $660.49 $0.00 $2,167.68 $2,167.68 0.3047 $660.4928 $0.00 $2,167.68 $2,167.68 0.2916 $632.09 $0.00 $2,167.68 $2,167.68 0.2916 $632.0929 $0.00 $2,167.68 $2,167.68 0.279 $604.78 $0.00 $2,167.68 $2,167.68 0.279 $604.7830 $0.00 $2,167.68 $2,167.68 0.267 $578.77 $0.00 $11,207.88 $11,207.88 0.267 $2,992.50
Totals $2,123,696.00 $65,030.25 $2,188,726.25 $1,696,241.14 $2,718,896.00 $74,070.46 $2,792,966.46 $1,806,092.95* Financing of $759,000 for 20 years at a 6.0% interest rate and $800,000 downpayment** Discount Rate = 4.5%*** Financing of $1,559,000 for 20 years at a 6% interest rate and $0.0 downpayment
Net Present Value of PV System = Present Value of Benefits - Present Worth of Costs= $1,627,425.99- $1,696,241.14= -$68,815.14
Cost of Generation =Total kWh Generated over Life of System
= $1,696,241.1413006050 kWh
= $0.130 /kWh
Benefit-Cost Ratio =
= $1,627,425.99$1,696,241.14
= 0.959
Payback = The period of time required for the profit or other benefits of the system toequal the cost of the initial investment.
= Year 28
Net Present Cost of the PV SystemNet Present Benefit of the PV System
Baseline Financial Analysis 200 kW Crystalline Silicon (Tracking) PV Power Station
Present Value of Benefits Net Cash Flows
Baseline Financial Analysis 200 kW Crystalline Silicon (Tracking) PV Power Station
Net Present Value of Costs with a Downpayment
Baseline Financial Analysis 200 kW Crystalline Silicon (Tracking) PV Power Station
Net Present Cost of PV System
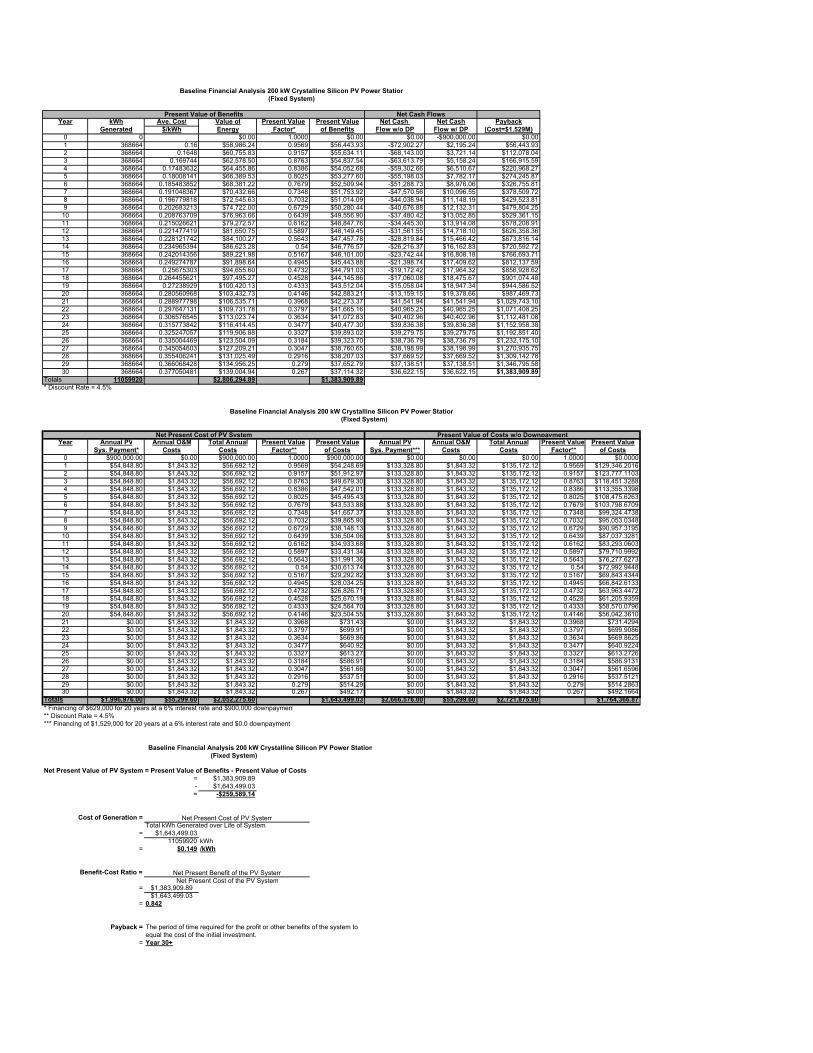
Year kWh Ave. Cost Value of Present Value Present Value Net Cash Net Cash PaybackGenerated $/kWh Energy Factor* of Benefits Flow w/o DP Flow w/ DP (Cost=$1.529M)
0 0 $0.00 1.0000 $0.00 $0.00 -$900,000.00 $0.001 368664 0.16 $58,986.24 0.9569 $56,443.93 -$72,902.27 $2,195.24 $56,443.932 368664 0.1648 $60,755.83 0.9157 $55,634.11 -$68,143.00 $3,721.14 $112,078.043 368664 0.169744 $62,578.50 0.8763 $54,837.54 -$63,613.79 $5,158.24 $166,915.594 368664 0.17483632 $64,455.86 0.8386 $54,052.68 -$59,302.66 $6,510.67 $220,968.275 368664 0.18008141 $66,389.53 0.8025 $53,277.60 -$55,198.03 $7,782.17 $274,245.876 368664 0.185483852 $68,381.22 0.7679 $52,509.94 -$51,288.73 $8,976.06 $326,755.817 368664 0.191048367 $70,432.66 0.7348 $51,753.92 -$47,570.56 $10,096.55 $378,509.728 368664 0.196779818 $72,545.63 0.7032 $51,014.09 -$44,038.94 $11,148.19 $429,523.819 368664 0.202683213 $74,722.00 0.6729 $50,280.44 -$40,676.88 $12,132.31 $479,804.25
10 368664 0.208763709 $76,963.66 0.6439 $49,556.90 -$37,480.42 $13,052.85 $529,361.1511 368664 0.215026621 $79,272.57 0.6162 $48,847.76 -$34,445.30 $13,914.08 $578,208.9112 368664 0.221477419 $81,650.75 0.5897 $48,149.45 -$31,561.55 $14,718.10 $626,358.3613 368664 0.228121742 $84,100.27 0.5643 $47,457.78 -$28,819.84 $15,466.42 $673,816.1414 368664 0.234965394 $86,623.28 0.54 $46,776.57 -$26,216.37 $16,162.83 $720,592.7215 368664 0.242014356 $89,221.98 0.5167 $46,101.00 -$23,742.44 $16,808.18 $766,693.7116 368664 0.249274787 $91,898.64 0.4945 $45,443.88 -$21,398.74 $17,409.62 $812,137.5917 368664 0.25675303 $94,655.60 0.4732 $44,791.03 -$19,172.42 $17,964.32 $856,928.6218 368664 0.264455621 $97,495.27 0.4528 $44,145.86 -$17,060.08 $18,475.67 $901,074.4819 368664 0.27238929 $100,420.13 0.4333 $43,512.04 -$15,058.04 $18,947.34 $944,586.5220 368664 0.280560968 $103,432.73 0.4146 $42,883.21 -$13,159.15 $19,378.66 $987,469.7321 368664 0.288977798 $106,535.71 0.3968 $42,273.37 $41,541.94 $41,541.94 $1,029,743.1022 368664 0.297647131 $109,731.78 0.3797 $41,665.16 $40,965.25 $40,965.25 $1,071,408.2523 368664 0.306576545 $113,023.74 0.3634 $41,072.83 $40,402.96 $40,402.96 $1,112,481.0824 368664 0.315773842 $116,414.45 0.3477 $40,477.30 $39,836.38 $39,836.38 $1,152,958.3825 368664 0.325247057 $119,906.88 0.3327 $39,893.02 $39,279.75 $39,279.75 $1,192,851.4026 368664 0.335004469 $123,504.09 0.3184 $39,323.70 $38,736.79 $38,736.79 $1,232,175.1027 368664 0.345054603 $127,209.21 0.3047 $38,760.65 $38,198.99 $38,198.99 $1,270,935.7528 368664 0.355406241 $131,025.49 0.2916 $38,207.03 $37,669.52 $37,669.52 $1,309,142.7829 368664 0.366068428 $134,956.25 0.279 $37,652.79 $37,138.51 $37,138.51 $1,346,795.5830 368664 0.377050481 $139,004.94 0.267 $37,114.32 $36,622.15 $36,622.15 $1,383,909.89
Totals 11059920 $2,806,294.89 $1,383,909.89* Discount Rate = 4.5%
Year Annual PV Annual O&M Total Annual Present Value Present Value Annual PV Annual O&M Total Annual Present Value Present ValueSys. Payment* Costs Costs Factor** of Costs Sys. Payment*** Costs Costs Factor** of Costs
0 $900,000.00 $0.00 $900,000.00 1.0000 $900,000.00 $0.00 $0.00 $0.00 1.0000 $0.00001 $54,848.80 $1,843.32 $56,692.12 0.9569 $54,248.69 $133,328.80 $1,843.32 $135,172.12 0.9569 $129,346.20162 $54,848.80 $1,843.32 $56,692.12 0.9157 $51,912.97 $133,328.80 $1,843.32 $135,172.12 0.9157 $123,777.11033 $54,848.80 $1,843.32 $56,692.12 0.8763 $49,679.30 $133,328.80 $1,843.32 $135,172.12 0.8763 $118,451.32884 $54,848.80 $1,843.32 $56,692.12 0.8386 $47,542.01 $133,328.80 $1,843.32 $135,172.12 0.8386 $113,355.33985 $54,848.80 $1,843.32 $56,692.12 0.8025 $45,495.43 $133,328.80 $1,843.32 $135,172.12 0.8025 $108,475.62636 $54,848.80 $1,843.32 $56,692.12 0.7679 $43,533.88 $133,328.80 $1,843.32 $135,172.12 0.7679 $103,798.67097 $54,848.80 $1,843.32 $56,692.12 0.7348 $41,657.37 $133,328.80 $1,843.32 $135,172.12 0.7348 $99,324.47388 $54,848.80 $1,843.32 $56,692.12 0.7032 $39,865.90 $133,328.80 $1,843.32 $135,172.12 0.7032 $95,053.03489 $54,848.80 $1,843.32 $56,692.12 0.6729 $38,148.13 $133,328.80 $1,843.32 $135,172.12 0.6729 $90,957.3195
10 $54,848.80 $1,843.32 $56,692.12 0.6439 $36,504.06 $133,328.80 $1,843.32 $135,172.12 0.6439 $87,037.328111 $54,848.80 $1,843.32 $56,692.12 0.6162 $34,933.68 $133,328.80 $1,843.32 $135,172.12 0.6162 $83,293.060312 $54,848.80 $1,843.32 $56,692.12 0.5897 $33,431.34 $133,328.80 $1,843.32 $135,172.12 0.5897 $79,710.999213 $54,848.80 $1,843.32 $56,692.12 0.5643 $31,991.36 $133,328.80 $1,843.32 $135,172.12 0.5643 $76,277.627314 $54,848.80 $1,843.32 $56,692.12 0.54 $30,613.74 $133,328.80 $1,843.32 $135,172.12 0.54 $72,992.944815 $54,848.80 $1,843.32 $56,692.12 0.5167 $29,292.82 $133,328.80 $1,843.32 $135,172.12 0.5167 $69,843.434416 $54,848.80 $1,843.32 $56,692.12 0.4945 $28,034.25 $133,328.80 $1,843.32 $135,172.12 0.4945 $66,842.613317 $54,848.80 $1,843.32 $56,692.12 0.4732 $26,826.71 $133,328.80 $1,843.32 $135,172.12 0.4732 $63,963.447218 $54,848.80 $1,843.32 $56,692.12 0.4528 $25,670.19 $133,328.80 $1,843.32 $135,172.12 0.4528 $61,205.935919 $54,848.80 $1,843.32 $56,692.12 0.4333 $24,564.70 $133,328.80 $1,843.32 $135,172.12 0.4333 $58,570.079620 $54,848.80 $1,843.32 $56,692.12 0.4146 $23,504.55 $133,328.80 $1,843.32 $135,172.12 0.4146 $56,042.361021 $0.00 $1,843.32 $1,843.32 0.3968 $731.43 $0.00 $1,843.32 $1,843.32 0.3968 $731.429422 $0.00 $1,843.32 $1,843.32 0.3797 $699.91 $0.00 $1,843.32 $1,843.32 0.3797 $699.908623 $0.00 $1,843.32 $1,843.32 0.3634 $669.86 $0.00 $1,843.32 $1,843.32 0.3634 $669.862524 $0.00 $1,843.32 $1,843.32 0.3477 $640.92 $0.00 $1,843.32 $1,843.32 0.3477 $640.922425 $0.00 $1,843.32 $1,843.32 0.3327 $613.27 $0.00 $1,843.32 $1,843.32 0.3327 $613.272626 $0.00 $1,843.32 $1,843.32 0.3184 $586.91 $0.00 $1,843.32 $1,843.32 0.3184 $586.913127 $0.00 $1,843.32 $1,843.32 0.3047 $561.66 $0.00 $1,843.32 $1,843.32 0.3047 $561.659628 $0.00 $1,843.32 $1,843.32 0.2916 $537.51 $0.00 $1,843.32 $1,843.32 0.2916 $537.512129 $0.00 $1,843.32 $1,843.32 0.279 $514.29 $0.00 $1,843.32 $1,843.32 0.279 $514.286330 $0.00 $1,843.32 $1,843.32 0.267 $492.17 $0.00 $1,843.32 $1,843.32 0.267 $492.1664
Totals $1,996,976.00 $55,299.60 $2,052,275.60 $1,643,499.03 $2,666,576.00 $55,299.60 $2,721,875.60 $1,764,366.87* Financing of $629,000 for 20 years at a 6% interest rate and $900,000 downpayment** Discount Rate = 4.5%*** Financing of $1,529,000 for 20 years at a 6% interest rate and $0.0 downpayment
Net Present Value of PV System = Present Value of Benefits - Present Value of Costs= $1,383,909.89- $1,643,499.03= -$259,589.14
Cost of Generation =Total kWh Generated over Life of System
= $1,643,499.0311059920 kWh
= $0.149 /kWh
Benefit-Cost Ratio =
= $1,383,909.89$1,643,499.03
= 0.842
Payback = The period of time required for the profit or other benefits of the system toequal the cost of the initial investment.
= Year 30+
Baseline Financial Analysis 200 kW Crystalline Silicon PV Power Station(Fixed System)
Present Value of Benefits Net Cash Flows
Baseline Financial Analysis 200 kW Crystalline Silicon PV Power Station(Fixed System)
Net Present Cost of PV System Present Value of Costs w/o Downpayment
Net Present Benefit of the PV SystemNet Present Cost of the PV System
Baseline Financial Analysis 200 kW Crystalline Silicon PV Power Station(Fixed System)
Net Present Cost of PV System

Year kWh Ave. Cost Value of Present Value Present Value Net Cash Net Cash PaybackGenerated $/kWh Energy Factor* of Benefits Flow w/o DP Flow w/ DP (Cost=$1.221M)
0 0 $0.00 1.0000 $0.00 $0.00 -$700,000.00 $0.001 321043 0.16 $51,366.88 0.9569 $49,152.97 -$54,265.35 $4,143.82 $49,152.972 321043 0.1648 $52,907.89 0.9157 $48,447.75 -$50,517.82 $5,376.51 $97,600.723 321043 0.169744 $54,495.12 0.8763 $47,754.08 -$46,953.29 $6,536.07 $145,354.804 321043 0.17483632 $56,129.98 0.8386 $47,070.60 -$43,562.28 $7,625.86 $192,425.395 321043 0.18008141 $57,813.88 0.8025 $46,395.64 -$40,335.69 $8,648.91 $238,821.036 321043 0.185483852 $59,548.29 0.7679 $45,727.13 -$37,264.75 $9,607.87 $284,548.167 321043 0.191048367 $61,334.74 0.7348 $45,068.77 -$34,345.78 $10,506.41 $329,616.938 321043 0.196779818 $63,174.78 0.7032 $44,424.51 -$31,574.83 $11,348.50 $374,041.449 321043 0.202683213 $65,070.03 0.6729 $43,785.62 -$28,939.00 $12,134.82 $417,827.0610 321043 0.208763709 $67,022.13 0.6439 $43,155.55 -$26,434.86 $12,868.80 $460,982.6111 321043 0.215026621 $69,032.79 0.6162 $42,538.01 -$24,058.68 $13,554.17 $503,520.6112 321043 0.221477419 $71,103.78 0.5897 $41,929.90 -$21,802.77 $14,192.52 $545,450.5113 321043 0.228121742 $73,236.89 0.5643 $41,327.58 -$19,659.94 $14,784.93 $586,778.0914 321043 0.234965394 $75,434.00 0.54 $40,734.36 -$17,626.91 $15,334.69 $627,512.4415 321043 0.242014356 $77,697.01 0.5167 $40,146.05 -$15,697.04 $15,842.33 $667,658.4916 321043 0.249274787 $80,027.93 0.4945 $39,573.81 -$13,869.98 $16,314.30 $707,232.3017 321043 0.25675303 $82,428.76 0.4732 $39,005.29 -$12,136.47 $16,747.66 $746,237.5918 321043 0.264455621 $84,901.63 0.4528 $38,443.46 -$10,493.54 $17,145.37 $784,681.0519 321043 0.27238929 $87,448.67 0.4333 $37,891.51 -$8,938.00 $17,510.63 $822,572.5620 321043 0.280560968 $90,072.14 0.4146 $37,343.91 -$7,464.57 $17,842.61 $859,916.46
Totals 6420860 $1,380,247.30 $859,916.46* Discount Rate = 4.5%
Year Annual PV Annual O&M Total Annual Present Value Present Value Annual PV Annual O&M Total Annual Present Value Present ValueSys. Payment* Costs Costs Factor** of Costs Sys. Payment*** Costs Costs Factor** of Costs
0 $700,000.00 $0.00 $700,000.00 1.0000 $700,000.00 $0.00 $0.00 $0.00 1.0000 $0.001 $45,431.20 $1,605.22 $47,036.42 0.9569 $45,009.15 $106,471.20 $1,605.22 $108,076.42 0.9569 $103,418.322 $45,431.20 $1,605.22 $47,036.42 0.9157 $43,071.25 $106,471.20 $1,605.22 $108,076.42 0.9157 $98,965.573 $45,431.20 $1,605.22 $47,036.42 0.8763 $41,218.01 $106,471.20 $1,605.22 $108,076.42 0.8763 $94,707.364 $45,431.20 $1,605.22 $47,036.42 0.8386 $39,444.74 $106,471.20 $1,605.22 $108,076.42 0.8386 $90,632.885 $45,431.20 $1,605.22 $47,036.42 0.8025 $37,746.72 $106,471.20 $1,605.22 $108,076.42 0.8025 $86,731.326 $45,431.20 $1,605.22 $47,036.42 0.7679 $36,119.26 $106,471.20 $1,605.22 $108,076.42 0.7679 $82,991.887 $45,431.20 $1,605.22 $47,036.42 0.7348 $34,562.36 $106,471.20 $1,605.22 $108,076.42 0.7348 $79,414.558 $45,431.20 $1,605.22 $47,036.42 0.7032 $33,076.01 $106,471.20 $1,605.22 $108,076.42 0.7032 $75,999.349 $45,431.20 $1,605.22 $47,036.42 0.6729 $31,650.80 $106,471.20 $1,605.22 $108,076.42 0.6729 $72,724.6210 $45,431.20 $1,605.22 $47,036.42 0.6439 $30,286.75 $106,471.20 $1,605.22 $108,076.42 0.6439 $69,590.4011 $45,431.20 $1,605.22 $47,036.42 0.6162 $28,983.84 $106,471.20 $1,605.22 $108,076.42 0.6162 $66,596.6912 $45,431.20 $1,605.22 $47,036.42 0.5897 $27,737.37 $106,471.20 $1,605.22 $108,076.42 0.5897 $63,732.6613 $45,431.20 $1,605.22 $47,036.42 0.5643 $26,542.65 $106,471.20 $1,605.22 $108,076.42 0.5643 $60,987.5214 $45,431.20 $1,605.22 $47,036.42 0.54 $25,399.66 $106,471.20 $1,605.22 $108,076.42 0.54 $58,361.2615 $45,431.20 $1,605.22 $47,036.42 0.5167 $24,303.72 $106,471.20 $1,605.22 $108,076.42 0.5167 $55,843.0816 $45,431.20 $1,605.22 $47,036.42 0.4945 $23,259.51 $106,471.20 $1,605.22 $108,076.42 0.4945 $53,443.7917 $45,431.20 $1,605.22 $47,036.42 0.4732 $22,257.63 $106,471.20 $1,605.22 $108,076.42 0.4732 $51,141.7618 $45,431.20 $1,605.22 $47,036.42 0.4528 $21,298.09 $106,471.20 $1,605.22 $108,076.42 0.4528 $48,937.0019 $45,431.20 $1,605.22 $47,036.42 0.4333 $20,380.88 $106,471.20 $1,605.22 $108,076.42 0.4333 $46,829.5120 $45,431.20 $1,605.22 $47,036.42 0.4146 $19,501.30 $106,471.20 $1,605.22 $108,076.42 0.4146 $44,808.48
Totals $1,608,624.00 $32,104.30 $1,640,728.30 $1,311,849.69 $2,129,424.00 $32,104.30 $2,161,528.30 $1,405,858.01* Financing of $521,000 for 20 years at a 6% interest rate and $700,000 downpayment** Discount Rate = 4.5%*** Financing of $1,221,000 for 20 years at a 6% interest rate and $0.00 downpayment
Net Present Value of PV System = Present Value of Benefits - Present Worth of Costs= $859,916.46- $1,311,849.69= -$451,933.22
Cost of Generation =Total kWh Generated over Life of System
= $1,311,849.696420860 kWh
= $0.204 /kWh
Benefit-Cost Ratio =
= $859,916.46$1,311,849.69
= 0.655
Payback = The period of time required for the profit or other benefits of the system toequal the cost of the initial investment.
= 20+ Years
Present Value of Costs w/o Downpayment
Baseline Financial Analysis 200 kW Amorphous Silicon PV Power Station
Baseline Financial Analysis 200 kW Amorphous Silicon PV Power Station
Present Value of Benefits Net Cash Flows
Baseline Financial Analysis 200 kW Amorphous Silicon PV Power Station
Net Present Cost of PV System
Net Present Benefit of the PV SystemNet Present Cost of the PV System
Net Present Cost of PV System

Millennium Energy LLC Brightfield Feasibility AssessmentFebruary, 2001 NREL Task Ordering Agreement # KDC-0-30470-00
Appendix E:Economic Analysis Spreadsheets
ForBest Case Scenario of PV System Options
Utilizing the 13-Year Financing Mechanism

Year kWh Ave. Cost Value of Clean Air Tax Credit Production Total Value Present Value Present Value Net Cash Net Cash PaybackGenerated $/kWh Energy Credits $/kWhr Tax Credits of Energy Factor* of Benefits Flow w/o DP Flow w/ DP (Cost=$6.134M)
0 0 $0.00 $0.00 $0.00 $0.00 $0.00 1.0000 $0.00 $0.00 -$2,800,000 $0.001 2241576 0.16 $358,652.16 $6,304.43 $0.0198 $26,224.96 $391,181.55 1.0000 $391,181.55 -$313,168.33 $3,231.67 $391,181.552 2241576 0.1648 $369,411.72 $6,304.43 $0.0204 $46,064.39 $421,780.54 1.0000 $421,780.54 -$282,569.34 $33,830.66 $812,962.103 2241576 0.169744 $380,494.08 $6,304.43 $0.0210 $47,409.33 $434,207.84 1.0000 $434,207.84 -$270,142.04 $46,257.96 $1,247,169.944 2241576 0.17483632 $391,908.90 $6,304.43 $0.0216 $48,754.28 $446,967.61 1.0000 $446,967.61 -$257,382.27 $59,017.73 $1,694,137.555 2241576 0.18008141 $403,666.17 $6,304.43 $0.0222 $50,099.22 $460,069.82 1.0000 $460,069.82 -$244,280.06 $72,119.94 $2,154,207.376 2241576 0.185483852 $415,776.15 $6,304.43 $0.0228 $51,444.17 $473,524.75 1.0000 $473,524.75 -$230,825.13 $85,574.87 $2,627,732.127 2241576 0.191048367 $428,249.44 $6,304.43 $0.0234 $52,789.11 $487,342.98 1.0000 $487,342.98 -$217,006.90 $99,393.10 $3,115,075.108 2241576 0.196779818 $441,096.92 $6,304.43 $0.0240 $54,134.06 $501,535.41 1.0000 $501,535.41 -$202,814.47 $113,585.53 $3,616,610.529 2241576 0.202683213 $454,329.83 $6,304.43 $0.0246 $55,479.01 $516,113.26 1.0000 $516,113.26 -$188,236.62 $128,163.38 $4,132,723.7810 2241576 0.208763709 $467,959.72 $6,304.43 $0.0252 $56,823.95 $531,088.10 1.0000 $531,088.10 -$173,261.78 $143,138.22 $4,663,811.8811 2241576 0.215026621 $481,998.51 $6,304.43 $0.0258 $58,168.90 $546,471.84 1.0000 $546,471.84 -$157,878.04 $158,521.96 $5,210,283.7312 2241576 0.221477419 $496,458.47 $6,304.43 $0.0264 $59,513.84 $562,276.74 1.0000 $562,276.74 -$142,073.14 $174,326.86 $5,772,560.4713 2241576 0.228121742 $511,352.22 $6,304.43 $0.0270 $45,391.91 $563,048.57 1.0000 $563,048.57 -$141,301.31 $175,098.69 $6,335,609.0414 2241576 0.234965394 $526,692.79 $6,304.43 $0.00 $0.00 $532,997.22 1.0000 $532,997.22 $521,789.34 $521,789.34 $6,868,606.2615 2241576 0.242014356 $542,493.57 $6,304.43 $0.00 $0.00 $548,798.00 1.0000 $548,798.00 $537,590.12 $537,590.12 $7,417,404.2616 2241576 0.249274787 $558,768.38 $6,304.43 $0.00 $0.00 $565,072.81 1.0000 $565,072.81 $553,864.93 $553,864.93 $7,982,477.0717 2241576 0.25675303 $575,531.43 $6,304.43 $0.00 $0.00 $581,835.86 1.0000 $581,835.86 $570,627.98 $570,627.98 $8,564,312.9418 2241576 0.264455621 $592,797.37 $6,304.43 $0.00 $0.00 $599,101.81 1.0000 $599,101.81 $587,893.93 $587,893.93 $9,163,414.7419 2241576 0.27238929 $610,581.29 $6,304.43 $0.00 $0.00 $616,885.73 1.0000 $616,885.73 $605,677.85 $605,677.85 $9,780,300.4720 2241576 0.280560968 $628,898.73 $6,304.43 $0.00 $0.00 $635,203.17 1.0000 $635,203.17 $623,995.29 $623,995.29 $10,415,503.6421 2241576 0.288977798 $647,765.70 $6,304.43 $0.00 $0.00 $654,070.13 1.0000 $654,070.13 $642,862.25 $642,862.25 $11,069,573.7722 2241576 0.297647131 $667,198.67 $6,304.43 $0.00 $0.00 $673,503.10 1.0000 $673,503.10 $662,295.22 $662,295.22 $11,743,076.8623 2241576 0.306576545 $687,214.63 $6,304.43 $0.00 $0.00 $693,519.06 1.0000 $693,519.06 $682,311.18 $682,311.18 $12,436,595.9224 2241576 0.315773842 $707,831.07 $6,304.43 $0.00 $0.00 $714,135.50 1.0000 $714,135.50 $702,927.62 $702,927.62 $13,150,731.4225 2241576 0.325247057 $729,066.00 $6,304.43 $0.00 $0.00 $735,370.43 1.0000 $735,370.43 $724,162.55 $724,162.55 $13,886,101.8526 2241576 0.335004469 $750,937.98 $6,304.43 $0.00 $0.00 $757,242.41 1.0000 $757,242.41 $746,034.53 $746,034.53 $14,643,344.2627 2241576 0.345054603 $773,466.12 $6,304.43 $0.00 $0.00 $779,770.55 1.0000 $779,770.55 $768,562.67 $768,562.67 $15,423,114.8128 2241576 0.355406241 $796,670.10 $6,304.43 $0.00 $0.00 $802,974.53 1.0000 $802,974.53 $791,766.65 $791,766.65 $16,226,089.3429 2241576 0.366068428 $820,570.20 $6,304.43 $0.00 $0.00 $826,874.64 1.0000 $826,874.64 $815,666.76 $815,666.76 $17,052,963.9830 2241576 0.377050481 $845,187.31 $6,304.43 $0.00 $0.00 $851,491.74 1.0000 $851,491.74 $840,283.86 $840,283.86 $17,904,455.72
Totals 67247280.00 $17,063,025.61 $189,132.98 $652,297.14 $17,904,455.72 $17,904,455.72* Discount Rate= 0.0%
Present Value of CostsYear Annual PV Annual O&M Total Annual Present Value Present Value Annual PV Annual O&M Total Annual Present Value Present Value
Sys. Payment* Costs Costs Factor** of Costs Sys. Payment*** Costs Costs Factor** of Costs0 $2,800,000.00 $0.00 $2,800,000.00 1.0000 $2,800,000.00 $0.00 $0.00 $0.00 1.0000 $0.00001 $376,742.00 $11,207.88 $387,949.88 1.0000 $387,949.88 $693,142.00 $11,207.88 $704,349.88 1.0000 $704,349.882 $376,742.00 $11,207.88 $387,949.88 1.0000 $387,949.88 $693,142.00 $11,207.88 $704,349.88 1.0000 $704,349.883 $376,742.00 $11,207.88 $387,949.88 1.0000 $387,949.88 $693,142.00 $11,207.88 $704,349.88 1.0000 $704,349.884 $376,742.00 $11,207.88 $387,949.88 1.0000 $387,949.88 $693,142.00 $11,207.88 $704,349.88 1.0000 $704,349.885 $376,742.00 $11,207.88 $387,949.88 1.0000 $387,949.88 $693,142.00 $11,207.88 $704,349.88 1.0000 $704,349.886 $376,742.00 $11,207.88 $387,949.88 1.0000 $387,949.88 $693,142.00 $11,207.88 $704,349.88 1.0000 $704,349.887 $376,742.00 $11,207.88 $387,949.88 1.0000 $387,949.88 $693,142.00 $11,207.88 $704,349.88 1.0000 $704,349.888 $376,742.00 $11,207.88 $387,949.88 1.0000 $387,949.88 $693,142.00 $11,207.88 $704,349.88 1.0000 $704,349.889 $376,742.00 $11,207.88 $387,949.88 1.0000 $387,949.88 $693,142.00 $11,207.88 $704,349.88 1.0000 $704,349.8810 $376,742.00 $11,207.88 $387,949.88 1.0000 $387,949.88 $693,142.00 $11,207.88 $704,349.88 1.0000 $704,349.8811 $376,742.00 $11,207.88 $387,949.88 1.0000 $387,949.88 $693,142.00 $11,207.88 $704,349.88 1.0000 $704,349.8812 $376,742.00 $11,207.88 $387,949.88 1.0000 $387,949.88 $693,142.00 $11,207.88 $704,349.88 1.0000 $704,349.8813 $376,742.00 $11,207.88 $387,949.88 1.0000 $387,949.88 $693,142.00 $11,207.88 $704,349.88 1.0000 $704,349.8814 $0.00 $11,207.88 $11,207.88 1.0000 $11,207.88 $0.00 $11,207.88 $11,207.88 1.0000 $11,207.8815 $0.00 $11,207.88 $11,207.88 1.0000 $11,207.88 $0.00 $11,207.88 $11,207.88 1.0000 $11,207.8816 $0.00 $11,207.88 $11,207.88 1.0000 $11,207.88 $0.00 $11,207.88 $11,207.88 1.0000 $11,207.8817 $0.00 $11,207.88 $11,207.88 1.0000 $11,207.88 $0.00 $11,207.88 $11,207.88 1.0000 $11,207.8818 $0.00 $11,207.88 $11,207.88 1.0000 $11,207.88 $0.00 $11,207.88 $11,207.88 1.0000 $11,207.8819 $0.00 $11,207.88 $11,207.88 1.0000 $11,207.88 $0.00 $11,207.88 $11,207.88 1.0000 $11,207.8820 $0.00 $11,207.88 $11,207.88 1.0000 $11,207.88 $0.00 $11,207.88 $11,207.88 1.0000 $11,207.8821 $0.00 $11,207.88 $11,207.88 1.0000 $11,207.88 $0.00 $11,207.88 $11,207.88 1.0000 $11,207.8822 $0.00 $11,207.88 $11,207.88 1.0000 $11,207.88 $0.00 $11,207.88 $11,207.88 1.0000 $11,207.8823 $0.00 $11,207.88 $11,207.88 1.0000 $11,207.88 $0.00 $11,207.88 $11,207.88 1.0000 $11,207.8824 $0.00 $11,207.88 $11,207.88 1.0000 $11,207.88 $0.00 $11,207.88 $11,207.88 1.0000 $11,207.8825 $0.00 $11,207.88 $11,207.88 1.0000 $11,207.88 $0.00 $11,207.88 $11,207.88 1.0000 $11,207.8826 $0.00 $11,207.88 $11,207.88 1.0000 $11,207.88 $0.00 $11,207.88 $11,207.88 1.0000 $11,207.8827 $0.00 $11,207.88 $11,207.88 1.0000 $11,207.88 $0.00 $11,207.88 $11,207.88 1.0000 $11,207.8828 $0.00 $11,207.88 $11,207.88 1.0000 $11,207.88 $0.00 $11,207.88 $11,207.88 1.0000 $11,207.8829 $0.00 $11,207.88 $11,207.88 1.0000 $11,207.88 $0.00 $11,207.88 $11,207.88 1.0000 $11,207.8830 $0.00 $11,207.88 $11,207.88 1.0000 $11,207.88 $0.00 $11,207.88 $11,207.88 1.0000 $11,207.88
Totals $7,697,646.00 $336,236.40 $8,033,882.40 $8,033,882.40 $9,010,846.00 $336,236.40 $9,347,082.40 $9,347,082.40* Financing of $3,334,000 for 13 years at a 6% interest rate and $2,800,000 downpayment with $1,000,000 from CEC and $250,000 from AB970** Discount Rate = 0.0%*** Financing of $6,134,000 for 13 years at a 6% interest rate and $0.0 downpayment with $1,000,000 from CEC and $250,000 from AB970
Net Present Value of PV System = Present Value of Benefits - Present Worth of Costs= $17,904,455.72- $8,033,882.40= $9,870,573.32
Cost of Generation =Total kWh Generated over Life of System
= $8,033,882.4067247280 kWh
= $0.119 /kWh
Benefit-Cost Ratio =
= $17,904,455.72$8,033,882.40
= 2.229
Payback = The period of time required for the profit or other benefits of the system toequal the cost of the initial investment.
= Year 12
Financial Analysis 1MW Crystalline Silicon (Tracking) PV Power Station - Best Case
Net Present Benefit of the PV SystemNet Present Cost of the PV System
Present Value of Benefits
Net Present Cost of PV System
Present Value of Costs w/o Downpayment
Net Cash Flows
Financial Analysis 1MW Crystalline Silicon (Tracking) PV Power Station - Best Case
Financial Analysis 1MW Crystalline Silicon (Tracking) PV Power Station - Best Case

Year kWh Ave. Cost Value of Clean Air Tax Credit Production Total Value Present Value Present Value Net Cash Net Cash PaybackGenerated $/kWh Energy Credits $/kWhr Tax Credits of Energy Factor* of Benefits Flow w/o DP Flow w/ DP (Cost=$5.934M)
0 0 $0.00 $0.00 $0.00 $0.00 $0.00 1.0000 $0.00 $0.00 -$3,100,000 $0.001 1903050 0.16 $304,488.00 $5,352.33 $0.0198 $22,264.43 $332,104.76 1.0000 $332,104.76 -$347,952.49 $2,347.51 $332,104.762 1903050 0.1648 $313,622.64 $5,352.33 $0.0204 $39,107.68 $358,082.65 1.0000 $358,082.65 -$321,974.60 $28,325.40 $690,187.403 1903050 0.169744 $323,031.32 $5,352.33 $0.0210 $40,249.51 $368,633.15 1.0000 $368,633.15 -$311,424.10 $38,875.90 $1,058,820.564 1903050 0.17483632 $332,722.26 $5,352.33 $0.0216 $41,391.34 $379,465.92 1.0000 $379,465.92 -$300,591.33 $49,708.67 $1,438,286.485 1903050 0.18008141 $342,703.93 $5,352.33 $0.0222 $42,533.17 $390,589.42 1.0000 $390,589.42 -$289,467.83 $60,832.17 $1,828,875.906 1903050 0.185483852 $352,985.04 $5,352.33 $0.0228 $43,675.00 $402,012.37 1.0000 $402,012.37 -$278,044.88 $72,255.12 $2,230,888.277 1903050 0.191048367 $363,574.60 $5,352.33 $0.0234 $44,816.83 $413,743.75 1.0000 $413,743.75 -$266,313.50 $83,986.50 $2,644,632.038 1903050 0.196779818 $374,481.83 $5,352.33 $0.0240 $45,958.66 $425,792.82 1.0000 $425,792.82 -$254,264.43 $96,035.57 $3,070,424.849 1903050 0.202683213 $385,716.29 $5,352.33 $0.0246 $47,100.49 $438,169.10 1.0000 $438,169.10 -$241,888.15 $108,411.85 $3,508,593.9510 1903050 0.208763709 $397,287.78 $5,352.33 $0.0252 $48,242.32 $450,882.42 1.0000 $450,882.42 -$229,174.83 $121,125.17 $3,959,476.3711 1903050 0.215026621 $409,206.41 $5,352.33 $0.0258 $49,384.15 $463,942.89 1.0000 $463,942.89 -$216,114.36 $134,185.64 $4,423,419.2612 1903050 0.221477419 $421,482.60 $5,352.33 $0.0264 $50,525.98 $477,360.91 1.0000 $477,360.91 -$202,696.34 $147,603.66 $4,900,780.1713 1903050 0.228121742 $434,127.08 $5,352.33 $0.0270 $38,536.76 $478,016.17 1.0000 $478,016.17 -$202,041.08 $148,258.92 $5,378,796.3414 1903050 0.234965394 $447,150.89 $5,352.33 $0.00 $0.00 $452,503.22 1.0000 $452,503.22 $442,987.97 $442,987.97 $5,831,299.5615 1903050 0.242014356 $460,565.42 $5,352.33 $0.00 $0.00 $465,917.75 1.0000 $465,917.75 $456,402.50 $456,402.50 $6,297,217.3116 1903050 0.249274787 $474,382.38 $5,352.33 $0.00 $0.00 $479,734.71 1.0000 $479,734.71 $470,219.46 $470,219.46 $6,776,952.0217 1903050 0.25675303 $488,613.85 $5,352.33 $0.00 $0.00 $493,966.18 1.0000 $493,966.18 $484,450.93 $484,450.93 $7,270,918.2018 1903050 0.264455621 $503,272.27 $5,352.33 $0.00 $0.00 $508,624.60 1.0000 $508,624.60 $499,109.35 $499,109.35 $7,779,542.8019 1903050 0.27238929 $518,370.44 $5,352.33 $0.00 $0.00 $523,722.77 1.0000 $523,722.77 $514,207.52 $514,207.52 $8,303,265.5620 1903050 0.280560968 $533,921.55 $5,352.33 $0.00 $0.00 $539,273.88 1.0000 $539,273.88 $529,758.63 $529,758.63 $8,842,539.4421 1903050 0.288977798 $549,939.20 $5,352.33 $0.00 $0.00 $555,291.53 1.0000 $555,291.53 $545,776.28 $545,776.28 $9,397,830.9722 1903050 0.297647131 $566,437.37 $5,352.33 $0.00 $0.00 $571,789.70 1.0000 $571,789.70 $562,274.45 $562,274.45 $9,969,620.6723 1903050 0.306576545 $583,430.49 $5,352.33 $0.00 $0.00 $588,782.82 1.0000 $588,782.82 $579,267.57 $579,267.57 $10,558,403.4924 1903050 0.315773842 $600,933.41 $5,352.33 $0.00 $0.00 $606,285.74 1.0000 $606,285.74 $596,770.49 $596,770.49 $11,164,689.2325 1903050 0.325247057 $618,961.41 $5,352.33 $0.00 $0.00 $624,313.74 1.0000 $624,313.74 $614,798.49 $614,798.49 $11,789,002.9736 1903050 0.335004469 $637,530.25 $5,352.33 $0.00 $0.00 $642,882.58 1.0000 $642,882.58 $633,367.33 $633,367.33 $12,431,885.5527 1903050 0.345054603 $656,656.16 $5,352.33 $0.00 $0.00 $662,008.49 1.0000 $662,008.49 $652,493.24 $652,493.24 $13,093,894.0428 1903050 0.355406241 $676,355.85 $5,352.33 $0.00 $0.00 $681,708.17 1.0000 $681,708.17 $672,192.92 $672,192.92 $13,775,602.2229 1903050 0.366068428 $696,646.52 $5,352.33 $0.00 $0.00 $701,998.85 1.0000 $701,998.85 $692,483.60 $692,483.60 $14,477,601.0730 1903050 0.377050481 $717,545.92 $5,352.33 $0.00 $0.00 $722,898.25 1.0000 $722,898.25 $713,383.00 $713,383.00 $15,200,499.32
Totals 57091500 $14,486,143.18 $160,569.84 $15,200,499.32 $15,200,499.32* Discount Rate= 0.0%
Net Present Cost of PV System Present Value of Costs w/o DownpaymentYear Annual PV Annual O&M Total Annual Present Value Present Value Annual PV Annual O&M Total Annual Present Value Present Value
Sys. Payment* Costs Costs Factor** of Costs Sys. Payment*** Costs Costs Factor** of Costs0 $3,100,000.00 $0.00 $3,100,000.00 1.0000 $3,100,000.00 $0.00 $0.00 $0.00 1.0000 $0.001 $320,242.00 $9,515.25 $329,757.25 1.0000 $329,757.25 $670,542.00 $9,515.25 $680,057.25 1.0000 $680,057.252 $320,242.00 $9,515.25 $329,757.25 1.0000 $329,757.25 $670,542.00 $9,515.25 $680,057.25 1.0000 $680,057.253 $320,242.00 $9,515.25 $329,757.25 1.0000 $329,757.25 $670,542.00 $9,515.25 $680,057.25 1.0000 $680,057.254 $320,242.00 $9,515.25 $329,757.25 1.0000 $329,757.25 $670,542.00 $9,515.25 $680,057.25 1.0000 $680,057.255 $320,242.00 $9,515.25 $329,757.25 1.0000 $329,757.25 $670,542.00 $9,515.25 $680,057.25 1.0000 $680,057.256 $320,242.00 $9,515.25 $329,757.25 1.0000 $329,757.25 $670,542.00 $9,515.25 $680,057.25 1.0000 $680,057.257 $320,242.00 $9,515.25 $329,757.25 1.0000 $329,757.25 $670,542.00 $9,515.25 $680,057.25 1.0000 $680,057.258 $320,242.00 $9,515.25 $329,757.25 1.0000 $329,757.25 $670,542.00 $9,515.25 $680,057.25 1.0000 $680,057.259 $320,242.00 $9,515.25 $329,757.25 1.0000 $329,757.25 $670,542.00 $9,515.25 $680,057.25 1.0000 $680,057.2510 $320,242.00 $9,515.25 $329,757.25 1.0000 $329,757.25 $670,542.00 $9,515.25 $680,057.25 1.0000 $680,057.2511 $320,242.00 $9,515.25 $329,757.25 1.0000 $329,757.25 $670,542.00 $9,515.25 $680,057.25 1.0000 $680,057.2512 $320,242.00 $9,515.25 $329,757.25 1.0000 $329,757.25 $670,542.00 $9,515.25 $680,057.25 1.0000 $680,057.2513 $320,242.00 $9,515.25 $329,757.25 1.0000 $329,757.25 $670,542.00 $9,515.25 $680,057.25 1.0000 $680,057.2514 $0.00 $9,515.25 $9,515.25 1.0000 $9,515.25 $0.00 $9,515.25 $9,515.25 1.0000 $9,515.2515 $0.00 $9,515.25 $9,515.25 1.0000 $9,515.25 $0.00 $9,515.25 $9,515.25 1.0000 $9,515.2516 $0.00 $9,515.25 $9,515.25 1.0000 $9,515.25 $0.00 $9,515.25 $9,515.25 1.0000 $9,515.2517 $0.00 $9,515.25 $9,515.25 1.0000 $9,515.25 $0.00 $9,515.25 $9,515.25 1.0000 $9,515.2518 $0.00 $9,515.25 $9,515.25 1.0000 $9,515.25 $0.00 $9,515.25 $9,515.25 1.0000 $9,515.2519 $0.00 $9,515.25 $9,515.25 1.0000 $9,515.25 $0.00 $9,515.25 $9,515.25 1.0000 $9,515.2520 $0.00 $9,515.25 $9,515.25 1.0000 $9,515.25 $0.00 $9,515.25 $9,515.25 1.0000 $9,515.2521 $0.00 $9,515.25 $9,515.25 1.0000 $9,515.25 $0.00 $9,515.25 $9,515.25 1.0000 $9,515.2522 $0.00 $9,515.25 $9,515.25 1.0000 $9,515.25 $0.00 $9,515.25 $9,515.25 1.0000 $9,515.2523 $0.00 $9,515.25 $9,515.25 1.0000 $9,515.25 $0.00 $9,515.25 $9,515.25 1.0000 $9,515.2524 $0.00 $9,515.25 $9,515.25 1.0000 $9,515.25 $0.00 $9,515.25 $9,515.25 1.0000 $9,515.2525 $0.00 $9,515.25 $9,515.25 1.0000 $9,515.25 $0.00 $9,515.25 $9,515.25 1.0000 $9,515.2526 $0.00 $9,515.25 $9,515.25 1.0000 $9,515.25 $0.00 $9,515.25 $9,515.25 1.0000 $9,515.2527 $0.00 $9,515.25 $9,515.25 1.0000 $9,515.25 $0.00 $9,515.25 $9,515.25 1.0000 $9,515.2528 $0.00 $9,515.25 $9,515.25 1.0000 $9,515.25 $0.00 $9,515.25 $9,515.25 1.0000 $9,515.2529 $0.00 $9,515.25 $9,515.25 1.0000 $9,515.25 $0.00 $9,515.25 $9,515.25 1.0000 $9,515.2530 $0.00 $9,515.25 $9,515.25 1.0000 $9,515.25 $0.00 $9,515.25 $9,515.25 1.0000 $9,515.25
Totals $7,263,146.00 $285,457.50 $7,548,603.50 $7,548,603.50 $8,717,046.00 $285,457.50 $9,002,503.50 $9,002,503.50* Financing of $2,634,000 for 13 years at a 6% interest rate and $3,100,000 downpayment with $1,000,000 from CEC and $250,000 from AB970** Discount Rate = 0.0%*** Financing of $5,934,000 for 13 years at a 6% interest rate and $0.0 downpayment with $1,000,000 from CEC and $250,000 from AB970
Net Present Value of PV System = Present Value of Benefits - Present Value of Costs= $15,200,499.32- $7,548,603.50= $7,651,895.82
Cost of Generation =Total kWh Generated over Life of System
= $7,548,603.5057091500 kWh
= $0.132 /kWh
Benefit-Cost Ratio =
= $15,200,499.32$7,548,603.50
= 2.014
Payback = The period of time required for the profit or other benefits of the system toequal the cost of the initial investment.
= Year 14
Present Value of Benefits
Financial Analysis 1MW Crystalline Silicon PV Power Station - Best Case(Fixed System)
Net Cash Flows
Financial Analysis 1MW Crystalline Silicon PV Power Station - Best Case(Fixed System)
Net Present Cost of PV System
Net Present Benefit of the PV SystemNet Present Cost of the PV System
Financial Analysis 1MW Crystalline Silicon PV Power Station - Best Case(Fixed System)

Yr kWh Ave. Cost Value of Clean Air Tax Credit Production Total Value Present Value Present Value Net Cash Net Cash PaybackGenerated $/kWh Energy Credits $/kWhr Tax Credits of Energy Factor* of Benefits Flow w/o DP Flow w/ DP (Cost=$4.372M)
0 0 $0.00 $0.00 $0.00 $0.00 $0.00 1.0000 $0.00 $0.00 -$1,950,000.00 $0.001 1644958 0.16 $263,193.28 $4,626.44 $0.0198 $19,244.92 $287,064.65 1.0000 $287,064.65 -$215,196.14 $5,153.86 $287,064.652 1644958 0.1648 $271,089.08 $4,626.44 $0.0204 $33,803.89 $309,519.41 1.0000 $309,519.41 -$192,741.38 $27,608.62 $596,584.063 1644958 0.169744 $279,221.75 $4,626.44 $0.0210 $34,790.86 $318,639.06 1.0000 $318,639.06 -$183,621.73 $36,728.27 $915,223.114 1644958 0.17483632 $287,598.40 $4,626.44 $0.0216 $35,777.84 $328,002.68 1.0000 $328,002.68 -$174,258.11 $46,091.89 $1,243,225.805 1644958 0.18008141 $296,226.36 $4,626.44 $0.0222 $36,764.81 $337,617.61 1.0000 $337,617.61 -$164,643.18 $55,706.82 $1,580,843.416 1644958 0.185483852 $305,113.15 $4,626.44 $0.0228 $37,751.79 $347,491.38 1.0000 $347,491.38 -$154,769.41 $65,580.59 $1,928,334.797 1644958 0.191048367 $314,266.54 $4,626.44 $0.0234 $38,738.76 $357,631.75 1.0000 $357,631.75 -$144,629.04 $75,720.96 $2,285,966.538 1644958 0.196779818 $323,694.54 $4,626.44 $0.0240 $39,725.74 $368,046.72 1.0000 $368,046.72 -$134,214.07 $86,135.93 $2,654,013.259 1644958 0.202683213 $333,405.37 $4,626.44 $0.0246 $40,712.71 $378,744.53 1.0000 $378,744.53 -$123,516.26 $96,833.74 $3,032,757.78
10 1644958 0.208763709 $343,407.53 $4,626.44 $0.0252 $41,699.69 $389,733.66 1.0000 $389,733.66 -$112,527.13 $107,822.87 $3,422,491.4411 1644958 0.215026621 $353,709.76 $4,626.44 $0.0258 $42,686.66 $401,022.86 1.0000 $401,022.86 -$101,237.93 $119,112.07 $3,823,514.3012 1644958 0.221477419 $364,321.05 $4,626.44 $0.0264 $43,673.63 $412,621.13 1.0000 $412,621.13 -$89,639.66 $130,710.34 $4,236,135.4413 1644958 0.228121742 $375,250.68 $4,626.44 $0.0270 $33,310.40 $413,187.53 1.0000 $413,187.53 -$89,073.26 $131,276.74 $4,649,322.9614 1644958 0.234965394 $386,508.20 $4,626.44 $0.00 $0.00 $391,134.65 1.0000 $391,134.65 $382,909.86 $382,909.86 $5,040,457.6115 1644958 0.242014356 $398,103.45 $4,626.44 $0.00 $0.00 $402,729.90 1.0000 $402,729.90 $394,505.11 $394,505.11 $5,443,187.5116 1644958 0.249274787 $410,046.55 $4,626.44 $0.00 $0.00 $414,673.00 1.0000 $414,673.00 $406,448.21 $406,448.21 $5,857,860.5117 1644958 0.25675303 $422,347.95 $4,626.44 $0.00 $0.00 $426,974.40 1.0000 $426,974.40 $418,749.61 $418,749.61 $6,284,834.9018 1644958 0.264455621 $435,018.39 $4,626.44 $0.00 $0.00 $439,644.83 1.0000 $439,644.83 $431,420.04 $431,420.04 $6,724,479.7419 1644958 0.27238929 $448,068.94 $4,626.44 $0.00 $0.00 $452,695.39 1.0000 $452,695.39 $444,470.60 $444,470.60 $7,177,175.1220 1644958 0.280560968 $461,511.01 $4,626.44 $0.00 $0.00 $466,137.45 1.0000 $466,137.45 $457,912.66 $457,912.66 $7,643,312.58
32899160 $7,072,102.00 $92,528.89 $7,643,312.58 $7,643,312.58* Discount Rate = 0.0%
Yr Annual PV Annual O&M Total Annual Present Value Present Value Annual PV Annual O&M Total Annual Present Value Present ValueSys. Payment* Costs Costs Factor** of Costs Sys. Payment*** Costs Costs Factor** of Costs
0 $1,950,000.00 $0.00 $1,950,000.00 1.0000 $1,950,000.00 $0.00 $0.00 $0.00 1.0000 $0.001 $273,686.00 $8,224.79 $281,910.79 1.0000 $281,910.79 $494,036.00 $8,224.79 $502,260.79 1.0000 $502,260.792 $273,686.00 $8,224.79 $281,910.79 1.0000 $281,910.79 $494,036.00 $8,224.79 $502,260.79 1.0000 $502,260.793 $273,686.00 $8,224.79 $281,910.79 1.0000 $281,910.79 $494,036.00 $8,224.79 $502,260.79 1.0000 $502,260.794 $273,686.00 $8,224.79 $281,910.79 1.0000 $281,910.79 $494,036.00 $8,224.79 $502,260.79 1.0000 $502,260.795 $273,686.00 $8,224.79 $281,910.79 1.0000 $281,910.79 $494,036.00 $8,224.79 $502,260.79 1.0000 $502,260.796 $273,686.00 $8,224.79 $281,910.79 1.0000 $281,910.79 $494,036.00 $8,224.79 $502,260.79 1.0000 $502,260.797 $273,686.00 $8,224.79 $281,910.79 1.0000 $281,910.79 $494,036.00 $8,224.79 $502,260.79 1.0000 $502,260.798 $273,686.00 $8,224.79 $281,910.79 1.0000 $281,910.79 $494,036.00 $8,224.79 $502,260.79 1.0000 $502,260.799 $273,686.00 $8,224.79 $281,910.79 1.0000 $281,910.79 $494,036.00 $8,224.79 $502,260.79 1.0000 $502,260.79
10 $273,686.00 $8,224.79 $281,910.79 1.0000 $281,910.79 $494,036.00 $8,224.79 $502,260.79 1.0000 $502,260.7911 $273,686.00 $8,224.79 $281,910.79 1.0000 $281,910.79 $494,036.00 $8,224.79 $502,260.79 1.0000 $502,260.7912 $273,686.00 $8,224.79 $281,910.79 1.0000 $281,910.79 $494,036.00 $8,224.79 $502,260.79 1.0000 $502,260.7913 $273,686.00 $8,224.79 $281,910.79 1.0000 $281,910.79 $494,036.00 $8,224.79 $502,260.79 1.0000 $502,260.7914 $0.00 $8,224.79 $8,224.79 1.0000 $8,224.79 $0.00 $8,224.79 $8,224.79 1.0000 $8,224.7915 $0.00 $8,224.79 $8,224.79 1.0000 $8,224.79 $0.00 $8,224.79 $8,224.79 1.0000 $8,224.7916 $0.00 $8,224.79 $8,224.79 1.0000 $8,224.79 $0.00 $8,224.79 $8,224.79 1.0000 $8,224.7917 $0.00 $8,224.79 $8,224.79 1.0000 $8,224.79 $0.00 $8,224.79 $8,224.79 1.0000 $8,224.7918 $0.00 $8,224.79 $8,224.79 1.0000 $8,224.79 $0.00 $8,224.79 $8,224.79 1.0000 $8,224.7919 $0.00 $8,224.79 $8,224.79 1.0000 $8,224.79 $0.00 $8,224.79 $8,224.79 1.0000 $8,224.7920 $0.00 $8,224.79 $8,224.79 1.0000 $8,224.79 $0.00 $8,224.79 $8,224.79 1.0000 $8,224.79
$5,507,918.00 $164,495.80 $5,672,413.80 $5,672,413.80 $6,422,468.00 $164,495.80 $6,586,963.80 $6,586,963.80* Financing of $2,422,000 for 13 years at a 6% interest rate and $1,950,000 downpayment with $1,000,000 from CEC and $250,000 from AB970** Discount Rate = 0.0%*** Financing of $4,372,000 for 13 years at a 6% interest rate and $0.00 downpayment and $1,000,000 from the CEC and $250,000 from AB970
Net Present Value of PV System = Present Value of Benefits - Present Worth of Costs= $7,643,312.58- $5,672,413.80= $1,970,898.78
Cost of= Generation Total kWh Generated over Life of System
= $5,672,413.8032899160 kWh
= $0.172 /kWh
Benefit-Cost = Ratio
= $7,643,312.58$5,672,413.80
= 1.347
Payback = The period of time required for the profit or other benefits of the system toequal the cost of the initial investment.
= Year 12
Net Present Cost of the PV System
Present Value of Benefits
Net Present Cost of PV System Present Value of Costs w/o Downpayment
Net Present Cost of PV System
Net Present Benefit of the PV System
Financial Analysis 1MW Amorphous Silicon PV Power Station - Best Case
Financial Analysis 1MW Amorphous Silicon PV Power Station - Best Case
Financial Analysis 1MW Amorphous Silicon PV Power Station - Best Case
Net Cash Flows
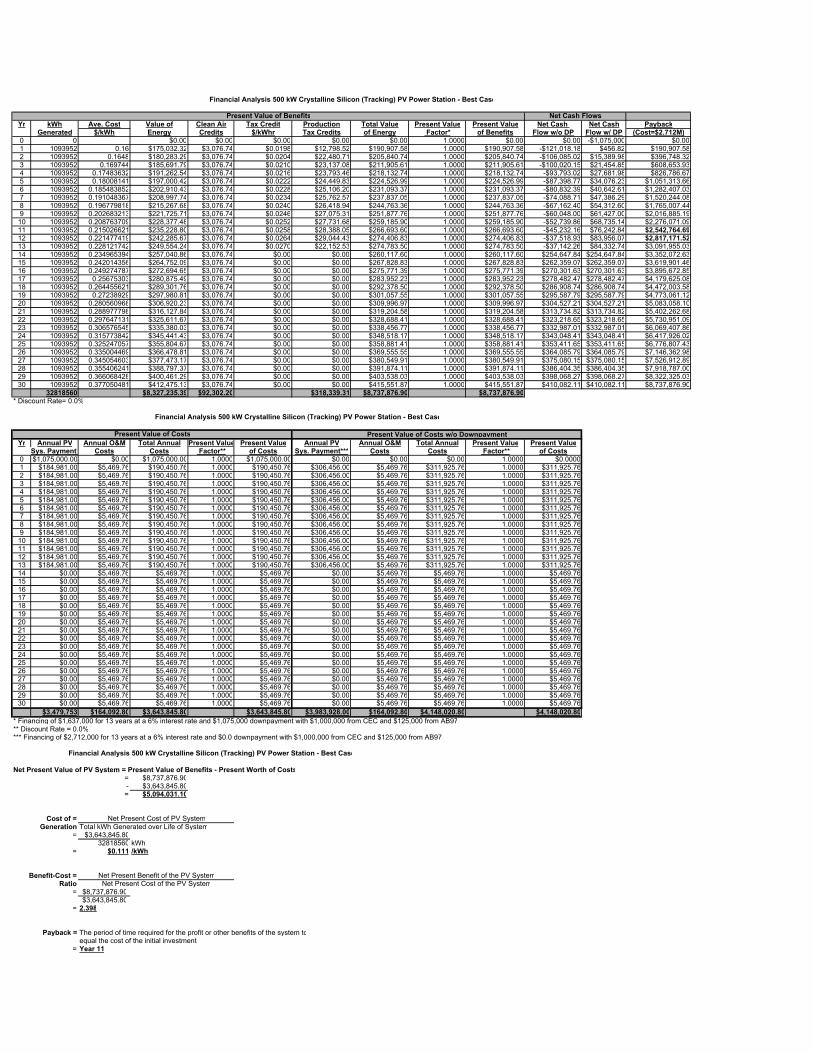
Yr kWh Ave. Cost Value of Clean Air Tax Credit Production Total Value Present Value Present Value Net Cash Net Cash PaybackGenerated $/kWh Energy Credits $/kWhr Tax Credits of Energy Factor* of Benefits Flow w/o DP Flow w/ DP (Cost=$2.712M)
0 0 $0.00 $0.00 $0.00 $0.00 $0.00 1.0000 $0.00 $0.00 -$1,075,000 $0.001 1093952 0.16 $175,032.32 $3,076.74 $0.0198 $12,798.52 $190,907.58 1.0000 $190,907.58 -$121,018.18 $456.82 $190,907.582 1093952 0.1648 $180,283.29 $3,076.74 $0.0204 $22,480.71 $205,840.74 1.0000 $205,840.74 -$106,085.02 $15,389.98 $396,748.323 1093952 0.169744 $185,691.79 $3,076.74 $0.0210 $23,137.08 $211,905.61 1.0000 $211,905.61 -$100,020.15 $21,454.85 $608,653.934 1093952 0.17483632 $191,262.54 $3,076.74 $0.0216 $23,793.46 $218,132.74 1.0000 $218,132.74 -$93,793.02 $27,681.98 $826,786.675 1093952 0.18008141 $197,000.42 $3,076.74 $0.0222 $24,449.83 $224,526.99 1.0000 $224,526.99 -$87,398.77 $34,076.23 $1,051,313.666 1093952 0.185483852 $202,910.43 $3,076.74 $0.0228 $25,106.20 $231,093.37 1.0000 $231,093.37 -$80,832.39 $40,642.61 $1,282,407.037 1093952 0.191048367 $208,997.74 $3,076.74 $0.0234 $25,762.57 $237,837.05 1.0000 $237,837.05 -$74,088.71 $47,386.29 $1,520,244.088 1093952 0.196779818 $215,267.68 $3,076.74 $0.0240 $26,418.94 $244,763.36 1.0000 $244,763.36 -$67,162.40 $54,312.60 $1,765,007.449 1093952 0.202683213 $221,725.71 $3,076.74 $0.0246 $27,075.31 $251,877.76 1.0000 $251,877.76 -$60,048.00 $61,427.00 $2,016,885.1910 1093952 0.208763709 $228,377.48 $3,076.74 $0.0252 $27,731.68 $259,185.90 1.0000 $259,185.90 -$52,739.86 $68,735.14 $2,276,071.0911 1093952 0.215026621 $235,228.80 $3,076.74 $0.0258 $28,388.05 $266,693.60 1.0000 $266,693.60 -$45,232.16 $76,242.84 $2,542,764.6912 1093952 0.221477419 $242,285.67 $3,076.74 $0.0264 $29,044.43 $274,406.83 1.0000 $274,406.83 -$37,518.93 $83,956.07 $2,817,171.5213 1093952 0.228121742 $249,554.24 $3,076.74 $0.0270 $22,152.53 $274,783.50 1.0000 $274,783.50 -$37,142.26 $84,332.74 $3,091,955.0314 1093952 0.234965394 $257,040.86 $3,076.74 $0.00 $0.00 $260,117.60 1.0000 $260,117.60 $254,647.84 $254,647.84 $3,352,072.6315 1093952 0.242014356 $264,752.09 $3,076.74 $0.00 $0.00 $267,828.83 1.0000 $267,828.83 $262,359.07 $262,359.07 $3,619,901.4616 1093952 0.249274787 $272,694.65 $3,076.74 $0.00 $0.00 $275,771.39 1.0000 $275,771.39 $270,301.63 $270,301.63 $3,895,672.8517 1093952 0.25675303 $280,875.49 $3,076.74 $0.00 $0.00 $283,952.23 1.0000 $283,952.23 $278,482.47 $278,482.47 $4,179,625.0818 1093952 0.264455621 $289,301.76 $3,076.74 $0.00 $0.00 $292,378.50 1.0000 $292,378.50 $286,908.74 $286,908.74 $4,472,003.5819 1093952 0.27238929 $297,980.81 $3,076.74 $0.00 $0.00 $301,057.55 1.0000 $301,057.55 $295,587.79 $295,587.79 $4,773,061.1220 1093952 0.280560968 $306,920.23 $3,076.74 $0.00 $0.00 $309,996.97 1.0000 $309,996.97 $304,527.21 $304,527.21 $5,083,058.1021 1093952 0.288977798 $316,127.84 $3,076.74 $0.00 $0.00 $319,204.58 1.0000 $319,204.58 $313,734.82 $313,734.82 $5,402,262.6822 1093952 0.297647131 $325,611.67 $3,076.74 $0.00 $0.00 $328,688.41 1.0000 $328,688.41 $323,218.65 $323,218.65 $5,730,951.0923 1093952 0.306576545 $335,380.03 $3,076.74 $0.00 $0.00 $338,456.77 1.0000 $338,456.77 $332,987.01 $332,987.01 $6,069,407.8624 1093952 0.315773842 $345,441.43 $3,076.74 $0.00 $0.00 $348,518.17 1.0000 $348,518.17 $343,048.41 $343,048.41 $6,417,926.0225 1093952 0.325247057 $355,804.67 $3,076.74 $0.00 $0.00 $358,881.41 1.0000 $358,881.41 $353,411.65 $353,411.65 $6,776,807.4326 1093952 0.335004469 $366,478.81 $3,076.74 $0.00 $0.00 $369,555.55 1.0000 $369,555.55 $364,085.79 $364,085.79 $7,146,362.9827 1093952 0.345054603 $377,473.17 $3,076.74 $0.00 $0.00 $380,549.91 1.0000 $380,549.91 $375,080.15 $375,080.15 $7,526,912.8928 1093952 0.355406241 $388,797.37 $3,076.74 $0.00 $0.00 $391,874.11 1.0000 $391,874.11 $386,404.35 $386,404.35 $7,918,787.0029 1093952 0.366068428 $400,461.29 $3,076.74 $0.00 $0.00 $403,538.03 1.0000 $403,538.03 $398,068.27 $398,068.27 $8,322,325.0330 1093952 0.377050481 $412,475.13 $3,076.74 $0.00 $0.00 $415,551.87 1.0000 $415,551.87 $410,082.11 $410,082.11 $8,737,876.90
32818560 $8,327,235.39 $92,302.20 $318,339.31 $8,737,876.90 $8,737,876.90* Discount Rate= 0.0%
Present Value of CostsYr Annual PV Annual O&M Total Annual Present Value Present Value Annual PV Annual O&M Total Annual Present Value Present Value
Sys. Payment* Costs Costs Factor** of Costs Sys. Payment*** Costs Costs Factor** of Costs0 $1,075,000.00 $0.00 $1,075,000.00 1.0000 $1,075,000.00 $0.00 $0.00 $0.00 1.0000 $0.00001 $184,981.00 $5,469.76 $190,450.76 1.0000 $190,450.76 $306,456.00 $5,469.76 $311,925.76 1.0000 $311,925.762 $184,981.00 $5,469.76 $190,450.76 1.0000 $190,450.76 $306,456.00 $5,469.76 $311,925.76 1.0000 $311,925.763 $184,981.00 $5,469.76 $190,450.76 1.0000 $190,450.76 $306,456.00 $5,469.76 $311,925.76 1.0000 $311,925.764 $184,981.00 $5,469.76 $190,450.76 1.0000 $190,450.76 $306,456.00 $5,469.76 $311,925.76 1.0000 $311,925.765 $184,981.00 $5,469.76 $190,450.76 1.0000 $190,450.76 $306,456.00 $5,469.76 $311,925.76 1.0000 $311,925.766 $184,981.00 $5,469.76 $190,450.76 1.0000 $190,450.76 $306,456.00 $5,469.76 $311,925.76 1.0000 $311,925.767 $184,981.00 $5,469.76 $190,450.76 1.0000 $190,450.76 $306,456.00 $5,469.76 $311,925.76 1.0000 $311,925.768 $184,981.00 $5,469.76 $190,450.76 1.0000 $190,450.76 $306,456.00 $5,469.76 $311,925.76 1.0000 $311,925.769 $184,981.00 $5,469.76 $190,450.76 1.0000 $190,450.76 $306,456.00 $5,469.76 $311,925.76 1.0000 $311,925.7610 $184,981.00 $5,469.76 $190,450.76 1.0000 $190,450.76 $306,456.00 $5,469.76 $311,925.76 1.0000 $311,925.7611 $184,981.00 $5,469.76 $190,450.76 1.0000 $190,450.76 $306,456.00 $5,469.76 $311,925.76 1.0000 $311,925.7612 $184,981.00 $5,469.76 $190,450.76 1.0000 $190,450.76 $306,456.00 $5,469.76 $311,925.76 1.0000 $311,925.7613 $184,981.00 $5,469.76 $190,450.76 1.0000 $190,450.76 $306,456.00 $5,469.76 $311,925.76 1.0000 $311,925.7614 $0.00 $5,469.76 $5,469.76 1.0000 $5,469.76 $0.00 $5,469.76 $5,469.76 1.0000 $5,469.7615 $0.00 $5,469.76 $5,469.76 1.0000 $5,469.76 $0.00 $5,469.76 $5,469.76 1.0000 $5,469.7616 $0.00 $5,469.76 $5,469.76 1.0000 $5,469.76 $0.00 $5,469.76 $5,469.76 1.0000 $5,469.7617 $0.00 $5,469.76 $5,469.76 1.0000 $5,469.76 $0.00 $5,469.76 $5,469.76 1.0000 $5,469.7618 $0.00 $5,469.76 $5,469.76 1.0000 $5,469.76 $0.00 $5,469.76 $5,469.76 1.0000 $5,469.7619 $0.00 $5,469.76 $5,469.76 1.0000 $5,469.76 $0.00 $5,469.76 $5,469.76 1.0000 $5,469.7620 $0.00 $5,469.76 $5,469.76 1.0000 $5,469.76 $0.00 $5,469.76 $5,469.76 1.0000 $5,469.7621 $0.00 $5,469.76 $5,469.76 1.0000 $5,469.76 $0.00 $5,469.76 $5,469.76 1.0000 $5,469.7622 $0.00 $5,469.76 $5,469.76 1.0000 $5,469.76 $0.00 $5,469.76 $5,469.76 1.0000 $5,469.7623 $0.00 $5,469.76 $5,469.76 1.0000 $5,469.76 $0.00 $5,469.76 $5,469.76 1.0000 $5,469.7624 $0.00 $5,469.76 $5,469.76 1.0000 $5,469.76 $0.00 $5,469.76 $5,469.76 1.0000 $5,469.7625 $0.00 $5,469.76 $5,469.76 1.0000 $5,469.76 $0.00 $5,469.76 $5,469.76 1.0000 $5,469.7626 $0.00 $5,469.76 $5,469.76 1.0000 $5,469.76 $0.00 $5,469.76 $5,469.76 1.0000 $5,469.7627 $0.00 $5,469.76 $5,469.76 1.0000 $5,469.76 $0.00 $5,469.76 $5,469.76 1.0000 $5,469.7628 $0.00 $5,469.76 $5,469.76 1.0000 $5,469.76 $0.00 $5,469.76 $5,469.76 1.0000 $5,469.7629 $0.00 $5,469.76 $5,469.76 1.0000 $5,469.76 $0.00 $5,469.76 $5,469.76 1.0000 $5,469.7630 $0.00 $5,469.76 $5,469.76 1.0000 $5,469.76 $0.00 $5,469.76 $5,469.76 1.0000 $5,469.76
$3,479,753 $164,092.80 $3,643,845.80 $3,643,845.80 $3,983,928.00 $164,092.80 $4,148,020.80 $4,148,020.80* Financing of $1,637,000 for 13 years at a 6% interest rate and $1,075,000 downpayment with $1,000,000 from CEC and $125,000 from AB97** Discount Rate = 0.0%*** Financing of $2,712,000 for 13 years at a 6% interest rate and $0.0 downpayment with $1,000,000 from CEC and $125,000 from AB97
Net Present Value of PV System = Present Value of Benefits - Present Worth of Costs= $8,737,876.90- $3,643,845.80= $5,094,031.10
Cost of =Generation Total kWh Generated over Life of System
= $3,643,845.8032818560 kWh
= $0.111 /kWh
Benefit-Cost =Ratio
= $8,737,876.90$3,643,845.80
= 2.398
Payback = The period of time required for the profit or other benefits of the system toequal the cost of the initial investment.
= Year 11
Net Present Cost of the PV System
Financial Analysis 500 kW Crystalline Silicon (Tracking) PV Power Station - Best Case
Net Present Cost of PV System
Net Present Benefit of the PV System
Financial Analysis 500 kW Crystalline Silicon (Tracking) PV Power Station - Best Case
Financial Analysis 500 kW Crystalline Silicon (Tracking) PV Power Station - Best Case
Present Value of Benefits Net Cash Flows
Present Value of Costs w/o Downpayment
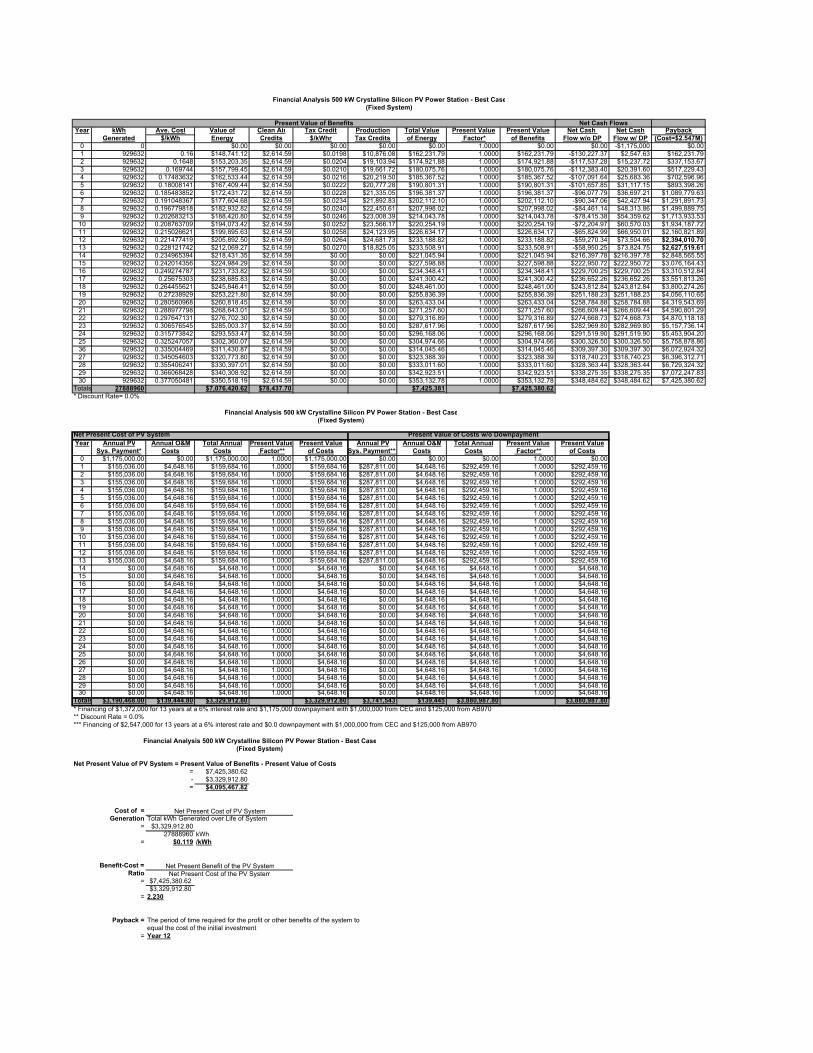
Year kWh Ave. Cost Value of Clean Air Tax Credit Production Total Value Present Value Present Value Net Cash Net Cash PaybackGenerated $/kWh Energy Credits $/kWhr Tax Credits of Energy Factor* of Benefits Flow w/o DP Flow w/ DP (Cost=$2.547M)
0 0 $0.00 $0.00 $0.00 $0.00 $0.00 1.0000 $0.00 $0.00 -$1,175,000 $0.001 929632 0.16 $148,741.12 $2,614.59 $0.0198 $10,876.08 $162,231.79 1.0000 $162,231.79 -$130,227.37 $2,547.63 $162,231.792 929632 0.1648 $153,203.35 $2,614.59 $0.0204 $19,103.94 $174,921.88 1.0000 $174,921.88 -$117,537.28 $15,237.72 $337,153.673 929632 0.169744 $157,799.45 $2,614.59 $0.0210 $19,661.72 $180,075.76 1.0000 $180,075.76 -$112,383.40 $20,391.60 $517,229.434 929632 0.17483632 $162,533.44 $2,614.59 $0.0216 $20,219.50 $185,367.52 1.0000 $185,367.52 -$107,091.64 $25,683.36 $702,596.965 929632 0.18008141 $167,409.44 $2,614.59 $0.0222 $20,777.28 $190,801.31 1.0000 $190,801.31 -$101,657.85 $31,117.15 $893,398.266 929632 0.185483852 $172,431.72 $2,614.59 $0.0228 $21,335.05 $196,381.37 1.0000 $196,381.37 -$96,077.79 $36,697.21 $1,089,779.637 929632 0.191048367 $177,604.68 $2,614.59 $0.0234 $21,892.83 $202,112.10 1.0000 $202,112.10 -$90,347.06 $42,427.94 $1,291,891.738 929632 0.196779818 $182,932.82 $2,614.59 $0.0240 $22,450.61 $207,998.02 1.0000 $207,998.02 -$84,461.14 $48,313.86 $1,499,889.759 929632 0.202683213 $188,420.80 $2,614.59 $0.0246 $23,008.39 $214,043.78 1.0000 $214,043.78 -$78,415.38 $54,359.62 $1,713,933.5310 929632 0.208763709 $194,073.42 $2,614.59 $0.0252 $23,566.17 $220,254.19 1.0000 $220,254.19 -$72,204.97 $60,570.03 $1,934,187.7211 929632 0.215026621 $199,895.63 $2,614.59 $0.0258 $24,123.95 $226,634.17 1.0000 $226,634.17 -$65,824.99 $66,950.01 $2,160,821.8912 929632 0.221477419 $205,892.50 $2,614.59 $0.0264 $24,681.73 $233,188.82 1.0000 $233,188.82 -$59,270.34 $73,504.66 $2,394,010.7013 929632 0.228121742 $212,069.27 $2,614.59 $0.0270 $18,825.05 $233,508.91 1.0000 $233,508.91 -$58,950.25 $73,824.75 $2,627,519.6114 929632 0.234965394 $218,431.35 $2,614.59 $0.00 $0.00 $221,045.94 1.0000 $221,045.94 $216,397.78 $216,397.78 $2,848,565.5515 929632 0.242014356 $224,984.29 $2,614.59 $0.00 $0.00 $227,598.88 1.0000 $227,598.88 $222,950.72 $222,950.72 $3,076,164.4316 929632 0.249274787 $231,733.82 $2,614.59 $0.00 $0.00 $234,348.41 1.0000 $234,348.41 $229,700.25 $229,700.25 $3,310,512.8417 929632 0.25675303 $238,685.83 $2,614.59 $0.00 $0.00 $241,300.42 1.0000 $241,300.42 $236,652.26 $236,652.26 $3,551,813.2618 929632 0.264455621 $245,846.41 $2,614.59 $0.00 $0.00 $248,461.00 1.0000 $248,461.00 $243,812.84 $243,812.84 $3,800,274.2619 929632 0.27238929 $253,221.80 $2,614.59 $0.00 $0.00 $255,836.39 1.0000 $255,836.39 $251,188.23 $251,188.23 $4,056,110.6520 929632 0.280560968 $260,818.45 $2,614.59 $0.00 $0.00 $263,433.04 1.0000 $263,433.04 $258,784.88 $258,784.88 $4,319,543.6921 929632 0.288977798 $268,643.01 $2,614.59 $0.00 $0.00 $271,257.60 1.0000 $271,257.60 $266,609.44 $266,609.44 $4,590,801.2922 929632 0.297647131 $276,702.30 $2,614.59 $0.00 $0.00 $279,316.89 1.0000 $279,316.89 $274,668.73 $274,668.73 $4,870,118.1823 929632 0.306576545 $285,003.37 $2,614.59 $0.00 $0.00 $287,617.96 1.0000 $287,617.96 $282,969.80 $282,969.80 $5,157,736.1424 929632 0.315773842 $293,553.47 $2,614.59 $0.00 $0.00 $296,168.06 1.0000 $296,168.06 $291,519.90 $291,519.90 $5,453,904.2025 929632 0.325247057 $302,360.07 $2,614.59 $0.00 $0.00 $304,974.66 1.0000 $304,974.66 $300,326.50 $300,326.50 $5,758,878.8636 929632 0.335004469 $311,430.87 $2,614.59 $0.00 $0.00 $314,045.46 1.0000 $314,045.46 $309,397.30 $309,397.30 $6,072,924.3227 929632 0.345054603 $320,773.80 $2,614.59 $0.00 $0.00 $323,388.39 1.0000 $323,388.39 $318,740.23 $318,740.23 $6,396,312.7128 929632 0.355406241 $330,397.01 $2,614.59 $0.00 $0.00 $333,011.60 1.0000 $333,011.60 $328,363.44 $328,363.44 $6,729,324.3229 929632 0.366068428 $340,308.92 $2,614.59 $0.00 $0.00 $342,923.51 1.0000 $342,923.51 $338,275.35 $338,275.35 $7,072,247.8330 929632 0.377050481 $350,518.19 $2,614.59 $0.00 $0.00 $353,132.78 1.0000 $353,132.78 $348,484.62 $348,484.62 $7,425,380.62
Totals 27888960 $7,076,420.62 $78,437.70 $7,425,381 $7,425,380.62* Discount Rate= 0.0%
Net Present Cost of PV System Present Value of Costs w/o DownpaymentYear Annual PV Annual O&M Total Annual Present Value Present Value Annual PV Annual O&M Total Annual Present Value Present Value
Sys. Payment* Costs Costs Factor** of Costs Sys. Payment*** Costs Costs Factor** of Costs0 $1,175,000.00 $0.00 $1,175,000.00 1.0000 $1,175,000.00 $0.00 $0.00 $0.00 1.0000 $0.001 $155,036.00 $4,648.16 $159,684.16 1.0000 $159,684.16 $287,811.00 $4,648.16 $292,459.16 1.0000 $292,459.162 $155,036.00 $4,648.16 $159,684.16 1.0000 $159,684.16 $287,811.00 $4,648.16 $292,459.16 1.0000 $292,459.163 $155,036.00 $4,648.16 $159,684.16 1.0000 $159,684.16 $287,811.00 $4,648.16 $292,459.16 1.0000 $292,459.164 $155,036.00 $4,648.16 $159,684.16 1.0000 $159,684.16 $287,811.00 $4,648.16 $292,459.16 1.0000 $292,459.165 $155,036.00 $4,648.16 $159,684.16 1.0000 $159,684.16 $287,811.00 $4,648.16 $292,459.16 1.0000 $292,459.166 $155,036.00 $4,648.16 $159,684.16 1.0000 $159,684.16 $287,811.00 $4,648.16 $292,459.16 1.0000 $292,459.167 $155,036.00 $4,648.16 $159,684.16 1.0000 $159,684.16 $287,811.00 $4,648.16 $292,459.16 1.0000 $292,459.168 $155,036.00 $4,648.16 $159,684.16 1.0000 $159,684.16 $287,811.00 $4,648.16 $292,459.16 1.0000 $292,459.169 $155,036.00 $4,648.16 $159,684.16 1.0000 $159,684.16 $287,811.00 $4,648.16 $292,459.16 1.0000 $292,459.1610 $155,036.00 $4,648.16 $159,684.16 1.0000 $159,684.16 $287,811.00 $4,648.16 $292,459.16 1.0000 $292,459.1611 $155,036.00 $4,648.16 $159,684.16 1.0000 $159,684.16 $287,811.00 $4,648.16 $292,459.16 1.0000 $292,459.1612 $155,036.00 $4,648.16 $159,684.16 1.0000 $159,684.16 $287,811.00 $4,648.16 $292,459.16 1.0000 $292,459.1613 $155,036.00 $4,648.16 $159,684.16 1.0000 $159,684.16 $287,811.00 $4,648.16 $292,459.16 1.0000 $292,459.1614 $0.00 $4,648.16 $4,648.16 1.0000 $4,648.16 $0.00 $4,648.16 $4,648.16 1.0000 $4,648.1615 $0.00 $4,648.16 $4,648.16 1.0000 $4,648.16 $0.00 $4,648.16 $4,648.16 1.0000 $4,648.1616 $0.00 $4,648.16 $4,648.16 1.0000 $4,648.16 $0.00 $4,648.16 $4,648.16 1.0000 $4,648.1617 $0.00 $4,648.16 $4,648.16 1.0000 $4,648.16 $0.00 $4,648.16 $4,648.16 1.0000 $4,648.1618 $0.00 $4,648.16 $4,648.16 1.0000 $4,648.16 $0.00 $4,648.16 $4,648.16 1.0000 $4,648.1619 $0.00 $4,648.16 $4,648.16 1.0000 $4,648.16 $0.00 $4,648.16 $4,648.16 1.0000 $4,648.1620 $0.00 $4,648.16 $4,648.16 1.0000 $4,648.16 $0.00 $4,648.16 $4,648.16 1.0000 $4,648.1621 $0.00 $4,648.16 $4,648.16 1.0000 $4,648.16 $0.00 $4,648.16 $4,648.16 1.0000 $4,648.1622 $0.00 $4,648.16 $4,648.16 1.0000 $4,648.16 $0.00 $4,648.16 $4,648.16 1.0000 $4,648.1623 $0.00 $4,648.16 $4,648.16 1.0000 $4,648.16 $0.00 $4,648.16 $4,648.16 1.0000 $4,648.1624 $0.00 $4,648.16 $4,648.16 1.0000 $4,648.16 $0.00 $4,648.16 $4,648.16 1.0000 $4,648.1625 $0.00 $4,648.16 $4,648.16 1.0000 $4,648.16 $0.00 $4,648.16 $4,648.16 1.0000 $4,648.1626 $0.00 $4,648.16 $4,648.16 1.0000 $4,648.16 $0.00 $4,648.16 $4,648.16 1.0000 $4,648.1627 $0.00 $4,648.16 $4,648.16 1.0000 $4,648.16 $0.00 $4,648.16 $4,648.16 1.0000 $4,648.1628 $0.00 $4,648.16 $4,648.16 1.0000 $4,648.16 $0.00 $4,648.16 $4,648.16 1.0000 $4,648.1629 $0.00 $4,648.16 $4,648.16 1.0000 $4,648.16 $0.00 $4,648.16 $4,648.16 1.0000 $4,648.1630 $0.00 $4,648.16 $4,648.16 1.0000 $4,648.16 $0.00 $4,648.16 $4,648.16 1.0000 $4,648.16
Totals $3,190,468.00 $139,444.80 $3,329,912.80 $3,329,912.80 $3,741,543 $139,445 $3,880,987.80 $3,880,987.80* Financing of $1,372,000 for 13 years at a 6% interest rate and $1,175,000 downpayment with $1,000,000 from CEC and $125,000 from AB970** Discount Rate = 0.0%*** Financing of $2,547,000 for 13 years at a 6% interest rate and $0.0 downpayment with $1,000,000 from CEC and $125,000 from AB970
Net Present Value of PV System = Present Value of Benefits - Present Value of Costs= $7,425,380.62- $3,329,912.80= $4,095,467.82
Cost of =Generation Total kWh Generated over Life of System
= $3,329,912.8027888960 kWh
= $0.119 /kWh
Benefit-Cost = Ratio
= $7,425,380.62$3,329,912.80
= 2.230
Payback = The period of time required for the profit or other benefits of the system toequal the cost of the initial investment.
= Year 12
Financial Analysis 500 kW Crystalline Silicon PV Power Station - Best Case(Fixed System)
Present Value of Benefits Net Cash Flows
Financial Analysis 500 kW Crystalline Silicon PV Power Station - Best Case(Fixed System)
Financial Analysis 500 kW Crystalline Silicon PV Power Station - Best Case(Fixed System)
Net Present Cost of PV System
Net Present Benefit of the PV SystemNet Present Cost of the PV System

Yr kWh Ave. Cost Value of Clean Air Tax Credit Production Total Value Present Value Present Value Net Cash Net Cash PaybackGenerated $/kWh Energy Credits $/kWhr Tax Credits of Energy Factor* of Benefits Flow w/o DP Flow w/ DP (Cost=$1.778M)
0 0 $0.00 $0.00 $0.00 $0.00 $0.00 1.0000 $0.00 $0.00 -$575,000.00 $0.001 810982 0.16 $129,757.12 $2,280.89 $0.0198 $9,487.95 $141,525.96 1.0000 $141,525.96 -$63,442.95 $1,532.05 $141,525.962 810982 0.1648 $133,649.83 $2,280.89 $0.0204 $16,665.68 $152,596.40 1.0000 $152,596.40 -$52,372.51 $12,602.49 $294,122.363 810982 0.169744 $137,659.33 $2,280.89 $0.0210 $17,152.27 $157,092.48 1.0000 $157,092.48 -$47,876.43 $17,098.57 $451,214.854 810982 0.17483632 $141,789.11 $2,280.89 $0.0216 $17,638.86 $161,708.85 1.0000 $161,708.85 -$43,260.06 $21,714.94 $612,923.705 810982 0.18008141 $146,042.78 $2,280.89 $0.0222 $18,125.45 $166,449.12 1.0000 $166,449.12 -$38,519.79 $26,455.21 $779,372.826 810982 0.185483852 $150,424.07 $2,280.89 $0.0228 $18,612.04 $171,316.99 1.0000 $171,316.99 -$33,651.92 $31,323.08 $950,689.817 810982 0.191048367 $154,936.79 $2,280.89 $0.0234 $19,098.63 $176,316.30 1.0000 $176,316.30 -$28,652.61 $36,322.39 $1,127,006.118 810982 0.196779818 $159,584.89 $2,280.89 $0.0240 $19,585.22 $181,450.99 1.0000 $181,450.99 -$23,517.92 $41,457.08 $1,308,457.109 810982 0.202683213 $164,372.44 $2,280.89 $0.0246 $20,071.80 $186,725.13 1.0000 $186,725.13 -$18,243.78 $46,731.22 $1,495,182.23
10 810982 0.208763709 $169,303.61 $2,280.89 $0.0252 $20,558.39 $192,142.89 1.0000 $192,142.89 -$12,826.02 $52,148.98 $1,687,325.1211 810982 0.215026621 $174,382.72 $2,280.89 $0.0258 $21,044.98 $197,708.59 1.0000 $197,708.59 -$7,260.32 $57,714.68 $1,885,033.7112 810982 0.221477419 $179,614.20 $2,280.89 $0.0264 $21,531.57 $203,426.66 1.0000 $203,426.66 -$1,542.25 $63,432.75 $2,088,460.3713 810982 0.228121742 $185,002.63 $2,280.89 $0.0270 $16,422.39 $203,705.90 1.0000 $203,705.90 -$1,263.01 $63,711.99 $2,292,166.2714 810982 0.234965394 $190,552.71 $2,280.89 $0.00 $0.00 $192,833.59 1.0000 $192,833.59 $188,778.68 $188,778.68 $2,484,999.8615 810982 0.242014356 $196,269.29 $2,280.89 $0.00 $0.00 $198,550.17 1.0000 $198,550.17 $194,495.26 $194,495.26 $2,683,550.0316 810982 0.249274787 $202,157.37 $2,280.89 $0.00 $0.00 $204,438.25 1.0000 $204,438.25 $200,383.34 $200,383.34 $2,887,988.2817 810982 0.25675303 $208,222.09 $2,280.89 $0.00 $0.00 $210,502.97 1.0000 $210,502.97 $206,448.06 $206,448.06 $3,098,491.2618 810982 0.264455621 $214,468.75 $2,280.89 $0.00 $0.00 $216,749.64 1.0000 $216,749.64 $212,694.73 $212,694.73 $3,315,240.8919 810982 0.27238929 $220,902.81 $2,280.89 $0.00 $0.00 $223,183.70 1.0000 $223,183.70 $219,128.79 $219,128.79 $3,538,424.5920 810982 0.280560968 $227,529.90 $2,280.89 $0.00 $0.00 $229,810.78 1.0000 $229,810.78 $225,755.87 $225,755.87 $3,768,235.37
16219640 $3,486,622.41 $45,617.74 $3,768,235.37 $3,768,235.37* Discount Rate = 0.0%
Yr Annual PV Annual O&M Total Annual Present Value Present Value Annual PV Annual O&M Total Annual Present Value Present ValueSys. Payment* Costs Costs Factor** of Costs Sys. Payment*** Costs Costs Factor** of Costs
0 $575,000.00 $0.00 $575,000.00 1.0000 $575,000.00 $0.00 $0.00 $0.00 1.0000 $0.001 $135,939.00 $4,054.91 $139,993.91 1.0000 $139,993.91 $200,914.00 $4,054.91 $204,968.91 1.0000 $204,968.912 $135,939.00 $4,054.91 $139,993.91 1.0000 $139,993.91 $200,914.00 $4,054.91 $204,968.91 1.0000 $204,968.913 $135,939.00 $4,054.91 $139,993.91 1.0000 $139,993.91 $200,914.00 $4,054.91 $204,968.91 1.0000 $204,968.914 $135,939.00 $4,054.91 $139,993.91 1.0000 $139,993.91 $200,914.00 $4,054.91 $204,968.91 1.0000 $204,968.915 $135,939.00 $4,054.91 $139,993.91 1.0000 $139,993.91 $200,914.00 $4,054.91 $204,968.91 1.0000 $204,968.916 $135,939.00 $4,054.91 $139,993.91 1.0000 $139,993.91 $200,914.00 $4,054.91 $204,968.91 1.0000 $204,968.917 $135,939.00 $4,054.91 $139,993.91 1.0000 $139,993.91 $200,914.00 $4,054.91 $204,968.91 1.0000 $204,968.918 $135,939.00 $4,054.91 $139,993.91 1.0000 $139,993.91 $200,914.00 $4,054.91 $204,968.91 1.0000 $204,968.919 $135,939.00 $4,054.91 $139,993.91 1.0000 $139,993.91 $200,914.00 $4,054.91 $204,968.91 1.0000 $204,968.91
10 $135,939.00 $4,054.91 $139,993.91 1.0000 $139,993.91 $200,914.00 $4,054.91 $204,968.91 1.0000 $204,968.9111 $135,939.00 $4,054.91 $139,993.91 1.0000 $139,993.91 $200,914.00 $4,054.91 $204,968.91 1.0000 $204,968.9112 $135,939.00 $4,054.91 $139,993.91 1.0000 $139,993.91 $200,914.00 $4,054.91 $204,968.91 1.0000 $204,968.9113 $135,939.00 $4,054.91 $139,993.91 1.0000 $139,993.91 $200,914.00 $4,054.91 $204,968.91 1.0000 $204,968.9114 $0.00 $4,054.91 $4,054.91 1.0000 $4,054.91 $0.00 $4,054.91 $4,054.91 1.0000 $4,054.9115 $0.00 $4,054.91 $4,054.91 1.0000 $4,054.91 $0.00 $4,054.91 $4,054.91 1.0000 $4,054.9116 $0.00 $4,054.91 $4,054.91 1.0000 $4,054.91 $0.00 $4,054.91 $4,054.91 1.0000 $4,054.9117 $0.00 $4,054.91 $4,054.91 1.0000 $4,054.91 $0.00 $4,054.91 $4,054.91 1.0000 $4,054.9118 $0.00 $4,054.91 $4,054.91 1.0000 $4,054.91 $0.00 $4,054.91 $4,054.91 1.0000 $4,054.9119 $0.00 $4,054.91 $4,054.91 1.0000 $4,054.91 $0.00 $4,054.91 $4,054.91 1.0000 $4,054.9120 $0.00 $4,054.91 $4,054.91 1.0000 $4,054.91 $0.00 $4,054.91 $4,054.91 1.0000 $4,054.91
$2,342,207.00 $81,098.20 $2,423,305.20 $2,423,305.20 $2,611,882.00 $81,098.20 $2,692,980.20 $2,692,980.20* Financing of $1,203,000 for 13 years at a 6% interest rate and $575,000 downpayment with $1,000,000 from CEC and $125,000 from AB970** Discount Rate = 0.0%*** Financing of $1,778,000 for 13 years at a 6% interest rate and $0.00 downpayment and $1,000,000 from the CEC and $125,000 from AB970
Net Present Value of PV System = Present Value of Benefits - Present Worth of Costs= $3,768,235.37- $2,423,305.20= $1,344,930.17
Cost of= Generation Total kWh Generated over Life of System
= $2,423,305.2016219640 kWh
= $0.149 /kWh
Benefit-Cost = Ratio
= $3,768,235.37$2,423,305.20
= 1.555
Payback = The period of time required for the profit or other benefits of the system toequal the cost of the initial investment.
= Year 10
Net Present Cost of PV System
Net Present Benefit of the PV SystemNet Present Cost of the PV System
Net Present Cost of PV System Present Value of Costs w/o Downpayment
Financial Analysis 500 kW Amorphous Silicon PV Power Station - Best Case
Financial Analysis 500 kW Amorphous Silicon PV Power Station - Best Case
Present Value of Benefits Net Cash Flows
Financial Analysis 500 kW Amorphous Silicon PV Power Station - Best Case

Yr kWh Ave. Cost Value of Clean Air Tax Credit Production Total Value Present Value Present Value Net Cash PaybackGenerated $/kWh Energy Credits $/kWhr Tax Credits of Energy Factor* of Benefits Flow w/ DP (Cost=$1.059M)
0 0 $0.00 $0.00 $0.00 $0.00 $0.00 1.0000 $0.00 -$425,000 $0.001 433535 0.16 $69,365.60 $1,219.32 $0.0198 $5,072.07 $75,656.99 1.0000 $75,656.99 -$977.68 $75,656.992 433535 0.1648 $71,446.57 $1,219.32 $0.0204 $8,909.14 $81,575.03 1.0000 $81,575.03 $16,240.35 $157,232.023 433535 0.169744 $73,589.97 $1,219.32 $0.0210 $9,169.27 $83,978.55 1.0000 $83,978.55 $18,643.87 $241,210.574 433535 0.17483632 $75,797.66 $1,219.32 $0.0216 $9,429.39 $86,446.37 1.0000 $86,446.37 $21,111.69 $327,656.935 433535 0.18008141 $78,071.59 $1,219.32 $0.0222 $9,689.51 $88,980.42 1.0000 $88,980.42 $23,645.74 $416,637.356 433535 0.185483852 $80,413.74 $1,219.32 $0.0228 $9,949.63 $91,582.69 1.0000 $91,582.69 $26,248.01 $508,220.047 433535 0.191048367 $82,826.15 $1,219.32 $0.0234 $10,209.75 $94,255.22 1.0000 $94,255.22 $28,920.55 $602,475.268 433535 0.196779818 $85,310.94 $1,219.32 $0.0240 $10,469.87 $97,000.13 1.0000 $97,000.13 $31,665.45 $699,475.399 433535 0.202683213 $87,870.27 $1,219.32 $0.0246 $10,729.99 $99,819.58 1.0000 $99,819.58 $34,484.90 $799,294.9610 433535 0.208763709 $90,506.37 $1,219.32 $0.0252 $10,990.11 $102,715.80 1.0000 $102,715.80 $37,381.13 $902,010.7711 433535 0.215026621 $93,221.57 $1,219.32 $0.0258 $11,250.23 $105,691.12 1.0000 $105,691.12 $40,356.44 $1,007,701.8812 433535 0.221477419 $96,018.21 $1,219.32 $0.0264 $11,510.35 $108,747.88 1.0000 $108,747.88 $43,413.21 $1,116,449.7713 433535 0.228121742 $98,898.76 $1,219.32 $0.0270 $8,779.08 $108,897.16 1.0000 $108,897.16 $43,562.49 $1,225,346.9314 433535 0.234965394 $101,865.72 $1,219.32 $0.00 $0.00 $103,085.04 1.0000 $103,085.04 $100,917.36 $1,328,431.9715 433535 0.242014356 $104,921.69 $1,219.32 $0.00 $0.00 $106,141.01 1.0000 $106,141.01 $103,973.34 $1,434,572.9816 433535 0.249274787 $108,069.34 $1,219.32 $0.00 $0.00 $109,288.66 1.0000 $109,288.66 $107,120.99 $1,543,861.6417 433535 0.25675303 $111,311.42 $1,219.32 $0.00 $0.00 $112,530.74 1.0000 $112,530.74 $110,363.07 $1,656,392.3818 433535 0.264455621 $114,650.77 $1,219.32 $0.00 $0.00 $115,870.08 1.0000 $115,870.08 $113,702.41 $1,772,262.4719 433535 0.27238929 $118,090.29 $1,219.32 $0.00 $0.00 $119,309.61 1.0000 $119,309.61 $117,141.93 $1,891,572.0720 433535 0.280560968 $121,633.00 $1,219.32 $0.00 $0.00 $122,852.32 1.0000 $122,852.32 $120,684.64 $2,014,424.3921 433535 0.288977798 $125,281.99 $1,219.32 $0.00 $0.00 $126,501.31 1.0000 $126,501.31 $124,333.63 $2,140,925.7022 433535 0.297647131 $129,040.45 $1,219.32 $0.00 $0.00 $130,259.77 1.0000 $130,259.77 $128,092.09 $2,271,185.4623 433535 0.306576545 $132,911.66 $1,219.32 $0.00 $0.00 $134,130.98 1.0000 $134,130.98 $131,963.30 $2,405,316.4424 433535 0.315773842 $136,899.01 $1,219.32 $0.00 $0.00 $138,118.33 1.0000 $138,118.33 $135,950.65 $2,543,434.7725 433535 0.325247057 $141,005.98 $1,219.32 $0.00 $0.00 $142,225.30 1.0000 $142,225.30 $140,057.63 $2,685,660.0726 433535 0.335004469 $145,236.16 $1,219.32 $0.00 $0.00 $146,455.48 1.0000 $146,455.48 $144,287.80 $2,832,115.5527 433535 0.345054603 $149,593.25 $1,219.32 $0.00 $0.00 $150,812.56 1.0000 $150,812.56 $148,644.89 $2,982,928.1228 433535 0.355406241 $154,081.04 $1,219.32 $0.00 $0.00 $155,300.36 1.0000 $155,300.36 $153,132.69 $3,138,228.4829 433535 0.366068428 $158,703.48 $1,219.32 $0.00 $0.00 $159,922.79 1.0000 $159,922.79 $157,755.12 $3,298,151.2730 433535 0.377050481 $163,464.58 $1,219.32 $0.00 $0.00 $164,683.90 1.0000 $164,683.90 $162,516.22 $3,462,835.17
13006050 $3,300,097.26 $36,579.52 $126,158.40 $3,462,835.17 $3,462,835.17* Discount Rate= 0.0%
Yr Annual PV Annual O&M Total Annual Present Value Present Value Annual PV Annual O&M Total Annual Present Value Present ValueSys. Payment* Costs Costs Factor** of Costs Sys. Payment* Costs Costs Factor** of Costs
0 $425,000.00 $0.00 $425,000.00 1.0000 $425,000.00 $0.00 $0.00 $0.00 1.0000 $0.001 $74,467.00 $2,167.68 $76,634.68 1.0000 $76,634.68 $119,667.00 $2,167.68 $121,834.68 1.0000 $121,834.682 $63,167.00 $2,167.68 $65,334.68 1.0000 $65,334.68 $119,667.00 $2,167.68 $121,834.68 1.0000 $121,834.683 $63,167.00 $2,167.68 $65,334.68 1.0000 $65,334.68 $119,667.00 $2,167.68 $121,834.68 1.0000 $121,834.684 $63,167.00 $2,167.68 $65,334.68 1.0000 $65,334.68 $119,667.00 $2,167.68 $121,834.68 1.0000 $121,834.685 $63,167.00 $2,167.68 $65,334.68 1.0000 $65,334.68 $119,667.00 $2,167.68 $121,834.68 1.0000 $121,834.686 $63,167.00 $2,167.68 $65,334.68 1.0000 $65,334.68 $119,667.00 $2,167.68 $121,834.68 1.0000 $121,834.687 $63,167.00 $2,167.68 $65,334.68 1.0000 $65,334.68 $119,667.00 $2,167.68 $121,834.68 1.0000 $121,834.688 $63,167.00 $2,167.68 $65,334.68 1.0000 $65,334.68 $119,667.00 $2,167.68 $121,834.68 1.0000 $121,834.689 $63,167.00 $2,167.68 $65,334.68 1.0000 $65,334.68 $119,667.00 $2,167.68 $121,834.68 1.0000 $121,834.6810 $63,167.00 $2,167.68 $65,334.68 1.0000 $65,334.68 $119,667.00 $2,167.68 $121,834.68 1.0000 $121,834.6811 $63,167.00 $2,167.68 $65,334.68 1.0000 $65,334.68 $119,667.00 $2,167.68 $121,834.68 1.0000 $121,834.6812 $63,167.00 $2,167.68 $65,334.68 1.0000 $65,334.68 $119,667.00 $2,167.68 $121,834.68 1.0000 $121,834.6813 $63,167.00 $2,167.68 $65,334.68 1.0000 $65,334.68 $119,667.00 $2,167.68 $121,834.68 1.0000 $121,834.6814 $0.00 $2,167.68 $2,167.68 1.0000 $2,167.68 $0.00 $2,167.68 $2,167.68 1.0000 $2,167.6815 $0.00 $2,167.68 $2,167.68 1.0000 $2,167.68 $0.00 $2,167.68 $2,167.68 1.0000 $2,167.6816 $0.00 $2,167.68 $2,167.68 1.0000 $2,167.68 $0.00 $2,167.68 $2,167.68 1.0000 $2,167.6817 $0.00 $2,167.68 $2,167.68 1.0000 $2,167.68 $0.00 $2,167.68 $2,167.68 1.0000 $2,167.6818 $0.00 $2,167.68 $2,167.68 1.0000 $2,167.68 $0.00 $2,167.68 $2,167.68 1.0000 $2,167.6819 $0.00 $2,167.68 $2,167.68 1.0000 $2,167.68 $0.00 $2,167.68 $2,167.68 1.0000 $2,167.6820 $0.00 $2,167.68 $2,167.68 1.0000 $2,167.68 $0.00 $2,167.68 $2,167.68 1.0000 $2,167.6821 $0.00 $2,167.68 $2,167.68 1.0000 $2,167.68 $0.00 $2,167.68 $2,167.68 1.0000 $2,167.6822 $0.00 $2,167.68 $2,167.68 1.0000 $2,167.68 $0.00 $2,167.68 $2,167.68 1.0000 $2,167.6823 $0.00 $2,167.68 $2,167.68 1.0000 $2,167.68 $0.00 $2,167.68 $2,167.68 1.0000 $2,167.6824 $0.00 $2,167.68 $2,167.68 1.0000 $2,167.68 $0.00 $2,167.68 $2,167.68 1.0000 $2,167.6825 $0.00 $2,167.68 $2,167.68 1.0000 $2,167.68 $0.00 $2,167.68 $2,167.68 1.0000 $2,167.6826 $0.00 $2,167.68 $2,167.68 1.0000 $2,167.68 $0.00 $2,167.68 $2,167.68 1.0000 $2,167.6827 $0.00 $2,167.68 $2,167.68 1.0000 $2,167.68 $0.00 $2,167.68 $2,167.68 1.0000 $2,167.6828 $0.00 $2,167.68 $2,167.68 1.0000 $2,167.68 $0.00 $2,167.68 $2,167.68 1.0000 $2,167.6829 $0.00 $2,167.68 $2,167.68 1.0000 $2,167.68 $0.00 $2,167.68 $2,167.68 1.0000 $2,167.6830 $0.00 $2,167.68 $2,167.68 1.0000 $2,167.68 $0.00 $2,167.68 $2,167.68 1.0000 $2,167.68
$1,257,471 $65,030.25 $1,322,501.25 $1,322,501.25 $1,555,671 $65,030.25 $1,620,701.25 $1,620,701.25* Financing of $634,000 for 13 years at a 6% interest rate and $425,000 downpayment with $500,000 from CEC** Discount Rate = 0.0%*** Financing of $1,059,000 for 13 years at a 6% interest rate with $500,000 from the CEC
Net Present Value of PV System = Present Value of Benefits - Present Worth of Costs= $3,462,835.17- $1,322,501.25= $2,140,333.92
Cost of =Generation Total kWh Generated over Life of System
= $1,322,501.2513006050 kWh
= $0.102 /kWh
Benefit-Cost =Ratio
= $3,462,835.17$1,322,501.25
= 2.618
Payback = The period of time required for the profit or other benefits of the system toequal the cost of the initial investment.
= Year 11
Present Value of Costs w/o a downpayment
Net Present Cost of the PV System
Financial Analysis 200 kW Crystalline Silicon (Tracking) PV Power Station - Best Case
Financial Analysis 200 kW Crystalline Silicon (Tracking) PV Power Station - Best Case
Net Present Cost of PV System
Net Present Benefit of the PV System
Financial Analysis 200 kW Crystalline Silicon (Tracking) PV Power Station - Best Case
Present Value of Benefits
Present Value of Costs

Year kWh Ave. Cost Value of Clean Air Tax Credit Production Total Value Present Value Present Value Net Cash PaybackGenerated $/kWh Energy Credits $/kWhr Tax Credits of Energy Factor* of Benefits Flow w/ DP (Cost=$1.029M)
0 0 $0.00 $0.00 $0.00 $0.00 $0.00 1.0000 $0.00 -$500,000 $0.001 368664 0.16 $58,986.24 $1,036.87 $0.0198 $4,313.13 $64,336.23 1.0000 $64,336.23 $2,715.91 $64,336.232 368664 0.1648 $60,755.83 $1,036.87 $0.0204 $7,576.05 $69,368.74 1.0000 $69,368.74 $7,748.42 $133,704.973 368664 0.169744 $62,578.50 $1,036.87 $0.0210 $7,797.24 $71,412.61 1.0000 $71,412.61 $9,792.29 $205,117.594 368664 0.17483632 $64,455.86 $1,036.87 $0.0216 $8,018.44 $73,511.17 1.0000 $73,511.17 $11,890.85 $278,628.755 368664 0.18008141 $66,389.53 $1,036.87 $0.0222 $8,239.64 $75,666.04 1.0000 $75,666.04 $14,045.72 $354,294.796 368664 0.185483852 $68,381.22 $1,036.87 $0.0228 $8,460.84 $77,878.93 1.0000 $77,878.93 $16,258.61 $432,173.727 368664 0.191048367 $70,432.66 $1,036.87 $0.0234 $8,682.04 $80,151.56 1.0000 $80,151.56 $18,531.24 $512,325.288 368664 0.196779818 $72,545.63 $1,036.87 $0.0240 $8,903.24 $82,485.74 1.0000 $82,485.74 $20,865.42 $594,811.029 368664 0.202683213 $74,722.00 $1,036.87 $0.0246 $9,124.43 $84,883.31 1.0000 $84,883.31 $23,262.99 $679,694.3210 368664 0.208763709 $76,963.66 $1,036.87 $0.0252 $9,345.63 $87,346.16 1.0000 $87,346.16 $25,725.84 $767,040.4911 368664 0.215026621 $79,272.57 $1,036.87 $0.0258 $9,566.83 $89,876.27 1.0000 $89,876.27 $28,255.95 $856,916.7612 368664 0.221477419 $81,650.75 $1,036.87 $0.0264 $9,788.03 $92,475.65 1.0000 $92,475.65 $30,855.33 $949,392.4113 368664 0.228121742 $84,100.27 $1,036.87 $0.0270 $7,465.45 $92,602.59 1.0000 $92,602.59 $30,982.27 $1,041,994.9914 368664 0.234965394 $86,623.28 $1,036.87 $0.00 $0.00 $87,660.15 1.0000 $87,660.15 $85,816.83 $1,129,655.1415 368664 0.242014356 $89,221.98 $1,036.87 $0.00 $0.00 $90,258.85 1.0000 $90,258.85 $88,415.53 $1,219,913.9916 368664 0.249274787 $91,898.64 $1,036.87 $0.00 $0.00 $92,935.51 1.0000 $92,935.51 $91,092.19 $1,312,849.5017 368664 0.25675303 $94,655.60 $1,036.87 $0.00 $0.00 $95,692.47 1.0000 $95,692.47 $93,849.15 $1,408,541.9718 368664 0.264455621 $97,495.27 $1,036.87 $0.00 $0.00 $98,532.13 1.0000 $98,532.13 $96,688.81 $1,507,074.1019 368664 0.27238929 $100,420.13 $1,036.87 $0.00 $0.00 $101,456.99 1.0000 $101,456.99 $99,613.67 $1,608,531.0920 368664 0.280560968 $103,432.73 $1,036.87 $0.00 $0.00 $104,469.60 1.0000 $104,469.60 $102,626.28 $1,713,000.6921 368664 0.288977798 $106,535.71 $1,036.87 $0.00 $0.00 $107,572.58 1.0000 $107,572.58 $105,729.26 $1,820,573.2722 368664 0.297647131 $109,731.78 $1,036.87 $0.00 $0.00 $110,768.65 1.0000 $110,768.65 $108,925.33 $1,931,341.9223 368664 0.306576545 $113,023.74 $1,036.87 $0.00 $0.00 $114,060.60 1.0000 $114,060.60 $112,217.28 $2,045,402.5224 368664 0.315773842 $116,414.45 $1,036.87 $0.00 $0.00 $117,451.32 1.0000 $117,451.32 $115,608.00 $2,162,853.8425 368664 0.325247057 $119,906.88 $1,036.87 $0.00 $0.00 $120,943.75 1.0000 $120,943.75 $119,100.43 $2,283,797.5836 368664 0.335004469 $123,504.09 $1,036.87 $0.00 $0.00 $124,540.95 1.0000 $124,540.95 $122,697.63 $2,408,338.5427 368664 0.345054603 $127,209.21 $1,036.87 $0.00 $0.00 $128,246.08 1.0000 $128,246.08 $126,402.76 $2,536,584.6228 368664 0.355406241 $131,025.49 $1,036.87 $0.00 $0.00 $132,062.35 1.0000 $132,062.35 $130,219.03 $2,668,646.9729 368664 0.366068428 $134,956.25 $1,036.87 $0.00 $0.00 $135,993.12 1.0000 $135,993.12 $134,149.80 $2,804,640.0930 368664 0.377050481 $139,004.94 $1,036.87 $0.00 $0.00 $140,041.81 1.0000 $140,041.81 $138,198.49 $2,944,681.89
Totals 11059920 $2,806,294.89 $31,106.03 $2,944,682 $2,944,681.89* Discount Rate= 0.0%
Net Present Cost of PV System Net Present Cost of PV SystemYear Annual PV Annual O&M Total Annual Present Value Present Value Annual PV Annual O&M Total Annual Present Value Present Value
Sys. Payment* Costs Costs Factor** of Costs Sys. Payment* Costs Costs Factor** of Costs0 $500,000.00 $0.00 $500,000.00 1.0000 $500,000.00 $0.00 $0.00 $0.00 1.0000 $0.001 $59,777.00 $1,843.32 $61,620.32 1.0000 $61,620.32 $116,277.00 $1,843.32 $118,120.32 1.0000 $118,120.322 $59,777.00 $1,843.32 $61,620.32 1.0000 $61,620.32 $116,277.00 $1,843.32 $118,120.32 1.0000 $118,120.323 $59,777.00 $1,843.32 $61,620.32 1.0000 $61,620.32 $116,277.00 $1,843.32 $118,120.32 1.0000 $118,120.324 $59,777.00 $1,843.32 $61,620.32 1.0000 $61,620.32 $116,277.00 $1,843.32 $118,120.32 1.0000 $118,120.325 $59,777.00 $1,843.32 $61,620.32 1.0000 $61,620.32 $116,277.00 $1,843.32 $118,120.32 1.0000 $118,120.326 $59,777.00 $1,843.32 $61,620.32 1.0000 $61,620.32 $116,277.00 $1,843.32 $118,120.32 1.0000 $118,120.327 $59,777.00 $1,843.32 $61,620.32 1.0000 $61,620.32 $116,277.00 $1,843.32 $118,120.32 1.0000 $118,120.328 $59,777.00 $1,843.32 $61,620.32 1.0000 $61,620.32 $116,277.00 $1,843.32 $118,120.32 1.0000 $118,120.329 $59,777.00 $1,843.32 $61,620.32 1.0000 $61,620.32 $116,277.00 $1,843.32 $118,120.32 1.0000 $118,120.3210 $59,777.00 $1,843.32 $61,620.32 1.0000 $61,620.32 $116,277.00 $1,843.32 $118,120.32 1.0000 $118,120.3211 $59,777.00 $1,843.32 $61,620.32 1.0000 $61,620.32 $116,277.00 $1,843.32 $118,120.32 1.0000 $118,120.3212 $59,777.00 $1,843.32 $61,620.32 1.0000 $61,620.32 $116,277.00 $1,843.32 $118,120.32 1.0000 $118,120.3213 $59,777.00 $1,843.32 $61,620.32 1.0000 $61,620.32 $116,277.00 $1,843.32 $118,120.32 1.0000 $118,120.3214 $0.00 $1,843.32 $1,843.32 1.0000 $1,843.32 $0.00 $1,843.32 $1,843.32 1.0000 $1,843.3215 $0.00 $1,843.32 $1,843.32 1.0000 $1,843.32 $0.00 $1,843.32 $1,843.32 1.0000 $1,843.3216 $0.00 $1,843.32 $1,843.32 1.0000 $1,843.32 $0.00 $1,843.32 $1,843.32 1.0000 $1,843.3217 $0.00 $1,843.32 $1,843.32 1.0000 $1,843.32 $0.00 $1,843.32 $1,843.32 1.0000 $1,843.3218 $0.00 $1,843.32 $1,843.32 1.0000 $1,843.32 $0.00 $1,843.32 $1,843.32 1.0000 $1,843.3219 $0.00 $1,843.32 $1,843.32 1.0000 $1,843.32 $0.00 $1,843.32 $1,843.32 1.0000 $1,843.3220 $0.00 $1,843.32 $1,843.32 1.0000 $1,843.32 $0.00 $1,843.32 $1,843.32 1.0000 $1,843.3221 $0.00 $1,843.32 $1,843.32 1.0000 $1,843.32 $0.00 $1,843.32 $1,843.32 1.0000 $1,843.3222 $0.00 $1,843.32 $1,843.32 1.0000 $1,843.32 $0.00 $1,843.32 $1,843.32 1.0000 $1,843.3223 $0.00 $1,843.32 $1,843.32 1.0000 $1,843.32 $0.00 $1,843.32 $1,843.32 1.0000 $1,843.3224 $0.00 $1,843.32 $1,843.32 1.0000 $1,843.32 $0.00 $1,843.32 $1,843.32 1.0000 $1,843.3225 $0.00 $1,843.32 $1,843.32 1.0000 $1,843.32 $0.00 $1,843.32 $1,843.32 1.0000 $1,843.3226 $0.00 $1,843.32 $1,843.32 1.0000 $1,843.32 $0.00 $1,843.32 $1,843.32 1.0000 $1,843.3227 $0.00 $1,843.32 $1,843.32 1.0000 $1,843.32 $0.00 $1,843.32 $1,843.32 1.0000 $1,843.3228 $0.00 $1,843.32 $1,843.32 1.0000 $1,843.32 $0.00 $1,843.32 $1,843.32 1.0000 $1,843.3229 $0.00 $1,843.32 $1,843.32 1.0000 $1,843.32 $0.00 $1,843.32 $1,843.32 1.0000 $1,843.3230 $0.00 $1,843.32 $1,843.32 1.0000 $1,843.32 $0.00 $1,843.32 $1,843.32 1.0000 $1,843.32
Totals $1,277,101.00 $55,299.60 $1,332,400.60 $1,332,400.60 $1,511,601.00 $55,299.60 $1,566,900.60 $1,566,900.60* Financing of $529,000 for 13 years at a 6% interest rate and $500,000 downpayment with $500,000 from CEC** Discount Rate = 0.0%*** Financing of $1,029,000 for 13 years at a 6% interest rate and $0.00 downpayment with $500,000 from the CEC
Net Present Value of PV System = Present Value of Benefits - Present Value of Costs= $2,944,681.89- $1,332,400.60= $1,612,281.29
Cost of =Generation Total kWh Generated over Life of System
= $1,332,400.6011059920 kWh
= $0.120 /kWh
Benefit-Cost = Ratio
= $2,944,681.89$1,332,400.60
= 2.210
Payback = The period of time required for the profit or other benefits of the system toequal the cost of the initial investment.
= Year 12
Financial Analysis 200 kW Crystalline Silicon PV Power Station - Best Case(Fixed System)
Present Value of Benefits
Financial Analysis 200 kW Crystalline Silicon PV Power Station - Best Case
Net Present Cost of PV System
Net Present Benefit of the PV SystemNet Present Cost of the PV System
(Fixed System)
Financial Analysis 200 kW Crystalline Silicon PV Power Station - Best Case(Fixed System)

Yr kWh Ave. Cost Value of Clean Air Tax Credit Production Total Value Present Value Present Value Net Cash PaybackGenerated $/kWh Energy Credits $/kWhr Tax Credits of Energy Factor* of Benefits Flow w/ DP (Cost=$0.721M)
0 0 $0.00 $0.00 $0.00 $0.00 $0.00 1.0000 $0.00 -$250,000.00 $0.001 321043 0.16 $51,366.88 $902.93 $0.0198 $3,755.99 $56,025.80 1.0000 $56,025.80 $1,197.59 $56,025.802 321043 0.1648 $52,907.89 $902.93 $0.0204 $6,597.43 $60,408.25 1.0000 $60,408.25 $5,580.04 $116,434.063 321043 0.169744 $54,495.12 $902.93 $0.0210 $6,790.06 $62,188.12 1.0000 $62,188.12 $7,359.90 $178,622.174 321043 0.17483632 $56,129.98 $902.93 $0.0216 $6,982.69 $64,015.60 1.0000 $64,015.60 $9,187.38 $242,637.775 321043 0.18008141 $57,813.88 $902.93 $0.0222 $7,175.31 $65,892.12 1.0000 $65,892.12 $11,063.91 $308,529.896 321043 0.185483852 $59,548.29 $902.93 $0.0228 $7,367.94 $67,819.16 1.0000 $67,819.16 $12,990.95 $376,349.057 321043 0.191048367 $61,334.74 $902.93 $0.0234 $7,560.56 $69,798.24 1.0000 $69,798.24 $14,970.02 $446,147.298 321043 0.196779818 $63,174.78 $902.93 $0.0240 $7,753.19 $71,830.91 1.0000 $71,830.91 $17,002.69 $517,978.199 321043 0.202683213 $65,070.03 $902.93 $0.0246 $7,945.81 $73,918.77 1.0000 $73,918.77 $19,090.56 $591,896.97
10 321043 0.208763709 $67,022.13 $902.93 $0.0252 $8,138.44 $76,063.50 1.0000 $76,063.50 $21,235.29 $667,960.4711 321043 0.215026621 $69,032.79 $902.93 $0.0258 $8,331.07 $78,266.79 1.0000 $78,266.79 $23,438.58 $746,227.2612 321043 0.221477419 $71,103.78 $902.93 $0.0264 $8,523.69 $80,530.40 1.0000 $80,530.40 $25,702.19 $826,757.6613 321043 0.228121742 $73,236.89 $902.93 $0.0270 $6,501.12 $80,640.94 1.0000 $80,640.94 $25,812.73 $907,398.6014 321043 0.234965394 $75,434.00 $902.93 $0.00 $0.00 $76,336.93 1.0000 $76,336.93 $74,731.71 $983,735.5315 321043 0.242014356 $77,697.01 $902.93 $0.00 $0.00 $78,599.95 1.0000 $78,599.95 $76,994.73 $1,062,335.4816 321043 0.249274787 $80,027.93 $902.93 $0.00 $0.00 $80,930.86 1.0000 $80,930.86 $79,325.64 $1,143,266.3417 321043 0.25675303 $82,428.76 $902.93 $0.00 $0.00 $83,331.70 1.0000 $83,331.70 $81,726.48 $1,226,598.0418 321043 0.264455621 $84,901.63 $902.93 $0.00 $0.00 $85,804.56 1.0000 $85,804.56 $84,199.34 $1,312,402.6019 321043 0.27238929 $87,448.67 $902.93 $0.00 $0.00 $88,351.61 1.0000 $88,351.61 $86,746.39 $1,400,754.2020 321043 0.280560968 $90,072.14 $902.93 $0.00 $0.00 $90,975.07 1.0000 $90,975.07 $89,369.85 $1,491,729.27
6420860 $1,380,247.30 $18,058.67 $1,491,729.27 $1,491,729.27* Discount Rate = 0.0%
Yr Annual PV Annual O&M Total Annual Present Value Present Value Annual PV Annual O&M Total Annual Present Value Present ValueSys. Payment* Costs Costs Factor** of Costs Sys. Payment* Costs Costs Factor** of Costs
0 $250,000.00 $0.00 $250,000.00 1.0000 $250,000.00 $0.00 $0.00 $0.00 1.0000 $0.001 $53,223.00 $1,605.22 $54,828.22 1.0000 $54,828.22 $81,473.00 $1,605.22 $83,078.22 1.0000 $83,078.222 $53,223.00 $1,605.22 $54,828.22 1.0000 $54,828.22 $81,473.00 $1,605.22 $83,078.22 1.0000 $83,078.223 $53,223.00 $1,605.22 $54,828.22 1.0000 $54,828.22 $81,473.00 $1,605.22 $83,078.22 1.0000 $83,078.224 $53,223.00 $1,605.22 $54,828.22 1.0000 $54,828.22 $81,473.00 $1,605.22 $83,078.22 1.0000 $83,078.225 $53,223.00 $1,605.22 $54,828.22 1.0000 $54,828.22 $81,473.00 $1,605.22 $83,078.22 1.0000 $83,078.226 $53,223.00 $1,605.22 $54,828.22 1.0000 $54,828.22 $81,473.00 $1,605.22 $83,078.22 1.0000 $83,078.227 $53,223.00 $1,605.22 $54,828.22 1.0000 $54,828.22 $81,473.00 $1,605.22 $83,078.22 1.0000 $83,078.228 $53,223.00 $1,605.22 $54,828.22 1.0000 $54,828.22 $81,473.00 $1,605.22 $83,078.22 1.0000 $83,078.229 $53,223.00 $1,605.22 $54,828.22 1.0000 $54,828.22 $81,473.00 $1,605.22 $83,078.22 1.0000 $83,078.22
10 $53,223.00 $1,605.22 $54,828.22 1.0000 $54,828.22 $81,473.00 $1,605.22 $83,078.22 1.0000 $83,078.2211 $53,223.00 $1,605.22 $54,828.22 1.0000 $54,828.22 $81,473.00 $1,605.22 $83,078.22 1.0000 $83,078.2212 $53,223.00 $1,605.22 $54,828.22 1.0000 $54,828.22 $81,473.00 $1,605.22 $83,078.22 1.0000 $83,078.2213 $53,223.00 $1,605.22 $54,828.22 1.0000 $54,828.22 $81,473.00 $1,605.22 $83,078.22 1.0000 $83,078.2214 $0.00 $1,605.22 $1,605.22 1.0000 $1,605.22 $0.00 $1,605.22 $1,605.22 1.0000 $1,605.2215 $0.00 $1,605.22 $1,605.22 1.0000 $1,605.22 $0.00 $1,605.22 $1,605.22 1.0000 $1,605.2216 $0.00 $1,605.22 $1,605.22 1.0000 $1,605.22 $0.00 $1,605.22 $1,605.22 1.0000 $1,605.2217 $0.00 $1,605.22 $1,605.22 1.0000 $1,605.22 $0.00 $1,605.22 $1,605.22 1.0000 $1,605.2218 $0.00 $1,605.22 $1,605.22 1.0000 $1,605.22 $0.00 $1,605.22 $1,605.22 1.0000 $1,605.2219 $0.00 $1,605.22 $1,605.22 1.0000 $1,605.22 $0.00 $1,605.22 $1,605.22 1.0000 $1,605.2220 $0.00 $1,605.22 $1,605.22 1.0000 $1,605.22 $0.00 $1,605.22 $1,605.22 1.0000 $1,605.22
$941,899.00 $32,104.30 $974,003.30 $974,003.30 $1,059,149.00 $32,104.30 $1,091,253.30 $1,091,253.30* Financing of $471,000 for 13 years at a 6% interest rate and $250,000 downpayment with $500,000 from CEC** Discount Rate = 0.0%*** Financing of $721,000 for 13 years at a 6% interest rate and $0.00 downpayment with $500,000 from CEC
Net Present Value of PV System = Present Value of Benefits - Present Worth of Costs= $1,491,729.27- $974,003.30= $517,725.97
Cost of= Generation Total kWh Generated over Life of System
= $974,003.306420860 kWh
= $0.152 /kWh
Benefit-Cost = Ratio
= $1,491,729.27$974,003.30
= 1.532
Payback = The period of time required for the profit or other benefits of the system toequal the cost of the initial investment.
= Year 10
Net Present Benefit of the PV SystemNet Present Cost of the PV System
Financial Analysis 200 kW Amorphous Silicon PV Power Station - Best Case
Net Present Cost of PV System
Financial Analysis 200 kW Amorphous Silicon PV Power Station - Best Case
Financial Analysis 200 kW Amorphous Silicon PV Power Station - Best Case
Present Value of Benefits
Net Present Cost of PV System
Net Present Cost of PV System

Millennium Energy LLC Brightfield Feasibility AssessmentFebruary, 2001 NREL Task Ordering Agreement # KDC-0-30470-00
Appendix F:Economic Analysis Spreadsheets
ForBest Case Scenario of PV System Options
Utilizing the 20-Year Financing Mechanism

Year kWh Ave. Cost Value of Clean Air Tax Credit Production Total Value Present Value Present Value Present Value Net Cash Net Cash PaybackGenerated $/kWh Energy Credits $/kWhr Tax Credits of Energy Factor* of Benefits of Costs w/o DP Flow w/o DP Flow w/ DP (Cost=$6.134M)
0 0 0 1.0000 $0.00 $0.00 $0.00 -$1,800,000 $0.001 2241576 0.16 $358,652.16 $6,304.43 $0.0198 $26,224.96 $391,181.55 0.9569 $374,321.63 $522,556.09 -$148,234 $1,960.57 $374,321.632 2241576 0.1648 $369,411.72 $6,304.43 $0.0204 $46,064.39 $421,780.54 0.9157 $386,224.44 $500,057.07 -$113,833 $29,895.65 $760,546.073 2241576 0.169744 $380,494.08 $6,304.43 $0.0210 $47,409.33 $434,207.84 0.8763 $380,496.33 $478,541.02 -$98,045 $39,499.36 $1,141,042.404 2241576 0.17483632 $391,908.90 $6,304.43 $0.0216 $48,754.28 $446,967.61 0.8386 $374,827.04 $457,953.32 -$83,126 $48,500.37 $1,515,869.445 2241576 0.18008141 $403,666.17 $6,304.43 $0.0222 $50,099.22 $460,069.82 0.8025 $369,206.03 $438,239.38 -$69,033 $56,927.06 $1,885,075.476 2241576 0.185483852 $415,776.15 $6,304.43 $0.0228 $51,444.17 $473,524.75 0.7679 $363,619.66 $419,344.57 -$55,725 $64,804.67 $2,248,695.137 2241576 0.191048367 $428,249.44 $6,304.43 $0.0234 $52,789.11 $487,342.98 0.7348 $358,099.62 $401,268.90 -$43,169 $72,164.93 $2,606,794.758 2241576 0.196779818 $441,096.92 $6,304.43 $0.0240 $54,134.06 $501,535.41 0.7032 $352,679.70 $384,012.37 -$31,333 $79,041.60 $2,959,474.459 2241576 0.202683213 $454,329.83 $6,304.43 $0.0246 $55,479.01 $516,113.26 0.6729 $347,292.62 $367,465.76 -$20,173 $85,445.24 $3,306,767.0710 2241576 0.208763709 $467,959.72 $6,304.43 $0.0252 $56,823.95 $531,088.10 0.6439 $341,967.63 $351,629.08 -$9,661 $91,405.10 $3,648,734.7011 2241576 0.215026621 $481,998.51 $6,304.43 $0.0258 $58,168.90 $546,471.84 0.6162 $336,735.95 $336,502.31 $234 $96,952.39 $3,985,470.6512 2241576 0.221477419 $496,458.47 $6,304.43 $0.0264 $59,513.84 $562,276.74 0.5897 $331,574.60 $322,030.85 $9,544 $102,103.05 $4,317,045.2513 2241576 0.228121742 $511,352.22 $6,304.43 $0.0270 $45,391.91 $563,048.57 0.5643 $317,728.31 $308,160.10 $9,568 $98,140.74 $4,634,773.5514 2241576 0.234965394 $526,692.79 $6,304.43 $0.00 $0.00 $532,997.22 0.54 $287,818.50 $294,890.05 -$7,072 $77,686.85 $4,922,592.0515 2241576 0.242014356 $542,493.57 $6,304.43 $0.00 $0.00 $548,798.00 0.5167 $283,563.93 $282,166.09 $1,398 $82,499.07 $5,206,155.9816 2241576 0.249274787 $558,768.38 $6,304.43 $0.00 $0.00 $565,072.81 0.4945 $279,428.51 $270,042.83 $9,386 $87,002.40 $5,485,584.4917 2241576 0.25675303 $575,531.43 $6,304.43 $0.00 $0.00 $581,835.86 0.4732 $275,324.73 $258,411.06 $16,914 $91,187.15 $5,760,909.2218 2241576 0.264455621 $592,797.37 $6,304.43 $0.00 $0.00 $599,101.81 0.4528 $271,273.30 $247,270.77 $24,003 $95,074.02 $6,032,182.5119 2241576 0.27238929 $610,581.29 $6,304.43 $0.00 $0.00 $616,885.73 0.4333 $267,296.59 $236,621.96 $30,675 $98,685.40 $6,299,479.1020 2241576 0.280560968 $628,898.73 $6,304.43 $0.00 $0.00 $635,203.17 0.4146 $263,355.23 $226,410.03 $36,945 $102,020.82 $6,562,834.3321 2241576 0.288977798 $647,765.70 $6,304.43 $0.00 $0.00 $654,070.13 0.3968 $259,535.03 $4,447.29 $255,088 $255,087.74 $6,822,369.3622 2241576 0.297647131 $667,198.67 $6,304.43 $0.00 $0.00 $673,503.10 0.3797 $255,729.13 $4,255.63 $251,473 $251,473.49 $7,078,098.4923 2241576 0.306576545 $687,214.63 $6,304.43 $0.00 $0.00 $693,519.06 0.3634 $252,024.83 $4,072.94 $247,952 $247,951.88 $7,330,123.3124 2241576 0.315773842 $707,831.07 $6,304.43 $0.00 $0.00 $714,135.50 0.3477 $248,304.91 $3,896.98 $244,408 $244,407.93 $7,578,428.2225 2241576 0.325247057 $729,066.00 $6,304.43 $0.00 $0.00 $735,370.43 0.3327 $244,657.74 $3,728.86 $240,929 $240,928.88 $7,823,085.9726 2241576 0.335004469 $750,937.98 $6,304.43 $0.00 $0.00 $757,242.41 0.3184 $241,105.98 $3,568.59 $237,537 $237,537.39 $8,064,191.9527 2241576 0.345054603 $773,466.12 $6,304.43 $0.00 $0.00 $779,770.55 0.3047 $237,596.09 $3,415.04 $234,181 $234,181.05 $8,301,788.0428 2241576 0.355406241 $796,670.10 $6,304.43 $0.00 $0.00 $802,974.53 0.2916 $234,147.37 $3,268.22 $230,879 $230,879.16 $8,535,935.4129 2241576 0.366068428 $820,570.20 $6,304.43 $0.00 $0.00 $826,874.64 0.279 $230,698.02 $3,127.00 $227,571 $227,571.02 $8,766,633.4330 2241576 0.377050481 $845,187.31 $6,304.43 $0.00 $0.00 $851,491.74 0.267 $227,348.29 $2,992.50 $224,356 $224,355.79 $8,993,981.73
Totals 67247280 $17,063,026 $189,132.98 $652,297.14 $17,904,456 $8,993,982* Discount Rate= 4.5%
Year Annual PV Annual O&M Total Annual Present Value Present Value Annual PV Annual O&M Total Annual Present Value Present ValueSys. Payment* Costs Costs Factor** of Costs Sys. Payment*** Costs Costs Factor** of Costs
0 $1,800,000.00 $0.00 $1,800,000.00 1.0000 $1,800,000.00 0 $0.00 $0.00 1.0000 $0.00001 $377,924.80 $11,207.88 $389,132.68 0.9569 $372,361.06 534,884.80 $11,207.88 $546,092.68 0.9569 $522,556.08552 $377,924.80 $11,207.88 $389,132.68 0.9157 $356,328.80 534,884.80 $11,207.88 $546,092.68 0.9157 $500,057.06713 $377,924.80 $11,207.88 $389,132.68 0.8763 $340,996.97 534,884.80 $11,207.88 $546,092.68 0.8763 $478,541.01554 $377,924.80 $11,207.88 $389,132.68 0.8386 $326,326.67 534,884.80 $11,207.88 $546,092.68 0.8386 $457,953.32145 $377,924.80 $11,207.88 $389,132.68 0.8025 $312,278.98 534,884.80 $11,207.88 $546,092.68 0.8025 $438,239.37576 $377,924.80 $11,207.88 $389,132.68 0.7679 $298,814.98 534,884.80 $11,207.88 $546,092.68 0.7679 $419,344.56907 $377,924.80 $11,207.88 $389,132.68 0.7348 $285,934.69 534,884.80 $11,207.88 $546,092.68 0.7348 $401,268.90138 $377,924.80 $11,207.88 $389,132.68 0.7032 $273,638.10 534,884.80 $11,207.88 $546,092.68 0.7032 $384,012.37269 $377,924.80 $11,207.88 $389,132.68 0.6729 $261,847.38 534,884.80 $11,207.88 $546,092.68 0.6729 $367,465.764410 $377,924.80 $11,207.88 $389,132.68 0.6439 $250,562.53 534,884.80 $11,207.88 $546,092.68 0.6439 $351,629.076711 $377,924.80 $11,207.88 $389,132.68 0.6162 $239,783.56 534,884.80 $11,207.88 $546,092.68 0.6162 $336,502.309412 $377,924.80 $11,207.88 $389,132.68 0.5897 $229,471.54 534,884.80 $11,207.88 $546,092.68 0.5897 $322,030.853413 $377,924.80 $11,207.88 $389,132.68 0.5643 $219,587.57 534,884.80 $11,207.88 $546,092.68 0.5643 $308,160.099314 $377,924.80 $11,207.88 $389,132.68 0.54 $210,131.65 534,884.80 $11,207.88 $546,092.68 0.54 $294,890.047215 $377,924.80 $11,207.88 $389,132.68 0.5167 $201,064.86 534,884.80 $11,207.88 $546,092.68 0.5167 $282,166.087816 $377,924.80 $11,207.88 $389,132.68 0.4945 $192,426.11 534,884.80 $11,207.88 $546,092.68 0.4945 $270,042.830317 $377,924.80 $11,207.88 $389,132.68 0.4732 $184,137.58 534,884.80 $11,207.88 $546,092.68 0.4732 $258,411.056218 $377,924.80 $11,207.88 $389,132.68 0.4528 $176,199.28 534,884.80 $11,207.88 $546,092.68 0.4528 $247,270.765519 $377,924.80 $11,207.88 $389,132.68 0.4333 $168,611.19 534,884.80 $11,207.88 $546,092.68 0.4333 $236,621.958220 $377,924.80 $11,207.88 $389,132.68 0.4146 $161,334.41 534,884.80 $11,207.88 $546,092.68 0.4146 $226,410.025121 $0.00 $11,207.88 $11,207.88 0.3968 $4,447.29 0.00 $11,207.88 $11,207.88 0.3968 $4,447.286822 $0.00 $11,207.88 $11,207.88 0.3797 $4,255.63 0.00 $11,207.88 $11,207.88 0.3797 $4,255.632023 $0.00 $11,207.88 $11,207.88 0.3634 $4,072.94 0.00 $11,207.88 $11,207.88 0.3634 $4,072.943624 $0.00 $11,207.88 $11,207.88 0.3477 $3,896.98 0.00 $11,207.88 $11,207.88 0.3477 $3,896.979925 $0.00 $11,207.88 $11,207.88 0.3327 $3,728.86 0.00 $11,207.88 $11,207.88 0.3327 $3,728.861726 $0.00 $11,207.88 $11,207.88 0.3184 $3,568.59 0.00 $11,207.88 $11,207.88 0.3184 $3,568.589027 $0.00 $11,207.88 $11,207.88 0.3047 $3,415.04 0.00 $11,207.88 $11,207.88 0.3047 $3,415.041028 $0.00 $11,207.88 $11,207.88 0.2916 $3,268.22 0.00 $11,207.88 $11,207.88 0.2916 $3,268.217829 $0.00 $11,207.88 $11,207.88 0.279 $3,127.00 0.00 $11,207.88 $11,207.88 0.279 $3,126.998530 $0.00 $11,207.88 $11,207.88 0.267 $2,992.50 0.00 $11,207.88 $11,207.88 0.267 $2,992.5040
Totals $9,358,496 $336,236.40 $9,694,732 $6,898,610.96 $10,697,696 $336,236 $11,033,932 $7,140,346.64* Financing of $4,334,000 for 20 years at a 6% interest rate and $1,800,000 downpayment with $1,000,000 from CEC and $250,000 from AB970** Discount Rate = 4.5%*** Financing of $6,134,000 for 20 years at a 6% interest rate and $0.0 downpayment with $1,000,000 from the CEC and $250,000 from AB970
Net Present Value of PV System = Present Value of Benefits - Present Worth of Costs= $8,993,981.73- $6,898,610.96= $2,095,370.77
Cost of Generation =Total kWh Generated over Life of System
= $6,898,610.9667247280 kWh
= $0.103 /kWh
Benefit-Cost Ratio =
= $8,993,981.73$6,898,610.96
= 1.304
Payback = The period of time required for the profit or other benefits of the system toequal the cost of the initial investment.
= Year 18
Financial Analysis 1MW Crystalline Silicon (Tracking) PV Power Station - Best Case
Net Cash Flows
Net Present Benefit of the PV SystemNet Present Cost of the PV System
Present Value of Benefits
Net Present Cost of PV System
Present Value of Costs w/o DownpaymentPresent Value of Costs with a Downpayment
Financial Analysis 1MW Crystalline Silicon (Tracking) PV Power Station - Best Case
Financial Analysis 1MW Crystalline Silicon (Tracking) PV Power Station - Best Case

Year kWh Ave. Cost Value of Clean Air Tax Credit Production Total Value Present Value Present Value Net Cash Net Cash PaybackGenerated $/kWh Energy Credits $/kWhr Tax Credits of Energy Factor* of Benefits Flow w/o DP Flow w/ DP (Cost=$5.934M)
0 0.00 $0.00 $0.00 $0.00 $0.00 $0.00 1.0000 $0.00 $0.0000 ########### $0.001 1903050 0.16 $304,488.00 $5,352.33 $0.0198 $22,253.12 $332,093.45 0.9569 $317,780.23 -$186,467.8467 -$11,240.32 $317,780.232 1903050 0.1648 $313,622.64 $5,352.33 $0.0204 $39,107.68 $358,082.65 0.9157 $327,896.28 -$154,641.0392 $13,041.94 $645,676.503 1903050 0.169744 $323,031.32 $5,352.33 $0.0210 $40,249.51 $368,633.15 0.8763 $323,033.23 -$138,741.8582 $21,726.20 $968,709.744 1903050 0.17483632 $332,722.26 $5,352.33 $0.0216 $41,391.34 $379,465.92 0.8386 $318,220.12 -$123,688.5737 $29,875.86 $1,286,929.865 1903050 0.18008141 $342,703.93 $5,352.33 $0.0222 $42,533.17 $390,589.42 0.8025 $313,448.01 -$109,437.4288 $37,516.37 $1,600,377.876 1903050 0.185483852 $352,985.04 $5,352.33 $0.0228 $43,675.00 $402,012.37 0.7679 $308,705.30 -$95,947.3235 $44,670.52 $1,909,083.177 1903050 0.191048367 $363,574.60 $5,352.33 $0.0234 $44,816.83 $413,743.75 0.7348 $304,018.91 -$83,191.3363 $51,365.24 $2,213,102.088 1903050 0.196779818 $374,481.83 $5,352.33 $0.0240 $45,958.66 $425,792.82 0.7032 $299,417.51 -$71,140.7967 $57,629.19 $2,512,519.599 1903050 0.202683213 $385,716.29 $5,352.33 $0.0246 $47,100.49 $438,169.10 0.6729 $294,843.99 -$59,747.4275 $63,474.02 $2,807,363.5810 1903050 0.208763709 $397,287.78 $5,352.33 $0.0252 $48,242.32 $450,882.42 0.6439 $290,323.19 -$48,986.3841 $68,924.58 $3,097,686.7711 1903050 0.215026621 $409,206.41 $5,352.33 $0.0258 $49,384.15 $463,942.89 0.6162 $285,881.61 -$38,831.1764 $74,007.37 $3,383,568.3812 1903050 0.221477419 $421,482.60 $5,352.33 $0.0264 $50,525.98 $477,360.91 0.5897 $281,499.73 -$29,248.6138 $78,737.25 $3,665,068.1113 1903050 0.228121742 $434,127.08 $5,352.33 $0.0270 $38,536.76 $478,016.17 0.5643 $269,744.53 -$27,619.0306 $75,715.59 $3,934,812.6314 1903050 0.234965394 $447,150.89 $5,352.33 $0.00 $0.00 $452,503.22 0.54 $244,351.74 -$40,206.6874 $58,678.11 $4,179,164.3715 1903050 0.242014356 $460,565.42 $5,352.33 $0.00 $0.00 $465,917.75 0.5167 $240,739.70 -$31,540.5573 $63,077.55 $4,419,904.0716 1903050 0.249274787 $474,382.38 $5,352.33 $0.00 $0.00 $479,734.71 0.4945 $237,228.81 -$23,352.9302 $67,199.91 $4,657,132.8917 1903050 0.25675303 $488,613.85 $5,352.33 $0.00 $0.00 $493,966.18 0.4732 $233,744.80 -$15,612.6982 $71,039.69 $4,890,877.6818 1903050 0.264455621 $503,272.27 $5,352.33 $0.00 $0.00 $508,624.60 0.4528 $230,305.22 -$8,302.2927 $74,614.44 $5,121,182.9019 1903050 0.27238929 $518,370.44 $5,352.33 $0.00 $0.00 $523,722.77 0.4333 $226,929.07 -$1,402.7151 $77,943.18 $5,348,111.9820 1903050 0.280560968 $533,921.55 $5,352.33 $0.00 $0.00 $539,273.88 0.4146 $223,582.95 $5,105.3136 $81,026.87 $5,571,694.9321 1903050 0.288977798 $549,939.20 $5,352.33 $0.00 $0.00 $555,291.53 0.3968 $220,339.68 $216,564.0262 $216,564.03 $5,792,034.6022 1903050 0.297647131 $566,437.37 $5,352.33 $0.00 $0.00 $571,789.70 0.3797 $217,108.55 $213,495.6093 $213,495.61 $6,009,143.1523 1903050 0.306576545 $583,430.49 $5,352.33 $0.00 $0.00 $588,782.82 0.3634 $213,963.68 $210,505.8360 $210,505.84 $6,223,106.8324 1903050 0.315773842 $600,933.41 $5,352.33 $0.00 $0.00 $606,285.74 0.3477 $210,805.55 $207,497.0986 $207,497.10 $6,433,912.3825 1903050 0.325247057 $618,961.41 $5,352.33 $0.00 $0.00 $624,313.74 0.3327 $207,709.18 $204,543.4576 $204,543.46 $6,641,621.5626 1903050 0.335004469 $637,530.25 $5,352.33 $0.00 $0.00 $642,882.58 0.3184 $204,693.81 $201,664.1586 $201,664.16 $6,846,315.3827 1903050 0.345054603 $656,656.16 $5,352.33 $0.00 $0.00 $662,008.49 0.3047 $201,713.99 $198,814.6902 $198,814.69 $7,048,029.3728 1903050 0.355406241 $676,355.85 $5,352.33 $0.00 $0.00 $681,708.17 0.2916 $198,786.10 $196,011.4569 $196,011.46 $7,246,815.4729 1903050 0.366068428 $696,646.52 $5,352.33 $0.00 $0.00 $701,998.85 0.279 $195,857.68 $193,202.9245 $193,202.92 $7,442,673.1530 1903050 0.377050481 $717,545.92 $5,352.33 $0.00 $0.00 $722,898.25 0.267 $193,013.83 $190,473.2599 $190,473.26 $7,635,686.98
Totals 57091500 $14,486,143.18 $160,569.84 $15,200,488.01 $7,635,686.98* Discount Rate= 4.5%
Net Present Cost of PV SystemYear Annual PV Annual O&M Total Annual Present Value Present Value Annual PV Annual O&M Total Annual Present Value Present Value
Sys. Payment* Costs Costs Factor** of Costs Sys. Payment*** Costs Costs Factor** of Costs0 $2,100,000.00 $0.00 $2,100,000.00 1.0000 $2,100,000.00 $0.00 $0.00 $0.00 1.0000 $0.00001 $334,324.80 $9,515.25 $343,840.05 0.9569 $329,020.54 $517,444.80 $9,515.25 $526,960.05 0.9569 $504,248.07182 $334,324.80 $9,515.25 $343,840.05 0.9157 $314,854.33 $517,444.80 $9,515.25 $526,960.05 0.9157 $482,537.31783 $334,324.80 $9,515.25 $343,840.05 0.8763 $301,307.04 $517,444.80 $9,515.25 $526,960.05 0.8763 $461,775.09184 $334,324.80 $9,515.25 $343,840.05 0.8386 $288,344.27 $517,444.80 $9,515.25 $526,960.05 0.8386 $441,908.69795 $334,324.80 $9,515.25 $343,840.05 0.8025 $275,931.64 $517,444.80 $9,515.25 $526,960.05 0.8025 $422,885.44016 $334,324.80 $9,515.25 $343,840.05 0.7679 $264,034.77 $517,444.80 $9,515.25 $526,960.05 0.7679 $404,652.62247 $334,324.80 $9,515.25 $343,840.05 0.7348 $252,653.67 $517,444.80 $9,515.25 $526,960.05 0.7348 $387,210.24478 $334,324.80 $9,515.25 $343,840.05 0.7032 $241,788.32 $517,444.80 $9,515.25 $526,960.05 0.7032 $370,558.30729 $334,324.80 $9,515.25 $343,840.05 0.6729 $231,369.97 $517,444.80 $9,515.25 $526,960.05 0.6729 $354,591.417610 $334,324.80 $9,515.25 $343,840.05 0.6439 $221,398.61 $517,444.80 $9,515.25 $526,960.05 0.6439 $339,309.576211 $334,324.80 $9,515.25 $343,840.05 0.6162 $211,874.24 $517,444.80 $9,515.25 $526,960.05 0.6162 $324,712.782812 $334,324.80 $9,515.25 $343,840.05 0.5897 $202,762.48 $517,444.80 $9,515.25 $526,960.05 0.5897 $310,748.341513 $334,324.80 $9,515.25 $343,840.05 0.5643 $194,028.94 $517,444.80 $9,515.25 $526,960.05 0.5643 $297,363.556214 $334,324.80 $9,515.25 $343,840.05 0.54 $185,673.63 $517,444.80 $9,515.25 $526,960.05 0.54 $284,558.427015 $334,324.80 $9,515.25 $343,840.05 0.5167 $177,662.15 $517,444.80 $9,515.25 $526,960.05 0.5167 $272,280.257816 $334,324.80 $9,515.25 $343,840.05 0.4945 $170,028.90 $517,444.80 $9,515.25 $526,960.05 0.4945 $260,581.744717 $334,324.80 $9,515.25 $343,840.05 0.4732 $162,705.11 $517,444.80 $9,515.25 $526,960.05 0.4732 $249,357.495718 $334,324.80 $9,515.25 $343,840.05 0.4528 $155,690.77 $517,444.80 $9,515.25 $526,960.05 0.4528 $238,607.510619 $334,324.80 $9,515.25 $343,840.05 0.4333 $148,985.89 $517,444.80 $9,515.25 $526,960.05 0.4333 $228,331.789720 $334,324.80 $9,515.25 $343,840.05 0.4146 $142,556.08 $517,444.80 $9,515.25 $526,960.05 0.4146 $218,477.636721 $0.00 $9,515.25 $9,515.25 0.3968 $3,775.65 $0.00 $9,515.25 $9,515.25 0.3968 $3,775.651222 $0.00 $9,515.25 $9,515.25 0.3797 $3,612.94 $0.00 $9,515.25 $9,515.25 0.3797 $3,612.940423 $0.00 $9,515.25 $9,515.25 0.3634 $3,457.84 $0.00 $9,515.25 $9,515.25 0.3634 $3,457.841924 $0.00 $9,515.25 $9,515.25 0.3477 $3,308.45 $0.00 $9,515.25 $9,515.25 0.3477 $3,308.452425 $0.00 $9,515.25 $9,515.25 0.3327 $3,165.72 $0.00 $9,515.25 $9,515.25 0.3327 $3,165.723726 $0.00 $9,515.25 $9,515.25 0.3184 $3,029.66 $0.00 $9,515.25 $9,515.25 0.3184 $3,029.655627 $0.00 $9,515.25 $9,515.25 0.3047 $2,899.30 $0.00 $9,515.25 $9,515.25 0.3047 $2,899.296728 $0.00 $9,515.25 $9,515.25 0.2916 $2,774.65 $0.00 $9,515.25 $9,515.25 0.2916 $2,774.646929 $0.00 $9,515.25 $9,515.25 0.279 $2,654.75 $0.00 $9,515.25 $9,515.25 0.279 $2,654.754830 $0.00 $9,515.25 $9,515.25 0.267 $2,540.57 $0.00 $9,515.25 $9,515.25 0.267 $2,540.5718
Totals $8,786,496.00 $285,457.50 $9,071,953.50 $6,603,890.91 $10,348,896.00 $285,457.50 $10,634,353.50 $6,885,915.87* Financing of $3,834,000 for 20 years at a 6% interest rate and $2,100,000 downpayment with $1,000,000 from the CEC and $250,000 from AB970** Discount Rate = 4.5%*** Financing of $5,934,000 for 20 years at a 6% interest rate and $0.0 downpayment with $1,000,000 from the CEC and $250,000 from AB970
Net Present Value of PV System = Present Value of Benefits - Present Value of Costs= $7,635,686.98- $6,603,890.91= $1,031,796.08
Cost of= Generation Total kWh Generated over Life of System
= $6,603,890.9157091500 kWh
= $0.116 /kWh
Benefit-Cost =Ratio
= $7,635,686.98$6,603,890.91
= 1.156
Payback = The period of time required for the profit or other benefits of the system toequal the cost of the initial investment.
= Year 21
Net Present Cost of the PV System
Financial Analysis 1MW Crystalline Silicon PV Power Station - Best Case
Present Value of Benefits
(Fixed System)
Financial Analysis 1MW Crystalline Silicon (Fixed) PV Power Station - Best Case
Financial Analysis 1MW Crystalline Silicon (Fixed) PV Power Station - Best Case
Net Cash Flows
Present Value of Costs w/o Downpayment
Net Present Cost of PV System
Net Present Benefit of the PV System
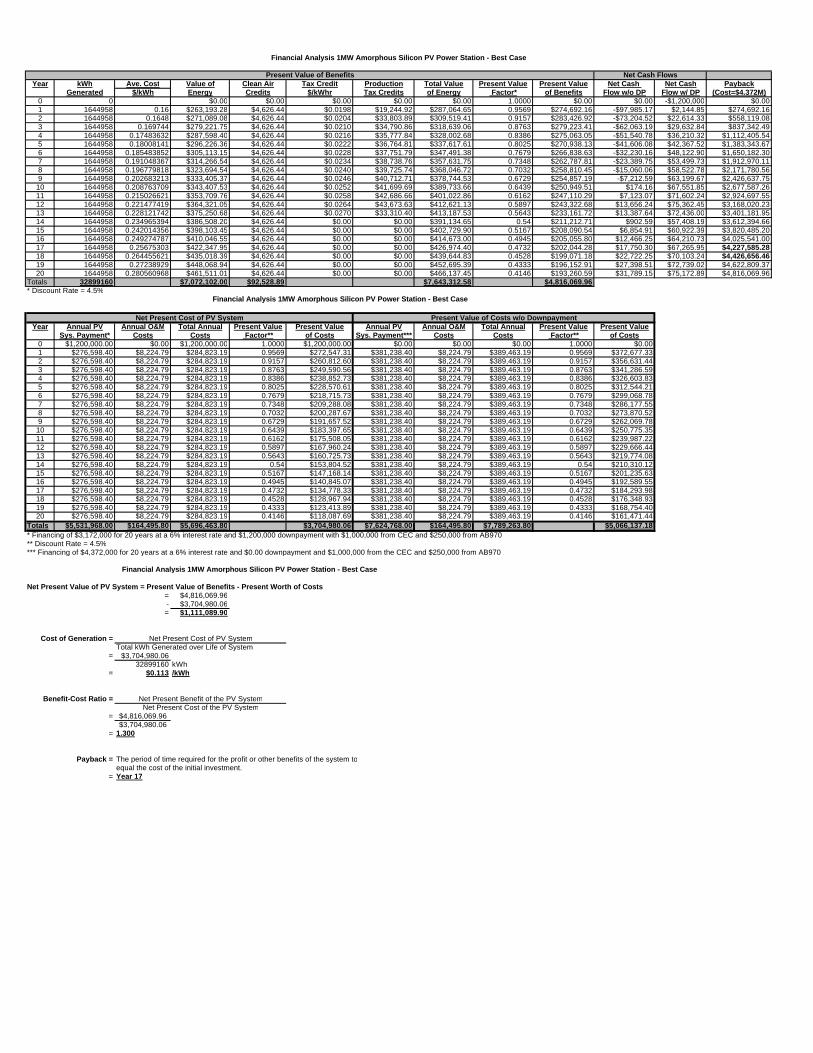
Year kWh Ave. Cost Value of Clean Air Tax Credit Production Total Value Present Value Present Value Net Cash Net Cash PaybackGenerated $/kWh Energy Credits $/kWhr Tax Credits of Energy Factor* of Benefits Flow w/o DP Flow w/ DP (Cost=$4.372M)
0 0 $0.00 $0.00 $0.00 $0.00 $0.00 1.0000 $0.00 $0.00 -$1,200,000 $0.001 1644958 0.16 $263,193.28 $4,626.44 $0.0198 $19,244.92 $287,064.65 0.9569 $274,692.16 -$97,985.17 $2,144.85 $274,692.162 1644958 0.1648 $271,089.08 $4,626.44 $0.0204 $33,803.89 $309,519.41 0.9157 $283,426.92 -$73,204.52 $22,614.33 $558,119.083 1644958 0.169744 $279,221.75 $4,626.44 $0.0210 $34,790.86 $318,639.06 0.8763 $279,223.41 -$62,063.19 $29,632.84 $837,342.494 1644958 0.17483632 $287,598.40 $4,626.44 $0.0216 $35,777.84 $328,002.68 0.8386 $275,063.05 -$51,540.78 $36,210.32 $1,112,405.545 1644958 0.18008141 $296,226.36 $4,626.44 $0.0222 $36,764.81 $337,617.61 0.8025 $270,938.13 -$41,606.08 $42,367.52 $1,383,343.676 1644958 0.185483852 $305,113.15 $4,626.44 $0.0228 $37,751.79 $347,491.38 0.7679 $266,838.63 -$32,230.16 $48,122.90 $1,650,182.307 1644958 0.191048367 $314,266.54 $4,626.44 $0.0234 $38,738.76 $357,631.75 0.7348 $262,787.81 -$23,389.75 $53,499.73 $1,912,970.118 1644958 0.196779818 $323,694.54 $4,626.44 $0.0240 $39,725.74 $368,046.72 0.7032 $258,810.45 -$15,060.06 $58,522.78 $2,171,780.569 1644958 0.202683213 $333,405.37 $4,626.44 $0.0246 $40,712.71 $378,744.53 0.6729 $254,857.19 -$7,212.59 $63,199.67 $2,426,637.75
10 1644958 0.208763709 $343,407.53 $4,626.44 $0.0252 $41,699.69 $389,733.66 0.6439 $250,949.51 $174.16 $67,551.85 $2,677,587.2611 1644958 0.215026621 $353,709.76 $4,626.44 $0.0258 $42,686.66 $401,022.86 0.6162 $247,110.29 $7,123.07 $71,602.24 $2,924,697.5512 1644958 0.221477419 $364,321.05 $4,626.44 $0.0264 $43,673.63 $412,621.13 0.5897 $243,322.68 $13,656.24 $75,362.45 $3,168,020.2313 1644958 0.228121742 $375,250.68 $4,626.44 $0.0270 $33,310.40 $413,187.53 0.5643 $233,161.72 $13,387.64 $72,436.00 $3,401,181.9514 1644958 0.234965394 $386,508.20 $4,626.44 $0.00 $0.00 $391,134.65 0.54 $211,212.71 $902.59 $57,408.19 $3,612,394.6615 1644958 0.242014356 $398,103.45 $4,626.44 $0.00 $0.00 $402,729.90 0.5167 $208,090.54 $6,854.91 $60,922.39 $3,820,485.2016 1644958 0.249274787 $410,046.55 $4,626.44 $0.00 $0.00 $414,673.00 0.4945 $205,055.80 $12,466.25 $64,210.73 $4,025,541.0017 1644958 0.25675303 $422,347.95 $4,626.44 $0.00 $0.00 $426,974.40 0.4732 $202,044.28 $17,750.30 $67,265.95 $4,227,585.2818 1644958 0.264455621 $435,018.39 $4,626.44 $0.00 $0.00 $439,644.83 0.4528 $199,071.18 $22,722.25 $70,103.24 $4,426,656.4619 1644958 0.27238929 $448,068.94 $4,626.44 $0.00 $0.00 $452,695.39 0.4333 $196,152.91 $27,398.51 $72,739.02 $4,622,809.3720 1644958 0.280560968 $461,511.01 $4,626.44 $0.00 $0.00 $466,137.45 0.4146 $193,260.59 $31,789.15 $75,172.89 $4,816,069.96
Totals 32899160 $7,072,102.00 $92,528.89 $7,643,312.58 $4,816,069.96* Discount Rate = 4.5%
Year Annual PV Annual O&M Total Annual Present Value Present Value Annual PV Annual O&M Total Annual Present Value Present ValueSys. Payment* Costs Costs Factor** of Costs Sys. Payment*** Costs Costs Factor** of Costs
0 $1,200,000.00 $0.00 $1,200,000.00 1.0000 $1,200,000.00 $0.00 $0.00 $0.00 1.0000 $0.001 $276,598.40 $8,224.79 $284,823.19 0.9569 $272,547.31 $381,238.40 $8,224.79 $389,463.19 0.9569 $372,677.332 $276,598.40 $8,224.79 $284,823.19 0.9157 $260,812.60 $381,238.40 $8,224.79 $389,463.19 0.9157 $356,631.443 $276,598.40 $8,224.79 $284,823.19 0.8763 $249,590.56 $381,238.40 $8,224.79 $389,463.19 0.8763 $341,286.594 $276,598.40 $8,224.79 $284,823.19 0.8386 $238,852.73 $381,238.40 $8,224.79 $389,463.19 0.8386 $326,603.835 $276,598.40 $8,224.79 $284,823.19 0.8025 $228,570.61 $381,238.40 $8,224.79 $389,463.19 0.8025 $312,544.216 $276,598.40 $8,224.79 $284,823.19 0.7679 $218,715.73 $381,238.40 $8,224.79 $389,463.19 0.7679 $299,068.787 $276,598.40 $8,224.79 $284,823.19 0.7348 $209,288.08 $381,238.40 $8,224.79 $389,463.19 0.7348 $286,177.558 $276,598.40 $8,224.79 $284,823.19 0.7032 $200,287.67 $381,238.40 $8,224.79 $389,463.19 0.7032 $273,870.529 $276,598.40 $8,224.79 $284,823.19 0.6729 $191,657.52 $381,238.40 $8,224.79 $389,463.19 0.6729 $262,069.78
10 $276,598.40 $8,224.79 $284,823.19 0.6439 $183,397.65 $381,238.40 $8,224.79 $389,463.19 0.6439 $250,775.3511 $276,598.40 $8,224.79 $284,823.19 0.6162 $175,508.05 $381,238.40 $8,224.79 $389,463.19 0.6162 $239,987.2212 $276,598.40 $8,224.79 $284,823.19 0.5897 $167,960.24 $381,238.40 $8,224.79 $389,463.19 0.5897 $229,666.4413 $276,598.40 $8,224.79 $284,823.19 0.5643 $160,725.73 $381,238.40 $8,224.79 $389,463.19 0.5643 $219,774.0814 $276,598.40 $8,224.79 $284,823.19 0.54 $153,804.52 $381,238.40 $8,224.79 $389,463.19 0.54 $210,310.1215 $276,598.40 $8,224.79 $284,823.19 0.5167 $147,168.14 $381,238.40 $8,224.79 $389,463.19 0.5167 $201,235.6316 $276,598.40 $8,224.79 $284,823.19 0.4945 $140,845.07 $381,238.40 $8,224.79 $389,463.19 0.4945 $192,589.5517 $276,598.40 $8,224.79 $284,823.19 0.4732 $134,778.33 $381,238.40 $8,224.79 $389,463.19 0.4732 $184,293.9818 $276,598.40 $8,224.79 $284,823.19 0.4528 $128,967.94 $381,238.40 $8,224.79 $389,463.19 0.4528 $176,348.9319 $276,598.40 $8,224.79 $284,823.19 0.4333 $123,413.89 $381,238.40 $8,224.79 $389,463.19 0.4333 $168,754.4020 $276,598.40 $8,224.79 $284,823.19 0.4146 $118,087.69 $381,238.40 $8,224.79 $389,463.19 0.4146 $161,471.44
Totals $5,531,968.00 $164,495.80 $5,696,463.80 $3,704,980.06 $7,624,768.00 $164,495.80 $7,789,263.80 $5,066,137.18* Financing of $3,172,000 for 20 years at a 6% interest rate and $1,200,000 downpayment with $1,000,000 from CEC and $250,000 from AB970** Discount Rate = 4.5%*** Financing of $4,372,000 for 20 years at a 6% interest rate and $0.00 downpayment and $1,000,000 from the CEC and $250,000 from AB970
Net Present Value of PV System = Present Value of Benefits - Present Worth of Costs= $4,816,069.96- $3,704,980.06= $1,111,089.90
Cost of Generation =Total kWh Generated over Life of System
= $3,704,980.0632899160 kWh
= $0.113 /kWh
Benefit-Cost Ratio =
= $4,816,069.96$3,704,980.06
= 1.300
Payback = The period of time required for the profit or other benefits of the system toequal the cost of the initial investment.
= Year 17
Financial Analysis 1MW Amorphous Silicon PV Power Station - Best Case
Net Cash Flows
Present Value of Costs w/o Downpayment
Net Present Cost of PV System
Net Present Cost of the PV System
Present Value of Benefits
Net Present Cost of PV System
Financial Analysis 1MW Amorphous Silicon PV Power Station - Best Case
Financial Analysis 1MW Amorphous Silicon PV Power Station - Best Case
Net Present Benefit of the PV System

Yr kWh Ave. Cost Value of Clean Air Tax Credit Production Total Value Present Value Present Value Present Value Net Cash Net Cash PaybackGenerated $/kWh Energy Credits $/kWhr Tax Credits of Energy Factor* of Benefits of Costs w/o DP Flow w/o DP Flow w/ DP (Cost=$2.712M)
0 0 0 1.0000 $0.00 $0.00 $0.00 $750,000 $0.001 1093952 0.16 $175,032.32 $3,076.74 $0.0198 $12,798.52 $190,907.58 0.9569 $182,679.46 $231,527.85 -$48,848 $3,302.66 $182,679.462 1093952 0.1648 $180,283.29 $3,076.74 $0.0204 $22,480.71 $205,840.74 0.9157 $188,488.37 $221,559.26 -$33,071 $16,834.76 $371,167.833 1093952 0.169744 $185,691.79 $3,076.74 $0.0210 $23,137.08 $211,905.61 0.8763 $185,692.89 $212,026.18 -$26,333 $21,425.06 $556,860.724 1093952 0.17483632 $191,262.54 $3,076.74 $0.0216 $23,793.46 $218,132.74 0.8386 $182,926.11 $202,904.44 -$19,978 $25,725.38 $739,786.835 1093952 0.18008141 $197,000.42 $3,076.74 $0.0222 $24,449.83 $224,526.99 0.8025 $180,182.91 $194,169.82 -$13,987 $29,749.34 $919,969.746 1093952 0.185483852 $202,910.43 $3,076.74 $0.0228 $25,106.20 $231,093.37 0.7679 $177,456.60 $185,798.14 -$8,342 $33,509.01 $1,097,426.347 1093952 0.191048367 $208,997.74 $3,076.74 $0.0234 $25,762.57 $237,837.05 0.7348 $174,762.67 $177,789.39 -$3,027 $37,019.88 $1,272,189.008 1093952 0.196779818 $215,267.68 $3,076.74 $0.0240 $26,418.94 $244,763.36 0.7032 $172,117.59 $170,143.57 $1,974 $40,298.42 $1,444,306.599 1093952 0.202683213 $221,725.71 $3,076.74 $0.0246 $27,075.31 $251,877.76 0.6729 $169,488.54 $162,812.30 $6,676 $43,349.29 $1,613,795.1410 1093952 0.208763709 $228,377.48 $3,076.74 $0.0252 $27,731.68 $259,185.90 0.6439 $166,889.80 $155,795.57 $11,094 $46,186.78 $1,780,684.9411 1093952 0.215026621 $235,228.80 $3,076.74 $0.0258 $28,388.05 $266,693.60 0.6162 $164,336.59 $149,093.39 $15,243 $48,826.11 $1,945,021.5312 1093952 0.221477419 $242,285.67 $3,076.74 $0.0264 $29,044.43 $274,406.83 0.5897 $161,817.71 $142,681.55 $19,136 $51,274.81 $2,106,839.2413 1093952 0.228121742 $249,554.24 $3,076.74 $0.0270 $22,152.53 $274,783.50 0.5643 $155,060.33 $136,535.86 $18,524 $49,278.82 $2,261,899.5714 1093952 0.234965394 $257,040.86 $3,076.74 $0.00 $0.00 $260,117.60 0.54 $140,463.51 $130,656.33 $9,807 $39,237.18 $2,402,363.0815 1093952 0.242014356 $264,752.09 $3,076.74 $0.00 $0.00 $267,828.83 0.5167 $138,387.16 $125,018.75 $13,368 $41,528.56 $2,540,750.2316 1093952 0.249274787 $272,694.65 $3,076.74 $0.00 $0.00 $275,771.39 0.4945 $136,368.95 $119,647.32 $16,722 $43,671.88 $2,677,119.1917 1093952 0.25675303 $280,875.49 $3,076.74 $0.00 $0.00 $283,952.23 0.4732 $134,366.20 $114,493.65 $19,873 $45,661.94 $2,811,485.3818 1093952 0.264455621 $289,301.76 $3,076.74 $0.00 $0.00 $292,378.50 0.4528 $132,388.98 $109,557.75 $22,831 $47,508.83 $2,943,874.3719 1093952 0.27238929 $297,980.81 $3,076.74 $0.00 $0.00 $301,057.55 0.4333 $130,448.24 $104,839.60 $25,609 $49,223.48 $3,074,322.6020 1093952 0.280560968 $306,920.23 $3,076.74 $0.00 $0.00 $309,996.97 0.4146 $128,524.74 $100,315.02 $28,210 $50,805.42 $3,202,847.3521 1093952 0.288977798 $316,127.84 $3,076.74 $0.00 $0.00 $319,204.58 0.3968 $126,660.38 $2,170.40 $124,490 $124,489.98 $3,329,507.7222 1093952 0.297647131 $325,611.67 $3,076.74 $0.00 $0.00 $328,688.41 0.3797 $124,802.99 $2,076.87 $122,726 $122,726.12 $3,454,310.7123 1093952 0.306576545 $335,380.03 $3,076.74 $0.00 $0.00 $338,456.77 0.3634 $122,995.19 $1,987.71 $121,007 $121,007.48 $3,577,305.9024 1093952 0.315773842 $345,441.43 $3,076.74 $0.00 $0.00 $348,518.17 0.3477 $121,179.77 $1,901.84 $119,278 $119,277.93 $3,698,485.6725 1093952 0.325247057 $355,804.67 $3,076.74 $0.00 $0.00 $358,881.41 0.3327 $119,399.84 $1,819.79 $117,580 $117,580.06 $3,817,885.5126 1093952 0.335004469 $366,478.81 $3,076.74 $0.00 $0.00 $369,555.55 0.3184 $117,666.49 $1,741.57 $115,925 $115,924.92 $3,935,552.0027 1093952 0.345054603 $377,473.17 $3,076.74 $0.00 $0.00 $380,549.91 0.3047 $115,953.56 $1,666.64 $114,287 $114,286.92 $4,051,505.5628 1093952 0.355406241 $388,797.37 $3,076.74 $0.00 $0.00 $391,874.11 0.2916 $114,270.49 $1,594.98 $112,676 $112,675.51 $4,165,776.0529 1093952 0.366068428 $400,461.29 $3,076.74 $0.00 $0.00 $403,538.03 0.279 $112,587.11 $1,526.06 $111,061 $111,061.05 $4,278,363.1630 1093952 0.377050481 $412,475.13 $3,076.74 $0.00 $0.00 $415,551.87 0.267 $110,952.35 $1,460.43 $109,492 $109,491.92 $4,389,315.51
32818560 $8,327,235.39 $92,302.20 $318,339.31 $8,737,877 $4,389,316* Discount Rate= 4.5%
Yr Annual PV Annual O&M Total Annual Present Value Present Value Annual PV Annual O&M Total Annual Present Value Present ValueSys. Payment* Costs Costs Factor** of Costs Sys. Payment*** Costs Costs Factor** of Costs
0 $625,000.00 $0.00 $625,000.00 1.0000 $625,000.00 $0.00 $0.00 $0.00 1.0000 $0.00001 $181,986.40 $5,469.76 $187,456.16 0.9569 $179,376.80 $236,486.40 $5,469.76 $241,956.16 0.9569 $231,527.84952 $181,986.40 $5,469.76 $187,456.16 0.9157 $171,653.61 $236,486.40 $5,469.76 $241,956.16 0.9157 $221,559.25573 $181,986.40 $5,469.76 $187,456.16 0.8763 $164,267.83 $236,486.40 $5,469.76 $241,956.16 0.8763 $212,026.18304 $181,986.40 $5,469.76 $187,456.16 0.8386 $157,200.74 $236,486.40 $5,469.76 $241,956.16 0.8386 $202,904.43585 $181,986.40 $5,469.76 $187,456.16 0.8025 $150,433.57 $236,486.40 $5,469.76 $241,956.16 0.8025 $194,169.81846 $181,986.40 $5,469.76 $187,456.16 0.7679 $143,947.59 $236,486.40 $5,469.76 $241,956.16 0.7679 $185,798.13537 $181,986.40 $5,469.76 $187,456.16 0.7348 $137,742.79 $236,486.40 $5,469.76 $241,956.16 0.7348 $177,789.38648 $181,986.40 $5,469.76 $187,456.16 0.7032 $131,819.17 $236,486.40 $5,469.76 $241,956.16 0.7032 $170,143.57179 $181,986.40 $5,469.76 $187,456.16 0.6729 $126,139.25 $236,486.40 $5,469.76 $241,956.16 0.6729 $162,812.300110 $181,986.40 $5,469.76 $187,456.16 0.6439 $120,703.02 $236,486.40 $5,469.76 $241,956.16 0.6439 $155,795.571411 $181,986.40 $5,469.76 $187,456.16 0.6162 $115,510.49 $236,486.40 $5,469.76 $241,956.16 0.6162 $149,093.385812 $181,986.40 $5,469.76 $187,456.16 0.5897 $110,542.90 $236,486.40 $5,469.76 $241,956.16 0.5897 $142,681.547613 $181,986.40 $5,469.76 $187,456.16 0.5643 $105,781.51 $236,486.40 $5,469.76 $241,956.16 0.5643 $136,535.861114 $181,986.40 $5,469.76 $187,456.16 0.54 $101,226.33 $236,486.40 $5,469.76 $241,956.16 0.54 $130,656.326415 $181,986.40 $5,469.76 $187,456.16 0.5167 $96,858.60 $236,486.40 $5,469.76 $241,956.16 0.5167 $125,018.747916 $181,986.40 $5,469.76 $187,456.16 0.4945 $92,697.07 $236,486.40 $5,469.76 $241,956.16 0.4945 $119,647.321117 $181,986.40 $5,469.76 $187,456.16 0.4732 $88,704.25 $236,486.40 $5,469.76 $241,956.16 0.4732 $114,493.654918 $181,986.40 $5,469.76 $187,456.16 0.4528 $84,880.15 $236,486.40 $5,469.76 $241,956.16 0.4528 $109,557.749219 $181,986.40 $5,469.76 $187,456.16 0.4333 $81,224.75 $236,486.40 $5,469.76 $241,956.16 0.4333 $104,839.604120 $181,986.40 $5,469.76 $187,456.16 0.4146 $77,719.32 $236,486.40 $5,469.76 $241,956.16 0.4146 $100,315.023921 $0.00 $5,469.76 $5,469.76 0.3968 $2,170.40 $0.00 $5,469.76 $5,469.76 0.3968 $2,170.400822 $0.00 $5,469.76 $5,469.76 0.3797 $2,076.87 $0.00 $5,469.76 $5,469.76 0.3797 $2,076.867923 $0.00 $5,469.76 $5,469.76 0.3634 $1,987.71 $0.00 $5,469.76 $5,469.76 0.3634 $1,987.710824 $0.00 $5,469.76 $5,469.76 0.3477 $1,901.84 $0.00 $5,469.76 $5,469.76 0.3477 $1,901.835625 $0.00 $5,469.76 $5,469.76 0.3327 $1,819.79 $0.00 $5,469.76 $5,469.76 0.3327 $1,819.789226 $0.00 $5,469.76 $5,469.76 0.3184 $1,741.57 $0.00 $5,469.76 $5,469.76 0.3184 $1,741.571627 $0.00 $5,469.76 $5,469.76 0.3047 $1,666.64 $0.00 $5,469.76 $5,469.76 0.3047 $1,666.635928 $0.00 $5,469.76 $5,469.76 0.2916 $1,594.98 $0.00 $5,469.76 $5,469.76 0.2916 $1,594.982029 $0.00 $5,469.76 $5,469.76 0.279 $1,526.06 $0.00 $5,469.76 $5,469.76 0.279 $1,526.063030 $0.00 $5,469.76 $5,469.76 0.267 $1,460.43 $0.00 $5,469.76 $5,469.76 0.267 $1,460.4259
$4,264,728 $164,092.80 $4,428,820.80 $3,081,376.01 $4,729,728.00 $164,093 $4,893,820.80 $3,165,312.01* Financing of $2,087,000 for 20 years at a 6% interest rate and $625,000 downpayment with $1,000,000 from CEC and $125,000 from AB970** Discount Rate = 4.5%*** Financing of $2,712,000 for 20 years at a 6% interest rate and $0.0 downpayment with $1,000,000 from the CEC and $125,000 from AB970
Net Present Value of PV System = Present Value of Benefits - Present Worth of Costs= $4,389,315.51- $3,081,376.01= $1,307,939.50
Cost of =Generation Total kWh Generated over Life of System
= $3,081,376.0132818560 kWh
= $0.094 /kWh
Benefit-Cost = Ratio
= $4,389,315.51$3,081,376.01
= 1.424
Payback = The period of time required for the profit or other benefits of the system toequal the cost of the initial investment.
= Year 16
Present Value of Costs with a Downpayment Present Value of Costs w/o Downpayment
Net Present Benefit of the PV SystemNet Present Cost of the PV System
Financial Analysis 500 kW Crystalline Silicon (Tracking) PV Power Station - Best Case
Financial Analysis 500 kW Crystalline Silicon (Tracking) PV Power Station - Best Case
Net Present Cost of PV System
Financial Analysis 500 kW Crystalline Silicon (Tracking) PV Power Station - Best Case
Present Value of Benefits Net Cash Flows

Year kWh Ave. Cost Value of Clean Air Tax Credit Production Total Value Present Value Present Value Net Cash Net Cash PaybackGenerated $/kWh Energy Credits $/kWhr Tax Credits of Energy Factor* of Benefits Flow w/o DP Flow w/ DP (Cost=$2.547M)
0 0.00 $0.00 $0.00 $0.00 $0.00 $0.00 1.0000 $0.00 $0.0000 -$675,000 $0.001 929632 0.16 $148,741.12 $2,614.59 $0.0198 $10,870.56 $162,226.27 0.9569 $155,234.32 -$61,739.4666 -$5,416.33 $155,234.322 929632 0.1648 $153,203.35 $2,614.59 $0.0204 $19,103.94 $174,921.88 0.9157 $160,175.97 -$47,455.8584 $6,442.24 $315,410.283 929632 0.169744 $157,799.45 $2,614.59 $0.0210 $19,661.72 $180,075.76 0.8763 $157,800.39 -$40,897.6212 $10,681.40 $473,210.674 929632 0.17483632 $162,533.44 $2,614.59 $0.0216 $20,219.50 $185,367.52 0.8386 $155,449.21 -$34,700.4597 $14,659.54 $628,659.885 929632 0.18008141 $167,409.44 $2,614.59 $0.0222 $20,777.28 $190,801.31 0.8025 $153,118.05 -$28,846.0662 $18,389.08 $781,777.936 929632 0.185483852 $172,431.72 $2,614.59 $0.0228 $21,335.05 $196,381.37 0.7679 $150,801.25 -$23,317.4305 $21,881.16 $932,579.187 929632 0.191048367 $177,604.68 $2,614.59 $0.0234 $21,892.83 $202,112.10 0.7348 $148,511.97 -$18,101.4016 $25,148.93 $1,081,091.158 929632 0.196779818 $182,932.82 $2,614.59 $0.0240 $22,450.61 $207,998.02 0.7032 $146,264.21 -$13,183.9740 $28,206.38 $1,227,355.369 929632 0.202683213 $188,420.80 $2,614.59 $0.0246 $23,008.39 $214,043.78 0.6729 $144,030.06 -$8,547.6989 $31,059.20 $1,371,385.42
10 929632 0.208763709 $194,073.42 $2,614.59 $0.0252 $23,566.17 $220,254.19 0.6439 $141,821.67 -$4,180.4397 $33,719.51 $1,513,207.0911 929632 0.215026621 $199,895.63 $2,614.59 $0.0258 $24,123.95 $226,634.17 0.6162 $139,651.97 -$69.2560 $36,200.28 $1,652,859.0612 929632 0.221477419 $205,892.50 $2,614.59 $0.0264 $24,681.73 $233,188.82 0.5897 $137,511.44 $3,798.9983 $38,508.74 $1,790,370.5113 929632 0.228121742 $212,069.27 $2,614.59 $0.0270 $18,825.05 $233,508.91 0.5643 $131,769.08 $3,815.9936 $37,030.69 $1,922,139.5914 929632 0.234965394 $218,431.35 $2,614.59 $0.00 $0.00 $221,045.94 0.54 $119,364.81 -$3,078.3352 $28,706.06 $2,041,504.3915 929632 0.242014356 $224,984.29 $2,614.59 $0.00 $0.00 $227,598.88 0.5167 $117,600.34 $440.3936 $30,853.36 $2,159,104.7316 929632 0.249274787 $231,733.82 $2,614.59 $0.00 $0.00 $234,348.41 0.4945 $115,885.29 $3,759.1141 $32,865.38 $2,274,990.0217 929632 0.25675303 $238,685.83 $2,614.59 $0.00 $0.00 $241,300.42 0.4732 $114,183.36 $6,886.8880 $34,739.44 $2,389,173.3818 929632 0.264455621 $245,846.41 $2,614.59 $0.00 $0.00 $248,461.00 0.4528 $112,503.14 $9,832.2975 $36,484.11 $2,501,676.5219 929632 0.27238929 $253,221.80 $2,614.59 $0.00 $0.00 $255,836.39 0.4333 $110,853.91 $12,604.6234 $38,108.66 $2,612,530.4320 929632 0.280560968 $260,818.45 $2,614.59 $0.00 $0.00 $263,433.04 0.4146 $109,219.34 $15,210.2164 $39,613.57 $2,721,749.7721 929632 0.288977798 $268,643.01 $2,614.59 $0.00 $0.00 $271,257.60 0.3968 $107,635.01 $105,790.6250 $105,790.62 $2,829,384.7822 929632 0.297647131 $276,702.30 $2,614.59 $0.00 $0.00 $279,316.89 0.3797 $106,056.62 $104,291.7161 $104,291.72 $2,935,441.4123 929632 0.306576545 $285,003.37 $2,614.59 $0.00 $0.00 $287,617.96 0.3634 $104,520.37 $102,831.2243 $102,831.22 $3,039,961.7724 929632 0.315773842 $293,553.47 $2,614.59 $0.00 $0.00 $296,168.06 0.3477 $102,977.63 $101,361.4686 $101,361.47 $3,142,939.4125 929632 0.325247057 $302,360.07 $2,614.59 $0.00 $0.00 $304,974.66 0.3327 $101,465.07 $99,918.6273 $99,918.63 $3,244,404.4826 929632 0.335004469 $311,430.87 $2,614.59 $0.00 $0.00 $314,045.46 0.3184 $99,992.08 $98,512.1017 $98,512.10 $3,344,396.5527 929632 0.345054603 $320,773.80 $2,614.59 $0.00 $0.00 $323,388.39 0.3047 $98,536.44 $97,120.1482 $97,120.15 $3,442,932.9928 929632 0.355406241 $330,397.01 $2,614.59 $0.00 $0.00 $333,011.60 0.2916 $97,106.18 $95,750.7804 $95,750.78 $3,540,039.1829 929632 0.366068428 $340,308.92 $2,614.59 $0.00 $0.00 $342,923.51 0.279 $95,675.66 $94,378.8240 $94,378.82 $3,635,714.8430 929632 0.377050481 $350,518.19 $2,614.59 $0.00 $0.00 $353,132.78 0.267 $94,286.45 $93,045.3943 $93,045.39 $3,730,001.29
Totals 27888960 $7,076,420.62 $78,437.70 $7,425,375.09 $3,730,001.29* Discount Rate= 4.5%
Net Present Cost of PV SystemYear Annual PV Annual O&M Total Annual Present Value Present Value Annual PV Annual O&M Total Annual Present Value Present Value
Sys. Payment* Costs Costs Factor** of Costs Sys. Payment*** Costs Costs Factor** of Costs0 $675,000.00 $0.00 $675,000.00 1.0000 $675,000.00 $0.00 $0.00 $0.00 1.0000 $0.00001 $163,238.40 $4,648.16 $167,886.56 0.9569 $160,650.65 $222,098.40 $4,648.16 $226,746.56 0.9569 $216,973.78332 $163,238.40 $4,648.16 $167,886.56 0.9157 $153,733.72 $222,098.40 $4,648.16 $226,746.56 0.9157 $207,631.82503 $163,238.40 $4,648.16 $167,886.56 0.8763 $147,118.99 $222,098.40 $4,648.16 $226,746.56 0.8763 $198,698.01054 $163,238.40 $4,648.16 $167,886.56 0.8386 $140,789.67 $222,098.40 $4,648.16 $226,746.56 0.8386 $190,149.66525 $163,238.40 $4,648.16 $167,886.56 0.8025 $134,728.96 $222,098.40 $4,648.16 $226,746.56 0.8025 $181,964.11446 $163,238.40 $4,648.16 $167,886.56 0.7679 $128,920.09 $222,098.40 $4,648.16 $226,746.56 0.7679 $174,118.68347 $163,238.40 $4,648.16 $167,886.56 0.7348 $123,363.04 $222,098.40 $4,648.16 $226,746.56 0.7348 $166,613.37238 $163,238.40 $4,648.16 $167,886.56 0.7032 $118,057.83 $222,098.40 $4,648.16 $226,746.56 0.7032 $159,448.18109 $163,238.40 $4,648.16 $167,886.56 0.6729 $112,970.87 $222,098.40 $4,648.16 $226,746.56 0.6729 $152,577.7602
10 $163,238.40 $4,648.16 $167,886.56 0.6439 $108,102.16 $222,098.40 $4,648.16 $226,746.56 0.6439 $146,002.110011 $163,238.40 $4,648.16 $167,886.56 0.6162 $103,451.70 $222,098.40 $4,648.16 $226,746.56 0.6162 $139,721.230312 $163,238.40 $4,648.16 $167,886.56 0.5897 $99,002.70 $222,098.40 $4,648.16 $226,746.56 0.5897 $133,712.446413 $163,238.40 $4,648.16 $167,886.56 0.5643 $94,738.39 $222,098.40 $4,648.16 $226,746.56 0.5643 $127,953.083814 $163,238.40 $4,648.16 $167,886.56 0.54 $90,658.74 $222,098.40 $4,648.16 $226,746.56 0.54 $122,443.142415 $163,238.40 $4,648.16 $167,886.56 0.5167 $86,746.99 $222,098.40 $4,648.16 $226,746.56 0.5167 $117,159.947616 $163,238.40 $4,648.16 $167,886.56 0.4945 $83,019.90 $222,098.40 $4,648.16 $226,746.56 0.4945 $112,126.173917 $163,238.40 $4,648.16 $167,886.56 0.4732 $79,443.92 $222,098.40 $4,648.16 $226,746.56 0.4732 $107,296.472218 $163,238.40 $4,648.16 $167,886.56 0.4528 $76,019.03 $222,098.40 $4,648.16 $226,746.56 0.4528 $102,670.842419 $163,238.40 $4,648.16 $167,886.56 0.4333 $72,745.25 $222,098.40 $4,648.16 $226,746.56 0.4333 $98,249.284420 $163,238.40 $4,648.16 $167,886.56 0.4146 $69,605.77 $222,098.40 $4,648.16 $226,746.56 0.4146 $94,009.123821 $0.00 $4,648.16 $4,648.16 0.3968 $1,844.39 $0.00 $4,648.16 $4,648.16 0.3968 $1,844.389922 $0.00 $4,648.16 $4,648.16 0.3797 $1,764.91 $0.00 $4,648.16 $4,648.16 0.3797 $1,764.906423 $0.00 $4,648.16 $4,648.16 0.3634 $1,689.14 $0.00 $4,648.16 $4,648.16 0.3634 $1,689.141324 $0.00 $4,648.16 $4,648.16 0.3477 $1,616.17 $0.00 $4,648.16 $4,648.16 0.3477 $1,616.165225 $0.00 $4,648.16 $4,648.16 0.3327 $1,546.44 $0.00 $4,648.16 $4,648.16 0.3327 $1,546.442826 $0.00 $4,648.16 $4,648.16 0.3184 $1,479.97 $0.00 $4,648.16 $4,648.16 0.3184 $1,479.974127 $0.00 $4,648.16 $4,648.16 0.3047 $1,416.29 $0.00 $4,648.16 $4,648.16 0.3047 $1,416.294428 $0.00 $4,648.16 $4,648.16 0.2916 $1,355.40 $0.00 $4,648.16 $4,648.16 0.2916 $1,355.403529 $0.00 $4,648.16 $4,648.16 0.279 $1,296.84 $0.00 $4,648.16 $4,648.16 0.279 $1,296.836630 $0.00 $4,648.16 $4,648.16 0.267 $1,241.06 $0.00 $4,648.16 $4,648.16 0.267 $1,241.0587
Totals $3,939,768.00 $139,444.80 $4,079,212.80 $2,874,118.99 $4,441,968.00 $139,444.80 $4,581,412.80 $2,964,769.87* Financing of $1,872,000 for 20 years at a 6% interest rate and $675,000 downpayment with $1,000,000 from the CEC and $125,000 from AB970** Discount Rate = 4.5%*** Financing of $2,547,000 for 20 years at a 6% interest rate and $0.0 downpayment with $1,000,000 from the CEC and $125,000 from AB970
Net Present Value of PV System = Present Value of Benefits - Present Value of Costs= $3,730,001.29- $2,874,118.99= $855,882.31
Cost of= Generation Total kWh Generated over Life of System
= $2,874,118.9927888960 kWh
= $0.103 /kWh
Benefit-Cost =Ratio
= $3,730,001.29$2,874,118.99
= 1.298
Payback = The period of time required for the profit or other benefits of the system toequal the cost of the initial investment.
= Year 18
Net Present Cost of the PV System
Financial Analysis 500 kW Crystalline Silicon PV Power Station - Best Case(Fixed System)
Financial Analysis 500 kW Crystalline Silicon PV Power Station - Best Case(Fixed System)
Present Value of Costs w/o Downpayment
Net Present Cost of PV System
Net Present Benefit of the PV System
Present Value of Benefits Net Cash Flows
Financial Analysis 500 kW Crystalline Silicon PV Power Station - Best Case(Fixed System)

Year kWh Ave. Cost Value of Clean Air Tax Credit Production Total Value Present Value Present Value Net Cash Net Cash PaybackGenerated $/kWh Energy Credits $/kWhr Tax Credits of Energy Factor* of Benefits Flow w/o DP Flow w/ DP (Cost=$1.778M)
0 0 $0.00 $0.00 $0.00 $0.00 $0.00 1.0000 $0.00 $0.00 -$225,000 $0.001 810982 0.16 $129,757.12 $2,280.89 $0.0198 $9,487.95 $141,525.96 0.9569 $135,426.19 -$16,813.26 $1,961.12 $135,426.192 810982 0.1648 $133,649.83 $2,280.89 $0.0204 $16,665.68 $152,596.40 0.9157 $139,732.52 -$5,952.15 $12,013.88 $275,158.723 810982 0.169744 $137,659.33 $2,280.89 $0.0210 $17,152.27 $157,092.48 0.8763 $137,660.14 -$1,756.13 $15,436.88 $412,818.864 810982 0.17483632 $141,789.11 $2,280.89 $0.0216 $17,638.86 $161,708.85 0.8386 $135,609.04 $2,190.71 $18,644.04 $548,427.915 810982 0.18008141 $146,042.78 $2,280.89 $0.0222 $18,125.45 $166,449.12 0.8025 $133,575.42 $5,900.47 $21,645.52 $682,003.326 810982 0.185483852 $150,424.07 $2,280.89 $0.0228 $18,612.04 $171,316.99 0.7679 $131,554.32 $9,384.11 $24,450.30 $813,557.647 810982 0.191048367 $154,936.79 $2,280.89 $0.0234 $19,098.63 $176,316.30 0.7348 $129,557.22 $12,653.10 $27,069.88 $943,114.858 810982 0.196779818 $159,584.89 $2,280.89 $0.0240 $19,585.22 $181,450.99 0.7032 $127,596.34 $15,719.67 $29,516.46 $1,070,711.199 810982 0.202683213 $164,372.44 $2,280.89 $0.0246 $20,071.80 $186,725.13 0.6729 $125,647.34 $18,591.30 $31,793.60 $1,196,358.5310 810982 0.208763709 $169,303.61 $2,280.89 $0.0252 $20,558.39 $192,142.89 0.6439 $123,720.81 $21,278.56 $33,911.88 $1,320,079.3411 810982 0.215026621 $174,382.72 $2,280.89 $0.0258 $21,044.98 $197,708.59 0.6162 $121,828.03 $23,792.76 $35,882.61 $1,441,907.3712 810982 0.221477419 $179,614.20 $2,280.89 $0.0264 $21,531.57 $203,426.66 0.5897 $119,960.70 $26,141.49 $37,711.40 $1,561,868.0713 810982 0.228121742 $185,002.63 $2,280.89 $0.0270 $16,422.39 $203,705.90 0.5643 $114,951.24 $25,173.08 $36,244.64 $1,676,819.3114 810982 0.234965394 $190,552.71 $2,280.89 $0.00 $0.00 $192,833.59 0.54 $104,130.14 $18,218.02 $28,812.82 $1,780,949.4515 810982 0.242014356 $196,269.29 $2,280.89 $0.00 $0.00 $198,550.17 0.5167 $102,590.87 $20,385.71 $30,523.36 $1,883,540.3316 810982 0.249274787 $202,157.37 $2,280.89 $0.00 $0.00 $204,438.25 0.4945 $101,094.72 $22,421.49 $32,123.58 $1,984,635.0417 810982 0.25675303 $208,222.09 $2,280.89 $0.00 $0.00 $210,502.97 0.4732 $99,610.01 $24,325.54 $33,609.72 $2,084,245.0518 810982 0.264455621 $214,468.75 $2,280.89 $0.00 $0.00 $216,749.64 0.4528 $98,144.23 $26,105.34 $34,989.27 $2,182,389.2819 810982 0.27238929 $220,902.81 $2,280.89 $0.00 $0.00 $223,183.70 0.4333 $96,705.50 $27,768.98 $36,270.32 $2,279,094.7820 810982 0.280560968 $227,529.90 $2,280.89 $0.00 $0.00 $229,810.78 0.4146 $95,279.55 $29,318.14 $37,452.59 $2,374,374.33
Totals 16219640 $3,486,622.41 $45,617.74 $3,768,235.37 $2,374,374.33* Discount Rate = 4.5%
Year Annual PV Annual O&M Total Annual Present Value Present Value Annual PV Annual O&M Total Annual Present Value Present ValueSys. Payment* Costs Costs Factor** of Costs Sys. Payment*** Costs Costs Factor** of Costs
0 $225,000.00 $0.00 $225,000.00 1.0000 $225,000.00 $0.00 $0.00 $0.00 1.0000 $0.001 $135,421.60 $4,054.91 $139,476.51 0.9569 $133,465.07 $155,041.60 $4,054.91 $159,096.51 0.9569 $152,239.452 $135,421.60 $4,054.91 $139,476.51 0.9157 $127,718.64 $155,041.60 $4,054.91 $159,096.51 0.9157 $145,684.673 $135,421.60 $4,054.91 $139,476.51 0.8763 $122,223.27 $155,041.60 $4,054.91 $159,096.51 0.8763 $139,416.274 $135,421.60 $4,054.91 $139,476.51 0.8386 $116,965.00 $155,041.60 $4,054.91 $159,096.51 0.8386 $133,418.335 $135,421.60 $4,054.91 $139,476.51 0.8025 $111,929.90 $155,041.60 $4,054.91 $159,096.51 0.8025 $127,674.956 $135,421.60 $4,054.91 $139,476.51 0.7679 $107,104.01 $155,041.60 $4,054.91 $159,096.51 0.7679 $122,170.217 $135,421.60 $4,054.91 $139,476.51 0.7348 $102,487.34 $155,041.60 $4,054.91 $159,096.51 0.7348 $116,904.128 $135,421.60 $4,054.91 $139,476.51 0.7032 $98,079.88 $155,041.60 $4,054.91 $159,096.51 0.7032 $111,876.679 $135,421.60 $4,054.91 $139,476.51 0.6729 $93,853.74 $155,041.60 $4,054.91 $159,096.51 0.6729 $107,056.0410 $135,421.60 $4,054.91 $139,476.51 0.6439 $89,808.92 $155,041.60 $4,054.91 $159,096.51 0.6439 $102,442.2411 $135,421.60 $4,054.91 $139,476.51 0.6162 $85,945.43 $155,041.60 $4,054.91 $159,096.51 0.6162 $98,035.2712 $135,421.60 $4,054.91 $139,476.51 0.5897 $82,249.30 $155,041.60 $4,054.91 $159,096.51 0.5897 $93,819.2113 $135,421.60 $4,054.91 $139,476.51 0.5643 $78,706.59 $155,041.60 $4,054.91 $159,096.51 0.5643 $89,778.1614 $135,421.60 $4,054.91 $139,476.51 0.54 $75,317.32 $155,041.60 $4,054.91 $159,096.51 0.54 $85,912.1215 $135,421.60 $4,054.91 $139,476.51 0.5167 $72,067.51 $155,041.60 $4,054.91 $159,096.51 0.5167 $82,205.1716 $135,421.60 $4,054.91 $139,476.51 0.4945 $68,971.13 $155,041.60 $4,054.91 $159,096.51 0.4945 $78,673.2217 $135,421.60 $4,054.91 $139,476.51 0.4732 $66,000.28 $155,041.60 $4,054.91 $159,096.51 0.4732 $75,284.4718 $135,421.60 $4,054.91 $139,476.51 0.4528 $63,154.96 $155,041.60 $4,054.91 $159,096.51 0.4528 $72,038.9019 $135,421.60 $4,054.91 $139,476.51 0.4333 $60,435.17 $155,041.60 $4,054.91 $159,096.51 0.4333 $68,936.5220 $135,421.60 $4,054.91 $139,476.51 0.4146 $57,826.96 $155,041.60 $4,054.91 $159,096.51 0.4146 $65,961.41
Totals $2,708,432.00 $81,098.20 $2,789,530.20 $1,814,310.44 $3,100,832.00 $81,098.20 $3,181,930.20 $2,069,527.40* Financing of $1,553,000 for 20 years at a 6% interest rate and $225,000 downpayment with $1,000,000 from CEC and $125,000 from AB970** Discount Rate = 4.5%*** Financing of $1,778,000 for 20 years at a 6% interest rate and $0.00 downpayment and $1,000,000 from the CEC and $125,000 from AB970
Net Present Value of PV System = Present Value of Benefits - Present Worth of Costs= $2,374,374.33- $1,814,310.44= $560,063.89
Cost of Generation =Total kWh Generated over Life of System
= $1,814,310.4416219640 kWh
= $0.112 /kWh
Benefit-Cost Ratio =
= $2,374,374.33$1,814,310.44
= 1.309
Payback = The period of time required for the profit or other benefits of the system toequal the cost of the initial investment.
= Year 13
Net Present Cost of PV System
Net Present Benefit of the PV SystemNet Present Cost of the PV System
Net Present Cost of PV System Present Value of Costs w/o Downpayment
Financial Analysis 500 kW Amorphous Silicon PV Power Station - Best Case
Financial Analysis 500 kW Amorphous Silicon PV Power Station - Best Case
Present Value of Benefits Net Cash Flows
Financial Analysis 500 kW Amorphous Silicon PV Power Station - Best Case
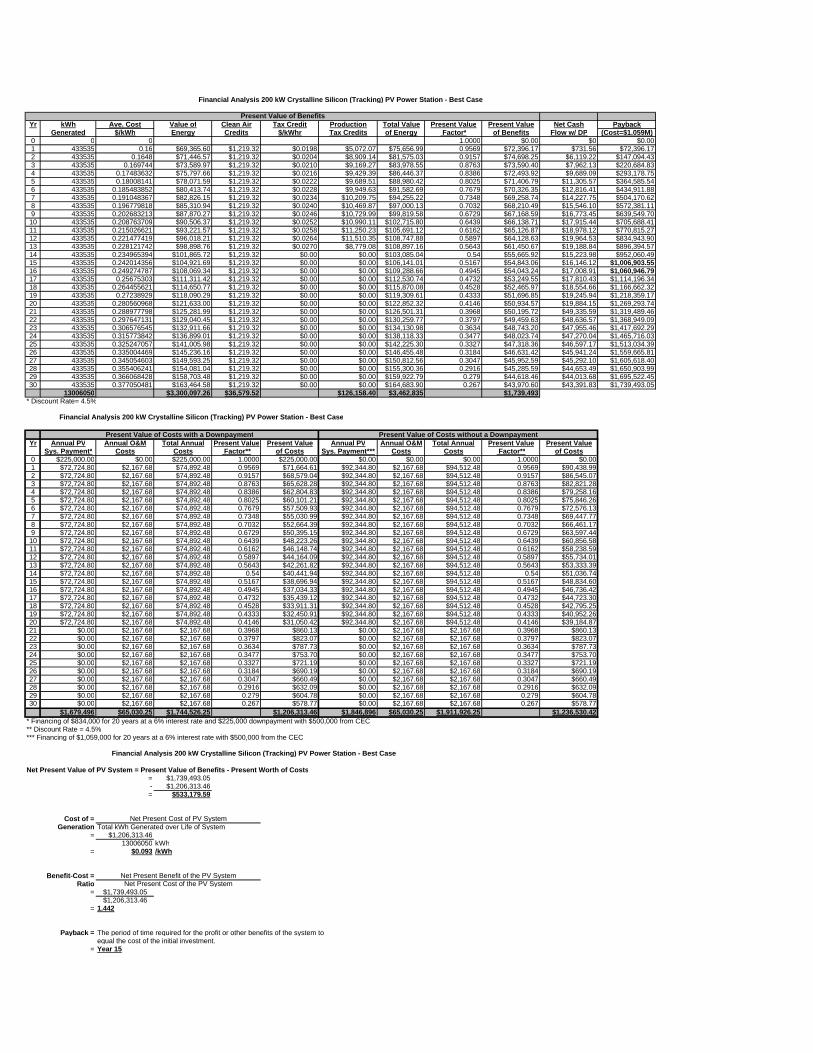
Yr kWh Ave. Cost Value of Clean Air Tax Credit Production Total Value Present Value Present Value Net Cash PaybackGenerated $/kWh Energy Credits $/kWhr Tax Credits of Energy Factor* of Benefits Flow w/ DP (Cost=$1.059M)
0 0 0 1.0000 $0.00 $0 $0.001 433535 0.16 $69,365.60 $1,219.32 $0.0198 $5,072.07 $75,656.99 0.9569 $72,396.17 $731.56 $72,396.172 433535 0.1648 $71,446.57 $1,219.32 $0.0204 $8,909.14 $81,575.03 0.9157 $74,698.25 $6,119.22 $147,094.433 433535 0.169744 $73,589.97 $1,219.32 $0.0210 $9,169.27 $83,978.55 0.8763 $73,590.40 $7,962.13 $220,684.834 433535 0.17483632 $75,797.66 $1,219.32 $0.0216 $9,429.39 $86,446.37 0.8386 $72,493.92 $9,689.09 $293,178.755 433535 0.18008141 $78,071.59 $1,219.32 $0.0222 $9,689.51 $88,980.42 0.8025 $71,406.79 $11,305.57 $364,585.546 433535 0.185483852 $80,413.74 $1,219.32 $0.0228 $9,949.63 $91,582.69 0.7679 $70,326.35 $12,816.41 $434,911.887 433535 0.191048367 $82,826.15 $1,219.32 $0.0234 $10,209.75 $94,255.22 0.7348 $69,258.74 $14,227.75 $504,170.628 433535 0.196779818 $85,310.94 $1,219.32 $0.0240 $10,469.87 $97,000.13 0.7032 $68,210.49 $15,546.10 $572,381.119 433535 0.202683213 $87,870.27 $1,219.32 $0.0246 $10,729.99 $99,819.58 0.6729 $67,168.59 $16,773.45 $639,549.7010 433535 0.208763709 $90,506.37 $1,219.32 $0.0252 $10,990.11 $102,715.80 0.6439 $66,138.71 $17,915.44 $705,688.4111 433535 0.215026621 $93,221.57 $1,219.32 $0.0258 $11,250.23 $105,691.12 0.6162 $65,126.87 $18,978.12 $770,815.2712 433535 0.221477419 $96,018.21 $1,219.32 $0.0264 $11,510.35 $108,747.88 0.5897 $64,128.63 $19,964.53 $834,943.9013 433535 0.228121742 $98,898.76 $1,219.32 $0.0270 $8,779.08 $108,897.16 0.5643 $61,450.67 $19,188.84 $896,394.5714 433535 0.234965394 $101,865.72 $1,219.32 $0.00 $0.00 $103,085.04 0.54 $55,665.92 $15,223.98 $952,060.4915 433535 0.242014356 $104,921.69 $1,219.32 $0.00 $0.00 $106,141.01 0.5167 $54,843.06 $16,146.12 $1,006,903.5516 433535 0.249274787 $108,069.34 $1,219.32 $0.00 $0.00 $109,288.66 0.4945 $54,043.24 $17,008.91 $1,060,946.7917 433535 0.25675303 $111,311.42 $1,219.32 $0.00 $0.00 $112,530.74 0.4732 $53,249.55 $17,810.43 $1,114,196.3418 433535 0.264455621 $114,650.77 $1,219.32 $0.00 $0.00 $115,870.08 0.4528 $52,465.97 $18,554.66 $1,166,662.3219 433535 0.27238929 $118,090.29 $1,219.32 $0.00 $0.00 $119,309.61 0.4333 $51,696.85 $19,245.94 $1,218,359.1720 433535 0.280560968 $121,633.00 $1,219.32 $0.00 $0.00 $122,852.32 0.4146 $50,934.57 $19,884.15 $1,269,293.7421 433535 0.288977798 $125,281.99 $1,219.32 $0.00 $0.00 $126,501.31 0.3968 $50,195.72 $49,335.59 $1,319,489.4622 433535 0.297647131 $129,040.45 $1,219.32 $0.00 $0.00 $130,259.77 0.3797 $49,459.63 $48,636.57 $1,368,949.0923 433535 0.306576545 $132,911.66 $1,219.32 $0.00 $0.00 $134,130.98 0.3634 $48,743.20 $47,955.46 $1,417,692.2924 433535 0.315773842 $136,899.01 $1,219.32 $0.00 $0.00 $138,118.33 0.3477 $48,023.74 $47,270.04 $1,465,716.0325 433535 0.325247057 $141,005.98 $1,219.32 $0.00 $0.00 $142,225.30 0.3327 $47,318.36 $46,597.17 $1,513,034.3926 433535 0.335004469 $145,236.16 $1,219.32 $0.00 $0.00 $146,455.48 0.3184 $46,631.42 $45,941.24 $1,559,665.8127 433535 0.345054603 $149,593.25 $1,219.32 $0.00 $0.00 $150,812.56 0.3047 $45,952.59 $45,292.10 $1,605,618.4028 433535 0.355406241 $154,081.04 $1,219.32 $0.00 $0.00 $155,300.36 0.2916 $45,285.59 $44,653.49 $1,650,903.9929 433535 0.366068428 $158,703.48 $1,219.32 $0.00 $0.00 $159,922.79 0.279 $44,618.46 $44,013.68 $1,695,522.4530 433535 0.377050481 $163,464.58 $1,219.32 $0.00 $0.00 $164,683.90 0.267 $43,970.60 $43,391.83 $1,739,493.05
13006050 $3,300,097.26 $36,579.52 $126,158.40 $3,462,835 $1,739,493* Discount Rate= 4.5%
Yr Annual PV Annual O&M Total Annual Present Value Present Value Annual PV Annual O&M Total Annual Present Value Present ValueSys. Payment* Costs Costs Factor** of Costs Sys. Payment*** Costs Costs Factor** of Costs
0 $225,000.00 $0.00 $225,000.00 1.0000 $225,000.00 $0.00 $0.00 $0.00 1.0000 $0.001 $72,724.80 $2,167.68 $74,892.48 0.9569 $71,664.61 $92,344.80 $2,167.68 $94,512.48 0.9569 $90,438.992 $72,724.80 $2,167.68 $74,892.48 0.9157 $68,579.04 $92,344.80 $2,167.68 $94,512.48 0.9157 $86,545.073 $72,724.80 $2,167.68 $74,892.48 0.8763 $65,628.28 $92,344.80 $2,167.68 $94,512.48 0.8763 $82,821.284 $72,724.80 $2,167.68 $74,892.48 0.8386 $62,804.83 $92,344.80 $2,167.68 $94,512.48 0.8386 $79,258.165 $72,724.80 $2,167.68 $74,892.48 0.8025 $60,101.21 $92,344.80 $2,167.68 $94,512.48 0.8025 $75,846.266 $72,724.80 $2,167.68 $74,892.48 0.7679 $57,509.93 $92,344.80 $2,167.68 $94,512.48 0.7679 $72,576.137 $72,724.80 $2,167.68 $74,892.48 0.7348 $55,030.99 $92,344.80 $2,167.68 $94,512.48 0.7348 $69,447.778 $72,724.80 $2,167.68 $74,892.48 0.7032 $52,664.39 $92,344.80 $2,167.68 $94,512.48 0.7032 $66,461.179 $72,724.80 $2,167.68 $74,892.48 0.6729 $50,395.15 $92,344.80 $2,167.68 $94,512.48 0.6729 $63,597.4410 $72,724.80 $2,167.68 $74,892.48 0.6439 $48,223.26 $92,344.80 $2,167.68 $94,512.48 0.6439 $60,856.5811 $72,724.80 $2,167.68 $74,892.48 0.6162 $46,148.74 $92,344.80 $2,167.68 $94,512.48 0.6162 $58,238.5912 $72,724.80 $2,167.68 $74,892.48 0.5897 $44,164.09 $92,344.80 $2,167.68 $94,512.48 0.5897 $55,734.0113 $72,724.80 $2,167.68 $74,892.48 0.5643 $42,261.82 $92,344.80 $2,167.68 $94,512.48 0.5643 $53,333.3914 $72,724.80 $2,167.68 $74,892.48 0.54 $40,441.94 $92,344.80 $2,167.68 $94,512.48 0.54 $51,036.7415 $72,724.80 $2,167.68 $74,892.48 0.5167 $38,696.94 $92,344.80 $2,167.68 $94,512.48 0.5167 $48,834.6016 $72,724.80 $2,167.68 $74,892.48 0.4945 $37,034.33 $92,344.80 $2,167.68 $94,512.48 0.4945 $46,736.4217 $72,724.80 $2,167.68 $74,892.48 0.4732 $35,439.12 $92,344.80 $2,167.68 $94,512.48 0.4732 $44,723.3018 $72,724.80 $2,167.68 $74,892.48 0.4528 $33,911.31 $92,344.80 $2,167.68 $94,512.48 0.4528 $42,795.2519 $72,724.80 $2,167.68 $74,892.48 0.4333 $32,450.91 $92,344.80 $2,167.68 $94,512.48 0.4333 $40,952.2620 $72,724.80 $2,167.68 $74,892.48 0.4146 $31,050.42 $92,344.80 $2,167.68 $94,512.48 0.4146 $39,184.8721 $0.00 $2,167.68 $2,167.68 0.3968 $860.13 $0.00 $2,167.68 $2,167.68 0.3968 $860.1322 $0.00 $2,167.68 $2,167.68 0.3797 $823.07 $0.00 $2,167.68 $2,167.68 0.3797 $823.0723 $0.00 $2,167.68 $2,167.68 0.3634 $787.73 $0.00 $2,167.68 $2,167.68 0.3634 $787.7324 $0.00 $2,167.68 $2,167.68 0.3477 $753.70 $0.00 $2,167.68 $2,167.68 0.3477 $753.7025 $0.00 $2,167.68 $2,167.68 0.3327 $721.19 $0.00 $2,167.68 $2,167.68 0.3327 $721.1926 $0.00 $2,167.68 $2,167.68 0.3184 $690.19 $0.00 $2,167.68 $2,167.68 0.3184 $690.1927 $0.00 $2,167.68 $2,167.68 0.3047 $660.49 $0.00 $2,167.68 $2,167.68 0.3047 $660.4928 $0.00 $2,167.68 $2,167.68 0.2916 $632.09 $0.00 $2,167.68 $2,167.68 0.2916 $632.0929 $0.00 $2,167.68 $2,167.68 0.279 $604.78 $0.00 $2,167.68 $2,167.68 0.279 $604.7830 $0.00 $2,167.68 $2,167.68 0.267 $578.77 $0.00 $2,167.68 $2,167.68 0.267 $578.77
$1,679,496 $65,030.25 $1,744,526.25 $1,206,313.46 $1,846,896 $65,030.25 $1,911,926.25 $1,236,530.42* Financing of $834,000 for 20 years at a 6% interest rate and $225,000 downpayment with $500,000 from CEC** Discount Rate = 4.5%*** Financing of $1,059,000 for 20 years at a 6% interest rate with $500,000 from the CEC
Net Present Value of PV System = Present Value of Benefits - Present Worth of Costs= $1,739,493.05- $1,206,313.46= $533,179.59
Cost of =Generation Total kWh Generated over Life of System
= $1,206,313.4613006050 kWh
= $0.093 /kWh
Benefit-Cost = Ratio
= $1,739,493.05$1,206,313.46
= 1.442
Payback = The period of time required for the profit or other benefits of the system toequal the cost of the initial investment.
= Year 15
Net Present Benefit of the PV SystemNet Present Cost of the PV System
Financial Analysis 200 kW Crystalline Silicon (Tracking) PV Power Station - Best Case
Financial Analysis 200 kW Crystalline Silicon (Tracking) PV Power Station - Best Case
Net Present Cost of PV System
Financial Analysis 200 kW Crystalline Silicon (Tracking) PV Power Station - Best Case
Present Value of Benefits
Present Value of Costs with a Downpayment Present Value of Costs without a Downpayment

Year kWh Ave. Cost Value of Clean Air Tax Credit Production Total Value Present Value Present Value Net Cash PaybackGenerated $/kWh Energy Credits $/kWhr Tax Credits of Energy Factor* of Benefits Flow w/ DP (Cost=$1.029M)
0 0.00 $0.00 $0.00 $0.00 $0.00 $0.00 1.0000 $0.00 -$325,000 $0.001 368664 0.16 $58,986.24 $1,036.87 $0.0198 $4,310.94 $64,334.04 0.9569 $61,561.25 $1,054.43 $61,561.252 368664 0.1648 $60,755.83 $1,036.87 $0.0204 $7,576.05 $69,368.74 0.9157 $63,520.96 $5,619.30 $125,082.203 368664 0.169744 $62,578.50 $1,036.87 $0.0210 $7,797.24 $71,412.61 0.8763 $62,578.87 $7,168.57 $187,661.074 368664 0.17483632 $64,455.86 $1,036.87 $0.0216 $8,018.44 $73,511.17 0.8386 $61,646.46 $8,620.01 $249,307.545 368664 0.18008141 $66,389.53 $1,036.87 $0.0222 $8,239.64 $75,666.04 0.8025 $60,722.00 $9,978.22 $310,029.546 368664 0.185483852 $68,381.22 $1,036.87 $0.0228 $8,460.84 $77,878.93 0.7679 $59,803.23 $11,247.28 $369,832.767 368664 0.191048367 $70,432.66 $1,036.87 $0.0234 $8,682.04 $80,151.56 0.7348 $58,895.37 $12,432.40 $428,728.138 368664 0.196779818 $72,545.63 $1,036.87 $0.0240 $8,903.24 $82,485.74 0.7032 $58,003.97 $13,539.14 $486,732.109 368664 0.202683213 $74,722.00 $1,036.87 $0.0246 $9,124.43 $84,883.31 0.6729 $57,117.98 $14,569.08 $543,850.08
10 368664 0.208763709 $76,963.66 $1,036.87 $0.0252 $9,345.63 $87,346.16 0.6439 $56,242.20 $15,527.03 $600,092.2711 368664 0.215026621 $79,272.57 $1,036.87 $0.0258 $9,566.83 $89,876.27 0.6162 $55,381.76 $16,418.13 $655,474.0312 368664 0.221477419 $81,650.75 $1,036.87 $0.0264 $9,788.03 $92,475.65 0.5897 $54,532.89 $17,244.91 $710,006.9213 368664 0.228121742 $84,100.27 $1,036.87 $0.0270 $7,465.45 $92,602.59 0.5643 $52,255.64 $16,573.75 $762,262.5614 368664 0.234965394 $86,623.28 $1,036.87 $0.00 $0.00 $87,660.15 0.54 $47,336.48 $13,191.14 $809,599.0415 368664 0.242014356 $89,221.98 $1,036.87 $0.00 $0.00 $90,258.85 0.5167 $46,636.75 $13,964.71 $856,235.7916 368664 0.249274787 $91,898.64 $1,036.87 $0.00 $0.00 $92,935.51 0.4945 $45,956.61 $14,688.33 $902,192.4017 368664 0.25675303 $94,655.60 $1,036.87 $0.00 $0.00 $95,692.47 0.4732 $45,281.68 $15,360.24 $947,474.0718 368664 0.264455621 $97,495.27 $1,036.87 $0.00 $0.00 $98,532.13 0.4528 $44,615.35 $15,983.85 $992,089.4219 368664 0.27238929 $100,420.13 $1,036.87 $0.00 $0.00 $101,456.99 0.4333 $43,961.31 $16,562.84 $1,036,050.7420 368664 0.280560968 $103,432.73 $1,036.87 $0.00 $0.00 $104,469.60 0.4146 $43,313.09 $17,097.06 $1,079,363.8321 368664 0.288977798 $106,535.71 $1,036.87 $0.00 $0.00 $107,572.58 0.3968 $42,684.80 $41,953.37 $1,122,048.6322 368664 0.297647131 $109,731.78 $1,036.87 $0.00 $0.00 $110,768.65 0.3797 $42,058.86 $41,358.95 $1,164,107.4923 368664 0.306576545 $113,023.74 $1,036.87 $0.00 $0.00 $114,060.60 0.3634 $41,449.62 $40,779.76 $1,205,557.1124 368664 0.315773842 $116,414.45 $1,036.87 $0.00 $0.00 $117,451.32 0.3477 $40,837.82 $40,196.90 $1,246,394.9325 368664 0.325247057 $119,906.88 $1,036.87 $0.00 $0.00 $120,943.75 0.3327 $40,237.99 $39,624.71 $1,286,632.9226 368664 0.335004469 $123,504.09 $1,036.87 $0.00 $0.00 $124,540.95 0.3184 $39,653.84 $39,066.93 $1,326,286.7627 368664 0.345054603 $127,209.21 $1,036.87 $0.00 $0.00 $128,246.08 0.3047 $39,076.58 $38,514.92 $1,365,363.3428 368664 0.355406241 $131,025.49 $1,036.87 $0.00 $0.00 $132,062.35 0.2916 $38,509.38 $37,971.87 $1,403,872.7229 368664 0.366068428 $134,956.25 $1,036.87 $0.00 $0.00 $135,993.12 0.279 $37,942.08 $37,427.79 $1,441,814.8030 368664 0.377050481 $139,004.94 $1,036.87 $0.00 $0.00 $140,041.81 0.267 $37,391.16 $36,899.00 $1,479,205.96
Totals 11059920 $2,806,294.89 $31,106.03 $2,944,679.70 $1,479,205.96* Discount Rate= 4.5%
Net Present Cost of PV SystemYear Annual PV Annual O&M Total Annual Present Value Present Value Annual PV Annual O&M Total Annual Present Value Present Value
Sys. Payment* Costs Costs Factor** of Costs Sys. Payment* Costs Costs Factor** of Costs0 $325,000.00 $0.00 $325,000.00 1.0000 $325,000.00 $0.00 $0.00 $0.00 1.0000 $0.001 $61,388.80 $1,843.32 $63,232.12 0.9569 $60,506.82 $89,728.80 $1,843.32 $91,572.12 0.9569 $87,625.362 $61,388.80 $1,843.32 $63,232.12 0.9157 $57,901.65 $89,728.80 $1,843.32 $91,572.12 0.9157 $83,852.593 $61,388.80 $1,843.32 $63,232.12 0.8763 $55,410.31 $89,728.80 $1,843.32 $91,572.12 0.8763 $80,244.654 $61,388.80 $1,843.32 $63,232.12 0.8386 $53,026.46 $89,728.80 $1,843.32 $91,572.12 0.8386 $76,792.385 $61,388.80 $1,843.32 $63,232.12 0.8025 $50,743.78 $89,728.80 $1,843.32 $91,572.12 0.8025 $73,486.636 $61,388.80 $1,843.32 $63,232.12 0.7679 $48,555.94 $89,728.80 $1,843.32 $91,572.12 0.7679 $70,318.237 $61,388.80 $1,843.32 $63,232.12 0.7348 $46,462.96 $89,728.80 $1,843.32 $91,572.12 0.7348 $67,287.198 $61,388.80 $1,843.32 $63,232.12 0.7032 $44,464.83 $89,728.80 $1,843.32 $91,572.12 0.7032 $64,393.519 $61,388.80 $1,843.32 $63,232.12 0.6729 $42,548.89 $89,728.80 $1,843.32 $91,572.12 0.6729 $61,618.88
10 $61,388.80 $1,843.32 $63,232.12 0.6439 $40,715.16 $89,728.80 $1,843.32 $91,572.12 0.6439 $58,963.2911 $61,388.80 $1,843.32 $63,232.12 0.6162 $38,963.63 $89,728.80 $1,843.32 $91,572.12 0.6162 $56,426.7412 $61,388.80 $1,843.32 $63,232.12 0.5897 $37,287.98 $89,728.80 $1,843.32 $91,572.12 0.5897 $54,000.0813 $61,388.80 $1,843.32 $63,232.12 0.5643 $35,681.89 $89,728.80 $1,843.32 $91,572.12 0.5643 $51,674.1514 $61,388.80 $1,843.32 $63,232.12 0.54 $34,145.34 $89,728.80 $1,843.32 $91,572.12 0.54 $49,448.9415 $61,388.80 $1,843.32 $63,232.12 0.5167 $32,672.04 $89,728.80 $1,843.32 $91,572.12 0.5167 $47,315.3116 $61,388.80 $1,843.32 $63,232.12 0.4945 $31,268.28 $89,728.80 $1,843.32 $91,572.12 0.4945 $45,282.4117 $61,388.80 $1,843.32 $63,232.12 0.4732 $29,921.44 $89,728.80 $1,843.32 $91,572.12 0.4732 $43,331.9318 $61,388.80 $1,843.32 $63,232.12 0.4528 $28,631.50 $89,728.80 $1,843.32 $91,572.12 0.4528 $41,463.8619 $61,388.80 $1,843.32 $63,232.12 0.4333 $27,398.48 $89,728.80 $1,843.32 $91,572.12 0.4333 $39,678.2020 $61,388.80 $1,843.32 $63,232.12 0.4146 $26,216.04 $89,728.80 $1,843.32 $91,572.12 0.4146 $37,965.8021 $0.00 $1,843.32 $1,843.32 0.3968 $731.43 $0.00 $1,843.32 $1,843.32 0.3968 $731.4322 $0.00 $1,843.32 $1,843.32 0.3797 $699.91 $0.00 $1,843.32 $1,843.32 0.3797 $699.9123 $0.00 $1,843.32 $1,843.32 0.3634 $669.86 $0.00 $1,843.32 $1,843.32 0.3634 $669.8624 $0.00 $1,843.32 $1,843.32 0.3477 $640.92 $0.00 $1,843.32 $1,843.32 0.3477 $640.9225 $0.00 $1,843.32 $1,843.32 0.3327 $613.27 $0.00 $1,843.32 $1,843.32 0.3327 $613.2726 $0.00 $1,843.32 $1,843.32 0.3184 $586.91 $0.00 $1,843.32 $1,843.32 0.3184 $586.9127 $0.00 $1,843.32 $1,843.32 0.3047 $561.66 $0.00 $1,843.32 $1,843.32 0.3047 $561.6628 $0.00 $1,843.32 $1,843.32 0.2916 $537.51 $0.00 $1,843.32 $1,843.32 0.2916 $537.5129 $0.00 $1,843.32 $1,843.32 0.279 $514.29 $0.00 $1,843.32 $1,843.32 0.279 $514.2930 $0.00 $1,843.32 $1,843.32 0.267 $492.17 $0.00 $1,843.32 $1,843.32 0.267 $492.17
Totals $1,552,776.00 $55,299.60 $1,608,075.60 $1,153,571.35 $1,794,576.00 $55,299.60 $1,849,875.60 $1,197,218.07* Financing of $704,000 for 20 years at a 6% interest rate and $325,000 downpayment with $500,000 from the CEC** Discount Rate = 4.5%*** Financing of $1,029,000 for 20 years at a 6% interest rate and $0.00 downpayment with $500,000 from the CEC
Net Present Value of PV System = Present Value of Benefits - Present Value of Costs= $1,479,205.96- $1,153,571.35= $325,634.61
Cost of= Generation Total kWh Generated over Life of System
= $1,153,571.3511059920 kWh
= $0.104 /kWh
Benefit-Cost =Ratio
= $1,479,205.96$1,153,571.35
= 1.282
Payback = The period of time required for the profit or other benefits of the system toequal the cost of the initial investment.
= Year 18
Present Value of Benefits
Financial Analysis 200 kW Crystalline Silicon PV Power Station - Best Case(Fixed System)
Net Present Cost of PV System w/o a Downpayment
Net Present Cost of the PV System
Financial Analysis 200 kW Crystalline Silicon PV Power Station - Best Case(Fixed System)
Financial Analysis 200 kW Crystalline Silicon PV Power Station - Best Case(Fixed System)
Net Present Cost of PV System
Net Present Benefit of the PV System

Year kWh Ave. Cost Value of Clean Air Tax Credit Production Total Value Present Value Present Value Net Cash PaybackGenerated $/kWh Energy Credits $/kWhr Tax Credits of Energy Factor* of Benefits Flow w/ DP (Cost=$0.721M)
0 0 $0.00 $0.00 $0.00 $0.00 $0.00 1.0000 $0.00 -$100,000 $0.001 321043 0.16 $51,366.88 $902.93 $0.0198 $3,755.99 $56,025.80 0.9569 $53,611.09 $257.78 $53,611.092 321043 0.1648 $52,907.89 $902.93 $0.0204 $6,597.43 $60,408.25 0.9157 $55,315.84 $4,259.69 $108,926.933 321043 0.169744 $54,495.12 $902.93 $0.0210 $6,790.06 $62,188.12 0.8763 $54,495.45 $5,636.10 $163,422.384 321043 0.17483632 $56,129.98 $902.93 $0.0216 $6,982.69 $64,015.60 0.8386 $53,683.48 $6,926.15 $217,105.855 321043 0.18008141 $57,813.88 $902.93 $0.0222 $7,175.31 $65,892.12 0.8025 $52,878.43 $8,133.90 $269,984.286 321043 0.185483852 $59,548.29 $902.93 $0.0228 $7,367.94 $67,819.16 0.7679 $52,078.33 $9,262.98 $322,062.627 321043 0.191048367 $61,334.74 $902.93 $0.0234 $7,560.56 $69,798.24 0.7348 $51,287.74 $10,317.93 $373,350.368 321043 0.196779818 $63,174.78 $902.93 $0.0240 $7,753.19 $71,830.91 0.7032 $50,511.49 $11,303.58 $423,861.859 321043 0.202683213 $65,070.03 $902.93 $0.0246 $7,945.81 $73,918.77 0.6729 $49,739.94 $12,221.45 $473,601.80
10 321043 0.208763709 $67,022.13 $902.93 $0.0252 $8,138.44 $76,063.50 0.6439 $48,977.29 $13,075.73 $522,579.0811 321043 0.215026621 $69,032.79 $902.93 $0.0258 $8,331.07 $78,266.79 0.6162 $48,228.00 $13,870.89 $570,807.0812 321043 0.221477419 $71,103.78 $902.93 $0.0264 $8,523.69 $80,530.40 0.5897 $47,488.78 $14,609.22 $618,295.8613 321043 0.228121742 $73,236.89 $902.93 $0.0270 $6,501.12 $80,640.94 0.5643 $45,505.68 $14,042.34 $663,801.5414 321043 0.234965394 $75,434.00 $902.93 $0.00 $0.00 $76,336.93 0.54 $41,221.94 $11,113.48 $705,023.4815 321043 0.242014356 $77,697.01 $902.93 $0.00 $0.00 $78,599.95 0.5167 $40,612.59 $11,803.25 $745,636.0816 321043 0.249274787 $80,027.93 $902.93 $0.00 $0.00 $80,930.86 0.4945 $40,020.31 $12,448.76 $785,656.3917 321043 0.25675303 $82,428.76 $902.93 $0.00 $0.00 $83,331.70 0.4732 $39,432.56 $13,048.62 $825,088.9518 321043 0.264455621 $84,901.63 $902.93 $0.00 $0.00 $85,804.56 0.4528 $38,852.30 $13,605.80 $863,941.2519 321043 0.27238929 $87,448.67 $902.93 $0.00 $0.00 $88,351.61 0.4333 $38,282.75 $14,123.50 $902,224.0020 321043 0.280560968 $90,072.14 $902.93 $0.00 $0.00 $90,975.07 0.4146 $37,718.26 $14,601.65 $939,942.26
Totals 6420860 $1,380,247.30 $18,058.67 $1,491,729.27 $939,942.26* Discount Rate = 4.5%
Year Annual PV Annual O&M Total Annual Present Value Present Value Annual PV Annual O&M Total Annual Present Value Present ValueSys. Payment* Costs Costs Factor** of Costs Sys. Payment*** Costs Costs Factor** of Costs
0 $100,000.00 $0.00 $100,000.00 1.0000 $100,000.00 $0.00 $0.00 $0.00 1.0000 $0.001 $54,151.20 $1,605.22 $55,756.42 0.9569 $53,353.31 $62,871.20 $1,605.22 $64,476.42 0.9569 $61,697.482 $54,151.20 $1,605.22 $55,756.42 0.9157 $51,056.15 $62,871.20 $1,605.22 $64,476.42 0.9157 $59,041.053 $54,151.20 $1,605.22 $55,756.42 0.8763 $48,859.35 $62,871.20 $1,605.22 $64,476.42 0.8763 $56,500.684 $54,151.20 $1,605.22 $55,756.42 0.8386 $46,757.33 $62,871.20 $1,605.22 $64,476.42 0.8386 $54,069.925 $54,151.20 $1,605.22 $55,756.42 0.8025 $44,744.52 $62,871.20 $1,605.22 $64,476.42 0.8025 $51,742.326 $54,151.20 $1,605.22 $55,756.42 0.7679 $42,815.35 $62,871.20 $1,605.22 $64,476.42 0.7679 $49,511.447 $54,151.20 $1,605.22 $55,756.42 0.7348 $40,969.81 $62,871.20 $1,605.22 $64,476.42 0.7348 $47,377.278 $54,151.20 $1,605.22 $55,756.42 0.7032 $39,207.91 $62,871.20 $1,605.22 $64,476.42 0.7032 $45,339.829 $54,151.20 $1,605.22 $55,756.42 0.6729 $37,518.49 $62,871.20 $1,605.22 $64,476.42 0.6729 $43,386.18
10 $54,151.20 $1,605.22 $55,756.42 0.6439 $35,901.56 $62,871.20 $1,605.22 $64,476.42 0.6439 $41,516.3611 $54,151.20 $1,605.22 $55,756.42 0.6162 $34,357.10 $62,871.20 $1,605.22 $64,476.42 0.6162 $39,730.3712 $54,151.20 $1,605.22 $55,756.42 0.5897 $32,879.56 $62,871.20 $1,605.22 $64,476.42 0.5897 $38,021.7413 $54,151.20 $1,605.22 $55,756.42 0.5643 $31,463.34 $62,871.20 $1,605.22 $64,476.42 0.5643 $36,384.0414 $54,151.20 $1,605.22 $55,756.42 0.54 $30,108.46 $62,871.20 $1,605.22 $64,476.42 0.54 $34,817.2615 $54,151.20 $1,605.22 $55,756.42 0.5167 $28,809.34 $62,871.20 $1,605.22 $64,476.42 0.5167 $33,314.9616 $54,151.20 $1,605.22 $55,756.42 0.4945 $27,571.55 $62,871.20 $1,605.22 $64,476.42 0.4945 $31,883.5917 $54,151.20 $1,605.22 $55,756.42 0.4732 $26,383.94 $62,871.20 $1,605.22 $64,476.42 0.4732 $30,510.2418 $54,151.20 $1,605.22 $55,756.42 0.4528 $25,246.50 $62,871.20 $1,605.22 $64,476.42 0.4528 $29,194.9219 $54,151.20 $1,605.22 $55,756.42 0.4333 $24,159.25 $62,871.20 $1,605.22 $64,476.42 0.4333 $27,937.6320 $54,151.20 $1,605.22 $55,756.42 0.4146 $23,116.61 $62,871.20 $1,605.22 $64,476.42 0.4146 $26,731.92
Totals $1,083,024.00 $32,104.30 $1,115,128.30 $725,279.45 $1,257,424.00 $32,104.30 $1,289,528.30 $838,709.21* Financing of $621,000 for 20 years at a 6% interest rate and $100,000 downpayment with $500,000 from CEC** Discount Rate = 4.5%*** Financing of $721,000 for 20 years at a 6% interest rate and $0.00 downpayment with $500,000 from CEC
Net Present Value of PV System = Present Value of Benefits - Present Worth of Costs= $939,942.26- $725,279.45= $214,662.82
Cost of Generation =Total kWh Generated over Life of System
= $725,279.456420860 kWh
= $0.113 /kWh
Benefit-Cost Ratio =
= $939,942.26$725,279.45
= 1.296
Payback = The period of time required for the profit or other benefits of the system toequal the cost of the initial investment.
= Year 14
Net Present Benefit of the PV SystemNet Present Cost of the PV System
Financial Analysis 200 kW Amorphous Silicon PV Power Station - Best Case
Net Present Cost of PV System
Financial Analysis 200 kW Amorphous Silicon PV Power Station - Best Case
Financial Analysis 200 kW Amorphous Silicon PV Power Station - Best Case
Present Value of Benefits
Net Present Cost of PV System w/o a downpayment
Net Present Cost of PV System

Millennium Energy LLC Brightfield Feasibility AssessmentFebruary, 2001 NREL Task Ordering Agreement # KDC-0-30470-00
Appendix G:Economic Analysis Spreadsheets
ForBest Case Scenario of PV System Options
Utilizing the 10-Year Financing and Direct Purchase Options

Yr kWh Ave. Cost Value of Clean Air Tax Credit Production Total Value Present Value Present Value Net Cash Net Cash PaybackGenerated $/kWh Energy Credits $/kWhr Tax Credits of Energy Factor* of Benefits Flow w/o DP Flow w/ DP (Cost=$2.712M)
0 0 $0.00 $0.00 $0.00 $0.00 $0.00 1.0000 $0.00 $0.00 -$1,350,000 $0.001 1093952 0.16 $175,032.32 $3,076.74 $0.0198 $12,798.52 $190,907.58 1.0000 $190,907.58 -$183,122.98 $342.02 $190,907.582 1093952 0.1648 $180,283.29 $3,076.74 $0.0204 $22,480.71 $205,840.74 1.0000 $205,840.74 -$168,189.82 $15,275.18 $396,748.323 1093952 0.169744 $185,691.79 $3,076.74 $0.0210 $23,137.08 $211,905.61 1.0000 $211,905.61 -$162,124.95 $21,340.05 $608,653.934 1093952 0.17483632 $191,262.54 $3,076.74 $0.0216 $23,793.46 $218,132.74 1.0000 $218,132.74 -$155,897.82 $27,567.18 $826,786.675 1093952 0.18008141 $197,000.42 $3,076.74 $0.0222 $24,449.83 $224,526.99 1.0000 $224,526.99 -$149,503.57 $33,961.43 $1,051,313.666 1093952 0.185483852 $202,910.43 $3,076.74 $0.0228 $25,106.20 $231,093.37 1.0000 $231,093.37 -$142,937.19 $40,527.81 $1,282,407.037 1093952 0.191048367 $208,997.74 $3,076.74 $0.0234 $25,762.57 $237,837.05 1.0000 $237,837.05 -$136,193.51 $47,271.49 $1,520,244.088 1093952 0.196779818 $215,267.68 $3,076.74 $0.0240 $26,418.94 $244,763.36 1.0000 $244,763.36 -$129,267.20 $54,197.80 $1,765,007.449 1093952 0.202683213 $221,725.71 $3,076.74 $0.0246 $27,075.31 $251,877.76 1.0000 $251,877.76 -$122,152.80 $61,312.20 $2,016,885.19
10 1093952 0.208763709 $228,377.48 $3,076.74 $0.0252 $27,731.68 $259,185.90 1.0000 $259,185.90 -$114,844.66 $68,620.34 $2,276,071.0911 1093952 0.215026621 $235,228.80 $3,076.74 $0.0258 $28,388.05 $266,693.60 1.0000 $266,693.60 $261,223.84 $261,223.84 $2,542,764.6912 1093952 0.221477419 $242,285.67 $3,076.74 $0.0264 $29,044.43 $274,406.83 1.0000 $274,406.83 $268,937.07 $268,937.07 $2,817,171.5213 1093952 0.228121742 $249,554.24 $3,076.74 $0.0270 $22,152.53 $274,783.50 1.0000 $274,783.50 $269,313.74 $269,313.74 $3,091,955.0314 1093952 0.234965394 $257,040.86 $3,076.74 $0.00 $0.00 $260,117.60 1.0000 $260,117.60 $254,647.84 $254,647.84 $3,352,072.6315 1093952 0.242014356 $264,752.09 $3,076.74 $0.00 $0.00 $267,828.83 1.0000 $267,828.83 $262,359.07 $262,359.07 $3,619,901.4616 1093952 0.249274787 $272,694.65 $3,076.74 $0.00 $0.00 $275,771.39 1.0000 $275,771.39 $270,301.63 $270,301.63 $3,895,672.8517 1093952 0.25675303 $280,875.49 $3,076.74 $0.00 $0.00 $283,952.23 1.0000 $283,952.23 $278,482.47 $278,482.47 $4,179,625.0818 1093952 0.264455621 $289,301.76 $3,076.74 $0.00 $0.00 $292,378.50 1.0000 $292,378.50 $286,908.74 $286,908.74 $4,472,003.5819 1093952 0.27238929 $297,980.81 $3,076.74 $0.00 $0.00 $301,057.55 1.0000 $301,057.55 $295,587.79 $295,587.79 $4,773,061.1220 1093952 0.280560968 $306,920.23 $3,076.74 $0.00 $0.00 $309,996.97 1.0000 $309,996.97 $304,527.21 $304,527.21 $5,083,058.1021 1093952 0.288977798 $316,127.84 $3,076.74 $0.00 $0.00 $319,204.58 1.0000 $319,204.58 $313,734.82 $313,734.82 $5,402,262.6822 1093952 0.297647131 $325,611.67 $3,076.74 $0.00 $0.00 $328,688.41 1.0000 $328,688.41 $323,218.65 $323,218.65 $5,730,951.0923 1093952 0.306576545 $335,380.03 $3,076.74 $0.00 $0.00 $338,456.77 1.0000 $338,456.77 $332,987.01 $332,987.01 $6,069,407.8624 1093952 0.315773842 $345,441.43 $3,076.74 $0.00 $0.00 $348,518.17 1.0000 $348,518.17 $343,048.41 $343,048.41 $6,417,926.0225 1093952 0.325247057 $355,804.67 $3,076.74 $0.00 $0.00 $358,881.41 1.0000 $358,881.41 $353,411.65 $353,411.65 $6,776,807.4326 1093952 0.335004469 $366,478.81 $3,076.74 $0.00 $0.00 $369,555.55 1.0000 $369,555.55 $364,085.79 $364,085.79 $7,146,362.9827 1093952 0.345054603 $377,473.17 $3,076.74 $0.00 $0.00 $380,549.91 1.0000 $380,549.91 $375,080.15 $375,080.15 $7,526,912.8928 1093952 0.355406241 $388,797.37 $3,076.74 $0.00 $0.00 $391,874.11 1.0000 $391,874.11 $386,404.35 $386,404.35 $7,918,787.0029 1093952 0.366068428 $400,461.29 $3,076.74 $0.00 $0.00 $403,538.03 1.0000 $403,538.03 $398,068.27 $398,068.27 $8,322,325.0330 1093952 0.377050481 $412,475.13 $3,076.74 $0.00 $0.00 $415,551.87 1.0000 $415,551.87 $410,082.11 $410,082.11 $8,737,876.90
32818560 $8,327,235.39 $92,302.20 $318,339.31 $8,737,876.90 $8,737,876.90* Discount Rate= 0.0%
Present Value of CostsYr Annual PV Annual O&M Total Annual Present Value Present Value Annual PV Annual O&M Total Annual Present Value Present Value
Sys. Payment* Costs Costs Factor** of Costs Sys. Payment*** Costs Costs Factor** of Costs0 ########### $0.00 $1,350,000.00 1.0000 $1,350,000.00 $0.00 $0.00 $0.00 1.0000 $0.00001 $185,095.80 $5,469.76 $190,565.56 1.0000 $190,565.56 $368,560.80 $5,469.76 $374,030.56 1.0000 $374,030.562 $185,095.80 $5,469.76 $190,565.56 1.0000 $190,565.56 $368,560.80 $5,469.76 $374,030.56 1.0000 $374,030.563 $185,095.80 $5,469.76 $190,565.56 1.0000 $190,565.56 $368,560.80 $5,469.76 $374,030.56 1.0000 $374,030.564 $185,095.80 $5,469.76 $190,565.56 1.0000 $190,565.56 $368,560.80 $5,469.76 $374,030.56 1.0000 $374,030.565 $185,095.80 $5,469.76 $190,565.56 1.0000 $190,565.56 $368,560.80 $5,469.76 $374,030.56 1.0000 $374,030.566 $185,095.80 $5,469.76 $190,565.56 1.0000 $190,565.56 $368,560.80 $5,469.76 $374,030.56 1.0000 $374,030.567 $185,095.80 $5,469.76 $190,565.56 1.0000 $190,565.56 $368,560.80 $5,469.76 $374,030.56 1.0000 $374,030.568 $185,095.80 $5,469.76 $190,565.56 1.0000 $190,565.56 $368,560.80 $5,469.76 $374,030.56 1.0000 $374,030.569 $185,095.80 $5,469.76 $190,565.56 1.0000 $190,565.56 $368,560.80 $5,469.76 $374,030.56 1.0000 $374,030.56
10 $185,095.80 $5,469.76 $190,565.56 1.0000 $190,565.56 $368,560.80 $5,469.76 $374,030.56 1.0000 $374,030.5611 $0.00 $5,469.76 $5,469.76 1.0000 $5,469.76 $0.00 $5,469.76 $5,469.76 1.0000 $5,469.7612 $0.00 $5,469.76 $5,469.76 1.0000 $5,469.76 $0.00 $5,469.76 $5,469.76 1.0000 $5,469.7613 $0.00 $5,469.76 $5,469.76 1.0000 $5,469.76 $0.00 $5,469.76 $5,469.76 1.0000 $5,469.7614 $0.00 $5,469.76 $5,469.76 1.0000 $5,469.76 $0.00 $5,469.76 $5,469.76 1.0000 $5,469.7615 $0.00 $5,469.76 $5,469.76 1.0000 $5,469.76 $0.00 $5,469.76 $5,469.76 1.0000 $5,469.7616 $0.00 $5,469.76 $5,469.76 1.0000 $5,469.76 $0.00 $5,469.76 $5,469.76 1.0000 $5,469.7617 $0.00 $5,469.76 $5,469.76 1.0000 $5,469.76 $0.00 $5,469.76 $5,469.76 1.0000 $5,469.7618 $0.00 $5,469.76 $5,469.76 1.0000 $5,469.76 $0.00 $5,469.76 $5,469.76 1.0000 $5,469.7619 $0.00 $5,469.76 $5,469.76 1.0000 $5,469.76 $0.00 $5,469.76 $5,469.76 1.0000 $5,469.7620 $0.00 $5,469.76 $5,469.76 1.0000 $5,469.76 $0.00 $5,469.76 $5,469.76 1.0000 $5,469.7621 $0.00 $5,469.76 $5,469.76 1.0000 $5,469.76 $0.00 $5,469.76 $5,469.76 1.0000 $5,469.7622 $0.00 $5,469.76 $5,469.76 1.0000 $5,469.76 $0.00 $5,469.76 $5,469.76 1.0000 $5,469.7623 $0.00 $5,469.76 $5,469.76 1.0000 $5,469.76 $0.00 $5,469.76 $5,469.76 1.0000 $5,469.7624 $0.00 $5,469.76 $5,469.76 1.0000 $5,469.76 $0.00 $5,469.76 $5,469.76 1.0000 $5,469.7625 $0.00 $5,469.76 $5,469.76 1.0000 $5,469.76 $0.00 $5,469.76 $5,469.76 1.0000 $5,469.7626 $0.00 $5,469.76 $5,469.76 1.0000 $5,469.76 $0.00 $5,469.76 $5,469.76 1.0000 $5,469.7627 $0.00 $5,469.76 $5,469.76 1.0000 $5,469.76 $0.00 $5,469.76 $5,469.76 1.0000 $5,469.7628 $0.00 $5,469.76 $5,469.76 1.0000 $5,469.76 $0.00 $5,469.76 $5,469.76 1.0000 $5,469.7629 $0.00 $5,469.76 $5,469.76 1.0000 $5,469.76 $0.00 $5,469.76 $5,469.76 1.0000 $5,469.7630 $0.00 $5,469.76 $5,469.76 1.0000 $5,469.76 $0.00 $5,469.76 $5,469.76 1.0000 $5,469.76
$3,200,958 $164,092.80 $3,365,050.80 $3,365,050.80 $3,685,608.00 $164,092.80 $3,849,700.80 $3,849,700.80* Financing of $1,362,000 for 10 years at a 6% interest rate and $1,350,000 downpayment with $1,000,000 from CEC and $125,000 from AB970** Discount Rate = 0.0%*** Financing of $2,712,000 for 10 years at a 6% interest rate and $0.0 downpayment with $1,000,000 from CEC and $125,000 from AB970
Net Present Value of PV System = Present Value of Benefits - Present Worth of Costs= $8,737,876.90- $3,365,050.80= $5,372,826.10
Cost of =Generation Total kWh Generated over Life of System
= $3,365,050.8032818560 kWh
= $0.103 /kWh
Benefit-Cost =Ratio
= $8,737,876.90$3,365,050.80
= 2.597
Payback = The period of time required for the profit or other benefits of the system toequal the cost of the initial investment.
= Year 11
Financial Analysis 500 kW Crystalline Silicon (Tracking) PV Power Station - Best Case
Present Value of Benefits Net Cash Flows
Financial Analysis 500 kW Crystalline Silicon (Tracking) PV Power Station - Best Case
Net Present Benefit of the PV SystemNet Present Cost of the PV System
Present Value of Costs w/o Downpayment
Financial Analysis 500 kW Crystalline Silicon (Tracking) PV Power Station - Best Case
Net Present Cost of PV System

Yr kWh Ave. Cost Value of Clean Air Tax Credit Production Total Value Present Value Present Value Present Value Net Cash Net Cash PaybackGenerated $/kWh Energy Credits $/kWhr Tax Credits of Energy Factor* of Benefits of Costs w/o DP Flow w/o DP Flow w/ DP (Cost=$2.712M)
0 0 0 1.0000 $0.00 $0.00 $0.00 -$2,712,000 $0.001 1093952 0.16 $175,032.32 $3,076.74 $0.0198 $12,798.52 $190,907.58 0.9569 $182,679.46 $231,527.85 -$48,848 $177,445.45 $182,679.462 1093952 0.1648 $180,283.29 $3,076.74 $0.0204 $22,480.71 $205,840.74 0.9157 $188,488.37 $221,559.26 -$33,071 $183,479.71 $371,167.833 1093952 0.169744 $185,691.79 $3,076.74 $0.0210 $23,137.08 $211,905.61 0.8763 $185,692.89 $212,026.18 -$26,333 $180,899.74 $556,860.724 1093952 0.17483632 $191,262.54 $3,076.74 $0.0216 $23,793.46 $218,132.74 0.8386 $182,926.11 $202,904.44 -$19,978 $178,339.17 $739,786.835 1093952 0.18008141 $197,000.42 $3,076.74 $0.0222 $24,449.83 $224,526.99 0.8025 $180,182.91 $194,169.82 -$13,987 $175,793.42 $919,969.746 1093952 0.185483852 $202,910.43 $3,076.74 $0.0228 $25,106.20 $231,093.37 0.7679 $177,456.60 $185,798.14 -$8,342 $173,256.37 $1,097,426.347 1093952 0.191048367 $208,997.74 $3,076.74 $0.0234 $25,762.57 $237,837.05 0.7348 $174,762.67 $177,789.39 -$3,027 $170,743.49 $1,272,189.008 1093952 0.196779818 $215,267.68 $3,076.74 $0.0240 $26,418.94 $244,763.36 0.7032 $172,117.59 $170,143.57 $1,974 $168,271.26 $1,444,306.599 1093952 0.202683213 $221,725.71 $3,076.74 $0.0246 $27,075.31 $251,877.76 0.6729 $169,488.54 $162,812.30 $6,676 $165,807.94 $1,613,795.14
10 1093952 0.208763709 $228,377.48 $3,076.74 $0.0252 $27,731.68 $259,185.90 0.6439 $166,889.80 $155,795.57 $11,094 $163,367.82 $1,780,684.9411 1093952 0.215026621 $235,228.80 $3,076.74 $0.0258 $28,388.05 $266,693.60 0.6162 $164,336.59 $149,093.39 $15,243 $160,966.13 $1,945,021.5312 1093952 0.221477419 $242,285.67 $3,076.74 $0.0264 $29,044.43 $274,406.83 0.5897 $161,817.71 $142,681.55 $19,136 $158,592.19 $2,106,839.2413 1093952 0.228121742 $249,554.24 $3,076.74 $0.0270 $22,152.53 $274,783.50 0.5643 $155,060.33 $136,535.86 $18,524 $151,973.75 $2,261,899.5714 1093952 0.234965394 $257,040.86 $3,076.74 $0.00 $0.00 $260,117.60 0.54 $140,463.51 $130,656.33 $9,807 $137,509.84 $2,402,363.0815 1093952 0.242014356 $264,752.09 $3,076.74 $0.00 $0.00 $267,828.83 0.5167 $138,387.16 $125,018.75 $13,368 $135,560.93 $2,540,750.2316 1093952 0.249274787 $272,694.65 $3,076.74 $0.00 $0.00 $275,771.39 0.4945 $136,368.95 $119,647.32 $16,722 $133,664.16 $2,677,119.1917 1093952 0.25675303 $280,875.49 $3,076.74 $0.00 $0.00 $283,952.23 0.4732 $134,366.20 $114,493.65 $19,873 $131,777.91 $2,811,485.3818 1093952 0.264455621 $289,301.76 $3,076.74 $0.00 $0.00 $292,378.50 0.4528 $132,388.98 $109,557.75 $22,831 $129,912.28 $2,943,874.3719 1093952 0.27238929 $297,980.81 $3,076.74 $0.00 $0.00 $301,057.55 0.4333 $130,448.24 $104,839.60 $25,609 $128,078.19 $3,074,322.6020 1093952 0.280560968 $306,920.23 $3,076.74 $0.00 $0.00 $309,996.97 0.4146 $128,524.74 $100,315.02 $28,210 $126,256.98 $3,202,847.3521 1093952 0.288977798 $316,127.84 $3,076.74 $0.00 $0.00 $319,204.58 0.3968 $126,660.38 $2,170.40 $124,490 $124,489.98 $3,329,507.7222 1093952 0.297647131 $325,611.67 $3,076.74 $0.00 $0.00 $328,688.41 0.3797 $124,802.99 $2,076.87 $122,726 $122,726.12 $3,454,310.7123 1093952 0.306576545 $335,380.03 $3,076.74 $0.00 $0.00 $338,456.77 0.3634 $122,995.19 $1,987.71 $121,007 $121,007.48 $3,577,305.9024 1093952 0.315773842 $345,441.43 $3,076.74 $0.00 $0.00 $348,518.17 0.3477 $121,179.77 $1,901.84 $119,278 $119,277.93 $3,698,485.6725 1093952 0.325247057 $355,804.67 $3,076.74 $0.00 $0.00 $358,881.41 0.3327 $119,399.84 $1,819.79 $117,580 $117,580.06 $3,817,885.5126 1093952 0.335004469 $366,478.81 $3,076.74 $0.00 $0.00 $369,555.55 0.3184 $117,666.49 $1,741.57 $115,925 $115,924.92 $3,935,552.0027 1093952 0.345054603 $377,473.17 $3,076.74 $0.00 $0.00 $380,549.91 0.3047 $115,953.56 $1,666.64 $114,287 $114,286.92 $4,051,505.5628 1093952 0.355406241 $388,797.37 $3,076.74 $0.00 $0.00 $391,874.11 0.2916 $114,270.49 $1,594.98 $112,676 $112,675.51 $4,165,776.0529 1093952 0.366068428 $400,461.29 $3,076.74 $0.00 $0.00 $403,538.03 0.279 $112,587.11 $1,526.06 $111,061 $111,061.05 $4,278,363.1630 1093952 0.377050481 $412,475.13 $3,076.74 $0.00 $0.00 $415,551.87 0.267 $110,952.35 $1,460.43 $109,492 $109,491.92 $4,389,315.51
32818560 $8,327,235.39 $92,302.20 $318,339.31 $8,737,877 $4,389,316* Discount Rate= 4.5%
Yr Annual PV Annual O&M Total Annual Present Value Present Value Annual PV Annual O&M Total Annual Present Value Present ValueSys. Payment* Costs Costs Factor** of Costs Sys. Payment*** Costs Costs Factor** of Costs
0 $2,712,000.00 $0.00 $2,712,000.00 1.0000 $2,712,000.00 $0.00 $0.00 $0.00 1.0000 $0.00001 $0.00 $5,469.76 $5,469.76 0.9569 $5,234.01 $236,486.40 $5,469.76 $241,956.16 0.9569 $231,527.84952 $0.00 $5,469.76 $5,469.76 0.9157 $5,008.66 $236,486.40 $5,469.76 $241,956.16 0.9157 $221,559.25573 $0.00 $5,469.76 $5,469.76 0.8763 $4,793.15 $236,486.40 $5,469.76 $241,956.16 0.8763 $212,026.18304 $0.00 $5,469.76 $5,469.76 0.8386 $4,586.94 $236,486.40 $5,469.76 $241,956.16 0.8386 $202,904.43585 $0.00 $5,469.76 $5,469.76 0.8025 $4,389.48 $236,486.40 $5,469.76 $241,956.16 0.8025 $194,169.81846 $0.00 $5,469.76 $5,469.76 0.7679 $4,200.23 $236,486.40 $5,469.76 $241,956.16 0.7679 $185,798.13537 $0.00 $5,469.76 $5,469.76 0.7348 $4,019.18 $236,486.40 $5,469.76 $241,956.16 0.7348 $177,789.38648 $0.00 $5,469.76 $5,469.76 0.7032 $3,846.34 $236,486.40 $5,469.76 $241,956.16 0.7032 $170,143.57179 $0.00 $5,469.76 $5,469.76 0.6729 $3,680.60 $236,486.40 $5,469.76 $241,956.16 0.6729 $162,812.3001
10 $0.00 $5,469.76 $5,469.76 0.6439 $3,521.98 $236,486.40 $5,469.76 $241,956.16 0.6439 $155,795.571411 $0.00 $5,469.76 $5,469.76 0.6162 $3,370.47 $236,486.40 $5,469.76 $241,956.16 0.6162 $149,093.385812 $0.00 $5,469.76 $5,469.76 0.5897 $3,225.52 $236,486.40 $5,469.76 $241,956.16 0.5897 $142,681.547613 $0.00 $5,469.76 $5,469.76 0.5643 $3,086.59 $236,486.40 $5,469.76 $241,956.16 0.5643 $136,535.861114 $0.00 $5,469.76 $5,469.76 0.54 $2,953.67 $236,486.40 $5,469.76 $241,956.16 0.54 $130,656.326415 $0.00 $5,469.76 $5,469.76 0.5167 $2,826.22 $236,486.40 $5,469.76 $241,956.16 0.5167 $125,018.747916 $0.00 $5,469.76 $5,469.76 0.4945 $2,704.80 $236,486.40 $5,469.76 $241,956.16 0.4945 $119,647.321117 $0.00 $5,469.76 $5,469.76 0.4732 $2,588.29 $236,486.40 $5,469.76 $241,956.16 0.4732 $114,493.654918 $0.00 $5,469.76 $5,469.76 0.4528 $2,476.71 $236,486.40 $5,469.76 $241,956.16 0.4528 $109,557.749219 $0.00 $5,469.76 $5,469.76 0.4333 $2,370.05 $236,486.40 $5,469.76 $241,956.16 0.4333 $104,839.604120 $0.00 $5,469.76 $5,469.76 0.4146 $2,267.76 $236,486.40 $5,469.76 $241,956.16 0.4146 $100,315.023921 $0.00 $5,469.76 $5,469.76 0.3968 $2,170.40 $0.00 $5,469.76 $5,469.76 0.3968 $2,170.400822 $0.00 $5,469.76 $5,469.76 0.3797 $2,076.87 $0.00 $5,469.76 $5,469.76 0.3797 $2,076.867923 $0.00 $5,469.76 $5,469.76 0.3634 $1,987.71 $0.00 $5,469.76 $5,469.76 0.3634 $1,987.710824 $0.00 $5,469.76 $5,469.76 0.3477 $1,901.84 $0.00 $5,469.76 $5,469.76 0.3477 $1,901.835625 $0.00 $5,469.76 $5,469.76 0.3327 $1,819.79 $0.00 $5,469.76 $5,469.76 0.3327 $1,819.789226 $0.00 $5,469.76 $5,469.76 0.3184 $1,741.57 $0.00 $5,469.76 $5,469.76 0.3184 $1,741.571627 $0.00 $5,469.76 $5,469.76 0.3047 $1,666.64 $0.00 $5,469.76 $5,469.76 0.3047 $1,666.635928 $0.00 $5,469.76 $5,469.76 0.2916 $1,594.98 $0.00 $5,469.76 $5,469.76 0.2916 $1,594.982029 $0.00 $5,469.76 $5,469.76 0.279 $1,526.06 $0.00 $5,469.76 $5,469.76 0.279 $1,526.063030 $0.00 $5,469.76 $5,469.76 0.267 $1,460.43 $0.00 $5,469.76 $5,469.76 0.267 $1,460.4259
$2,712,000 $164,092.80 $2,876,092.80 $2,801,096.92 $4,729,728.00 $164,093 $4,893,820.80 $3,165,312.01* Full payment of $2,712,000 for the 500kW system after $1,000,000 from CEC and $125,000 from AB970 rebates; so downpayment = full payment of the system after the rebates.** Discount Rate = 4.5%*** Financing of $2,712,000 for 20 years at a 6% interest rate and $0.0 downpayment with $1,000,000 from the CEC and $125,000 from AB970
Net Present Value of PV System = Present Value of Benefits - Present Worth of Costs= $4,389,315.51- $2,801,096.92= $1,588,218.59
Cost of =Generation Total kWh Generated over Life of System
= $2,801,096.9232818560 kWh
= $0.085 /kWh
Benefit-Cost = Ratio
= $4,389,315.51$2,801,096.92
= 1.567
Payback = The period of time required for the profit or other benefits of the system toequal the cost of the initial investment.
= Year 16
Present Value of Costs w/o Downpayment
Financial Analysis 500 kW Crystalline Silicon (Tracking) PV Power Station - Best Case
Financial Analysis 500 kW Crystalline Silicon (Tracking) PV Power Station - Best Case
Present Value of Benefits Net Cash Flows
Financial Analysis 500 kW Crystalline Silicon (Tracking) PV Power Station - Best Case
Net Present Cost of PV System
Net Present Benefit of the PV SystemNet Present Cost of the PV System
Present Value of Costs with a Downpayment

Millennium Energy LLC Brightfield Feasibility AssessmentFebruary, 2001 NREL Task Ordering Agreement # KDC-0-30470-00
Supplemental Appendix:Economic Analysis Spreadsheets
ForSan Diego Brightfield
Base Case and Best Case Scenarios of 500 kW PV System OptionsUtilizing the 13-Year and 20-Year Financing Mechanisms and
Power Sales Valuations of $0.19 and $0.22 per kWh

Year kWh Ave. Cost Value of Present Value Present Value Net Cash Net Cash PaybackGenerated $/kWh Energy Factor* of Benefits Flow w/o DP Flow w/ DP (Cost=$3.837M)
0 0 1.0000 $0.00 $0.00 -$1,550,000.00 $0.001 1093952 0.19 $207,850.88 0.9569 $198,892.51 -$126,507.23 $2,827.37 $198,892.512 1093952 0.1938 $212,007.90 0.9157 $194,135.63 -$117,253.79 $6,512.22 $393,028.143 1093952 0.197676 $216,248.06 0.8763 $189,498.17 -$108,493.04 $9,947.67 $582,526.314 1093952 0.20162952 $220,573.02 0.8386 $184,972.53 -$100,198.56 $13,146.61 $767,498.845 1093952 0.20566211 $224,984.48 0.8025 $180,550.04 -$92,345.03 $16,120.87 $948,048.886 1093952 0.209775353 $229,484.17 0.7679 $176,220.89 -$84,908.23 $18,881.13 $1,124,269.787 1093952 0.21397086 $234,073.85 0.7348 $171,997.46 -$77,875.80 $21,439.77 $1,296,267.248 1093952 0.218250277 $238,755.33 0.7032 $167,892.75 -$71,234.75 $23,809.77 $1,464,159.999 1093952 0.222615282 $243,530.43 0.6729 $163,871.63 -$64,952.16 $25,997.00 $1,628,031.62
10 1093952 0.227067588 $248,401.04 0.6439 $159,945.43 -$59,016.73 $28,012.79 $1,787,977.0511 1093952 0.23160894 $253,369.06 0.6162 $156,126.02 -$53,416.59 $29,869.00 $1,944,103.0612 1093952 0.236241119 $258,436.44 0.5897 $152,399.97 -$48,131.15 $31,572.71 $2,096,503.0313 1093952 0.240965941 $263,605.17 0.5643 $148,752.40 -$43,141.29 $33,129.50 $2,245,255.4314 1093952 0.24578526 $268,877.28 0.54 $145,193.73 -$38,436.60 $34,549.80 $2,390,449.1615 1093952 0.250700965 $274,254.82 0.5167 $141,707.47 -$33,999.55 $35,837.62 $2,532,156.6316 1093952 0.255714984 $279,739.92 0.4945 $138,331.39 -$29,826.38 $37,010.24 $2,670,488.0217 1093952 0.260829284 $285,334.72 0.4732 $135,020.39 -$25,894.19 $38,063.53 $2,805,508.4118 1093952 0.26604587 $291,041.41 0.4528 $131,783.55 -$22,193.88 $39,006.57 $2,937,291.9619 1093952 0.271366787 $296,862.24 0.4333 $128,630.41 -$18,715.93 $39,848.90 $3,065,922.3720 1093952 0.276794123 $302,799.48 0.4146 $125,540.67 -$15,446.62 $40,590.72 $3,191,463.0321 1093952 0.282330005 $308,855.47 0.3968 $122,553.85 $120,383.45 $120,383.45 $3,314,016.8822 1093952 0.287976605 $315,032.58 0.3797 $119,617.87 $117,541.00 $117,541.00 $3,433,634.7623 1093952 0.293736137 $321,333.24 0.3634 $116,772.50 $114,784.79 $114,784.79 $3,550,407.2524 1093952 0.29961086 $327,759.90 0.3477 $113,962.12 $112,060.28 $112,060.28 $3,664,369.3725 1093952 0.305603077 $334,315.10 0.3327 $111,226.63 $109,406.84 $109,406.84 $3,775,596.0026 1093952 0.311715139 $341,001.40 0.3184 $108,574.85 $106,833.27 $106,833.27 $3,884,170.8527 1093952 0.317949442 $347,821.43 0.3047 $105,981.19 $104,314.55 $104,314.55 $3,990,152.0428 1093952 0.324308431 $354,777.86 0.2916 $103,453.22 $101,858.24 $101,858.24 $4,093,605.2629 1093952 0.330794599 $361,873.41 0.279 $100,962.68 $99,436.62 $99,436.62 $4,194,567.9430 1093952 0.337410491 $369,110.88 0.267 $98,552.61 $95,560.10 $97,092.18 $4,293,120.55
Totals 32818560 $8,432,110.96 $4,293,120.55* Discount Rate= 4.5%
Net Present Value of Costs without a DownpaymentYear Annual PV Annual O&M Total Annual Present Value Present Value Annual PV Annual O&M Total Annual Present Value Present Value
Sys. Payment* Costs Costs Factor** of Costs Sys. Payment*** Costs Costs Factor** of Costs0 $1,550,000.00 $0.00 $1,550,000.00 1.0000 $1,550,000.00 $0.00 $0.00 $0.00 1.0000 $0.001 $199,426.40 $5,469.76 $204,896.16 0.9569 $196,065.14 $334,586.40 $5,469.76 $340,056.16 0.9569 $325,399.742 $199,426.40 $5,469.76 $204,896.16 0.9157 $187,623.41 $334,586.40 $5,469.76 $340,056.16 0.9157 $311,389.433 $199,426.40 $5,469.76 $204,896.16 0.8763 $179,550.51 $334,586.40 $5,469.76 $340,056.16 0.8763 $297,991.214 $199,426.40 $5,469.76 $204,896.16 0.8386 $171,825.92 $334,586.40 $5,469.76 $340,056.16 0.8386 $285,171.105 $199,426.40 $5,469.76 $204,896.16 0.8025 $164,429.17 $334,586.40 $5,469.76 $340,056.16 0.8025 $272,895.076 $199,426.40 $5,469.76 $204,896.16 0.7679 $157,339.76 $334,586.40 $5,469.76 $340,056.16 0.7679 $261,129.137 $199,426.40 $5,469.76 $204,896.16 0.7348 $150,557.70 $334,586.40 $5,469.76 $340,056.16 0.7348 $249,873.278 $199,426.40 $5,469.76 $204,896.16 0.7032 $144,082.98 $334,586.40 $5,469.76 $340,056.16 0.7032 $239,127.499 $199,426.40 $5,469.76 $204,896.16 0.6729 $137,874.63 $334,586.40 $5,469.76 $340,056.16 0.6729 $228,823.79
10 $199,426.40 $5,469.76 $204,896.16 0.6439 $131,932.64 $334,586.40 $5,469.76 $340,056.16 0.6439 $218,962.1611 $199,426.40 $5,469.76 $204,896.16 0.6162 $126,257.01 $334,586.40 $5,469.76 $340,056.16 0.6162 $209,542.6112 $199,426.40 $5,469.76 $204,896.16 0.5897 $120,827.27 $334,586.40 $5,469.76 $340,056.16 0.5897 $200,531.1213 $199,426.40 $5,469.76 $204,896.16 0.5643 $115,622.90 $334,586.40 $5,469.76 $340,056.16 0.5643 $191,893.6914 $199,426.40 $5,469.76 $204,896.16 0.54 $110,643.93 $334,586.40 $5,469.76 $340,056.16 0.54 $183,630.3315 $199,426.40 $5,469.76 $204,896.16 0.5167 $105,869.85 $334,586.40 $5,469.76 $340,056.16 0.5167 $175,707.0216 $199,426.40 $5,469.76 $204,896.16 0.4945 $101,321.15 $334,586.40 $5,469.76 $340,056.16 0.4945 $168,157.7717 $199,426.40 $5,469.76 $204,896.16 0.4732 $96,956.86 $334,586.40 $5,469.76 $340,056.16 0.4732 $160,914.5718 $199,426.40 $5,469.76 $204,896.16 0.4528 $92,776.98 $334,586.40 $5,469.76 $340,056.16 0.4528 $153,977.4319 $199,426.40 $5,469.76 $204,896.16 0.4333 $88,781.51 $334,586.40 $5,469.76 $340,056.16 0.4333 $147,346.3320 $199,426.40 $5,469.76 $204,896.16 0.4146 $84,949.95 $334,586.40 $5,469.76 $340,056.16 0.4146 $140,987.2821 $0.00 $5,469.76 $5,469.76 0.3968 $2,170.40 $0.00 $5,469.76 $5,469.76 0.3968 $2,170.4022 $0.00 $5,469.76 $5,469.76 0.3797 $2,076.87 $0.00 $5,469.76 $5,469.76 0.3797 $2,076.8723 $0.00 $5,469.76 $5,469.76 0.3634 $1,987.71 $0.00 $5,469.76 $5,469.76 0.3634 $1,987.7124 $0.00 $5,469.76 $5,469.76 0.3477 $1,901.84 $0.00 $5,469.76 $5,469.76 0.3477 $1,901.8425 $0.00 $5,469.76 $5,469.76 0.3327 $1,819.79 $0.00 $5,469.76 $5,469.76 0.3327 $1,819.7926 $0.00 $5,469.76 $5,469.76 0.3184 $1,741.57 $0.00 $5,469.76 $5,469.76 0.3184 $1,741.5727 $0.00 $5,469.76 $5,469.76 0.3047 $1,666.64 $0.00 $5,469.76 $5,469.76 0.3047 $1,666.6428 $0.00 $5,469.76 $5,469.76 0.2916 $1,594.98 $0.00 $5,469.76 $5,469.76 0.2916 $1,594.9829 $0.00 $5,469.76 $5,469.76 0.279 $1,526.06 $0.00 $5,469.76 $5,469.76 0.279 $1,526.0630 $0.00 $5,469.76 $5,469.76 0.267 $1,460.43 $0.00 $11,207.88 $11,207.88 0.267 $2,992.50
Totals $5,538,528.00 $164,092.80 $5,702,620.80 $4,233,235.53 $6,691,728.00 $169,830.92 $6,861,558.92 $4,442,928.89* Financing of $2,287,000 for 20 years at a 6.0% interest rate and $1,550,000 downpayment** Discount Rate = 4.5%*** Financing of $3,837,000 for 20 years at a 6% interest rate and $0.0 downpayment
Net Present Value of PV System = Present Value of Benefits - Present Worth of Costs= $4,293,120.55- $4,233,235.53= $59,885.02
Cost of Generation =Total kWh Generated over Life of System
= $4,233,235.5332818560 kWh
= $0.129 /kWh
Benefit-Cost Ratio =
= $4,293,120.55$4,233,235.53
= 1.014
Payback = The period of time required for the profit or other benefits of the system toequal the cost of the initial investment.
= Year 25
Net Present Cost of the PV System
Net Present Value of Costs with a Downpayment
Baseline Financial Analysis 500 kW Crystalline Silicon (Tracking) PV Power Station
Net Present Cost of PV System
Net Present Benefit of the PV System
Baseline Financial Analysis 500 kW Crystalline Silicon (Tracking) PV Power Station
Present Value of Benefits Net Cash Flows
Baseline Financial Analysis 500 kW Crystalline Silicon (Tracking) PV Power Station

Year kWh Ave. Cost Value of Present Value Present Value Net Cash Net Cash PaybackGenerated $/kWh Energy Factor* of Benefits Flow w/o DP Flow w/ DP (Cost=$3.837M)
0 0 1.0000 $0.00 $0.00 -$1,150,000.00 $0.001 1093952 0.22 $240,669.44 0.9569 $230,296.59 -$95,103.15 $854.78 $230,296.592 1093952 0.2244 $245,482.83 0.9157 $224,788.63 -$86,600.80 $5,225.60 $455,085.213 1093952 0.228888 $250,392.49 0.8763 $219,418.93 -$78,572.28 $9,303.09 $674,504.154 1093952 0.23346576 $255,400.34 0.8386 $214,178.72 -$70,992.37 $13,102.43 $888,682.875 1093952 0.238135075 $260,508.34 0.8025 $209,057.94 -$63,837.12 $16,637.58 $1,097,740.816 1093952 0.242897777 $265,718.51 0.7679 $204,045.24 -$57,083.88 $19,921.13 $1,301,786.067 1093952 0.247755732 $271,032.88 0.7348 $199,154.96 -$50,718.31 $22,967.44 $1,500,941.028 1093952 0.252710847 $276,453.54 0.7032 $194,402.13 -$44,725.36 $25,791.53 $1,695,343.149 1093952 0.257765064 $281,982.61 0.6729 $189,746.10 -$39,077.69 $28,400.72 $1,885,089.24
10 1093952 0.262920365 $287,622.26 0.6439 $185,199.97 -$33,762.19 $30,808.10 $2,070,289.2111 1093952 0.268178772 $293,374.70 0.6162 $180,777.49 -$28,765.11 $33,027.42 $2,251,066.7012 1093952 0.273542348 $299,242.20 0.5897 $176,463.12 -$24,067.99 $35,067.12 $2,427,529.8313 1093952 0.279013195 $305,227.04 0.5643 $172,239.62 -$19,654.07 $36,933.93 $2,599,769.4514 1093952 0.284593459 $311,331.58 0.54 $168,119.05 -$15,511.27 $38,639.93 $2,767,888.5015 1093952 0.290285328 $317,558.21 0.5167 $164,082.33 -$11,624.69 $40,189.99 $2,931,970.8316 1093952 0.296091034 $323,909.38 0.4945 $160,173.19 -$7,984.58 $41,603.88 $3,092,144.0217 1093952 0.302012855 $330,387.57 0.4732 $156,339.40 -$4,575.18 $42,877.32 $3,248,483.4218 1093952 0.308053112 $336,995.32 0.4528 $152,591.48 -$1,385.95 $44,020.83 $3,401,074.9019 1093952 0.314214174 $343,735.22 0.4333 $148,940.47 $1,594.14 $45,045.46 $3,550,015.3720 1093952 0.320498458 $350,609.93 0.4146 $145,362.88 $4,375.59 $45,951.68 $3,695,378.2521 1093952 0.326908427 $357,622.13 0.3968 $141,904.46 $139,734.06 $139,734.06 $3,837,282.7122 1093952 0.333446596 $364,774.57 0.3797 $138,504.90 $136,428.04 $136,428.04 $3,975,787.6123 1093952 0.340115528 $372,070.06 0.3634 $135,210.26 $133,222.55 $133,222.55 $4,110,997.8724 1093952 0.346917838 $379,511.46 0.3477 $131,956.14 $130,054.30 $130,054.30 $4,242,954.0125 1093952 0.353856195 $387,101.69 0.3327 $128,788.73 $126,968.94 $126,968.94 $4,371,742.7426 1093952 0.360933319 $394,843.73 0.3184 $125,718.24 $123,976.67 $123,976.67 $4,497,460.9827 1093952 0.368151985 $402,740.60 0.3047 $122,715.06 $121,048.43 $121,048.43 $4,620,176.0428 1093952 0.375515025 $410,795.41 0.2916 $119,787.94 $118,192.96 $118,192.96 $4,739,963.9929 1093952 0.383025325 $419,011.32 0.279 $116,904.16 $115,378.10 $115,378.10 $4,856,868.1530 1093952 0.390685832 $427,391.55 0.267 $114,113.54 $111,121.04 $112,653.12 $4,970,981.69
Totals 32818560 $9,763,496.90 $4,970,981.69* Discount Rate= 4.5%
Net Present Value of Costs without a DownpaymentYear Annual PV Annual O&M Total Annual Present Value Present Value Annual PV Annual O&M Total Annual Present Value Present Value
Sys. Payment* Costs Costs Factor** of Costs Sys. Payment*** Costs Costs Factor** of Costs0 $1,150,000.00 $0.00 $1,150,000.00 1.0000 $1,150,000.00 $0.00 $0.00 $0.00 1.0000 $0.001 $234,306.40 $5,469.76 $239,776.16 0.9569 $229,441.81 $334,586.40 $5,469.76 $340,056.16 0.9569 $325,399.742 $234,306.40 $5,469.76 $239,776.16 0.9157 $219,563.03 $334,586.40 $5,469.76 $340,056.16 0.9157 $311,389.433 $234,306.40 $5,469.76 $239,776.16 0.8763 $210,115.85 $334,586.40 $5,469.76 $340,056.16 0.8763 $297,991.214 $234,306.40 $5,469.76 $239,776.16 0.8386 $201,076.29 $334,586.40 $5,469.76 $340,056.16 0.8386 $285,171.105 $234,306.40 $5,469.76 $239,776.16 0.8025 $192,420.37 $334,586.40 $5,469.76 $340,056.16 0.8025 $272,895.076 $234,306.40 $5,469.76 $239,776.16 0.7679 $184,124.11 $334,586.40 $5,469.76 $340,056.16 0.7679 $261,129.137 $234,306.40 $5,469.76 $239,776.16 0.7348 $176,187.52 $334,586.40 $5,469.76 $340,056.16 0.7348 $249,873.278 $234,306.40 $5,469.76 $239,776.16 0.7032 $168,610.60 $334,586.40 $5,469.76 $340,056.16 0.7032 $239,127.499 $234,306.40 $5,469.76 $239,776.16 0.6729 $161,345.38 $334,586.40 $5,469.76 $340,056.16 0.6729 $228,823.79
10 $234,306.40 $5,469.76 $239,776.16 0.6439 $154,391.87 $334,586.40 $5,469.76 $340,056.16 0.6439 $218,962.1611 $234,306.40 $5,469.76 $239,776.16 0.6162 $147,750.07 $334,586.40 $5,469.76 $340,056.16 0.6162 $209,542.6112 $234,306.40 $5,469.76 $239,776.16 0.5897 $141,396.00 $334,586.40 $5,469.76 $340,056.16 0.5897 $200,531.1213 $234,306.40 $5,469.76 $239,776.16 0.5643 $135,305.69 $334,586.40 $5,469.76 $340,056.16 0.5643 $191,893.6914 $234,306.40 $5,469.76 $239,776.16 0.54 $129,479.13 $334,586.40 $5,469.76 $340,056.16 0.54 $183,630.3315 $234,306.40 $5,469.76 $239,776.16 0.5167 $123,892.34 $334,586.40 $5,469.76 $340,056.16 0.5167 $175,707.0216 $234,306.40 $5,469.76 $239,776.16 0.4945 $118,569.31 $334,586.40 $5,469.76 $340,056.16 0.4945 $168,157.7717 $234,306.40 $5,469.76 $239,776.16 0.4732 $113,462.08 $334,586.40 $5,469.76 $340,056.16 0.4732 $160,914.5718 $234,306.40 $5,469.76 $239,776.16 0.4528 $108,570.65 $334,586.40 $5,469.76 $340,056.16 0.4528 $153,977.4319 $234,306.40 $5,469.76 $239,776.16 0.4333 $103,895.01 $334,586.40 $5,469.76 $340,056.16 0.4333 $147,346.3320 $234,306.40 $5,469.76 $239,776.16 0.4146 $99,411.20 $334,586.40 $5,469.76 $340,056.16 0.4146 $140,987.2821 $0.00 $5,469.76 $5,469.76 0.3968 $2,170.40 $0.00 $5,469.76 $5,469.76 0.3968 $2,170.4022 $0.00 $5,469.76 $5,469.76 0.3797 $2,076.87 $0.00 $5,469.76 $5,469.76 0.3797 $2,076.8723 $0.00 $5,469.76 $5,469.76 0.3634 $1,987.71 $0.00 $5,469.76 $5,469.76 0.3634 $1,987.7124 $0.00 $5,469.76 $5,469.76 0.3477 $1,901.84 $0.00 $5,469.76 $5,469.76 0.3477 $1,901.8425 $0.00 $5,469.76 $5,469.76 0.3327 $1,819.79 $0.00 $5,469.76 $5,469.76 0.3327 $1,819.7926 $0.00 $5,469.76 $5,469.76 0.3184 $1,741.57 $0.00 $5,469.76 $5,469.76 0.3184 $1,741.5727 $0.00 $5,469.76 $5,469.76 0.3047 $1,666.64 $0.00 $5,469.76 $5,469.76 0.3047 $1,666.6428 $0.00 $5,469.76 $5,469.76 0.2916 $1,594.98 $0.00 $5,469.76 $5,469.76 0.2916 $1,594.9829 $0.00 $5,469.76 $5,469.76 0.279 $1,526.06 $0.00 $5,469.76 $5,469.76 0.279 $1,526.0630 $0.00 $5,469.76 $5,469.76 0.267 $1,460.43 $0.00 $11,207.88 $11,207.88 0.267 $2,992.50
Totals $5,836,128.00 $164,092.80 $6,000,220.80 $4,286,954.57 $6,691,728.00 $169,830.92 $6,861,558.92 $4,442,928.89* Financing of $2,687,000 for 20 years at a 6.0% interest rate and $1,150,000 downpayment** Discount Rate = 4.5%*** Financing of $3,837,000 for 20 years at a 6% interest rate and $0.0 downpayment
Net Present Value of PV System = Present Value of Benefits - Present Worth of Costs= $4,970,981.69- $4,286,954.57= $684,027.12
Cost of Generation =Total kWh Generated over Life of System
= $4,286,954.5732818560 kWh
= $0.131 /kWh
Benefit-Cost Ratio =
= $4,970,981.69$4,286,954.57
= 1.160
Payback = The period of time required for the profit or other benefits of the system toequal the cost of the initial investment.
= Year 20
Net Present Cost of the PV System
Net Present Value of Costs with a Downpayment
Baseline Financial Analysis 500 kW Crystalline Silicon (Tracking) PV Power Station
Net Present Cost of PV System
Net Present Benefit of the PV System
Baseline Financial Analysis 500 kW Crystalline Silicon (Tracking) PV Power Station
Present Value of Benefits Net Cash Flows
Baseline Financial Analysis 500 kW Crystalline Silicon (Tracking) PV Power Station

Year kWh Ave. Cost Value of Present Value Present Value Net Cash Net Cash PaybackGenerated $/kWh Energy Factor* of Benefits Flow w/o DP Flow w/ DP (Cost=$3.837M)
0 0 1.0000 $0.00 $0.00 -$2,100,000.00 $0.001 1093952 0.19 $207,850.88 1.0000 $207,850.88 -$231,199.88 $6,100.12 $207,850.882 1093952 0.1938 $212,007.90 1.0000 $212,007.90 -$227,042.86 $10,257.14 $419,858.783 1093952 0.197676 $216,248.06 1.0000 $216,248.06 -$222,802.70 $14,497.30 $636,106.834 1093952 0.20162952 $220,573.02 1.0000 $220,573.02 -$218,477.74 $18,822.26 $856,679.855 1093952 0.20566211 $224,984.48 1.0000 $224,984.48 -$214,066.28 $23,233.72 $1,081,664.336 1093952 0.209775353 $229,484.17 1.0000 $229,484.17 -$209,566.59 $27,733.41 $1,311,148.497 1093952 0.21397086 $234,073.85 1.0000 $234,073.85 -$204,976.91 $32,323.09 $1,545,222.348 1093952 0.218250277 $238,755.33 1.0000 $238,755.33 -$200,295.43 $37,004.57 $1,783,977.679 1093952 0.222615282 $243,530.43 1.0000 $243,530.43 -$195,520.33 $41,779.67 $2,027,508.1010 1093952 0.227067588 $248,401.04 1.0000 $248,401.04 -$190,649.72 $46,650.28 $2,275,909.1511 1093952 0.23160894 $253,369.06 1.0000 $253,369.06 -$185,681.70 $51,618.30 $2,529,278.2112 1093952 0.236241119 $258,436.44 1.0000 $258,436.44 -$180,614.32 $56,685.68 $2,787,714.6513 1093952 0.240965941 $263,605.17 1.0000 $263,605.17 -$175,445.59 $61,854.41 $3,051,319.8314 1093952 0.24578526 $268,877.28 1.0000 $268,877.28 $263,407.52 $263,407.52 $3,320,197.1015 1093952 0.250700965 $274,254.82 1.0000 $274,254.82 $268,785.06 $268,785.06 $3,594,451.9216 1093952 0.255714984 $279,739.92 1.0000 $279,739.92 $274,270.16 $274,270.16 $3,874,191.8417 1093952 0.260829284 $285,334.72 1.0000 $285,334.72 $279,864.96 $279,864.96 $4,159,526.5618 1093952 0.26604587 $291,041.41 1.0000 $291,041.41 $285,571.65 $285,571.65 $4,450,567.9719 1093952 0.271366787 $296,862.24 1.0000 $296,862.24 $291,392.48 $291,392.48 $4,747,430.2120 1093952 0.276794123 $302,799.48 1.0000 $302,799.48 $297,329.72 $297,329.72 $5,050,229.6921 1093952 0.282330005 $308,855.47 1.0000 $308,855.47 $303,385.71 $303,385.71 $5,359,085.1722 1093952 0.287976605 $315,032.58 1.0000 $315,032.58 $309,562.82 $309,562.82 $5,674,117.7523 1093952 0.293736137 $321,333.24 1.0000 $321,333.24 $315,863.48 $315,863.48 $5,995,450.9924 1093952 0.29961086 $327,759.90 1.0000 $327,759.90 $322,290.14 $322,290.14 $6,323,210.8925 1093952 0.305603077 $334,315.10 1.0000 $334,315.10 $328,845.34 $328,845.34 $6,657,525.9826 1093952 0.311715139 $341,001.40 1.0000 $341,001.40 $335,531.64 $335,531.64 $6,998,527.3827 1093952 0.317949442 $347,821.43 1.0000 $347,821.43 $342,351.67 $342,351.67 $7,346,348.8128 1093952 0.324308431 $354,777.86 1.0000 $354,777.86 $349,308.10 $349,308.10 $7,701,126.6729 1093952 0.330794599 $361,873.41 1.0000 $361,873.41 $356,403.65 $356,403.65 $8,063,000.0830 1093952 0.337410491 $369,110.88 1.0000 $369,110.88 $363,641.12 $363,641.12 $8,432,110.96
Totals 32818560 $8,432,110.96 $8,432,110.96* Discount Rate= 0.0%
Year Annual PV Annual O&M Total Annual Present Value Present Value Annual PV Annual O&M Total Annual Present Value Present ValueSys. Payment* Costs Costs Factor** of Costs Sys. Payment*** Costs Costs Factor** of Costs
0 $2,100,000.00 $0.00 $2,100,000.00 1.0000 $2,100,000.00 $0.00 $0.00 $0.00 1.0000 $0.00001 $196,281.00 $5,469.76 $201,750.76 1.0000 $201,750.76 $433,581.00 $5,469.76 $439,050.76 1.0000 $439,050.762 $196,281.00 $5,469.76 $201,750.76 1.0000 $201,750.76 $433,581.00 $5,469.76 $439,050.76 1.0000 $439,050.763 $196,281.00 $5,469.76 $201,750.76 1.0000 $201,750.76 $433,581.00 $5,469.76 $439,050.76 1.0000 $439,050.764 $196,281.00 $5,469.76 $201,750.76 1.0000 $201,750.76 $433,581.00 $5,469.76 $439,050.76 1.0000 $439,050.765 $196,281.00 $5,469.76 $201,750.76 1.0000 $201,750.76 $433,581.00 $5,469.76 $439,050.76 1.0000 $439,050.766 $196,281.00 $5,469.76 $201,750.76 1.0000 $201,750.76 $433,581.00 $5,469.76 $439,050.76 1.0000 $439,050.767 $196,281.00 $5,469.76 $201,750.76 1.0000 $201,750.76 $433,581.00 $5,469.76 $439,050.76 1.0000 $439,050.768 $196,281.00 $5,469.76 $201,750.76 1.0000 $201,750.76 $433,581.00 $5,469.76 $439,050.76 1.0000 $439,050.769 $196,281.00 $5,469.76 $201,750.76 1.0000 $201,750.76 $433,581.00 $5,469.76 $439,050.76 1.0000 $439,050.7610 $196,281.00 $5,469.76 $201,750.76 1.0000 $201,750.76 $433,581.00 $5,469.76 $439,050.76 1.0000 $439,050.7611 $196,281.00 $5,469.76 $201,750.76 1.0000 $201,750.76 $433,581.00 $5,469.76 $439,050.76 1.0000 $439,050.7612 $196,281.00 $5,469.76 $201,750.76 1.0000 $201,750.76 $433,581.00 $5,469.76 $439,050.76 1.0000 $439,050.7613 $196,281.00 $5,469.76 $201,750.76 1.0000 $201,750.76 $433,581.00 $5,469.76 $439,050.76 1.0000 $439,050.7614 $0.00 $5,469.76 $5,469.76 1.0000 $5,469.76 $0.00 $5,469.76 $5,469.76 1.0000 $5,469.7615 $0.00 $5,469.76 $5,469.76 1.0000 $5,469.76 $0.00 $5,469.76 $5,469.76 1.0000 $5,469.7616 $0.00 $5,469.76 $5,469.76 1.0000 $5,469.76 $0.00 $5,469.76 $5,469.76 1.0000 $5,469.7617 $0.00 $5,469.76 $5,469.76 1.0000 $5,469.76 $0.00 $5,469.76 $5,469.76 1.0000 $5,469.7618 $0.00 $5,469.76 $5,469.76 1.0000 $5,469.76 $0.00 $5,469.76 $5,469.76 1.0000 $5,469.7619 $0.00 $5,469.76 $5,469.76 1.0000 $5,469.76 $0.00 $5,469.76 $5,469.76 1.0000 $5,469.7620 $0.00 $5,469.76 $5,469.76 1.0000 $5,469.76 $0.00 $5,469.76 $5,469.76 1.0000 $5,469.7621 $0.00 $5,469.76 $5,469.76 1.0000 $5,469.76 $0.00 $5,469.76 $5,469.76 1.0000 $5,469.7622 $0.00 $5,469.76 $5,469.76 1.0000 $5,469.76 $0.00 $5,469.76 $5,469.76 1.0000 $5,469.7623 $0.00 $5,469.76 $5,469.76 1.0000 $5,469.76 $0.00 $5,469.76 $5,469.76 1.0000 $5,469.7624 $0.00 $5,469.76 $5,469.76 1.0000 $5,469.76 $0.00 $5,469.76 $5,469.76 1.0000 $5,469.7625 $0.00 $5,469.76 $5,469.76 1.0000 $5,469.76 $0.00 $5,469.76 $5,469.76 1.0000 $5,469.7626 $0.00 $5,469.76 $5,469.76 1.0000 $5,469.76 $0.00 $5,469.76 $5,469.76 1.0000 $5,469.7627 $0.00 $5,469.76 $5,469.76 1.0000 $5,469.76 $0.00 $5,469.76 $5,469.76 1.0000 $5,469.7628 $0.00 $5,469.76 $5,469.76 1.0000 $5,469.76 $0.00 $5,469.76 $5,469.76 1.0000 $5,469.7629 $0.00 $5,469.76 $5,469.76 1.0000 $5,469.76 $0.00 $5,469.76 $5,469.76 1.0000 $5,469.7630 $0.00 $5,469.76 $5,469.76 1.0000 $5,469.76 $0.00 $5,469.76 $5,469.76 1.0000 $5,469.76
Totals $4,651,653.00 $164,092.80 $4,815,745.80 $4,815,745.80 $5,636,553.00 $164,092.80 $5,800,645.80 $5,800,645.80* Financing of $1,737,000 for 13 years at a 6% interest rate and $2,100,000 downpayment** Discount Rate = 0.0%*** Financing of $3,837,000 for 13 years at a 6% interest rate and $0.0 downpayment
Net Present Value of PV System = Present Value of Benefits - Present Worth of Costs= $8,432,110.96- $4,815,745.80= $3,616,365.16
Cost of Generation =Total kWh Generated over Life of System
= $4,815,745.8032818560 kWh
= $0.147 /kWh
Benefit-Cost Ratio =
= $8,432,110.96$4,815,745.80
= 1.751
Payback = The period of time required for the profit or other benefits of the system toequal the cost of the initial investment.
= Year 15
Net Present Benefit of the PV SystemNet Present Cost of the PV System
Net Present Cost of PV System Present Value of Costs w/o Downpayment
Baseline Financial Analysis 500 kW Crystalline Silicon (Tracking) PV Power Station
Net Present Cost of PV System
Baseline Financial Analysis 500 kW Crystalline Silicon (Tracking) PV Power Station
Present Value of Benefits Net Cash Flows
Baseline Financial Analysis 500 kW Crystalline Silicon (Tracking) PV Power Station
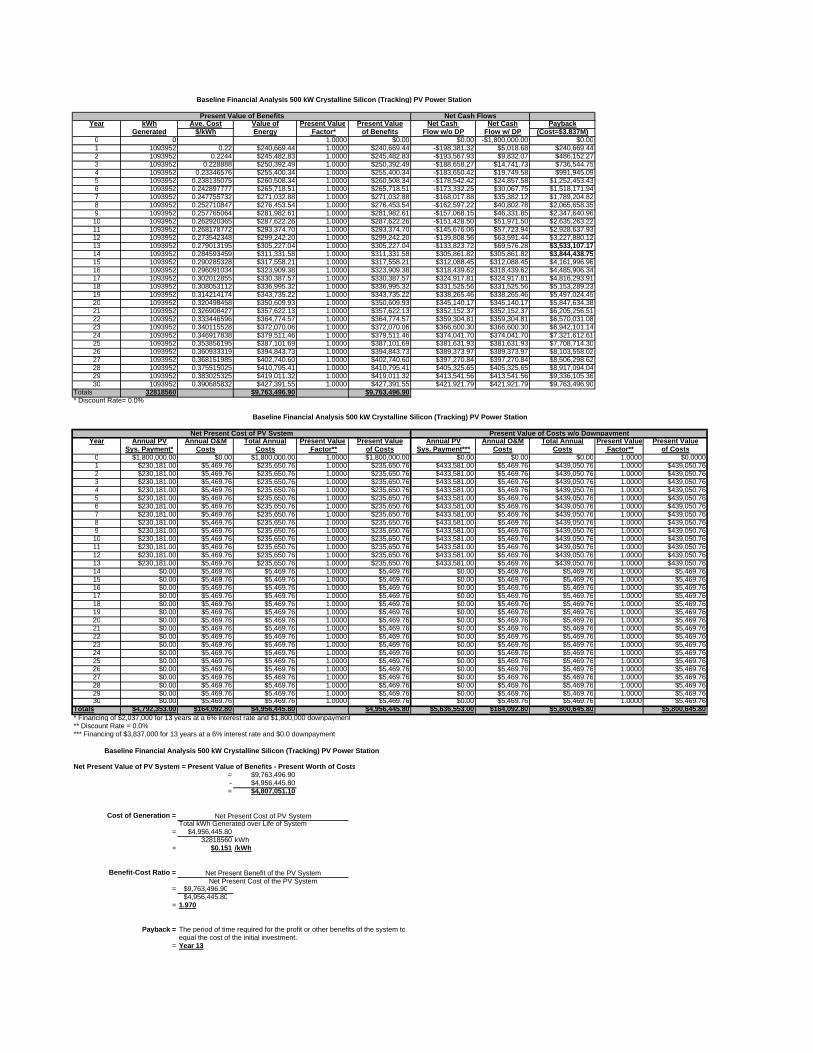
Year kWh Ave. Cost Value of Present Value Present Value Net Cash Net Cash PaybackGenerated $/kWh Energy Factor* of Benefits Flow w/o DP Flow w/ DP (Cost=$3.837M)
0 0 1.0000 $0.00 $0.00 -$1,800,000.00 $0.001 1093952 0.22 $240,669.44 1.0000 $240,669.44 -$198,381.32 $5,018.68 $240,669.442 1093952 0.2244 $245,482.83 1.0000 $245,482.83 -$193,567.93 $9,832.07 $486,152.273 1093952 0.228888 $250,392.49 1.0000 $250,392.49 -$188,658.27 $14,741.73 $736,544.754 1093952 0.23346576 $255,400.34 1.0000 $255,400.34 -$183,650.42 $19,749.58 $991,945.095 1093952 0.238135075 $260,508.34 1.0000 $260,508.34 -$178,542.42 $24,857.58 $1,252,453.436 1093952 0.242897777 $265,718.51 1.0000 $265,718.51 -$173,332.25 $30,067.75 $1,518,171.947 1093952 0.247755732 $271,032.88 1.0000 $271,032.88 -$168,017.88 $35,382.12 $1,789,204.828 1093952 0.252710847 $276,453.54 1.0000 $276,453.54 -$162,597.22 $40,802.78 $2,065,658.359 1093952 0.257765064 $281,982.61 1.0000 $281,982.61 -$157,068.15 $46,331.85 $2,347,640.9610 1093952 0.262920365 $287,622.26 1.0000 $287,622.26 -$151,428.50 $51,971.50 $2,635,263.2211 1093952 0.268178772 $293,374.70 1.0000 $293,374.70 -$145,676.06 $57,723.94 $2,928,637.9312 1093952 0.273542348 $299,242.20 1.0000 $299,242.20 -$139,808.56 $63,591.44 $3,227,880.1213 1093952 0.279013195 $305,227.04 1.0000 $305,227.04 -$133,823.72 $69,576.28 $3,533,107.1714 1093952 0.284593459 $311,331.58 1.0000 $311,331.58 $305,861.82 $305,861.82 $3,844,438.7515 1093952 0.290285328 $317,558.21 1.0000 $317,558.21 $312,088.45 $312,088.45 $4,161,996.9616 1093952 0.296091034 $323,909.38 1.0000 $323,909.38 $318,439.62 $318,439.62 $4,485,906.3417 1093952 0.302012855 $330,387.57 1.0000 $330,387.57 $324,917.81 $324,917.81 $4,816,293.9118 1093952 0.308053112 $336,995.32 1.0000 $336,995.32 $331,525.56 $331,525.56 $5,153,289.2319 1093952 0.314214174 $343,735.22 1.0000 $343,735.22 $338,265.46 $338,265.46 $5,497,024.4520 1093952 0.320498458 $350,609.93 1.0000 $350,609.93 $345,140.17 $345,140.17 $5,847,634.3821 1093952 0.326908427 $357,622.13 1.0000 $357,622.13 $352,152.37 $352,152.37 $6,205,256.5122 1093952 0.333446596 $364,774.57 1.0000 $364,774.57 $359,304.81 $359,304.81 $6,570,031.0823 1093952 0.340115528 $372,070.06 1.0000 $372,070.06 $366,600.30 $366,600.30 $6,942,101.1424 1093952 0.346917838 $379,511.46 1.0000 $379,511.46 $374,041.70 $374,041.70 $7,321,612.6125 1093952 0.353856195 $387,101.69 1.0000 $387,101.69 $381,631.93 $381,631.93 $7,708,714.3026 1093952 0.360933319 $394,843.73 1.0000 $394,843.73 $389,373.97 $389,373.97 $8,103,558.0227 1093952 0.368151985 $402,740.60 1.0000 $402,740.60 $397,270.84 $397,270.84 $8,506,298.6228 1093952 0.375515025 $410,795.41 1.0000 $410,795.41 $405,325.65 $405,325.65 $8,917,094.0429 1093952 0.383025325 $419,011.32 1.0000 $419,011.32 $413,541.56 $413,541.56 $9,336,105.3630 1093952 0.390685832 $427,391.55 1.0000 $427,391.55 $421,921.79 $421,921.79 $9,763,496.90
Totals 32818560 $9,763,496.90 $9,763,496.90* Discount Rate= 0.0%
Year Annual PV Annual O&M Total Annual Present Value Present Value Annual PV Annual O&M Total Annual Present Value Present ValueSys. Payment* Costs Costs Factor** of Costs Sys. Payment*** Costs Costs Factor** of Costs
0 $1,800,000.00 $0.00 $1,800,000.00 1.0000 $1,800,000.00 $0.00 $0.00 $0.00 1.0000 $0.00001 $230,181.00 $5,469.76 $235,650.76 1.0000 $235,650.76 $433,581.00 $5,469.76 $439,050.76 1.0000 $439,050.762 $230,181.00 $5,469.76 $235,650.76 1.0000 $235,650.76 $433,581.00 $5,469.76 $439,050.76 1.0000 $439,050.763 $230,181.00 $5,469.76 $235,650.76 1.0000 $235,650.76 $433,581.00 $5,469.76 $439,050.76 1.0000 $439,050.764 $230,181.00 $5,469.76 $235,650.76 1.0000 $235,650.76 $433,581.00 $5,469.76 $439,050.76 1.0000 $439,050.765 $230,181.00 $5,469.76 $235,650.76 1.0000 $235,650.76 $433,581.00 $5,469.76 $439,050.76 1.0000 $439,050.766 $230,181.00 $5,469.76 $235,650.76 1.0000 $235,650.76 $433,581.00 $5,469.76 $439,050.76 1.0000 $439,050.767 $230,181.00 $5,469.76 $235,650.76 1.0000 $235,650.76 $433,581.00 $5,469.76 $439,050.76 1.0000 $439,050.768 $230,181.00 $5,469.76 $235,650.76 1.0000 $235,650.76 $433,581.00 $5,469.76 $439,050.76 1.0000 $439,050.769 $230,181.00 $5,469.76 $235,650.76 1.0000 $235,650.76 $433,581.00 $5,469.76 $439,050.76 1.0000 $439,050.7610 $230,181.00 $5,469.76 $235,650.76 1.0000 $235,650.76 $433,581.00 $5,469.76 $439,050.76 1.0000 $439,050.7611 $230,181.00 $5,469.76 $235,650.76 1.0000 $235,650.76 $433,581.00 $5,469.76 $439,050.76 1.0000 $439,050.7612 $230,181.00 $5,469.76 $235,650.76 1.0000 $235,650.76 $433,581.00 $5,469.76 $439,050.76 1.0000 $439,050.7613 $230,181.00 $5,469.76 $235,650.76 1.0000 $235,650.76 $433,581.00 $5,469.76 $439,050.76 1.0000 $439,050.7614 $0.00 $5,469.76 $5,469.76 1.0000 $5,469.76 $0.00 $5,469.76 $5,469.76 1.0000 $5,469.7615 $0.00 $5,469.76 $5,469.76 1.0000 $5,469.76 $0.00 $5,469.76 $5,469.76 1.0000 $5,469.7616 $0.00 $5,469.76 $5,469.76 1.0000 $5,469.76 $0.00 $5,469.76 $5,469.76 1.0000 $5,469.7617 $0.00 $5,469.76 $5,469.76 1.0000 $5,469.76 $0.00 $5,469.76 $5,469.76 1.0000 $5,469.7618 $0.00 $5,469.76 $5,469.76 1.0000 $5,469.76 $0.00 $5,469.76 $5,469.76 1.0000 $5,469.7619 $0.00 $5,469.76 $5,469.76 1.0000 $5,469.76 $0.00 $5,469.76 $5,469.76 1.0000 $5,469.7620 $0.00 $5,469.76 $5,469.76 1.0000 $5,469.76 $0.00 $5,469.76 $5,469.76 1.0000 $5,469.7621 $0.00 $5,469.76 $5,469.76 1.0000 $5,469.76 $0.00 $5,469.76 $5,469.76 1.0000 $5,469.7622 $0.00 $5,469.76 $5,469.76 1.0000 $5,469.76 $0.00 $5,469.76 $5,469.76 1.0000 $5,469.7623 $0.00 $5,469.76 $5,469.76 1.0000 $5,469.76 $0.00 $5,469.76 $5,469.76 1.0000 $5,469.7624 $0.00 $5,469.76 $5,469.76 1.0000 $5,469.76 $0.00 $5,469.76 $5,469.76 1.0000 $5,469.7625 $0.00 $5,469.76 $5,469.76 1.0000 $5,469.76 $0.00 $5,469.76 $5,469.76 1.0000 $5,469.7626 $0.00 $5,469.76 $5,469.76 1.0000 $5,469.76 $0.00 $5,469.76 $5,469.76 1.0000 $5,469.7627 $0.00 $5,469.76 $5,469.76 1.0000 $5,469.76 $0.00 $5,469.76 $5,469.76 1.0000 $5,469.7628 $0.00 $5,469.76 $5,469.76 1.0000 $5,469.76 $0.00 $5,469.76 $5,469.76 1.0000 $5,469.7629 $0.00 $5,469.76 $5,469.76 1.0000 $5,469.76 $0.00 $5,469.76 $5,469.76 1.0000 $5,469.7630 $0.00 $5,469.76 $5,469.76 1.0000 $5,469.76 $0.00 $5,469.76 $5,469.76 1.0000 $5,469.76
Totals $4,792,353.00 $164,092.80 $4,956,445.80 $4,956,445.80 $5,636,553.00 $164,092.80 $5,800,645.80 $5,800,645.80* Financing of $2,037,000 for 13 years at a 6% interest rate and $1,800,000 downpayment** Discount Rate = 0.0%*** Financing of $3,837,000 for 13 years at a 6% interest rate and $0.0 downpayment
Net Present Value of PV System = Present Value of Benefits - Present Worth of Costs= $9,763,496.90- $4,956,445.80= $4,807,051.10
Cost of Generation =Total kWh Generated over Life of System
= $4,956,445.8032818560 kWh
= $0.151 /kWh
Benefit-Cost Ratio =
= $9,763,496.90$4,956,445.80
= 1.970
Payback = The period of time required for the profit or other benefits of the system toequal the cost of the initial investment.
= Year 13
Net Present Benefit of the PV SystemNet Present Cost of the PV System
Net Present Cost of PV System Present Value of Costs w/o Downpayment
Baseline Financial Analysis 500 kW Crystalline Silicon (Tracking) PV Power Station
Net Present Cost of PV System
Baseline Financial Analysis 500 kW Crystalline Silicon (Tracking) PV Power Station
Present Value of Benefits Net Cash Flows
Baseline Financial Analysis 500 kW Crystalline Silicon (Tracking) PV Power Station

Yr kWh Ave. Cost Value of Clean Air Tax Credit Production Total Value Present Value Present Value Present Value Net Cash Net Cash PaybackGenerated $/kWh Energy Credits $/kWhr Tax Credits of Energy Factor* of Benefits of Costs w/o DP Flow w/o DP Flow w/ DP (Cost=$2.712M)
0 0 0 1.0000 $0.00 $0.00 $0.00 $750,000 $0.001 1093952 0.19 $207,850.88 $3,076.74 $0.0198 $12,798.52 $223,726.14 0.9569 $214,083.54 $231,527.85 -$17,444 $1,330.07 $214,083.542 1093952 0.1938 $212,007.90 $3,076.74 $0.0204 $22,480.71 $237,565.35 0.9157 $217,538.59 $221,559.26 -$4,021 $13,945.37 $431,622.133 1093952 0.197676 $216,248.06 $3,076.74 $0.0210 $23,137.08 $242,461.88 0.8763 $212,469.35 $212,026.18 $443 $17,636.17 $644,091.484 1093952 0.20162952 $220,573.02 $3,076.74 $0.0216 $23,793.46 $247,443.21 0.8386 $207,505.88 $202,904.44 $4,601 $21,054.77 $851,597.365 1093952 0.20566211 $224,984.48 $3,076.74 $0.0222 $24,449.83 $252,511.04 0.8025 $202,640.11 $194,169.82 $8,470 $24,215.34 $1,054,237.476 1093952 0.209775353 $229,484.17 $3,076.74 $0.0228 $25,106.20 $257,667.10 0.7679 $197,862.57 $185,798.14 $12,064 $27,130.63 $1,252,100.047 1093952 0.21397086 $234,073.85 $3,076.74 $0.0234 $25,762.57 $262,913.16 0.7348 $193,188.59 $177,789.39 $15,399 $29,815.98 $1,445,288.638 1093952 0.218250277 $238,755.33 $3,076.74 $0.0240 $26,418.94 $268,251.01 0.7032 $188,634.11 $170,143.57 $18,491 $32,287.32 $1,633,922.749 1093952 0.222615282 $243,530.43 $3,076.74 $0.0246 $27,075.31 $273,682.49 0.6729 $184,160.94 $162,812.30 $21,349 $34,550.94 $1,818,083.6810 1093952 0.227067588 $248,401.04 $3,076.74 $0.0252 $27,731.68 $279,209.47 0.6439 $179,782.97 $155,795.57 $23,987 $36,620.72 $1,997,866.6611 1093952 0.23160894 $253,369.06 $3,076.74 $0.0258 $28,388.05 $284,833.86 0.6162 $175,514.62 $149,093.39 $26,421 $38,511.08 $2,173,381.2812 1093952 0.236241119 $258,436.44 $3,076.74 $0.0264 $29,044.43 $290,557.61 0.5897 $171,341.82 $142,681.55 $28,660 $40,230.19 $2,344,723.1013 1093952 0.240965941 $263,605.17 $3,076.74 $0.0270 $22,152.53 $288,834.44 0.5643 $162,989.28 $136,535.86 $26,453 $37,524.98 $2,507,712.3814 1093952 0.24578526 $268,877.28 $3,076.74 $0.00 $0.00 $271,954.02 0.54 $146,855.17 $130,656.33 $16,199 $26,793.64 $2,654,567.5515 1093952 0.250700965 $274,254.82 $3,076.74 $0.00 $0.00 $277,331.56 0.5167 $143,297.22 $125,018.75 $18,278 $28,416.12 $2,797,864.7616 1093952 0.255714984 $279,739.92 $3,076.74 $0.00 $0.00 $282,816.66 0.4945 $139,852.84 $119,647.32 $20,206 $29,907.61 $2,937,717.6017 1093952 0.260829284 $285,334.72 $3,076.74 $0.00 $0.00 $288,411.46 0.4732 $136,476.30 $114,493.65 $21,983 $31,266.83 $3,074,193.9018 1093952 0.26604587 $291,041.41 $3,076.74 $0.00 $0.00 $294,118.15 0.4528 $133,176.70 $109,557.75 $23,619 $32,502.89 $3,207,370.6019 1093952 0.271366787 $296,862.24 $3,076.74 $0.00 $0.00 $299,938.98 0.4333 $129,963.56 $104,839.60 $25,124 $33,625.30 $3,337,334.1620 1093952 0.276794123 $302,799.48 $3,076.74 $0.00 $0.00 $305,876.22 0.4146 $126,816.28 $100,315.02 $26,501 $34,635.71 $3,464,150.4421 1093952 0.282330005 $308,855.47 $3,076.74 $0.00 $0.00 $311,932.21 0.3968 $123,774.70 $2,170.40 $121,604 $121,604.30 $3,587,925.1522 1093952 0.287976605 $315,032.58 $3,076.74 $0.00 $0.00 $318,109.32 0.3797 $120,786.11 $2,076.87 $118,709 $118,709.24 $3,708,711.2623 1093952 0.293736137 $321,333.24 $3,076.74 $0.00 $0.00 $324,409.98 0.3634 $117,890.58 $1,987.71 $115,903 $115,902.87 $3,826,601.8424 1093952 0.29961086 $327,759.90 $3,076.74 $0.00 $0.00 $330,836.64 0.3477 $115,031.90 $1,901.84 $113,130 $113,130.06 $3,941,633.7425 1093952 0.305603077 $334,315.10 $3,076.74 $0.00 $0.00 $337,391.84 0.3327 $112,250.26 $1,819.79 $110,430 $110,430.48 $4,053,884.0126 1093952 0.311715139 $341,001.40 $3,076.74 $0.00 $0.00 $344,078.14 0.3184 $109,554.48 $1,741.57 $107,813 $107,812.91 $4,163,438.4827 1093952 0.317949442 $347,821.43 $3,076.74 $0.00 $0.00 $350,898.17 0.3047 $106,918.67 $1,666.64 $105,252 $105,252.04 $4,270,357.1628 1093952 0.324308431 $354,777.86 $3,076.74 $0.00 $0.00 $357,854.60 0.2916 $104,350.40 $1,594.98 $102,755 $102,755.42 $4,374,707.5629 1093952 0.330794599 $361,873.41 $3,076.74 $0.00 $0.00 $364,950.15 0.279 $101,821.09 $1,526.06 $100,295 $100,295.03 $4,476,528.6530 1093952 0.337410491 $369,110.88 $3,076.74 $0.00 $0.00 $372,187.62 0.267 $99,374.09 $1,460.43 $97,914 $97,913.67 $4,575,902.74
32818560 $8,432,110.96 $92,302.20 $318,339.31 $8,842,752.47 $4,575,902.74* Discount Rate= 4.5%
Yr Annual PV Annual O&M Total Annual Present Value Present Value Annual PV Annual O&M Total Annual Present Value Present ValueSys. Payment* Costs Costs Factor** of Costs Sys. Payment*** Costs Costs Factor** of Costs
0 $225,000.00 $0.00 $225,000.00 1.0000 $225,000.00 $0.00 $0.00 $0.00 1.0000 $0.00001 $216,866.40 $5,469.76 $222,336.16 0.9569 $212,753.47 $236,486.40 $5,469.76 $241,956.16 0.9569 $231,527.84952 $216,866.40 $5,469.76 $222,336.16 0.9157 $203,593.22 $236,486.40 $5,469.76 $241,956.16 0.9157 $221,559.25573 $216,866.40 $5,469.76 $222,336.16 0.8763 $194,833.18 $236,486.40 $5,469.76 $241,956.16 0.8763 $212,026.18304 $216,866.40 $5,469.76 $222,336.16 0.8386 $186,451.10 $236,486.40 $5,469.76 $241,956.16 0.8386 $202,904.43585 $216,866.40 $5,469.76 $222,336.16 0.8025 $178,424.77 $236,486.40 $5,469.76 $241,956.16 0.8025 $194,169.81846 $216,866.40 $5,469.76 $222,336.16 0.7679 $170,731.94 $236,486.40 $5,469.76 $241,956.16 0.7679 $185,798.13537 $216,866.40 $5,469.76 $222,336.16 0.7348 $163,372.61 $236,486.40 $5,469.76 $241,956.16 0.7348 $177,789.38648 $216,866.40 $5,469.76 $222,336.16 0.7032 $156,346.79 $236,486.40 $5,469.76 $241,956.16 0.7032 $170,143.57179 $216,866.40 $5,469.76 $222,336.16 0.6729 $149,610.00 $236,486.40 $5,469.76 $241,956.16 0.6729 $162,812.300110 $216,866.40 $5,469.76 $222,336.16 0.6439 $143,162.25 $236,486.40 $5,469.76 $241,956.16 0.6439 $155,795.571411 $216,866.40 $5,469.76 $222,336.16 0.6162 $137,003.54 $236,486.40 $5,469.76 $241,956.16 0.6162 $149,093.385812 $216,866.40 $5,469.76 $222,336.16 0.5897 $131,111.63 $236,486.40 $5,469.76 $241,956.16 0.5897 $142,681.547613 $216,866.40 $5,469.76 $222,336.16 0.5643 $125,464.30 $236,486.40 $5,469.76 $241,956.16 0.5643 $136,535.861114 $216,866.40 $5,469.76 $222,336.16 0.54 $120,061.53 $236,486.40 $5,469.76 $241,956.16 0.54 $130,656.326415 $216,866.40 $5,469.76 $222,336.16 0.5167 $114,881.09 $236,486.40 $5,469.76 $241,956.16 0.5167 $125,018.747916 $216,866.40 $5,469.76 $222,336.16 0.4945 $109,945.23 $236,486.40 $5,469.76 $241,956.16 0.4945 $119,647.321117 $216,866.40 $5,469.76 $222,336.16 0.4732 $105,209.47 $236,486.40 $5,469.76 $241,956.16 0.4732 $114,493.654918 $216,866.40 $5,469.76 $222,336.16 0.4528 $100,673.81 $236,486.40 $5,469.76 $241,956.16 0.4528 $109,557.749219 $216,866.40 $5,469.76 $222,336.16 0.4333 $96,338.26 $236,486.40 $5,469.76 $241,956.16 0.4333 $104,839.604120 $216,866.40 $5,469.76 $222,336.16 0.4146 $92,180.57 $236,486.40 $5,469.76 $241,956.16 0.4146 $100,315.023921 $0.00 $5,469.76 $5,469.76 0.3968 $2,170.40 $0.00 $5,469.76 $5,469.76 0.3968 $2,170.400822 $0.00 $5,469.76 $5,469.76 0.3797 $2,076.87 $0.00 $5,469.76 $5,469.76 0.3797 $2,076.867923 $0.00 $5,469.76 $5,469.76 0.3634 $1,987.71 $0.00 $5,469.76 $5,469.76 0.3634 $1,987.710824 $0.00 $5,469.76 $5,469.76 0.3477 $1,901.84 $0.00 $5,469.76 $5,469.76 0.3477 $1,901.835625 $0.00 $5,469.76 $5,469.76 0.3327 $1,819.79 $0.00 $5,469.76 $5,469.76 0.3327 $1,819.789226 $0.00 $5,469.76 $5,469.76 0.3184 $1,741.57 $0.00 $5,469.76 $5,469.76 0.3184 $1,741.571627 $0.00 $5,469.76 $5,469.76 0.3047 $1,666.64 $0.00 $5,469.76 $5,469.76 0.3047 $1,666.635928 $0.00 $5,469.76 $5,469.76 0.2916 $1,594.98 $0.00 $5,469.76 $5,469.76 0.2916 $1,594.982029 $0.00 $5,469.76 $5,469.76 0.279 $1,526.06 $0.00 $5,469.76 $5,469.76 0.279 $1,526.063030 $0.00 $5,469.76 $5,469.76 0.267 $1,460.43 $0.00 $5,469.76 $5,469.76 0.267 $1,460.4259
$4,562,328 $164,092.80 $4,726,420.80 $3,135,095.05 $4,729,728.00 $164,092.80 $4,893,820.80 $3,165,312.01* Financing of $2,487,000 for 20 years at a 6% interest rate and $225,000 downpayment with $1,000,000 from CEC and $125,000 from AB970** Discount Rate = 4.5%*** Financing of $2,712,000 for 20 years at a 6% interest rate and $0.0 downpayment with $1,000,000 from the CEC and $125,000 from AB970
Net Present Value of PV System = Present Value of Benefits - Present Worth of Costs= $4,575,902.74- $3,135,095.05= $1,440,807.69
Cost of = Generation Total kWh Generated over Life of System
= $3,135,095.0532818560 kWh
= $0.096 /kWh
Benefit-Cost = Ratio
= $4,575,902.74$3,135,095.05
= 1.460
Payback = The period of time required for the profit or other benefits of the system toequal the cost of the initial investment.
= Year 14
Net Present Cost of PV System
Net Present Benefit of the PV SystemNet Present Cost of the PV System
Financial Analysis 500 kW Crystalline Silicon (Tracking) PV Power Station - Best Case$0.19/kWhr; Discount Rate = 4.5%
Financial Analysis 500 kW Crystalline Silicon (Tracking) PV Power Station - Best Case$0.19/kWhr; Discount Rate = 4.5%
Financial Analysis 500 kW Crystalline Silicon (Tracking) PV Power Station - Best Case$0.19/kWhr; Discount Rate = 4.5%
Present Value of Benefits Net Cash Flows
Present Value of Costs with a Downpayment Present Value of Costs w/o Downpayment

Yr kWh Ave. Cost Value of Clean Air Tax Credit Production Total Value Present Value Present Value Net Cash Net Cash PaybackGenerated $/kWh Energy Credits $/kWhr Tax Credits of Energy Factor* of Benefits Flow w/o DP Flow w/ DP (Cost=$2.712M)
0 0 $0.00 $0.00 $0.00 $0.00 $0.00 1.0000 $0.00 $0.00 -$825,000.00 $0.001 1093952 0.19 $207,850.88 $3,076.74 $0.0198 $12,798.52 $223,726.14 1.0000 $223,726.14 -$88,199.62 $5,025.38 $223,726.142 1093952 0.1938 $212,007.90 $3,076.74 $0.0204 $22,480.71 $237,565.35 1.0000 $237,565.35 -$74,360.41 $18,864.59 $461,291.493 1093952 0.197676 $216,248.06 $3,076.74 $0.0210 $23,137.08 $242,461.88 1.0000 $242,461.88 -$69,463.88 $23,761.12 $703,753.374 1093952 0.20162952 $220,573.02 $3,076.74 $0.0216 $23,793.46 $247,443.21 1.0000 $247,443.21 -$64,482.55 $28,742.45 $951,196.585 1093952 0.20566211 $224,984.48 $3,076.74 $0.0222 $24,449.83 $252,511.04 1.0000 $252,511.04 -$59,414.72 $33,810.28 $1,203,707.626 1093952 0.209775353 $229,484.17 $3,076.74 $0.0228 $25,106.20 $257,667.10 1.0000 $257,667.10 -$54,258.66 $38,966.34 $1,461,374.737 1093952 0.21397086 $234,073.85 $3,076.74 $0.0234 $25,762.57 $262,913.16 1.0000 $262,913.16 -$49,012.60 $44,212.40 $1,724,287.898 1093952 0.218250277 $238,755.33 $3,076.74 $0.0240 $26,418.94 $268,251.01 1.0000 $268,251.01 -$43,674.75 $49,550.25 $1,992,538.909 1093952 0.222615282 $243,530.43 $3,076.74 $0.0246 $27,075.31 $273,682.49 1.0000 $273,682.49 -$38,243.27 $54,981.73 $2,266,221.3810 1093952 0.227067588 $248,401.04 $3,076.74 $0.0252 $27,731.68 $279,209.47 1.0000 $279,209.47 -$32,716.29 $60,508.71 $2,545,430.8511 1093952 0.23160894 $253,369.06 $3,076.74 $0.0258 $28,388.05 $284,833.86 1.0000 $284,833.86 -$27,091.90 $66,133.10 $2,830,264.7012 1093952 0.236241119 $258,436.44 $3,076.74 $0.0264 $29,044.43 $290,557.61 1.0000 $290,557.61 -$21,368.15 $71,856.85 $3,120,822.3113 1093952 0.240965941 $263,605.17 $3,076.74 $0.0270 $22,152.53 $288,834.44 1.0000 $288,834.44 -$23,091.32 $70,133.68 $3,409,656.7614 1093952 0.24578526 $268,877.28 $3,076.74 $0.00 $0.00 $271,954.02 1.0000 $271,954.02 $266,484.26 $266,484.26 $3,681,610.7715 1093952 0.250700965 $274,254.82 $3,076.74 $0.00 $0.00 $277,331.56 1.0000 $277,331.56 $271,861.80 $271,861.80 $3,958,942.3316 1093952 0.255714984 $279,739.92 $3,076.74 $0.00 $0.00 $282,816.66 1.0000 $282,816.66 $277,346.90 $277,346.90 $4,241,758.9917 1093952 0.260829284 $285,334.72 $3,076.74 $0.00 $0.00 $288,411.46 1.0000 $288,411.46 $282,941.70 $282,941.70 $4,530,170.4518 1093952 0.26604587 $291,041.41 $3,076.74 $0.00 $0.00 $294,118.15 1.0000 $294,118.15 $288,648.39 $288,648.39 $4,824,288.6019 1093952 0.271366787 $296,862.24 $3,076.74 $0.00 $0.00 $299,938.98 1.0000 $299,938.98 $294,469.22 $294,469.22 $5,124,227.5820 1093952 0.276794123 $302,799.48 $3,076.74 $0.00 $0.00 $305,876.22 1.0000 $305,876.22 $300,406.46 $300,406.46 $5,430,103.8021 1093952 0.282330005 $308,855.47 $3,076.74 $0.00 $0.00 $311,932.21 1.0000 $311,932.21 $306,462.45 $306,462.45 $5,742,036.0222 1093952 0.287976605 $315,032.58 $3,076.74 $0.00 $0.00 $318,109.32 1.0000 $318,109.32 $312,639.56 $312,639.56 $6,060,145.3423 1093952 0.293736137 $321,333.24 $3,076.74 $0.00 $0.00 $324,409.98 1.0000 $324,409.98 $318,940.22 $318,940.22 $6,384,555.3224 1093952 0.29961086 $327,759.90 $3,076.74 $0.00 $0.00 $330,836.64 1.0000 $330,836.64 $325,366.88 $325,366.88 $6,715,391.9625 1093952 0.305603077 $334,315.10 $3,076.74 $0.00 $0.00 $337,391.84 1.0000 $337,391.84 $331,922.08 $331,922.08 $7,052,783.7926 1093952 0.311715139 $341,001.40 $3,076.74 $0.00 $0.00 $344,078.14 1.0000 $344,078.14 $338,608.38 $338,608.38 $7,396,861.9327 1093952 0.317949442 $347,821.43 $3,076.74 $0.00 $0.00 $350,898.17 1.0000 $350,898.17 $345,428.41 $345,428.41 $7,747,760.1028 1093952 0.324308431 $354,777.86 $3,076.74 $0.00 $0.00 $357,854.60 1.0000 $357,854.60 $352,384.84 $352,384.84 $8,105,614.7029 1093952 0.330794599 $361,873.41 $3,076.74 $0.00 $0.00 $364,950.15 1.0000 $364,950.15 $359,480.39 $359,480.39 $8,470,564.8530 1093952 0.337410491 $369,110.88 $3,076.74 $0.00 $0.00 $372,187.62 1.0000 $372,187.62 $366,717.86 $366,717.86 $8,842,752.47
32818560 $8,432,110.96 $92,302.20 $318,339.31 $8,842,752.47 $8,842,752.47* Discount Rate= 0.0%
Present Value of CostsYr Annual PV Annual O&M Total Annual Present Value Present Value Annual PV Annual O&M Total Annual Present Value Present Value
Sys. Payment* Costs Costs Factor** of Costs Sys. Payment*** Costs Costs Factor** of Costs0 $825,000.00 $0.00 $825,000.00 1.0000 $825,000.00 $0.00 $0.00 $0.00 1.0000 $0.00001 $213,231.00 $5,469.76 $218,700.76 1.0000 $218,700.76 $306,456.00 $5,469.76 $311,925.76 1.0000 $311,925.762 $213,231.00 $5,469.76 $218,700.76 1.0000 $218,700.76 $306,456.00 $5,469.76 $311,925.76 1.0000 $311,925.763 $213,231.00 $5,469.76 $218,700.76 1.0000 $218,700.76 $306,456.00 $5,469.76 $311,925.76 1.0000 $311,925.764 $213,231.00 $5,469.76 $218,700.76 1.0000 $218,700.76 $306,456.00 $5,469.76 $311,925.76 1.0000 $311,925.765 $213,231.00 $5,469.76 $218,700.76 1.0000 $218,700.76 $306,456.00 $5,469.76 $311,925.76 1.0000 $311,925.766 $213,231.00 $5,469.76 $218,700.76 1.0000 $218,700.76 $306,456.00 $5,469.76 $311,925.76 1.0000 $311,925.767 $213,231.00 $5,469.76 $218,700.76 1.0000 $218,700.76 $306,456.00 $5,469.76 $311,925.76 1.0000 $311,925.768 $213,231.00 $5,469.76 $218,700.76 1.0000 $218,700.76 $306,456.00 $5,469.76 $311,925.76 1.0000 $311,925.769 $213,231.00 $5,469.76 $218,700.76 1.0000 $218,700.76 $306,456.00 $5,469.76 $311,925.76 1.0000 $311,925.7610 $213,231.00 $5,469.76 $218,700.76 1.0000 $218,700.76 $306,456.00 $5,469.76 $311,925.76 1.0000 $311,925.7611 $213,231.00 $5,469.76 $218,700.76 1.0000 $218,700.76 $306,456.00 $5,469.76 $311,925.76 1.0000 $311,925.7612 $213,231.00 $5,469.76 $218,700.76 1.0000 $218,700.76 $306,456.00 $5,469.76 $311,925.76 1.0000 $311,925.7613 $213,231.00 $5,469.76 $218,700.76 1.0000 $218,700.76 $306,456.00 $5,469.76 $311,925.76 1.0000 $311,925.7614 $0.00 $5,469.76 $5,469.76 1.0000 $5,469.76 $0.00 $5,469.76 $5,469.76 1.0000 $5,469.7615 $0.00 $5,469.76 $5,469.76 1.0000 $5,469.76 $0.00 $5,469.76 $5,469.76 1.0000 $5,469.7616 $0.00 $5,469.76 $5,469.76 1.0000 $5,469.76 $0.00 $5,469.76 $5,469.76 1.0000 $5,469.7617 $0.00 $5,469.76 $5,469.76 1.0000 $5,469.76 $0.00 $5,469.76 $5,469.76 1.0000 $5,469.7618 $0.00 $5,469.76 $5,469.76 1.0000 $5,469.76 $0.00 $5,469.76 $5,469.76 1.0000 $5,469.7619 $0.00 $5,469.76 $5,469.76 1.0000 $5,469.76 $0.00 $5,469.76 $5,469.76 1.0000 $5,469.7620 $0.00 $5,469.76 $5,469.76 1.0000 $5,469.76 $0.00 $5,469.76 $5,469.76 1.0000 $5,469.7621 $0.00 $5,469.76 $5,469.76 1.0000 $5,469.76 $0.00 $5,469.76 $5,469.76 1.0000 $5,469.7622 $0.00 $5,469.76 $5,469.76 1.0000 $5,469.76 $0.00 $5,469.76 $5,469.76 1.0000 $5,469.7623 $0.00 $5,469.76 $5,469.76 1.0000 $5,469.76 $0.00 $5,469.76 $5,469.76 1.0000 $5,469.7624 $0.00 $5,469.76 $5,469.76 1.0000 $5,469.76 $0.00 $5,469.76 $5,469.76 1.0000 $5,469.7625 $0.00 $5,469.76 $5,469.76 1.0000 $5,469.76 $0.00 $5,469.76 $5,469.76 1.0000 $5,469.7626 $0.00 $5,469.76 $5,469.76 1.0000 $5,469.76 $0.00 $5,469.76 $5,469.76 1.0000 $5,469.7627 $0.00 $5,469.76 $5,469.76 1.0000 $5,469.76 $0.00 $5,469.76 $5,469.76 1.0000 $5,469.7628 $0.00 $5,469.76 $5,469.76 1.0000 $5,469.76 $0.00 $5,469.76 $5,469.76 1.0000 $5,469.7629 $0.00 $5,469.76 $5,469.76 1.0000 $5,469.76 $0.00 $5,469.76 $5,469.76 1.0000 $5,469.7630 $0.00 $5,469.76 $5,469.76 1.0000 $5,469.76 $0.00 $5,469.76 $5,469.76 1.0000 $5,469.76
$3,597,003 $164,092.80 $3,761,095.80 $3,761,095.80 $3,983,928.00 $164,092.80 $4,148,020.80 $4,148,020.80* Financing of $1,887,000 for 13 years at a 6% interest rate and $825,000 downpayment with $1,000,000 from CEC and $125,000 from AB970** Discount Rate = 0.0%*** Financing of $2,712,000 for 13 years at a 6% interest rate and $0.0 downpayment with $1,000,000 from CEC and $125,000 from AB970
Net Present Value of PV System = Present Value of Benefits - Present Worth of Costs= $8,842,752.47- $3,761,095.80= $5,081,656.67
Cost of =Generation Total kWh Generated over Life of System
= $3,761,095.8032818560 kWh
= $0.115 /kWh
Benefit-Cost= Ratio
= $8,842,752.47$3,761,095.80
= 2.351
Payback = The period of time required for the profit or other benefits of the system toequal the cost of the initial investment.
= Year 10
Net Present Cost of the PV System
Financial Analysis 500 kW Crystalline Silicon (Tracking) PV Power Station - Best Case
$0.19/kWhr; Discount Rate = 0.0%
$0.19/kWhr; Discount Rate = 0.0%
Financial Analysis 500 kW Crystalline Silicon (Tracking) PV Power Station - Best Case$0.19/kWhr; Discount Rate = 0.0%
Present Value of Benefits Net Cash Flows
Present Value of Costs w/o Downpayment
Financial Analysis 500 kW Crystalline Silicon (Tracking) PV Power Station - Best Case
Net Present Cost of PV System
Net Present Benefit of the PV System

Yr kWh Ave. Cost Value of Clean Air Tax Credit Production Total Value Present Value Present Value Net Cash PaybackGenerated $/kWh Energy Credits $/kWhr Tax Credits of Energy Factor* of Benefits Flow w/ DP (Cost=$2.712M)
0 0 0 1.0000 $0.00 $750,000.00 $0.001 1093952 0.22 $240,669.44 $3,076.74 $0.0198 $12,798.52 $256,544.70 0.9569 $245,487.62 $13,959.77 $245,487.622 1093952 0.2244 $245,482.83 $3,076.74 $0.0204 $22,480.71 $271,040.28 0.9157 $248,191.59 $26,632.33 $493,679.213 1093952 0.228888 $250,392.49 $3,076.74 $0.0210 $23,137.08 $276,606.31 0.8763 $242,390.11 $30,363.93 $736,069.324 1093952 0.23346576 $255,400.34 $3,076.74 $0.0216 $23,793.46 $282,270.53 0.8386 $236,712.07 $33,807.63 $972,781.385 1093952 0.238135075 $260,508.34 $3,076.74 $0.0222 $24,449.83 $288,034.91 0.8025 $231,148.01 $36,978.20 $1,203,929.406 1093952 0.242897777 $265,718.51 $3,076.74 $0.0228 $25,106.20 $293,901.45 0.7679 $225,686.92 $39,888.79 $1,429,616.327 1093952 0.247755732 $271,032.88 $3,076.74 $0.0234 $25,762.57 $299,872.19 0.7348 $220,346.08 $42,556.70 $1,649,962.408 1093952 0.252710847 $276,453.54 $3,076.74 $0.0240 $26,418.94 $305,949.22 0.7032 $215,143.49 $44,999.92 $1,865,105.899 1093952 0.257765064 $281,982.61 $3,076.74 $0.0246 $27,075.31 $312,134.66 0.6729 $210,035.41 $47,223.11 $2,075,141.3010 1093952 0.262920365 $287,622.26 $3,076.74 $0.0252 $27,731.68 $318,430.68 0.6439 $205,037.52 $49,241.94 $2,280,178.8211 1093952 0.268178772 $293,374.70 $3,076.74 $0.0258 $28,388.05 $324,839.50 0.6162 $200,166.10 $51,072.71 $2,480,344.9212 1093952 0.273542348 $299,242.20 $3,076.74 $0.0264 $29,044.43 $331,363.36 0.5897 $195,404.98 $52,723.43 $2,675,749.9013 1093952 0.279013195 $305,227.04 $3,076.74 $0.0270 $22,152.53 $330,456.31 0.5643 $186,476.50 $49,940.63 $2,862,226.3914 1093952 0.284593459 $311,331.58 $3,076.74 $0.00 $0.00 $314,408.32 0.54 $169,780.49 $39,124.17 $3,032,006.8915 1093952 0.290285328 $317,558.21 $3,076.74 $0.00 $0.00 $320,634.95 0.5167 $165,672.08 $40,653.33 $3,197,678.9716 1093952 0.296091034 $323,909.38 $3,076.74 $0.00 $0.00 $326,986.12 0.4945 $161,694.64 $42,047.31 $3,359,373.6017 1093952 0.302012855 $330,387.57 $3,076.74 $0.00 $0.00 $333,464.31 0.4732 $157,795.31 $43,301.66 $3,517,168.9118 1093952 0.308053112 $336,995.32 $3,076.74 $0.00 $0.00 $340,072.06 0.4528 $153,984.63 $44,426.88 $3,671,153.5419 1093952 0.314214174 $343,735.22 $3,076.74 $0.00 $0.00 $346,811.96 0.4333 $150,273.62 $45,434.02 $3,821,427.1720 1093952 0.320498458 $350,609.93 $3,076.74 $0.00 $0.00 $353,686.67 0.4146 $146,638.49 $46,323.47 $3,968,065.6621 1093952 0.326908427 $357,622.13 $3,076.74 $0.00 $0.00 $360,698.87 0.3968 $143,125.31 $140,954.91 $4,111,190.9722 1093952 0.333446596 $364,774.57 $3,076.74 $0.00 $0.00 $367,851.31 0.3797 $139,673.14 $137,596.27 $4,250,864.1123 1093952 0.340115528 $372,070.06 $3,076.74 $0.00 $0.00 $375,146.80 0.3634 $136,328.35 $134,340.64 $4,387,192.4624 1093952 0.346917838 $379,511.46 $3,076.74 $0.00 $0.00 $382,588.20 0.3477 $133,025.92 $131,124.08 $4,520,218.3825 1093952 0.353856195 $387,101.69 $3,076.74 $0.00 $0.00 $390,178.43 0.3327 $129,812.36 $127,992.58 $4,650,030.7426 1093952 0.360933319 $394,843.73 $3,076.74 $0.00 $0.00 $397,920.47 0.3184 $126,697.88 $124,956.30 $4,776,728.6227 1093952 0.368151985 $402,740.60 $3,076.74 $0.00 $0.00 $405,817.34 0.3047 $123,652.54 $121,985.91 $4,900,381.1628 1093952 0.375515025 $410,795.41 $3,076.74 $0.00 $0.00 $413,872.15 0.2916 $120,685.12 $119,090.14 $5,021,066.2829 1093952 0.383025325 $419,011.32 $3,076.74 $0.00 $0.00 $422,088.06 0.279 $117,762.57 $116,236.51 $5,138,828.8530 1093952 0.390685832 $427,391.55 $3,076.74 $0.00 $0.00 $430,468.29 0.267 $114,935.03 $113,474.61 $5,253,763.88
32818560.00 $9,763,496.90 $92,302.20 $318,339.31 $10,174,138.41 $5,253,763.88* Discount Rate= 4.5%
Yr Annual PV Annual O&M Total Annual Present Value Present ValueSys. Payment* Costs Costs Factor** of Costs
0 $0.00 $0.00 $0.00 1.0000 $0.001 $236,486.40 $5,469.76 $241,956.16 0.9569 $231,527.852 $236,486.40 $5,469.76 $241,956.16 0.9157 $221,559.263 $236,486.40 $5,469.76 $241,956.16 0.8763 $212,026.184 $236,486.40 $5,469.76 $241,956.16 0.8386 $202,904.445 $236,486.40 $5,469.76 $241,956.16 0.8025 $194,169.826 $236,486.40 $5,469.76 $241,956.16 0.7679 $185,798.147 $236,486.40 $5,469.76 $241,956.16 0.7348 $177,789.398 $236,486.40 $5,469.76 $241,956.16 0.7032 $170,143.579 $236,486.40 $5,469.76 $241,956.16 0.6729 $162,812.3010 $236,486.40 $5,469.76 $241,956.16 0.6439 $155,795.5711 $236,486.40 $5,469.76 $241,956.16 0.6162 $149,093.3912 $236,486.40 $5,469.76 $241,956.16 0.5897 $142,681.5513 $236,486.40 $5,469.76 $241,956.16 0.5643 $136,535.8614 $236,486.40 $5,469.76 $241,956.16 0.54 $130,656.3315 $236,486.40 $5,469.76 $241,956.16 0.5167 $125,018.7516 $236,486.40 $5,469.76 $241,956.16 0.4945 $119,647.3217 $236,486.40 $5,469.76 $241,956.16 0.4732 $114,493.6518 $236,486.40 $5,469.76 $241,956.16 0.4528 $109,557.7519 $236,486.40 $5,469.76 $241,956.16 0.4333 $104,839.6020 $236,486.40 $5,469.76 $241,956.16 0.4146 $100,315.0221 $0.00 $5,469.76 $5,469.76 0.3968 $2,170.4022 $0.00 $5,469.76 $5,469.76 0.3797 $2,076.8723 $0.00 $5,469.76 $5,469.76 0.3634 $1,987.7124 $0.00 $5,469.76 $5,469.76 0.3477 $1,901.8425 $0.00 $5,469.76 $5,469.76 0.3327 $1,819.7926 $0.00 $5,469.76 $5,469.76 0.3184 $1,741.5727 $0.00 $5,469.76 $5,469.76 0.3047 $1,666.6428 $0.00 $5,469.76 $5,469.76 0.2916 $1,594.9829 $0.00 $5,469.76 $5,469.76 0.279 $1,526.0630 $0.00 $5,469.76 $5,469.76 0.267 $1,460.43
$4,729,728.00 $164,092.80 $4,893,820.80 $3,165,312.01* Financing of $2,712,000 for 20 years at a 6% interest rate and $0.00 downpayment with $1,000,000 from CEC and $125,000 from AB970** Discount Rate = 4.5%
Net Present Value of PV System = Present Value of Benefits - Present Worth of Costs= $5,253,763.88- $3,165,312.01= $2,088,451.87
Cost of= Generation Total kWh Generated over Life of System
= $3,165,312.0132818560 kWh
= $0.096 /kWh
Benefit-Cost = Ratio
= $5,253,763.88$3,165,312.01
= 1.660
Payback = The period of time required for the profit or other benefits of the system toequal the cost of the initial investment.
= Year 12
Net Present Cost of PV System
Net Present Benefit of the PV SystemNet Present Cost of the PV System
Present Value of Benefits
Present Value of Costs with a Downpayment
Financial Analysis 500 kW Crystalline Silicon (Tracking) PV Power Station - Best Case$0.22/kWhr; Discount Rate = 4.5%
Financial Analysis 500 kW Crystalline Silicon (Tracking) PV Power Station - Best Case$0.22/kWhr; Discount Rate = 4.5%
Financial Analysis 500 kW Crystalline Silicon (Tracking) PV Power Station - Best Case$0.22/kWhr; Discount Rate = 4.5%
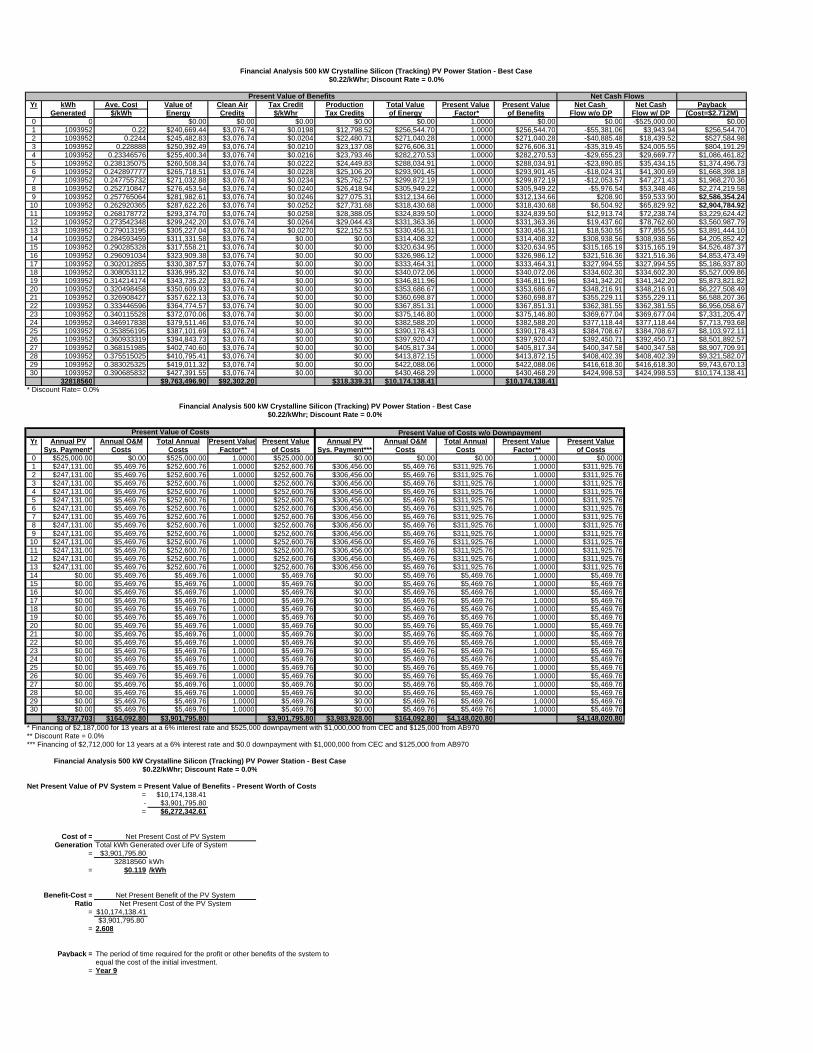
Yr kWh Ave. Cost Value of Clean Air Tax Credit Production Total Value Present Value Present Value Net Cash Net Cash PaybackGenerated $/kWh Energy Credits $/kWhr Tax Credits of Energy Factor* of Benefits Flow w/o DP Flow w/ DP (Cost=$2.712M)
0 0 $0.00 $0.00 $0.00 $0.00 $0.00 1.0000 $0.00 $0.00 -$525,000.00 $0.001 1093952 0.22 $240,669.44 $3,076.74 $0.0198 $12,798.52 $256,544.70 1.0000 $256,544.70 -$55,381.06 $3,943.94 $256,544.702 1093952 0.2244 $245,482.83 $3,076.74 $0.0204 $22,480.71 $271,040.28 1.0000 $271,040.28 -$40,885.48 $18,439.52 $527,584.983 1093952 0.228888 $250,392.49 $3,076.74 $0.0210 $23,137.08 $276,606.31 1.0000 $276,606.31 -$35,319.45 $24,005.55 $804,191.294 1093952 0.23346576 $255,400.34 $3,076.74 $0.0216 $23,793.46 $282,270.53 1.0000 $282,270.53 -$29,655.23 $29,669.77 $1,086,461.825 1093952 0.238135075 $260,508.34 $3,076.74 $0.0222 $24,449.83 $288,034.91 1.0000 $288,034.91 -$23,890.85 $35,434.15 $1,374,496.736 1093952 0.242897777 $265,718.51 $3,076.74 $0.0228 $25,106.20 $293,901.45 1.0000 $293,901.45 -$18,024.31 $41,300.69 $1,668,398.187 1093952 0.247755732 $271,032.88 $3,076.74 $0.0234 $25,762.57 $299,872.19 1.0000 $299,872.19 -$12,053.57 $47,271.43 $1,968,270.368 1093952 0.252710847 $276,453.54 $3,076.74 $0.0240 $26,418.94 $305,949.22 1.0000 $305,949.22 -$5,976.54 $53,348.46 $2,274,219.589 1093952 0.257765064 $281,982.61 $3,076.74 $0.0246 $27,075.31 $312,134.66 1.0000 $312,134.66 $208.90 $59,533.90 $2,586,354.2410 1093952 0.262920365 $287,622.26 $3,076.74 $0.0252 $27,731.68 $318,430.68 1.0000 $318,430.68 $6,504.92 $65,829.92 $2,904,784.9211 1093952 0.268178772 $293,374.70 $3,076.74 $0.0258 $28,388.05 $324,839.50 1.0000 $324,839.50 $12,913.74 $72,238.74 $3,229,624.4212 1093952 0.273542348 $299,242.20 $3,076.74 $0.0264 $29,044.43 $331,363.36 1.0000 $331,363.36 $19,437.60 $78,762.60 $3,560,987.7913 1093952 0.279013195 $305,227.04 $3,076.74 $0.0270 $22,152.53 $330,456.31 1.0000 $330,456.31 $18,530.55 $77,855.55 $3,891,444.1014 1093952 0.284593459 $311,331.58 $3,076.74 $0.00 $0.00 $314,408.32 1.0000 $314,408.32 $308,938.56 $308,938.56 $4,205,852.4215 1093952 0.290285328 $317,558.21 $3,076.74 $0.00 $0.00 $320,634.95 1.0000 $320,634.95 $315,165.19 $315,165.19 $4,526,487.3716 1093952 0.296091034 $323,909.38 $3,076.74 $0.00 $0.00 $326,986.12 1.0000 $326,986.12 $321,516.36 $321,516.36 $4,853,473.4917 1093952 0.302012855 $330,387.57 $3,076.74 $0.00 $0.00 $333,464.31 1.0000 $333,464.31 $327,994.55 $327,994.55 $5,186,937.8018 1093952 0.308053112 $336,995.32 $3,076.74 $0.00 $0.00 $340,072.06 1.0000 $340,072.06 $334,602.30 $334,602.30 $5,527,009.8619 1093952 0.314214174 $343,735.22 $3,076.74 $0.00 $0.00 $346,811.96 1.0000 $346,811.96 $341,342.20 $341,342.20 $5,873,821.8220 1093952 0.320498458 $350,609.93 $3,076.74 $0.00 $0.00 $353,686.67 1.0000 $353,686.67 $348,216.91 $348,216.91 $6,227,508.4921 1093952 0.326908427 $357,622.13 $3,076.74 $0.00 $0.00 $360,698.87 1.0000 $360,698.87 $355,229.11 $355,229.11 $6,588,207.3622 1093952 0.333446596 $364,774.57 $3,076.74 $0.00 $0.00 $367,851.31 1.0000 $367,851.31 $362,381.55 $362,381.55 $6,956,058.6723 1093952 0.340115528 $372,070.06 $3,076.74 $0.00 $0.00 $375,146.80 1.0000 $375,146.80 $369,677.04 $369,677.04 $7,331,205.4724 1093952 0.346917838 $379,511.46 $3,076.74 $0.00 $0.00 $382,588.20 1.0000 $382,588.20 $377,118.44 $377,118.44 $7,713,793.6825 1093952 0.353856195 $387,101.69 $3,076.74 $0.00 $0.00 $390,178.43 1.0000 $390,178.43 $384,708.67 $384,708.67 $8,103,972.1126 1093952 0.360933319 $394,843.73 $3,076.74 $0.00 $0.00 $397,920.47 1.0000 $397,920.47 $392,450.71 $392,450.71 $8,501,892.5727 1093952 0.368151985 $402,740.60 $3,076.74 $0.00 $0.00 $405,817.34 1.0000 $405,817.34 $400,347.58 $400,347.58 $8,907,709.9128 1093952 0.375515025 $410,795.41 $3,076.74 $0.00 $0.00 $413,872.15 1.0000 $413,872.15 $408,402.39 $408,402.39 $9,321,582.0729 1093952 0.383025325 $419,011.32 $3,076.74 $0.00 $0.00 $422,088.06 1.0000 $422,088.06 $416,618.30 $416,618.30 $9,743,670.1330 1093952 0.390685832 $427,391.55 $3,076.74 $0.00 $0.00 $430,468.29 1.0000 $430,468.29 $424,998.53 $424,998.53 $10,174,138.41
32818560 $9,763,496.90 $92,302.20 $318,339.31 $10,174,138.41 $10,174,138.41* Discount Rate= 0.0%
Present Value of CostsYr Annual PV Annual O&M Total Annual Present Value Present Value Annual PV Annual O&M Total Annual Present Value Present Value
Sys. Payment* Costs Costs Factor** of Costs Sys. Payment*** Costs Costs Factor** of Costs0 $525,000.00 $0.00 $525,000.00 1.0000 $525,000.00 $0.00 $0.00 $0.00 1.0000 $0.00001 $247,131.00 $5,469.76 $252,600.76 1.0000 $252,600.76 $306,456.00 $5,469.76 $311,925.76 1.0000 $311,925.762 $247,131.00 $5,469.76 $252,600.76 1.0000 $252,600.76 $306,456.00 $5,469.76 $311,925.76 1.0000 $311,925.763 $247,131.00 $5,469.76 $252,600.76 1.0000 $252,600.76 $306,456.00 $5,469.76 $311,925.76 1.0000 $311,925.764 $247,131.00 $5,469.76 $252,600.76 1.0000 $252,600.76 $306,456.00 $5,469.76 $311,925.76 1.0000 $311,925.765 $247,131.00 $5,469.76 $252,600.76 1.0000 $252,600.76 $306,456.00 $5,469.76 $311,925.76 1.0000 $311,925.766 $247,131.00 $5,469.76 $252,600.76 1.0000 $252,600.76 $306,456.00 $5,469.76 $311,925.76 1.0000 $311,925.767 $247,131.00 $5,469.76 $252,600.76 1.0000 $252,600.76 $306,456.00 $5,469.76 $311,925.76 1.0000 $311,925.768 $247,131.00 $5,469.76 $252,600.76 1.0000 $252,600.76 $306,456.00 $5,469.76 $311,925.76 1.0000 $311,925.769 $247,131.00 $5,469.76 $252,600.76 1.0000 $252,600.76 $306,456.00 $5,469.76 $311,925.76 1.0000 $311,925.7610 $247,131.00 $5,469.76 $252,600.76 1.0000 $252,600.76 $306,456.00 $5,469.76 $311,925.76 1.0000 $311,925.7611 $247,131.00 $5,469.76 $252,600.76 1.0000 $252,600.76 $306,456.00 $5,469.76 $311,925.76 1.0000 $311,925.7612 $247,131.00 $5,469.76 $252,600.76 1.0000 $252,600.76 $306,456.00 $5,469.76 $311,925.76 1.0000 $311,925.7613 $247,131.00 $5,469.76 $252,600.76 1.0000 $252,600.76 $306,456.00 $5,469.76 $311,925.76 1.0000 $311,925.7614 $0.00 $5,469.76 $5,469.76 1.0000 $5,469.76 $0.00 $5,469.76 $5,469.76 1.0000 $5,469.7615 $0.00 $5,469.76 $5,469.76 1.0000 $5,469.76 $0.00 $5,469.76 $5,469.76 1.0000 $5,469.7616 $0.00 $5,469.76 $5,469.76 1.0000 $5,469.76 $0.00 $5,469.76 $5,469.76 1.0000 $5,469.7617 $0.00 $5,469.76 $5,469.76 1.0000 $5,469.76 $0.00 $5,469.76 $5,469.76 1.0000 $5,469.7618 $0.00 $5,469.76 $5,469.76 1.0000 $5,469.76 $0.00 $5,469.76 $5,469.76 1.0000 $5,469.7619 $0.00 $5,469.76 $5,469.76 1.0000 $5,469.76 $0.00 $5,469.76 $5,469.76 1.0000 $5,469.7620 $0.00 $5,469.76 $5,469.76 1.0000 $5,469.76 $0.00 $5,469.76 $5,469.76 1.0000 $5,469.7621 $0.00 $5,469.76 $5,469.76 1.0000 $5,469.76 $0.00 $5,469.76 $5,469.76 1.0000 $5,469.7622 $0.00 $5,469.76 $5,469.76 1.0000 $5,469.76 $0.00 $5,469.76 $5,469.76 1.0000 $5,469.7623 $0.00 $5,469.76 $5,469.76 1.0000 $5,469.76 $0.00 $5,469.76 $5,469.76 1.0000 $5,469.7624 $0.00 $5,469.76 $5,469.76 1.0000 $5,469.76 $0.00 $5,469.76 $5,469.76 1.0000 $5,469.7625 $0.00 $5,469.76 $5,469.76 1.0000 $5,469.76 $0.00 $5,469.76 $5,469.76 1.0000 $5,469.7626 $0.00 $5,469.76 $5,469.76 1.0000 $5,469.76 $0.00 $5,469.76 $5,469.76 1.0000 $5,469.7627 $0.00 $5,469.76 $5,469.76 1.0000 $5,469.76 $0.00 $5,469.76 $5,469.76 1.0000 $5,469.7628 $0.00 $5,469.76 $5,469.76 1.0000 $5,469.76 $0.00 $5,469.76 $5,469.76 1.0000 $5,469.7629 $0.00 $5,469.76 $5,469.76 1.0000 $5,469.76 $0.00 $5,469.76 $5,469.76 1.0000 $5,469.7630 $0.00 $5,469.76 $5,469.76 1.0000 $5,469.76 $0.00 $5,469.76 $5,469.76 1.0000 $5,469.76
$3,737,703 $164,092.80 $3,901,795.80 $3,901,795.80 $3,983,928.00 $164,092.80 $4,148,020.80 $4,148,020.80* Financing of $2,187,000 for 13 years at a 6% interest rate and $525,000 downpayment with $1,000,000 from CEC and $125,000 from AB970** Discount Rate = 0.0%*** Financing of $2,712,000 for 13 years at a 6% interest rate and $0.0 downpayment with $1,000,000 from CEC and $125,000 from AB970
Net Present Value of PV System = Present Value of Benefits - Present Worth of Costs= $10,174,138.41- $3,901,795.80= $6,272,342.61
Cost of = Generation Total kWh Generated over Life of System
= $3,901,795.8032818560 kWh
= $0.119 /kWh
Benefit-Cost = Ratio
= $10,174,138.41$3,901,795.80
= 2.608
Payback = The period of time required for the profit or other benefits of the system toequal the cost of the initial investment.
= Year 9
Net Present Cost of PV System
Net Present Benefit of the PV SystemNet Present Cost of the PV System
Present Value of Benefits Net Cash Flows
Present Value of Costs w/o Downpayment
Financial Analysis 500 kW Crystalline Silicon (Tracking) PV Power Station - Best Case$0.22/kWhr; Discount Rate = 0.0%
Financial Analysis 500 kW Crystalline Silicon (Tracking) PV Power Station - Best Case$0.22/kWhr; Discount Rate = 0.0%
Financial Analysis 500 kW Crystalline Silicon (Tracking) PV Power Station - Best Case$0.22/kWhr; Discount Rate = 0.0%

(Place on City of San Diego Letterhead)
PROPOSAL APPLICATIONFor
City of San Diego's Proposed Brightfield ProjectSolar Power Plant at Miramar Landfill
Submitted to:Committee for Land and Airspace Management Policy (CLAMP)
MCAS MiramarInstallations and Logistics, Public Works Division
Code 5JD, POB 452013San Diego, CA 92145-2013
Submitted by:City of San Diego
Environmental Services Department9601 Ridgehaven Court, Suite 310
San Diego, CA 92123
March 1, 2001

INTRODUCTIONThe City of San Diego Environmental Services Department submits this Proposal Application to theMCAS Miramar Committee for Land and Airspace Management Policy (CLAMP) for review andconsideration of approval. The City of San Diego currently holds a lease with approximately thirty yearsremaining for the operation of the City's landfill operations at Miramar. The purpose of this application isto explore opportunities for the development of up to a 1 MegaWatt Solar Power Plant on top of cappedlandfill within the City's existing lease area. The opportunity for development of the proposed solar planthas been supported through the US Department of Energy and its "Brightfield" initiative. This programsupports local government efforts to transform existing "brownfield" sites, such as capped landfill areasthat have limited development potential into productive economic development opportunities.
For the Miramar landfill site, the development of innovative and environmentally sensitive solar powergeneration can provide a natural and cost-effective solution to energy price volatility, reliability concerns,and air quality issues currently being experienced in the energy-stressed San Diego region. In fact, basedon estimates provided through a US DOE funded feasibility study for this proposed project (see attached),energy cost savings will likely result for City operations at the Miramar site. Similarly, the MCASMiramar facility may also share in these benefits should it decide to utilize power from thisenvironmentally sensitive and technologically proven on-site resource.
The following sections of this application are directly in line with the CLAMP application guidelines, anddetail the "who", "what", "when", "where", "why" and "how" of the proposed solar power plant at theMiramar Landfill site.
PROJECT PARTICIPANTSThe lead entity for this proposed project is the City of San Diego Environmental Services Department(ESD). The ESD will finance, develop, own, operate, maintain and manage the proposed solar electricplant to be located on the Miramar Landfill.
The ESD is a municipal government entity, and was created by the San Diego City Council in 1988 as theWaste Management Department to ensure that all residents of San Diego are provided with a clean, safe,and ecologically sound environment. The ongoing priorities of the Department are public health andsafety, environmental conservation and preservation. More specifically, it pursues waste managementstrategies that emphasize waste reduction and recycling, composting, and environmentally sound landfillmanagement to meet the City's long-term disposal needs.
With a staff of approximately 450, the ESD is the City of San Diego's primary environmentalrepresentative. The Department is divided into five divisions:1. Refuse Collection:• Provides weekly-trash, and biweekly-recycling and greenery collection to more than 310,000
households in the City of San Diego.2. Refuse Disposal:• Miramar Landfill Operations• Fee Collection• Closed Landfills/Regulatory Compliance3. Environmental Programs• AB 939 Compliance• Solid Waste Code Enforcement• Curbside Recycling Planning• Support Services4. Resource Management• Community Sustainability

• Customer Service• Facilities maintenance• Fiscal Planning and Management• Human Resources• Information Technology and Education• Management Information Services• Organization Development and Training• Public Information• Safety5. Environmental Protection:• Burn Ash Site Remediation• Hazardous Materials• Asbestos/Lead Management• Storm Water Pollution Prevention
Again, the proposed solar plant at Miramar Landfill will be developed, financed, owned, operated,maintained and managed by the Environmental Programs division. Letters of support for this effort fromthe Department Director and the Mayor of San Diego are attached in Appendix A to this application.
The mission of the ESD is to sustain and improve the quality of life in San Diego. This mission isachieved through integrity, creativity, teamwork and innovative technology by dedicated and competentemployees who are committed to fully meeting community needs. The City of San Diego is dedicated todeveloping innovative environmental programs as evidenced by our acclaimed Ridgehaven GreenBuilding, refuse truck diesel-to-natural gas conversion and landfill gas liquefaction programs. Ourhousehold hazardous waste handling facility and expanded curbside recycling programs further confirmour commitment to progressive waste management principles. These activities serve to demonstrate thecommitment to the EDS mission through educating the community on technologies, services, andpractices that benefit both the environment and local businesses' bottom line. The proposed solar plant atthe Miramar Landfill continues this department mission to demonstrate technologies that are cost-effective, environmentally sensitive, and make good business sense for the department and the localeconomy.
The City of San Diego's Environmental Services Department (ESD) has served as a catalyst forsustainability in the San Diego region, pursuing its goals of fostering an environmental conservationethic, encouraging the use of recycled products, significantly reducing energy and water consumption,and promoting a transition to renewable energy sources.
The ESD has taken a cooperative, integrative approach, forming partnerships with the local electricutility, state and federal governments, nonprofit organizations, and private companies to pursuegreenhouse gas reduction and green building projects that demonstrate to the community the value ofcollaboration. This cooperative approach is being employed for the proposed solar plant at MiramarLandfill through partnerships with the US DOE, potential additional funding support from the CaliforniaEnergy Commission, and collaboration with the local electric utility.
The US DOE is supporting this proposed project via its "Brightfield" initiative. One of DOE's missions isto support the development and commercialization of cost-effective renewable energy technologies thatdemonstrate environmental benefits and support local economic development through the transformationof local sites that are currently unavailable for development. The proposed solar plant for the MiramarLandfill site is directly in line with this mission, and as such, the DOE has provided programmaticsupport as well as funding to develop a feasibility study and design assistance for the proposed project. A

letter of support from the US DOE's Assistant Secretary of Energy Efficiency and Renewable Energy isattached in Appendix A.
PROJECT DESCRIPTIONThe City of San Diego proposes to develop, finance, own, operate, maintain and manage a solar electric(photovoltaic) power plant, up to 1 MegaWatt in size, on MCAS Miramar land currently leased to theCity for its landfill operations. The plant will be sited on a capped area of the landfill that currently haslimited options for development. Photovoltaics, or PV arrays, are a technologically proven powergeneration source, and are environment friendly. PV power sources do not emit air emissions, do notrequire cooling water as with conventional power plants, do not require extensive site preparation,produce no waste from their operation, and do not pose any reflectivity issues with respect to air trafficflight patterns. An example of the type and layout of the PV system proposed for this site is depicted inthe picture below.
The City is currently exploring several system sizingoptions for the plant, including array configurationswith output capacities of 200 kW, 500 kW and 1MW. The City is also investigating several systemtypes, including amorphous silicon PV modules witha fixed axis stationary mount, crystalline siliconmodules with a fixed axis stationary mount, andcrystalline silicon PV modules utilizing a trackingsystem mount. At this time, it appears that thecrystalline silicon modules with tracking systemconfiguration may be the best candidate system forthis site based on its economic and peak periodperformance characteristics. The preliminary system
design developed for the 1 MW PV plant specifies 10 rows of 100 kW arrays each to maximize systemperformance and reliability. System components for a 1 MW crystalline silicon PV plant with a trackingsystem mount would include:• 4,320 300 watt crystalline silicon modules (432 parallel strings of 10 in series) in 10 sub-arrays;• 10 Trace 100 kW line tied inverters (1 per sub-array);• 10 single axis azimuth tracking mount structures; and• Balance of system components (hardware, wire, disconnects, metering, and NEC required
components).Schematic diagrams of a 1 MW PV system detailing the preliminary system design are included in thefeasibility study provided as a supplement to this application. Smaller systems under consideration (i.e.,200 kW and 500 kW) would include the same system components, but the number of each of thecomponents would be reduced proportionately.
The estimated capital cost of the 1 MW PV plant with tracking system is ~$7.4 million. Results from thefeasibility study for this proposed project indicate that power from this system configuration can begenerated at a busbar cost of under 15 cents per kWh. Current utility energy costs in the San Diego regionfor large General Service customers are averaging in the 18-22 cent per kWh range. The City plans toutilize a portion of the PV system output to power loads at the existing Miramar Landfill Fee Station toprovide net savings on the utility bills for this account. However, the Fee Station consumes less than 2.5%of the annual output of the largest proposed PV plant size.
Benefits to the MCAS Miramar could potentially be accrued through similar reductions in utility bills if itopted to utilize power generated by the on-site PV plant. Significant reductions in utility bills could berealized particularly in the peak summer months when PV plant output is highest, and has a high degree

of coincidence with high cost utility peak power periods. For example, during the summer of 2000, peakutility energy costs spiked up to the 75-80 cent per kWh range. In addition, MCAS Miramar may alsobenefit from the additional voltage support provided to the local power distribution system by theproposed PV plant. A more thorough discussion of the economics of solar electricity purchases by MCASMiramar is contained in the feasibility study included with this submittal.
PROJECT TIMELINEThe City of San Diego proposes an aggressive schedule for the proposed project’s implementation. Uponapproval of the project through MCAS Miramar’s CLAMP application process, the City will immediatelyinitiate the necessary environmental review, consultant selection, project design and construction processutilizing an expedited process. It is anticipated that this process will take approximately 18 months frominitiation to acceptance of the completed project. This timeline does not include provision for federalenvironmental review nor a modification to the current Ground Lease. It is anticipated that these actionsmight be required, and that they could be run in parallel where possible to expedite the process.
The proposed plant will have a project life of a minimum of thirty years. This thirty-year period coincideswith the remaining years left on the existing lease to the City from MCAS Miramar for its landfilloperations. At the end of the thirty-year period, the City will assess the performance of the plant todetermine if it should be decommissioned to recover any salvage value, or if the power plant operationsshould be continued by the City, a third party, and/or MCAS Miramar. Any decommissioning orconveyance of the facility will take place in conformance with the terms and conditions in Section 9“Maintenance and Restoration” of the Ground Lease.
PROJECT SITINGBased on an analysis of the site characteristics at the Miramar landfill, two potential sites have beenidentified for the location of the solar plant. Site One is adjacent to the cogeneration plant near the SludgeDewatering Facility. Site Two is adjacent to the Fee Station at the northern end of South MiramarLandfill. The boundaries of these two potential sites are clearly marked in the two maps provided assupplemental materials to this application package. For more detail on each of these site's characteristicsplease refer the feasibility study supplement.
The amount of acreage required for the project will depend on the final system size and technologyselected. For example, a 1 MW crystalline silicon array would require approximately 6.5 acres ofavailable land, while a 1 MW amorphous silicon array would require approximately 13 acres. Smallersystem sizes will reduce the acreage requirements proportionately.
PROJECT PURPOSE, NEED AND BENEFITSThe purpose of this project is to convert capped landfill area with limited development potential into aproductive, economically viable, and environmentally sensitive electrical power generation facility. Thisfacility will provide benefits to the City, MCAS Miramar, and the community at large. One of the majordrivers behind the need for this project is the current energy situation in the San Diego region. Since thespring of 2000, the San Diego area has been hit hard by volatile energy prices caused by a restructuredenergy industry. Electricity price spikes during the summer of 2000 were as high as 75-80 cents per kWh,and at year-end, prices still remain well over 60% above those of the previous year. With California Stateand other Federal and local incentives, solar electric generation, at a generation cost of under 15 cents perkWh, can easily beat these volatile prices.
While the largest of the proposed plants (1 MW) is small in relation to San Diego's overall energy needs,it can play a role in meeting the need for more power generation in the region. The use of solar power canbypass many of the development hurdles that block most conventional power plants. In fact, with

available land for new generation sites extremely scarce in the San Diego region, the proposed solar plantat the MCAS Miramar landfill site provides an historic opportunity to demonstrate cost-effective, zeroemission generation technology. Once successful, this project can serve as model for the development ofadditional solar plants in the region to bring fast track sources of power into the energy stressed region.
The benefits of this proposed project to the City include developing a cost-effective source of power thatwill provide utility bill cost savings to the Landfill Station. In addition, this project is directly in line withthe Department's mission of demonstrating and promoting the use of technologies to provide a clean, safe,and ecologically sound environment for the residents of the region.
Finally, the MCAS Miramar will be provided a number of benefits through the successful development ofthis project. First and foremost, the MCAS Miramar facility may be provided utility cost savings should itopt to utilize power generated from the solar plant. Recently, one large power marketing company hasbegun to offer 5 year, fixed price power contracts to large customers in California at a rate of 11.7 centsper kWh. The solar plant proposed at the Miramar Landfill is competitive with this offering, and wouldcertainly provide utility cost savings if utilized to offset power purchases via the existing SDG&E Time-of-Use (T-O-U) rate tariff. It should be noted that purchases of solar electric power should be evaluatedagainst the SDG&E retail rate, which are significantly higher than the current rates charged to MCASMiramar via the Public Works Center. Based on the current T-O-U rates charged by SDG&E, and theexpected increases to be passed on by the PWC to Miramar in the future, solar electricity from theMiramar Landfill could provide MCAS Miramar with cost savings in the short term, and hedge againstfuture price increases in the long-term.
In addition, should the MCAS Miramar facility chose to utilize power from the solar plant, it would assistin meeting the energy goals specified in Executive Order 13123 - which calls for a 30% reduction ingreenhouse gases via utilization of energy efficiency and/or renewable energy technologies. Lastly,should this project proceed, the MCAS Miramar would enjoy a positive public perception throughsupporting common community energy goals of developing environmentally sensitive generationtechnologies that reduce San Diego's peak demand and its associated high costs.
Project Lease AgreementsThe City proposes to site the solar plant on top of capped landfill area currently under lease from MiramarMCAS for City landfill operations. Therefore, the City does not anticipate the need to enter into anyadditional land leases for this project, as the site proposed would fall under the existing lease agreementwith the City of San Diego.

Appendix A:Letters of Endorsement