millimetre and submillimetre continuum … a showed that their ... 6.5.3 implications of the scuba...
TRANSCRIPT

MILLIMETRE AND SUBMILLIMETRE
CONTINUUM IMAGING STUDIES
OF NEARBY ACTIVE GALAXIES
LEROTHODI LEONARD LEEUW
Thesis
for
DOCTOR OF PHILOSOPHY
Centre for Astrophysics
UNIVERSITY OF CENTRAL LANCASHIRE
JUNE 2002

Abstract
The thesis presents millimetre (mm) and submm continuum imaging observations of the
four, nearby active galaxies Cygnus A, NCC 4374, Centaurus A and M 82. These were
undertaken using the Submillimetre Common-User Bolometer Array (SCUBA) on the
James Clerk Maxwell Telescope in Hawaii. The study focused on the properties of the
cool to cold dust 80 to 10K) and its associations with star formation and nuclear
activity in the galaxies.
The observations of Cygnus A constrained the galaxy's cold dust temperature be-
tween 37 and 85K, corresponding to dust masses between 1.0 x 10 8M® and 1.4 x 10⁶M®
respectively. Based on the dust spatial and mass limits, it is possible the heating of the
cold dust in Cygnus A is dominated by high-energy nuclear activity or star formation.
Detailed photometric observations of the core and two major hotspots (A and D) in
Cygnus A showed that their mm to submm spectral indices extend smoothly to about
450pm (677GHz), with no evidence of spectral steepening. The results allow tight deter-
minations for model parameters of synchrotron electron lifetimes in these components.
In pilot survey observations of the elliptical galaxy NGC 4374, a mass upper-limit
of 2 x 10⁷M® (i.e. comparable to the dust contents of luminous spiral galaxies) was
placed on the diffuse dust that, if it exists, would affect colour and metallicity studies

of elliptical galaxies. Following the pilot observations, a strategy was devised to select a
good sample of ellipticals in which to search for this low-level, very cold dust.
For the first time ever, the observations of Centaurus A delineated the galaxy's submm
unresolved core, an inner-jet interacting with gas in the dust lane, and extended emission
from multi-temperature cold dust at ". 40, 30 and 12K. Also for the first time ever, a
submm high surface brightness ringed, spiral structure of radii n.j 90", that coincides with
the regions of intense star formation and mid-infrared continuum, was revealed in the
optical dust-lane, confirming predictions by a geometric warped disc model consisting of
tilted rings. From the spatial associations in the galaxy, star formation seems to dominate
at lease 50% of the heating of the cold dust, while the rest appears to be heated by diluted
stellar radiation.
In M82, the 850pm continuum has been detected out to 1.5kpc, at least 10% farther
in radius than previous detections in this starburst galaxy. The overall submm morphol-
ogy and nuclear spectral index distribution have a general north-south asymmetry similar
to that of H. and X-ray winds, supporting the association of the extended continuum
with outflows of dust grains from the nucleus into the halo. The work of M 82 raises many
interesting points about the origin and structure of the submm emission, however the
results are displayed here still under investigation and therefore are rather preliminary.
In short, the submm continuum observations of Cygnus A, NGC 4374, CentaurusA
and M 82 are presented in this thesis that constrain the physical properties of cold dust
in these active galaxies and elucidate the associations of the dust with star formation,
nuclear activity and stellar components in these galaxies in particular, and other similar
galaxies in general.
II

Contents
Abstract
1
Acknowledgements xv
Dedication .......................................xv
1 Introduction 1
1.1 The Revolution of Submm Astronomy with SCUBA ............1
1.2 The Submm Galaxies Studied Here ......................2
1.3 The Nature of Submm Continuum Emission ................5
1.3.1 Thermal Re-radiation from Dust ...................6
1.3.2 Synchrotron Radiation from Relativistic Electrons .........9
1.3.3 Free-free Radiation from lonised Gas .................13
1.4 Summary of Thesis and Collaborations ....................16
2 Millimetre and Submillimetre Continuum Techniques 17
2.1 Preface .....................................17
2.2 SCUBA on the JCMT .............................19
2.2.1 SCUBA Bolometers ..........................20
2.2.2 SCUBA Filters .............................21
111

6.5 Origin of Submm Continuum Morphology and Spectral Index Distribution 124
6.5.1 Source and Structure of the Nuclear Submm Continuum ......124
6.5.2 Possible CO Contamination of the Submm Continuum? ......126
6.5.3 Implications of the SCUBA maps on the Outflow of cold Dust . . 128
6.6 Exploratory Analysis of MEM and the 180" Chop Throw .........132
6.6.1 Can MEM reprocessing Improve SCUBA Images7 .........132
6.6.2 Are MEM-reprocessed—SCUBA Peaks of M 82 Reliable 7 ......135
6.6.3 Does a 180" Chop Throw Improve the Submm Image of M82? . . 141
6.7 Summary of Results and Future Work on M 82 ...............146
7 Summary of Thesis Results and Future Work 151
7.1 Outline of SCUBA Results and Follow-on Work ...............152
7.1.1 Outline of Future Submm Polarimetry with SCUBA ........158
7.2 Plans for Future Observational Work with SIRTF .............. 159
Bibliography 178
vi

2.2.3 SCUBA Optics and Image Sampling . 22
2.2.4 SCUBA Observing Modes .......................23
2.3 Millimetre and Submm Extinction Correction ................24
2.3.1 Calculating Sky Opacities with SCUBA ...............26
2.4 Sky-Noise Removal in the Millimetre and Submm ..............29
2.5 Millimetre and Submm Flux Calibration ...................30
2.5.1 Flux Calibration with SCUBA ....................31
2.6 IRAS reprocessed Data ............................32
2.6.1 HIRES ..................................32
2.6.2 SCANPI .................................33
3 Millimetre and Submillimetre Continuum Observations of the Core and
Hotspots of Cygnus A 34
3.1 Introduction ...................................34
3.2 Observations ..................................36
3.3 Results and Discussion .............................42
3.3.1 The Hotspots ..............................42
3.3.2 The Core Component .........................44
3.3.3 Cold Dust in Cygnus A ........................45
3.4 Summary ....................................48
4 SCUBA Observations of the Elliptical Galaxy NGC 4374 50
4.1 Introduction ...................................50
4.2 Observations and Reductions .........................53
4.3 Results and Discussion .............................54
iv

4.3.1 Decomposing the SED . 56
4.3.2 Dust Mass and its Implications ....................61
4.4 Conclusions ...................................63
5 Direct Imaging of Cold Dust Structures in Centaurus A 65
5.1 Introduction ...................................65
5.2 Observations ..................................67
5.3 The Submm Images and Comparisons with other Wavelengths ......69
5.3.1 Submm vs. Optical Morphology ...................76
5.3.2 Submm vs. ISO Mid-JR Morphology ................78
5.3.3 Submm vs. IRAS Far-JR Morphology ................79
5.3.4 Submm vs. Warped-Disc—Model Morphology ............82
5.4 The Submm Spectral Index Distribution ...................87
5.5 Implications of the Multiwavelength Images .................92
5.6 The Extended Emission Temperature and Dust Mass Estimates ......95
5.7 The Unresolved Core: Radio to Optical SED ................99
5.8 Conclusions ...................................101
6 Properties and Outflows of Cold Dust in M 82 104
6.1 Introduction ...................................104
6.2 Observations ..................................110
6.3 The General Submm Continuum Morphology ................111
6.3.1 Submm vs. Optical Morphology ...................114
6.3.2 Submm vs. High-Resolution CO (1-0) Morphology .........116
6.4 The Nuclear Spectral Index Distribution ...................119
v

List of Tables
2.1 Overview of JCMT and Atmospheric Parameters ..............19
2.2 Typical CSO relations used in this thesis project ..............28
2.3 New CSO relations derived October 2000 by JCMT staff ..........29
2.4 Illustrative HIRES Resolutions after 1 and 20 iterations ..........33
3.1 SCUBA Fluxes of Cygnus A's Core and Hotspots ..............38
4.1 Submillimetre fluxes for NGC 4374 from SCUBA ..............54
4.2 Parameters determined from the model fit to the SED for NOC 4374 . . . 61
5.1 Submm to Mid-IR Fluxes of the CentaurusA Core and Extended Emission 96
vu

List of Figures
1.1 Cygnus A plumes, jet and hotspots as seen in the radio 3
1.2 The dust lane in CentaurusA as seen in an optical image .........4
1.3 An illustrative thermal spectrum of Arp 220 .................8
1.4 A typical self-absorbed synchrotron spectrum of a radio source ......13
2.1 Atmospheric transmission as a function of frequency in the submm window 18
2.2 Pixel layout of the SCUBA arrays ......................20
2.3 The jiggle pattern used to fully sample the SCUBA maps .........23
3.1 The hotspots and central core of Cygnus A at 850pm ............39
3.2 The hotspots and central core of Cygnus A at 750 pm ............40
3.3 The hotspots and central core of Cygnus A at 450pm ............41
3.4 The spectral energy distribution of hotspots A and D in Cygnus A . . . . 42
3.5 The spectral energydistribution of the central core in Cygnus A ......45
3.6 The continuum spectrum of the core in Cygnus A that includes ISO fluxes 46
4.1 The SCUBA 850pm image of NGC 4374 ...................55
4.2 Spectral energy distribution for the core of NGC 4374 ...........57
5.1 "Jiggle-mapping" image of CentaurusA obtained with SCUBA at 850pm 70
viii

5.2 "J iggle- mapping" image of CentaurusA obtained with SCUBA at 450pm 71
5.3 "Scan-mapping" image of CentaurusA obtained with SCUBA at 850pm . 72
5.4 Profiles of the emission from CentaurusA at 850 and 450pm .......73
5.5 The 4501im contours superposed on an optical image of CentaurusA . . . 74
5.6 The 450pm contours of CentaurusA superposed on a 7pm ISOCAM image 78
5.7 The 450pm contours of CentaurusA superposed on the 100pm IRAS-
HIRES image ..................................80
5.8 F/lAS reprocessed 12, 25, 60 and 100pm images of CentaurusA .....81
5.9 The 850pm map of CentaurusA superimposed with contours of the warped-
disc model by Quillen et al. (1993) ......................83
5.10 The face-on morphology from the warped-disc model by Quillen et al. (1993) 84
5.11 The warped-disc model of CentaurusA by Quillen et al. (1993) plotted
with scale heights of 0.06 and 0.14 ......................86
5.12 Map of the submm spectral index distribution of Centaurus A .......88
5.13 Integrated fluxes in two annuli centred on the core of CentaurusA . . . . 98
5.14 The spectral energy distribution of the central core in CentaurusA . . . . 100
6.1 The H. outflows from M82 imaged using the Subaru Telescope ......105
6.2 The natural-colour composite of the central region of M82 reconstructed
from photographs obtained with the Hubble Space Telescope ........ 107
6.3 Deep maps of M82 at 850 and 450pm, obtained with a 120" chop throw . 112
6.4 Map of M82 at 3501im, obtained with a 120" chop throw .........113
6.5 The central 76" x 56" region of M82 at 850 and 450 pit overlaid with
high-resolution CO (1-0) contours .......................117
ix

6.6 The submm spectral index map of M82 overlaid with 850 pm contours . . 121
6.7 The submm spectral index map of M82 overlaid with high-resolution
CO (1-0) contours ................................123
6.8 The velocity-integrated intensity contours of SiO (2-1), overlaid on the
5GHz continuum image of M82 (Garcfa-Burillo etal., 2001) .......131
6.9 Original and MEM maps of CRL 618 and Centaurus Aat 450 pm .....133
6.10 The MEM-reprocessed, 850 pm map of nuclear peaks in M82 with the
original SCUBA 850 and 450 pm contours overlaid . . . . . . . . . . . . . . 136
6.11 The MEM-reproceised, 450 and 350 pm maps of nuclear peaks in M82
with the original SCUBA contours overlaid . . . . . . . . . . . . . . . . . . 139
6.12 Maps of the 180" chop throw, 850 and 750 pm continuum emission centred
at the near-infrared nucleus of M 82 .....................142
6.13 Maps of the 180" chop throw, 450 and 350 pm continuum emission centred
at the near-infrared nucleus of M 82 .....................143
7.1 Contours of the 450pm image superposed on (a) an optical waveband
image and (b) a 7pm ISOCAM negative image of CentaurusA ......162
x

Acknowledgements
The University of Central Lancashire (UCLan) is acknowledged for a fruitful Ph.D. pro-
gram that was supported by a full-time university research studentship. The Joint As-
tronomy Centre (JAC) in Hawaii is also acknowledged for their hospitality and "aloha"
during the acquisition and analysis of data for this Ph.D. research. Profs. E. Ian Rob-
son (Director of the JAC), Gordon E. Bromage (Head of the Centre for Astrophysics,
UCLan) and Mike C. Holmes (Head of Department of Physics, Astronomy and Mathe-
matics, UCLan) arranged and supported the complicated logistics of a Ph.D. undertaken
both in England and Hawaii by a South African national.
Prof. Robson is acknowledged as director of studies and for providing his Director's
Discretionary Time that ensured extensive telescope-observing experience was gained and
new data obtained for this thesis and invariably many other unrelated programs. His
enthusiastic encouragement, whether given in person or 'beamed' by email or fax across
one ocean or two, led to new results that were presented in several refereed scientific
journals and at international conferences. His guidance allowed for the development
of an independent research initiative that should yield further scientific advancements
in the future. For the publications of work on NGC 4374 and CentaurusA, fruitful
collaborations are acknowledged with the leading co-authors Drs. A. E. Sansom and
xi

H.E. Matthews, respectively, as well as many others as noted in the relevant papers. The
referees and scientific editors of the relevant publications are acknowledged for invaluable
comments that improved the final quality of the published papers.
Drs. T. Jenness, R. Tilanus, M. J. Currie, D. S. Berry advised in the full exploitation
of SURF and other Starlink Project software packages used in data analysis. Drs. G.
Sandell, R. Ivison, W. Holland and E. Archibald gave needed guidance in the acquisition
and exploitation of SCUBA data. Very useful scientific discussions were had with, among
others, Drs. T. Hawarden, D. Hughes, A. Quillen, A. Eckart and J. Stevens. The JCMT
Telescope System Specialists too assisted during many long nights up Mauna Kea.
Work at the JAC was very enjoyable, made especially so by the friendships forged
with the support staff there and many Canadian co-op students who did their "work-
studies" at the centre. Special mention goes to Erik Starman for good times away from
work and to Aunties Donna, Marge and Anna for their "aloha". Also in Hilo, Hawaii,
but outside the JAC, special mention goes to the crew at Cronies Bar and Grill, noting
Shea, Layne and Ken for many eventful nights, and also friends at the Naniloa Paradise
SPA for cool and relaxing hours.
Work at UCLan was also quite exciting. Special mention here goes to Bill, Cormac,
Gabriel, Greg and Giulio for most memorable times at work and around Preston. Dr.
A. Stirling provided lodging at a big discount when University funding ran out in the
final stages of the Ph.D. The UCLan International Student Office (Maria and Diana) is
thanked for assisting in arranging visa extensions and emergency funding during those
crucial final months of the Ph.D. For numerous supporting letters and general assistance
during the entire Ph.D., Mrs. Fiona Mair and her colleagues in the UCLan Academic
Records are also acknowledged.
xii

Due to illness that began midway through the program, the "writing-up" of work
presented here took longer than the expected completion time for a Ph.D. at UCLan.
Physicians in Hawaii, in particular Drs. Arakawa and Adee, and at the UCLan Health
Services are acknowledged for trying in vain to treat this still undiagnosed but now
improved ill-condition, that to much frustration causes pain when typing, thus hampering
progress on work at the computer. Many thanks goes to Lynn C. and Mona C. for helping
with typing some 40 pages (between them) of the thesis in the final "writing-up" stages.
The Ph.D. examiners are acknowledged for recommending pointed changes to the
originally submitted manuscript, the incorporation of which have improved the quality
of this thesis. Dr. T. V. Cawthorne is thanked for his role as second supervisor and
for advice on many aspects of this Ph.D., in particular for his critical reading and pa-
tient discussion of the thesis leading to the incorporation of the examiners recommended
changes.
Overall, the Ph.D. program was an enriching academic and memorable social expe-
rience. The Leeuw family are, acknowledged for unwavering and visionary guidance on
matters both in and outside school. Much gratitude goes to numerous, dear friends for
their boundless love and encouragement. Once again UCLan and the JAC are thanked
for providing the opportunity and support for this Ph.D.
Observations presented in this thesis extensively used the James Clerk Maxwell Tele-
scope (JCMT), which is operated by the JAC on behalf of the United Kingdom Particle
Physics and Astronomy Research Council, the Netherlands Organization for Scientific
Research and the Canadian National Research Council. The data analysis was under-
taken using the dedicated SCUBA data reduction software SURF, as well as KAPPA,
GAlA, FIGARO and CONVERT software packages provided by the Starlink Project.
xlii

The Starlink Project is run by the Council for the Central Laboratory of the Research
Councils on behalf of the Particle Physics and Astronomy Research Council of the United
Kingdom. This research has made use of Infrared Astronomy Satellite (IRAS) data that
were re-processed using HIRES and SCANPI routines at NASA/IPAC, which is operated
by the Jet Propulsion Laboratory, Caltech, under contract to the National Aeronautics
and Space Administration. Use was also made of data from ISOCAM, the infrared im-
ager on the Infrared Space Observatory (ISO), which is a European Space Agency (ESA)
project with instruments funded by ESA member states and with participation of ISAS
and NASA. Dr. F. Mirabel is acknowledged for providing the reduced ISOCAM data.
An optical waveband (395 and 540 nm) image courtesy of the Anglo-Australian Obser-
vatory was also used. This research has also made use of the NASA/IPAC Extragalactic
Database (NED) which is operated by the Jet Propulsion Laboratory, California Institute
of Technology, under contract with the National Aeronautics and Space Administration.
xiv

DEDICATION
To my late mother and father
to whom
I owe all my education and good life
xv

Chapter 1
Introduction
1.1 The Revolution of Submm Astronomy with SCUBA
Until the mid-1990's, the only instruments available for the submillimetre (submm) wave-
band continuum astronomy were single-pixel, broadband photometers. With these, such
as UKT14, which operated on the United Kingdom Infrared Telescope (UKIRT) and
the James Clerk Maxwell Telescope (JCMT) from 1984 to 1988 and 1988 to 1996 respec-
tively, mapping extended regions of the sky was very slow, and instrument sensitivity was
detector-noise limited. The thesis project described here began in late 1997, during the
final commissioning of the JCMT's new submillimetre continuum pixel-array, SCUBA
(Holland et al., 1999).
SCUBA is the first large-scale submm array designed for submm astronomy. It is
mounted on the world's largest submm telescope, which is well supported by scientific and
technical staff, and has a dedicated suite of data reduction software making data analysis
and hence publication of scientific results readily achievable. As recently reviewed by
Robson (2001), SCUBA has opened up submm observational astronomy, one of the last
1

unexplored windows on the physical Universe. It has truly revolutionised at least two
main areas of astrophysics: galaxy evolution in the early Universe (e.g. Small et al.,
1997; Barger et al., 1998; Hughes et al., 1998) and dust discs around main-sequence stars
(Holland et al., 1998; Greaves et al., 1998), and dramatically extended large-scale survey
programmes addressing star formation (e.g. Johnstone & Bally, 1999; Pierce-Price et al.,
2000). In addition, it has made significant contributions to the study of galaxies in the
nearby Universe, particularly in the investigation of the variability and nature of non-
thermal radiation from compact extragalactic structures (e.g. Robson et al., 1998) and
the properties and distribution of submm thermal re-radiation from cool dust in nearby
galaxies (e.g. Alton et al., 1999; Israel et al., 1999; Leeuw et al., 2002), which is the focus
of this thesis.
1.2 The Submm Galaxies Studied Here
The original thesis project was to investigate non-thermal and thermal emission from a
small sample of nearby galaxies using SCUBA. In part, this was only partially successful
due to observing and time constraints. Eventually, the thesis focuses on the cool to cold
dust component of a smaller selection of galaxies, ie. CygnusA, NGC4374, CentaurusA
and M82, which all lie in the nearby Universe, within < 200 Mpc of our galaxy.
The galaxies have active nuclei and other interesting properties, mostly discovered in
wavelengths other than the submm. Cygnus A, NGC 4374 and Centaurus A have jets and
lobes seen in the radio and X-ray wavelengths, while M82 has starburst associated, large-
scale outflows seen in emission-line and X-ray observations. The radio image of the jet
and lobes in CygnusA, courtesy of the National Radio Astronomy Observatory (NRAO),
is shown in Figure 1.1, while the optical image of the dust lane in CentaurusA, courtesy
2

- :
'0
of the European Southern Observatory (ESO), seen obscuring the galactic stellar corn-
ponent, is shown in Figure 1.2. These galaxies were expected to emit submm thermal
re-radiation from cool dust because they have dust lanes discovered in optical studies
and generally emit copious far-infrared emission detected in Infrared Astronomy Satellite
(IRAS) observations. They were also expected to emit some non-thermal submm radi-
ation, most likely associated with their radio compact nuclei, but perhaps also their jets
and lobes
• 1 .. ::c:1r' '' •
I
• -. .: •,
.
I
I -
•_%LI_ H" .z
-
Figure 1.1: Cygnus A plumes, jet and hotspots as seen in the radio, courteiy of NRAO.
The goal with the current Cygnus A observations was to investigate suggestions that
the origin of the IRAS excess emission in the galaxy was thermal radiation from cool dust
(e.g. Salter et al., 1989). As the entire galaxy, including the radio lobes and the hotspots,
fits on the instantaneous view of the SCUBA array, the hotspots' submm spectral energy
distribution was also to be investigated. In NGC 4374, which is an elliptical galaxy, the
existence of lower level diffuse dust was explored following suggestions by Goudfrooij
(1994) that IRAS fluxes did not account for all the dust mass estimated from optical
3

Cenmunis A Radio Galaxy (VLT KUEYEN + FORS2)
}SO PR Nun O1M (8 Fdxuay2l) C Eutoptin SUUdXN1, Ocntcq
Figure 1.2: The dust lane in CentaurusA as seen in an optical image, courtesy of ESO.
extinction observations of this galaxy and other ellipticals.
The dusty nuclear regions of M 82 and Centaurus A were previously mapped in the
submm regime with UKT14, respectively by Hughes et al. (1994) and Hawarden et al.
(1993). The observations achieved understandably limited success, particularly in spa-
tial extent, as this single-pixel predecessor of SCUBA, though excellent during its time,
was relatively less sensitive and not efficient for mapping. The current imaging study
was intended to extend the previous observations in spatial extent, sensitivity and in all
the four wavelengths available with the SCUBA array. As these two galaxies are espe-
4

cially nearby, only about 3Mpc away, they allow for high resolution imaging. Therefore,
structure and physical properties of the emitting regions can be constrained.
Nearby galaxies were targeted for observation with the goal of exploiting the new
submm imaging capabilities of SCUBA in making simultaneous, dual wavelength maps
at moderate-to-high resolution. The dual wavelength observations, which can be obtained
simultaneously at 850 and 450pm or 750 and 350pm, allow submm spectral index dis-
tribution maps to be computed, and the relatively high resolution allows structure of
the emitting regions to be delineated. Therefore, the radiation mechanisms responsible
for the emission structures could be distinguished and the physical characteristics of the
mechanisms could be studied over extended spatial scales and in specific parts of the
galaxies. For example, in the case of emission from dust re-radiation, the temperatures
(or grain emissivijy) and mass content of extended, discrete dust regions in the nearby
galaxies could be determined. It is noted that galactic dust grains may be reasonably
assumed to contain simply a fixed fraction, e.g. r.s 50%, of the heavy metals in the inter-
stellar medium (e.g. Edmunds & Eales, 1998; Edmunds, 2001), so studying the dust-mass
content, especially at all temperatures, is an essential aspect of the investigation of galac-
tic metallicity and the interstellar medium in general.
1.3 The Nature of Submm Continuum Emission
Millimetre and submm observations are essential for studies of thermal re-radiation from
cool dust in astrophysical objects, as it is in the submm that the cold dust radiates
strongest. Another thermal process that is potentially significant in the mm to submm
regime is free-free or bremsstrahlung emission from ionised gas. This emission can be
particularly important at the longer, mm wavelengths, especially in sources where the

bulk of the luminosity comes from regions of star formation (Kronberg et al., 1985).
Non-thermal, synchrotron emission from extragalactic structures such as compact nuclei,
jets and lobes, that are features of radio-loud active galaxies, also radiates in the mm to
submm region. This is usually an extrapolation of the high frequency radio synchrotron
spectrum which may be found to steepen in the submm. This steepening spectrum is a
manifestation of ageing high energy synchrotron electrons, and submm observations can
place crucial limits on the electron spectral energy distributions in this regime.
In this section, the thermal re-radiation from cool dust is presented first, as it is
the dominant emission mechanism responsible for the submm continuum in the sources
selected here. Following this, synchrotron and free-free mechanisms are presented in turn.
1.3.1 Thermal Re-radiation from Dust
Dust grains absorb ultraviolet through optical to infrared electromagnetic radiation.
They are efficient absorbers at wavelengths less than or equal to their physical sizes but
are transparent at longer wavelengths. The grains are heated to a temperature which
is determined by the balance between the energy absorbed from the radiation field and
their rate of radiation. In other words, heated by incident radiation, the grains attain
thermal equilibrium and radiate effectively like greybodies. This radiation is given by the
Planck function modified by the frequency dependent emissivity function of the grains
and is written as c(v) = tc(v)B(v), where B(v) is the Planck function and n(v) is the
emissivity of the grains (Longair, 1997).
To a good approximation, r(v) oc z' at wavelengths less than 100pm and oc v 2 at
wavelengths longer than 100pm (Hildebrand, 1983). The cool grains are heated to typi-
cally 30 to 100 K and radiate their peak emission at wavelengths of about 30 to 100 pm,

while the colder grains reach only 10 to 30K and radiate their peak emission at 100 to
300pm. Longward of the peak emission, the thermal spectrum is a good approximation
of the Rayleigh-Jeans tail of the blackbody function. At these wavelengths, the dust is
transparent. Therefore, the energy is radiated very efficiently, and the emission can be
seen to great depths (Longair, 1997). This picture explains why galaxies selected for
study here have not only dust lanes but also emit copious IRAS-detected, far-infrared
emission. The fact that the dust re-radiation is optically thin means that any
resolved, detected dust emission could potentially reveal structure deep in the
galaxy. Such structure, imaged extensively for the first time in the submm
(and in some cases for the first time in any waveband) will be presented in this thesis.
For a given dust temperature Td,t, the flux density S takes the form
SV = Q _____ [1 - exp(_(t)P)], c2 exp( h - 1 V0
where Q is the solid angle for the emitting region, v0 the frequency at which the opti-
cal depth is unity and 0 the emissivity index of the grains. Extensive observations of
molecular dust clouds have shown that 0 values range from 1 to 2. As an example, a
thermal dust emission spectrum is shown in Figure 1.3, fit to the submm to infrared data
of Arp 220. The figure illustrates that, as it turns out, Arp 220 is a remarkably good
source to fit the thermal function given in equation 1.1. The fit indicates a temperature
of 61K and /3 = 2 with the optical depth being 1 at 180 pm and 0.26 at 350 pm(Emerson
et al., 1984). As noted earlier, longward of the spectral turnover or peak, the flux density
follows a Rayleigh-Jeans, power-law decline, S oc v° , where a = j3 + 2, while shortward
of the peak, the flux follows the Wien, exponential fall.
7

Wavelength (microns) 104 1000 100 10
f
I I I I I I I T-
4
io 10 1 C)6 10' loB
Frequency (MHz)
Figure 1.3: An illustrative thermal, 61K dust emission spectrum fit to the submm-to-infrared data of Arp 220 (c.f. Emerson et al., 1984). The data are courtesy of NED, the NASA/IPAC Extragalactic Database.
When the distance to a source is known and the flux density, emissivity index, and
temperature for the thermal emission from the source are determined, the mass of the
emitting dust Md can be derived. Using a simple relation adapted from Hildebrand
(1983), the dust mass is written as
Md = SD2 (1.2)
kdB(v, T)'
where Sv is the measured flux, D the distance to the source, B(v, T) the Planck function
and kd = 3Q/4ap the grain mass absorption coefficient with a and p being respectively
100
10
>1
-I
0,
0 x
0.1
0.01

the grain radius and density.
Unfortunately, the advantage of using optically thin submm emission to determine
the dust mass is offset by the increased uncertainty of the grain emission efficiency, Q,
and subsequently of kd, as A is increased from the far-IR to submm wavelengths (Draine,
1990). A different choice of lea could result in an estimation of the dust mass that differs
by a factor .- 2 (c.f. Hughes et al., 1997). Based on Hildebrand (1983) and Draine
(1990), the commonly accepted values of ksoMm =0.25 m2kg' and k ° " = 3.3 m2kg'
are assumed in this thesis and the dust masses derived using equation 1.2.
1.3.2 Synchrotron Radiation from Relativistic Electrons
Synchrotron radiation refers to emission that results from the acceleration of relativistic
electrons in a magnetic field. In the non-relativistic domain, the radiation from the
electron, which is called cyclotron radiation, is a dipole in the rest frame, corresponding
with the strength of the electric field as a function of angle with respect to the velocity
vector of the electron. The non-relativistic magnetic force on the electron is F = Bev,
where B is the magnetic field strength, e is the charge on the electron and v is the velocity
of the electron. The orbital (centripetal) force on the spiralling electron is F = me v2/r,
where m is the mass of the electron and r is the orbital radius. Equating the magnetic
and orbital force, the frequency of the electron radiation is simply given by its gyration
in the magnetic field,and is thus
Be Vg
= 2irme (1.3)
In the relativistic domain, the radiation of the electron, now called synchrotron radi-
ation, is more complex. Transformed by relativistic effects, the emission is highly peaked
9

in the forward direction of the velocity vector, giving a cone of radiation in the rest frame
of the electron. The emitting, critical frequency of the spiralling, relativistic electron is
2 2Be
V571/g=7 2irme'
(1.4)
where 7 is the relativistic gamma factor given by 7 = i/'i - v 2 /c2 and Vg is the non-
relativistic gyro-frequency given in equation 1.3. As E = 7mec2 , the radiating frequency,
u5 cc BE 2 . Following work by Pacholczyk (1970), the radiating electrons, averaged over
all the pitch angles of the spiralling electrons, lose energy at a rate
dE - cc B 2 E2 . dt
(1.5)
1.3.2.1 The synchrotron radiation of electrons with a power-law energy spec-
t rum
Astrophysically, it is interesting to consider what happens when an ensemble of relativis-
tic electrons radiates due to a magnetic field. It has been noted that the synchrotron
radiation of the electrons of energy, E, is sharply peaked near the emitting, critical fre-
quency, V. 'y2 1/g (equation 1.4), and much narrower than the breadth of the electron
spectrum. Therefore, the energy radiated in the critical frequency range ii to ii + dv is
emitted by electrons with energies between E and E+dE. The energy radiated, j(u)dv,
is then
j(u)dv = (—)N(E)dE, (1.6)
where N(E)dE refers to the number density of the electrons. By substituting the equa-
10

tions of the rate of energy loss (as in equation 1.5) and critical frequency, i'5 of the
radiating electrons, in the appropriate forms, the luminosity, j(v), may be expressed in
terms of the Doppler shift factor, magnetic field strength, particle (or electron) distribu-
tion power-law index, frequency, (respectively, ic, B, p, v) and the fundamental constants:
j(v) = (constants),cB(+fl/ 2v()/ 2 . ( 1.7)
1.3.2.2 Synchrotron self-absorption
According to the principle of detailed balance, to every emission process, there is a
corresponding absorption process. For the mechanism in point, it is known as syn-
chmtron self-absorption. Following Longair (1997), the physical arguments for the self-
absorption are presented below. If a synchrotron source with a power-law spectrum
of S va has the same physical size at all frequencies, its brightness temperature is
Tb = (0/02k)(S1fl) x (2+), where 5, is the flux density, a = (- 1 )12 is the emis-
sion spectral index, p is the electron distribution power-law index and (2 is the solid angle
the source subtends at the observer. Therefore, at low frequencies, the brightness tem-
perature (Tb) of the radiation may approach the kinetic temperature (Ta) of the electrons,
resulting in a self-absorption of the radiation.
It is noted that extensive observations of cosmic rays interacting with a weak mag-
netic field have shown that the synchrotron radiation spectrum is a power-law energy
distribution of relativistic electrons. It is further noted that, a power-law spectrum is
not a thermal equilibrium spectrum of a Maxwellian-electron distribution; this is the
reason it is commonly known as a non-thermal spectrum. However, the spectrum can
still be associated with a temperature for particles of a particular energy E, which is
11

peaked about the emitting, critical frequency V. 72 Vg , where -y = E/mc 2 >> 1 and
Pg = eB/2wm is the non-relativistic gyro-frequency. Furthermore, the temperature T
can be associated with electrons of a given energy through the relation
lmec2 = 3kT. (1.8)
Therefore, the effective temperature of the electrons becomes a function of energy; and,
since 7 & (v/)112, the effective temperature is
mec2 ()1/2 (1.9) Pg
For a self-absorbed source, Tb = T, therefore in the Rayleigh-Jeans limit,
2kTv2 Q 2 C
(1.10)
where 1? is the solid angle subtended by the source. Substituting the expression for
temperature as in equation 1.9, the flux density is
S. = 2mv/ 1/2 31/g
In summary, the characteristic synchrotron spectrum has an optically thin component
that rises with decreasing frequency and has a turnover frequency v 0 . It then falls in
the self-absorbed region at S. OC p512 with decreasing frequency. The self-absorbed
component does not follow the standard Rayleigh-Jeans law because the effective kinetic
temperature of the electrons varies with frequency (Longair, 1997). The typical spectrum
of a self-absorbed r&lio source is shown in Figure 1.4.
12

Log
Iv
Sr. V
Logy
Figure 1.4: A typical self-absorbed synchrotron spectrum of a radio source.
It is noted that if the electron energy spectrum has power law index p, the synchrotron
emission of these electrons has a spectral index a = (p - 1 )12 (see equation 1.7). This
is very useful because a measurement of the spectral index from a synchrotron emitting
source allows the determination of the power-law index of the electron energy distribution.
Indeed, cosmic rays which permeate our galaxy and interact with weak magnetic field
produce synchrotron radiation that is a power-law with spectral index a = —0.7 (S x
as determined from radio observations. Observations of extended components of
radio galaxies and compact radio-loud nuclei, seen in radio to submm wavelengths, also
give synchrotron radio spectral index close to —0.7.
1.3.3 Free-free Radiation from Tonised Gas
Free-free or bremsstrahlung emission is radiation due to the acceleration of a charge in
the Coulomb field of another charge. Astrophysically, the common occurrence of free-
free radiation is the electron-ion thermal bremsstrahlung continuum emission of a fully
ionised, hot gas in which the velocity distribution of the emitting electrons is Maxwellian
13

at a temperature T. In the mm to submm wavelength regime, thermal bremsstrahlung is
commonly detected from diffuse regions of ionised hydrogen at T io K, surrounding
very hot 0, B type stars in the HI! regions. The submm fluxes fit a high-frequency
extrapolation of the radio emission spectrum, which is generally the radiation of the H II
regions resulting from an interaction of free electrons with positively charged hydrogen
ions. The emission is continuous because free electrons can possess a large range of
continuum energies; and, in electron-ion bremsstrahlung, the electrons are the primary
radiators, since the relative accelerations are inversely proportional to the masses, and
the charges are roughly equal, while the ions are relatively more massive (Longair, 1997).
A typical free-free spectrum extends from the optical to the radio, depending on
density of the gas (in, say, the H II region). At the long-wavelengths, there is a turnover
in the spectrum, which corresponds to the wavelength where, according to the principle
of detailed balance or Kirchhoff's law, the effects of self-absorption of the radiation by the
same process as the emission become dominant. In more compact astrophysical regions,
self-absorption becomes important at higher frequencies. Indeed, in most compact HI!
regions found in the vicinity of regions of star-formation, a self-absorption bremsstrahlung
spectrum can be evident even at the centimetre wavelengths.
The self-absorbed (optically thick) part of the free-free spectrum is given by I,, =
2kTv 2/c2 , where J, is the emitted intensity as a function of frequency v. This follows
the Rayleigh-Jeans approximation of the Planck function, as hi' <c kT in this regime.
In the optically thin part, the spectrum is fairly fiat, with a power-law spectral index,
a (I,, cx iP), of —0.1 up to frequencies hi' kT, above which there is an exponential
cut-off. It is noted that the intensity of the radiation per unit bandwidth depends on the
number density of the electrons, N, and inversely on the temperature, T/2. Thus, the
14

total intensity along a line of sight is
1,, oc f NT 1 / 2d1. (1.12)
For AGN observations, particularly at the longer wavelengths in the mm to submm
regime, free-free emission is only important in sources where the bulk of the luminosity
comes from regions of star-formation. In the starburst galaxy M 82 for example, free-
free emission dominates the 3mm (90GHz) fluxes (Kronberg et al., 1985). With the
measurement of free-free flux at 3mm, the flux of ionizing photons in a source can be
determined from
4.75 x 1054v°1 D5,T 045r1 , ( 1.13)
where L. is the number of the continuum photons emitted per second, ii is the frequency in
GHz, D is the distance to the source in Mpc and S is the flux in Jy. Such a determination
is expected to be more direct and reliable for determining the number of ionizing photons
in a target source than other used methods (Gear, 1988).
It is noted in passing that at X-ray wavelengths, bremsstrahlung has been observed
from diffuse, very hot intergalactic gas in rich clusters of galaxies and from shells of
supernova remnants (Longair, 1997). It is further noted that free-free radiation might
be important in ionised regions surrounding a hot central engine of an AGN, and could
possibly provide the best explanation of the origin of the big blue bump seen in some
quasar continuum emission (see e.g. Robson, 1996).
15

1.4 Summary of Thesis and Collaborations
This thesis project describes submillimetre continuum observations using SCUBA to
undertake imaging at a number of submm wavelengths of a selection of nearby galaxies
with interesting properties. Millimetre and submm photometry and imaging observations
are used to study (1) the properties, content and structure of cool to cold dust (2)
the energy distribution of synchrotron electrons and (3) the large-scale outflows in the
selected, active galaxies Cygnus A, NGC 4374, CentaurusA and M82.
All the work in the thesis was undertaken by myself under supervision from Prof. Ian
Robson. Some collaborative observations of Cygnus A had been preliminarily obtained
by Drs. Jason Stevens and Wayne Holland. The programme on NGC 4374 was a col-
laboration on diffusely distributed dust in IRAS selected elliptical galaxies. Dr. Anne
Sansom (UCLan), who is the principal investigator for that programme, devised the
simple dust/torus emission model fitted to the data for this object (see section 4.3.1).
Preliminary observations of M 82 were done in collaboration with Dr. David Hughes,
following up previous work with Ian Robson. Observations of Centaurus A are a combi-
nation of data sets obtained by myself and Ian Robson and those by Drs. Henry Matthews
and Tim Hawarden. Observations have also been made of M87 as part of a programme
by my second supervisor Dr. Tim Cawthorne (UCLan). This source will feature in a
post-thesis study (Leeuw et al., in preparation), that is outside the scope of the work
described here.
16

Chapter 2
Millimetre and Submillimetre
Continuum Techniques
2.1 Preface
This chapter presents millimetre (mm) and submillimetre (submm) continuum observing
techniques, with a special focus on the James Clerk Maxwell Telescope (JCMT)'s Submm
Common-User Bolometer Array (SCUBA), the instrument with which most observations
in this thesis were made. The chapter ends with a brief section discussing the reprocessing
of Infrared Astronomy Satellite (IRAS) data using HIRES and SCANPI routines at
NASA/IPAC. The HIRES reprocessed IRAS data have a higher resolution than earlier
presentation of the IRAS observations and the far-infrared data (60 and 100 pm) in
particular make an important complement to the SCUBA observations in this thesis.
The SCANPI data are a co-addition of the IRAS raw survey data and provide better
constraining flux estimates (or local upper limits) of the target sources, particularly for
the confused or faint sources.
17

Atmosphec Tronsmssion
- versus Frequency
for 0.5, 1.0 and 5.0 mm pwv
_ h DO 300 400 500 600 700 600 90
Frequency (OHz)
Figure 2.1: Atmospheric transmission calculated as a function of frequency in the submm window for three different water vapour pressures (1mm pwv is 'good', 0.5mm pwv 'exceptional', and 5mm pwv is 'very poor'). Reproduced from the JCMT Guide 1998.
Millimetre and submm observations are strongly affected by precipitable water vapour
(pwv) and, to a lesser extent, by other atmospheric constituents. The opacity of the
atmosphere increases generally with frequency until observations from the ground are
virtually impossible for A c 300zm (Masson, 1994). The submm observations are re-
stricted to semi-transparent windows between strong absorption lines of atmospheric
water. Figure 2.1 and Table 2.1 respectively show such transmission windows and the
calculated, representative values of the atmospheric transmission at the zenith above the
high (4200m), dry site of Mauna Kea, Hawaii. The last two columns in Table 2.1 are
respectively the atmospheric transmission for 0.5mm pwv and the percentage of 'good'
nights at a number of representative frequencies (chiefly those of CO transitions [JCMT
User Guide 19981).
Although submm observations are difficult, they have great astrophysical importance.
0 0
CO 00 0 0
E 0 C
2'. -d
01 0
0 21
lin
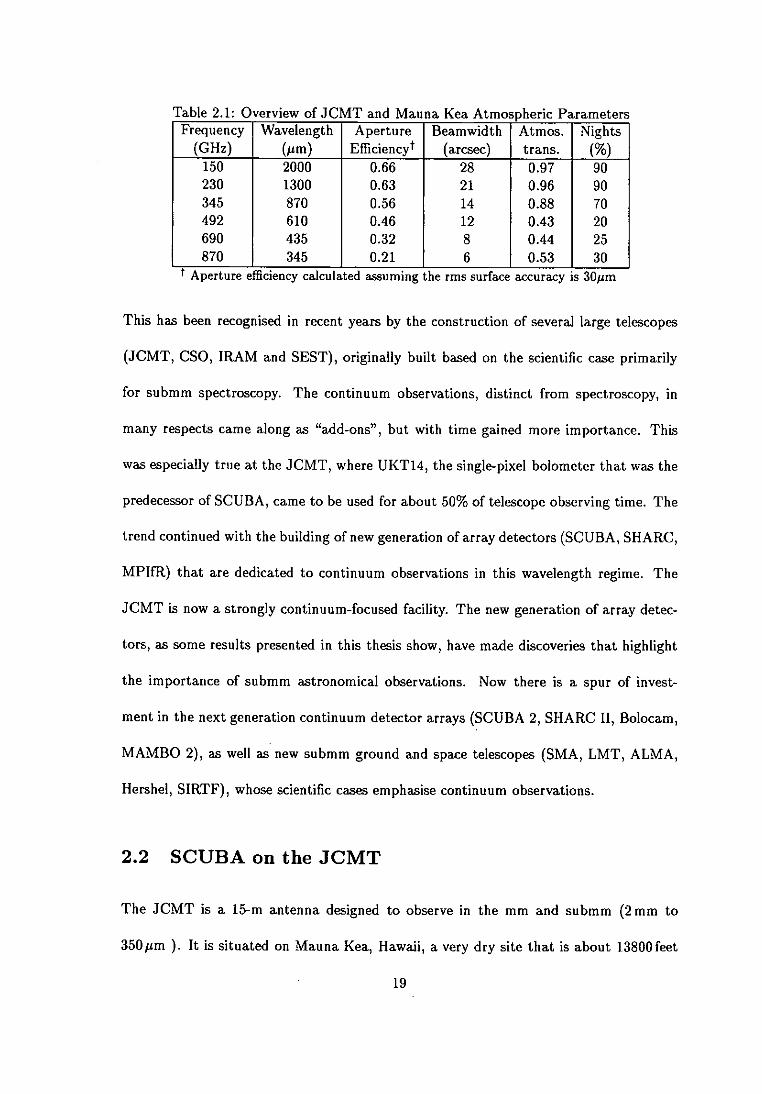
Table 2.1: Overview of JCMT and Mauna Kea Atmosnheric Parameters Frequency
(GHz) Wavelength
(pm) Aperture
Efficiency Beamwidth
(arcsec) Atmos. trans.
Nights (%)
150 2000 0.66 28 0.97 90 230 1300 0.63 21 0.96 90 345 870 0.56 14 0.88 70 492 610 0.46 12 0.43 20 690 435 0.32 8 0.44 25 870 345 0.21 1 6 1 0.53 30
Aperture efficiency calculated assuming the rms surface accuracy is 30pm
This has been recognised in recent years by the construction of several large telescopes
(JCMT, CSO, IRAM and SEST), originally built based on the scientific case primarily
for submm spectroscopy. The continuum observations, distinct from spectroscopy, in
many respects came along as "add-ons", but with time gained more importance. This
was especially true at the JCMT, where UKT14, the single-pixel bolometer that was the
predecessor of SCUBA, came to be used for about 50% of telescope observing time. The
trend continued with the building of new generation of array detectors (SCUBA, SHARC,
MPIfR) that are dedicated to continuum observations in this wavelength regime. The
JCMT is now a strongly continuum-focused facility. The new generation of array detec-
tors, as some results presented in this thesis show, have m&Ie discoveries that highlight
the importance of submm astronomical observations. Now there is a spur of invest-
ment in the next generation continuum detector arrays (SCUBA 2, SHARC II, Bolocam,
MAMBO 2), as well as new submm ground and space telescopes (SMA, LMT, ALMA,
Hershel, SIRTF), whose scientific cases emphasise continuum observations.
2.2 SCUBA on the JCMT
The JCMT is a 15-m antenna designed to observe in the mm and submm (2mm to
350pm ). It is situated on Mauna Kea, Hawaii, a very dry site that is about 13800 feet
19

1.3mm
1.1mm
(photometric pixel)
SHORT WAVE ARRAY LONG WAVE ARRAY
(91 detectors) (37 detectors)
2.3 arcminutes I 0 6 10 16 20 26 mm
Figure 2.2: Pixel layout of the SCUBA arrays, reproduced from Holland et al. (1999).
(4200 m) above sea-level. Some essential properties of the site and atmosphere above the
JCMT are highlighted in Figure 2.1 and Table 2.1.
SCUBA is a new-generation, versatile and powerful submm camera that operates at
the Na.smyth focus of the JCMT (Holland et at., 1999). SCUBA has a 91 pixel short-wave
(SW) array that is optimised to operate at 450 or 350 pm and a 37 pixel long-wave (LW)
array that is optimised to operate at 850 or 750pm (see Figure 2.2). Both arrays have
a 2'.3 instantaneous field-of-view, and the optics are designed such that with a suitable
jiggle pattern of the secondary mirror of the telescope, fully sampled maps can be obtained
simultaneously at 450 and 850pm or 350 and 750pm. As shown in Figure 2.2, SCUBA
also has single element bolometers optimised to operate at 1100, 1350 and 2000pm.
2.2.1 SCUBA Bolometers
In general, bolometer detectors have a large instantaneous bandwidth and therefore, are
more sensitive than heterodyne receivers. This withstands the fact that, in practice,
20

the filter profile is often reduced to a relatively narrow bandwidth in order to reduce
degradation in performance through background power loading of the cooled detector.
SCUBA bolometers are made of a thin film of bismuth mounted on sapphire. A small
chip of neutron transmutation doped germanium is glued to the centre of the bolometer
and measures tiny temperature changes due to incident photons on the bismuth-sapphire
composite. Brass wires that govern thermal conductance make electrical connections
leading out of the tightly packed 131-bolometer mounts that make-up the SCUBA ar-
ray. The bolometers are cooled to operating temperature of 100 mK and were designed
to achieve background limited performance under low sky-background. In practice the
bolometers are limited by the background of the system (dominated by the optics box)
rather than the sky. As the background is not variable, this has, in some ways, made the
operation easier. The measured electrical noise equivalent power (NEP) of the bolometers
varies by 20% across the array.
2.2.2 SCUBA Filters
The SCUBA filters are designed to exploit the "windows" that are available for observ-
ing in the submm waveband (see Section 2.1 and Figure 2.1). The multi-layer, metal
mesh interference filters are located in a nine-position filter-drum that is cooled to 4 K.
They ensure that the SCUBA wavelength profiles match the selected observing windows,
maximizing transmission of the source signal (typically to over 80%) and minimizing the
contribution of extraneous sky emission to the target signal. The rotating filter-drum
allows observations to be made simultaneously at 450 and 850 jim and also at 350 and
750pm, or individually at 1100, 1350 and 2000pm. To minimise the thermal load on
the SCUBA detectors, optical and near-infrared radiation are blocked by an alkali-halide
21

filter, cooled to around 90 K and located on the outer radiation shield of the cryostat
(Holland et al., 1999).
2.2.3 SCUBA Optics and Image Sampling
The submm input beam from an astronomical source is reflected from the primary to
the secondary and tertiary mirrors of the JCMT. The beam is then relayed by these
mirrors and sent through the SCUBA thermal-load blocking filter (which is cooled to
about 90K). An internal Gaussian-beam telescope then relays the beam via a dichroic
beam splitter (partitioning it for the SW and LW arrays) through bandpass filters (which
are cooled to about 4K) and through feedhorns that feed individual SCUBA detectors
(which are cooled to about 65 mK). In order to achieve optimal collecting efficiency,
the entrance diameter of the feedhorns at the detectors is 2fA (i.e. 2 x the FWHM
of the Airy pattern), where f is the focal ratio of the beam. Unfortunately, this is
four times the required detector or pixel separation to achieve a fully sampled image.
(The Nyquist sampling required to achieve a fully sampled image is < I A/2). In other
words, the image is significantly undersampled. Therefore, to obtain a fully sampled
SCUBA image at one wavelength requires four offsets in the orthogonal directions. This
is achieved by "jiggling" the secondary mirror over a 16-point pattern to fill in the gaps,
as shown in Figure 2.3. However, the spatial •resolutioh of the SCUBA arrays is the
diffraction limit in the wavelength in question, being 7" at 450pm, which is half the 14"
resolution at 850pm. Therefore, to obtain a diffraction limited map at both wavelengths
simultaneously, a 64-point jiggle pattern is required.
22

—U— Exposure I
Exposure 2
—a-
-n—Exposuie 4
-28 -20-12 -4 4 12 20 22 16-12-84 0 4 S 1216
Aic-tconds Arc.conds
Figure 2.3: The jiggle pattern used to fully sample the SCUBA maps, reproduced from Holland et al. (1999).
2.2.4 SCUBA Observing Modes
As mentioned above, the jiggle mapping observations employ a 16-point jiggle pattern
(see Figure 2.3) to fully sample an individual SW or LW array over a period of 32s (1
integration). For fully sampled images with both arrays (e.g. at 450 and 850pm), a 64-
point jiggle pattern with a 3" offset between each position (see Figure 2.3) is performed
over a period of 128s (1 integration). Since the spacing of the SW bolometers is about
half that of the LW, this ensures that the area between the LW array pixels is covered
at the resolution required to fully-sample the SW array. Each integration is divided
into 4 so that the telescope can be nodded between the signal and reference beam every
16s. Using specific single bolometers (e.g. the central ones) of the LW and SW arrays
and a simpler jiggle pattern, faster photometric mode observations can instead be
obtained simultaneously at 450 and 850pm, or 350 and 7501im. The photometry mode
observations employ a 9-point jiggle pattern in a 3 by 3 grid of 2" spacing, taking
9seconds on the signal and 9seconds on the reference beams (1 integration). The 1350
and 2000 pm observations use the single photometry bolometers and also employ the 9-
a 10
20
12
12 S
1 4
-12 -8
-20 -12
-28 -16
23

point jiggle pattern. Averaging the source signal in an area slightly larger than the beam
is intended to achieve the best photometry accuracy under good-to-moderate seeing; and,
in case of the simultaneous observations with the LW and SW arrays, to also compensate
for the small offset between the arrays.
Two additional observing modes, scan-mapping and polarimetry, are also available
with SCUBA. The scan-mapping mode allows SCUBA to observe regions larger than
the 2'.3 field-of-view of the camera, by rapidly scanning the array over the region to be
mapped in a raster mode and adding the data. In the traditional rastering technique,
chopping was done in one direction on the sky, resulting in a map that has the source
signal convolved with the chop. Deconvolving the chop was problematic where the Fourier
transform of the chop is low or near zero and thus introduced noise in the restored map.
A new form of rastering follows a technique that was first described by Emerson (1995),
and is locally called Emerson II, where maps of the same region are taken with several
chop throws and directions. This ensures that the zeroes of one FT do not coincide
with the zeroes of another and has been shown to improve the S/N over the traditional
technique (Jenness et al., 1998).
For the polarimetry mode observations, SCUBA has a polarimeter attached (an
additional photolithographic analyser along with a rotating half-wave plate to select one
plane of polarization). The polarimeter has not been used in this thesis.
2.3 Millimetre and Submm Extinction Correction
As shown in Figure 2.1 and Table 2.1, the atmosphere strongly attenuates the submm
signal and therefore, extinction correction is a dominant uncertainty in submm observa-
tions, especially at the short wavelengths, where the transmission is at best 50% at zenith.
24

Assuming a plane-parallel, homogeneous atmosphere, the extinction varies exponentially
with the airmass, i.e.
lobs = Jo x
(2.1)
where lobs is the observed signal, In is the intrinsic signal that one would measure above
the atmosphere, r0 is the optical depth at zenith and A is the airmass (the secant of the
zenith distance).
The traditional method of determining extinction is by following a bright, known
source, typically a planet, observing it atdifferent airmasses (minimum 3) and making a
least-squares fit to the above equation. The method, known as the secant method, is sub-
ject to major uncertainties because it assumes the sky is constant or homogeneous, which
is seldom the case (Sandell, 1994). The atmospheric water vapour above the telescope is
a function of time and position of the object in the sky. The secant method also suffers
from the poor sky coverage available from bright sources, particularly planets; therefore,
in general this method makes it very difficult to determine atmospheric extinction at the
position of the target source (Duncan et al., 1990; Stevens & Robson, 1994).
A focal plane calibration system that involves performing skydips, such as recently
employed at the JCMT with the arrival of SCUBA, can overcome the difficulty of deter-
mining atmospheric extinction at the position of the target source. It allows monitoring
of the sky transmission of submm radiation wherever the antenna is pointing and when-
ever it is convenient for an observer to do so. Skydips with SCUBA measure the sky
temperature over a range of elevations, typically between 15 and 80 degrees. At each
elevation, a focal plane chopper wheel allows SCUBA to alternate between observing the
25

sky and ambient and liquid cooled loads. The temperatures of the ambient and cold loads
are measured and adjusted to match the profiles of the SCUBA filters. Thus observations
of the sky are calibrated. The zenith sky opacity is then estimated from fitting a model
of both the atmosphere (assumed to be plane-parallel) and the data
On Mauna Kea, a dedicated atmospheric transmission monitor, the Caltech Submit-
limeter Observatory (CSO) radiometer, performs such skydips regularly. The radiometer
operates at 225GHz (1.3 mm) and provides a record of the opacity (commonly referred
to as reso) at all frequencies since the opacity at 225GHz can be scaled to the opacity
at other frequencies. Such scaling factors are determined from theoretical models and
extrapolations from experimental data (e.g. Masson, 1994; Stevens & Robson, 1994). The
opacity at a given wavelength (TA) 15
7). = kA x (rCso - B), (2.2)
where kA is the scaling factor and B is the oxygen contribution to the TA opacity (the rest
of the contribution is from the PWV in the atmosphere). The uncertainties in the scaling
factors are highest at the higher frequencies, again since the atmospheric extinction of
the submm signal is strongest at these higher frequencies.
2.3.1 Calculating Sky Opacities with SCUBA
In order to make extinction corrections to the SCUBA data presented in this thesis, the
zenith sky opacity, r, was estimated using two common methods used for this purpose
at the JCMT: (1) performing skydips with SCUBA and (2) extrapolating the r at the
SCUBA filters from the r at 225GHz (rcgO) measured by the CSO radiometer. The two
26

methods are described below, particularly as they relate to their relevance in this thesis.
Skydips with SCUBA
Theoretically, SCUBA skydips are preferred because they can give an estimate of the sky
opacity wherever the telescope is pointed, and therefore at the local time and azimuth of
the target source. Since the objective is to correct the data from the target source, this
is important because the atmosphere water vapour is, as mentioned above, a function
of time and position in the sky. In practice, the skydips have overheads and it is only
reasonable to perform them about every 2 hours in an observing run, and quite often
less frequently. Furthermore, in mediocre to poor weather, the skydip model has trouble
fitting the data, particularly at the short wavelengths. From quite early on in this thesis
project, the visual inspection and the resultant often-high x2 of the SCUBA skydip model
showed that the fitting to the 4501im data was unreliable when TCSo > 0.08, and the
fitting to the 350pm data was almost always untrustworthy, regardless of the weather.
This was the case even after off-line reduction of the model fitting, often involving a
removal of a couple of "bad" points in the data sets. This off-line reduction was necessary
for all the estimation of 7-450 and the r at the long wavelength (i.e.. 750 and 850pm) in
bad weather.
Using rcso in SCUBA observations and data correction
Firstly, the rCSO measurements were exploited as one of the key indicators in monitoring
and forming a basis to make short-term forecasts of weather conditions on Mauna Kea.
The high frequency 15 minute-intervals with which the measurements are made (when
the CSO radiometer works) is important in this regard. This was useful for planning
27

submm observations before going up to and while working at the telescope.
The second exploitation of the rCso, and perhaps the most crucial one, was in using
it to extrapolate the r at the SCUBA wavelengths. Doing this makes redundant the need
to perform SCUBA skydips frequently, if at all, and therefore minimises the overheads
associated with skydips. However, one disadvantage is that, unlike r's derived directly
with SCUBA, the CSO-derived r's are most often not for the area of the sky where
the JCMT is pointing and therefore not local to the SCUBA target source. The second
disadvantage is that extrapolation to the SCUBA filters increases the uncertainty in the
estimation of the needed r. While nothing can be done about the former disadvantage,
the latter can be made insignificant by deriving relations from correlations with minimal
scatter. At the JCMT, these relations are derived empirically. Therefore, they have been
periodically updated and improved as more data, especially since the commissioning
of SCUBA, have been obtained (e.g. Archibald, Wagg, & Jenness, 2000 ' [hereafter
AWJOO]).
Table 2.2: Typical CSO relations used in this thesis project
= 4.3 x (rcso - 0.007), = 23.9 x (rcso - 0.01), = 6.5 x (7-850 —0.03).
The typical relations used during the course of this Ph.D. are listed in Table 2.2.
The latest relations for r450, r850 and rcso were derived by AWJOO and are listed in
Table 2.3. These have not been used in this thesis as they were derived after all the data
reductions presented here were undertaken. With these recent relations is obtained an
estimate of r450 and r850 that differs from the earlier estimates by no more than 10%. The
'This latest documentation is available at the Joint Astronomy Centre web site, http://www.jath.hawaii.edu

reason for the small discrepancy.is because the estimate of the r values in this thesis were
calculated with special care. As described above, all the SCUBA skydips model fittings
were checked off-line and only the r estimates from good fits were used; otherwise, an
extrapolation was made from the CSO-SCUBA r relations, which though becoming more
robust with time, have generally been reliable (AWJ00).
Table 2.3: New CSO relations derived for October 2000 by JCMT staff AWJOO
= 3.99 x (rCSo - 0.004) = 23.5 x (roso - 0.012) = 5.92 x (r550 - 0.032)
2.4 Sky-Noise Removal in the Millimetre and Submm
Besides attenuating the submm signal, the atmosphere (and immediate surroundings of
the telescope) contribute thermal radiation that is always relatively higher than the target
signal. The thermal emission from the sky manifests in two ways: (1) in a DC offset and
(2) in temporal and spatial variations in the emissivity of the atmosphere on short time-
scales, which degrades the available sensitivity, especially during long integrations and
particularly at the higher frequencies.
The DC offset is removed by chopping and nodding. However, since the spatial and
temporal variations of the sky emission are on scales comparable to the chop throws, the
chopped beams travel through slightly different atmospheric paths and the sky-noise (i.e.
the variations of the background thermal emission) is not removed completely. Reducing
the chop throw has been shown to decrease the effects of sky-noise. On the JCMT,
adopting a throw of 120" instead of 30" to 40" can produce a degradation in S/N of up
to a factor of 2 (Holland et al., 1999). On the other hand, to prevent beam cancellation,
29

a minimum of 3x beamsize is required. Also, in some cases, one is forced to adopt a
large throw in order to ensure that the chopping is away from emission from an extended
region or known neighbour of the target object.
Observing with the SCUBA array allows for the removal of sky-noise by subtracting
emission from off-source bolometers that are viewing the 'blank-sky'. The residual sky-
noise is removed off-line by using quiet (or 'blank-sky') SCUBA array bolometers in
which there is no source emission. Usually the bolometers in the first ring (for LW) and
second ring (for SW) from the centre are used to remove this sky emission. For the
1350 and 2000 pm photometry observations, residual sky emission is not removal as the
observations use only a single bolometer.
2.5 Millimetre and Submm Flux Calibration
An ideal calibration source should be bright, compact and non-variable. Unfortunately
such sources do not exist for submm observations. Planets are the best choice, but
even here present problems due to their extended nature, variability and, in some cases,
excess brightness. Primary submm calibration is taken from Mars (Wright, 1976) and
Uranus (Orton, 1986; Griffin & Orton, 1993). When planets are not available, secondary
calibration is done with (1) ultracompact Hil regions in which most of the radiation is in
the submm, (2) low-luminosity protostars that are cold and dust rich and (3) asymptotic
giant branch stars that are surrounded by large dust-rich envelopes. None of these
secondary calibrators fulfil all the criteria of an ideal calibrator (bright, compact and
non-variable) but they are the best choices available for submm observations (Sandell,
1994).
30

2.5.1 Flux Calibration with SCUBA
Mars and Uranus are the primary submm calibrators and were used as top priority
for calibrating data presented in this thesis. The SCUBA data were calibrated using
instrumental gains that were determined from beam maps of either of the two planets
nightly. Ideally, the calibration observations were made in the same observation mode
and chop throw and chop waveform as the target observation. Planetary fluxes for each
filter were obtained using the JCMT utility program FLUXES. On the nights when
the planets were not available, e.g. during the January and February 1998 runs, the
JCMT secondary calibrators CRL 618, CRL 2688 or IRC+10216 were used. Fluxes for
the secondary calibrators were obtained from Sandell (1998), with occasional reference to
Sandell (1994). The list of calibrators (primary or secondary) used for respective nights
and observations are listed in tables in the relevant chapters. The instrumental 'gain',
or, strictly, the flux conversion factor, is given by
'—A -- Sastrophysical
'instrumental (2.3)
which is in Jansky (Jy) /Volts (V), and converts the output data from Volts, the instru-
mental signal measure, to Jansky, a very useful infrared to radio wavelength astrophysical
flux density measure.
31

2.6 IRAS reprocessed Data
The reprocessing of IRAS data using HIRES or SCANPI 2 routines is undertaken at
NASA/IPAC following email requests. The reprocessed data are available electronically
by ftp in the form of several files of the target source maps, diagnostic maps, graphs
and text. As with the SCUBA data presented here, the HIRES and SCANPJ data were
analysed using STARLINK programs after being converted to the required formats.
2.6.1 HIRES
HIRES is an iterative process that uses the Maximum Correlation Method (Aumann
et al., 1990) to produce images with better resolution than that nominal for the IRAS
data. In general, the process works very well, providing a powerful tool for studying
morphology in the IRAS waveband observations and for separating confused sources.
The HIRES images produced for this thesis used the processing defaults of the IPAC
data centre, as they were suitable for the target sources. Typically, the image size was
1 x 10 and the pixel size was 15". The algorithm produced maps at the 1st, 5th, 10th
and 20th iterations. With the output maps, diagnostics imaging tools were produced,
including surface brightness and beam maps.
The resolution achieved can be better than an arcminute, roughly a five-fold increase
over the unenhanced resolution. This resolution varies from band to band and also from
point to point within a single map. The band to band variation is due to the expected,
inherent point spread differences between IRAS bands. Illustrative resolutions at 12, 25,
60 and 100pm after 1 and 20 iterations are shown in Table 2.4. The one reason for the
2 The latest HIRES and SCANPI documentation, around which this section is based, is available at the NASA/IPAC web site, http://www.ipac.edu
32

variation within a map is signal-to-noise variation from source-to-source. This is not a
concern in the current thesis because only one target source is analysed in each map.
T.h10 9 A 1IlI,ctr2trn T-TIRP.e ftar 1 ngl 911 ;tar2t;nnc
12pm 25pm 60pm 100pm 1 iteration 20 iterations
256 x 66" 37 x 23"
270)< 64" 35 x 23"
301 >< 121" 62 x 41"
304 x 284" 98 x 80"
Further consideration about HIRES images is the dynamic range, which is limited
to 1:100 on small spatial scales. The fluxes measured on the intensity maps agree to
the IRAS Point Source Catalog to within 20%. The flux stability over the course of
iteration varies by 20%, and is only conserved when most of the resolvable structure has
been resolved.
2.6.2 SCANPI
SCANPI co-adds IRAS scans that all passed within 1'.7 of a target position. After
retrieval, archival data are re-sampled to facilitate alignment. Then baselines are fitted
and residual noise is computed for each scan. The scans are co-added in four ways:
straight mean, noise-weighted mean, median and mean with noisy detectors half weighted.
Among other things, the co-added scans are analysed to find the peak, determine if a
signal exists and compute the integrated fluxes and the full width at quarter and half
maximum. Flux estimation is expected to agree to within lc between the methods of
co-addition. Though no single method is supposed to produce the best flux estimate, the
median is said to be consistently the good estimator of the methods. The SCANPI data
are not only useful for obtaining fluxes for point or slightly extended faint or confused
sources, but can be useful for estimating local upper limits, and are handy for diagnosing
source extent.
33

Chapter 3
Millimetre and Submillimetre
Continuum Observations of the
Core and Hotspots of Cygnus A
3.1 Introduction
Cygnus A is locally the most powerful Fanaroff-Riley (FR!!) radio galaxy and therefore it
is also the best studied in terms of spatial resolution. It has even had an entire workshop
devoted to it and global properties of the object are well reviewed in these references
(Carilli et al., 1998; Carilli & Barthel, 1996; Carilli & Harris, 1996). CygnusA has fea-
tured prominently in the quest for the unification of powerful radio galaxies and quasars,
being cast as the classical case of a quasar in the plane of the sky (Antonucci & Miller,
1985; Barthel, 1989). In terms of the synchrotron emission, at low radio frequencies the
two giant lobes dominate the emission (Hargrave & Ryle, 1974), but at higher frequencies
the hotspots, or working surfaces in the lobes, become more prominent along with the
34

galaxy core. The southern and northern hotspots are respectively 50" and 70" from the
core. Using a Hubble constant of 75km r' Mpc' and a redshift of z = 0.0562 (Stockton
et al., 1994), Cygnus A lies at a distance of 227 Mpc.
Deep Very Large Array (YLA) images reveal the thin jet which transports energy from
the AGN core to the radio lobes (Perley et al., 1984). Very Long Baseline Interferometer
observations by Linfield (1985) and other authors, and most recently by Krichbaum et al.
(1998), have extended this picture at sub-milliarcsecond resolution. The fact that the
electron synchrotron lifetime in the hotspots is less than the light travel time from the
central core (Hargrave & Ryle, 1974) means that electron re-acceleration must take place
in the lobes, and the hotspots are believed to be the working surfaces at which this re-
acceleration takes place. Indeed, the prominence of hotspots at the outer edges of the
lobes is one of the identifying features of FRII radio sources (Fanaroff & Riley, 1974).
The precise mechanism for the electron acceleration is uncertain and determination of the
synchrotron spectral index is important as it can rule out some potential mechanisms.
For a steady injection model (Bell, 1978), a steepening of 0.5 in the index is expected
at a certain frequency as the electrons lose energy more rapidly than is being supplied
by the acceleration process. At some higher frequency, the electron spectrum will cut-off
as the high energy electrons rapidly lose energy and become depleted; this produces the
final turnover and steep downturn of the synchrotron emission. The emission from the
hot-spots (denoted by A and D in the convention derived from VLA maps, where A is
the north-west and D is the south-east hot-spot) has been well observed at a number
of radio frequencies (Wright & Birkinshaw, 1984; Carilli et al., 1991; Salter et al., 1989;
Eales et al., 1989). Both are found to have an excellent power-law spectral index with a
coefficient of about —0.5 between 0.1 GHz to around a few GHz, steepening to an index
35

of -1.0 at higher frequencies. The break to the higher index occurs at around 100Hz
for both hotspots. The spectral break of 0.5 is indicative of the steady injection model
with constant radiative losses.
The spectral shape of the core of Cygnus A is much less well determined than the
hotspots. The general shape is of a power-law, which is self-absorbed below a few 0Hz,
and above which it has an index of around —0.1, but with significant uncertainty (Salter
et al., 1989; Eales et al., 1989).
This thesis presents high frequency (150-8570Hz) photometry of the hotspots A and
D (there is no visible evidence for a separate component B at this spatial resolution) and
the galaxy core. Single-pixel photometry data are given for frequencies of 150 and 222
0Hz, and the first submm imaging photometry at frequencies of 353, 400, 667 and 857
0Hz (corresponding to wavelengths of 2000, 1350, 850, 750, 450 and 350 pm respectively)
are presented.
3.2 Observations
The imaging and photometry observations were made with SCUBA (see Chapter 2) on
1997 May 02, Sep 18, Oct 02 and 1998 Feb 14 and 16. Observations were made in the
faster photometric mode only on 1998 Feb 14 in order to go deeper and reduce flux
uncertainties, especially at 450pm. For the imaging observations of Cygnus A, the 64-
point jiggle mapping mode was employed. The telescope was pointed at the core of the
optical galaxy using radio positions from Hargrave & Ryle (1974). The radio hotspots
are about 65" from the core, thereby nicely fitting within the instantaneous SCUBA
field-of-view. For the photometry mode observation, the 9-point jiggle pattern mode was
employed. In this mode, the telescope was pointed at the radio core position, and at
I;J

each hotspot using the positions from Salter et at. (1989).
The data were calibrated using instrumental gains that were determined from beam
maps of Mars or Uranus nightly and in the same observation mode as the target observa-
tion. During the 1998 Feb runs, the planets were not available and the JCMT secondary
calibrators CRL 618, CRL 2688 and IRC+10216 were used (see Chapter 2).
The results from the imaging and photometry observations are shown in Table 3.1.
The uncertainties are a quadratic sum of the uncertainty arising from the measured
signal-to-noise-ratio and a systematic calibration uncertainty, which varies from 10% at
850pm and lower, to 27% at 450pm.
In addition to SCUBA observations, IRAS data were reprocessed using HIRES and
SCANPI routines at NASA's Infrared Processing and Analysis Center (IPAC). The re-
reduced 12, 25 and 60pm data agree well with previous determinations (Fullmer & Londs-
dale, 1989; Knapp et at., 1990; Golombek et al., 1988). There is some disagreement about
the 100pm value; Golombek et al. (1988) indicated that the upper limit flux density was
1.8Jy, however Fullmer & Londsdale (1989) gave a significantly different upper limit of
8.3Jy. The reason for disagreement is because the published upper limits have been de-
termined in different ways. Cygnus A has alow galactic latitude (b = 6°), and the 100pm
flux is contaminated by cirrus (Low et al., 1984). From the HIRES images it is clear
that the cirrus contamination is dominant and the true Cygnus A flux at 100pm cannot
be retrieved from IRAS data even with unusually high iterations of HIRES processing.
Moreover, photometry on the HIRES images produced a 3c upper limit of 5.1Jy.
-
37

U
CO
C
O
N-
R
R
0
0
0
0
C,t
Ott
Ott
S 0
0
0
Co
0
Co
(0
0
0
©
-
N-
—
cc E
0
0
0
Co
h
© fl
Co
CoC
o w
CO C
o
0
00
00
00
n
C) C
oO
t) N
- V
a
0
00
00
-0
LI)
©
It) C
o 0
1
) '
Ott
Ott
r eq
Cl 0
0
0 0
0 0
CO
C
o 0
Co
CO
C
O
N
Cl C
N
- -
© 0
- ©
—
—
C
o Cc? I-
C'1
0
0 ©
0
C
eq —
C
) N
- C
o h
0
—
eq eq
Ott
eq R
eq
o 0.
0
0.
cj
'CoC
CO
C Q
CO
C'C
OC
'1
(Ocq
CO
eq
00
_0_©
.J_©
_0
gt eqeqoC
)C
oZ
cqoC
)C
o
0C
'l0C
)It)
Q©
©©
© ©
-400Z
0r
-©
0
CO
N-N
-N
-.C
ON
-t-N
-
CO
N-N
-N
-
- C
C
) C) C
) C)
ri
C)
C)
C)
C)C
)C
) C
) C
) —
C
) C
) C
) C)
-
BE

Eat; C
0
L
C-)
I.
C,
Is
'I, (3
L.
0
-'-I
w
U,
0
-1
II
:s C
k
f
4-
-C
to
0
t4 a
C) I- a
U
Ct
C-
4-
C) U
'0
= cd
4-
0
0. 4-
0
-t C) -t
C) S
.- = to
IT
(aesa
io)
18
8j4
40
u
on
.ou
ipea
39

ZL
co C
0
IL)
U
a)
I 0
U)
N
a
"4
IA
C
N-
{0 = bjD
C-) 0
C)
0
ho
U
4-
C) U
0
Ct
(C
4-
0
(C
4-
0
-t
C)
-c
C.,
C) I-
cI
(aa
nio
) .esj4.o
uoL
wu
lJaaa
40

E
I I 0
U,
C
CI? C
0
C-)
0
LO
"3
bo
U)
C-)
0
0
C-)
1 0
C-)
-o "3 U
) -4
- 0
0.
U)
4- 0
CIS
ho
-t
0
-t
0
(oo
.c) W
SJ
40
U
OIID
VU
OO
41

a) a
cx-
0.1
3.3 Results and Discussion
The 850, 750, and 450pm SCUBA images, respectively, in Figure 3.1, 3.2, and 3.2
clearly show the two hotspots and the central core of the galaxy. The rms uncertainties
on the maps are 40, 50 and 85 mjy respectively. No detections were made at 350 pm and
a 430 mjy rms was determined from the map (not shown).
3.3.1 The Hotspots
Wavelength (millimetre) 1000 100 10 1 0.1
100
C • C
S
a.
I
1000 io 10 5 10 6 Frequency (MHz)
Figure 3.4: The spectral energy distribution of the hotspots A (open circles) and D (solid circles) in Cygnus A. The SCUBA data points are indicated by triangles.
The spectral energy distribution of the two hotspots is shown in Figure 3.4. The SCUBA
data points are indicated by open (hotspot A) and solid (hotspot D) triangles; the other
42

data points are taken from Carilli et al. (1991) and they are indicated by open (hotspot
A) and solid (hotspot D) circles. The points at 375GHz (800pm) are from Eales et al.
(1989) and are also from the JCMT using the previous single-pixel continuum instrument,
UKT14.
The well observed radio synchrotron spectrum is seen to continue smoothly into the
submm region with no apparent spectral break. The spectral indices, a, determined
from 146 to 667 GHz, are a = —1.04 ± 0.01 for hotspot A (NW) and a = —0.99 + 0.01
for hot-spot D (SE). In all cases S. x if. There is no significant evidence for further
spectral steepening due to a high energy cut-off in the electron distribution. The excellent
determination of an index of close to —1.0 fits extremely well with the continuous injection
of relativistic electrons in the hotspots (Carilli et al., 1998). The spectral index of the
injected electrons of —0.5 gives support to the origin of the high energy electrons in a
shock (Bell, 1978).
If an equipartition value for the magnetic field in the hotspots of 30 nT (Wright &
Birkinshaw, 1984) is taken, the electrons radiating at 800 GHz have an energy of around
2 x 10¹⁰ eV and a synchrotron radiative lifetime of 6.6 x io years. For a single central
source of the electron acceleration in each hotspot and an electron diffusion rate of the
speed of light, the electrons responsible for the 800 GHz synchrotron radiation can, at
most, travel a radial distance of 2 kpc. Interferometer measurements at 89 GHz (Wright
& Birkinshaw, 1984) reveal that the hotspots are spatially resolved and are between 2
and 3 kpc in size. Therefore if the hotspots are the same size at 800 GHz, there is barely
adequate time for the highest energy electrons to fill the volume even with a diffusion
speed of order c. If the speed is substantially less than c, then multiple acceleration
sources (shocks) are required in order to explain the observations. In fact, the spectral
43

index distribution determined from recent high-resolution VLA imaging observations at
30GHz suggests that distributed particle acceleration occurs in the hot spots (Carilli
et al., 1999). To test this hypothesis further requires better determination of the mag-
netic field and interferometer measurements at 800GHz. These will be possible with the
introduction of the Smithsonian Submillimeter Array (Moran, 1996), that is now under
commissioning on Mauna Kea, Hawaii.
3.3.2 The Core Component
A power-law spectral index of o = —0.6 ± 0.1 has been determined between 146 and
6770Hz for the core. This is much steeper than & —0.1 determined by Wright &
Birkinshaw (1984) and Salter et al. (1989) respectively between 10 and 89 0Hz and 89
and 230 GHz. Indeed, given the quality of the data it is not clear whether a power law
(rather than a smoothly curving function) is, in fact, the best fit to the data. On the
other hand, in the unification scenario we suspect the radio-core of Cygnus A to be a
severely misaligned jet and therefore the spectrum to be typical of an unboosted blazar
jet spectrum. These have been observed in the mm to submm (Gear et al., 1984), so it
is assumed that a power-law is the simplest interpretation. In this case there is tentative
evidence for some steepening above 6000Hz, but the data are inadequate to determine
whether this is the 0.5 break of a continuous injection model, or, whether it is the onset
of depletion of high energy electrons. Further observations at the high frequency submm
wavelengths are needed to answer this question.
The IRAS measurements clearly suggest thermal emission from dust in the central
galaxy, although the temperature and hence mass of the emitting dust are very uncertain
from the IRAS values alone. The new submm data points constrain the non-thermal con-
44

tribution to the IRAS and the new ISO fluxes. In particular the 667 0Hz measurement
constrains the temperature of emitting dust to within a factor of two.
3.3.3 Cold Dust in Cygnus A
Wavelength (microns)
io 104 1000 .100 10 I 1111111 I I 11111111 I 11111111 I
1111111:
+ 4 .
.+
I III1FII I I 11111 I 1111111 I I
io io 106 107 io Frequency (MHz)
Figure 3.5: The spectral energy distribution of the central core in Cygnus A. The SCUBA data points are indicated by open triangles. The upper limits are both 3c; the 350pm is from SCUBA and the 100 pm is from reprocessed IRAS data. The two curves represent emission from greybodies with temperatures of 37 and 85K with an emissivity index, /3, of 1.3.
Assuming a reasonable value for the dust emissivity index, /3, of 1.3, the maximum
temperature that appears to fit the IRAS data is 85K, while the lower temperature
is constrained by the SCUBA measurement at 4501im to 37K. Figure 3.5 shows both
these temperatures. Changing 3 between 2.0 and 1.0 makes very little difference to the
>'
-a
ci)
-
0.1
45

derived temperatures. The mass of emitting dust Md is derived as in Section 1.3.1. It is
assumed that values of the grain mass absorption coefficient are= 0.25 m 2kg'
and = 3.3 m2kg' (c.f. Section 1.3.1), which yield dust masses of 1.0 x 10⁸M0 for
T = 37K and 1.4 x 10⁶M® for T = 85K.
Wavelength (microns) 105 104 1000 100 10
1111111 I I JIIIIIIII 1111111 P I 11111111
1 A 0? 0
f 2
0.1
I 1111111 1111111 I I 1111111 I
104 105 io° io 108
Frequency (MHz)
Figure 3.6: The spectral energy distribution of the central core in Cygnus A that includes recent ISO observations by Haas et al. (1998). The data points are as in Figure 3.5 plus the new ISO fluxes at 60, 120, 170 and 180 pm marked by solid squares. The upper limits are the 3a determinations at 350, 170 and 100pm from SCUBA, ISO and IRAS respectively.
Using recent ISO data at 60, 120, 170 and 180 pm (Haas et aL, 1998), which sample
the critical part of the spectrum, the dust temperature can be better-constrained. Consis-
tent with the above results, the IRAS and ISO data are fit by a greybody function with
the temperature of 70K and emissivity index of 1.3, that is shown in Figure 3.6. Also
46

consistent with the above results, (Haas et al., 1998) fit a slightly cooler dust spectrum
of temperature 52K to their ISO data, yielding a dust mass of 5 x 10⁶M® .
For the starburst galaxy M82, Hughes et al. (1994) estimated the dust mass within
the inner 1 kpc of the nucleus to be between 1.8 x 10 6M® and 3.6 x 10⁶M® for T= 48K
and T= 30K respectively. The minimum estimated 85 to 52K dust masses in Cygnus A
are remarkably close to this, and, though only a tantalising hint, suggests Cygnus A
core properties are similar to those of classical nuclear starburst galaxies. However, the
submm upper limit to the dust mass for Cygnus A is considerably higher than the dust
mass in M 82, even when considering the mass contribution seen in the low brightness
flux outside the inner lkpc of the nucleus, which is measured to be about 30% of the
nuclear mass (Alton et al., 1999). From these deep images of the extended dust emission
in M82 (c.f., Chapter 6 and Alton et al., 1999), it can safely be said that if M82 were
moved to the distance of Cygnus A, the emission would be unresolved in the SCUBA
beams. The recently obtained deep SCUBA images of the star forming galaxy Arp 220
(at 76Mpc) are also unresolved.
The upper limit for the dust mass in Cygnus A obtained from the submm data is
comparable to the dust masses for Arp 220 and another star forming galaxy NGC 6240,
which are 4.5x 10⁷M® and 3.0 x 10 7M® respectively (Klaas et al., 1997). The comparison
is interesting because, from unusually luminous hot molecular gas emission (1.0 x 10 W),
Ward et al. (1991) likened the core of CygnusA to Arp 220 and NGC6240. At the same
time, Ward et al. (1991) noted that the implied mass of the hot molecular gas led to
a mass ratio upper limit of hot-cold H2 that was not unusual in AGN. It is noted that
while the lower and upper dust mass limits for Cygnus A are, respectively, comparable
to the nuclear starburst galaxies M 82 and the extranuclear starburst galaxies Arp 220
47

and NOC 6240, the upper dust mass limit is also similar to the masses for the Radio
Quiet Quasars TZwl, Mrk 1014 and Mrk376, which are 7.6x10 7M® , 6.3 x 10⁸M® and
5.8 x 10 7M® respectively (Hughes et at., 1993).
3.4 Summary
Detailed photometric and imaging observations of the two hotspots and the radio core
of Cygnus A have been made. The spectral index of the hotspots extends smoothly
to about 450Mm (677GHz) with no evidence of spectral steepening. If the diffusion
speed for the electrons responsible for this emission is about c, then a single particle
acceleration mechanism can be responsible for the hotspot synchrotron emission. On the
other hand, if the diffusion speed is significantly less than c, then multiple acceleration
locations are probably required unless the magnetic field strength is significantly less
than the equipartition value. Future observations using submm interferometers should
narrow-down the parameter space in terms of the size of the emitting region.
The radio core has a much flatter spectral index, more indicative of a relativistic jet,
and as such could be the standing shock at the entrance of the parsec-scale jet. There is
some evidence for spectral steepening, perhaps suggesting that at these energies, the life-
time of the radiating particles is sufficiently short that there is inadequate replenishment
available. There is no evidence for thermal emission from dust at the highest frequency
of 6670Hz (450pm) and this, along with re-reduced IRAS data, restricts the temper-
ature of the emitting dust to between 37 and 85K, with corresponding dust masses of
1.0 x 10⁸M® and 1.4 x 10⁶M® . These results are consistent with very recent and better-
constrained dust temperature of 52 to 70K and dust mass of about 5 x 10 6M® (cL Haas
et al., 1998), obtained using new ISO data at 60 through 180 pm. The lower dust mass

limit of 106M® is comparable to the nuclear starburst galaxy M 82 and the upper limit
to the extranuclear starburst galaxies Arp 220 and NGC 6240 as well as the Radio Quiet
Quasars IZw 1, Mrk 1014 and Mrk 376. It is unclear whether the heating of warm dust
in Cygnus A is dominated by the active star formation or galactic nucleus.
49

Chapter 4
SCUBA Observations of the
Elliptical Galaxy NGC 4374
4.1 Introduction
The interstellar medium (ISM) in elliptical galaxies is not easily probed by optical obser-
vations; however, observations at a range of other wavelengths have revealed unexpected
amounts of gas in these galaxies (e.g. Roberts et al., 1991). With the gas, it is also
expected that dust will be present since red giant stars lose dust to the ISM. Small
amounts of dust are seen in dust lanes and patches in ellipticals (Sparks et al., 1985;
Goudfrooij et al., 1994). SCUBA provides an opportunity to test if there is cold (less
than about 30K), diffusely distributed dust present in elliptical galaxies as suggested
from far-infrared observations and from IRAS observations for a sample of ellipticals
by Goudfrooij & de Jong (1995). They estimated dust temperatures of 25 to 35K and
dust masses of .-.' 101 to few x10 6M® , which indicated that dust masses derived from
IRAS fluxes exceeded the dust masses estimated from optically identified dust lanes and
50

patches in many ellipticals, by typically an order of magnitude.
However, the IRAS data are limited for studying dust since IRAS gave little infor-
mation about the spatial distribution of the dust in galaxies, so cannot be used to check
directly if the dust is diffusely distributed or not. It can also be noted that many ellipti-
cals contain haloes of hot gas at around io K with masses of a few x 10 9M® (Canizares
et al., 1987). This X-ray emitting plasma is expected to destroy any dust grains through
sputtering by hot gas particles in a short time (< 10 years (Draine & Salpeter, 1979)).
So, for diffusely distributed dust to be present in a typical giant elliptical galaxy, the dust
would have to be protected or shielded from the plasma in some way. SCUBA, being an
imaging device, offers an opportunity to map out the distribution of any cool dust.
The giant elliptical NGC 4374 was chosen from the sample of Goudfrooij & de Jong
(1995) as a candidate in which to look for diffusely distributed dust because it has optical
dust lanes in the central region (< 10"). The dust mass estimated from the dust lanes
is 3.5 x 10⁴M® and the dust mass estimated from the infrared (IRAS) fluxes (at 60 and
100 jim) is 1.35 x 10 5 M® (for a dust temperature of 35 K), a factor of r-d 4 greater than
from the optically identified dust (Goudfrooij & de Jong, 1995).' Since most of this dust
is not seen in the optiëal dust lanes, Goudfrooij & de Jong (1995) suggest that it must
be diffusely distributed throughout the galaxy. Such dust would affect the colours in
galaxies. However, this effect could be difficult to disentangle from age and metallicity
variations in the stellar population, which also produce colour changes (Worthey, 1994).
Therefore, the presence of a few million solar masses of dust, distributed throughout a
galaxy, could well have escaped optical detection. On the other hand, spatially resolved
'Note there was a typographical error by Goudfrooij & de Jong (1995): the dust mass they estimated from the IRAS data should have read LogMd=5.13 (not 5.3) (Goudlrooij - private communi-cation). The correct dust mass is quoted here.
51

tometry at 2000, 1350, 850 and 450pm can confirm the presence of diffusely distributed,
cold dust in the giant elliptical galaxy NGC 4374. The SCUBA observations together
with radio and infrared data from the literature are used to place tighter constraints
on the spectral components, including the dust temperature and the size of the infrared
emitting region.
4.2 Observations and Reductions
Imaging and photometric observations of NGC 4374 were obtained on 1997 September 3
as well as 1998 January 22, February 1, February 14 and 1999 March 19, with SCUBA
(see Table 4.1). The imaging observations used the short wave array (SW) at 450pm
and the long wave array (LW) at 850pm, with beam-widths of 8".5 and 14".5 (FWHM)
respectively. The observations employed a 64-point jiggle pattern, fully sampling the
2'.3 field of view of both arrays. Similarly, the submm photometric observations were
obtained by operating the central bolometers of the SW and LW arrays at 450 and 850pm
simultaneously, employing a 9-point jiggle pattern in a 3 by 3 grid of 2". The 1350 and
2000 pm observations used the single photometry bolometers and also employed a 9-point
jiggle pattern.
Standard SCUBA data reduction was undertaken (see Chapter 2). The fluxes were
calibrated using instrumental gains that were determined from beam-maps of Mars or
Uranus nightly and in the same observation mode as the target observation (see Ta-
ble 4.1). Planetary fluxes for each filter were obtained using the JCMT utility program
FLUXES. During the January and February 1998 runs, the planets were not available and
the JCMT secondary calibrators CRL 2688 and IRC+10216 were used (Sandell, 1994,
1998). On nights when the rcso > 0.07 (see above and Table 4.1), the atmosphere was
53

Table 4.1: Submillimetre fluxes (Janskys) for NGC 4374 from SCUBA
UT Date 2000pm 1350pm 850pm 450sm 850/450pm Cbs Tcgo Calibrators 146GHz 221 GHz 3500Hz 6770Hz 350/677GHz Mode
Total hit. Time (s)
'990319 0.15 ± 0.02 0.18 ± 0.02 0.11 ± 0.02 2160 Phot 0.06 Mars '980214 0.15 ± 0.02 0.15 ± 0.02 0.11 ± 0.02 <0.15 1260 Phot 0.05 CRL2698 '980201 0.15± 0.02 <0.12 2640 Map 0.05 IRC+10216 '980122 0.14 + 0.02 0.13 ± 0.02 <0.12 2340 Map 0.04 IRC-l-10216 '970703 0.16± 0.03 2220 Map 0.1 Uranus
opaque to 450pm emission and observations could be made only at longer wavelengths.
4.3 Results and Discussion
Figure 4.1 shows the 850pm image of NOC 4374 together with the beam-width deter-
mined from observations of 3C 273, a standard point source for the JCMT, made in the
same way and conditions as NGC 4374. The rms uncertainty on the map is less than
20 mjy/beam. The image of NGC 4374 has small northeastern and southwestern spurs
that are not real features of the galaxy but a manifestation of the beam smearing as a
result of chopping. These spurs are in the chop direction and are detected at a much
lower level than the central emission. An examination of the point spread function of the
NGC 4374 image yielded FWHMminor_axis = 15".0 and FWHMmajor_axis = 15".7, The
result shows that the image of NGC 4374 is no more than 1" greater than the JCMT
beam. This insignificant spatial extension is probably a result of a small pointing drift
during the long observation (r'.' lhr). Thus, NGC 4374 is not extended in the SCUBA
850pm image, which constrains the spatial origin of the observed emission to less than
15" (1.5kpc for a distance of 20.74 Mpc) in diameter. It is worth noting that although
the SCUBA beam is 15" at 850pm, the arrays have a 2'.3 field of view, and therefore,
at the distance of NGC4374, any diffuse emission to ".' 13kpc in extent is not detected,
54

NGC4374
54:00
50
40
30
20
10
12:53:00
50
40
30
12:25:07 05 03 01
Right ascension
Figure 4.1: The SCUBA 8501im image of NGC4374. The observation was made on 1998 February 1 when rcso was '-' 0.05.
as the observations were made with the array pointed at the centre of the galaxy and
were sensitive to the entire field of view of SCUBA. The 3u upper limit on the 850pm
integrated flux within a region of about 2' diameter, just less than the SCUBA array, is
0.6Jy, giving the flux density upper-limits on the undetected low, level diffuse dust.
The results from the imaging and photometric observations are shown in Table 4.1.
The uncertainties are a quadratic sum of the uncertainty arising from the measured
signal-to- noise- ratio and a systematic calibration uncertainty, which varies from 10% at
850pm and lower, to 27% at 450pm. The 450pm fluxes listed for the 1998 Feb 01 and
14 and Jan 22 runs are 3a upper limits. The submillimetre flux variation over the four
observing runs was within the uncertainties on the fluxes.
55

4.3.1 Decomposing the SED
Figure 4.2 shows the spectral energy distribution (SED) for NGC 4374, including data
from radio (Jenkins et al., 1977) to infrared (IRAS) wavelengths. The infrared fluxes were
obtained from NED (the NASA/IFAC Extragaiactic Database) and have been interpreted
as thermal emission from dust (Knapp & Fatten, 1991; Goudfrooij, 1994). At longer radio
wavelengths, the lobes dominate the integrated flux from NGC 4374 (by a factor of 8 at
50Hz (Wrobel, 1991)) and give an excellent power-law of spectral index (5, oc ift) of
= —0.6 ± 0.03, as shown by the dotted line in Figure 4.2. This spectral index
is consistent with the classification of NGC 4374 as a steep spectrum radio galaxy. The
good fit suggests variability larger than the errors on the fluxes is uncommon for the
synchrotron power-law of the radio emission.
The submm data points for fluxes within the SCUBA beam and previous submm
measurements fall below an extrapolation of this steep radio power-law from the inte-
grated flux. No sign of extended emission from the radio lobes is visible on any of the
maps, and the 3a upper limit on the 850,um integrated flux within a region approxi-
mately the size of the lobes is 0.6 Jy. This is much higher than the extrapolation of the
radio power-law from the integrated fluxes, showing that the observations are insensitive
to the radio lobes (Figure 4.1). As is shown later, this indicates that if the observed
SCUBA 850 jtm emission is non-thermal in nature, it is dominated by the compact core
(or inner-jet).
56

-t C'
0
C)o
.
II 0
—
4
-
j0
• -o
o
' 4-
'-4
4
-
' 0
Cd
tO
Z
0 °
E- '
4- k ' to
t t
= C)
—w
ot
o to
, Cd —
04-
'4 C-)
0
.9 0 z
Cd
0,
tO
C
)•_
C
).-
I-
C)
C)
4-
cd
0
I- U'
CC
) d
-,
0
C)
4
t+
?
"4
ao c
4-4-0
'- 4
- .9
0
to .2
cd ©
c
C)
'0 0 0
4-
I-
-?
C)C
'-I tO
• 0 ' 0
4-'-
. 0
C) C
).0
U'
C)
"A
bo o=
c
to
bo
C)
c
Ci_a
=C
q
-= C
)
fa.icn 0
--o'
+
+
I I
'4,
"4-
N
I
C
0
a) S...
'4-
0'
0
—J
04
o go-
(Xr) (X
T!su
ap x
nij)b
oi
57

The Core SED
In Figure 4.2, the single available core-radio flux for NGC 4374 at 5GHz (Jenkins et al.,
1977; Wrobel, 1991) is plotted; the circles are the means of the SCUBA data listed in
Table 4.1. The 5GHz core flux together with the SCUBA data give a power-law slope
of a = —0.23 ± 0.03. In compact radio galaxies, such flat spectra have been found
to comprise spectra from many unresolved components, each with its own synchrotron
spectrum, the sum of which results in the observed flat power-law. Although there is
only one radio-core point and the SCUBA data, the observed flatter power-law of the
NGC 4374 core could be a consequence of such unresolved synchrotron components; but,
with the current data, this is only a suggestion rather than anything stronger at this
stage. At 5GHz, the northern jet in NGC 4374 is brighter than the southern jet for the
first 10" (Bridle & Perley, 1984); this one-sided inner-jet may comprise such unresolved
components.
It is worth noting that the SCUBA fluxes at 850, 1350 and 2000 pm alone give a
spectral index of ci 350011z= — 0.16 ± 0.32 in the submm, forming a flat spectrum re-
sembling that of a free-free emission component (or is characteristic of low-luminosity
blazars; see below and Section 53). While this 2000 to 850 pm spectral index is consis-
tent with that of free-free emission (a = —0.1), the large uncertainty on its value limits
the ability to prove conclusively its origin. The SCUBA 450pm data-point lies well be-
low this a = —0.16 spectrum, which does not help to prove or disprove its origin, but
instead adds the complication that this free-free component might have a high-frequency
cut-off between 850 and 450 pm. In steep spectrum radio galaxies such as NGC 4374, it is
uncharacteristic for a free-free component to dominate the power-law in the mm-submm
wavelength range (e.g. Gear et al., 1985). Therefore, if this component is real it would
-
-

have to come from very high ionization and it would be an interesting discovery. To
explore this further, the 'submm flat-spectrum component' in Figure 4.2 was crossed cor-
related with the well known spectrum of 3C 273, using data taken with SCUBA on 1998
February 15, just one night after and under very similar conditions as the photometry
observations of NGC 4374. The spectrum of 3C273 gives a much steeper slope and a
spectral index of Ce350GHz= — 0.7 + 0.1, as expected of this variable object during its
quiescent phase (Robson et al., 1993). Therefore, with the current limited data, it is
not possible to say if the 850, 1350 and 2000pm fluxes come from significant free-free
emission, if there is any at all.
In the case of CentaurusA, a low-luminosity FRI radio galaxy like NGC 4374, Hawar-
den et al. (1993) and Kellermann et al. (1997) determined a very flat nuclear mm-to-
submm spectrum in the core, which they attributed to a low-luminosity blazar (see
Chapter 5). In terms of the blazar/FR I unification scheme of AGN, a misaligned blazar
in the core is consistent with the FRI morphology that is seen in large-scale radio maps
of NGC 4374 and CentaurusA. While a very flat spectral index is also consistent with
free-free emission (& = —0.1) from ionised gas in star-formation regions, high resolution
VLBA observations of Centaurus A by Kellermann et al. (1997) set lower limits of 1010 K
on the core brightness temperature, thus excluding free-free emission from star-formation
as a possible contributing factor. Therefore, if the core of NGC 4374 is as compact as
in CentaurusA and has similar brightness temperature, free-free submm emission may
indeed be highly unlikely in this case too. Furthermore, if indeed the submm core spec-
trum of NGC 4374 is flat as the observations indicate, the results would, more plausibly,
support the hypothesis that flat spectra are a characteristic of low-luminosity blazars
(see Section 5.7). Submm observations of a larger sample of low-luminosity blazars are
59

needed to provide a more definitive test.
To model the radio to infrared SED, a combination of a power-law (non-thermal
radio emission from the active nucleus) plus greybody (re-processed emission from dust
(Hughes et al., 1994)) was used. 2 The composite model flux is
= Czr° + QBR(fl[l - exp(—(A
))]. (4.1)
In equation (4.1), C is the normalisation for the power-law component, a the power-law
spectral slope, Q the solid angle for the greybody component, B(T) the Planck function
at temperature T, A. the wavelength at which the optical depth is unity and /3 the emis-
sivity index of the grains. The normalisation factors (C and 0) are obtained by forcing
the model to agree with the 5GHz core-radio and IR (60 and 100pm) fluxes respec-
tively, since the two components dominate in these different wavebands. The power-law
index and its uncertainty were estimated from linear regression fits to the core-radio plus
SCUBA data in a log-log plot. It is assumed that the BIAS emission comes from a region
less than -..' 10" due to lack of extension seen at 450pm. The best fit temperature and its
uncertainty for the greybody component were estimated by eye from plots of the compos-
ite model versus the data. Other parameter values (A., = 7.9 pm and 0 = 1.3±0.5) were
fixed at the values given by Hughes et al. (1994) in their study of M 82. The parameter
values determined from the model are summarised in Table 4.2, and the model is plotted
as a solid line in Figure 4.2. The greybody fit demands that the warm dust emission
comes from a very compact zone, much smaller than the SCUBA 450pm resolution (see
Table 4.2). The simplest explanation for the 450pm data point lying below the sum of
2 The composite model was constructed by Anne Sansom in collaboration with L. L. Leeuw and E.I. Robson for a paper presented by Leeuw et al. (2000).
Mf

the thermal and non-thermal emission (see Figure 4.2) is that the synchrotron spectrum
steepens between 850 and 450pm (or somewhat longward of 850pm, given the uncer-
tainties). Some small part of the 450 pm emission could be due to low surface brightness
dust of - 15 to 20K. Better spectral coverage and higher signal-to-noise data in the
submm are clearly needed to test more complex spectral models.
Table 4.2: Parameters determined from the model fit to the SED for NGC 4374
Parameter Value Uncertainties Units -0.23 ±0.03 - 3.96E-11 - steradians 1.46 - arcseconds
T 35 ±5 K
4.3.2 Dust Mass and its Implications
The temperature that fits the IRAS data and is constrained by the SCUBA 450pm
measurement is '- 35±5 K (see Figure 4.2). Not surprisingly, this is the same temperature
as Goudfrooij (1994) found for this galaxy from his analysis of the IRAS data alone.
Changing 0 between 2.0 and 1.0 makes very little difference to the best fit temperature.
The mass of the emitting dust Md is derived as in Section 1.3.1. Using the distance of
20.74 Mpc for NGC 4374, as assumed by Goudfrooij (1994), and the grain mass absorption
coefficient of On = 2.5 m 2 kg' (Hildebrand, 1983), a dust mass is estimated of 1.2 x
10 5 M® for SlooMm = 0.98±0.21 Jy and IL' = 35K. The dust mass calculated for N0C4374
is about the same as Goudfrooij & de Jong (1995), as expected since they used the same
temperature. Furthermore, it is similar to that found in a recent HST (V - I) study of
the dust lane in NGC 4374 by Bower et al. (1997), who found the dust mass to be in
agreement with that derived from IRAS data, in contrast with the dust deficit found in
[ill

other optical studies of ellipticals (Goudfrooij & de Jong, 1995). However, for NGC 4374
this is at least one order of magnitude lower than Knapp & Fatten (1991), who assumed a
cooler temperature of 18K (based on objects in their sample of nearby radio galaxies for
which 1350, 800 and 450 pm fluxes were detected). Also, they obtained the higher mass
even though they assumed a smaller distance of 13 Mpc. While the low dust temperatures
(15 to 20K) estimated by Knapp & Fatten (1991) are similar to the Galactic Flane value
ofT = 19K, they are inconsistent with the SCUBA plus IRAS observations of NGC 4374
if the dust is assumed to be all a single temperature of 35K (Goudfrooij, 1994; Leeuw
et al., 2000).
As for the extended radio-lobe emission, the extended low-level emission from diffusely
distributed dust was not detected with SCUBA. The 2000 to 850 pm data from the central
region of the galaxy are most unlikely due to diffuse cold dust, but some small part of
the 450 pm emission could be due to dust ofs 15 to 20K. Also, the 3cr upper limit to the
surface brightness at 450 pm is too high and not useful for setting dust mass upper limits
on this possibly colder dust. Deeper SCUBA imaging observations are clearly needed to
address this question.
A very rough dust mass limit is estimated for the diffuse dust using the 3cr upper
limit of "s 0.6Jy on the 850pm integrated flux within a region of about 2' (13kpc of
the galaxy) diameter, which is the flux density upper limit on the undetected low, level
diffuse dust as well as the extended radio-lobe emission (c.f. Section 4.3.1). Assuming the
distance of 20.74 Mpc for NGC 4374, as above, and the grain mass absorption coefficient of
= 0.15 m2kg' (Hildebrand, 1983), a dust mass is determined of 3.6 x 10 7M® and
1.2 x 10 7M® for cold dust of T = 12 (as estimated by Leeuw et al. (2002) in CentaurusA)
and 18K (as assumed by Knapp et al. (1990) and is similar to the Galactic Flane value)
62

respectively. These mass limits for cold, diffuse dust are about two orders of magnitude
higher than calculated assuming the dust in NGC 4374 is all at a single temperature
of 35K (Leeuw et al., 2000). It is noted that the mass limits are of the order of the
dust contents in luminous spiral galaxies 10 6 to 108M®). Saying any more at this
point would be over-interpretation as the limits are very rough. Again, deeper submm
imaging observations are needed to place tighter constraints on the cold dust contents in
NCC 4374 and other ellipticals.
4.4 Conclusions
Following the suggestion that elliptical galaxies may contain diffusely distributed dust
(Goudfrooij 1994), this was searched for with submm imaging observations of the elliptical
galaxy NGC 4374, using SCUBA. Low-level, diffusely distributed dust was not detected.
The 3u upper limit on the 850 jzm integrated flux within a region of about 2' (13kpc
of the galaxy) diameter, just less than the SCUBA array, is "-' 0.63y, giving the flux
density upper limits on the undetected low, level diffuse dust. The emission at 850 jim is
spatially unresolved (diameter < 15"), showing that the detected dust is confined to the
central region of diameter < 1.5kpc.
Adding the SCUBA submm data to existing radio through IR data for this galaxy,
the core dust component can be constrained to a single temperature of -'.' 30 to 40K,
implying a dust mass of '-.. 1.2 x 10 5M® . The model fitting in Section 4.3.1 gives an
angular extent of the dust to be 1".5 in diameter, which corresponds to a size-scale of
only 0.15 kpc. Mindful that this result is too simplistic for a radiative model of an AGN
torus (e.g. Alexander et al., 1999), it is noted in passing that if there is a co-mixing of
the molecular gas and dust, this constrains the size of any molecular torus around the
63

AGN core of NGC4374 to around only 150pc in diameter. Using the 30' upper limit of
the 850 jim integrated flux within a region just less than the SCUBA array (tJ 13kpc of
the galaxy diameter), a very rough dust mass limit is determined of 3.6 x 10 7M® and
1.2 x 10⁷M® for the undetected cold diffuse dust of T= 12 and 18K respectively, which
is of similar order to the dust contents in luminous spiral galaxies.
The mm-submm observations show a flat spectral index that is consistent with the
5GHz radio core flux. The spectrai index of the 850 to 2000 pm fluxes alone is consistent
with that expected from free-free emission. The possibility of a free-free component is
very unusual and intriguing. Given the care taken over calibration, no systematic reasons
for the peculiar mm-submm SED seems likely.
.A flat mm-to-submm spectrum has also been observed in the core of CentaurusA (see
Chapter 5), and it may be characteristic of low-luminosity blazars (Hawarden et al., 1993).
If indeed the submm core spectrum is flat as the observations indicate, the results would
plausibly support the hypothesis that flat spectra are a characteristic of low-luminosity
blazars, as NGC4374 is a low-luminosity FRI radio galaxy like CentaurusA. Submm
observations of a larger sample of these objects are needed to provide a more definitive
test.
64

Chapter 5
Direct Imaging of Cold Dust
Structures in Centaurus A
5.1 Introduction
NGC 5128 (Centaurus A) is the nearest giant elliptical galaxy and is remarkable in several
respects. It is a powerful radio source with a double-lobed structure extending approxi-
mately 3.5° x 8°.5 on the sky (Bolton et al., 1949; Clarke et al., 1992; Tingay et al., 1998).
At the other extreme of scales a central source, less than 0.4 milliarcsec (-s 0.008 pc) in
extent (Kellermann et al., 1997), is prominent on radio through X-ray images. This feeds
subparsec-scale relativistic outflows that are approximately aligned with, and clearly the
generators of, the vast outer radio lobes.
The optical appearance is dominated by a dramatic warped dust lane at least 12'.5 in
E-W extent, which effectively bisects the main body of the elliptical galaxy and almost
completely obscures the nucleus and all optical structure in the inner 500 pc (e.g. Schreier
et al., 1996). The outer isophotes of CentaurusA are markedly elongated in P.A. -s 25°.
65

Faint shells, associated with both H I and CO emission, are evident in these outlying
parts (Malin et al., 1983; Schiminovich et al., 1994; Charmandaris et al., 2000). The
somewhat chaotic dust lane, and especially the shells, are strong evidence of a relatively
recent merger (Baade & Minkowski, 1954; Graham, 1979; Tubbs, 1980; Schreier et al.,
1996; Israel, 1998) which is generally believed (cf. Marconi et al., 2000, and references
therein) to be responsible for the nuclear activity.
Ha and molecular line observations (e.g. van Gorkom et al., 1990) indicate that the
nucleus is surrounded by a rapidly rotating massive inner disc with a pronounced warp
(Nicholson et al., 1992; Quillen et al., 1992), a scenario that is supported by modelling
of the structure of the obscuring dust seen in near-infrared (Qui!len et al., 1993) images.
At an assumed distance of 3.5 Mpc (Hui et al., 1993), 1" at Centaurus A corresponds
to 20 pc; hence, it is close enough that observations with large single dish telescopes and
interferometers can be used to reveal details of the structure of the galaxy at radio
through submillimetre (submm) wavelengths. Previous observations have been reviewed
extensively in the literature, most recently by Israel (1998). Here, new deep observations
at submm wavelengths, that are sensitive in particular to emission from cold interstellar
dust, are described.
Submm-wavelength emission, apparently thermal in origin, was first observed from
CentaurusA by Cunningham et al. (1984), using the single-pixel bolometer UKT14
mounted on the 3.8-m UK Infrared Telescope with a beam size of ".' 80". Millimetre-
wave continuum observations by Eckart et al. (1990) in 22" and 45" beams show an
unresolved nuclear source, surrounded by extended thermal emission seen by IRAS at
60 and 100pm and which is roughly co-extensive with a region of strong CO molecular
line emission. More extensive submm continuum observations were made by Hawarden
[i

et al. (1993), who mapped the galaxy using the smaller beamsize of '-' 15" afforded by
UKT14 mounted on the 15-rn James Clerk Maxwell Telescope (JCMT). Although ex-
tended emission was visible in their images, these were not sensitive enough to reveal
much detailed structure beyond a general extension corresponding to the optical dust
lane and a brighter, elongated, central feature, with an apparently thermal spectrurn,
surrounding the strong, flat-spectrum nuclear source.
This chapter presents new high-quality deep submm images of Centaurus A obtained
with SCUBA. These resolve the structure of the inner disc down to scales of r.-' 150 pc,
while also revealing details not previously seen of the faint outer dust emission at large
radii. These results are compared with observations by Mirabel et al. (1999) who used
ISOCAM, the infrared (IR) imager on the Infrared Space Observatory (ISO), to obtain
images at mid-IR wavelengths. Additionally, reprocessed IRAS data is used to comple-
ment the detailed study of the dust properties in the disc.
5.2 Observations
CentaurusA presents special challenges for observations at submrn wavelength from
Mauna Kea since it never rises more than 28° above the southern horizon. Images were
nevertheless obtained using SCUBA during several observing periods in 1998.
The simultaneous 850 and 450pm images were obtained during three nights (UT
1998 March 29, April 9 and April 11) during a period in which sky conditions were
exceptionally transparent, with zenith opacities often as low as 0.1 and 0.4 or better at
850 and 450pm respectively. The data were taken using the "jiggle-mapping" mode of
SCUBA. A series of seven overlapping field centres were observed, placed 55" apart along
a line at a position angle of 120° (North through East), roughly corresponding to that of
67

the dust lane of CentaurusA. The chop throw was 120" perpendicular to this line.
The strong overlap (> 50%) between neighbouring fields compensated for the limited
rotation of the very southerly source with respect to the SCUBA arrays, offsetting the
effect on the final reduced images of occasional excessively noisy pixels. A different subset
of the seven fields was observed on each of the three nights. Since the bright nucleus
appears on the central three fields, it was observed at least twice per night, allowing
corrections for pointing drifts to be measured and applied to the final images.
To determine the beam pattern of the JCMT, the bright unresolved blazar 3C 279 was
observed each night using the same jiggle-pattern mode as applied to CentaurusA. Atmo-
spheric opacities were determined from skydips made at intervals during the observing,
and instrumental gains were derived from images of the JCMT secondary calibrators
CRL 618, !RC+10216 and 16293-2422 (Sandell 1994, 1998). Corrections for pointing
drifts were incorporated in the final images using the fields in which the core source ap-
peared. The apparent core source size was reduced from 9.2 to 8".4 (FWHM) at 450pm
after the inclusion of these corrections.
An image at 850pm had been previously obtained under somewhat worse conditions
on UT 1998 February 14, 15 and 16. This image was made using the "scan-mapping"
mode and covers an area 4' square centred on the bright core source. Despite the lower
quality of this dataset, it provides a useful comparison for the reality of features in
the two 850 pm images. The sky transmission was not good enough on this occasion
for the simultaneous 450 pm data to be useful. The instrumental gains for the "scan-
mapping" mode observations are 20% less than those typical for the "jiggle-mapping"
mode; therefore, the gains have to be determined separately for the individual modes.
The beam in the 850pm "scan-mapping" image of CentàurusA in this paper is slightly
M.

larger than in the "jiggle-mapping" images and the photometry differences between the
two final maps are within and proportional to the uncertainties: the percentage differences
are larger in the less sensitive parts of the maps.
5.3 The Submm Images and Comparisons with other Wave-
lengths
The images of CentaurusA at 850 and 450pm obtained from the combined "jiggle-map"
datasets are about 6' long and 2' wide (respectively 7 and 1.7kpc at CentaurusA) and
cover much of the dust disc. They are shown in Figures 5.1 and 5.2. Figure 5.3 presents
the 850 pm image obtained froth the "scan-mappiné" observations.
The submm images show extended emission centred on the nucleus of CentaurusA
and oriented at a position angle of about 115 0 (North through East) on the plane of
the sky, clearly corresponding to the prominent optical dust lane. Within about 90" at
both 850 and 450pm, the emission has a much higher surface brightness than at larger
radii. The bright structures have a reversed S-shape suggestive of spiral structure or, as
pointed out by Mirabel et al. (1999), a bar.
The central source has a flux density per beam at least 40 times brighter than the
surrounding emission from the dust lane, as shown in the profiles along the major axis
in Figure 5.4. Furthermore, the close resemblance of the central source to the profiles of
the JCMT beam (line with crosses in Figure 5.4), shows the source is unresolved. The
point-source core has been isolated from the extended emission and separate submm-to-
JR spectral energy distributions (hereafter SEDs) have been constructed for the core and
extended galactic emission. These are discussed in Section 5.6.
69

0
U)
C
a) C) U
)
4.)
PC
co —
1 d
C
0
0
0
0
C
0
cv
C,,
0
C'2 63
• __
'—I
'rn
0
CQ
Co
tO
0
0
0
0
0
63
UO
fluijo
a
tdO
UD
ho- 4
-
4-
-= o- - 0
cd b
o -=
—
0 -
u,0
0
0
'I) 0.-
' fl. 0
0
bo .5
4-
ci]
0
-4-
0 t
-. o
0
Ct
-c • 0
0
ed
0 C
-
0
4-
-,
0 0
tE-
8 It
0
Cd 0
0
c•c 0
It
- td
.9
0
.6 Z
Cl
-c -c 0
- -
, 0
0
.- 0 o
0 orc
CD bO
0
cd I- -
0
- u
2
Ct
to b
O- 0
E ° _ - 0
bO
0
o
70

I•'L N
'
to
0
0
0
0
0
I I U
0fl9
u!p
9Q
D
'2
D
0
0
Co
a)
to
C) U
)
PC
D
D
'1 0
-I
6
00
00
00
6 do
I
CO
bO
00
=
0.
(0
=10
U.)
C) C
) C)
U
.0
C) C
) 0
4-.-
-
Ct
U, = Ce
- U)
I-
cd
H j0W
- 0
—
b
DE
tC
:c0
0
- U
be
C
a. :9
C
Ce'!
-a
C) --C
C)
r' -=cq
0
-
-a U
) =
0 —
(0
°
C)
r
-a =
=
Z E
C) a'
C) C)
I-
o 0
t
Ce •0
C
-a
C) a'bo
4-
C
.0
I , 4
--
C)
-a —
CJD Ce
+ - 0 - -
4-
C) -a
C) •C
ho C
) -C
.0
= 0
bC
.P
0
-a o
•4
0
• C
-a
o
C C)
1 0 — -a
Z
bO
C) Ce
C
I 4-a
2 —
4- - 0
bD
Ce
71

-
d
0
0
0
0
0
I
0
7. 0
CO
a) C) (I) 'xi
0
'0
C\2 0') —
1
o
o
0
0
0
0
0
0
C' 0
CO
0
CO
0
o
-
6i 63
0
0
0
0
Cvi III
o o
o
c',
0C)
O
-o C
)
bO
Q
C) 0
.c b.0
o •-'
- C
CL•
4.a
[C
- I- -
Ct
C) bO
E
Id C
a -,
C
ed
0•'
'C
[0
'to
C)
U
4-?
It
- C
)
C 0
p-b
C/D S S
bO
4-
I C '
-- C
C)
4-
o ° ©
'C
4-
•p—
o
bD
- ct
--C
C
'a
C
•_ -
00
. U
0'a
- C
t •-a
U
o -o .
4-
It C
C
4.a It C
— -
[C
• 0
•O
C)
C)
'a_
ta
=
g0 bO
72

6 a) .0
50.0 100.0 1500 2000 250.0
Pixel coordinate 1 (pixel)
7
1 6 a) .05
..- 4 a)
4.)
0
1
ri 50.0 100.0 150.0 200.0 250.0 300.0 350.0 400.0
Pixel coordinate 1 (pixel)
Figure 5.4: Profiles of the emission from CentaurusA at 850 and 450pm (top and bottom respectively) along an axis roughly coincident with the optical dust lane. The profile of the JCMT beam is superimposed in a line marked with crosses. This beam profile is obtained from a map of the JCMT pointing source 3C279 scaled to the peak flux of CentaurusA and determined along an axis roughly coincident with the major axis of the dust lane. The horizontal offsets are in pixels, re-binned so that one pixel equals one arcsecond, and the vertical axis is in Jy/beam.
73

0
—I
[i!I
0
'-4
G) C)
-I-)
0
CO tiC
0'-
'4
'4
CC
)
(0
(d o
-
' (0
0
-0- -
0) b
jD
0
o
:<
II
LM
Ce
0)
5.
—z
C
Ce
0
(0z
00
04•
'-4
C.-
0)0
UD
C
o
Lt)
C
v. 4-, 0
0
(0
C) 0
-'
C) -
•0
WD
C
i-0
o 0
co
o
o
0
0
0
0
0
0
0
o
CO C
CO
0
Co 0
Co 0
0
—1
0
0
0
0
Co
UO
flgufloeJ
0
CO
74

Figures 5.5, 5.6 and 5.7 show the 450 pm contours, from the highest resolution
SCUBA image, superimposed on 1) an optical J waveband image courtesy of the Anglo-
Australian Observatory 1 , 2) the 7pm ISOCAM image and 3) the 100pm IRAS, HIRES-
reprocessed image. In Figure 5.7, the 450pm image is smoothed to a resolution compa-
rable to that in the 100pm HIRES map.
The SCUBA contours were overlaid on the optical, ISO and IRAS images using the
Starlink program CONTOUR, within the KAPPA software package, which aligned the
images in the celestial co-ordinate system. Before the alignment, the KAPPA program
WCSFRAME was used to convert the images from their supplied celestial co-ordinate
frame and the epoch at which the sky co-ordinate system was determined to the Julian
2000 co-ordinate frame, which is the domain in which all the Centaurus A images here
are plotted. Aligning the images using the celestial co-ordinates was preferred because
CentaurusA has very different structure in the wavelengths that were compared here, and
there was no unresolved astrophysical source seen and known to be co-spatial in all the
frames. Such a source(s) would have provided a point(s) to do the alignment independent
of the astrometry accuracy of the different telescopes that supplied the sky co-ordinates
in their respective maps. The SCUBA and ISO images were exceptions to this; because,
in both cases the AGN core of CentaurusA was unresolved and much brighter than the
surrounding structure. For these two maps, registration was determined assuming that
the unresolved submm and mid-JR sources had a common origin on the sky and using the
JCMT supplied co-ordinates, because the telescope's pointing accuracy at the elevation
of CentaurusA is about 111.5 compared to 3".5 for ISO. This involved shifting the ISO
'riginal plate material for the Digitised Sky Survey in the southern sky is copyright (c) the Anglo-Australian Observatory and was used, with their permission, to produce the The Digitised Sky Survey at the Space Telescope Science Institute under US Government Grant NAG W-2166.
75

image by 6" west and 2" south to the SCUBA sky position. As noted in Section 5.3.2,
this results in remarkly well aligned extended and unresolved structure.
5.3.1 Submm vs. Optical Morphology
The well-defined reverse-S-shape structure that is seen in high surface brightness submm
emission, within 90" of the galaxy nucleus, is largely indiscernible in optical maps, imply-
ing that the denser material around the nucleus, seen in the submm, is heavily obscured
in the optical. However, the southern edge of the SE high surface brightness submm
emission aligns with the southern ridge of the optical dust lane, in turn suggesting that
the SE reverse-S-shape structure is on the near-side and therefore relatively less obscured
in the optical, as reported by Block & Sauvage (2000) and Quillen et al. (1993), based on
their analysis of mid-infrared versus V and near-infrared data respectively. Furthermore,
if the submm/optical morphology is a manifestation of a warped dusty disc or spiral
structure that is highly inclined on the plane of the sky (c.f. Section 5.5), the southern
edge is consistent with an inner fold of the disc seen tangent to the line of sight. Such
a ridge would have a high column density in the line of sight, as evident in the aligned
southern edges of high surface brightness submm emission and the dark optical lane.
The low surface brightness submm emission generally follows the optical dust ab-
sorption distribution, including the clockwise twists in the east and west of the dust
lane. This submm emission corresponds especially well with the dark optical obscuration
in the NW and NE and also the very dark twist in the east, indicating that some low
level submm emission must arise from the optically prominent dust material. There is
no marked difference between the flux densities of submm low level emission that cor-
responds with the dark optical obscuration in the NE and the low level emission in the
76

southern edge of the dust lane: in both regions, the flux densities are in the range - 40 to
120 mJy/beam and -.s 10 to 60 mJy/beam at 450 and 850pm respectively. Schreier
et al. (1996) find that the extinction in the southern ridge is much more than that in the
NE, where it reduces the R flux by a factor of 6 compared to a factor of only 1.5 to 2 in
the NE. Therefore, the similarity of the flux densities in the northern and southern low
level submm emission despite the higher extinction in the southern ridge indicates that
the NE dust lane is well in the foreground, in a region of low stellar density, and is thus
heated by a more dilute stellar radiation field.
Within the length (major diameter) of 270" that excludes the clockwise twists, low
surface brightness submm emission extends farther north and south beyond the optical
feature: the average width (minor diameter) of the dust feature seen in submm emission
is > 90" compared with the optical obscuration of < 60" (see Figure 5.5). The extension
is appreciably so in the south, where the dust giving rise to the submm emission here
lies on the far-side of the galaxy and is overlain by the stellar body. Consistent with this
scenario, when Schreier et al. (1996) removed the effects of foreground dust obscuration
from HST I' band images, they found a band of residual obscuration, presumably caused
by dust within the stars on the farther side of the galaxy.
While it is clear that the maximum width at which the dust lane will be detected
in extinction and seen in thermal emission will depend on the relative sensitivity of the
two techniques, the width at which the feature is detected in the submm observations
(> 90", cf. Figure 5.5) surpasses the maximum width detected in all optical observations
currently available in literature, including the recent HST (Schreier et al., 1996; Marconi
et al., 2000) and VLT 2 observations (< 60"), supporting the assertion that the low-level
2 VLT astronomical image gallery is available at http://www.eso.org/outreach/info-
77

13:25:40 35 30 25 20 15
r. 30 0
01:00
30
fiX!]
30
—43:00:00
02:00
03:00
Figure 5.6: Contours of the 450pm image of CentaurusA (see 5.2) superposed on a 7pm ISOCAM image (Mirabel et al. (1999)).
submm emission extends well beyond the optical obscuration.
5.3.2 Submm vs. ISO Mid-IR Morphology
Mirabel et al. (1999) presented images of CentaurusA at 7 and lSpm obtained with
ISOCAM as well as early SCUBA "jiggle-mapping" images of a 2' field around the core of
the galaxy at 450 and 850pm. They note the similarity of their lit (ISOCAM) and submm
(SCUBA) images (which are much less sensitive to faint emission than those presented
here), observing that there was the "same general distribution" between the "warm" and
"cold" dust seen respectively in the ISOCAM and the early SCUBA image published
by them. Mirabel et al. (1999) conclude that the absence of submm emission from the
optical dark lanes "is not due to major differences between the spatial distributions of
events/ut lfl/astroiinages.html
1121

the cold and very warm dust components," attributing the optical dust features to "small
amounts of cold dust in the outer parts" of the system.
The SCUBA data exhibited in this thesis, which have much greater sensitivity and
extend much farther from the nucleus than the images published by Mirabel et al. (1999),
show that there are remarkable similarities between the appearance of Centaurus A in
the mid-JR and the submm (see Figure 5.6 and 5.7). This is particularly true of the 450
and 7m images, even though their wavelengths differ by a factor of 65. Both images
show the reverse-S-shaped, high surface brightness submm structure out to 90" from the
core and the fainter extensions of this structure out to 120". The major difference is that
the submm emission is seen to much larger angular distances than is the mid-IR, and
as pointed out above, faint submm emission from some of the more outlying dust in the
optical dust lane is evident.
The contours in Figure 5.6 show a feature extending to about 15" radius from the
nucleus in position angle 145°; this may correspond to that attributed to a circumnuclear
torus by Hawarden et al. (1993); Israel (1998) and Bryant & Hunstead (1999). The
SCUBA and ISOCAM images suggest it may represent the inner folds of the reverse-S-
shaped structure (or warped disc, c.f. Section 5.5) mentioned above.
5.3.3 Submm vs. IRAS Far-JR Morphology
Archival IRAS data for Centaurus A were re-analysed using the HIRES facility to extract
the best possible spatial resolution and to ensure the same registration of the regions to
determine integrated fluxes for comparison with the SCUBA and ISOCAM measurements
(c.f. Section 5.6). The resolutions achieved in the IRAS, HIRES-reprocessed images (of
Figure 5.8) are 60", 50", 80" and 90" respectively at 12, 25, 60 and 100zm, which are
79

SB
59
—43:00
0
01
C) q) o 02
03
04
05
13:25:50 40 30 20 10
Right ascension
Figure 5.7: Contours of the SCUBA image of CentaurusA at 450pm (see Figure 5.2) superposed on the IRAS-HIRES image at 100pm. The 450pm image is smoothed to a resolution comparable to that in the 100pm HIRES map (i.e. 90").
much larger than the 4" to 15" resolutions in the ISOCAM and SCUBA images.
As shown in Figure 5.8, the extent of the IRAS detected emission increases with
wavelength. At the short wavelength range (12, 25pm), the emission is extended to
scales comparable to the ISOCAM detections, while at 100 pm the emission is broadly
similar to the very extended 450 pm detections (see the 450pm image smoothed to a
similar resolution and overlaid on the IRAS 100pm image in Figure 5.7). A full analysis
of the mid-infrared to submm spectral energy distribution therefore needs to refer to

Cen.h
40
0•
200
Right o,c.n.io.
C.,'.
8
Rigt,t ,...n.i.. Right ,.c.,.ion
C.,'.
4,
41
.3
-
42',0
I3fl 40 30 2
Right , ..hioI,
CeM
8
I 3j.1j
Figure 5.8: IRAS reprocessed 12, 25 (top panels), 60 and 100 pm(bottom panels) images of Centaurus A.
particular spatial locations. The submm observations and 60 and 100pm IRAS data
allow this for the large-scale "cold" component out to -. 7 kpc from the nucleus.
In an early comparison of their 100 pm and CO (1-0) data, Eckart et al. (1990) con-
cluded that about half of the 100pm emission was more extended than the CO (1-0)
molecular disc and was not associated with massive star-formation, but rather with dif-
fuse "cirrus" clouds. They predicted that the submm extended emission would follow
this extended far-IR emission, which, as can be seen from Figure 5.7, is indeed the case:
the very low-level 100 pm emission exhibits a morphology with large western and eastern
warps comparable with the optical dust lane and the submm images. This also resembles
the distribution of the HI detected in Centaurus A (Schiminovich et al., 1994), indicating
that the HI emission traces the "cirrus" dust in this galaxy just as in the Milky Way.

5.3.4 Submm vs. Warped-Disc—Model Morphology
Figure 5.9 shows contours from the warped-disc model, that was proposed by Quillen
et al. (1992) and explored by Quillen et al. (1993), overlaid on the 850,um image of
Centaurus A in pixel co-ordinates and aligned about the high surface brightness, reverse-
S-shaped submm structure. The warped-disc model was originally determined to fit the
velocity field observed in CO emission (Quillen et al., 1992) and then modified to produce
the geometry that would show the absorption features observed in the J, H and K band
infrared images of CentaurusA (Quillen et al., 1993).
The overlay in Figure 5.9 shows that the overall reverse-S-shape morphology is more
extreme and the distance of the eastern- and western-disc warps is underestimated in the
model than in the emission observations. However, the correspondence between the two
morphologies, particularly from about radii 25" to 90", is striking, especially because
the model geometry was constructed to match infrared images tracing extinction and
a velocity field rather than an emission map. This good correspondence constrains the
disc inclination to the line of sight and position angle on the sky plane respectively to
65 ± 6° and 120 + 6°. Model plots with disc inclination and position angle outside these
deviations show less direct resemblance to the SCUBA images.
The contours in Figure 5.9 not only demonstrate how well the model corresponds with
the submm morphology but also illustrate the general disc geometry that is responsible
for the dust structure that is seen in complex IR-submm emission and optical extinction
images. In particular, the plot shows the almost face-on or high inclination of the disc
to the line of sight, that is not directly apparent in the SCUBA or optical data, together
with disc warps along a major-axis with (the more apparent) a SE-NW position angle of
120° on the plane of the sky.

360.0
340.0
WAK]
300.0
a)
280.0
a) 0
• 260.0 D L 0 0 U - 240.0 a) x Si
220.0
200.0
ll;I'Js]
160.0 180.0 200.0 220.0 240.0 260.0 280.0 300.0 320.0 340.0
Pixel coordinate 1 (pixel)
Figure 5.9: The inner 180" x 200" image of CentaurusA at 850 pm(see Figure 5.1), su-perimposed in pixel co-ordinates with contours from the geometric, warped-disc model, provided by Alice Quillen based on infrared-extinction work by Quillen et al. (1993) after modifications of an earlier CO-velocity model by Quillen et al. (1992). The contours illus-trate the almost face-on or high inclination of the predicted disc to the line of sight (c.f. Figure 5.10). The pixel co-ordinates are plotted so that one pixel equals one arcsecond, and the colour codes mark relative 850pm intensities.

100.0
MWIM -4
70.0
60.0 .3
.E 50.0 'a Li
30.0
10.0
2.8
2.4
2
1.6
1.2
0.8
0.4
0.0 10.0 20.0 30.0 40.0 50.0 60.0 70.0 80.0 100.0
Pixel coordinate 1 (pixel)
Figure 5.10: The face-on morphology produced from the warped-disc model of CentaurusA by Quillen et al. (1993) (cf. contours in Figure 5.9). The colour codes indicate relative model intensities, that are also marked out by contours at 90%, 70%, 50% and 30% of the peak intensity. The dashed contours are below 50% of the peak intensity, and the pixel co-ordinates are plotted so that one pixel equals 2.4 arcseconds.

The projected face-on morphology of the disc is displayed in Figure 5.10, where the
model prediction by Quillen et al. (1993) (cf. contours in Figure 5.9) is now plotted at
an inclination of 900. The central, spiral-shaped warp that manifests within radii 90" in
the submm and infrared emission maps (see, e.g., Figures 5.6) is also apparent in this
figure. The image supports the arguments in Section 5.5 that the warped-disc model
predicts the spiral-shaped feature of the colder and warmer material seen respectively in
the submm and mid-IR, rather well, without a need for any additional structures.
The morphology of the high surface brightness submm structure within radii r's 90",
as seen in comparison with the model plots, suggests the scale height of the disc is no less
than the 0.08 predicted by Quillen et al. (1993). A highly inclined disc with a lower scale
height would result in a model with line of sight intensities (or column densities) that
are relatively higher at the disc edges compared to the smoother folds and thus produce
a disc morphology with more pronounced edges and sharper warps (see Figure 5.11).
Plots of the disc that are produced with scale heights higher than determined by Quillen
et al. (1993) show less severe warps within radii r.J 90" and generally present a better
correspondence with the high surface brightness submm emission up to scale height r-' 0.14
(see Figure 5.11), suggesting that the dust seen in the submm emission may have a higher
scale height than determined in the model prediction. Scale heights higher than '-s 0.14
produce model morphologies that have very smooth high-brightness shapes with almost
no warping and thus show much less resemblance to the submm emission maps. Further
implications of the model on the data at the submm and other wavelengths are discussed
further in Section 5.5.
[11

100.0
EM
80.0
470.0
a) 4.)
50.0
00 40.0 C)
30.0
20.0
10.0
0.0 10.0 20.0 30.0 40.0 50.0 60.0 70.0 80.0
Pixel coordinate 1 (pixel)
100.0
_80.0
70.0
CV 60.0 a) 4-,
.9 50.0 •0 'I
00 40.0 U
30.0
20.0
10.0
3.2
2.6
2.4
2
1.6
1.2
0.8
0.4
0.0 10.0 20.0 30.0 40.0 50.0 60.0 70.0 80.0 100.0
Pixel coordinate 1 (pixel)
Figure 5.11: The warped-disc model of CentaurusA by Quillen et al. (1993) (cf. contours in Figure 5.9) is plotted with scale heights of 0.06 (top panel) and 0.14 (bottom panel). The colour codes indicate relative model intensities, that are also marked out by contours at 95%, 85%, 75%, 65% and 55% of the peak intensity. The pixel co-ordinates are plotted so that one pixel equals 2.4arcseconds.

5.4 The Submm Spectral Index Distribution
Using the 450 and 850 pm imaging data, the global spectral index distribution of Cen-
taurusA is derived at submm wavelengths and used to delineate the submm components
in the nuclear regions of the galaxy as well as to investigate the dust properties of the ex-
tended emission. The following procedure was used. The 450 pm data were first smoothed
to the 14" resolution of the 850pm map. The spectral index a, where S. cc tP, between
450 and 850pm was then computed as
a — - [5450 1 I 18501
log —I flog'—' ssoJ/ [450j'
(5.1)
where S is the flux density per beam at each point in the map. The uncertainty in the
spectral index is then given by
(Aa)2 = 5450\2 + (AS850\ 21 / / 850\ 2
5450 ) 5850 ) j / ( log.g ) ( 5.2) R where the variables are as for equation 5.1. The largest probable uncertainty in AS arises
from the calibration, especially for the 450pm flux densities. The maximum uncertainty
in the final map is estimated as I Aa 'max 1.5 and the mean uncertainty as I Aa 'mean
0.5. The uncertainty in the regions with a > 3.2 is most probably underestimated as this
is also the region of the map with the least sensitivity.
The spectral index map of CentaurusA between 450 and 850pm is shown in Fig-
ure 5.12. There are four regions apparent in the map. Contours at the spectral indices
2.0 (dashed lines) and 3.0 and 3.3 (solid lines) are overlaid to guide the eye to the less
obviously manifested features. In the nuclear area, the unresolved core and a feature
EfI

uo
qeu
rp
a
'a C
C
.-
cu
t o
tfl. @
1
c a
0
C.
a-cu
0
<0
0
—'
0.
It
E 0) 'a
—
0)5
C
. o
o
0
0
o
—I
0
0
0')
0
N
u-s CQ
0
0) C
,
C
o4
J
IC
C')
C
IL) N
C
') '-I
-4
in le
C')
eQ
e -4
0.
o
o
Ce tf)
CeC
I
C
Cd
.. •
C
0 —
-u C
)C
I
-I.
U
2 e
a
gC
eC
C) j
4
Ce -o
bo
- _,._ U
C
)C)
.0
0.
C) C
C)
—
C) =
IV
OA
ce
o
E
C) =
.0
c0 0
. C
a
ce
C •_
• 4 C
OC
eC
)U]
Ce -
C.)
C) C)
• C)
.0 s
_ =
0
-•U
t
:
Cd
I_C
u
C)
0. Ce
C) C'1
cs—. .0
L6C
) '-
! OtC
C
-a
't
C)C
eC
Ce
"4
-
CO C)
0
OI
: C)
çz4 CO
U)
C) C
u
4- C

apparently representing the inner jet are distinguished. Farther from the nucleus we can
discern, with progressively increasing spectral indices, the bright, reverse-S-shaped struc-
ture, familiar from the intensity maps, and the fainter outer dust, roughly corresponding
to the optical dust lane (see Section 5.3.1).
The spectral index of the unresolved core is close to zero, consistent with the
nonthermal spectrum from an AGN nucleus. These results confirm that the core source
has a flat submm spectrum (i.e. a 0), which is common for BL Lacs (blazars) (see,
e.g., Brown et al., 1989, and Section 5.7).
The feature which this thesis refers to as the inner jet is not evident on the intensity
maps but is prominent in Figure 5.12 as (green-blue) areas of low spectral index to NE
and SW of the nucleus. The spectral index of these areas is in the range 1.5 < a < 2.5
(see dashed contour lines). The northern extension is coincident with the inner radio jet
(Clarke et al., 1992), which, as implied by the designation in this thesis, is not considered
to be merely by chance. However, the observed spectral index is much higher than
would be expected from extrapolation of the power-law spectrum of the radio jet itself.
One possible explanation is that the submm spectrum is not a manifestation of the
electron distribution of the relativistic radio jet itself (or the jet overlaid by a warm dust
component), but rather of some internal mechanism (e.g. ionisation of gas) resulting
from the interaction of the jet and the ISM in the inner regions of the galaxy.
Brodie et al. (1983) and others have proposed that optical jets in galaxies such as
CentaurusA may be due to emission from interstellar gas that has been entrained and
heated by the flow of relativistic particles from the nucleus. The entrained gas would
generate free-free continuum emission with spectral index, in the optically thick case,
of a 2, consistent with the observed spectral range of the inner jet 1.5 < a < 2.5.
RE

The southern nuclear extension in the submm spectral map in this thesis is attributed to
the same mechanism, though in this case associated with the fainter counter jet recently
reported by Tingay et al. (1998) and Kraft et al. (2000), respectively from their high
resolution VLBI radio and Chandra X-ray images.
A similar interaction of the jet and interstellar medium was proposed by Joy et al.
(1991) based on their near-IR observation of the inner jet of CentaurusA, which mani-
fested itself as a region of 'bluer' colour, with spectral index 1.3 < a < 2.9, coincident
with the radio jet. Marconi et al. (2000) also reported a 'blue channel' coincident with
the radio jet, but they attributed it to low extinction resulting from relatively low concen-
tration of dust that has been mechanically 'evacuated' by the jet. This thesis disagrees
with this interpretation as there is no sign of a deficiency of emission on the 450pm map
at this location: the inner jet feature of Figure 5.12 arises from a relative enhancement
of emission at 850pm in these locations.
The spectral index of the inner disc is in the range 2.5 < a < 3.2, consistent with
thermal emission from dust. The lowest indices occur in an almost circular region about
30" in radius around the nucleus; this is coincident with an area of hot molecular gas
reported by Schreier et al. (1998) 1 from their HST observations. Emission with a steeper
spectrum (2.6 < a C 3.2, see solid contour lines) approximately traces the inner disc of
brighter structures seen in the 7 and 450pm images out to -s 90" (see Section 5.3.2
and Figure 5.6). Farther still from the nucleus, in the fainter outer disc the spectral
index increases to a rs 4. As underscored by the solid line contours in Figure 5.12, the
spectral index is asymmetric about the nucleus in the inner disc region of the map: it is
STSc!-PRC98-14 Electronic Press Release is available at http://oposite.stsci.edu/pubinfo/pr/1998/14 /pr-photos.html
ED

somewhat flatter on the eastern part of the inner disc, indicating slightly different relative
distributions of dust grains on either side of the nucleus.
If the dust seen in the maps presented in this thesis is emitting with blackbody
spectral index a = 2 + fi (where fi is the emissivity index), the spectral index in the
extended region implies that for a given temperature, the dust in Centaurus A has on
average a low fi., i.e. the dust is made of relatively large grains, and that its temperature
is fairly cool. Furthermore, the somewhat flatter spectral index in the south-east suggests
the dust in this region is made of smaller grains with moderately warmer temperatures
than those in the same region in the NW. This is not surprising as the SE is reported
to exhibit stronger HI emission (van Gorkom et al., 1990), weaker ' 2 C(1-0) and stronger
Ha line emission compared to the NW, that led Eckart et al. (1990) to speculate that
star-formation and its associated high radiation field were greater in the SE.
The uncertainty in the emissivity analysis in the spectral index map (Figure 5.12)
does not permit us to quantitatively examine the effects, if any, due to diffuse "cirrus"
grains in the map. The dust in the outer disc, where the emissivity index fi > 1.5, may
well consist of "cirrus" grains, which, as it is generally accepted (e.g. Rowan-Robinson,
1992), would have an emissivity index close to $ = 2 and temperatures 15 < T < 40K.
In fact, Eckart et al. (1990) associated the far-IR emission outside the molecular star-
forming disc (i.e. radius >'' 90") with "cirrus" clouds with scale height larger than
that of the molecular gas disc (c.f. Section 5.3.3); and they predicted that the submm
extended emission would also originate from dust constituting "cirrus" grains as could
well be the case.
91

5.5 Implications of the Multiwavelength Images
The submm images in this thesis demonstrate that outlying dust in CentaurusA is sig-
nificantly cooler than the material in the bright elongated features within " 90" of the
nucleus. This is naturally to be expected: at larger radii the ambient radiation field
heating the dust is more dilute because of the much lower density of stars (Eckart et al.,
1990; Schreier et al., 1996; Marconi et al., 2000). The emission from this dust generally
follows the optical dust lane.
Figures 5.6 and 5.7 showed that there are remarkable similarities between the appear-
ance of CentaurusA in the mid-IR and the submm, the major difference being that the
submm emission is seen to much larger angular distances than is the mid-JR. It follows
that the warped-disc model, consisting of tilted rings of material that absorbs galactic
light (Quillen et al., 1993), not only predicts structure of the colder material seen in the
submm (as demonstrated in Figure 5.9) but also warmer material seen in the mid-IR,
rather well, particularly for radii less than about r.j 90" of the nucleus. This scenario is
supported by Eckart et al. (1999), who showed that a warped structure of tilted rings
explained not only the line emission in the disc of CentaurusA (Quillen et al., 1993),
but also a complex absorption-line system towards the nucleus, without a need for any
additional structures.
From their ISO 7 and lSpm images, Mirabel et al. (1999) conclude from a comparison
with similar mid-IR images of the dwarf barred spiral NOC 1530 that the structure imaged
in the mid-IR in CentaurusA is itself a barred spiral: the prominent emission peaks
75" from the nucleus at each end of the bright mid-IR and submm structures are
hypothesised to be foreshortened arms twisting anti-clockwise from the outer ends of the
92

bar. Block & Sauvage (2000) support this proposal from their V, H, K and l5pm study
of Centaurus A, noting too that the warm dust seen by ISOCAM contributes little to the
extinction seen at optical wavelengths.
Kinematics is clearly important in understanding the true nature of the near-nuclear
structures in CentaurusA. Mirabel et al. (1999) address these in their Figure 4, a corn-
parison of the IR images with the CO kinematics in the form of a position-velocity (P-V)
plot from Quillen et al. (1992). On this figure, they identify the strong CO feature ex-
tending from-1'.2, 300kmr' to +1' .2, 800kmr' as the bar, undergoing solid body
rotation, and weaker outlying features at nearly constant velocity at larger radii as the
"typical" rotation curve of galactic discs.
However, an alternative interpretation of the PV diagram is that the "bar" represents
a nearly-complete, highly foreshortened, ring of material at a radius of '' 65" (1s 1300 pc).
In that scenario the concentrations of JR and submm emission NW and SE of the nucleus
represent the ends of the ring where the optical depth is maximised. Similarly, the "EW
high-velocity feature" mentioned by Mirabel et al. (1999), which they note does not fit
their scenario, is readily explained by another ring of molecular material at a radius of
20" (rs 400pc), tilted relative to the outer ring and evident on the mid-IR images as
two small extensions to the nuclear feature in PA 80° and 260°. Furthermore, the outer
features of the PV diagram also have an alternative interpretation: the feature >1 ' .7 SE
of the nucleus has the properties of an arc of material starting at radius of rj., 4.6 kpc
and ending perhaps 2kpc from the nucleus close to the minor axis: in a normal edge-on
spiral, such a feature would be interpreted as a spiral arm.
Marconi et al. (2000) also accept the bar model since its edges appear to be delineated
by linear concentrations of star-forming regions seen in their Pa a images, suggesting
93

that these delineate the shocks normally seen as dust lanes along the leading edges or
the midlines of galaxy bars in optical images. However, they also noted that their data
do not rule out a warped ring without a bar, as the star-formation is found in regions of
the warp that are tangent to the line of sight, and if the young stars are above or inside
the disc, they would indeed appear to be concentrated where the Paa emission is seen.
This thesis suggests the latter interpretation is more plausible for the following two
reasons. First, the same elongated distribution of Faa emission regions, which Marconi
et al. (2000) show to coincide precisely with the elongated mid-IR ridge that passes just
south of the nucleus, is equally coincident with the dense, narrow, optical dust lane that
passes south of the nucleus in Figure 5.5. Since this is the only feature of the bright
central complex (apart from the nucleus itself) that is potentially identifiable with an
optically-visible feature, we suggest that it is not in fact part of the near-nuclear complex
at all, but, as suggested by the models of Quillen et al. (1992), a manifestation of an
outlying fold or ring in the warped disc.
Second, it is noted that the bar-shocks traced by dust in early-type field spirals are
asymmetric about their nuclei, since they lie in the leading edges of the bars, while those
in late type systems are centred in the bars. However, the Faa emission regions in
Figure 13 of Marconi et al. (2000) pass by several arcsecs south of the nucleus from the
SE to west of the nucleus. This is not what would be expected of a shock in a bar in
a field spiral, but more the distribution to be expected if the star-forming regions are
associated with the trailing dust lanes in a typical spiral arm, or in this case the dusty
rings postulated by Quillen et al. (1992).
Therefore, the combined evidence to date from the CO kinematics, the mid-IR images,
the bright and faint submm features and the Faa images supports the warped-disc model
94

of Quillen et al. (1992) rather than indicating the presence of a true bar, and may even
represent spiral structure in the dust lane of CentaurusA.
One of the attractions of the bar scenario for both Mirabel et al. (1999) and Marconi
et al. (2000) is its expected utility as a mover of material from larger to smaller radii in
the disc in order to fuel the AGN. However, since the association of barred structure with
the presence of an active nucleus in field galaxies, though long looked for, is marginal at
best (cf., for example, Ho et al. (1996) and references therein), the presence of the AGN
cannot be taken as an argument for the reality of the putative bar. Not having a bar
to fuel the active nucleus is not too bad a loss; e.g. recent work by Duschl et al. (2000)
suggests that viscosity in a thin gas plane may alsà provide an efficient AGN fuelling
mechanism.
5.6 The Extended Emission Temperature and Dust Mass
Estimates
This thesis has shown that the central source is unresolved and has a flux density per
beam at least 40 times brighter and a spectrum markedly flatter than the surrounding
emission from the dust lane; i.e. the central source is clearly distinct from the extended
emission (c.f. Sections 5.3, 5.4 & 5.5 and Figures 5.4 & 5.12). The core flux densities
from 850 to 7pm are presented in Table 5.1, together with integrated flux densities
determined for two regions of the extended emission from the dust lane: (1) an ellipse of
60" x 180" minus the core measurement and (2) an elliptical annulus of (120"— 60") x
(450" - 180"). The far-IR flux densities are archival IRAS data for CentaurusA that
were re-analysed using the HIRES facility to extract the best possible spatial resolution
95

Table 5.1: Submm to Mid-IA. Fluxes of the CentaurusA Core and Extended Emission
Filter Frequency Core Inner disc Outer disc
SCUBA 850 350 8.1 ± 0.8 2.7 + 0.4 3.4 ± 0.5 SCUBA 750 407 8.1 ± 1.6 SCUBA 450 667 7.9 ± 0.8 16.9 ± 3.2 22.6 + 5.2 SCUBA 350 866 7.7 ± 1.9 IRAS100 3000 8 ± 2 119±20 181±36 IRAS60 5000 8 ± 2 96±15 77±15 IRAS2S 12000 ... 15+2 6±1 ISOCAM 15 20000 1.2 10.4 IRAS12 25000 ... 11±2 6±1 ISOCAM 7 42857 0.7 9.4
In columns four and five, the integrated fluxes presented are determined respectively in an ellipse of 60" x 180" minus the core flux and in an elliptical annulus of (120" —60") x (450"— 180"). Core fluxes have not been subtracted from the integrated fluxes for IRAS 100 and 60 filters as no reasonable estimate of the core fluxes at these wavelengths could be estimated from the present data. In the case of the 100 and 60pm core fluxes, the data listed are an extrapolation of the submm core SED (a?/ = 0.01, 5, cc v°) to 60pm (5000GHz), as the HIRES beams are very large (50" to 90") so that it was impossible to isolate the core fluxes from the extended emission.
and to ensure the same registration of the regions from which integrated flux densities
are determined. The ellipse and annulus are denoted respectively as the inner disc and
outer disc, as the two regions have different submm continuum morphology and spectral
index distributions (see Sections 5.3.2 & 5.4). The SED for the two extended regions
are plotted in Figure 5.13, and temperatures as well as dust masses determined for the
emission from these regions are discussed below.
The compact core is unresolved on the submm and ISO mid-IR images (FWHM < 8"
at 450pm and C 4" at 7pm, see Section 5.7). In the case of the IRAS data, HIRES
beams are very large (50" to 90") so that the core extent is impossible to constrain
and its flux not easily separable from that of the extended emission. Therefore, the 100
and 60pm core fluxes listed in Table 5.1 are an extrapolation of the submm core SED
/ 8770Hz - V81GHz - — 0.01, S. cc v°) to 60pm (50000Hz); and, for the inner disc IRAS fluxes
96

listed in the table, the integrated flux measurements were simply subtracted from these
extrapolated numbers. A further discussion of the SED of the submm core in Centaurus A
is carried out in Section 5.7.
The integrated submm to far-IR flux densities are fit by a two-component optically
thin greybody of the form
= (1 - exp(—A 0/A))[QiB(Ti) + Q2B(T2)], (5.3)
where S is the observed flux density at frequency ii, Q the solid angle for the greybody
component, B(T) the Planck function at temperature T, A0 the wavelength at which
the optical depth is unity and fi the emissivity index of the grains. First, a 12 and 40K
two-component greybody with dust emissivity index of 1.3 fits the data for the inner
disc, and secondly, a 12 and 30K greybody with dust emissivity index of 1.6 fits the
data for the outer disc (c.f. Figure 5.13). These fits, in particular the derived relative
emissivities and temperatures, are consistent with the spectral index maps, showing that
the average dust temperature decreases from the galactic core outwards. Unsurprisingly,
these temperatures are also consistent with the 42 and 32 K determined by Eckart et al.
(1990) from their 50 and 100pm IRAS flux densities alone, as well as the average r-' 40K
determined by Unger et al. (2000) from their 40 to 100pm ISO LWS maps of the inner
disc region.
The mass of emitting dust Md is derived as in Section 1.3.1. It is assumed that
values of the grain mass absorption coefficient are = 0.25 m 2kg' and =
3.3 mkg' (e.g. Hildebrand, 1983), yielding dust masses of 2.5 x 10 4M® for T = 40K and
9.6 x 10⁵M® for T = 12K in the inner disc and dust masses of 4.9 x 10⁴M® for T = 30K
97

Wavelength (Saran.)
40 K
I -
' 12K 7 /1
F
Frequency (OH.)
Wavelength (Saran.)
1000 200 20
30K
1"
1/ '22K
1000 101
Frequency (Cli.)
Figure 5.13: Integrated fluxes in two annuli centred on the core of CentaurusA. The upper frame for the inner disc of 60" x 180" minus the core flux and the lower frame for the outer disc annulus of (120"— 60") x (450" - 180"). The submm to far-IA. data points are fit by two component optically thin greybodies of temperatures 12 and 40K with dust emissivity index of 1.3 for the inner disc and 12 and 30K with dust emissivity index of 1.6 for the outer disc annulus.
IN
;; to
II
0.1
IN
t ID
I'
I
0.1
M.

and 1.2 x 10⁶M® for T = 12K in the outer disc. The total mass for the dust that emits
from the far-JR through the submm wavelength is then 9.9 x 10 5M® and 1.2 x 10⁶M0,
respectively in the inner disc and outer disc, giving an overall total of 2.2 x 10 6M® for
the dust lane region of the galaxy observed in this thesis (i.e. radii <225" or " 4.5kpc).
5.7 The Unresolved Core: Radio to Optical SED
Using the highest resolution SCUBA and ISO images, the extent of the compact core is
constrained to 8" in the submm and 4" in the mid-IR respectively from the 450 and 7 im
observations, i.e. the core is indeed unresolved, as would be expected if it is entirely a
manifestation of the unresolved central radio source (cf. Kellermann et al., 1997). Recent
near-IR and optical size constraints, the first-ever at these wavelengths, (< 0".2 at 2.2im
and < 0".1 at .8itm) by Marconi et al. (2000) are also consistent with the submm nuclear
emission size upper-limits.
In Figure 5.14 are plotted the fluxes of the core source for observations ranging from
radio (1.6GHz) through submm 850 and 450Mm (450 and 6770Hz) imaging data, other
submm measures from Hawarden et al. (1993), the ISO 15 and 7Mm results from Mirabel
et al. (1999) and H and J band near-IR values and optical I and R fluxes from Marconi
et at. (2000). The core spectrum is self-absorbed below 30 GHz and very fiat to higher
frequencies, up to about 1000 0Hz: with ajt = —0.01 (S cc v°, see Figure 5.14).
A fiat spectrum in this wavelength regime is common for BL Lacs (blazars). Hawarden
et al. (1993) and Ketlermann et al. (1997) determined a very fiat nuclear mm-to-submm
spectrum in the core of CentaurusA, attributing it to a low-luminosity blazar, as first
suggested by Bailey et al. (1986) from near-infrared polarimetry. Hawarden et al. (1993)
suggested that the flat mm-to-submm is a characteristic of low-luminosity blazars (and/or
99

Wavelength (microns)
• ,_i0 10' 10 1000 100 10 L Ul
10
0.1
0.01
• 0.001 0 a
0.0001
I 0 •
10'
10'
-,
r • 250K
700K,
1
- •1
.1 .I
1 10 100 1000 ic' i0' 10 Frequency (GHz)
Figure 5.14: The spectral energy distribution of the central core in CentaurusA. The open triangles indicate the SCUBA data points, while the solid squares and circles re-spectively indicate data as cited by Hawarden et al. (1993) and Marconi et al. (2000). The two curves represent thermal emission from warm dust with temperatures of 250 and 700K with an emissivity index, $, of 1.3.
jet sources at a large angle to the line of sight), which has been supported by observations
of NGC4374, another low-luminosity AGN (Leeuw et al., 2000, see Chapter 4).
While a very flat spectral index is also consistent with free-free emission (a = —0.1)
from ionised gas in star-formation regions, Hawarden et al. (1993) showed that this is
highly unlikely in the case of CentaurusA. This has been confirmed by high resolution
VLBA observati?ns by Kellermann et al. (1997), which set lower limits on the core
brightness temperature of 1010 K, thus excluding free-free emission from star-formation
as a possible contributing factor.
Therefore, the very flat mm-submm spectrum in the core of CentaurusA is indicative
of synchrotron emission, probably from the base of a jet, perhaps in the standing shock
(e.g. Gear et al., 1985). In terms of the BL Lac/FR I unification scheme, a misaligned
100

BL Lac object in the core is consistent with the FRI morphology that is seen in large-scale
radio maps of CentaurusA.
Marconi et al. (2000) concluded that the optical emission, and some fraction of the
near-infrared, from the core source in CentaurusA could also be attributed to non-
thermal emission from an AGN, as in the BL Lac scenario noted above, while the rest
of the near-IR emission is from warm, circumnuclear dust at 700 KI inaed, the near:
to mid-JR emission in the core of active galaxies is usually accounted for by thermal
emission from dust heated by an AGN (e.g. Rieke & Lebofsky, 1981), while the decline in
the SED at A < 2 pm is ascribed to sublimation of the dust close to the source (Sanders
et al., 1989). The data from Marconi etal. (2000) are plotted in Figure 5.14 and a 250K
greybody (representing a cooler component of the circumnuclear dust) is fitted to the
mid-infrared ISOCAM core fluxes.
5.8 Conclusions
The SCUBA 850 and 450pm images in this thesis show that the submm continuum
morphology and spectral index distribution of CentaurusA comprise:
1. The Nucleus and associated structures: A distinct, unresolved, flat-spectrum
AGN core is attributed to a low-luminosity blazar, plus a circumnuclear structure,
including, to the northeast and southwest, areas of low spectral index which it
is suggested arises from free-free emission in ionised gas entrained in the nuclear
outflow. -
2. Inner disc: A prominent, elongated feature that may be a circumnuclear ring (or
bar) extends across the centre of the galaxy out to a radius of 90". It contains
101

considerable real structure, including concentrations of emission towards its ends
and a reverse-S-shaped twist; this structure appears reflected about the nucleus.
The details of this structure are very similar indeed to what is seen on mid-IR
ISO images, so the cooler dust seen in the submm is very closely co-extensive with
the much warmer material (transiently heated by UV-photon absorption) seen at
7 and 15jtm, and which establishes that the inner disc is a locus of vigorous star
formation. It is also a strong source of CO emission with kinematics consistent with
a ring or rings of gas around the nucleus, rather than a bar, as has been suggested
elsewhere (Mirabel et al., 1999).
3. Outer disc and outlying dust features: Low-level emission, at least some
of which comes from the foreground material in the prominent optical dust lane,
extends to the eastern, and probably to the western, end of the submm maps. It
traces the clockwise twist of the optical feature.
Some of the observed low-level emission does not coincide with optically-visible
dust. The deep SCUBA images are, for the first time, showing the direct detection
of emission arising from dust that is in the far side of the galaxy, overlaid and
obscured by the stellar component of Centaurus A, and thus not seen in the optical.
A warped-disc model consisting of tilted rings (Quillen et al., 1993) predicts the
structure of the warmer and colder material, especially in the inner disc, rather well. It
appears that in this vicinity the JR and submm images to a large extent reveal the same
material; however, at larger radii, the dust is cooler because it is immersed in a much
less intense stellar radiation field. Alternative arguments are presented by Mirabel et al.
(1999) and Block & Sauvage (2000), who interpret the mid-JR (and brighter submm)
102

structures as a true barred spiral.
Using the continuum integrated fluxes from far-IR through submm wavelengths a
totai dust mass of 2.2 x 10⁶M® is derived within a radius of 225" of the nucleus of
CentaurusA. About 45% of the dust mass is in the star-forming inner disc within about
C 90" of the nucleus.
103

Chapter 6
Properties and Outflows of Cold
Dust in M82
6.1 Introduction
Massive ejections of gas and dust originating in galactic nuclei have been observed at
scales of a few kpc in optical emission lines, submillimetre molecular lines, radio con-
tinuum emission and soft X-rays (e.g. Watson et al., 1984; Devine & Bally, 1999). One
explanation for the outflows is that a high supernova rate in the galactic nucleus heats
up the surrounding gas to high temperatures and sound speeds exceeding the escape
velocity of the galaxy, creating a wind that expands outward from the galaxy (Chevalier
& Clegg, 1985). The wind entrains cosmic rays, warm and cool gas, as well as cool dust,
making the outflow visible in many wavebands. The outflows are usually oriented along
the minor axes of the galaxies and are thus most easily observed in edge-on galaxies.
Figure 6.1 shows detailed, filamentary outflows of the H. winds of the nearby galaxy
M82, that were imaged in B (0.45pm), V (O.Spm) and H. (0.65pm) filters during the
104

Figure 6.1: The H. outflows from M82 as imaged in B (0.45zm), V (0.5pm) and H. (0.65 jim) filters during the commissioning of Subaru's Faint Object Camera and Spec-trograph. The field of view is about 6' in diameter and centred on the position of the galactic nucleus. The image is provided courtesy of the Subaru Telescope.
commissioning of the Faint Object Camera and Spectrograph on the Subaru Telescope,
provided courtesy of the National Observatory of Japan. As described above, it is thought
that this outflow is being driven by the copious formation of massive stars (or a starburst)
and subsequent explosions of supernovae. The starburst outflow not only provides the
ejection mechanism for the material from the galactic nucleus, but also heats the gas and
ionises the hydrogen, causing it to glow with the red light of H. emission line.
M82 (NGC 3034) is a favourite object in which to investigate the physical association
105

between galactic nuclei and large-scale outflows. The galaxy is edge-on with an inclination
of about 100 at position angle 72° and is classified as Irril. At an estimated distance of
3.25Mpc (Tammann & Sandage, 1968), it has optical dimensions of 11'.2 x 4 1 .3, i.e.
10.8 x 4.1 kpc. The nuclear region, within 4' x 2' about the major axis of the galactic
disc, has numerous point sources or emission concentrations, some of which originate
from supernovae and massive star clusters, that have been detected from the X-ray to
radio wavebands. Layers of dust filaments laden these inner regions producing severe
optical extinction and copious infrared to submm re-radiated emission.
A spectacular natural-colour composite, optical-band photograph of the inner region
of M 82 obtained with the Hubble Space Telescope, courtesy of Dr. Richard de Grijs at
Cambridge University, is displayed in Figure 6.2. This detailed HST image shows more
than 100 compact groupings of about 10 stars in very bright star clusters as white dots
sprinkled throughout M 82's central region, the prominent dust lanes that crisscross the
disc - including a huge dark-cloud of dust just above the centre of the picture, knotty
filaments of nitrogen and hydrogen gas (of Figure 6.1) in a strong galactic wind that is
clear below the centre and to the right of the image, and many other regions of varying
star-formation environments in the nuclear parts of this galaxy (see, e.g., Section 6.4 or
de Grijs, 2001). The huge clusters of massive stars, numerous X-ray and radio detected
supernovae, gas concentrations, optically-dramatic dust filaments, galactic winds and
other active nuclear features have been attributed to a large burst of star formation 10 7
to 108 years ago, that was probably triggered by a tidal interaction with the nearby
galaxy M81 (see, e.g., Förster Schreiber, 2000, for a recent review).
It is noted that up until the early 1960s, it was believed that the chaotic optical
morphology and extended H. emission in M 82 was caused by a single massive explosion
106

at the centre of the galaxy (e.g. Lynds & Sandage, 1963). It was only after the discovery of
the many supernova remnants, clusters of massive stars and large amounts of outfiowing
molecular gas, did it emerge that the nuclear morphology and outflows were a result of
the star-formation and subsequent explosions of supernovae.
Figure 6.2: The natural-colour composite of the central region ofM82 reconstructed from photographs obtained with the HST's Wide Field and Planetary Camera 2 in blue, green and red filters, courtesy of NASA and ESA. The image shows more than 100 compact star clusters as very bright, white dots sprinkled throughout the central region; prominent dust lanes that crisscross the disc; and knotty filaments of hydrogen and nitrogen gas in a strong galactic wind that is clear below the centre and to the right. These features together manifest varying star-formation environments in the nuclear parts of this galaxy. The field of view is about 21.5 x 2'.5.
The proximity of this galaxy makes it possible to observe the region of interaction
107

between the star-formation regions and the halo, including expanding radio shells and
"chimneys" that are producing a clearer picture of the localised driving mechanisms for
the outflows (e.g. Wills et al., 1999). The proximity also allows the detections of low-
level emission in the halo and consequently the determination of the amounts and possible
origin of material that results in this emission (e.g. Seaquist & Clark, 2001). Studying the
contents and interactions between the star-formation regions and the halo is important
for understanding their role in the evolution of M 82 and may provide clues to general
galaxy evolution as well as details of the composition of the intergalactic material.
This chapter focuses on the SCUBA maps of the copious submm re-radiated emission
that results from the dust-laden, nuclear disc, as well as large-scale, low-level emission
that is associated with the outflows in the halo of M82. Submm continuum observations
of the dusty central regions in M 82 were previously obtained with UKT 14 by Hughes
et al. (1990, 1994) and later with SCUBA by Leeuw et al. (1998) and Alton et al. (1999).
The current study was intended to extend these previous imaging submm observations
in spatial extent, sensitivity and to all the four submm wavelengths available with the
SCUBA array (see Section 6.2). The study includes a co-addition of data observed by
other astronomers and mined from the SCUBA Data Archive, as well as exploratory
observations that were obtained with the 180" chop throw rather than the 120" chop
that is customarily used at the JCMT for mapping extended emission.
The co-added data produce the deepest submm continuum maps yet of M82, in
which low-level emission is detected out to 1.5kpc for the first time in the submm con-
tinuum of this galaxy. The deep maps are used in a detailed morphological study of
the nuclear and large-scale detections (see Sections 6.3 and 6.5), including a focused
comparative analysis to optical (see Section 6.3.1) and high-resolution CO (1-0) (see Sec-

tion 6.3.2) morphology. The maps are also used in the computation and investigation
of the first submm spectral index distribution of the high-brightness, nuclear region (see
Sections 6.4 and 6.5). These observational results are used in the discussion of the origin
and structure of submm continuum morphology and spectral index distribution of M82
and reviewed in the context of relevant interpretations by other researchers, including
those who use data from other wavelengths (see Section 6.5). In particular, (a) the com-
monly assumed interpretation that the double emission peaks that are seen in the mm
to infrared continuum are due to emission from the edges of an inclined, dusty-molecular
torus is challenged (see Section 6.5.1), (b) an analytical review of CO results is under-
taken to assess if CO emission may significantly contaminate the continuum observed in
SCUBA filters (see Section 6.5.2), and (c) a morphological comparison is conducted to
check whether the localised outflows that are reported in radio and SiO maps respectively
by Wills et al. (1999) and Garcfa-Burillo et al. (2001) can be seen in the SCUBA maps
(see Section 6.5.3). Furthermore, preliminary analyses are conducted to investigate (i)
whether Maximum Entropy Method deconvolution can improve the SCUBA resolution
of standard JCMT sources (see Section 6.6.1) and the deep submm maps of M82 (see
Section 6.6.2), and (ii) if observations with the 180" chop throw can improve the detec-
tion of the submm continuum in M 82 (see Section 6.6.3), as the large throw was designed
to chop clear of any unknown low-level emission. Finally, the overall implication of the
results are discussed and possible future work is outlined (see Section 6.7). It is empha-
sised that the results in this chapter are presented as work in progress, and therefore
some of the conclusions are rather preliminary.
109
6.2 Observations
SCUBA 350, 450, 750 and 850 pm imaging observations of M 82 were obtained with the
telescope pointed at the 2.2 pm infrared nuclear peak of the galaxy using positions from
Dietz et al. (1986). Jiggle mapping observations were conducted with the secondary
chopping in azimuth at 7.8 Hz and with a throw of 120", the recommended maximum
chop when using SCUBA on the JCMT. On a separate occasion, a chop throw of 180" was
used in an attempt to chop clear of any extended emission. The imaging observations
employed the common 64-point jiggle pattern with a 3" offset between each position,
giving fully sampled images with both arrays.
Because M82 has been a popularly observed source with SCUBA, additional maps
that were obtained with a chop throw of 120" by other observers were mined from the
SCUBA Data Archive in order to co-add the related data and maximise the signal-to-
noise in the final maps. Following JCMT guidelines by Sandell (1998), data sets from
the SCUBA Archive were separately flux calibrated and corrected for JCMT pointing
errors and then co-added, with each observation being weighted according to its relative
integration time and the noise in the map. The 450-850 pm dual mapping wavebands have
been used more commonly than the 350-750 pm combination, and therefore the archival
maps constitute about 85% and 35% of the respective co-added, total-integration time
for the 450-850pm and 350-750 pm dual maps.
The imaging data analysis for all maps was undertaken using SURF software and stan-
dard SCUBA data reduction techniques (see Chapter 2). All the data were calibrated
using instrumental gains determined from nightly beam maps of Mars and Uranus, pri-
marily, or the JCMT secondary calibrators. Unfortunately, calibration observations of
110

the planets or the JCMT secondary calibrators were not obtained with the 180" chop
throw at the time. Instrumental gains determined from observations with 60" and 120"
chop throws can differ by as much as 20% (e.g. Sandell, 1998). Therefore, some gain
difference is also expected between observations with the 120" and 180" chop throws.
For this thesis, the observations from the 180" chop throw data set are presented with
calibrations determined from instrumental gains of the 120" chop throw, without any
attempt to compensate for the uncertainty introduced by the likely gain difference of
the 120" and 180" chop-throws. Those data are displayed with an emphasis only on the
morphology seen in the maps, until proper 180" chop throw instrumental gain observa-
tions, or 120" and 180" throw gain ratios, are available and these maps can be rigorously
calibrated.
There is also a calibration problem with the 750pm data of the 120" chop throw.
This is manifested in 'noisy' maps with a morphology that has no resemblance to the
other submm maps of M82. No obvious cause of this has currently been found. Alton
et al. (1999) reported a similar (unexplainable) 750pm calibration problem evident in
their spectral energy distribution (SED) diagram. These 750pm data are not presented
in this thesis and are being investigated by the JCMT staff. The SCUBA filter-drum has
been inoperable since the time of these observations, operating only at 450 and 850pm,
and so the problem is awaiting SCUBA to be restored to full filter configuration.
6.3 The General Submm Continuum Morphology
Figure 6.3 shows the 850 and 450 pm co-added maps of M82 that were obtained with
a chop throw of 120" in jiggle mapping observing mode, respectively at 14".5 and 8".5
resolution and about 8 and 110 mJy/beam sensitivity. Figure 6.4 displays the 350 pm
111

4 1:00 C 0
tt C
30
0
69:40:00
39:30
1.2
1
0.6
0.4
0.2
0
—0.2
05 9:56:00 55 50 45 40
Right ascension
41:00 C 0
C 30
a) 0
69:40:00
39:30
[I
5
4
3
2
1
0
Ob 9:56:00 55 50 45 40
Right ascension
Figure 6.3: Deep maps of the 850 (top pane!) and 450pm (bottom panel) continuum emission centred at the near-infrared nucleus of M 82 and obtained with a 120" chop throw. The 850 and 450pm contours on the respective maps are [16, 32, 48, 64, 96, 128, 200, 300, 400, 600, 800, 1000, 1175, 1350] and [225, 450, 900, 1450, 2000, 3000, 4000, 5000, 6000, 6800] mjy/beam; the rms uncertainties are about 8 and 110 mJy/beam. The keys are colour-coded intensities in Jy/beam, and the X and Y axes are J2000 coordinates.
112

9:56:00 56 52 48 44
0 -.3
tt
0 4,
M.
9
8
7
8
5
4
3
2
1
0
Eight ascension
Figure 6.4: Deep 350pm continuum emission maps centred at the near-infrared nucleus of M 82 and obtained with a 120" chop throw. The contours are 650, 1050, 1500, 1950, 2000, 3000, 4000, 5000, 6000, 8000, 9000 and 10000 mJy/beam, and the rms uncertainty is at least 325 mjy/beam. The key is colour-coded intensities in Jy/beam, and the X and Y axes are J2000 coordinates.
image, that was also obtained with a chop throw of 120" in jiggle mapping observing
mode. This has a sensitivity of 350 mJy/beam and the highest submm resolution of 6".7.
The chop throw of 120", that was used to obtain the maps in Figures 6.3 and 6.4, is the
standard recommended SCUBA chop for observing extended emission (cf. maps of the
180" chop throw that are shown in Figures 6.12 and 6.13).
The 850 pm image has a single emission peak that is centred about 9" west of the
galactic nucleus, while the 450 and 350 pm maps have two emission peaks centred about
10" and 6" respectively east and west of the nucleus along the galactic disc. The peak
in the west is slightly elongated along the galactic disc and is brighter than the eastern
peak, showing east-west asymmetry about the nucleus. The overall extended morphology
has an elliptical shape with the major axis position angle of 72°, i.e. roughly the same
113

as the galactic disc in the nuclear region. This general morphology is similar to previous
continuum observations at mm (e.g. Kuno & Matsuo, 1997; Thuma et al., 2000), submm
(Hughes et al., 1994; Leeuw et at., 1998; Alton et al., 1999) and mid-infrared (Telesco
et al., 1991) wavelengths, as well as to CO line transitions (e.g. Nakai et al., 1987) and
Ha (e.g. Devine & Bally, 1999) observations of comparable resolution.
It is noted that although the maps presented in Figure 6.3 have similar features
to those in published submm continuum maps by Hughes et al. (1994) and Alton et al.
(1999), the very sensitive 850 pm map presented here also shows that the 850 pm emission
(that is expected to be from cold dust) extends by at least 10" (' 160 pc) radius farther
into the halo than detected by those authors. Furthermore, the maps presented in this
thesis show that the 850 pm emission traces the CO(2-1) emission very well, contrary to
claims by Thuma et al. (2000) that the CO(2-1) emission is more extended than the cold
dust emission in M82, and therefore made the galaxy exceptional in this regard.
6.3.1 Submm vs. Optical Morphology
First, it is noted that the detailed Subaru Telescope and HST photographs shown in
Section 6.1 or other reasonable optical images of M 82 are not currently available in a
suitable format to be electronically overlaid with the SCUBA images for direct spatial
comparison in this thesis. The electronic maps are essential because the structure in the
optical image is rather complex (e.g. de Grijs, 2001) and spatial comparison of features
in the respective wavebands is best done with the maps overlaid in sky coordinates. The
following preliminary points are made about the submm versus optical morphology based
on overlays of scaled paper copies of the relevant maps. An analysis of the submm versus
optical morphology is important because the complex optical morphology that is seen in
114

M 82 is thought to result from obscuration of optical light by dust grains that re-radiate
in the infrared to submm wavelengths.
The submm morphology of M 82 generally resembles the optical picture in that the
nuclear emission has an apparently elliptical shape whose major axis is clearly aligned
with that of the galactic disc at a position angle of r.s 72°. However, the submm mor-
phology is much smoother than the optical, and the huge dark dust cloud that is slightly
to the left of centre and the prominent filamentary dust lanes that run north-south in
the optical picture (see Figure 6.2) are not obvious in the submm continuum. In fact,
the submm emission has a brightness peak west of the nucleus, i.e. on the opposite end
of the galactic centre to the dark dust cloud. The lack of correspondence between the
very dark optical clouds and filaments with bright submm emission suggests that these
optical features are due to obscuration by cool dust grains that are in the near side of the
galaxy and at large distances from the nuclear region, where they are heated by a dilute
stellar radiation field. Therefore, though they evidently have enough column densities to
obscure optical light in the line of sight, they only emit very low-level submm emission
that shows no striking features in the current maps.
One explanation for the submm low-level continuum having a relatively smooth mor-
phology is that, because this emission is optically thin, the detected radiation at a par-
ticular submm wavelength represents the total emission from the entire galactic column
of dust in the line of sight. This is different from the optical morphology of dust because
the dust is typically seen obscuring stellar light, and therefore only the dust in certain
spatial stratifications (usually the foreground) of the line-of-sight columns is observed.
In other words, morphology due to spatial-depth or stratification of similar dust grains
that are heated by a dilute radiation field is often more obviously seen in optical obscu-
115

ration than in submm emission. These morphological effects will of course depend on the
sensitivities of the instruments used.
Deep HST images of M 82 show optical morphology that is complex, with visual
extinction values (Av) that range from about 3 to 25 (e.g. Alonso-Herrero et al., 2001)
across the galaxy. The dust lanes must vary not only in their geometric structure but
also in their heating mechanisms and composition. Clearly, a more quantitative spatial-
correspondence and optical-depth analyses (and radiative modelling) of the submm versus
optical images are needed to make more definite assertions about the origin of any of the
features noted here.
It is noted that the submm peaks and high-brightness, diffuse emission that runs
east-west along the major axis of the galactic disc may be associated with east-west dust
lanes with a blue-brownish hue that are seen in the very central regions of M 82, shown
in Figure 6.2. In that case, the hot, massive, young stars that are responsible for the blue
hue could be heating the dust in these inner regions, leading to the submm high surface
brightness emission. This type of heating will also result in bright short-wavelength in-
frared emission as well as emission lines associated with intense star-formation which has
been extensively reported in M 82 (e.g. Alonso-Herrero et al., 2001). Further investiga-
tion of these central features will elucidate any differences between the heating of dust
in the central and outer parts of M 82.
6.3.2 Submm vs. High-Resolution CO (1-0) Morphology
Figure 6.5 shows black contours of the integrated-intensity-CO. (1-0) data, that were
obtained with the Berkeley Illinois Maryland Association (BIMA) interferometer by Shen
& Lo (1995), overlaid on the SCUBA 450 and 850 pm continuum images. The BIMA
116

69;41:
0 0
Right ascension
C
C
C C C
Right ascension
1.2
Os
0.6
0.4
0.2
0
-0.2
6
5
4
3
2
0
Figure 6.5: The central 76" x 56" region of M 82 at 850 (top panel) and 450 pm (bottom panel) overlaid with the integrated-intensity (black contours) of the CO (1-0) interferom-etry data by Shen & Lo (1995). The white 850 and 450pm contours on the respective maps are [200 to 1175] and [900 to 6000JmJy/beam, as displayed in Figure 6.3. The red 850 and 450pm contours are at 1350 and 6800 mJy/beam and are plotted to highlight the position of the respective western submm peak. The cross marks the 2.2 pm peak (Dietz et al., 1986). The keys and coordinates are as in Figure 6.3.
maps are at resolution 2".4x2".6 and are plotted to investigate the spatial correspondence
between the submm continuum morphology and the high-resolution CO features. It was
noted earlier that CO (1-0) (e.g. Nakai et al., 1987) and (2-1) (e.g. Thuma et al., 2000)
observations, that are of comparable resolution to the SCUBA maps, showed that CO
emission traced dust re-radiation rather well in the nuclear regions of M 82. Therefore,
the BIMA maps are expected to give a reasonable indication of how dust emission may
appear at higher resolution and perhaps also some insight about the structure seen in
117

the SCUBA images. The BIMA maps probably provide the best observational, high-
resolution evidence of nuclear structure that is associated with dust, as submm continuum
observations of dust in M 82 are not currently available at a resolution higher than 6".7,
that is obtainable with SCUBA at 350 jim (cf. Section 6.6.2 on resolution-enhancement
of the SCUBA images).
The first obvious difference between the SCUBA and high-resolution-BIMA maps is
that the emission peak that is indicated by red contours and appears about 8" west of
the nucleus in the submm maps is resolved into two peaks centred about 9" apart in the
CO maps. Of these two CO western peaks, the one closer to the nucleus is co-spatial
with the 450 jim (red contour) and slightly east of the 850 jim (red contour) western
peaks, and the one farthest from the nucleus is on the eastern edges of the submm 850
and 450 pm high-brightness lobes. Assuming that the CO and dust grains are mixed
and that the relative brightness of peak and diffuse emission in CO is similar to that
in submm continuum, then it is quite reasonable that the elongated submm western
peak corresponds with the resolved CO western peaks. In fact, the roughly 9" resolved
separation of these western peaks as seen by the 2".5-BIMA beam is consistent with the
10" unresolved elongation (in the same direction as the separation of the CO peaks) as
seen by the 6".7-350 pm and 8".5-350 pm beams. The good correspondence suggests
the BIMA maps do indeed give a reasonable indication of how dust emission peaks may
appear at higher resolution.
Contrary to indications above that the CO and submm emission peaks correspond
very well at the scale of the BIMA and SCUBA beam-sizes, it appears from Figure 6.5
that the CO, however, does not trace direct emission of diffuse dust in a very simple
way, particularly in the nuclear region west of the most western CO peak. Here, the CO
118

emission fans-out westerly at position angle 85°; i.e., it diverts from the 72°—position-
angle of the submm continuum lobes and disc along the major axis, as well as that of the
CO within a 10" radius from the galactic nucleus. There is some hint from the south-
western ridge of the high surface brightness continuum in the 850 pm and especially the
450 and 350 pm images that the dust emission also bends northward from the position
angle of 72°. This is strengthened by the data from the submm spectral index maps
(Figures 6.6 and 6.7) that are shown in Section 6.4, where the deviation is interpreted
as a manifestation of a star-formation environment that is different to that near the
galactic nucleus (also see Section 6.4 or Achtermann & Lacy, 1995). Higher resolution
observations of dust that will soon be possible with the commissioning of the Smithsonian
Submillimeter Array (Moran, 1996) and the Space Infrared Telescope (e.g. Deutsch &
Bicay, 2000) will provide direct observational evidence to further test how well the CO
and dust emission trace each other at the small scales shown in the BIMA maps. Those
future observations will also test if dust emission has more complex morphology than has
currently been detected, as is suggested by the increasing structure that is seen in the
SCUBA maps going from low to high resolutions. Further discussion of the origin and
structure of the submm emission peaks is detailed in Section 6.5.
6.4 The Nuclear Spectral Index Distribution
An analytical review of CO results is undertaken in Section 6.5.2 to assess if CO emission
may contaminate the continuum of M 82 observed in SCUBA filters. For one, significantly
different contributions in the 850 and 450 pm will affect the appearance of spectral index
distribution in this galaxy and indeed its interpretation. If the differences are impor-
tant, the spectral index distribution should in theory be calculated after correcting or
119

accounting for the CO contamination. It is currently not obvious if the contamination
to the higher-frequency continuum will be less or higher than the 47% estimated to the
SCUBA-850 pm band by Seaquist & Clark (2001); even though it is clear that it may
also be important (see Section 6.5.2). White relevant CO data need to be acquired in
the future to make a quantitative calculation of the relative contributions in the SCUBA
bands, for the practical determination of the spectral index of M 82 in this thesis, it is
assumed that the CO contribution in 850 and 450 pm data is the same.
The spectral index distribution of M82 has been computed from the deep 850 and
450pm imaging data that were obtained using a 120" chop throw and shown in Fig-
ures 6.3. The spectral index map is used to investigate the dust properties in the galaxy
and to probe the nature and extentof dust outflows entrained in the reported winds out
of the galaxy. First, the 450pm map was convolved with a gaussian function in order
to convert the 8".5 resolution of this map to the 14" resolution of the 850pm map. The
spectral index a and the relative uncertainty Aa in its determination were computed
using equations 5.1 and 5.2 respectively, as described in Section 5.4. Following equa-
tion 5.2, the estimated maximum error in the final spectral index map is I ia 1.ax 1.2
and the mean uncertainty is j zXa l me.0.3.
Figure 6.6 shows the spectral index map of M 82 between 450 and 850pm overlaid
with 850 pm intensity contours that range from 0.12 to 1.35Jy/beam and are adopted
from Figure 6.3. The distribution of the spectral index is asymmetric about the major
axis and delineates two unique areas: 1) a flattened region of minor radii 10", that is
outlined by a dark-blue colour in the middle of Figure 6.6 and referred to as the disc, and
2) a region north and south of the disc, that is marked by green and yellow-red colours
in the same figure and referred to as the inner-halo. The spectral index disc is slightly
120

58 56 54 52 9:55:50 48 46
69:41:
0 ~3
C —4 —4 0 a,
1.6
Right ascension
Figure 6.6: The spectral energy distribution map of M82 between 450 and 850pm is overlaid with 850 pm contours. The colour-coded key is the spectral indices, and the cross marks the 2.2 pm peak (Dietz et al., 1986). The contours are 850 pm intensities from 0.12 to 1.35 Jy/beam and separated as in Figure 6.3.
to the north of the dynamical nucleus and roughly co-spatial with the continuum disc.
The spectral indices range from about 2.3 to 2.6 in the star-forming disc to about
2.7 and 2.9, respectively, in the north and south inner-halo plateaus. These indices are
consistent with thermal re-radiation of low-emissivity (i.e. fi -.s 1.3; e.g. Hughes et al.,
1994) dust that dominates the emission in M82 at these submm wavelengths. In the
south of the disc, the spectral index gradient is steeper and more uniform than in the
north, as marked by the black contours that are stratified parallel to the major axis of
the disc (see Figure 6.7). The spectral index distribution is rather knotty in most of the
inner-halo, though with a general north-south asymmetry. The south is smoother and
has on average higher indices. In general, the spectral index distribution increases from
the nuclear region out along the minor axis of the disc, and is fairly flat along the major
121

axis.
It is worth mentioning some remarkable similarities between disc features in the spec-
tral index distribution map and those seen in the morphology of M 82 obtained from other
wavelengths. The spectral index disc has position angle '-. 72 0 , as seen at other wave-
lengths, but here its major axis goes slightly north rather than through the galactic
dynamical nucleus. About 18" west of the nucleus, the disc bends to position angle
85°, very similar to the bend seen in the CO (1-0) emission here (see Figure 6.7). The
CO (and also 850 and 450 pm) peak that is - 6" west of the nucleus is at the position
of separation between the regions of position angles 72° and 85°. The two regions are
referred to as the central and western discs respectively and will be discussed further be-
low. In maps of Nell by Achtermann & Lacy (1995), these regions show similar change
in position angles after the western emission peak; those authors refer to the area of
separation as the 'wedge'.
As mentioned in Section 6.3.2, the western disc is known to have relatively lower gas
density and thus also lower star-formation efficiency than the central disc (Achtermann
& Lacy, 1995). That the two regions have two different star-formation environments
is supported by optical spectroscopic studies by Förster Schreiber (2000) and de Grijs
(2001). In the submm spectral index map, the western disc is distinguished by a "hole"
with a .c 2.5, perhaps indicating a change from a dominance of thermal to non-thermal
emission, or a manifestation of the destruction of grains that see radiation directly from
the central heating of the galaxy. As shown in Figure 6.7, the contours of the CO (1-0)
fan-out westerly along the major axis of the disc in this region.
It is noted that the spectra] index distribution map does not have similar western
peaks to the 350, 450 or 850 pm continuum maps. The difference from the 850 pm is
122

58 56 54 52 9:55:50 48 46
0 4-,
0 4, o 40
10
30
20
3.6 3.4 3.2 3 2.6
2.6 2.4 2.2 2 1.8
Right ascension
Figure 6.7: The submm spectral energy distribution map of M82 is shown overlaid with red contours of the CO (1-0) interferometry data by Shen & Lo (1995). The colour-coded key is the spectral indices between 450 and 850pm and the black and white contours are spectral indices from 2.3 to 3.2 in steps of 0.1. The cross marks the 2.2 pm peak (Dietz et al., 1986).
especially surprising because that map is of similar resolution. Also, the spectral index
from the position of the nucleus to the position of the submm emission peaks (see, e.g.,
Figure 6.3) increases inversely to the flux density in the continuum maps, indicating that
the ratio of 450 to 850 pm, or temperature (as expected), is higher at the 2.2 pm nucleus
in comparison to that at the peaks. As with the continuum distribution along the disc,
the temperature increase about the nucleus is asymmetric, supporting suggestions in this
thesis that the submm emission in the inner disc originates from re-radiation of dust
concentrations rather than a dusty torus about the nucleus (see Section 6.5.1 below).
123

6.5 Origin of Submm Continuum Morphology and Spectral
Index Distribution
6.5.1 Source and Structure of the Nuclear Submm Continuum
The radiation at the radio, mm and submm-to-infrared wavelengths in M 82 is respec-
tively dominated by synchrotron emission from supernovae, free-free emission from ionised
gas, and thermal re-radiation from dust heated by young stars. In this light, the double
peaks seen in the mm to infrared continuum have commonly been interpreted as due to
emission from the edges of an inclined, dusty-molecular torus, that - as a result of their
geometry on the plane of the sky and optically-thin nature of radiation - have relatively
high optical-depths in the line of sight (e.g. Hughes et at., 1994). In Figure 6.3, and
other mm-to-infrared maps of similar or worse resolution (such as those from IRAS),
the double peaks are not resolved and appear as a single, elongated lobe that is brightest
in the southwest. Like the galactic disc, the lobe (or nuclear peaks when resolved-out)
has a position angle of roughly 72° and - in the tori interpretation (e.g. Shen & Lo, 1995)
- an inclination of -s 100.
The peaks of emission seen in the mm to infrared have alternatively been interpreted
simply as dust and molecular concentrations along the galactic disc, perhaps in a bar
structure (e.g. Neininger et al., 1998). This interpretation is supported by at least three
reasons. First, the east-west, double peaks have now been seen in maps of both optically
thin and thick CO emission (e.g. Petitpas & Wilson, 2000). This is reasonable if the
emission is from a structure that constitutes concentrations or clouds of dust but is
contrary to what is expected if the emission is from a structure with tori geometry that,
like the galactic disc, is thought to be highly inclined (e.g. Shen & Lo, 1995). For optically
124

thin radiation, it will be possible to detect emission from the inner parts of the imaged
structure, and either dust clouds or indeed edges of an inclined torus would manifest as
regions of relatively higher optical-depth or brighter optically-thin emission in the line
of sight (e.g. Hughes et al., 1994). However, as also noted by Neininger et al. (1998)
and Petitpas & Wilson (2000), for optically thick radiation, it will be possible to directly
detect emission only from the foreground surface of the imaged structure. In that case,
the dust clouds will be seen as two emission peaks, while the torus (or bar) will manifest
as an elongated, barlike emission of roughly the same optical depth or optically-thick
brightness.
Second, the two main peaks seen in maps of similar resolution as the 450 and 350 jim
images in Figures 6.3 and 6.4 are not symmetric. In maps of better resolution and
sensitivity (e.g. Shen & Lo, 1995, see the CO contours in Figure 6.5), the peak west
of the nucleus has a morphology clearly different from the eastern peak and can be
resolved into two or three structures. High resolution VLA maps by Wills et al. (1999)
show that the western peak is associated with locations of supernova explosions of higher
intensity and earlier evolutionary stage than the eastern peak. This is supported by high
resolution HST imaging of stellar clusters that indicates that the regions near the eastern
and western submm peaks have different star-formation histories (e.g. de Grijs, 2001). In
this light, the submm peaks indicate concentrations of dust environments associated with
different locations of varying supernova and star-formation activity, not the commonly
assumed dust torus.
Third, observations of line ratio gradients indicate that the average temperature
across the lobe increases from the northeast to southwest, while the density increases
in the opposite direction (e.g. Petitpas & Wilson, 2000). Further evidence of the higher
125

temperature or, at least, column density in the southwest is seen in the lopsided 850 and
750 pm lobe and the double-peak 450 and 350 pm lobes in which the southwest parts
are the brighter. A torus that probably houses and is heated by an active galactic nu-
cleus (e.g. Muxlow et al., 1994), would be expected to have temperature and density that
increase from its inner to outer walls. One explanation for the higher temperature and
lower density in the the southwest is linked with star-formation activity that both heats
and depletes the interstellar medium (ISM) at this location (Wills et al., 1999), or simply
western and eastern regions of two different star-formation physical environments (e.g.
Achtermann & Lacy, 1995; Forster Schreiber, 2000; de Grijs, 2001). Evidence in this
thesis in terms of clearly asymmetric submm emission seen in almost all the presented
intensity and spectral index distribution maps seems to disfavOur the commonly assumed
interpretation of a dusty torus in M82.
6.5.2 Possible CO Contamination of the Submm Continuum?
It is worth noting that the dust morphology that is mapped in the submm continuum
from M82 may be substantially enhanced by CO emission from this galaxy. A recent flux
comparison between CO(3-2) emission and 850 pm continuum in M82 showed that CO
makes a 47% (i.e. high) contribution to the integrated continuum in this SCUBA band
(Seaquist & Clark, 2001). From analysing collated CO(4-3) observations together with
those of CO at lower transitions, Guesten et al. (1993) concluded that the line strengths
in M 82 increased as one went to higher transitions, indicating that the higher transitions
must provide significant cooling in the galaxy. All SCUBA bands have roughly the same
widths, i.e. 30GHz, and therefore the CO contribution to the higher frequency continuum
would be expected to be equally or more significant than that reported for the 850 pm
126

band by Seaquist & Clark (2001). However, because the submm continuum in M82 has
a thermal spectrum (e.g. Hughes et al., 1994), and therefore the submm fluxes increase
with frequency, the CO contribution to the higher frequency continuum may be less than
the estimates for the 850 pm band.
Recent observations using a new high frequency, Fabry-Perot spectrometer on the
JCMT have lead to clear detections of the high transition CO(7-6) in M 82 and NGC 253
(Bradford et al., 1999), the first such detection in any extragalactic sources. The analysis
by Guesten et al. (1993) and the recent detections of CO(7-6), whose transition line lies
in the 450 pm filter bandpass, suggest that other higher transition lines, such as the
13CO(8-7) line that lies at the centre of the SCUBA 350 pm band, could be very strong
in M 82, supporting the proposition above that the high frequency SCUBA images may
have significant contribution from CO. In this light, the morphology seen in the SCUBA
images is a direct probe of the galactic cooling and the generai interactions of active star
formation and the ISM in M82.
If molecular line contamination is indeed significant in M 82, it could explain some
small differences seen in the 450 and 350 pm continuum, such as most obvious in the
maps obtained with the 180"chop throw shown in Figure 6.13. The 350 pm observations
have only a slightly better resolution than the 450 pm and are separated only by 100 pm
in wavelength space. Also, the fluxes from the two wavebands are both on the Rayleigh-
Jeans slope and are expected to come from optically thin dust of roughly the same
temperature. Therefore, the ëontinuum morphology is expected to be the same. However,
the contamination by lines of different transitions could be of varying degrees in the two
continuum bands, particularly if the conclusion by Guesten et al. (1993), that the line
strengths in M 82 increased as one went to higher transitions, is applicable in these bands.
127

It is noted that because the transitions lines are narrow compared to the continuum
bandpass, their total flux would have to be extremely large, in order to have a continuum
contribution of say higher than 47% (e.g. Seaquist & Clark, 2001), and would indeed
prove that the lines provide significant cooling in the galaxy.
Although it is not obvious if the CO contribution to the higher frequencies of SCUBA
will be less than or as significant as estimates by Seaquist & Clark (2001), it is clear that
the CO contamination to higher-frequency continuum warrants investigation. Future
work on this galaxy will attempt to acquire the data of the CO lines in the 450 and
350 pm bands and make a quantitative comparison of these data in order to determine the
possible contributions of CO to the high-frequency-SCUBA data. Such work is important
(among other things) in the determination and interpretation of submm spectral index
distribution and thus the nature of dust emission in M82 (see Section 6.4).
6.5.3 Implications of the SCUBA maps on the Outflow of Cold Dust
There is a general north-south asymmetry and filamentary structure in the spectral index
distribution map of the nuclear region and the continuum morphology in the inner-halo
of M82, that is consistent with the north-south asymmetric X-ray and H. winds (e.g.
Watson et al., 1984), and the associated UV, optical, molecular and indeed infrared to
mm structures that have been reported in M82 (e.g. Seaquist & Clark, 2001). Therefore,
a simple interpretation of the asymmetric, filamentary structures in the submm spectral
index distribution in the nuclear region and the continuum morphology in the halo of
M82 and is that they are a manifestation of an outflow of dust from the nucleus to the
halo.
128

Seaquist & Odegard (1991) presented one of the earlier, extensive evidence of the
nuclear-to-halo outflows from spectral index distribution computations using radio con-
tinuum maps at several wavelengths between 0.33 and 4.9 GHz (90 and 6cm). They found
spectral indices between —0.3 and —0.6 in the nuclear region, steepening to about —1.0 at
a radius of about 1 kpc along the minor axis, and concluded that these were from rela-
tivistic synchrotron-emitting electrons that were being scattered against infrared photons
emitted in the nuclear regions of M82. Recently, Wills et al. (1999) used high resolution
VLA continuum data between 1.4 and 5GHz and computed spectral indices from —0.6
to —0.8 about 20" north of the galactic disc, in localised nuclear sites of the outflows that
they call 'chimneys'. These values are consistent with the results by Seaquist & Odegard
(1991) in the same wavebands, and Wills et al. (1999) alsointerpreted them as indicating
synchrotron emission from relativistic electrons entrained in the wind.
A thermal component in the filaments has previously been suggested based on 'ten-
tacles' observed in Nell maps of M82 (Achtermann & Lacy, 1995), which presumably
are also a manifestation of the outflow phenomenon. In the maps in this thesis, the
values of the spectral index distribution in the inner-halo range from about 2.6 to 3.1,
consistent with thermal re-radiation of low-emissivity dust that dominates the emission
in M82 at these submm wavelengths (see, e.g., Hughes et al., 1994). The submm indices
are asymmetric and increase predominately along the minor axis of the disc, similar to
the radio spectral index gradient by Seaquist & Odegard (1991) and Wills et al. (1999)
and consistent with the north-south asymmetric, large-scale X-ray and H. winds (e.g.
Shopbell & Bland-Hawthorn, 1998). In this light, the submm continuum maps indicate
an outflow of dust grains that are ejected from the nuclear region by, or entrained in, the
starburst winds.
129

One explanation for the outflow being asymmetric was given by Shopbell & Bland-
Hawthorn (1998), who suggested that if the star-forming disc is slightly shifted up from
the galactic disc, this would imply that there is less covering material in the north and
would make collimation difficult, resulting in an immediate blow-out of material in the
north. Detections confirming that collimation is better to the south of M 82 have been
made of large-scale emission extending to 1.5kpc, and more extended in the south, not
only in optical line maps (e.g. Devine & Bally, 1999), but also in CO(2-1) and CO(3-2)
respectively by Thuma et al. (2000) and Seaquist & Clark (2001). Another valuable result
of the co-addition of SCUBA archive data in this .thesis is that the most sensitive submm
maps that are displayed in Figure 6.3 show submm extended emission that is associated
with the outflows on scales that for the first time match the 1.5 kpc CO detections noted
above.
Recently reported radio 'chimneys' (e.g. Wills et al., 1999), that are about 20" north
of the disc and hypothesised to signify local blow-outs of material by supernova-driven
winds, are not obvious in the SCUBA maps. However, prominent SiO features associated
with the localised radio outflows have now been detected in mm-heterodyne observations
obtained with the IRAM interferometer (e.g. Garcca.-Burillo et aL, 2001). Contours of
these SiO features overlaid on the 5GHz radio maps by Wills et al. (1999) are reproduced
from the work by Garcfa-Burillo et al. (2001) and displayed in Figure 6.8. The authors
explain the SiO detections in a framework of shocked chemistry at the sites of the gas
ejections from the starburst disc. It appears that the shocked gas has for the moment
proved to be a better probe of the localised outlows than the direct observations of dust
emission in the mm to submm continuum.
Localised sites of the outlows or 'emission spurs', although long sought-after and
130

20 0 -20
Figure 6.8: The velocity-integrated intensity map of SiO (v=0,J=2-1) in the central region of M82, that was produced by Garcia-Burillo et al. (2001), is overlaid on the saturated gray-scale of the 5GHz continuum image from work by Wills et al. (1999).
sometimes reported in mm to submm continuum and CO maps (e.g. Hughes et al., 1994;
Shen & Lo, 1995; Leeuw et al., 1998; Alton et al., 1999), have not been reliably reproduced
in the different mm to submm observations. All the continuum maps in this thesis also
have some low-level 'spurs', but almost none are reproduced at exactly the same locations
and extend to the same degrees between any two different observations. This would
suggest that the spurs might be artefacts in the maps. However, it is mentioned in passing
that the spurs at the edges of the submm maps may be associated with complex optical
filaments that are seen criss-crossing M 82 in optical pictures (see, e.g., Figure 6.2). If
the filaments have different optical depths and re-radiate low-level emission in relatively
131

narrow wavebands, they may not be reproduced in maps at certain wavelengths and
sensitivities. Preliminary results from high-resolution, interferometry observations of
• molecular streamers around M 82' by Walter et al. (2001) seem to strongly support
the association of mm-continuum spurs with optical filaments. Therefore, the above
hypotheses will almost certainly be tested in the near future as sensitive submm and
optical observations become available and allow precise spatial associations between the
emission spurs and the absorption filaments to become possible.
6.6 Exploratory Analysis of MEM and the 180" Chop Throw
6.6.1 Can MEM reprocessing Improve SCUBA Images?
This section presents original and Maximum Entropy Method (MEM)-reprocessed, SCUBA-
450 pm maps of CRL 618 and CentaurusA, in an effort to investigate the usefulness of
employing the MEM technique to improve the resolution of SCUBA images as used in
the more complex submm maps of M82 and described in Section 6.6.2. CRL 618 is a
submm-bright, proto-planetary nebula that is a point source in the SCUBA beam and
is used as a secondary calibrator at the JCMT (e.g. Sandell, 1994). CentaurusA is a
merger-remnant galaxy that, as must now be familiar from this thesis (see Chapter 5),
has a very bright, compact core and extended submm emission that have been observed
with SCUBA (Leeuw et al., 2002).
The MEM routines used in this thesis are provided by the Starlink Project to perform
a deconvolution of 2-dimensional images. The program uses algorithms based on Bayesian
analysis of image reconstruction as presented in the Gull and Skilling Maximum-Entropy-
132

System-5 Manual.' This follows various improvements on the 'classical' MEM that was
presented by Gull & Skilling (1983). The Starlink routines take an image and a point-
spread function as input and, based on the noise and signal in the image, iteratively
produce an equal-sized image as output with higher resolution. For this thesis, the
SCUBA maps are reprocessed with beam-widths estimated from the relevant, nightly
beam maps and the common assumption that the beam shapes are Gaussian (e.g. Sandell,
1998).
— —
N
S C..
I: U
S S N
S
Pixel coordiat. I (pixel)
Pixel coordirat. I (pixel)
N
$
L E rfej
— — I"-
S
N
§ I
— - Iy
Pixel clordlat. I (pixel) Pixel elordinat. I (pixel)
Figure 6.9: Original SCUBA-450 jim maps of CRL618 and CentaurusA to the left and MEM-reprocessed images of these sources to the right. The CRL 618 and CentaurusA images are at top and bottom respectively. The keys are relative intensities shown by the contours. The axis are in pixel, representing arcsecond, displacements. Note that the bottom row images are at half the scale of the top images, in order to include the depiction of the extended emission in Centaurus A.
Figure 6.9 presents the original SCUBA-450 pm maps of CRL 618 and CentaurusA
flushed to the left and the MEM-reprocessed images of these sources flushed to the right.
The resolutions achieved in the SCUBA and MEM-reprocessed images of CRL 618, that
MemSysS Manual describes the latest Fortran code implementation of the Gull and Skilling Maximum-Entropy Method, as is used in the Starlink software, and is available at http://www.maxent.co.uk
133

are shown in the top row of Figure 6.9, are 7".8 and 2".4 respectively, and those of
CentaurusA, that are shown in the bottom row at half the scale of the top images, are
8".2 and 2".6 respectively. Therefore, for the 450 pm maps shown in Figure 6.9, MEM
improves the SCUBA resolution by a factor of 3. The images of CentaurusA in the
bottom panels of Figure 6.9 show that in images with strong peaks that are surrounded
by relatively low-level extended emission, the MEM devolution smoothes-out the diffuse
emission and emphasises the isolated peaks at an improved resolution. Therefore, in the
case where the peak is of much higher level relative to the diffuse emission, the technique
is not ideal for seeing structure in the extended emission.
While the MEM-reprocessed image of Centaurus A that is shown in Figure 6.9 is fairly
round, i.e. its major to minor axis ratio is 1.1 and very normal for the not-perfectly-
Gaussian SCUBA beams, the reprocessed image of CRL 618 is clearly elongated, i.e.
its major to minor axis ratio is - 1.5. High-resolution, mm-to-radio—interferometry
observations of the CS (2-1) and CO (1-0) gases and 23 GHz radio continuum in CRL 618
respectively by Hajian et al. (1995, 1996) and Martin-Pintado et al. (1995) have reported
detections of a multicomponent, extended structure that is dominated by a spherical halo
of CO gas with radius s 15" and a core east-west, bi-polar outflow of roughly 3" x 5" that
is seen in all these observations and is roughly cross-shaped in CS gas. The elongation
in the MEM image of CRL 618 is therefore probably the real, extended structure from
the diffuse emission of this nebula. It is generally east-west, like the bi-polar outflow
in the mm-to-radio—interferometry observations, and has the same orientation as one of
the components in the CS gas maps. Therefore, although it is unresolved in the SCUBA
beams (Sandell, 1998), it is revealed here by MEM for the first time in the submm.
Extended, low-level submm emission is quite common in nebulae, which makes many of
134

them unsuitable secondary calibrators, even though their cores can be bright enough to
make calibrators, in the submm regime (Sandell, 1998). The resolved submm emission
in the MEM-reprocessed image of CRL 618 suggests that in the case that the extended
emission is not too low-level compared to the peak emission, MEM deconvolution may be
useful for seeing structure that is unresolved by SCUBA. While the images show that the
MEM technique produces reasonable morphological results of reprocessed SCUBA maps,
statistical tests and modelling of the MEM images, or comparisons with higher resolution
images at the same wavelengths, are needed to confirm the quantitative usefulness of the
employed routines.
6.6.2 Are MEM-reprocessed—SCUBA Peaks of M 82 Reliable?
This section presents Maximum Entropy Method (MEM) deconvolution of SCUBA-850, -
450 and -350 pm images of M 82 to investigate if MEM reprocessing can reliably produce
resolution-enhanced submm features of this galaxy. As is the case for CRL 618, the
extended submm emission in the nuclear region of M82 is not too low-level compared to
the emission of the peaks in the same region, and in principle MEM deconvolution can
produce useful results for M 82. If similar 'reliable' enhancement of resolution can be
produced for the complex nuclear structure such as is expected in the active starburst of
M 82, then the MEM submm images can be used for a comparative analysis with high
resolution data from other wavelengths.
The SCUBA maps of M82 that are used in the MEM deconvolution are the deep
850, 450 and 350 pm images that were obtained with the 120" chop throw and presented
in Figures 6.3 & 6.4. Their excellent signal-to-noise ratio makes them a good choice
for use with MEM. For the input parameters of the MEM deconvolution, it is assumed
135

Right ascension
Right ascension
r. 0
-
C) 4)
0
-4
U a,
CI
Figure 6.10: The MEM-reprocessed, deep-SCUBA-850 pm maps that were obtained with the 120" chop throw are displayed in colour-scale. The MEM images have an enhanced resolution that show the best derived locations of the emission peaks given the signal-to-noise in the central parts of M 82. Original SCUBA contours at 850 (top panel) and 450 pm (bottom panel) are overlaid to cross-check the source of the MEM-resolution-enhanced features. The keys are colour-coded relative intensities, and the axis labels are J2000 coordinates.
4.5
4
3.5
3
2.5
2
1.5
1
0.5
0
4.5
4
3.5
3
2.5
2
1.5
1
0.5
0
136

that the SCUBA beams have Gaussian widths of 15", 8" and 6".7 respectively at 850,
450 and 350 jim, as estimated from SCUBA point sources. The very diffuse emission
in MEM images is smoothed-out and the high-level emission is emphasised to show the
most probable details of the detection peaks in the central region of the M 82 disc at a
resolution that has been improved by a factor of 3.
The MEM-850 pm map of M82 is presented in Figure 6.10 and compared with the
original 850 and 450 pm contours that are overlaid to cross-check the source of all the
MEM-produced features. The original 450 pm image has a higher resolution than the
850 pm map and therefore provides an observed example of the general morphology that
is expected in the MEM-resolution-enhanced-850 pm map. Figure 6.10 shows that the
morphology in the MEM-850 pm image is generally consistent with the submm emission
peaks that are distributed along the spine of the galactic disc at a roughly 72° position
angle, as shown by the original SCUBA contours. The single lobe of the original SCUBA-
850 pm emission is now resolved into two peaks, as seen in the 450 and 350 pm maps.
Also, the MEM process has reproduced the 850 pm western peak with a more elongated
and brighter structure than that of the eastern peak, just as has been observed in SCUBA
maps of higher resolution. However, the top panel in Figure 6.10 shows that the precise
locations of the MEM-850 pm peaks are not well matched with those in the original maps.
This is particularly true for the western peak that is reproduced at least 5" farther west
than the original 850 and 450 pm western peaks. A cross-check of the MEM-850 pm
peaks with the original SCUBA images, as shown in Figure 6.10, shows that MEM peaks
are systematically produced at the edges of all elongated, high-brightness emission in the
original image, generally resulting in the locations of the peaks being moved farther away
from their original positions.
137

That MEM deconvolves single peaks into two that are slightly shifted from the 'orig-
inal' position, is not unreasonable, if the shift is not large in relation to the beamsize, for
the following reason. If a very large smooth is applied to two resolved peaks - assume
they are delta functions to drive the point home - then the smooth will result in a single
peak that is located between the two resolved peak positions. It follows that as the peaks
are smoothed more and more, the smoothed wings of the original peaks will contribute
more and more in the area between versus outside the peaks, resulting in a systematic
central shift. This will hold-up for equal and non-equal sources (that do not have to be
delta). Therefore, observations of two (or more) peaks with a beam larger than their sep-
aration would result in an unresolved peak of the original two at a more central location
than their true locations. By the corollary, it is therefore acceptable that MEM resolves
and systematically shifts the single, unresolved peaks in two that are farther out.
Thus, it is also not surprising that the eastern peak seen in the MEM-850 pm and
original 450 pm images in Figure 6.10 corresponds reasonably well, give-or-take an ac-
ceptable north-south pointing shift of r' 2", even though this peak is at the eastern-edge
of the unresolved lobe in the original 850 pm image. However, the fact that the location
of the western peak cannot be reproduced as well as that of the eastern suggests that
not all the peaks that are produced by MEM reprocessing of M 82 data are a reliable
resolution-enhancement of the SCUBA images.
The above assertion is supported by a cross-check of MEM-reproduced-450 pm im-
ages with their original SCUBA contours, that are shown overlaid in Figure 6.11. The
MEM colour-coded peaks are labelled 1 to 5, and the position of the 2.2 pm peak or
dynamic nucleus is marked by a black cross. The original double peaks (cf. MEM 1,2
and 3,4) seen on either side of the 2.2pm peak location in the SCUBA-450 and -350 pm
138

69:4 1 C 0
+2
C
C a,
69:4 1: C 0
C -4 C, a,
Right ascension
0.018
0.016
0.014
0.012
0.01
0.008
0.006
0.004
0.002
0
18
16
14
12
10
Figure 6.11: MEM-reprocessed, SCUBA-450 (top panel) and -350 pm (bottom panel) maps of M82 that were obtained with the 120" chop throw are displayed in colour-scale. The MEM images have an enhanced resolution that show the best derived locations of the emission peaks given the signal-to-noise ratio in the central parts of M 82. Original SCUBA contours are overlaid to cross-check the source of the resolution-enhanced fea-tures that are produced by the MEM procedure. The MEM peaks are labelled 1 to 5, and the position of the dynamic or 2.2 pm nucleus is marked by a black cross. The keys are colour-coded relative intensities, and the axis labels are J2000 coordinates.
139

contours are reproduced at roughly their original positions along the major axis of the
nuclear disc. The elongated, brighter peak seen about 9" west of the nucleus in the
original images is now resolved into two peaks (i.e. MEM 3 & 4): one within --. 1" of the
2.2 pm peak and the other (i.e. MEM 4) about 9" west of nucleus. There is an additional
peak (i.e. MEM 5) about 15" west of the nucleus and the eastern peak is reproduced
with an elongation of what seems to be two unresolved peaks (i.e. MEM 1 & 2) along
the disc. As is evident in Figure 6.10, it is shown once again in Figure 6.11 that MEM
systematically resolves all peaks with any elongated extension - however-slight - into two
peaks (e.g. MEM 1 & 2) at the longward-edges of the structure. This often results in
the locations of the peaks being moved farther away from their original positions, which,
as explained earlier, can be reasonable if the shifts are not large in comparison to the
beamsize.
A factor that may be affecting the precise reprocessing of peak locations may be
that the assumption that the SCUBA beam is Gaussian (that is used in the MEM
routines here) is not good enough for the deconvolution of the current M82 images.
As noted in Section 6.6.1 and shown in Figure 6.9 above, the SCUBA beam is not a
perfect Gaussian. Other authors using separate MEM software as that used in this thesis
have achieved what appears to be reasonable results in their reprocessing of M 82 data at
other wavelengths (e.g. Dietz et al., 1989, in their 10 pm images). However, some of their
MEM reprocessing, for example on the Nell data by Achtermann & Lacy (1995), results
merely in a smoother image of the original, rather than an improvement of resolution
as undertaken in this thesis. This is consistent with the demonstrated evidence in this
thesis that MEM reprocessing is reasonably true to the input data.
With the precise locations of the resolved peaks aside, MEM's systematic re-production
140

of unresolved peaks into two (or more) peaks shows that the deconvolution is biased to
producing point sources, that are not a unique reproduction of the original structure. In
other words, the MEM results of M82 show that, given reasonable signal-to-noise ratio
in the images, all mapped structures that are extended will be deconvolved into point
sources, even if the structure is truly extended at the higher resolution seen in the MEM
images. This makes the reprocessed results true to MEM and the data, but not to the
reproduction of real (extended) structure.
The conclusion in this thesis is that, based on morphological comparisons of the orig-
inal and MEM-deconvolved images, MEM reprocessing can be true to the data in the
image but is not useful for uniquely enhancing the resolution of the SCUBA maps of the
complex nuclear region in M 82. The MEM-reprocessed maps displayed in Figures 6.10
and 6.11 are therefore presented only to demonstrate the results of the MEM deconvo-
lution of M82 maps that were obtained with SCUBA and are not used in any further
scientific analysis in this thesis. Further assessment of the use and implementation of
MEM for the SCUBA data of M82 may be considered in the future.
6.6.3 Does a 180" Chop Throw Improve the Submm Image of M 82?
Figures 6.12 and 6.13 show maps of M 82 at 850, 750, 450 and 350 im that, like the maps
shown in Figures 6.3 and 6.4, were also obtained in jiggle mapping observing mode, but
with an azimuthal chop throw of 180" rather than 120". The 180" chop is not commonly
used with SCUBA and was employed in exploratory observations designed to chop clear
of low-level emission of previously unknown submm extent. These maps are not as deep
or well calibrated as the images with the 120" chop, that are displayed in Figures 6.3 and
6.4, and are preliminarily presented, only to cross-check features in submm maps and to
141

30
41:00
30
69:40:00
Right ascension
1.2
1
ci 41
.4
-0.2
-0.4
56 52 46
44
Right ascension
Figure 6.12: Maps of the 180" chop throw, 850 (top panel) and 750 jim (bottom panel) continuum emission centred at the near-infrared nucleus of M 82. The contours on the respective maps are [64, 96, 128, 200, 300, 400, 600, 800, 1000, 1175, 1350, 1525, 16701 and [200, 275, 425, 700, 1000, 1300, 1450) mjy/beam; the rms uncertainty is about 32 and 100 mjy/beam. The key is colour-coded intensity in Jy/beam, and the X and Y axes are J2000 coordinates.
69:40.. 9:56:00
142
1.6
1.4
1.2
1
0.8
0.6
0.4
0.2
0
-0.2

.9 41 -3
C) V
69:40
5
4
3
2
1
0
05 9:56:00 55 50 45 40
Right ascension
30
20
10
41:00
RQ•Afl•flfl
4
1.5
1
9:56:00 56 52 48 44
Right ascension
Figure 6.13: Maps with the 180" chop throw, 450 (top panel) and 350 pm (bottom panel) continuum emission centred at the near-infrared nucleus of M 82. The contours on the re-spective maps are [950,1450, 2.100, 3.100, 3.800, 4.500, 5000] and [1250, 1750, 2250, 2900, 3400, 3800, 4100] mJy/beam; the rms uncertainty is at least 475 and 625 mjy/beam. The key is colour-coded intensity in Jy/beam, and the X and Y axes are J2000 coordinates.
143

determine if the 180" chop throw improves the imaging of extended emission in M 82.
The general morphology in these maps is indeed similar to the earlier 120" chop throw
maps (see Section 6.3), however the nuclear-disc peaks in the 450 and 350 pm maps in
Figure 6.13 are less smooth, round or elliptical than those in the maps in Figures 6.3 and
6.4. The peak that is east of the nucleus is now more triangular and that in the west is
not just elongated along the disc but now has remarkably more 'structure', especially in
the 350 pm map. In the 450 pm map, this western peak is now pear-shaped, bulging with
increasing major axis distance from the nucleus, and in the 350 pm map, it is resolved
into two peaks that lie along the major axis of the disc. Of these resolved, western peaks
in the 350 pm map, the peak closest to the nucleus is elongated along the disc-major
axis, following the orientation of the original, but now the elongated emission is brightest
at the position of the galactic nucleus and also has a spur in the south.
These new nuclear features in the 450 and 350 pm data of the 180" chop throw have
not been seen before in the submm continuum and that would be exciting if they were
detected with strong confidence. Unfortunately, the reality of the features is questionable
for at least the following simple reason. The features are not seen in the maps shown in
Figures 6.3 and 6.4, and that is surprising because those maps are deeper and should
therefore reveal all the real features displayed in Figures 6.12 and 6.13.
One explanation for the discrepancy comes from comparing the relative peak-to-
baseline—flux ratios obtained from similar regions of the respective-wavelength 120" and
180" chop maps. The ratio in the 180", compared to that in the 120", chop maps, is
lower and decreases with decreasing submm wavelength maps (i.e. the ratio decreases
systematically from the 850 pm down to 350 pm maps). The reason is because, in com-
parable regions of the 120" and 180" chop maps, the baseline fluxes are similar, however
144
the peak fluxes in the 180" chop maps are systematically lower. This indicates that peak
fluxes in the 180" chop maps are not conserved and the beams in these images are most
probably distorted. It may be that the larger-180" throw, that chops in azimuth white
the image rotates during an observation, smears-out the peaks, trimming their fluxes and
superficially enhancing their morphology.
Because the effect of altering the peak fluxes and morphology will increase respectively
with decreasing beam-width and increasing resolution, and therefore with decreasing
submm wavelengths, it will be strongest in the 350 pm images. In fact, engineering
observations at the JCMT show that beam distortions in SCUBA maps will be worst at
the shortest wavebands (e.g. Sandell, 1998). It is clear from the maps in Figure 6.13,
that compared to those in Figures 6.4 and 6.4, the 350 pm images are indeed the most
different between the 120" and 180" chop throw results. In the 450 and 350 pm images
themselves, the peak west of the nucleus is more morphologically changed than the eastern
peak, because the western one is elongated (cf. almost point-like eastern peak) and thus
has more surface flux and structure that can be smeared-out by the 180" throw.
On the basis that peak fluxes are not conserved in the current images with the 180"
chop throw, and that the 'new' features ofM82 in these maps are most probably artefacts
created by distorted beams, the conclusion is that the 180" chop throw maps shown in
this thesis, particular at 350 and 450 pm are not an improvement on the other SCUBA
images. Clearly, the current 180" chop throw results raise interesting issues about peak
flux and morphology conservation (or enhancement) with larger chops, particularly in
short-wavlength SCUBA observations. This could be investigated further in beam-map
observations of JCMT primary sources at large chop throws.
Finally, it is noted that in the 750pm image from the 180" chop throw data set shown
145

in Figure 6.13, the single emission peak seen in the 850pm image (see Figure 6.12) is
beginning to be resolved-out into the double peaks seen in the 450 and 3501im images
(see Figures 6.12 and 6.13). This is expected, as the 750pm observations have a resolution
that is intermediate between that of the 850 and 450pm.
6.7 Summary of Results and Future Work on M 82
SCUBA 350, 450, 750 and 850pm imaging observations have been presented of the dust-
laden, star-forming nuclear region and large-scale, low-level emission that is associated
with the outflows in the halo of M 82. The displayed maps include co-added data that were
mined from the SCUBA Data Archive, resulting in the deepest submm continuum maps
of M 82. The 850 pm morphology has a single emission peak that is centred about 9" west
of the galactic nucleus, while the 450 and 350 pm maps have two emission peaks centred
about 10" and 6" respectively east and west of the nucleus along the galactic disc, similar
to previous continuum observations at mm, submm and mid-infrared wavelengths, as well
as to CO line transitions and H. observations of comparable resolution (see Section 6.3).
Low-level emission is detected out to 1.5kpc for the first time in the 850 pm continuum
of this galaxy, i.e. at least - 160 pc radius farther-out than other recent studies.
The deep maps were used in a detailed morphological study of the nuclear and large-
scale detections, including a comparative analysis of submm to optical morphology (see
Section 6.3.1). The overall, extended submm morphology of M82 generally resembles
the optical picture in that the nuclear emission has an apparently elliptical shape whose
major axis is clearly aligned with that of the galactic disc at position angle 72°.
However, the submm morphology is much smoother than the optical picture, and some
prominent dust cloud and filamentary lanes that are seen in the optical are not obvious
146

in the submm continuum. One explanation for the submm versus optical correspondence
(or lack of it) is that the optically-thin submm continuum represents total emission from
the entire galactic columns of dust in the line of sight, while the optical morphology
of dust, because the dust is typically seen obscuring stellar light, represents only the
dust in certain spatial stratifications (usually the foreground) of the observed line-of-
sight columns. A more quantitative spatial-correspondence and optical-depth analysis
(and radiative modelling) of the submm versus optical images is clearly needed to make
definite assertions about the origin of any of the features seen in the compared maps.
A comparative analysis was further conducted of submm to high-resolution CO (1-0)
morphology (see Section 6.3.2). Resolved peaks in the CO maps could be associated
with unresolved features in the submm maps. Assuming that the CO and dust grains
were well-mixed, it was concluded that BIMA maps gave a reasonable indication of how
dust emission might appear at higher resolution. This will be tested by future higher
resolution observations of dust that will soon be possible with the commissioning of the
Smithsonian Submillimeter Array (Moran, 1996) and the Space Infrared Telescope (e.g.
Deutsch & Bicay, 2000)
The SCUBA maps were also used in the computation and investigation of the first
submm spectral index distribution of the high-brightness, nuclear region of M 82 (see
Section 6.4) and in the discussion of the origin and structure of submm maps (see Sec-
tion 6.5). In particular, (a) the commonly assumed interpretation that the double emis-
sion peaks that were seen in the mm to infrared continuum are due to emission from the
edges of an inclined, dusty-molecular torus was challenged (see Section 6.5.1), (b) an an-
alytical review of CO results was undertaken to assess if CO emission might significantly
contaminate the continuum observed in SCUBA filters (see Section 6.5.2), and (c) a mor-
147

phological comparison was conducted to check whether the localised outflows that were
reported in radio and SiO maps respectively by Wills et al. (1999) and Garcfa-Burillo
et al. (2001) could be seen in the SCUBA maps (see Section 6.5.3).
Evidence in this thesis in terms of clearly asymmetric nuclear-submm emission seen
in almost all the presented intensity and spectral index distribution maps seems to dis-
favour the commonly assumed interpretation of a dusty torus in M 82. Arguments were
presented to explanation the nuclear submm maps of M82 in the context of emission
from a rather complex distribution of dust concentrations that are in regions of differ-
ent star-formation environments, as has been reported from various studies using data
at other wavelengths (e.g. Achtermann & Lacy, 1995; Forster Schreiber, 2000; de Grijs,
2001).
It is not obvious if the CO contribution to the higher frequencies of SCUBA will be
less than or higher than the 47% estimated to the SCUBA-850 pm band by Seaquist
& Clark (2001). However, it is clear that the CO contamination to higher-frequency
continuum may also be significant and warrants detailed investigation. Future work on
this galaxy will attempt to acquire the data of the CO lines in the 450 and 350 pm bands
and make a quantitative comparison of these data in order to determine the possible
contributions of CO to the high-frequency-SCUBA data.
The overall submm low-level morphology has a general north-south asymmetry that is
similar to the filamentary H. winds and CO and X-ray outflows that have been detected
in M82 (e.g. Shopbell & Bland-Hawthorn, 1998). The submm spectral index distribution
is also asymmetric with indices that increase predominately along the minor axis of the
disc, similar to the radio spectral index gradient by Seaquist & Odegard (1991) and Wills
et al. (1999) and consistent with the north-south asymmetric, large-scale X-ray and H.
148

winds. Therefore, the current results support the simple interpretation (e.g. Leeuw et al.,
1998; Alton et al., 1999) that the asymmetric, filamentary structures in the submm maps
are a manifestation of corresponding outflows of dust grains from the galactic nucleus
into the halo.
Preliminary analyses were conducted to investigate whether Maximum Entropy Method
deconvolution can improve the SCUBA resolution of standard JCMT sources (see Sec-
tion 6.6.1) and the deep submm maps of M82 (see Section 6.6.2). It was demonstrated
that MEM can produce reasonable, resolution-enhanced results for the SCUBA-450 pm
maps of CRL 618 and Centaurus A. However, based on morphological comparisons of the
original and MEM images, the conclusion in this thesis is that although MEM reprocess-
ing can produce reasonable results, given the data in the submm images, it is not useful
for uniquely enhancing the resolution of the SCUBA maps of M 82, particularly that of
the complex nuclear structure in this galaxy. Therefore, MEM maps of M82 were not
used in any further scientific analysis in this thesis. Nevertheless, extended assessment
of the use and implementation of MEM for the SCUBA data may be considered in the
future.
Preliminary analyses were also conducted to investigate if observations with the 180"
chop throw could improve the detection of the submm continuum in M 82 (see Sec-
tion 6.6.3), as the large throw was designed to chop clear of any unknown low-level
emission. It appears that the larger chop throw smears-out peaks in the 350 and 450 pm
continuum, trimming the high-level fluxes and creating artefacts in the morphology. On
the basis that peak fluxes are not conserved in the current images with the 180" chop
throw, and that 'new' features of M 82 in these maps are most probably artefacts created
by distorted beams, the conclusion in this thesis is that the 180" chop throw maps, par-
149

ticularly at 350 and 450 pm are not an improvement on the other SCUBA images. The
180" chop throw results clearly raise interesting issues about peak flux and morphology
conservation with larger chops, particularly in short-wavelength SCUBA observations,
and need to be investigated further in beam-map observations of JCMT primary sources.
It is re-emphasised that the results in this chapter are presented as work in progress,
and therefore some the conclusions are rather preliminary.
150

Chapter 7
Summary of Thesis Results and
Future Work
Millimetre and submm continuum observations of selected, nearby active galaxies have
been undertaken using SCUBA on the JCMT. The properties, content and structure of
cool to cold dust (e.J 80 to 10K) have been studied in CygnusA, NGC 4374, M82 and
Centaurus A. The energy distribution of synchrotron electrons in Cygnus A and the cold
dust outflows in M82 have also been investigated. Summarised in Section 7.1 below
are the thesis observational studies, results that were achieved and possible follow-on
investigations (some already underway). Future SCUBA-polarimetry studies, that are
related to the results in this thesis, are outlined in Section 7.1.1. A recently proposed
post-thesis project, that was written in conjunction with an application for a postdoctoral
fellowship, to exploit the high resolution and sensitivity of the soon to be commissioned
Space Infrared Telescope Facility (SIRTF), is described in Section 7.2.
151

7.1 Outline of SCUBA Results and Follow-on Work
Millimetre and submm continuum observations of Cygnus A: The cool dust
temperature in the galaxy was constrained between 37 and 85 K, corresponding to dust
masses between 1.0 x 10 8M® and 1.4 x 10⁶M® respectively (Robson et al., 1998). These
results are consistent with very recent and better-constrained dust temperatures of 52 to
70K and dust mass of - 5 x 10 6M® obtained using new ISO data at 60 through 180 pm
(Haas et al., 1998; Leeuw & Robson, 1999), confirming that cool dust is responsible for
the far-infrared (far-IR) to submm emission in Cygnus A, and perhaps other AGN of
the same type. The lower dust mass limit of n 106M® is comparable to the nuclear
starburst galaxy M 82 and the upper limit to the extranuclear starburst galaxies Arp 220
and NGC6240 as well as the Radio Quiet Quasars IZwl, Mrk 1014 and Mrk376. It is
unclear whether the heating of the warm dust in Cygnus A is dominated by active star
formation or the active galactic nucleus.
Detailed photometric observations of the two major hotspots (A & D) in Cygnus A
showed that their spectral index extends smoothly to about 450pm (677GHz), with
no evidence of spectral steepening. The thesis shows that if the diffusion speed for the
electrons responsible for this emission is about c, then a single particle acceleration mech-
anism can be responsible for the hotspot synchrotron emission. On the other hand, if the
diffusion speed is significantly less than c, then multiple acceleration locations are proba-
bly required unless the magnetic field strength is significantly less than the equipartition
value. Future observations using submm interferometers (e.g. the Submillimeter Array
[SMA] on Mauna Kea) will narrow-down the parameter space in terms of the size of the
emitting region.
152

Searching for diffusely distributed dust in the effiptical galaxy NGC 4374: (','w. s'.,..,;.. -. .. -
Following the suggestion that elliptical galaxies may contain diffusely distributed dust
(Goudfrooij, 1994), a search for this was undertaken with submm imaging observations of
the elliptical galaxy NGC 4374, using SCUBA (Lecuw et al., 2000). Low-level, diffusely
distributed dust was not detected. However, due to the limiting sensitivity of SCUBA,
the'existence of this diffuse dust could not be ruled out. The 3c upper limit on the
850pm integrated flux within a region of about 2' diameter (just less than the SCUBA
array) is 0.6Jy, giving the flux density upper-limits on the undetected low, level diffuse
dust and extended radio lobes. The detected emission at 850pm is spatially unresolved
(diameter < 15"), showing that the dust is confined to the central region of diameter
.c 1.5kpc. Model fitting gives an angular extent of the dust to be 111.5 in diameter,
which corresponds to a size-scale of only 0.15 kpc. If there is a co-mixing of the molecular
gas and dust, this constrains the size of any molecular torus around the AGN core of
NGC 4374 to around only 150 pc in diameter. Future high resolution observations using
mm-submm interferometers (e.g. the SMA) and ground based mid-IR instruments (e.g.
Michelle on UKIRT/GEMINI) should directly test these spatial-size constraints. Such
observations were proposed for this thesis with the Owens Valley Radio Observatory
but, unfortunately, the proposal was not approved. (A recent, successful proposal, that
will be scheduled post this thesis, to use the GEMINI Telescope for a similar purpose is
mentioned below.)
For the low-level emission, a strategy was devised to find better candidates for the
follow-up programme. This has been proposed for observing time on the JCMT in col-
laboration with Dr. Anne Sansom of UCLan. Dr. Martin Ha.as, one of the collaborators
in this project, is involved in a parallel far-IR emission project using ISO data. To pin-
153

down the non-thermal flux contribution to the submm-IR dust mission, complementary
mm observations have been successfully proposed and are scheduled at the Nobeyama
Radio Telescope in Japan. Searching and mapping the distribution of the diffuse dust is
important, among other things, because the dust could affect metallicity (and thus age)
determinations in elliptical galaxies. See Section 7.2 below for a detailed description of
a recently proposed project to exploit the high resolution and sensitivity of the soon to
be commissioned SIRTE in far-infrared observations of ellipticals.
Deep submm imaging of dust structures in NGC 5128 (Centaurus A):
SCUBA imaging observations were obtained at 850 and 450 pm covering the central 450"x
100" ('.s 8.0 x 2.0kpc) of CentaurusA. The sensitive 850 and 450Mm images include the
first direct detection of emission from dust that is in the background or inner parts of
NGC 5128 (Leeuw & Robson, 2000). The new images show that the submm continuum
morphology and spectral index distribution of CentaurusA comprise four regions in the
nuclear area and dust lane of the galaxy: non-thermal emission from the unresolved
AGN core (a 0) and the inner-jet interacting with gas in the dust lane (a 2); and
thermal emission from the inner disc of radii —'90" (2.5 < a < 3.5) and colder outer
dust (3.2 < & < 4.2), where S. oc v° is computed between 450 and 850pm (Leeuw
et al., 2002). Observing the submm jet in this case is interesting because the spectral
index here is indicative of free-free continuum emission from interstellar gas that has
been entrained and heated by the flow of relativistic particles from the nucleus (Brodie
et al., 1983), and not a manifestation of the synchrotron relativistic radio jet itself. It
is the first time this has been detected in the submm. The AGN core, which is clearly
distinct from the extehded emission, is most probably a low-luminosity blazar. The
inner disc of radii 90" has a high surface brightness and is reverse-S-shaped in the 850
154

and 450zm images. It coincides with the regions of intense 7 and 15pm continuum,
dense molecular gas emission, and a high concentration of Paa sources indicative of
active star formation. The IR and submm images appear to a large extent to reveal the
same material, as predicted by a geometric warped disc model consisting of tilted rings
(Quillen et al., 1993), a scenario that seems more plausible than that recently proposed
by Mirabel et al. (1999) suggesting that the mid-JR emission is primarily from a bar,
with a structure that is different from the extended warped disc alone.
Follow-up molecular line observations to constrain the dynamics of the Centaurus A
inner disc are underway at the JCMT, in collaboration with Dr. Henry Matthews.
Furthermore, high resolution mid-JR observations have been successfully proposed and
will be scheduled to use T-RECS, the mid-JR imager on GEMINI-South telescope to
observe the physical details of this structure and the nuclear components in Centaurus A.
There are plans for similar high resolution mid-IR observations of other dust lane AGN,
to better distinguish their morphology as a circumnuclear ring or bar, determine whether
bars are a common feature of such galaxies and therefore whether accretion is sustained
by funnelling in a bar or which of the other structures/mechanisms are more plausible
in this regard. If the mid-JR emission is from a circumnuclear ring, determining its
orientation might indicate the role the ring plays in nuclear activity in CentaurusA and
similar objects. (Also see Section 7.2 below for a proposed complementary project in
far-infrared observations that will exploit the high resolution and sensitivity of the soon
to be commissioned SIRTF.)
Flat mm-to-submm spectra have been observed in the core of both CentaurusA and
NGC 4374. If indeed the submm core spectra in these objects are flat as the observations
indicate, the results would support the hypothesis that flat spectra are a characteristic
155

of low-luminosity blazars (Hawarden et al., 1993; Kellermann et al., 1997). In terms of
the blazar/FR I unification scheme of AGN, a mis-aligned blazar (or BL Lac) object in
the core is consistent with the FRI morphology that is seen in large-scale radio maps
of NGC 4374 and Centaurus A. Submm observations of a larger sample of these objects
are needed to provide a more definitive test that has implications on the blazar/FR I
unification scheme of AGN.
Properties and Outflows of Cold Dust in M 82: Deep SCUBA 350, 450, 750
and 850pm imaging observations have been presented of the dust-laden nuclear region
and submm halo of M82. The displayed maps include co-added data that were mined
from the SCUBA Data Archive, rsulting in detections of low-level emission out to 1.5 kpc
for the first time in the 850pm continuum of this galaxy, i.e. r 160pc radius farther-out
than other recent studies (see Section 6.3).
The overall, extended submm morphology of M 82 generally resembles the optical
picture; however, the submm morphology is much smoother than the optical, and some
prominent dust cloud and filamentary lanes that are seen in the optical are not obvious
in the submm continuum (see Section 6.3.1). One reason for this relative correspondence
is that the optically-thin submm continuum represents total emission from the entire
galactic columns of dust in the line of sight, while the optical morphology of dust, be-
cause the dust is typically seen obscuring stellar light, rejresents only the dust in certain
spatial stratifications (usually the foreground) of the observed line-of-sight columns. The
overall submm low-level morphology and nuclear spectral index distribution have a gen-
eral north-south asymmetry that can be associated with filamentary H. winds and CO
and X-ray outflows that have been detected in M82, confirming the simple interpretation
(e.g. Leeuw et al., 1998; Alton et al., 1999) that the asymmetric, filamentary structures
-
156

in the submm maps were a manifestation of associated outflows of dust grains from the
galactic nucleus into the halo.
A comparative analysis of submm to high-resolution CO (1-0) morphology showed
that resolved peaks in the CO maps could be associated with unresolved features in the
submm maps (see Section 6.3.2). Assuming that the CO and dust grains were well-
mixed, it was concluded that BIMA maps gave a reasonable indication of how dust
emission might appear at higher resolution. The submm morphology and spectral index
distribution evidence in this thesis disfavour the commonly assumed interpretation that
submm emission arises from a dusty torus in M 82 (see Sections 6.4 and 6.5). The more
likely interpretation is that the emission arises from an east-west asymmetric distribution
of dust concentrations that are in regions of different star-formation environments, as
has been reported from various studies using data at other wavelengths. It is clear
that the CO contamination to higher-frequency continuum may be as significant as the
47% estimated for the SCUBA-850pm band by Seaquist & Clark (2001) and detailed
investigations of the 450 and 350 pm observations are needed to establish their respective
contaminations levels (see Section 6.5.2).
Preliminary analyses show that Maximum Entropy Method .(MEM) deconvolution
or observations with the 180" chop throw respectively are not useful for uniquely en-
hancing the resolution of the SCUBA maps or improving the detection of the submm
continuum in M82 (see Section 6.6). Never the less, extended assessment of the use and
implementation of MEM—re-processing and obtaining maps with the 180" chop throw
for SCUBA observations may be worthy of further investigation in the future. Targeted
beam-map observations of JCMT primary sources with 180" (and also 150") chop throws
would characterise SCUBA results at these large throws and help establish their general
157

usefulness.
Some interesting points have been raised about the origin and structure of the submm
emission in M 82. A more quantitative spatial-correspondence and optical-depth analysis
(and radiative modelling) of the submm versus optical images is needed to make definite
assertions about the origin of any of the features seen in the compared maps. Future
higher resolution observations of dust that will soon be possible with the commissioning
of the Submillimeter Array (Moran, 1996) and the Space Infrared Telescope (e.g. Deutsch
& Bicay, 2000) will provide data that will allow inferred structure at small-scales to be
tested by direct observations. It is re-emphasised that the results of M 82 are presented
as work in progress, and therefore some the conclusions are rather preliminary.
In summary, the thesis has used SCUBA in a submm continuum imaging study of
four, nearby active galaxies, directly revealing the ringed, spiral structure of the optical
dust-lane in the merger-remnant galaxy CentaurusA, placing upper-limits on diffuse dust
in the elliptical galaxy NGC 4374, constraining the cold dust temperature and dust con-
tent in the double-lobed radio galaxy Cygnus A, and showing morphological and spectral
index distribution evidence of nuclear-dust concentrations and outflows in the starburst
galaxy M 82. The results have implications on hypotheses for interactions of star forma-
tion and nuclear activity with dust and thus the general role of the interstellar medium
in galactic evolution.
7.1.1 Outline of Future Submm Polarimetry with SCUBA
The plans for future submm observations of the galaxies described above include po-
larimetry with SCUBA (some that are already underway or proposed for telescope time
at the JCMT) to study the alignment of the emitting dust grains by galactic magnetic
158

fields. The average polarization position angle of the detected dust re-radiation is directly
related to the average orientation of the magnetically-aligned grains; and can therefore
be used to infer structure and common origin of the emitting grains. For example,
imaging polarimetry of Centaurus A obtained with the SCUBA polarimeter will be used
to investigate the relationship of the submm emission detected from the inner parts of
the galaxy and the foreground grains seen in optical obscuration. Similar single-pixel
polarimetry will be undertaken with SCUBA to investigate the relation any detected po-
larization position angles of the centrally concentrated submm continuum from the cores
of Cygnus A and NOC 4374 have in relation to the orientations of the optical dust lanes
in those galaxies. The percentage of polarization will be used to distinguish any non-
thermal component of the detections, as the non-thermal mechanisms (e.g. synchrotron)
are expected to have much higher (up to '-' 30%) linear polarizations than re-radiation
from aligned grains (6%). From these polarimetry observations, the general role of the
magnetic fields themselves on galactic evolution can be studied.
7.2 Plans for Future Observational Work with SIRTF
Properties of the Infrared Continuum in Local Elliptical and Active Galaxies
- Probing Merger Formation and Host-Nuclear Activity Interaction Hypotheses: The
currently popular evolution hypothesis of elliptical galaxies is that they form by mergers
of gas-rich spirals (Schweizer 1998) that go through a dust-rich and far-infrared bright
merging phase prior to relaxation to a normal elliptical. Mergers presumably happen to
all types of galaxies, but evidence of these events should be more obvious in ellipticals
because of the general paucity of the interstellar medium (ISM) and because the accretion
of cold gas is thought to fuel the central dormant engine in these systems, causing them to
159

become active galaxies and radio sources (cf. Knapp 1989). Activity in the galactic.nuclei
can then itself affect the ISM (e.g. Krolik 2001). Detections of the diffuse and compact
emission from nearby elliptical and active galaxies at the unparalleled infrared sensitivity
and spatial resolution that will be made possible by the commissioning of SIRTF 1 will
permit direct comparisons with data of similar resolution at other wavelengths and thus
allow the probing of galactic evolution and host-nuclear activity interaction hypotheses.
Cold Dust in Elliptical Galaxies - Testing the Merger Formation Hypothesis: 2
If it is true that elliptical galaxies form by mergers of gas-rich spirals, then some remnants
of dust from the merger should be seen, at the very least, in young ellipticals with no hot
ISM (Sansom, Hibbard and Schweizer 2000). The older ellipticals are expected to have
little or no dust since the hot gas haloes in these galaxies destroy the dust by sputtering
(Goudfrooij 1994). These predicted evolutionary trends can be tested by combining an
observational programme of well determined dust mass estimates proposed here, available
X-ray data (e.g. Sansom et al. in preparation) and relative age data from morphological
fine structure (e.g. Schweizer & Seitzer 1992) and spectroscopic age indicators (e.g.
Terlevjch & Forbes 2001).
The SIRTF sensitivity is 100 times better and spatial resolution is at lease 3 times
greater than any of the predecessor mid- to far-infrared instruments and therefore will
allow unprecedented constraints on the existence and locations of cool to cold ("-' 90 to
20 K) dust in ellipticals. The far-infrared SIRTF flux from dust is optically thin and
'Space Infrared Telescope Facility (SIRTY) is the final element in NASA's Great Observatories Pro-gram, and is an important scientific and technical cornerstone of the new Astronomical Search for Origins Program. The space-borne, cryogenically-cooled infrared observatory will be launch in July 2002.
' The proposed SIRTF programme of cold dust in elliptical galaxies is a mm-to-infrared-multiwave-observation programme that, if successful, is to be undertaken in association with proposed observations on the JCMT in collaboration with Sansom et al., a paralleled far-IR emission project using ISO data in collaboration with Haas et al., and complementary mm observations proposed at the Nobeyama Radio Telescope.
160

therefore can be detected much deeper in the source than emission at the shorter wave-
lengths, potentially revealing source structure not previously seen. Recent observational
evidence from SCUBA detections of the optically thin dust emission from Centaurus A
(see Figure 7.1a) shows a spiral feature in the optical dust lane and dust emission in
the inner parts of galaxy that were revealed for the first time in this merger-remnant
galaxy (Leeuw et al. 2002). SIRTF will match and in some cases achieve better reso-
lution and sensitivity than the current submm studies, providing complementary fluxes
in the infrared for spectral energy distribution studies. For the optically thin dust, the
far-infrared SIRTF fluxes are directly proportional to the dust mass (for a given temper-
ature and distance). By fitting the fluxes to the spectral energy distribution, the dust
temperatures and hence dust masses can be determined.
Some dust has been detected in numerous elliptical galaxies. About 40% of ellip-
ticals have dust lanes that are seen obscuring optical stellar light (Sadler & Gerhard
1985). A similar percentage of bright ellipticals produce copious infrared emission and
has been detected by IRASat 100 jim (Knapp et al. 1989), with the far-infrared colours
S6opm1S1oo, m 1/3 as expected from cool dust. However, the dust masses estimated
from the IRAS fluxes are typically an order of magnitude higher than is detected in dust
lanes via optical extinction (Goudfrooij 1994). The IRAS excess fluxes suggest the pres-
ence of cool, diffusely distributed dust that is not detected in the dust lanes (Goudfrooij
1994). By assuming lower dust temperature ('-49K) than was detected by IRAS, even
larger dust masses can be inferred in ellipticals (Knapp et al. 1991).
ISO and SCUBA observations showed fairly convincing evidence for very cold (..15 K)
dust in spiral galaxies (e.g. Haas et al. 1998; Dunne & Eales 2001), that increased the
estimated dust masses in spirals by about a factor of three. For observations of ellipticals
161

a
0
0100
30 0
(b S
30 2
Right ascension
Figure 7.1: Contours of the 450pm image superposed on, from top to bottom, (a) an optical waveband image of Centaurus A, digitised from the IIIaJ emulsion photographic plates which are sensitive to emission between 395 and 540 nm wavelengths and (b) a 7pm ISOCAM negative image, courtesy of the Anglo-Australian Observatory and Mirabel et al. (1999) respectively (Leeuw et al., 2002, see Chapter 5).
the ISO sensitivities are limited and have produced only isolated but interesting detec-
tions of cold dust. The preliminary results from the ISO 200 pm observations, that need
to be confirmed with sensitive far-infrared SIRTF and also submm SCUBA observations,
suggest that ellipticals show a range of dust properties (e.g. Haas in preparation). Com-
plementary mm and submm (e.g. with SCUBA) observations are important for sampling
emission from any colder dust that emits longward of the infrared and for pinning down
any non-thermal contribution to the infrared spectrum. By decomposing the radio to
162

infrared spectral energy distribution, any non-thermal contribution to the flux can be
subtracted and dust temperatures (here including very cold dust) as well as the best con-
strained dust masses to date can be determined. The angular size of the SCUBA beams
at 350 and 450pm are very similar to those of SIRTF at 70 and 160 pm, therefore the
submm and IR observations undertaken with these instruments will sample similar emis-
sion regions of most probably related mechanisms, making their complementary use not
only essential but also technically very sensible! In addition to the SCUBA observations,
other complementary submm observations can be proposed with new bolometer arrays
at the Heinrich-Hertz Submillimeter Telescope in Arizona and Caltech Submillimeter
Observatory in Hawaii.
Establishing the presence and properties of extended, cold dust is important for the
understanding of the evolutionary state of ellipticals and the interstellar medium itself.
It will be interesting to see if cold dust (< 25K) also survives in the more hostile environ-
ment of ellipticals galaxies as well, perhaps providing reservoirs for star formation and
nuclear activity? Constraining the total dust content and thus its extinction is also im-
portant for separating the effects of dust and those of increased heavy element abundance,
or increased age of the stellar population, in ellipticals. An observational programme that
investigates the dust in infrared and submm emission will allow a direct and independent
estimation of the effects of dust on broadband colours of ellipticals, which is critical for
accurate dust mass determinations expected from future broadband, large area optical
surveys (e.g. from VISTA). Dust extinction can mimic the effects of increased heavy
element abundance or increased age of the stellar population in ellipticals. For example
the diffusely distributed dust found by Goudfrooij (1994) is enough to explain apparent
age changes across some galaxies in his sample. Therefore future broadband, large area
163

surveys will benefit from accurately knowing the masses of dust present in galaxies.
Infrared Properties at Local Emitting Regions -Probing Host-Nuclear Activity
Interactions: High resolution SIRTF studies of high luminous infrared ellipticals and
active galaxies will determine the detailed infrared emission morphology in the central
kpc scales of these galaxies. In particular, the studies of optical dust lanes that are com-
mon in these objects at these scales will determine, if the infrared emission exclusively
follows the dust lane absorption of optical light and if it has any interesting structure.
The far-infrared (and submm) dust re-radiation is optically thin and this can be exploited
to expose galactic material in the inner parts and structure not seen in the optical and
near-infrared bands. As shown in Figure 7.1b, recent ISO and SCUBA observations of
Centaurus A by Mirabel et al. 1999 and Leeuw et al. 2002 respectively showed that the
dust lane of the galaxy, which appears chaotic in optical maps, is actually a prominent,
elongated spiral feature that may be a circumnuclear ring or bar and extends across the
center of the galaxy out to a radius of-.' 1 kpc. This feature is associated with a concen-
tration of blue stars indicative of high star-formation and its spiral structure may be the
remnant of a merger event that lead to nuclear activity in Centaurus A. If the feature is
a bar as suggested by Mirabel et al. 1999, it may funnel material into the active galactic
nucleus. Remarkable spatial correspondence between images obtained at the mid-IR by
Mirabel et al. 1999 and the submm demonstrate that infrared emission from structures
such as this will be revealed by SIRTF observations of dust lanes at unprecedented spatial
detail and sensitivity. Spectral index distribution analysis from infrared (and submm)
flux ratios will constrain the emission mechanisms in these structures. Morphological
comparisons with data at other wavelengths will reveal associations the dust structures
164

have with common tracers of other activities in the galaxies e.g. H I for star-formation,
X-ray for nuclear activity and cooling flows, optical and near-infrared for stellar activity.
High resolution SIRTF studies of nuclear regions in elliptical and active galaxies will
distinguish components and mechanisms responsible for the mid- to far-infrared emission.
From both dust temperature fits and direct imaging spatial information, some recent far-
infrared and submm observations (e.g. Leeuw, Sansom & Robson 2000; Rupen et al.
1997) of a few ellipticals have indicated some emission at the respective wavelengths is
concentrated at the core of the galaxies, well within a few hundred parces. The emission
is more concentrated than the stellar component, suggesting that the emitting material
resulted from something other than mass-loss in late type stars. The thermal temperature
fits are consistent with emission from the warm to cool (r%J 250 to 50 K) outer regions of
circumstellar tori. High resolution SIRTF observations at selected bands could confirm
the existence of the tori in these objects; in that case, the ratio of fluxes at the different
bands could be used to provide temperature information across the tori. Information
about the incidence and inclinations of the tori in relation to nuclear activity would be
used to access any physical role they play in the relevant activity. For example, are the tori
commonly found perpendicular to active nuclei jets and if so do they direct the jets? The
flux ratios in some sources may alternatively indicate that the infrared emission is the high
frequency non-thermal component of the radio synchrotron or inverse-Compton emission
from the active nuclei cores. In the case of non-thermal emission from both the nuclear
cores and knots in the jets, the infrared fluxes will be important for constraining the high
frequency spectral steeping due to synchrotron high energy loses (e.g. Carilli et al. 1999)
and therefore give age estimates of the sources. It is noted that the studies by Leeuw,
Sansom & Robson 2000 and Rupen et al. 1997 that detected centrally concentrated
165

emission in some ellipticals did not rule out low-level far-infrared and submm emission
from cold, diffuse dust as proposed for sensitive SIRTF imaging above.
Source Selection: Experience from some infrared and submm studies (e.g. Leeuw,
Sansom & Robson 2000; Knapp & Patten 1991; Haas in preparation) indicates some
useful selection criteria for choosing targets of early-type galaxies in which to detect cool
dust. The galaxies need to be relatively strong infrared sources (i.e. have IRASdetections
at 100 or 60 pm and inferred dust masses of> 10 5 M(D ), nearby (< 40— 200 Mpc) in order
to maximise expected low-level fluxes and to resolve emitting regions, and low radio
emitters (to avoid confusion of sources of emission in the submm). For the proposed
study the sample will include a few radio-loud objects to ensure useful detections for the
host-nuclear activity interaction part of the investigation and representative selections
across the elliptical classes. Consideration will also be made to choose galaxies with
published complementary data that will be needed for useful spectral energy studies
and morphological comparisons. These will include galaxies from the samples of Knapp
& Fatten 1991, Goudfrooij 1994, Bregman et al. 1998. In addition to observations
of specifically selected targets for this programme, relevant data will be used from the
SIRTF First Look and Legacy Science Frogrammes. It is anticipated that the results from
the programme proposed here will reveal unprecedented detailed and sensitive infrared
continuum from elliptical and active galaxies, providing unparalleled constraints on the
properties of the emission that will allow the probing of the merger formation and host-
nuclear activity hypotheses in the target galaxies as well as the nature of the emission
itself.
166

Bibliography
Achtermann, J. M. & Lacy, J. H. 1995, ApJ, 439, 163
Alexander, D. M., Efstathiou, A., Hough, J. H., Aitken, D. K., Lutz, D., Roche, P. F.,
& Sturm, E. 1999, MNRAS, 310, 78
Alonso-Herrero, A., Rieke, M. J., Rieke, C. H., & Kelly, D. M. 2001, Ap&SS, 276, 1109
Alton, P. B., Davies, J. I., & Bianchi, S. 1999, A&A, 343, 51
Antonucci, R. R. J. & Miller, J. S. 1985, ApJ, 297, 621
Aumann, H. H., Fowler, J. W., & Melnyk, M. 1990, AJ, 99, 1674
Baade, W. & Minkowski, R. 1954, ApJ, 119, 215
Bailey, J., Sparks, W. B., Hough, J. H., & Axon, D. J. 1986, Nature, 322, 150
Barger, A. J., Cowie, L. L., Sanders, D. B., Fulton, E., Taniguchi, Y., Sato, Y., Kawara,
K., & Okuda, H. 1998, Nature, 394, 248
Barthel, P. D. 1989, ApJ, 336, 606
Baum, S. A., Heckman, T. M., & van Breugel, W. 1992, ApJ, 389, 208
Bell, A. R. 1978, MNRAS, 182,443
167

Blandford, R. D. & Rees, M. J. 1974, MNRAS, 169, 395
Block, D. L. & Sauvage, M. 2000, A&A, 353, 72
Bolton, J. G., Stanley, C. J., & Slee, 0. B. 1949, Nature, 164, 101
Bower, G. A., Heckman, T. M., Wilson, A. S., & Richstone, D. 0. 1997, ApJ, 483, L33
Bradford, C. M., Stacey, C. J., Nikola, T., Swain, M. R., Bolatto, A. D., Jackson, J. M.,
Savage, M. L., & Davidson, J. A. 1999, in American Astronomical Society Meeting,
Vol. 195, 7304
Bridle, A. H. & Perley, R. A. 1984, ARA&A, 22, 319
Brodie, J., Koenigl, A., & Bowyer, S. 1983, ApJ, 273, 154
Brown, L. M. J., Robson, E. I., Gear, W. K., & Smith, M. C. 1989, ApJ, 340,150
Bryant, J. J. & Hunstead, R. W. 1999, MNRAS, 308, 431
Canizares, C. R., Fabbiano, C., & Trinchieri, C. 1987, ApJ, 312, 503
Carilli, C. L. & Barthel, P. D. 1996, A&A Rev., 7, 1
Carilli, C. L. & Harris, D. E. 1996, Cygnus A - Study of a Radio Galaxy (Cambridge
University Press)
Carilli, C. L., Kurk, J. D., van der Werl, P. P., Perley, R. A., & Miley, C. K. 1999, AJ,
118, 2581
Carilli, C. L., Perley, R., Harris, D. EL, & Barthel, P. D. 1998, Physics of Plasmas,
Volume 5, Issue 5, May 1998, pp.1981-1990, 5, 1981
Carilli, C. L., Perley, R. A., Dreher, J. W., & Leahy, J. P. 1991, ApJ, 383, 554

Charmandaris, V., Combes, F., & van der Huist, J. M. 2000, A&A, 356, Li
Chevalier, R. A. & Clegg, A. W. 1985, Nature, 317, 44
Clarke, D. A., Burns, J. 0., & Norman, M. L. 1992, ApJ, 395, 444
Cunningham, C. T., Ade, P. A. R., Robson, E. I., & Radostitz, J. V. 1984, MNRAS, 211,
543
de Grijs, R. 2001, Astronomy and Geophysics, 42, 12
Deutsch, M. & Bicay, M. D. 2000, Ap&SS, 273, 187
Devine, D. & Bally, J. 1999, ApJ, 510, 197
Dietz, R. D., Gehrz, R. D., Jones, T. J., Grasdajen, C. L., Smith, J., Gullixson, C., &
Hackwell, J. A. 1989, AJ, 98, 1260
Dietz, R. D., Smith, J., Hackwell, J. A., Gehrz, R. D., & Grasdalen, G. L. 1986, AJ, 91,
758
Draine, B. T. 1990, in ASSL Vol. 161: The Interstellar Medium in Galaxies, 483-492
Draine, B. T. & Salpeter, E. E. 1979, ApJ, 231, 77
Duncan, W. D., Sandell, 0., Robson, E. I., Ade, P. A. R., & Griffin, M. J. 1990, MNRAS,
243, 126
Duschl, W. J., Strittmatter, P. A., & Biermann, P. L. 2000, A&A, 357, 1123
Eales, S. A., Alexander, P., & Duncan, W. D. 1989, MNRAS, 240, 817
Eckart, A., Cameron, M., Rothermel, H., Wild, W., Zinnecker, H., Rydbeck, G., Olberg,
M., & Wiklihd, T. 1990, ApJ, 363, 451
169

Eckart, A., Wild, W., & Ageorges, N. 1999, ApJ, 516, 769
Edmunds, M. G. 2001, MNRAS, 328, 223
Edmunds, M. G. & Eales, S. A. 1998, MNRAS, 299, L29
Emerson, D. T. 1995, in ASP Conf. Ser. 75: Multi-Feed Systems for Radio Telescopes,
309
Emerson, J. P., Clegg, P. E., Gee, 0., Griffin, M. J., Cunningham, C. T., Brown, L.
M. J., Robson, E. I., & Longmore, A. J. 1984, Nature, 311, 237
Forster Schreiber, N. M. 2000, New Astronomy Review, 44, 263
Fanaroff, B. L. & Riley, J. M. 1974, MNRAS, 167, 31P
Fullmer, L. & Londsdale, C. J. 1989, Cataloged galaxies and quasars observed in the
JR.AS survey (Pasadena: Jet Propulsion Laboratory, Version 2)
Garcfa-Burillo, S., Martfn-Pintado, J., Fuente, A., & Neri, R. 2001, ApJ, 563, L27
Gear, W. K. 1988, in Millimetre and Submillimetre Astronomy, 307-338
Gear, W. K., Robson, E. I., Ade, P. A. R., Smith, M. C., C!egg, P. E., Cunningham,
C. T., Griffin, M. J., Nolt, I. G., & Radostitz, J. V. 1984, ApJ, 280, 102
Gear, W. K., Robson, E. I., Gee, G., & Nolt, I. C. 1985, MNR.AS, 217, 281
Golombek, D., Miley, G. K., & Neugebauer, G. 1988, AJ, 95, 26
Goudfrooij, P. 1994, PhD thesis, Ph. D. thesis, University of Amsterdam, The Nether-
lands
Goudfrooij, P. & de Jong, T. 1995, A&A, 298, 784
170

Goudfrooij, P., Hansen, L., Jorgensen, H. E., & Norgaard-Nielsen, H. U. 1994, A&AS,
105,341
Graham, J. A. 1979, ApJ, 232, 60
Greaves, J. S., Holland, W. S., Moriarty-Schieven, G., Jenness, T., Dent, W. R. F.,
Zuckerman, B., McCarthy, C., Webb, R. A., Butner, H. M., Gear, W. K., & Walker,
H. J. 1998, ApJ, 506, L133
Griffin, M. J. & Orton, G. S. 1993, Icarus, 105, 537
Guesten, R., Serabyn, E., Kasemann, C., Schinckel, A., Schneider, G., Schulz, A., &
Young, K. 1993, ApJ, 402, 537
Gull, S. F. & Skilling, J. 1983, in Indirect Imaging - Measurement and Processing for In-
direct Imaging. Proceedings of an International Symposium held in Sydney, Australia,
August 30-September 2, 1983. Editor, J.A. Roberts; Publisher, Cambridge University
Press, Cambridge, England, 267
Hass, M., Chini, R., Meisenheimer, K., Stickel, M., Lemke, D., Klaas, U., & Kreysa, E.
1998, ApJ, 503, L109
Hajian, A. R. ., Phillips, J. A., & Terzian, Y. 1996, ApJ, 467, 341
Hajian, A. R., Phillips, J. A., & Terzian, Y. 1995, ApJ, 446, 244
Hargrave, P. J. & Ryle, M. 1974, MNRAS, 166, 305
Hawarden, T. G., Sandell, G, Matthews, H. E., Friberg, P., Watt, G. D., & Smith, P. A.
1993, MNRAS, 260,844
Hildebrand, R. H. 1983, QJRAS, 24, 267
171

Ho, L. C., Filippenko, A. V., & Sargent, W. L. W. 1996, in ASP Conf. Ser. 91: IAU
Colloq. 157: Barred Galaxies, 188
Holland, W. S., Greaves, J. S., Zuckerman, B., Webb, R. A., McCarthy, C., Coulson,
I. M., Waither, D. M., Dent, W. R. F., Gear, W. K., & Robson, I. 1998, Nature, 392,
Holland, W. S., Robson, E. I., Gear, W. K., Cunningham, C. R., Lightfoot, J. F., Jenness,
T., Ivison, R. J., Stevens, J. A., Ade, P. A. R., Griffin, M. J., Duncan, W. D., Murphy,
J. A., & Naylor, D. A. 1999, MNRAS, 303, 659
Hughes, D. H., Dunlop, J. S., & Rawlings, S. 1997, MNRAS, 289, 766
Hughes, D. H., Gear, W. K., & Robson, E. I. 1994, MNRAS, 270, 641
Hughes, D. H., Robson, E. I., Dunlop, J. S., & Gear, W. K. 1993, MNRAS, 263, 607
Hughes, D. H., Robson, E. I., & Gear, W. K. 1990, MNRAS, 244, 759
Hughes, D. H., Serjeant, S., Dunlop, J., Rowan-Robinson, M., Blain, A., Mann, R. G.,
Ivison, R., Peacock, J., Efstathiou, A., Gear, W., Oliver, S., Lawrence, A., Longair,
M., Goldschmjdt, P., & Jenness, T. 1998, Nature, 394, 241
Hui, X., Ford, H. C., Ciardullo, R., & Ja.coby, G. H. 1993, ApJ, 414, 463
Israel, F. P. 1998, A&A Rev., 8, 237
Israel, F. P., van der Werf, P. P., & Tilanus, R. P. J. 1999, A&A, 344, L83
Jenkins, C. J., Pooley, G. G., & Riley, J. M. 1977, MmRAS, 84, 61
Jenness, T., Lightfoot, J. F., & Holland, W. S. 1998, Proc. SPIE, 3357, 548
172

Johnstone, D. & Bally, J. 1999, ApJ, 510, L49
Joy, M., Harvey, P. M., Tollestrup, E. V., Sellgren, K., McGregor, P. J., & Hyland, A. R.
1991, ApJ, 366, 82
Kellermann, K. I., Zensus, J. A., & Cohen, M. H. 1997, ApJ, 475, L93
Klaas, U., Haas, M., Heinrichsen, I., & Schulz, B. 1997, A&A, 325, L21
Knapp, G. R., Bies, W. E., & van Gorkom, J. H. 1990, AJ, 99, 476
Knapp, C. R. & Patten, B. M. 1991, AJ, 101, 1609
Kraft, R. P., Forman, W., Jones, C., Kenter, A. T., Murray, S. S., Aldcroft, T. L.,
Elvis, M. S., Evans, I. N., Fabbiano, G., Isobe, T., Jerius, D., Karovska, M., Kim, D.,
Prestwich, A. H., Primini, F. A., Schwartz, D. A., Schreier, E. J., & Vikhlinin, A. A.
2000, ApJ, 531, L9
Krichbaum, T. P., Alef, W., Witzel, A., Zensus, J. A., Booth, R. S., Greve, A., & Rogers,
A. E. E. 1998, A&A, 329, 873
Kronberg, P. P., Biermann, P., & Schwab, F. R. 1985, ApJ, 291, 693
Kuno, N. & Matsuo, H. 1997, PASJ, 49, 265
Laing, R. A. & Bridle, A. H. 1987, MNRAS, 228, 557
Leeuw, L. L., Hawarden, T. G., Matthews, H. E., Robson, E. I., & Eckart, A. 2002, ApJ,
565,131
Leeuw, L. L., Hughes, D. H. & Robson, E. I. 1998, in IAU Symposium, Vol. 192, E22
173

Leeuw, L. L. & Robson, E. I. 1999, in IAU Symp. 194: Activity in Galaxies and Related
Phenomena, Vol. 194, 179
Leeuw, L. L. & Robson, E. 1. 2000, in Imaging at Radio through Submillimeter Wave-
lengths. Edited by Jeff Mangum. Publisher: The Astronomical Society of the Pacific,
Conference Series, 2000. The conference was held June 6-8, 1999, in Tucson, Arizona.,
E40
Leeuw, L. L., Sansom, A. E., & Robson, E. I. 2000, MNRAS, 311, 683
Linfield, R. 1985, ApJ, 295, 463
Longair, M. S. 1997, High energy astrophysics. Vol.2: Stars, the galaxy and the inter-
stellar medium (Cambridge: Cambridge University Press, 2nd edition, 1st reprint)
Low, F. J., Young, E., Beintema, D. A., Gautier, T. N., Beichman, C. A., Aumann,
H. H., Gillett, F. C., Neugebauer, G., Boggess, N., & Emerson, J. P. 1984, ApJ, 278,
L19
Lynds, C. R. & Sandage, A. R. 1963, ApJ, 137, 1005
MaIm, D. F., Quinn, P. J., & Graham, J. A. 1983, ApJ, 272, L5
Marconi, A., Schreier, E. J., Koekemoer, A., Capetti, A., Axon, D., Macchetto, D., &
Caon, N. 2000, ApJ, 528, 276
Martin-Pintado, J., Gaume, R. A., Johnston, K. J., & Bachiller, R. 1995, ApJ, 446, 687
Masson, C. R. 1994, in ASP Conf. Ser. 59: IAU Colloq. 140: Astronomy with Millimeter
and Submillimeter Wave Interferometry, 87
174

Mirabel, I. F., Laurent, 0., Sanders, D..B., Sauvage, M., Tagger, M., Charmandaris, V.,
Vigroux, L., Gallais, P., Cesarsky, C., & Block, D. L. 1999, A&A, 341, 667
Moran, J. M. 1996, in American Astronomical Society Meeting, Vol. 188, 4605
Muxiow, T. W. B., Pedlar, A., Wilkinson, P. N., Axon, D. J., Sanders, E. M., & de
Bruyn, A. G. 1994, MNRAS, 266, 455
Nakai, N., Hayashi, M., Handa, T., Sofue, Y., Hasegawa, T., & Sasaki, M. 1987, PASJ,
39,685
Neininger, N., Guelin, M., Klein, U., Garcia-Burillo, S., & Wielebinski, R. 1998, A&A,
339, 737
Nicholson, R. A., Bland-Hawthorn, J., & Taylor, K. 1992, ApJ, 387, 503
Orton, G. S. 1986, Science, 231, 836
Pacholczyk, A. G. 1970, Radio astrophysics. Nonthermal processes in galactic and extra-
galactic sources (San Francisco: Freeman)
Perley, R. A., Dreher, J. W., & Cowan, J. J. 1984, ApJ, 285, L35
Petitpas, G. R. & Wilson, C. D. 2000, ApJ, 538, L117
Pierce-Price, D., Richer, J. S., Greaves, J. S., Holland, W. S., Jenness, T., Lasenby,
A. N., White, G. J., Matthews, H. E., Ward-Thompson, D., Dent, W. R. F., Zylka, R.,
Mezger, P., Hasegawa, T., Oka, T., Omont, A., & Gilmore, G. 2000, ApJ, 545, L121
Quillen, A. C., de Zeeuw, P. T., Phinney, E. S., & Phillips, T. G. 1992, ApJ, 391, 121
Quillen, A. C., Graham, J. R., & Frogel, J. A. 1993, ApJ, 412, 550
175

Rieke, G. H. & Lebofsky, M. J. 1981, ApJ, 250, 87
Roberts, M. S., Hogg, D. E., Bregman, J. N., Forman, W. R., & Jones, C. 1991, ApJS,
75,751
Robson, E. I. 1996, Active Galactic Nuclei (New York, NY: Wiley, Chichester: Praxis
Publishing)
Robson, E. I. 2001, in IAU CoIloq. 184: AGN Surveys, E27
Robson, E. I., Leeuw, L. L., Stevens, J. A., & Holland, W. S. 1998, MNRAS, 301, 935
Robson, E. I., Litchfield, S. J., Gear; W. K., Hughes, D. H., Sandell, 0., Courvoisier, T.
J. ., Paltani, S., Valtaoja, E., Terasranta, H., Tornikoski, M., Steppe, H., & Wright,
M. C. H. 1993, MNRAS, 262,249
Rowan-Robinson, M. 1992, MNRAS, 258, 787
Salter, C. J., Chini, R., Haslam, C. G. T., Junor, W., Kreysa, E., Mezger, P. G., Spencer,
R. E., Wink, J. E., & Zylka, R. 1989, A&A, 220, 42
Sandell, G. . 1994, MNRAS, 271, 75
Sandell, G. 1998, JAC WEB pages, 271, 75
Sanders, D. B., Phinney, E. S., Neugebauer, G., Soifer, B. T., & Matthews, K. 1989,
ApJ, 347, 29
Schiminovich, D., van Gorkom, J. H., van der Huist, J. M., & Kasow, S. 1994, ApJ, 423,
L101
Schreier, E. J., Capetti, A. ., Macchetto, F., Sparks, W. B., & Ford, H. J. 1996, ApJ,
459,535
176

Schreier, E. J., Capetti, A., Macchetto, F., Sparks, W. B., & Ford, H. J. 1998, STScI
Electronic Press Release STScJ-PRC98-14, 459, 535
Seaquist, E. R. & Clark, J. 2001, ApJ, 552, 133
Seaquist, E. R. & Odegard, N. 1991, Ap.J, 369, 320
Shen, J. & Lo, K. Y. 1995, ApJ, 445, L99
Shopbell, P. L. & Bland-Hawthorn, J. 1998, ApJ, 493, 129
Smail, I., Ivison, R. J., & Blain, A. W. 1997, ApJ, 490, L5
Sparks, W. B., Wall, J. V., Thorne, D. J., Jorden, P. R., van Breda, I. 0., Rudd, P. J.,
& Jorgensen, H. E. 1985, MNR.AS, 217, 87
Stevens, J. A. & Robson, E. I. 1994, MNRAS, 270, L75
Stockton, A., Ridgway, S. E., & Lilly, S. J. 1994, AJ, 108, 414
Tammann, G. A. & Sandage, A. 1968, ApJ, 151, 825
Telesco, C. M., Joy, M., Dietz, K., Decher, R., & Campins, H. 1991, ApJ, 369, 135
Thuma, 0., Neininger, N., Klein, U., & Wielebinski, R. 2000, A&A, 358, 65
Tingay, S. J., Jauncey, D. L., Reynolds, J. E., Tzioumis, A. K., King, E. A., Preston,
R. A., Jones, D. L., Murphy, D. W., Meier, D. L., van Ommen, T. D., McCulloch,
P. M., Ellingsen, S. P., Costa, M. E., Edwards, P. 0., Lovell, J. E. J., Nicolson, G. D.,
Quick, J. F. H., Kemball, A. J., Migenes, V., Harbison, P., Jones, P. A., White, G. L.,
Gough, R. G., Ferris, R. H., Sinclair, M. W., & Clay, R. W. 1998, AJ, 115, 960
Tubbs, A. D. 1980, ApJ, 241, 969
177

Unger, S. J., Clegg, P. E., Stacey, G. J., Cox, P., Fischer, J., Greenhouse, M., Lord,
S. D., Luhman, M. L., Satyapal, S., Smith, H. A., Spinoglio, L., & Wolfire, M. 2000,
A&A, 355, 885
van Gorkom, J. H., van der Huist, J. M., Haschick, A. D., & Tubbs, A. D. 1990, AJ, 99,
1781
Walter, F., Weiss, A., & Scoville, N. 2001, in American Astronomical Society Meeting,
Vol. 199, 4904
Ward, M. J., Blanco, P. R., Wilson, A. S., & Nishida, M. 1991, ApJ, 382, 115
Watson, M. C., Stanger, V., & Griffiths, R. E. 1984, ApJ, 286, 144
Wills, K. A., Redman, M. P., Muxlow, T. W. B., & Pedlar, A. 1999, MNRAS, 309, 395
Worthey, G. 1994, ApJS, 95, 107
Wright, E. L. 1976, ApJ, 210, 250
Wright, M. & Birkinshaw, M. 1984, ApJ, 281, 135
Wrobel, J. M. 1991, AJ, 101, 127
178