milwaukee public schools
TRANSCRIPT
MILWAUKEE PUBLIC SCHOOLS MEASURES OF ACADEMIC PROGRESS
Melanie Stewart, Ph.D. June 25, 2013
Gregory E. Thornton, Ed.D. Superintendent of Schools Christina Flood Chief Academic Officer
(ATTACHMENT 1) REPORT AND POSSIBLE ACTION REGARDING MEASURES OF ACADEMIC PROGRESS
(MAP) RESULTS
1-1
Measures of Academic Progress
• The Measures of Academic Progress (MAP) has
been used as the Universal Screener for the
district for 3 years.
• Students take the assessment in Kindergarten
through 12th grade in fall, winter and spring
• All students take Reading and Math assessments,
except kindergarten students take math only.
These students’ reading skills are measured on
the state Phonological Awareness Literacy
Screening assessment (PALS)
1-2
Goals
• MAP is used to monitor student academic
growth
• The assessment also provides tools to be
used by classroom teachers to target
instruction and interventions
• Results include Value-Added Growth,
Achievement and Simple Growth compared
to average national growth
1-3
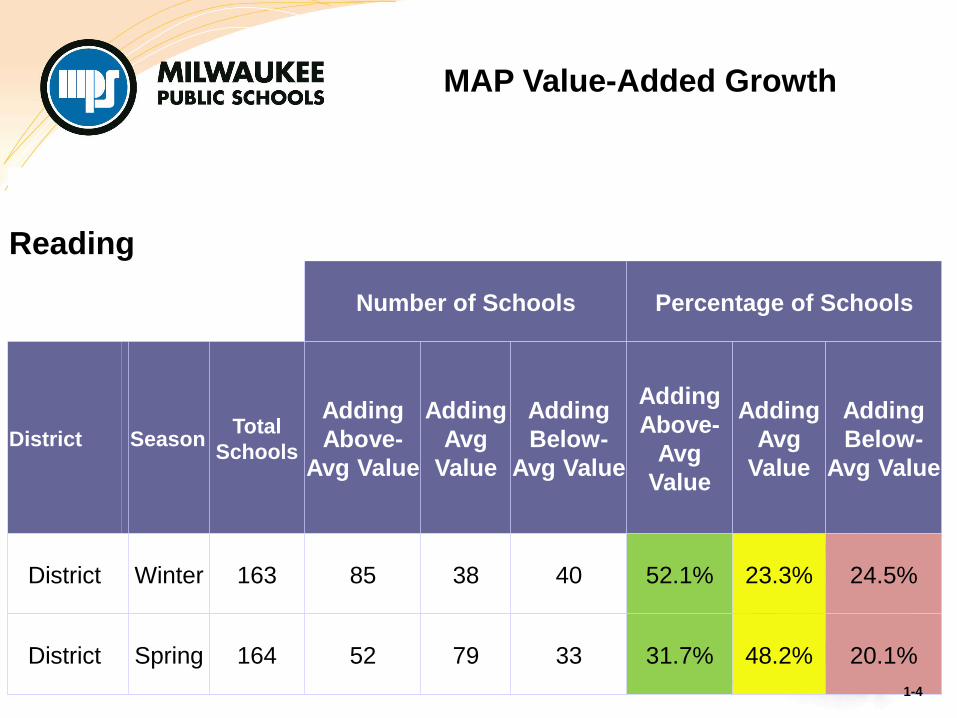
MAP Value-Added Growth
Reading
Number of Schools Percentage of Schools
District Season Total
Schools
Adding
Above-
Avg Value
Adding
Avg
Value
Adding
Below-
Avg Value
Adding
Above-
Avg
Value
Adding
Avg
Value
Adding
Below-
Avg Value
District Winter 163 85 38 40 52.1% 23.3% 24.5%
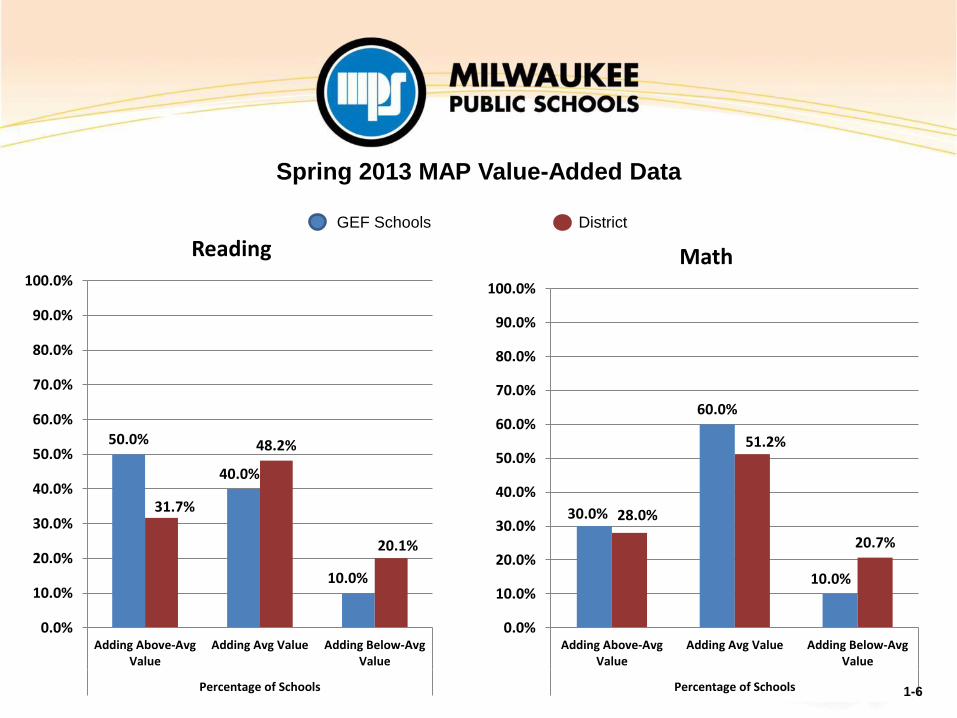
District Spring 164 52 79 33 31.7% 48.2% 20.1%
1-4

MAP Value-Added Growth
Math
Number of Schools Percentage of Schools
District
Season
Total
Schools
Adding
Above-
Avg
Value
Adding
Avg
Value
Adding
Below-
Avg
Value
Adding
Above-
Avg
Value
Adding
Avg
Value
Adding
Below-
Avg
Value
District Winter 163 99 31 33 60.7% 19% 20.2%
District Spring 164 46 84 34 28% 51.2% 20.7%
1-5
0.0%
10.0%
20.0%
30.0%
40.0%
50.0%
60.0%
70.0%
80.0%
90.0%
100.0%
Adding Above-Avg Value
Adding Avg Value Adding Below-Avg Value
Percentage of Schools
Math
GE Schools
District
Spring 2013 MAP Value-Added Data
50.0%
40.0%
10.0%
31.7%
48.2%
20.1%
0.0%
10.0%
20.0%
30.0%
40.0%
50.0%
60.0%
70.0%
80.0%
90.0%
100.0%
Adding Above-AvgValue
Adding Avg Value Adding Below-AvgValue
Percentage of Schools
Reading
30.0%
60.0%
10.0%
28.0%
51.2%
20.7%
0.0%
10.0%
20.0%
30.0%
40.0%
50.0%
60.0%
70.0%
80.0%
90.0%
100.0%
Adding Above-AvgValue
Adding Avg Value Adding Below-AvgValue
Percentage of Schools
Math
GEF Schools District
1-6
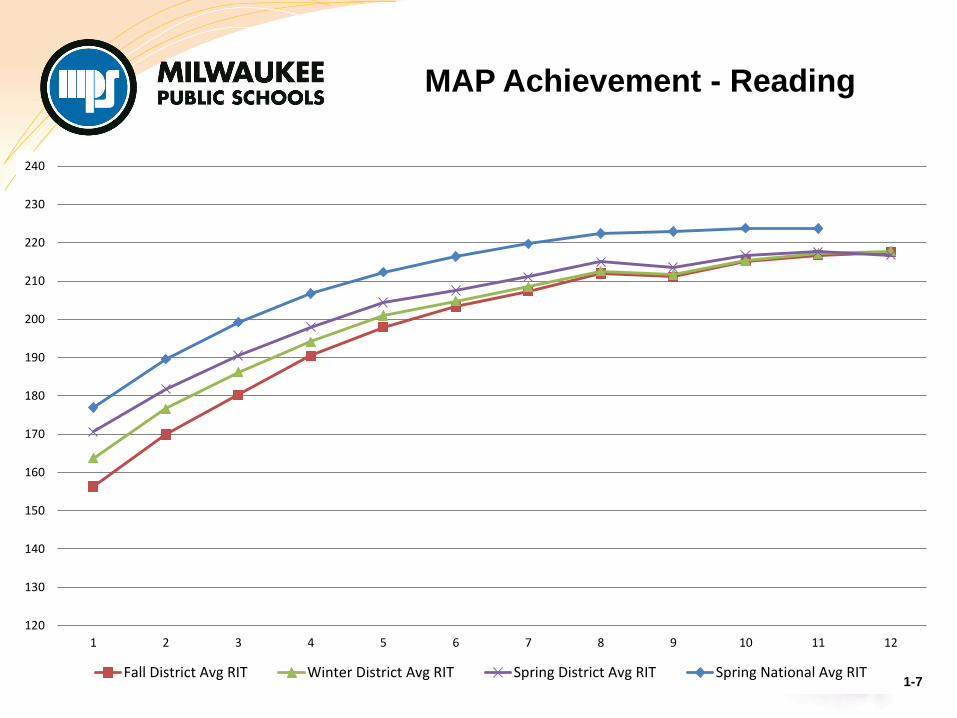
MAP Achievement - Reading
120
130
140
150
160
170
180
190
200
210
220
230
240
1 2 3 4 5 6 7 8 9 10 11 12
Fall District Avg RIT Winter District Avg RIT Spring District Avg RIT Spring National Avg RIT1-7

MAP Achievement - Math
120
130
140
150
160
170
180
190
200
210
220
230
240
K 1 2 3 4 5 6 7 8 9 10 11 12
Fall District Avg RIT Winter District Avg RIT Spring District Avg RIT Spring National Avg RIT
Kindergarten achievement in
spring met the national
average
1-8
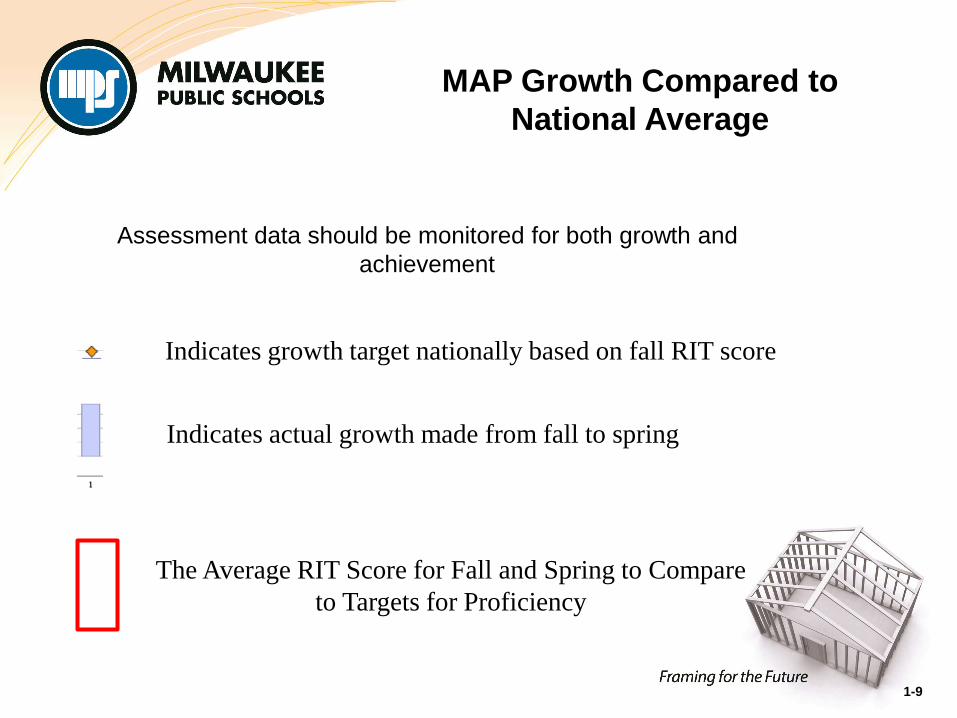
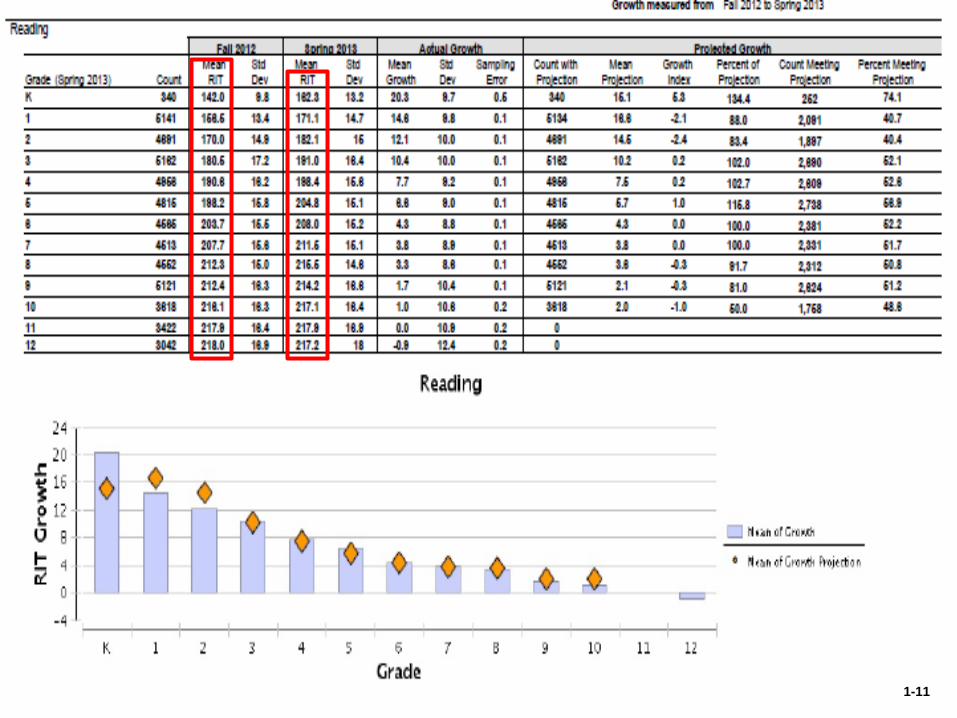
MAP Growth Compared to
National Average
Assessment data should be monitored for both growth and
achievement
Indicates growth target nationally based on fall RIT score
Indicates actual growth made from fall to spring
The Average RIT Score for Fall and Spring to Compare
to Targets for Proficiency
1-9
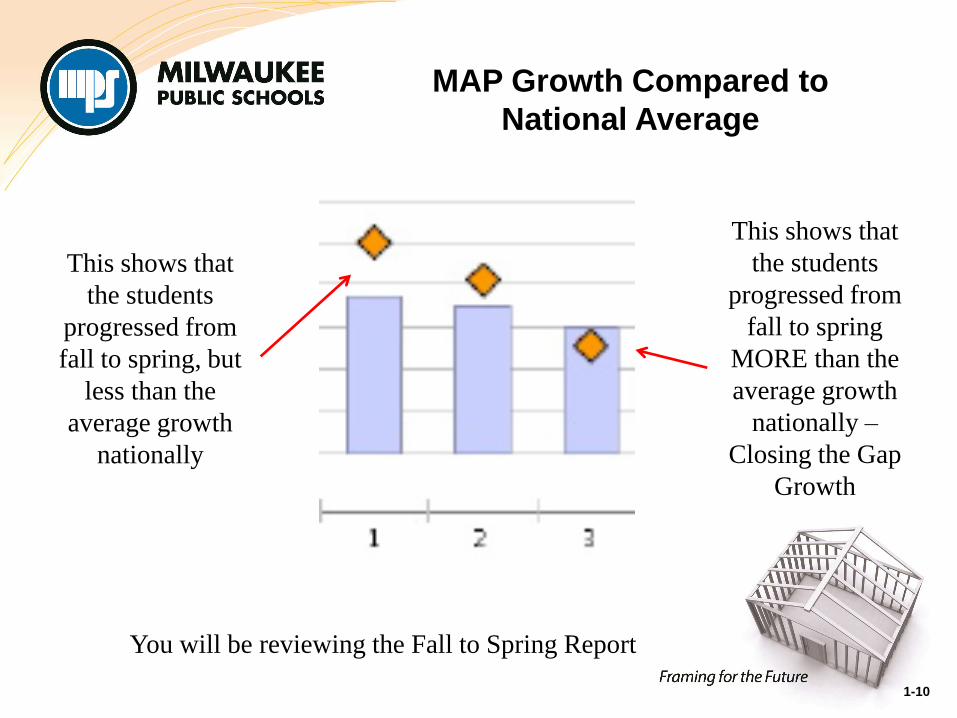
MAP Growth Compared to
National Average
This shows that
the students
progressed from
fall to spring, but
less than the
average growth
nationally
This shows that
the students
progressed from
fall to spring
MORE than the
average growth
nationally –
Closing the Gap
Growth
You will be reviewing the Fall to Spring Report
1-10
MAP Achievement - Math
1-11

MAP Achievement - Math
1-12
Looking Ahead to 2013-14
• MAP aligned to the Common Core State Standards will be
implemented in 2013-14
• Monitor achievement compared to projected proficiency on
the state assessment
• Monitor achievement compared to projected scores on ACT
• Monitor growth compared to the state and/or nation
• Provide professional development on using the data to
inform instruction
1-13
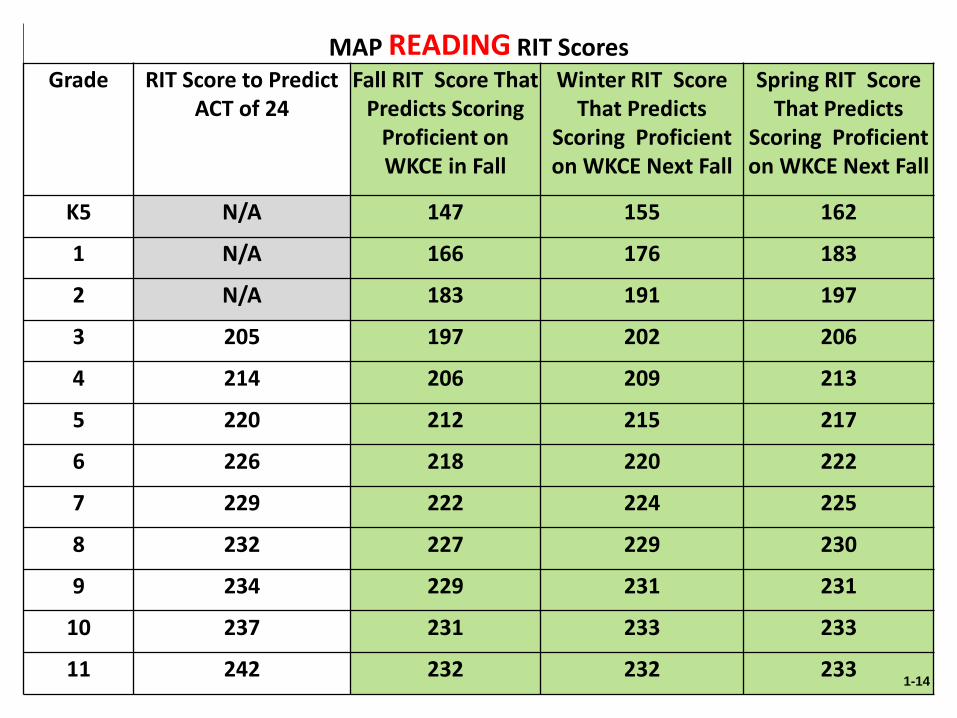
MAP READING RIT Scores Grade RIT Score to Predict
ACT of 24 Fall RIT Score That
Predicts Scoring Proficient on WKCE in Fall
Winter RIT Score That Predicts
Scoring Proficient on WKCE Next Fall
Spring RIT Score That Predicts
Scoring Proficient on WKCE Next Fall
K5 N/A 147 155 162
1 N/A 166 176 183
2 N/A 183 191 197
3 205 197 202 206
4 214 206 209 213
5 220 212 215 217
6 226 218 220 222
7 229 222 224 225
8 232 227 229 230
9 234 229 231 231
10 237 231 233 233
11 242 232 232 233 1-14

MAP MATH RIT Scores Grade RIT Score to Predict
ACT of 24 Fall RIT Score That Predicts
Scoring Proficient on WKCE in Fall
Winter RIT Score That Predicts
Scoring Proficient on WKCE Next Fall
Spring RIT Score That Predicts
Scoring Proficient on WKCE Next Fall
K5 N/A 145 153 161
1 N/A 165 175 181
2 N/A 180 187 193
3 207 194 200 205
4 217 204 209 213
5 228 212 217 220
6 239 222 225 228
7 242 227 230 232
8 247 235 238 239
9 250 238 240 240
10 253 239 241 241
11 258 242 242 242 1-15

Milwaukee Public Schools MEASURES OF ACADEMIC PROGRESS
MPS Board of School Directors Dr. Michael Bonds, President Larry Miller, Vice President Mark Sain, District 1 Jeff Spence, District 2 Annie Woodward, District 4 Dr. Tatiana Joseph, District 6 Claire Zautke, District 7 Meagan Holman, District 8 Terrence Falk, At-Large
Senior Team Dr. Gregory Thornton, Superintendent Naomi Gubernick, Chief of Staff Darienne Driver, Chief Innovation Officer Tina Flood, Chief Academic Officer Dr. Karen Jackson, Chief Human Resources Officer Michelle Nate, Chief Operations Officer Gerald Pace, Esq., Chief Financial Officer Anita Pietrykowski, Chief, School Administration Denise Callaway, Executive Director of Community Engagement Patricia Gill, Executive Director, Family Services Sue Saller, Coordinator to the Superintendent
1-16