mind over matter? - ined · mind over matter? 20-year trends in physically and cognitively healthy...
TRANSCRIPT
Mind over matter?20-year trends in physically andcognitively healthy life years of
65-year-olds in the Netherlands
Dorly Deeg, Hannie Comijs, Emiel Hoogendijk, Martijn Huisman
Epidemiology of Ageing, VU University Medical Centre Amsterdam, The Netherlands
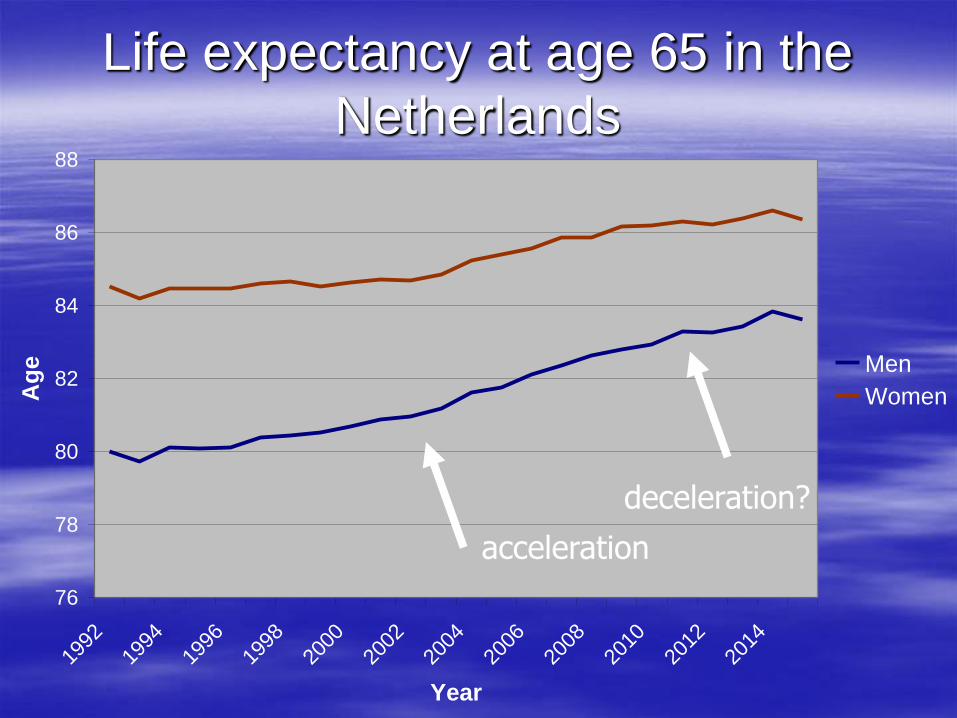
Life expectancy at age 65 in the
Netherlands
76
78
80
82
84
86
88
1992
1994
1996
1998
2000
2002
2004
2006
2008
2010
2012
2014
Year
Ag
e Men
Women
acceleration
deceleration?

1. Are the additional years gained spent in
good or poor health / no disability or
disability?
2. Is the answer different when looking at
mild or severe health conditions /
disability?
3. (More recently) Is the answer different for
physical and cognitive health?
The eternal questions…
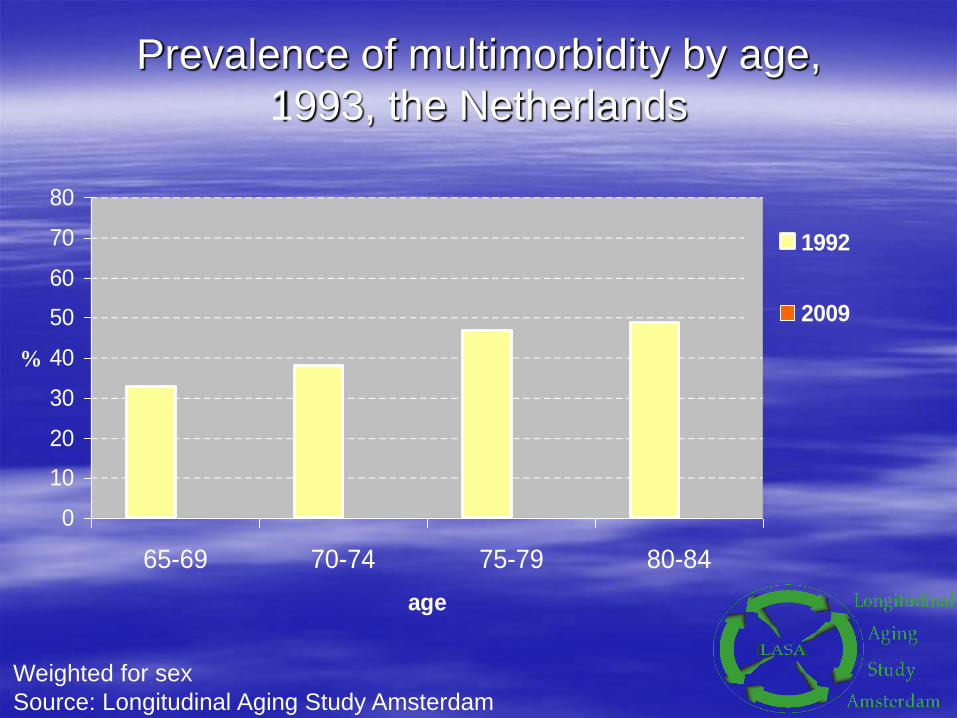
Prevalence of multimorbidity by age,
1993, the Netherlands
0
10
20
30
40
50
60
70
80
65-69 70-74 75-79 80-84
age
%
1992
2009
Weighted for sex
Source: Longitudinal Aging Study Amsterdam
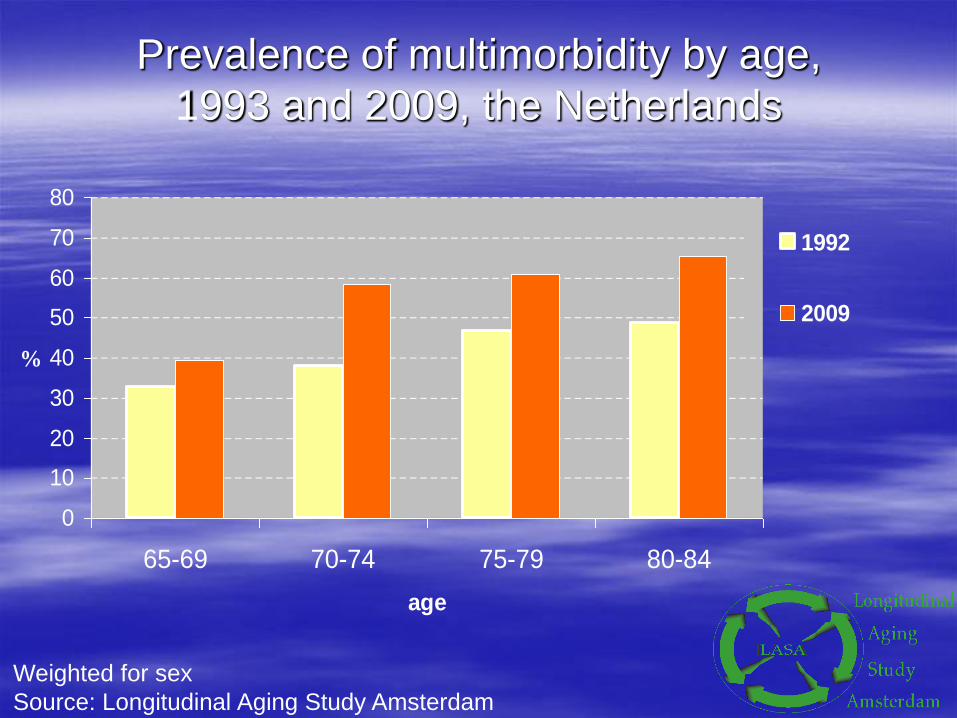
Prevalence of multimorbidity by age,
1993 and 2009, the Netherlands
0
10
20
30
40
50
60
70
80
65-69 70-74 75-79 80-84
age
%
1992
2009
Weighted for sex
Source: Longitudinal Aging Study Amsterdam

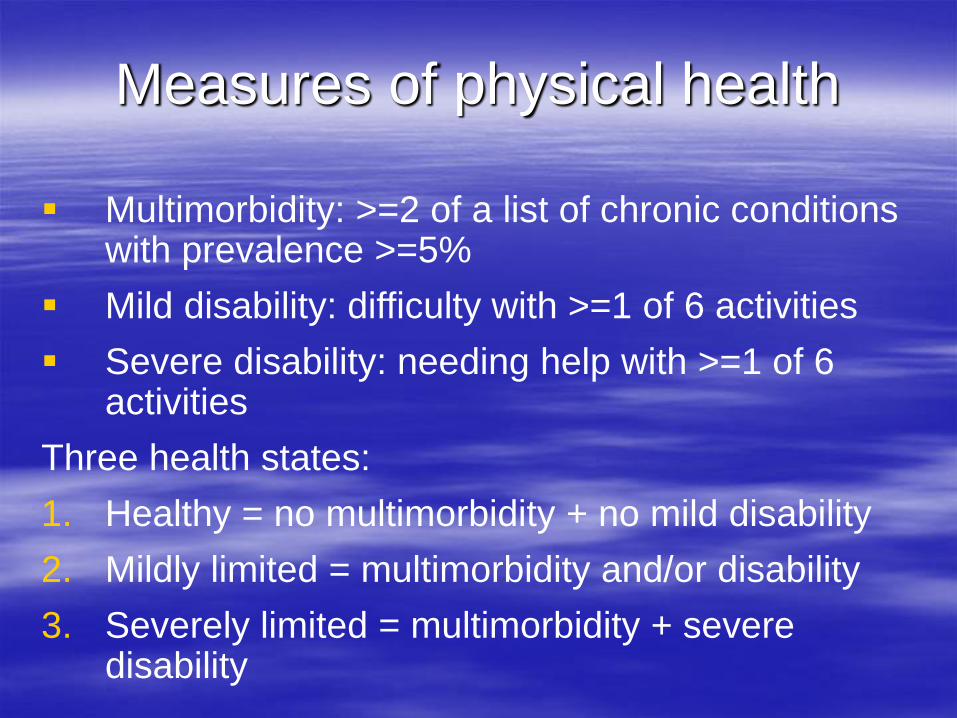
Multimorbidity: >=2 of a list of chronic conditions with prevalence >=5%
Mild disability: difficulty with >=1 of 6 activities
Severe disability: needing help with >=1 of 6 activities
Three health states:
1. Healthy = no multimorbidity + no mild disability
2. Mildly limited = multimorbidity and/or disability
3. Severely limited = multimorbidity + severe disability
Measures of physical health
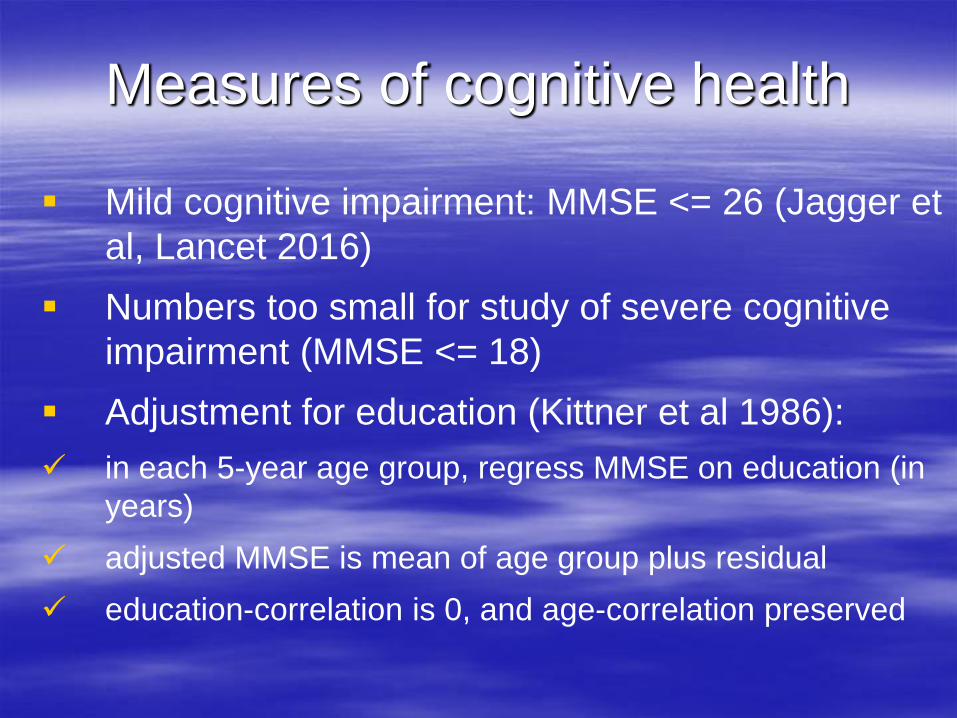
Mild cognitive impairment: MMSE <= 26 (Jagger et
al, Lancet 2016)
Numbers too small for study of severe cognitive
impairment (MMSE <= 18)
Adjustment for education (Kittner et al 1986):
in each 5-year age group, regress MMSE on education (in
years)
adjusted MMSE is mean of age group plus residual
education-correlation is 0, and age-correlation preserved
Measures of cognitive health
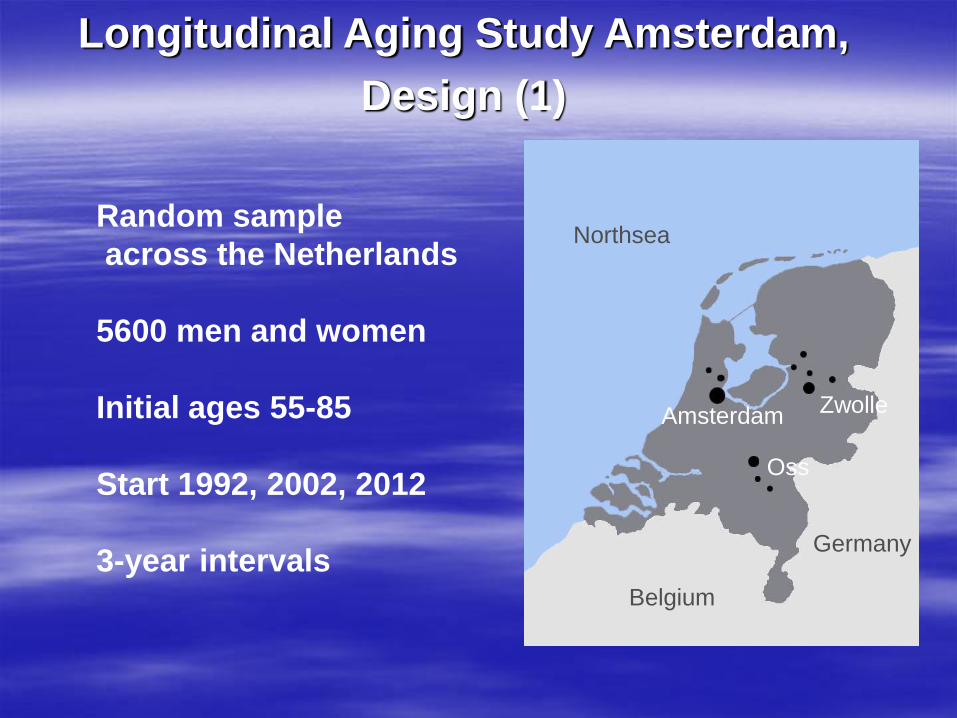
Random sample
across the Netherlands
5600 men and women
Initial ages 55-85
Start 1992, 2002, 2012
3-year intervals
Zwolle
Oss
Amsterdam
Germany
Belgium
Northsea
Longitudinal Aging Study Amsterdam,
Design (1)
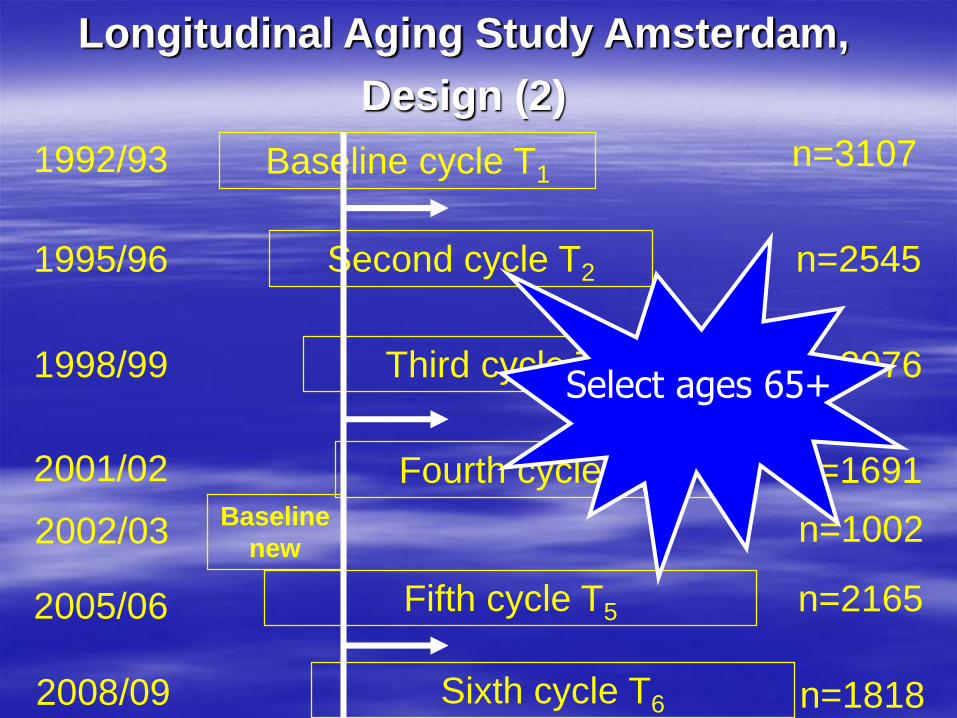
Baseline cycle T1
Second cycle T2
Third cycle T3
1992/93
1995/96
1998/99
n=3107
n=2545
n=2076
Fourth cycle T42001/02 n=1691
2002/03Baseline
newn=1002
Fifth cycle T5
n=1818
2005/06
Sixth cycle T62008/09
n=2165
Longitudinal Aging Study Amsterdam,
Design (2)
Select ages 65+
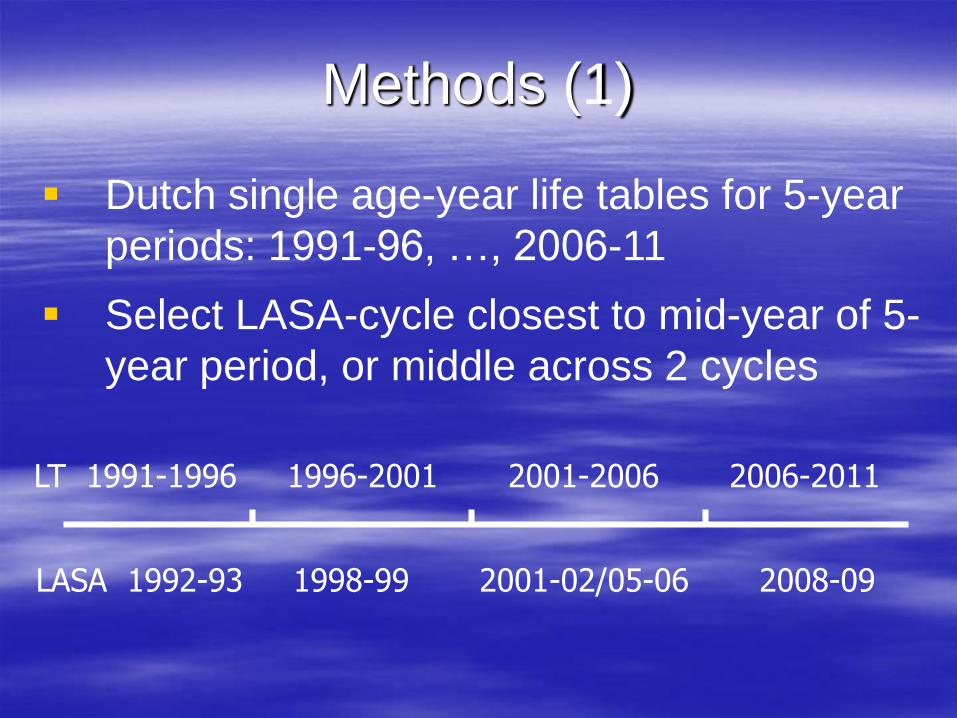
Dutch single age-year life tables for 5-year
periods: 1991-96, …, 2006-11
Select LASA-cycle closest to mid-year of 5-
year period, or middle across 2 cycles
Methods (1)
LT 1991-1996 1996-2001 2001-2006 2006-2011
LASA 1992-93 1998-99 2001-02/05-06 2008-09
Calculate age-sex-specific prevalences for
each cycle
Extrapolate prevalences for ages older than
observed up to age 100 for each cycle
Apply Sullivan method to calculate expected
years without mild health condition, and
expected years with severe condition
Methods (2)
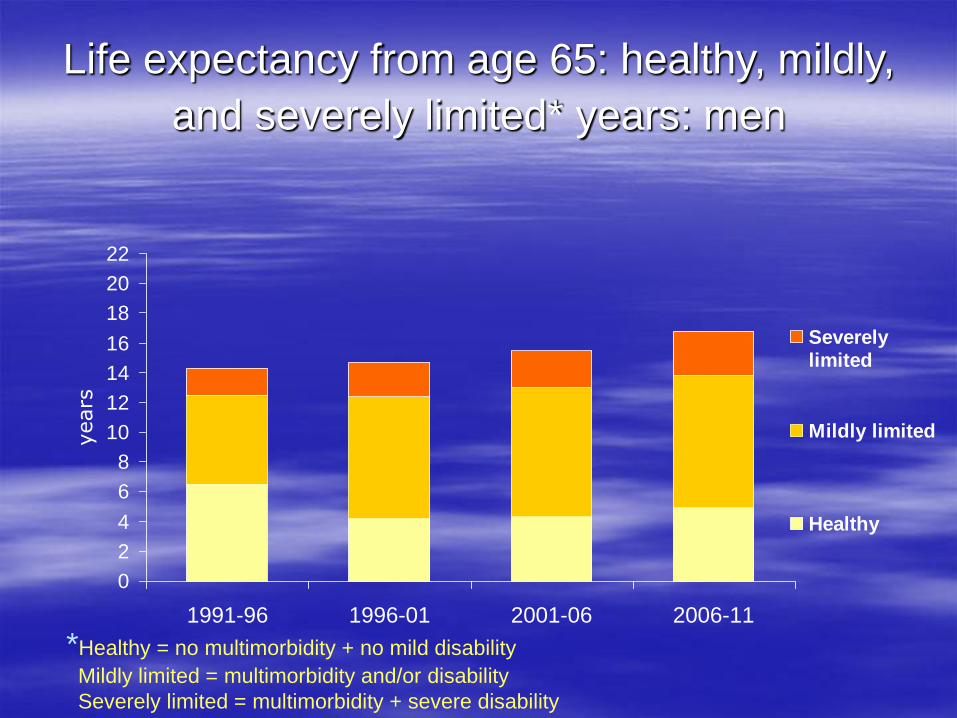
Life expectancy from age 65: healthy, mildly,
and severely limited* years: men
0
2
4
6
8
10
12
14
16
18
20
22
1991-96 1996-01 2001-06 2006-11
years
Severelylimited
Mildly limited
Healthy
*Healthy = no multimorbidity + no mild disability
Mildly limited = multimorbidity and/or disability
Severely limited = multimorbidity + severe disability
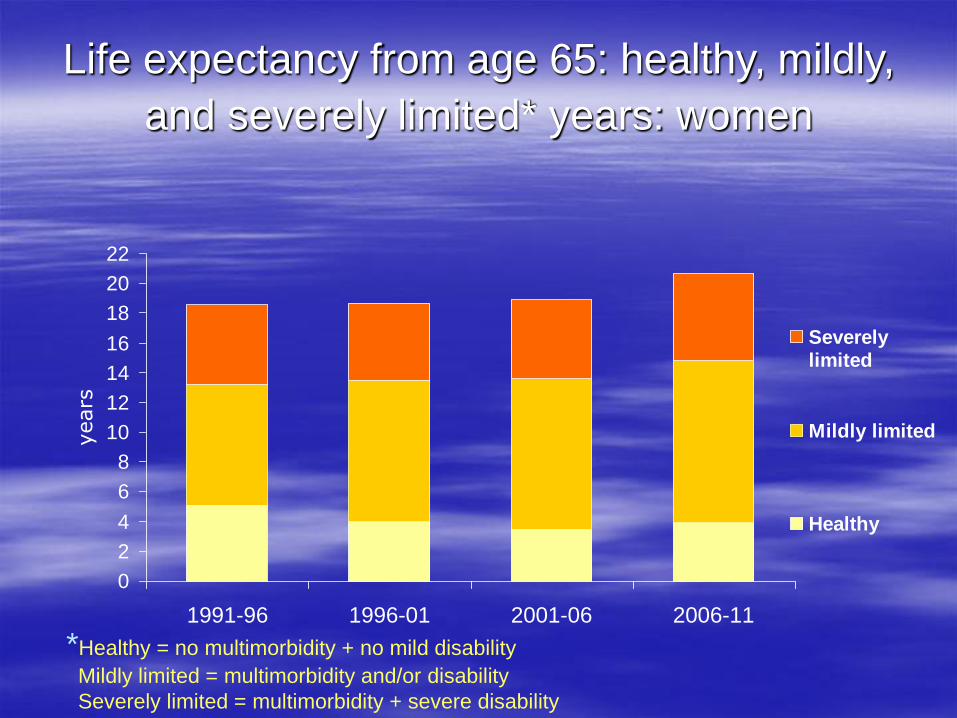
Life expectancy from age 65: healthy, mildly,
and severely limited* years: women
0
2
4
6
8
10
12
14
16
18
20
22
1991-96 1996-01 2001-06 2006-11
years
Severelylimited
Mildly limited
Healthy
*Healthy = no multimorbidity + no mild disability
Mildly limited = multimorbidity and/or disability
Severely limited = multimorbidity + severe disability
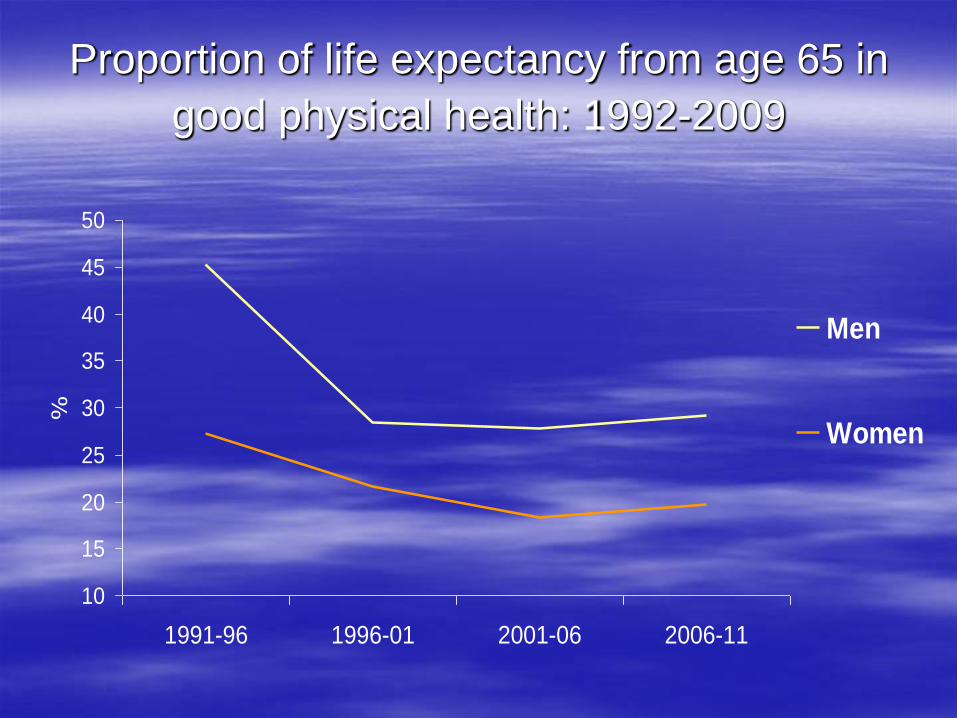
Proportion of life expectancy from age 65 in
good physical health: 1992-2009
10
15
20
25
30
35
40
45
50
1991-96 1996-01 2001-06 2006-11
%
Men
Women
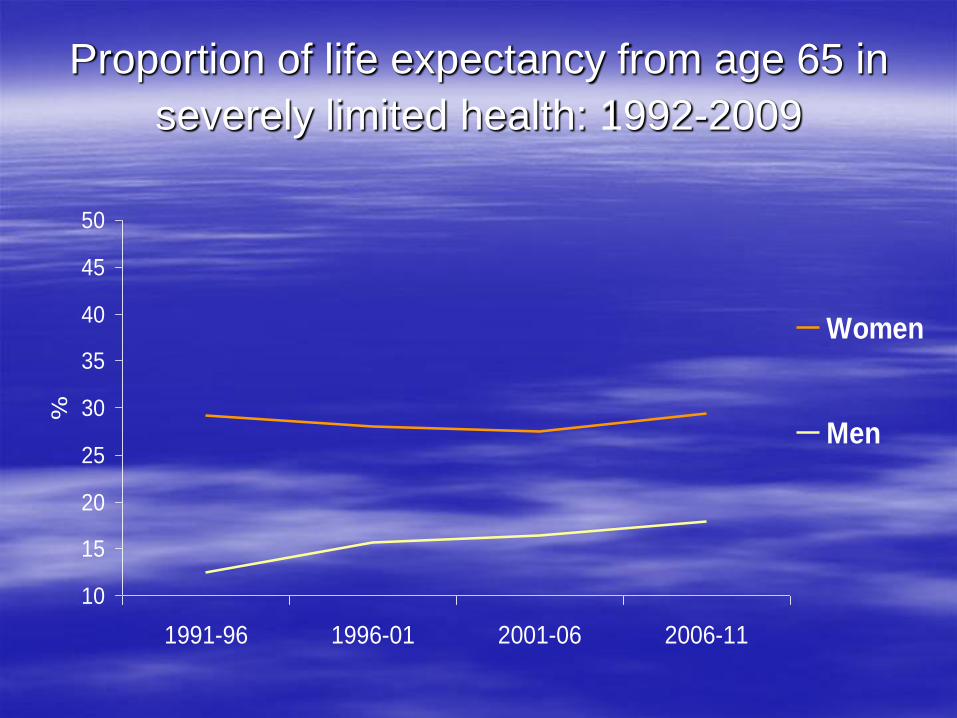
Proportion of life expectancy from age 65 in
severely limited health: 1992-2009
10
15
20
25
30
35
40
45
50
1991-96 1996-01 2001-06 2006-11
%
Women
Men

Life expectancy from age 65: years in good
cognitive health: men
0
2
4
6
8
10
12
14
16
18
20
22
1991-96 1996-01 2001-06 2006-11
years
Mildly
limited
Healthy
*Healthy = MMSE > 26
Mildly limited = MMSE <= 26
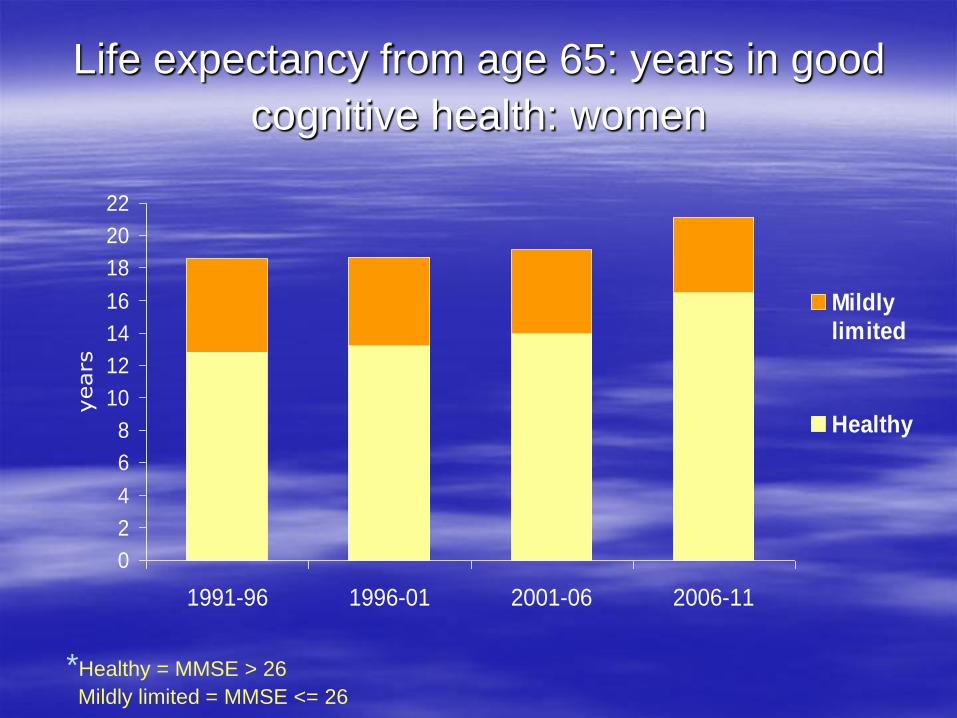
Life expectancy from age 65: years in good
cognitive health: women
0
2
4
6
8
10
12
14
16
18
20
22
1991-96 1996-01 2001-06 2006-11
years
Mildly
limited
Healthy
*Healthy = MMSE > 26
Mildly limited = MMSE <= 26
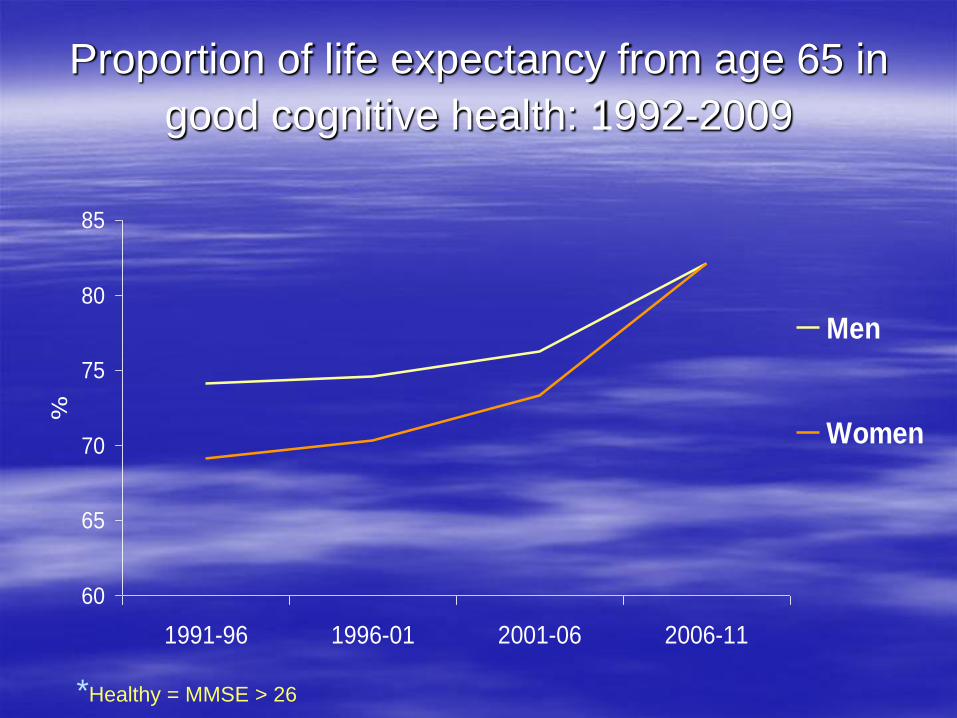
Proportion of life expectancy from age 65 in
good cognitive health: 1992-2009
60
65
70
75
80
85
1991-96 1996-01 2001-06 2006-11
%
Men
Women
*Healthy = MMSE > 26

Proportion of life expectancy from age 65 in
good cognitive health: 1992-2009
60
65
70
75
80
85
1991-96 1996-01 2001-06 2006-11
%
Men corr
Women corr
*Healthy = MMSE > 26, corrected for years of education
Physical health:
Years with at least mild limitations increased,
especially in the 1990s ‘expansion’
Years with severe limitations high in women,
increased in men
Cognitive health:
Years with mild limitations decreased, especially in
the 2000s ‘compression’
Even greater increase after correction for
education
Summary
Physical health:
Did the causes for accelerated increase in
LE in the 2000s also stop the expansion of
morbidity/disability? (Education, Health
care?)
Cognitive health:
Why did correction for education not flatten
the increase in healthy cognitive years?
Other causes for longer cognitive health?
Discussion