mind the map: a nordic take on the customer journey and experience
TRANSCRIPT

Mind the Map
U n c o v e r i n g t h e n o r d i c t a k e o n J o U r n e y M a p p i n g
NORDIC MORNING
INNOVATION AWARD
W I N N E R
2016RESEARCH

2
ContentsChapter 1: Journey and destination
Why Customer Journeys matter more than ever before? The all-in-one, end-to-end introduction to a model of journey mapping that can start a cultural change.
Chapter 2: Seven Nordic principles when mapping a journey
What are the Nordic principles that have guided us to make a new model of journey mapping?
Chapter 3: Fire and Ice
What is not a customer journey? What are the knitty-gritty details I need to know to convince management? How does it work in practice? How do you set up a project? How does it work in terms of data collection and research methods?
Chapter 4: Take a ride
The step-by-step for you to start on your own a pilot project for Customer Journey Mapping and get that wow effect over your management.
Chapter 5: Around the campfire
We are sharing selected takeaways from our projects. Tidbits and useful information that we have learned along our projects that can be useful and applicable to businesses, professionals and service providers.
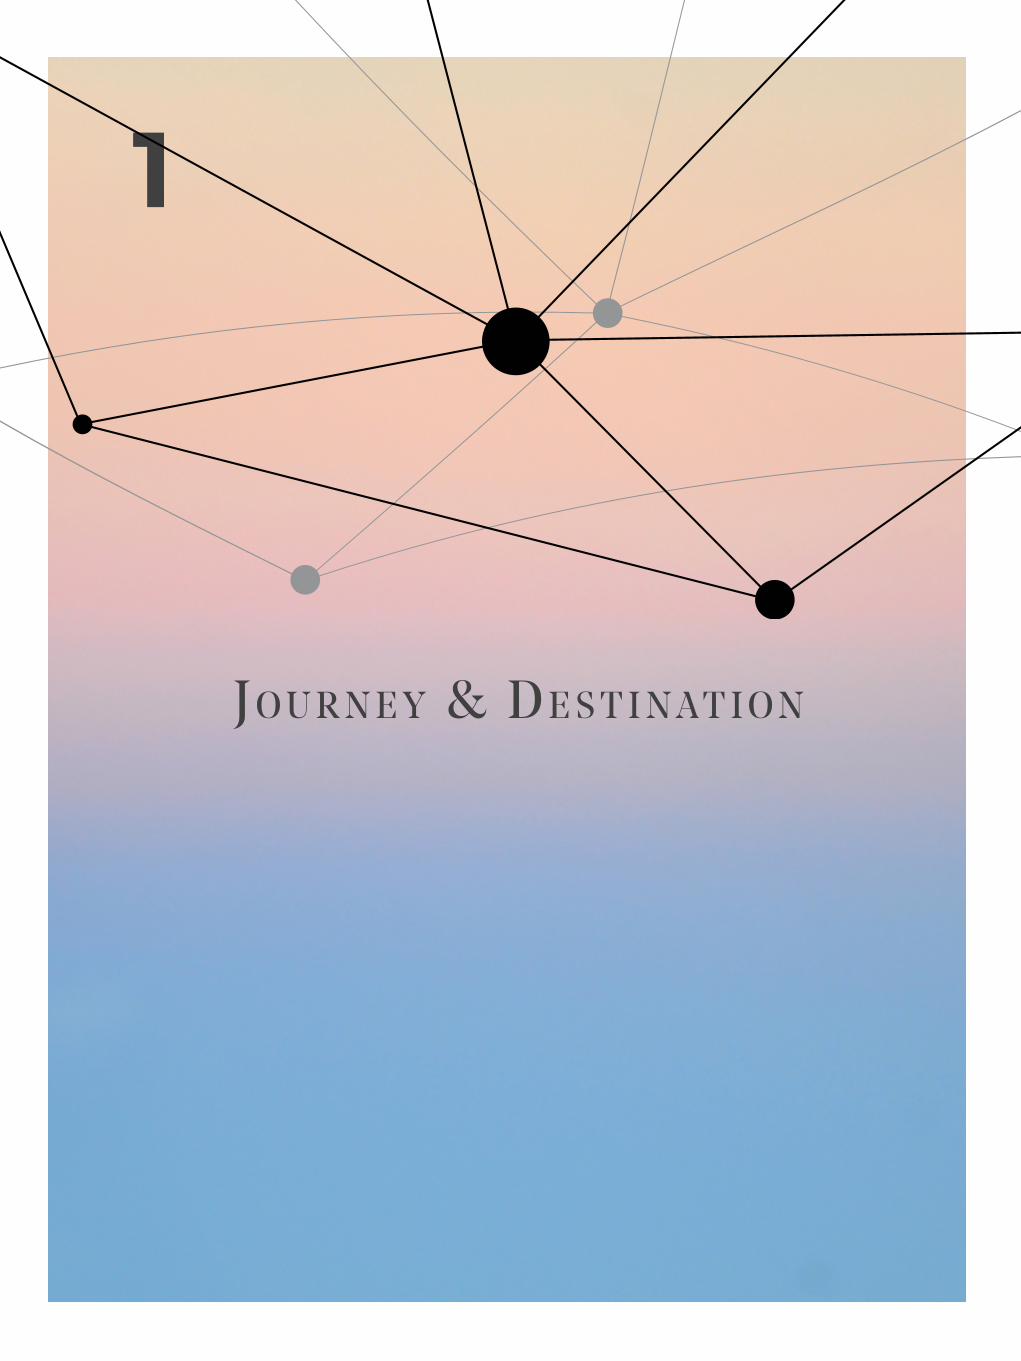
J o U r n e y & d e s t i n a t i o n
1

4
Why the customer journey became an essential tool for business
Journey mapping was much easier in two scenarios.
Firstly, the pre-“big data” time, where assumptions made around a table were the source of information, and would accomplish the map of a consumer’s journey.
Secondly, when mapping is restricted to analysts discussing conversion rates on a website or digital service.
Both approaches show problems: the first, based on assumption, were heavily subjected to confirmation bias and proximity bias. People would assume for all what they would do themselves,

5
and rule out a number of relevant scenarios.
The sceond, based on analytics, is extremely precise on measuring and tracking how consumers navigate and convert into sales on web services. However, they cannot tell why a customer dropped out of the service, nor what motivates their choices. That means they are not generally able to tell why things work, and trial and error play an extensive driving force in this scenario.
Journey mapping is a cultural change
Mapping a consumer journey, however, was seen / is often seen as a “painkiller”. Even in great framworks of design thinking, popular in the Nordics, journey mapping is often regarded as one of many items in a tool box to design solutions that can provide rapid effect.
Journey mapping in the context of business design, however, means something much bigger -- it is a shift from operative, task-oriented, silo culture companies to companies who are providing their entire activities around the consumer’s needs.
It is no coincidence that Forrester has boldly stated that “in 2016, leaders will execute multidiscipline CX strategies to change internal operations — and drive a larger wedge between themselves and those just executing CX tactics.”
Journey mapping is evolving rapidly. The buying journey must be simplified, widely tracked, deeply listened, absolutely personalised. Companies must track data and actively use it to improve it. Companies must prepare to have “things” enhancing human capability for the customer’s decision-making, and seamlessly connect the identified customer accross channels.
We are on the way to offer a Nordic approach to how it can be done, and sharing what we have found so far.
Useful resources
Christensen, Clayton M., Michael Raynor E., and Rory McDonald. “What Is Disruptive Innovation?” Harvard Business Review, 04 Apr. 2016.
Goodwin, Tom. “The Battle Is For The Customer Interface.” TechCrunch. 03 Mar. 2015.
“The 2016 Top 10 Critical Success Factors To Determine Who Wins And Who Fails In The Age Of The Customer.” Forrester. Oct. 2015.

6
Helping to uncover a Nordic take on consumer mapping research
Our take on the consumer journey map has evolved rapidly in the past years. We have been commited to create a “Nordic” approach to it. This can mean a number of things. We have been structuring the development with a certain commitment to innovation -- with the attitude, resources and risks that innovation entices. But also reaping the benefits from that.
Our journey mapping projects have always been focused in going right towards new challenges Keeping the focus is on creativity, paired with the help of technology and design principles. We also have prioritised the activation of local partners, and kept thinking bigger, across borders, even when that was not the easy way
out -- our journeys needed to be relevant even after they are implemented, even after the next quarter is done, even when technology changes and evolves. Those are all elements deeply connected to the Nordic business culture.
The development in our methods have been also been fostered by Nordic ideals of opennes of thinking, freedom of experimentation, constant evaluation and challenging of current and new models. Furthermore, we kept a dialog with the society, the market, the region and the global trends by connecting to people, research participants and international members of our group.
We won a group award in 2016, the Nordic Morning Innovation Award. We believe our product is a lasting one, an open one, and that can help our clients to get back in touch with their customers. Furthermore, when you map journeys you can see the details of the big picture -- that’s a value in itself, and much more when it’s in an actionable way.
A lot of what we have learned is published here -- there it goes another Nordic principle of transparency and openness. Enjoy the ride!

7
Against the blind spots
We mix ethnography, trained agents, qualitative and quantitative data to cover the blind spots that most methods leave out.
That means that as several methods are combined, they gradually strengthen the validity of the findings.
For example, we may recruit and train subjects for a qualitative research and collect quantitative data about their interaction with a service. We may ask how their contexts matter and find common denominators -- following the tendency to rely less on demographics and more on common behavior and meaningful moments accross the journey.
Furthermore, we are concerned in setting up your journey to receive and compute more and more data -- which later on can be analysed in a variety of ways. We will cover all those along the pages.

8
The maps
This is one model of the map. It shows the imaginary client Nordic Morning Coffee House, a service where you can order coffee online and pick it at a store without a cashier or money transactions.
As in the example, maps should be tailored for customer’s businesses, never from ready-mades or templates with the usual stuff (awareness, consideration, purchase, aftermath, for example).
We include in the map what customers are doing, thinking and feeling in the context of our customer’s business, and which moments are meaningful for the consumer.
Awareness ➜ Familiarity ➜ Appeal ➜ Consideration ➜ TRIGGERDECISION ➜
USING THEAPP ➜ At the shop ➜ CORE OFFER ➜ DIGITAL FOLLOW
UP ➜ Advocacy➜
DOINGABILITY/INABILITY
Can the user engage with the service in a
continuous way? Facebook ads
Spotify ads Sponsored podcast
Twitter ads
Can the user get to the shop?
Festival brochure Friends
recommendation
Users are aware and familiar with the service. Can they find what resonates in the service with their expectations?
Can the user understand the offer so that it considers
the service as a provider? Can the user place
their orders?
WHAT IS USEFUL/USABLE
Browse, look and feel Browsing categories Browsing products
Basket Pay
Track
Can the user find the shop?
Can the user locate their orders?
The coffee is ready. Can the user find a
place, sit comfortably and have it at the
store?
Dessert. Can the user place a second order? Can the user be categorised in a
profile and browse a suitable list of follow up
offers?
Digital receipt is sent. Can the user connect
with the store for further interaction?
Can the user invite friends to use the
service?
THINKINGCONFIDENCE/CONFUSION
“I din’t know they existed” “There they are again” “This must be a good
service”“Should I give it a
try?” “Let’s do this” “How can I order?” “Where do I get my order?” “Where’s my coffee?” “What now?” “What else do they
offer?”“I think they would like
this service”
FEELINGSENTIMENT
KEYS
Momentum scale
Unpleasant high energy
Pleasant high energy
Unpleasant Low energy
Pleasant low energy
Experience keys
Peak
Moments of truth
Pain points
Delight

9
Awareness ➜ Familiarity ➜ Appeal ➜ Consideration ➜ TRIGGERDECISION ➜
USING THEAPP ➜ At the shop ➜ CORE OFFER ➜ DIGITAL FOLLOW
UP ➜ Advocacy➜
DOINGABILITY/INABILITY
Can the user engage with the service in a
continuous way? Facebook ads
Spotify ads Sponsored podcast
Twitter ads
Can the user get to the shop?
Festival brochure Friends
recommendation
Users are aware and familiar with the service. Can they find what resonates in the service with their expectations?
Can the user understand the offer so that it considers
the service as a provider? Can the user place
their orders?
WHAT IS USEFUL/USABLE
Browse, look and feel Browsing categories Browsing products
Basket Pay
Track
Can the user find the shop?
Can the user locate their orders?
The coffee is ready. Can the user find a
place, sit comfortably and have it at the
store?
Dessert. Can the user place a second order? Can the user be categorised in a
profile and browse a suitable list of follow up
offers?
Digital receipt is sent. Can the user connect
with the store for further interaction?
Can the user invite friends to use the
service?
THINKINGCONFIDENCE/CONFUSION
“I din’t know they existed” “There they are again” “This must be a good
service”“Should I give it a
try?” “Let’s do this” “How can I order?” “Where do I get my order?” “Where’s my coffee?” “What now?” “What else do they
offer?”“I think they would like
this service”
FEELINGSENTIMENT
KEYS
Momentum scale
Unpleasant high energy
Pleasant high energy
Unpleasant Low energy
Pleasant low energy
Experience keys
Peak
Moments of truth
Pain points
Delight
The first page of the map is paired with a second section, Taking action. We were concerned when some of our clients were happy with the results, had their “aha” moments, but were not on the clear when it comes to act upon the discoveries from the research.
Taking actionAwareness ➜ Familiarity ➜ Appeal ➜ Consideration ➜ TRIGGER
DECISION ➜USING THE
APP ➜ At the shop ➜ CORE OFFER ➜ DIGITAL FOLLOW UP ➜ Advocacy➜
Wanted behaviourExpectations
Consumer should get to
know us
Users should be trustful towards
our promise
Users should be knowledgeable and understand
how we are useful
Users should perceive a
specific occasion
when we are useful
User needs are met
User places the order
Take order, mingle,
empathy towards crew
User is able to claim order and enjoy coffee
User takes further action
User invites friends
MomentumStrategic actions to be implemented
Curiosity, identification,
adventure
Deeper identification Persuasion Context Timing Shopping mode,
excitement Ambient experience, slow pace
Shopping mode,
excitement
Shopping mode,
excitement
RewardTactical actions to be implemented
1st timer reward, sense
of urgencyValue for price Higher
experienceBest among
category
Best viable option for occasion
Customership score up
Experience, extras
Interaction with the ambientNew offers / promo
Score-based offers
Score goes up when invites
convert
Expertise to be activated
SEO, SEM, Content
management
Content management Branding SEO, SEM,
Partners
SEO, SEMService
designers
Service designers
Interior designers,
Training
Taste specialists, baristas, quality control
Service designers
SEO, SEM, Marketing
automation
Further comments
Coffee industry for millennial tend to be related to energy, productivity and culture.
Decisions should be activated by other trigger behaviours according to location, free
schedule, closeness to store, shopping behaviour, search history.
Follow up offers should be based on Facebook friends, past purchase behaviour, check-ins
from Swarm and other app usage.
The environment will play a crucial role in loyalty and should represent contrast to other ambients, as well
as cultural and heritage values
Core delivery should be in strict line with brand promise and service, with rigid quality control
including waiting time, interaction script and active creation of meaningful moments.
Follow up should be individually
automated with relevant offer based on profile and past
behaviour.
The service should make users proud,
connect with identity, “brag on instagram” and reward in loyalty
membership

10
HELSINKI
Emotion
Restful Impacient Tired Relaxed / PEAK Comfortable Excited Relaxed Relaxed
Interview responsespatterns of words
“Hurry” “Looking for” “Looking for” “Sitting back” “Eager” “Confused”
Other relevant correlations
After 40 minutes within the Journey, the participant states “I feel confused”. It's likely that help would already be accepted at this point. A reminder could also be effective here.
Decision of seeking help at 60 min. within the Journey.
Decision of calling comes spontaneously, not planned (like Help section). Correlation with reward. “I’m confused” comes after 100 min.
Effectively completion comes in exact “100 Cal”, 130 min. later.
Control group research
Did you buy water last time you traveled?
Control group results
65% YES
Awareness Consideration Decision Online Homepage Ordering Ancillary AfterwardsMomentum Push for engagement Offer relief Push excitement Offer Reward Offer comfort Push excitement Push ancillary Offer reward
Essential reward strategy Attached to purchase Free sheltering good Kind greeting, surprise
special offer Stimuli to restaurant Stimuli accepted, bigger reward
Token, reward next purchase
Token accepted, fidelity bonus Token of exclusivity
Insights
At station Waiting Boarding Online Homepage Ordering Ancillary Afterwards
Triggered actions - - - Buy water Buy coffee Buy dinner - Buy 2nd beer
Essential keys
Essential Journey
Biometrics
EXPANDED CUSTOMER JOURNEY Focus service
Guiding questionsWhat is working and what is not in online restaurant services? How can the service experience be improved? How can extra business value be added? What unseen consumer needs exist during the experience? What correlations can be useful considering what was tracked, the level of consumer experience and business value?
Pursued insightsWhat are the pain points to manage? Where expectation must be managed, and how? When is the best time to present offerings? How to tackle newly identified consumer needs?
Momentum scale
Unpleasant high energy Pleasant high energy
Unpleasant Low energy Pleasant low energy
6pm 7pm 8pm 9pm 10pm 11pm 12am 1am 2am 3am 4am 5am 6am 7am 8am
Ability Confident Sentiment
The goal is to get a research-based picture of the business. It shifted from assumption: it’s cross validated and based on customer’s needs. Companies had insights about customer acquisition, but rarely they had information after that. We could give a detailed map of interactions, and provide
insight on customers’ needs at each stage of the process.
It gives a unified, shared vision of the big picture. And that was proven to be extremely valuable for whoever wanted to show that customer-centrism is the way to go.

11
Ability, confidence and sentiment are three pillars that can provide you with incredibly valuable insight.

12
s e v e n n o r d i c p r i n c i p l e s
w h e n J o U r n e y M a p p i n g
2

13
BIRCH Make it valuable.
The organisation essentials can be understood in one picture, and each responsible area understands their own and each other’s role — killing silo thinking and leaving no room for excuses.
1.
We have listed seven basic principles that can hint how the Customer Experience Map can benefit the actionable management of customer needs.

14
“VIHTA” Make it easy-to-use
It does not promote complex theoretical brainstorms, or by-the-book consultant reports. The process reflects what happens in practice, and gaps appear to be filled by actions.
2.

15
Cardamom Integrate it in culture.
The organisation starts learning by practice how to put the customer in the centre of the business.
At the same time, find the moments that require new winning strategies, kill bottlenecks and leap towards a substantially better experience.
3.

16
Snow Moments are more important than touchpoints.
Our research method trains agents to collect information about experiences according to contextually-aware emotional triggers. That’s the same principle that the Silicon Valley uses in their user experience developments, like Facebook or Google.
4.

17
Simplicity Look for the right questions, and the answers will follow.
Correlations for new questions. Looking into correlations should offer insights. The insights should raise verifiable questions — to be answered by control groups, customer existing data or prototypes.
5.

18
The compass An agile, integrated portrait of the big picture.
Customer Journey Mapping should be a spearhead for business and service design works. The Customer Journey Mapping is likely to be followed by Ottoboni’s Management Framework, that starts digital transformation within companies in a strategic, overarching level.
6.

19
Aurora Borealis Emotions are the real drivers.
An Experience is connected by emotions. The management of emotions is the management of expectations. These are the real drivers that deliver change in experience perception. Emotions can be measured, yes — but more importantly, emotions can be managed.
7.
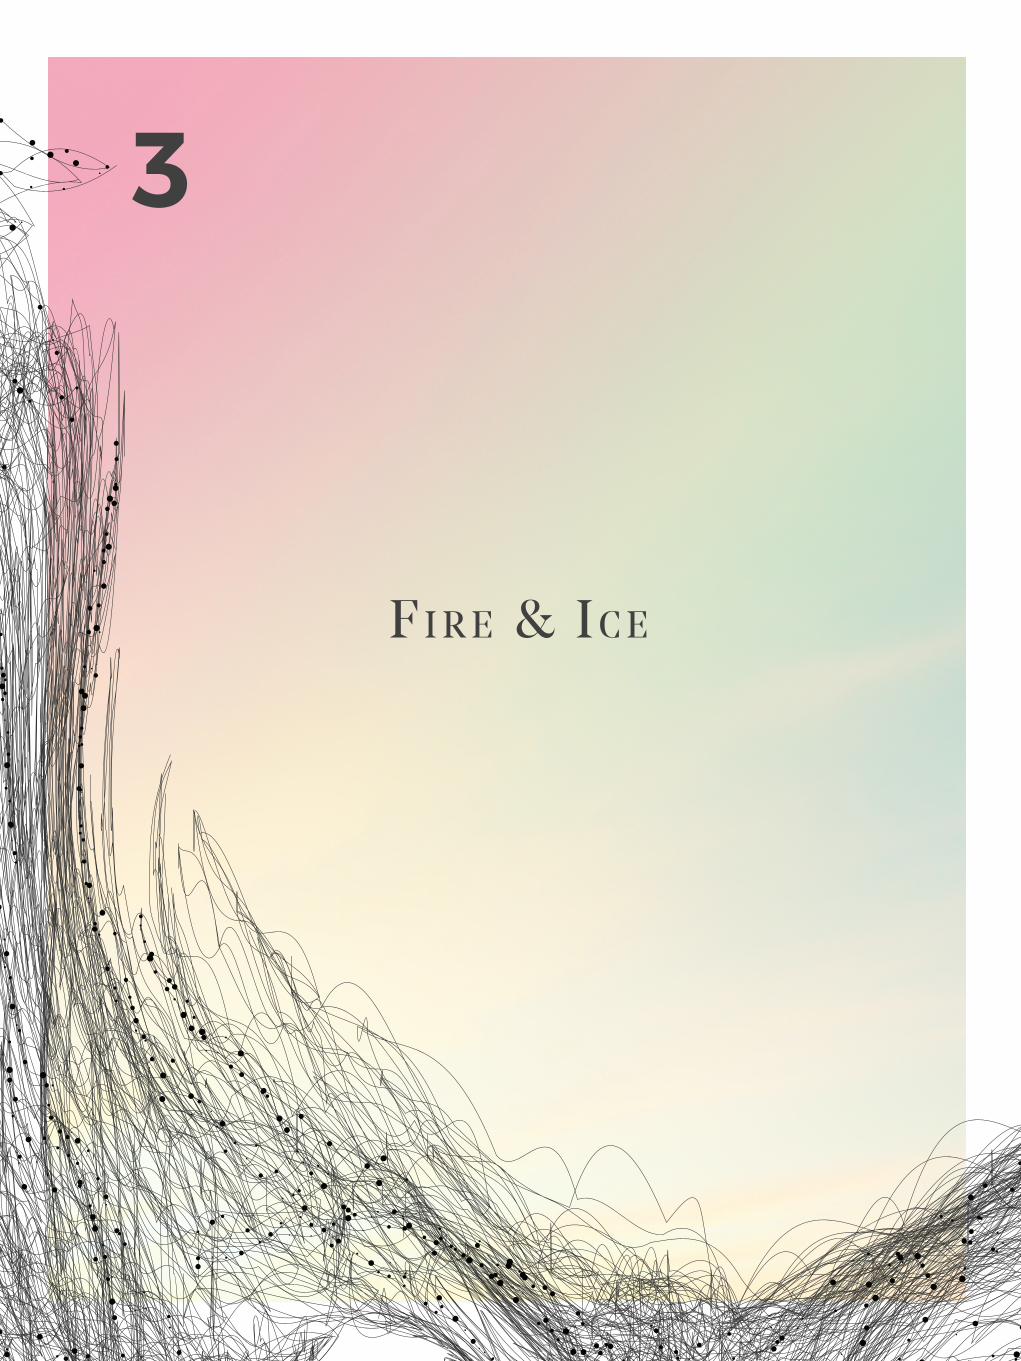
F i r e & i c e
3

21
There is a lot of things that
journey mapping research
is not.

22
It’s not a customer satisfaction survey.
It’s not an usability test.
It’s not focused on customer’s opinions.
It’s not an evaluation of the size of a market.
It’s not a qualitative study of edge cases.
It’s not a way to find statistics about your customer.
It’s not a listing of what you offer.
It’s not a service blueprint.
It’s not only a qualitative study.
It’s not an assumption of what your customer experience is. Nope.
So, what is it?
10 things that your customer journey map is not

23
It’s a field recognition task.And it’s a multi-strategy method research.
We are taking established practices from digital, design and business fields, and applying to recognise experiences.
24
The purpose is to understand what happens when someone uses your product or service -- which mounts up to a comprehensive big picture of all that happens throughout the interactions between company and consumer.
In here, experience is an asset that can be described and managed, like a store, a website or a production line.
A thorough, multi-dimensional, real-world, empirically-based field recognition.

25
Discovering the real-world journey
We make a filtered pre-selection of potentially relevant customer profiles.
We make qualitative interviews, deep-listening the context interplay between subjects and products.
We conduct unobtrusive, real-field experiences to design the journey map. Screen recording, camera on subject, stress sensors, observation, debriefing conversations.
At this point (only), we have the right questions — so that they can be investigated further with a high n of respondents.
We then generate informed, research-based insights to manage the Customer Experience Journey.

26
HELSINKI
Experiencing the journey Measuring the level of Ability, Confidence and Sentiment with numerous cross-validating methods (Electroencephalogram, Electrocardiogram, video, mood meters)
In order to get companies back in touch with customers, we have developed unique multi-strategy research methods to cover three main fields:
What is customer behaviour? What data covers: user behaviour and analytics tell what happens on the site
What is the motivation behind it? What data does not cover: customer sentiment response, general and contextual emotional behaviour
What is the total experience? Converting experience into a measurable and manageable asset, and maximising its possibilities.
Debriefing the experience Test users go through an especially designed set of debriefing interviews, where key terms are highlighted to better understand their perception
Cross-referencing All the data collected is laid out over a timeline, where cross referencing happens to identify the first fact-based insight opportunities.
Control group The control group helps us to investigate and validate quantitatively the value of each insight
Fact-based insights High-quality insights are extracted from crossing data from the map
1
2
3
4
5
Essential keys Experience Peaks Moments of truth Pain points Delightful details
Wolds of experienceHigh & Downs of experience
Momentum Detail on context and mood
Essential reward strategy Tells best actions to be taken according to context
Customer Experience multi-strategy research
Scope of the mapping experience is defined
Data collection method is chosen
Agents are trained
Data is collected
Data is processed
Hypothetical opportunities are created
Questions are sent to control groups
Control groups data is processed
Correlations are found between Agents
Control group Business goals
Maps are created
The final document is created, showing causes, effects and
opportunities between consumer behaviour, context, emotional
states and business goals.
----
Consumer-centric implementation and management begins
ModelingOur model is based on training a number of targeted subjects to undergo to the experience of services, perceive and report their own emotional variations and meaningful moments encountered, and cross-validated with quantitative methods. Control groups and data-trackers are placed so that the journey continues to evolve while projects are managed in order to transform it.
27
MoodMeter
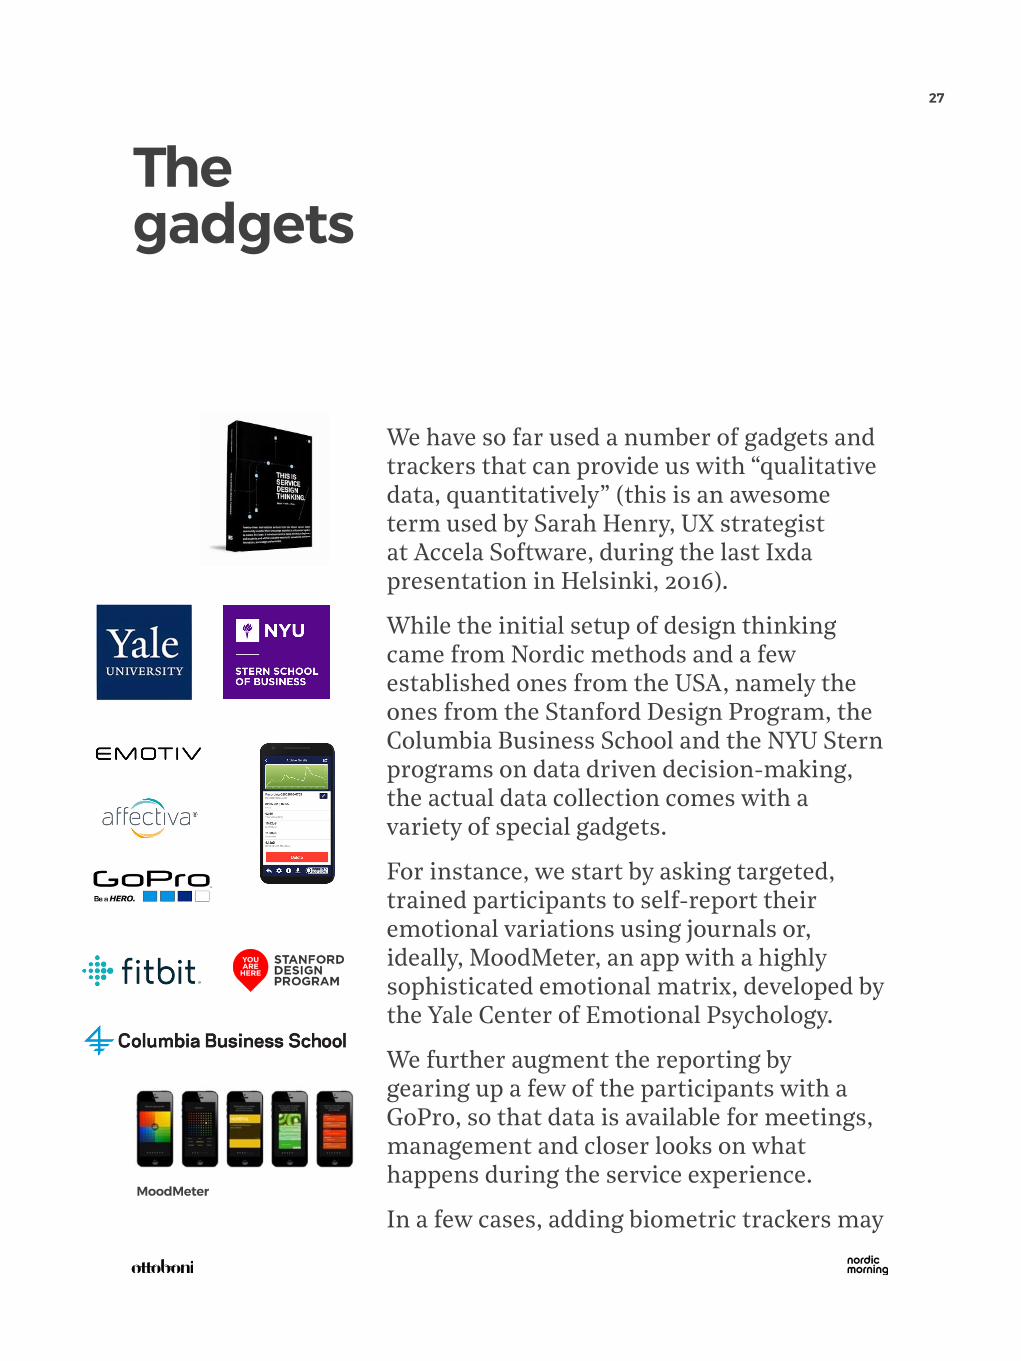
The gadgets
We have so far used a number of gadgets and trackers that can provide us with “qualitative data, quantitatively” (this is an awesome term used by Sarah Henry, UX strategist at Accela Software, during the last Ixda presentation in Helsinki, 2016).
While the initial setup of design thinking came from Nordic methods and a few established ones from the USA, namely the ones from the Stanford Design Program, the Columbia Business School and the NYU Stern programs on data driven decision-making, the actual data collection comes with a variety of special gadgets.
For instance, we start by asking targeted, trained participants to self-report their emotional variations using journals or, ideally, MoodMeter, an app with a highly sophisticated emotional matrix, developed by the Yale Center of Emotional Psychology.
We further augment the reporting by gearing up a few of the participants with a GoPro, so that data is available for meetings, management and closer looks on what happens during the service experience.
In a few cases, adding biometric trackers may

28
be of help. We can know, for instance, how much energy is burned accross the experience of a service -- and know what food or drink offers may be of use, and at what point.
Furthermore, with online experiences, for instance, we are able to measure the Galvanic Skin Reaction with Mindfield© trackers, from Germany, and draw conclusions on mental effort, stress levels and other information. If not to be considered as “evidence” alone, skin sensors (as well as, say, electroencephalograms, which can be used by Emotiv© technologies, for instance) are valuable when combining with other evidence of and indicators of use and experience quality.
We are even able to further cross-validate those with a number of services that contain databases of facial expressions, such as Affectiva©, from the MIT, with whom we have been in contact for a few time already.
When consider the current state of data collection, we are proud to state that our way of combining qualitative, quantitative, and “qualitative data, quantitatively” is quite advanced.
From up: Affectiva algorithm of emotion recognition, Mindfields eSense galvanic skin reaction, Emotiv EEG sensor and Fitbit.

29
The reports
The final document is a map that companies can rely to work across the organization.
It is a comprehensive document, somewhere between 25 to 85 pages, depending on the complexity of the case, where anyone within the organisation can understand everything necessary to work with the customer journeys in the business.
The last part of the Customer Journey Mapping is the DAY 1 of the Customer Experience
Management Framework — a way of aligning in practice the organisation with the customer-centric approach. Projects get in line, capabilities in place, KPIs are established and the transformation can really begin.
With the data trackers in place, the customer journey is ready to grow -- in accuracy, reliability and impact. The graphic shows how the customer journey starts from assumptions, gets more accurate with the empirical field recognition, and grows in accuracy as data is tracked from the journey’s moments (touchpoints).
30
The n question
One of our differentials is the ability to make customer journeys with a variety of subject numbers (“n”).
We can derive statistics from thousands of datapoints, even millions, when evaluating journeys through websites with consolidated uses.
When it comes to brick-and-mortar, B2B or complex services, other methods can be applied. We have developed ways to provide extremely insightful outcomes with less resources, and very fast deployment.
That is because when seeing the field recognition as a variation of usability testings, the results start to repeat quickly, and a low number of participants start outputing usable insights early.
Advanced content

31
N (1-(1- L ) n )Where N is the total number of problems and L is the proportion of problems discovered while testing a single user.
The typical value of L is 31%, averaged across a large number of projects we studied. Plotting the curve for L =31% gives the following result:
% of
expe
rienc
e pr
oble
ms f
ound
Number of subjects

32
This model has been applied since 1993, reinforced in the year 2000 for digital and business experiences.
It has been challenged several times, and most researchers agree upon the use of the low n for easily discoverable UX issues. Recent articles restate the economy of resources of a low n for applications such as the ones in Experience Mapping.
As a field recognition process, we aim at finding the physical and emotional common denominators to the presented experiences.
The subjects are pre-filtered, having interest with the product, familiarity with its usage, minimum literacy with digital usage, enough similar cultural backgrounds and so on.
Subjects are then trained to learn how to see and use the product or service, and to understand how they can best respond to the research.
Digital thinking, business practice.

33
“We have thousands of customers.” In experience testing, we focus on functionality-towards-customers, not on personal feedback-from-a-customer. The feedback matrix is pretty simple, yet sophisticated: Ability, Confidence and Sentiment are simple-yet-rich insight generators.
“Our business has hundreds of features.” This is an argument for running several different tests — each focusing on a smaller set of features — not for having more users in each test. You can't ask any individual to test more than a handful of tasks before the poor user is tired out. Yes, you'll need more users overall for a feature-rich business, but you need to spread these users across many studies, each focusing on a subset of your research agenda.
When it sounds you need more research subjects— but you actually don’t

34
"We have several different target profiles.” This argument holds only if the different users are actually going to behave in completely different ways. For example, if you target athletes and coaches, teachers and students, you may need different testing sessions.
“ We want to be very thorough” If money is not at all the problem, there is no harm in extensively testing. But as research has shown, functionality and experience is shown right upfront.Resource“Usability & UX Articles from Nielsen Norman Group.” Nielsen Norman Group.
When it sounds you need more research subjects— but you actually don’t

35
If you want statistics, not insights. Get statistically significant numbers; tight confidence intervals require even more users.
To organise complex information.And when you want to ask how customers can organise it themselves.
When discoverability is a problem. If the experience is highly complex and demand several hours of testing per user (say, all financial services of a bank), more users are likely to find out more issues.
Eyetracking. At least 39 customers if you want stable heatmaps.
Defining what you want to fix in your journey. It might not be worth the effort to improve an experience that users don’t care about; better to spend the effort recoding something with that most will notice.NNGroup, June 4, 2012. https://www.nngroup.com/articles/
And when to use more user data and quantitative methods?

36
Some of the ways Bryman sees how multi-strategy research can be used:
Qualitative research facilitates quantitative research: qualitative research can be used to generate quantitative studies.
Quantitative research facilitates qualitative research: quantitative research may tell how many or how often, and the qualitative research may seek to answer why.
Researchers’ and participants’ perspectives: qualitative data may give a view to the perspectives of the people, while the quantitative information may tell researcher what they are trying to find
Qualitative research facilitating the interpretations of the relationship between the variables: i.e. quantitative research may identify patterns, while qualitative research can offer to explain the patterns
Studying different aspects of a phenomenon. i.e. quantitative methods might help one research what people thought of religion and qualitative research might research how religious beliefs and rituals affected behaviour.Resource“Uses of Multi-strategy Research.” Introduction to Research. University of Surrey.
Uses of multi-strategy research

Five users can be enough – if problems are somewhat easy to discoverProblem discoverability (here, p) is the likelihood that at least one participant will encounter the problem during testing. Nielsen and Landauer (1993; see also Nielsen, 2012) found on average p=0.31 for the set of projects studied. Based on that, 5 users would be expected to find 85% of the problems available for discovery in that test iteration.
Similarly, Virzi (1992) created a model based on other usability projects, finding p between 0.32 and 0.42. Therefore, 80% of the problems in a test could be detected with 4 or 5 participants.
And so a UX guideline was born. For the best return on investment, test with 5 users, find the majority of problems, fix them, and retest. For wider coverage, vary the types of users and the tasks tested in subsequent iterations.
Resourcehttp://www.humanfactors.com/newsletters/ how_many_test_participants.asp

38
International Encyclopaedia of Ergonomics and Human Factors, Second Edition
http://libweb.surrey.ac.uk/library/skills/Introduction%20to%20Research%20and%20Managing%20Informa-tion%20Leicester/page_30.htm
Jeff Sauro, James Lewis. Quantifying the User Experience: Practical Statistics for User ResearchM
https://www.nngroup.com/articles/why-you-only-need-to-test-with-5-users/
http://www.humanfactors.com/newsletters/how_many_test_participants.asp
http://www.simplifyinginterfaces.com/wp-content/up-loads/2008/07/
http://usabilityetc.com/2011/06/alan-dix-usability-test-ing-five-users/faulkner_brmic_vol35.pdf
http://www.measuringu.com/five-users.php
https://uxfactor.wordpress.com/2012/11/12/five-users-will-find-85-of-the-usability-problems-wrong/
More resources

t a k e a r i d e
3

40
Check facts, processes and gather the information you need to leap from theory to practice
The first thing you want to do to get your experience journey mapped is to scope what you are going to map.
Some fields are especially complicated. Say, for instance, you work in the financial sector. We have even developed a special product for this type of customer -- we called those services of high complexity. It has little to do with the complexity itself, but with how it is perceived by the customer. You know what you will go through when ordering coffee, but many people don’t have a clue of what to expect when signing up for insurance.
Choose one specific product or service, and write down the steps that take in theory for it to be delivered.
Depending on your expertise, you will have something between a service blueprint or a list of touchpoints that your customer goes through to use your service or consume your product.
Getting started

41
Rewrite your notes, using them for reference, but writing like a journal or report from a customer
This is where most consultants drop the ball. They end up commiting a series of mistakes that the traditional mental models of marketing consultants did not account for.
For instance, the proximity bias (being too close to the project to see different points of view), the confirmation bias (looking only into things they already thought to be true), bias from liking (choosing what they like over what others like) and so on. These bias and interferences are still potential threats to research, but they are much more overtly present when working only with assumptions.
That was the crucial problem, and the main different from research-based journeys and assumption-based journeys. While mapping journeys by assumption rendered a technical list of touchpoints, empirical research can give you insights you would definitely not account for.
Thus you need to start writing it down from the perspective of a day in your customer’s life. In the first time, you may leave out the pre-awareness and consideration phases, and concentrate on the moments your customer may first need your product or service.
Shift the perspective

42
Get someone to use it, someone who’s not so familiar and who won’t be entirely biased. Tell them to pay attention to what they feel along a few steps
When you have your basic idea of what will happen, which places your customer will stop by, which procedures your customer will go through, get someone to actually use it. At this point, in order to get things going, you can do it yourself.
But the important thing is not to map touchpoints or run a “customer satisfaction” to evaluate if the team is sharp or if the delivery is fast.
The crucial thing is to look into what changes your mood along the experience. You can focus on the moments that your mood shifts, and mention what was influencing the changes at each place and time.
In that way, you will have a list of influencing factors, such as your schedule, the weather, the surroundings of your shop, the place to park, the length of the line and so on.
Through the grapevine

43
They will quickly start to fix your service. Forget that. It’s not a customer satisfaction. Rely on your documentation
Later on, you should discuss what was written down with the subject, or then debrief your own notes.
Avoid start fixing small things at the time you do that, such as “we need more cashiers, the line was long”. That’s not accurate nor the level of strategic thinking you want to develop for the project.
Instead, stay focused on the emotional shifts and the needs of the customer in each step of the journey. Start asking how your service or product may affect the customer’s day and their needs, even if they don’t seem entirely related to your business at this point.
Rationally you are able to recall and write down what you were thinking, doing and feeling at each point.
What you were doing reflects each of the touchpoints. What you were thinking reflects your focus of interest and the decision-making process. What you were feeling concerns the level of general satisfaction to that experience -- within and outside your business boundaries.
Filter the attention

44
Work with a matrix of keys and values to understand what matters for the customer along the journey
You can start by assigning what was the experience peak, that is, the most remarkable moment during your experience.
Identity the moments of truth: the moments that trigger strong and long-lasting impressions customres will retain from their experience.
Then, establish which are the delightful moments, that is, moments where the experience was significantly higher than the expectations.
Add also the pain points: where was the customer significantly frustrated?
Lastly, spot which points could hold opportunities to influence perception or open new sources of revenue.
Add the journey keys

45
The second part of journey mapping is planning your action
Once you understand the influencing keys and what you were doing, thinking and feeling at each point, you may write down what is the expected behavior at each of these steps.
Each emotional state will give you an idea of what kind of “momentum” you have. Is it time to offer something new? Is it time to ask if everything is going smoothly? Is it time to upsell?
While momentum is a strategic and abstract approach, rewards are tactical and concrete. Both, however, are essential to master.
With a momentum of good high energy (like excitement), the reward may be “more of what you’re getting”. With a momentum of bad high energy (like frustration), the reward can be an alternative product instead.
Planning the action

46
How should the experience be managed: changing assets or influencing expectations?
You will then need more data to evaluate business feasibility to each -- how can you track data at that given moment of the journey? What customer data would be useful to understand the impact of this moment into the business? That’s when projects start to need real structuring, and the customer journey comes alive.
A common temptation is to “fix all problems”. That’s not so simple, because consumers will always say they “more for less”.
Compare, contrast, evaluate

47
You have a map, but what now? Usually what needs to be evaluated at this point is:
a) Is this key (i.e., moment of truth, delight, pain point) significant in the business level?
b) Should we focus in changing the asset (product, service) or the expectation (promotion, promise)?
c) What teams need to be activated and what expertise can help me in this?
d) What KPIs will make these changes relevant to the business?
At this point, you are way ahead the scope of the customer journey, fostering a customer-centric culture and actually becoming an agent of change.
Things don’t happen on paper
5
a r o U n d t h e c a M p F i r e : s o M e o F o U r F i n d i n g s

49
Experience is an asset — and entity, which is manageable and can be tweaked, moulded and modified according to each customer.
Assets like “an experience” are by nature abstract, but should be treated as objectively as possible. In a lean-agile environment, they are constantly shifting, in a networked chain of elements happening along time.
That means that the experience is highly manegeable, malleable, and may go unstable with the slightest malfunction.
Having this in mind is an essential view, as important as the notion that the experience orbits the customer, not your product.
Those are cultural approaches that should be kept in mind in order to successfully deploy the ideas that you, your team or your management have in mind.
Your main asset is the experience

50
While everyone knows that customisation is the new bar, we have noticed that customisation is currently more relevant than detailed demographics. After digitisation and data trackers are in place, demographics will be seamlessly created by customer big data.
Personalisation comes after digitalisation

51
Experiences happen in tension & relief cycles. For example, boarding the train is an important moment of truth because there are several tensions involved until boarding (weather, time, luggage, coordination). On a digital scale, it is the confirmation of the purchase that releases the building tension.
Capitalising these moments is a way of reinforcing relief and closure, such as indications of welcoming, readiness, preparedness, new start, beginning.
Tension/relief cycles

52
The experiences shown that when on longer in-person buying journeys, consumers tend to have a cycle of openness (to services, offers, novelty) followed by closed cycles (work, conversation, phone usage, hunger, thirst, physiological needs).
Coordinate offerings at ease in the beginning and estimated breaks, according to stops and destinations. In multiple stops, notifications and alerts can customise suggested breaks.
Spirals of behaviour

53
Certain sequences of emotions tend to “snap” to each other, creating positive or negative fields that are hard to break — the “no matter what you do” moments.
It’s important to anticipate known pain points and manage the expectations right before and after them, so that they don’t “snap” to more pain points.
Emotional fields

54
Context and surroundings, as well as other agents non-related to the service provider, directly make a direct influence on the service provider’s perceived experience.
These variables should be accounted in the overall experience delivered, and taken in consideration as possible scenarios of experience. Seasons changing, weather changes and even the political zeitgeist are elements that should be actively embraced by experience management.
The matter of context

55
Assets may change in value perception along the journey. If a customer is nervously waiting at the bank for a long time before being served, a cold cup of coffee may significantly affect the experience perception in combination with the also negative experience of the long wait.
Conversely, a not-so-warm coffee right before a great deal of a lifetime closed is exactly meaningless.
In practice, when a research participant says “the coffee was a bit cold”, the main takeaway is not “let’s offer hotter coffee”, but “at that point of the journey, it mattered”, and look for understanding why it matters.
The “hot coffee” rule

56
Our research method trains agents to collect information about experiences according to contextually-aware emotional triggers. That’s because, as useful as it is to know where your touchpoints exist, it’s important to understand how customers are feeling when they reach those touchpoints, and how you can affect their emotional states.
That’s the same principle that the Silicon Valley uses in their user experience developments, like Facebook or Google’s concept of micromoments.
Idle time is a growingly scarce asset. In the USA, people check their phone about 46 times a day. When customers are idle when waiting for service, it’s usually important to consider how to keep them informed, entertained or interested -- even before they pick their phones.
Resources Eadicicco, Lisa. “Americans Check Their Phones 8 Billion Times a Day.” Time, 15 Dec. 2015.
Meaningful moments and idle time: valuables

57
It’s often overlooked the fact that customers claim your offer in very advanced stages of interaction.
Think of an airline -- first you consider traveling, you browse for alterantives, you are exposed to the brand, you browse their site, make the reservation, book the tickets, go to the airport... and the core offer of the airline -- air travelling -- is only claimed after the customer lands in their destination.
This moment -- the moment of the core offer being claimed -- is an emotionally charged one. The interaction has come to a closure, and there is a sense of accomplishment shared between service provider and customer.
The client is recollecting the journey in several ways, finalising proceedings, preparing for their next action. It is important the service providers can act accordingly towards these emotional states and anticipate what customers will do next, in order to support them in their next needs as well -- by providing information, forging partnerships or even expanding your own offer.
Wrapping-up is an emotionally-charged moment

58
Moments of very low expectation can create delight when they are charged with high delivery.
Delight details result in stronger effects than their initial investment would suggest, with relatively low investment.
In one case, we have noticed that delight was created when an attendant gave special attential to a child. Our suggestion was that a new policy should be introduced: children under a certain age would always get special attention.
In that way, impact from delight was not created only by the action itself, but in the perception of other customers towards the special care and attention given to more vulnerable passengers.
“Delightful details”: balancing high & low

59
It’s not always necessary to change the offer or the assets — expectations can be effectively managed to correct the pain points and reinforce delight even when facing negative experiences.
For instance, when the internet does not work in a cafe, users may understand that “it happens”. They don’t expect perfect wifi, but they do expect free wifi.
We have noticed in a number of cases that customers can be quite forgiving, as long as they are informed and are not taken by surprise. In a nutshell, expectations should be kept strictly on track -- when they cannot be managed, asset management may have to be taken into the mix.
Manage the expectation, not the assets

60
Do you know Dinko? For more information about Ottoboni you can contact Dinko for a visit, a meeting or a good-old football match.
Dinko KortzanovClient Service Director+358 40 579 0690
Pssst!
We are gathering people interested in joining discussions around the consumer journey.
Trendwatching, co-creation and free, actionable sessions.
If you are part of a company, we can even set up a workshop to inform you -- most likely free of charge.
You can also visit us anytime. Write us and we will invite you to our lab!

61
OttoboniResearch & Insight
Sérgio TavaresSenior Researcher, phD. candidate
+358 40 4878989
Laura AndströmResearch & Insight Director
+358 50 5810797
Teemu TakalaBusiness Strategy Advisor / CEO
+358 40 8085819
Ottoboni Finland OyVilhonvuorenkatu 12
5th Floor00500 Helsinki