mine 2014 realigning expectations - pwc - james lusby - final.pdftimes roll 2005 enter the dragon...
TRANSCRIPT

Mine 2014Realigning expectations
June 2014
Strictly Privateand Confidential PICTURE TO BE ADDED

PwC • June 2014Mine 2014 • Realigning expectations
What is Mine?
• Analysis of the 40 largest listed mining companies by market capitalisation
• Sourced from the latest publicly available information
• No adjustments to reflect different reporting requirements or year-ends(report covers reporting periods from 1 April 2012 to 31 December 2013)
• Includes diversified companies (eg Glencore trading and BHP Billitonpetroleum, except where noted)
• Entities that are controlled by others in the Top 40 and consolidated intotheir results have been excluded, even when minority stakes are listed
2

PwC • June 2014Mine 2014 • Realigning expectations
11 years of Mine
3
2014Realigning
expectations
2013A confidence
crisis
2012The growingdisconnect
2011The game
has changed
2010Back to the
boom?
2009When the going
gets tough...
2008As good
as it gets?
2007Riding
the wave
2006Let the good
times roll
2005Enter theDragon
2004Mine

PwC • June 2014Mine 2014 • Realigning expectations
Contents
1Realigning
expectations –lifting off
the bottom
2A look at
2013’sTop 40
3It’s always
darkest beforethe dawn…
4Gearedfor thefuture
5Strategiesto beat thedownturn
6Outlook

PwC • June 2014Mine 2014 • Realigning expectations
Realigningexpectations –lifting off thebottom

PwC • June 2014Mine 2014 • Realigning expectations
Realigning expectations –lifting off the bottom
2013 was a year that forced miners to realign expectations…
… the Top 40 bit the bullet, booking impairments of $57 billion in 2013
… this drove aggregate net profits of the Top 40 to their deepest depths in a decade at $20 billion
… and market capitalisation of the Top 40 fell by $280 billion, or 23%
… net debt is up 42%
… but dividends paid continued to increase
… capital velocity has flattened, showing the change in priorities and tightening of belts
6
1 2 3 4 5 6

PwC • June 2014Mine 2014 • Realigning expectations
Realigning expectations –lifting off the bottom
All of this in response to one of the most difficult operatingenvironments for years …
… new CEOs installed in nearly half of the Top 40 over the last two years
… commodity prices are down
… increased demand from shareholders to focus on core operations and increase returns
… cost reduction initiatives taking time to implement
… focus on delivering disciplined capital allocation
… licence to operate becoming increasingly difficult, particularly in emerging economies
… more emerging markets companies in the Top 40
The mining industry spent 2013 realigning stakeholder expectationsand 2014 will see if the renewed strategies of miners can successfully
lift the industry off the bottom by delivering sustainable growth…
7
1 2 3 4 5 6
1 2 3 4 5 6
PwC • June 2014Mine 2014 • Realigning expectations
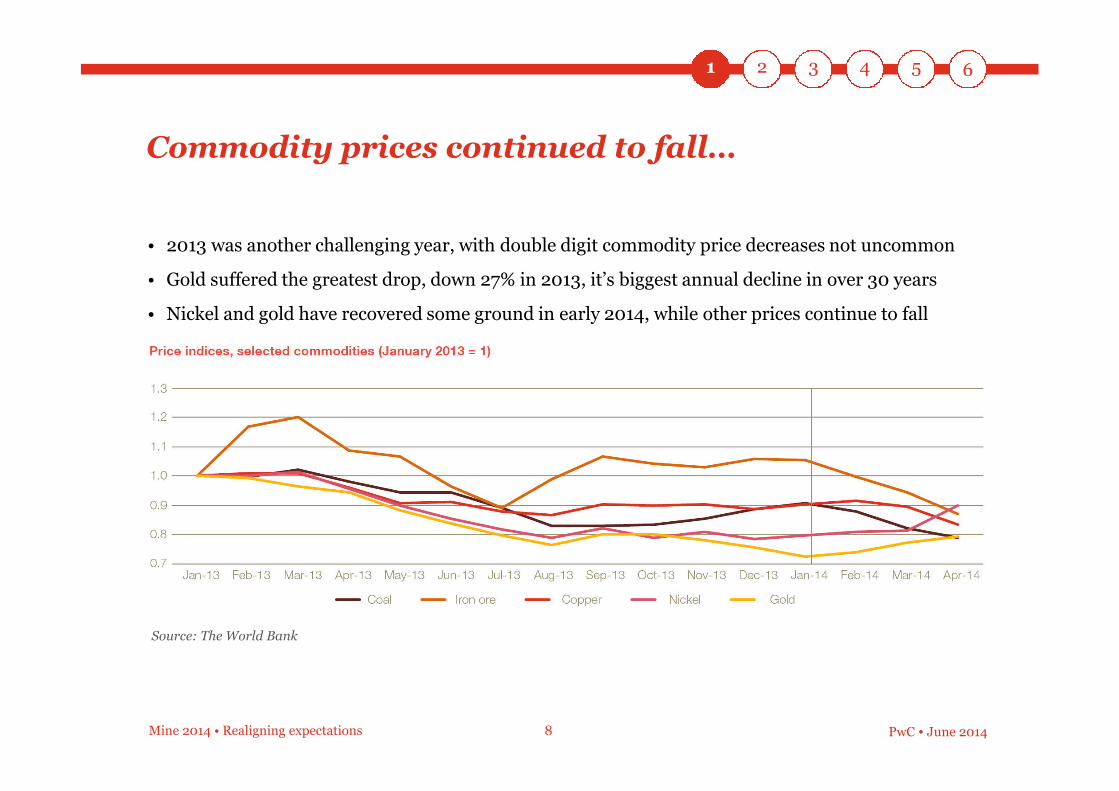
Commodity prices continued to fall…
• 2013 was another challenging year, with double digit commodity price decreases not uncommon
• Gold suffered the greatest drop, down 27% in 2013, it’s biggest annual decline in over 30 years
• Nickel and gold have recovered some ground in early 2014, while other prices continue to fall
8
1
Source: The World Bank

1 2 3 4 5 6
PwC • June 2014Mine 2014 • Realigning expectations
…driving down mining stocks in 2013
• The performance of mining stocks was lacklustre in 2013, down 23%
• In contrast, the Dow Jones and FTSE-100 rose by 27% and 15%, respectively in 2013, largely dueto the Fed’s tapering of QE measures and renewed optimism towards the US economy
9
1
15%
27%
(23)%
Source: Bloomberg

PwC • June 2014Mine 2014 • Realigning expectations
A look at 2013’sTop 40

1 2 3 4 5 6
PwC • June 2014Mine 2014 • Realigning expectations
A gloomy year for market capitalisation
• 2013 year-end marketcapitalisation for theTop 40 closed atroughly $958 billion,a drop of 23% from$1,238 billion at theend of 2012
• Gold miners werehardest hit, with thesegment losing $110billion off its marketcapitalisation in 2013,representing 40% ofthe year’s decrease
11
2
Source: PwC analysis

1 2 3 4 5 6
PwC • June 2014Mine 2014 • Realigning expectations
Low earnings drove a higher price-to-earnings ratio
• Impairments and low commodity prices reduced the Top 40’s earnings to $20 billion from$72 billion in 2012, the lowest profit level in a decade
• Aggregated results of gold miners weighed on results, with collectively $20 billion in net lossesin 2013
• Adjusting forimpairment,the Top 40’syear-end PEratio increasedto levels last seenduring 2009
12
2
Source: PwC analysis

1 2 3 4 5 6
PwC • June 2014Mine 2014 • Realigning expectations
Top 40 return on capital employed near rock bottom
• Adjusting for impairment, the 2013 ROCE of 5% is even lower than during the global financialcrisis in 2009 when ROCE dropped to 10%
• With target ROCE hurdle rates of 15%, this clearly demonstrates the challenges in getting newprojects approved
13
2
Source: PwC analysis

1 2 3 4 5 6
PwC • June 2014Mine 2014 • Realigning expectations
Dividends paid grew, despite poor profits…
• Over the last five years, theTop 40’s dividends have almosttripled, from $15 billion to$41 billion in 2013
• On an aggregate basis, totaldividends of $41 billion aredouble the total net profit ofthe Top 40 of $20 billion
• Given the uncertainty surroundingcommodity prices, this level ofshareholder returns may not besustainable for much longer, asevidenced by changes in dividendpolicies
14
2
Source: PwC analysis

1 2 3 4 5 6
PwC • June 2014Mine 2014 • Realigning expectations
The Top 40 maintained or grew production acrossmost commodities, despite softening prices
15
Production(measure)
Volume changefrom prior year (%)
Price changefrom prior year (%)
Copper(million tonnes)
12 8% (9%)
Iron Ore(million tonnes)
825 4% 6%
Coal(million tonnes)
1,470 2% (9%)
Gold(million ounces)
25 2% (28%)
Potash(million tonnes)
30 4% (22%)
2
Source: PwC analysis

1 2 3 4 5 6
PwC • June 2014Mine 2014 • Realigning expectations
Gold reserves were realigned to the newmarket reality
• Falling gold prices during2013 saw increasedconservatism applied bygold miners in evaluatingyear-end reserves
• Gold reserves of theTop 40 fell 8%, to431 million oz.
• The highest priceassumption fell fromUS$1,500/oz toUS$1,350/oz, with thelowest at $950/oz.
16
2
Source: PwC analysis

1 2 3 4 5 6
PwC • June 2014Mine 2014 • Realigning expectations
The continuing rise of emerging market miners,now accounting for more than half of the Top 40...
• Emerging marketcompanies now accountfor more than half ofthe Top 40
• Collectively emergingmarket miners netted$24bn in profits,compared with $4bn inlosses from developedmarket peers
• Diversifieds continue todominate marketcapitalisation of theTop 40, accounting for51% of the total
17
2
Source: PwC analysis

1 2 3 4 5 6
PwC • June 2014Mine 2014 • Realigning expectations
Two new faces in the Top 40 field in 2013…
Saudi Arabian Mining and ALROSA both joined the Top 40 for the first time
• Saudi Arabian Mining is the first ever company from the Middle East in the Top 40,backed by a government mandate to develop Saudi Arabia’s mineral resources
• Russian diamond miner, ALROSA, joined as a result of an IPO in 2013, one of thefew major companies to list during the year
Impacted by impairments and decliningprices during 2013, all five companies to leave
the Top 40 in 2013 were gold companies(although one gold company did re-enter)
18
2

PwC • June 2014Mine 2014 • Realigning expectations
It’s alwaysdarkest beforethe dawn…

1 2 3 4 5 6
PwC • June 2014Mine 2014 • Realigning expectations
Mining revenues decreased in 2013 as commodityprices fell
• The Top 40 realised a decline of 2% in mining revenues, down $13 billion to $512 billion in 2013
• Copper and iron ore revenue increased in 2013, supported by demand from emerging markets
• Emerging market factors such as China’s continuing urbanisation are expected to keep demandstrong
20
3

1 2 3 4 5 6
PwC • June 2014Mine 2014 • Realigning expectations
Operating costs remained a challenge for the Top 40
• With costs up, aggregate net profits for the year dropped to $20 billion, the lowest level for theTop 40 in a decade
• Cost saving initiatives are taking time to bear fruit, but early 2014 reporting indicates some success,particularly with gold companies reporting substantial all-in cost reductions
21
3
Source: PwC analysis

1 2 3 4 5 6
PwC • June 2014Mine 2014 • Realigning expectations
Record impairments… again
• 2013 was another year of write downsfor the Top 40 with $57 billion ofimpairment charges recorded in theyear, on top of $40 billion in 2012
• One quarter of the Top 40 recordedover $1 billion of impairments each in2013, primarily gold miners and theTop 5 diversifieds
22
3
Source: PwC analysis

1 2 3 4 5 6
PwC • June 2014Mine 2014 • Realigning expectations
Record impairments… again
• A higher proportion of impairment charges were recorded against hard assets such as PP&E in2013, reflecting the Top 40’s generally lowered outlook on commodity prices, and the fact thatlarge impairments against goodwill and intangibles had been taken in the prior year
• Emerging market companies were seemingly less impacted by impairments in 2012 and 2013,perhaps due to different M&A strategies
23
3
Source: PwC analysis

1 2 3 4 5 6
PwC • June 2014Mine 2014 • Realigning expectations
Capital velocity slows
• Capital velocity, the ratio of capital expenditure to capital employed, and a proxy for measuring thegrowth agenda of organisations in capital intensive industries, has been increasing since 2010, butslowed in 2013
• Capital discipline measures are showing, as the flattening of the ratio indicates a more consideredand deliberate approach to capital allocation
24
3
Source: PwC analysis

PwC • June 2014Mine 2014 • Realigning expectations
Geared forthe future

1 2 3 4 5 6
PwC • June 2014Mine 2014 • Realigning expectations
Gearing continues to go up…
• Net debt increased 42% in 2013 as the Top 40 accessed debt and extended their repayment profiles
• Rating agency concerns for the industry in the short-term around weak operating and financialmetrics, and the expectation finance costs can only increase will put pressure on the Top 40’s abilityto raise cheap debt
26
4
Source: PwC analysis

1 2 3 4 5 6
PwC • June 2014Mine 2014 • Realigning expectations
A struggle to reduce committed capital expenditureas operating cash flows eroded
• Negative free cash flow of($6 billion) for the firsttime in the Mine series
• Net operating cash flowswere down 7% or by $10billion as a result ofsqueezed operatingmargins
• The Top 40 struggled toreduce property, plantand equipment spend,up 2% on 2012
27
4
Source: PwC analysis

1 2 3 4 5 6
PwC • June 2014Mine 2014 • Realigning expectations
Yet dividends maintained regardless of results?
• Despite the difficult year,the industry continued toincrease dividends paid,at $41 billion, up 5% on2012
• Even after removing theimpact of impairments,the dividend yield atDecember 2013 fromemerging marketcompanies significantlyexceeded their developedmarket peers
28
4
Source: PwC analysis

PwC • June 2014Mine 2014 • Realigning expectations
Strategies tobeat thedownturn

1 2 3 4 5 6
PwC • June 2014Mine 2014 • Realigning expectations
The productivity imperative – rejecting the short-term mindset
• PwC’s Mining Equipment Productivity Index shows despite recent cost reduction initiatives,equipment efficiency continues to decrease globally
• Productivity remains one of the most important topics as the industry aims to restore and sustainshareholder value
30
5
Source: PwC’s Equipment Productivity and Reliability Database

1 2 3 4 5 6
PwC • June 2014Mine 2014 • Realigning expectations
The productivity levers
1. Determining a clear operating strategy, which is typically one of:
• Volume strategy – favoured during periods of high commodity prices,sees higher truck usage to minimise loader idle time, or
• Cost strategy – a high focus on costs generally means fewer,and more highly utilised, trucks and higher levels of loader idle time
2. Data
• Use of available data is a key feature of mines that achieve outstanding equipment performance,but the industry is yet to fully leverage its data
3. People
• The full potential of a clear mine strategy and sound data management will not be achievedwithout the right people or skills
The need to realise sustainable productivity gains will be paramountto reaching the goal of having mines for all stages of the cycle
31
5

1 2 3 4 5 6
PwC • June 2014Mine 2014 • Realigning expectations
Expandingbeyond
domesticborders
Realigning portfolio management
• With changes in CEOs and continuedmargin pressure, flexing where andwhat to mine, and what to put on holdis a focus to deliver shareholder value
• Almost a quarter of the Top 40 arediversifying geographically with asimilar number either divesting non-core assets, or looking to do so in 2014
32
Sharingrisk andcapital
Sheddingnon-core
assets
Moving upand downthe value
chainSimplifyingoperations
andportfolios
Portfolio management of the Top 40
5

1 2 3 4 5 6
PwC • June 2014Mine 2014 • Realigning expectations
Innovative mining practices
• Innovation can help the industry enhance profitability and productivity, address labour shortagesand costs and develop technologies required in more difficult conditions (e.g. declining grades,remote locations, deep mining)
• Typically much of the innovation comes from suppliers to the industry, with only nine miningcompanies included in a recent survey of the world’s top 2,000 companies by R&D investment
• Studying ‘big data’ and understanding variables such as truck and process plant activity, andanalysing maintenance planning and scheduling has reportedly resulted in substantial efficienciesfor Rio Tinto and BHP Billiton
• Other areas of innovation being reported include replacing some drill and blast activities with newreef-boring technology for gold companies, greater adoption of driverless trucks to lessen downtimeand improve safety, and assessing benefits from new engine and fuel mixes
33
5

PwC • June 2014Mine 2014 • Realigning expectations
Outlook

1 2 3 4 5 6
PwC • June 2014Mine 2014 • Realigning expectations
Long-term demand fundamentals from emergingmarkets continue to provide hope
• Emerging markets continue to be the world’s growth engine, with China leading the way with anenvious growth rate of 6.8% by 2018
• Growth rates in developed markets are also expected to increase beyond 2014 as confidence isrestored in the broader economy
35
6
Source: IMF

1 2 3 4 5 6
PwC • June 2014Mine 2014 • Realigning expectations
Difficulties with licence to operate will continue
• Resource nationalism is hereto stay. Unintendedoutcomes can result, actuallydecreasing the benefitsmining brings tocommunities
• 2014 election results inBrazil, India, Indonesia andSouth Africa may alterexpectations
• Carefully managing totalimpact can be used to buildtrust with local stakeholders
36
6

1 2 3 4 5 6
PwC • June 2014Mine 2014 • Realigning expectations
Delivering against realigned expectations
• Revised strategies have been put in motion and the market will grow impatient for demonstrablereturns in 2014 from the strategies adopted by the Top 40
• Emerging market mining companies, some backed by governments and focused on meetingdomestic supply needs, may see opportunities to get in at a relative low point for the industry
• We expect to see some moves towards consolidation – friendly or otherwise – if only to seek outsynergies to reduce costs in this low price environment, consistent with the new mantra of lowercosts and higher productivity
2014 will see if the renewed strategies of themining industry can successfully lift the industryof the bottom by delivering sustainable growth…
37
6

www.pwc.com/mining
Copyright © 2014 PwC. All rights reserved. PwC refers to the PwC network and/or one or more of its member firms, each of which is a separate legal entity. Please seewww.pwc.com/structure for further details. This content is for general information purposes only, and should not be used as a substitute for consultation with professional advisors.
PricewaterhouseCoopers has exercised reasonable care in the collecting, processing, and reporting of this information but has not independently verified validated, or audited the data toverify the accuracy or completeness of the information. PricewaterhouseCoopers gives no express or implied warranties, including but not limited to any warranties of merchantability orfitness for a particular purpose or use and shall not be liable to any entity or person using this document, or have any liability with respect to this document.
PwC helps organisations and individuals create the value they’re looking for. We’re a network of firms in 158 countries with more than 180,000 people who are committed to deliveringquality in assurance, tax and advisory services. Tell us what matters to you and find out more by visiting us at www.pwc.com.