minerals industry tax data collection - survey results · minerals industry tax data collection ......
TRANSCRIPT
Minerals industry tax data collection - survey results Minerals Council of Australia
29 August 2011
Liability limited by a scheme approved under Professional Standards Legislation.
© 2011 Deloitte Access Economics Pty Ltd
Dr John Kunkel Director, Industry Economics and Taxation Minerals Council of Australia Level 3, 44 Sydney Avenue Forrest ACT 2603
29 August 2011
Dear John
Industry data collection and analysis
Deloitte Access Economics was commissioned by the MCA in late 2010 to assist it in collecting its own industry level database of the taxes paid by mining companies.
The case for the industry itself to maintain an aggregate dataset (maintaining the confidentiality of the data of individual members) derives from the difficult political backdrop which could accompany any renewed mining tax debate.
The data relied upon in the mining tax debate of 2010 were often inappropriately used. Old data were relied on in some instances, while in other instances the use of different data sources resulted in erroneous calculations and misleading conclusions.
Yours sincerely,
Chris Richardson Director Deloitte Access Economics Pty Ltd
Deloitte Access Economics Pty Ltd
ACN: 149 633 116
Level 1, 9 Sydney Ave
Barton ACT 2600
PO Box 6334
Kingston ACT 2604
Tel: +61 2 6175 2000
Fax: +61 2 6175 2001
www.deloitte.com.au
i Deloitte Access Economics Commercial-in-confidence
Contents Executive Summary........................................................................................................................ ii
1 Survey approach .................................................................................................................. 5
2 Results and conclusions ....................................................................................................... 7
Appendix A ................................................................................................................................... 12
Limitation of our work ..................................................................................................................... 17
Tables Table 2.1 : Estimated royalties tax-take – larger miners ............................................................... 8
Chart 2.2: Estimated royalties tax-take – larger miners ................................................................ 9
Table 2.2 : Estimated total tax-take – larger miners ................................................................... 10
Chart 2.3: Estimated total tax-take – larger miners .................................................................... 10
Table A.1 : Survey coverage ......................................................................................................... 12
ii Deloitte Access Economics Commercial-in-confidence
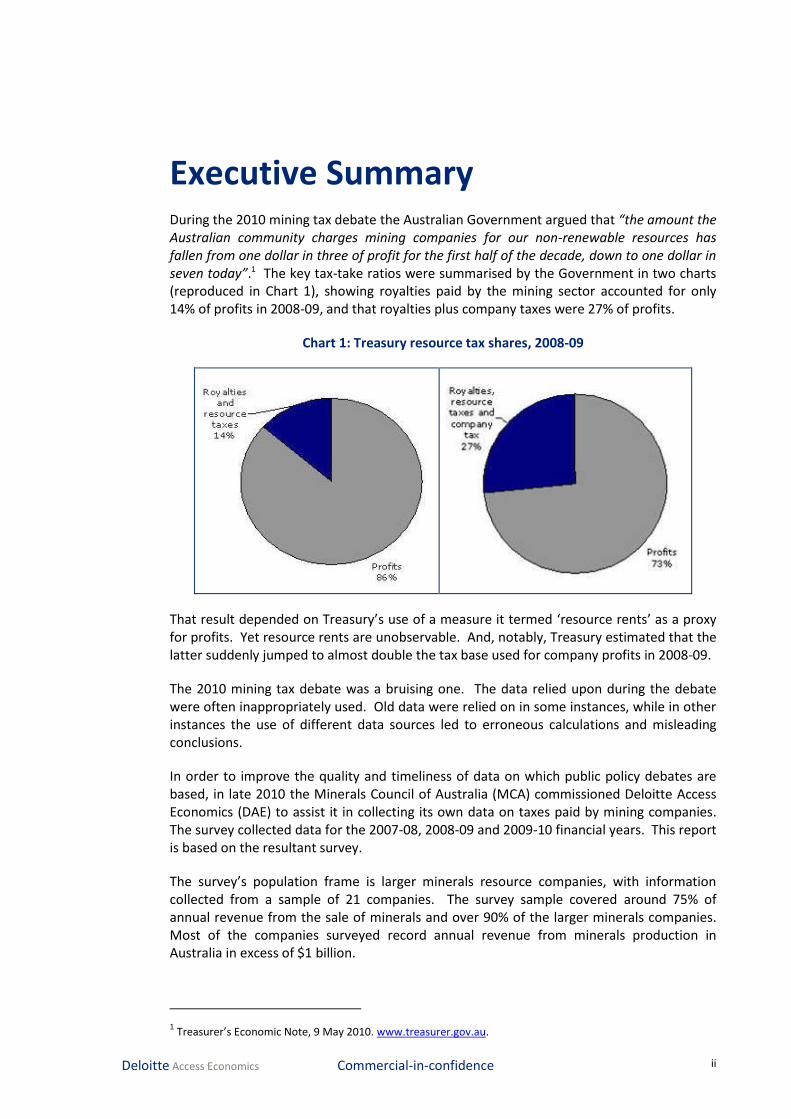
Executive Summary During the 2010 mining tax debate the Australian Government argued that “the amount the Australian community charges mining companies for our non-renewable resources has fallen from one dollar in three of profit for the first half of the decade, down to one dollar in seven today”.1 The key tax-take ratios were summarised by the Government in two charts (reproduced in Chart 1), showing royalties paid by the mining sector accounted for only 14% of profits in 2008-09, and that royalties plus company taxes were 27% of profits.
Chart 1: Treasury resource tax shares, 2008-09
That result depended on Treasury’s use of a measure it termed ‘resource rents’ as a proxy for profits. Yet resource rents are unobservable. And, notably, Treasury estimated that the latter suddenly jumped to almost double the tax base used for company profits in 2008-09.
The 2010 mining tax debate was a bruising one. The data relied upon during the debate were often inappropriately used. Old data were relied on in some instances, while in other instances the use of different data sources led to erroneous calculations and misleading conclusions.
In order to improve the quality and timeliness of data on which public policy debates are based, in late 2010 the Minerals Council of Australia (MCA) commissioned Deloitte Access Economics (DAE) to assist it in collecting its own data on taxes paid by mining companies. The survey collected data for the 2007-08, 2008-09 and 2009-10 financial years. This report is based on the resultant survey.
The survey’s population frame is larger minerals resource companies, with information collected from a sample of 21 companies. The survey sample covered around 75% of annual revenue from the sale of minerals and over 90% of the larger minerals companies. Most of the companies surveyed record annual revenue from minerals production in Australia in excess of $1 billion.
1 Treasurer’s Economic Note, 9 May 2010. www.treasurer.gov.au.
iii Deloitte Access Economics Commercial-in-confidence
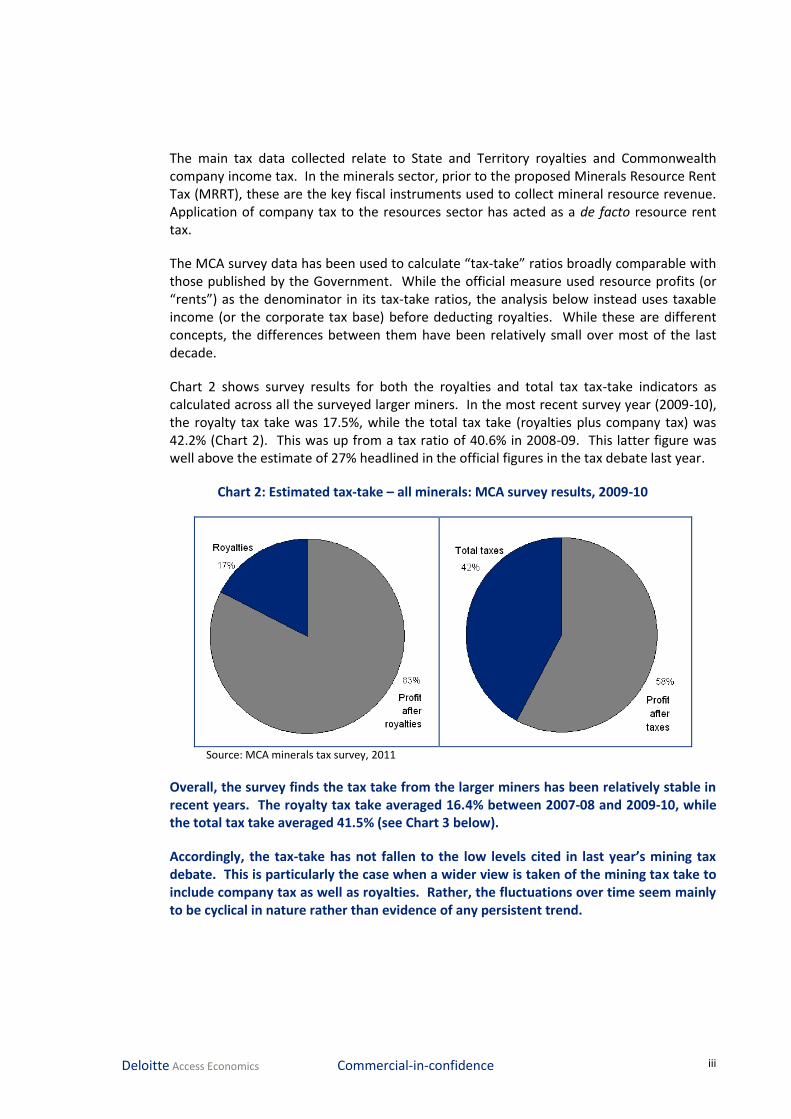
The main tax data collected relate to State and Territory royalties and Commonwealth company income tax. In the minerals sector, prior to the proposed Minerals Resource Rent Tax (MRRT), these are the key fiscal instruments used to collect mineral resource revenue. Application of company tax to the resources sector has acted as a de facto resource rent tax.
The MCA survey data has been used to calculate “tax-take” ratios broadly comparable with those published by the Government. While the official measure used resource profits (or “rents”) as the denominator in its tax-take ratios, the analysis below instead uses taxable income (or the corporate tax base) before deducting royalties. While these are different concepts, the differences between them have been relatively small over most of the last decade.
Chart 2 shows survey results for both the royalties and total tax tax-take indicators as calculated across all the surveyed larger miners. In the most recent survey year (2009-10), the royalty tax take was 17.5%, while the total tax take (royalties plus company tax) was 42.2% (Chart 2). This was up from a tax ratio of 40.6% in 2008-09. This latter figure was well above the estimate of 27% headlined in the official figures in the tax debate last year.
Chart 2: Estimated tax-take – all minerals: MCA survey results, 2009-10
Source: MCA minerals tax survey, 2011
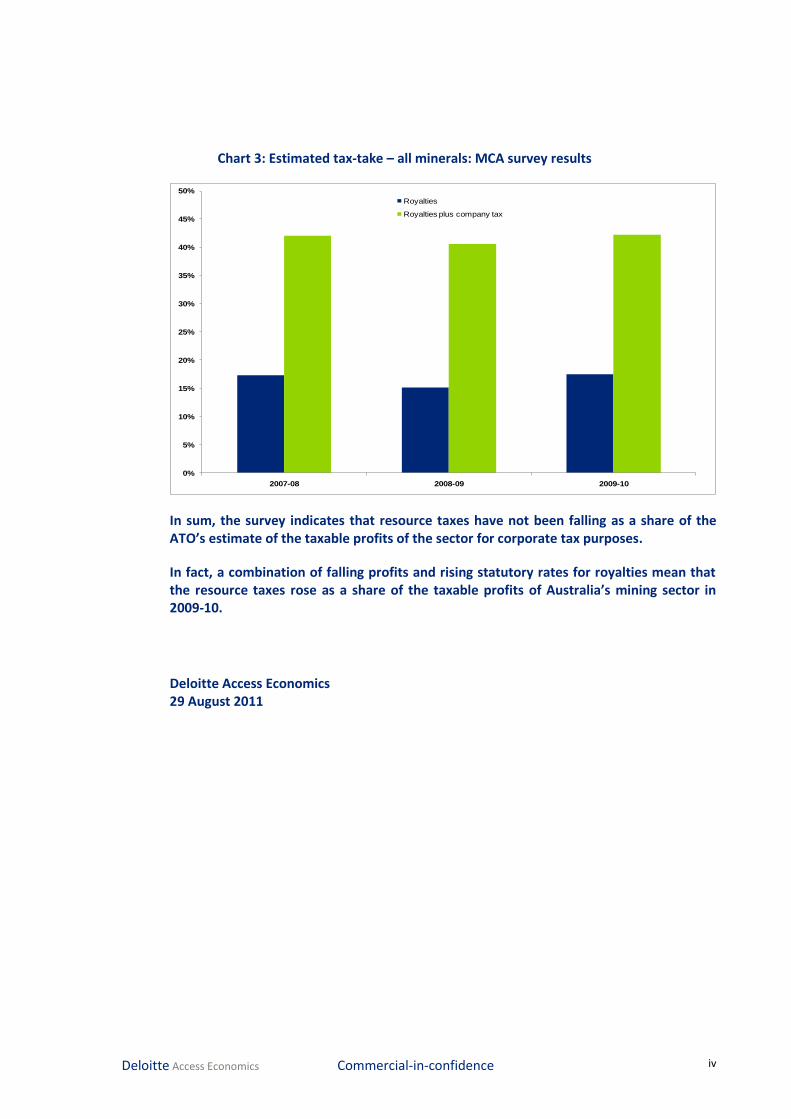
Overall, the survey finds the tax take from the larger miners has been relatively stable in recent years. The royalty tax take averaged 16.4% between 2007-08 and 2009-10, while the total tax take averaged 41.5% (see Chart 3 below).
Accordingly, the tax-take has not fallen to the low levels cited in last year’s mining tax debate. This is particularly the case when a wider view is taken of the mining tax take to include company tax as well as royalties. Rather, the fluctuations over time seem mainly to be cyclical in nature rather than evidence of any persistent trend.
iv Deloitte Access Economics Commercial-in-confidence
Chart 3: Estimated tax-take – all minerals: MCA survey results
0%
5%
10%
15%
20%
25%
30%
35%
40%
45%
50%
2007-08 2008-09 2009-10
Royalties
Royalties plus company tax
In sum, the survey indicates that resource taxes have not been falling as a share of the ATO’s estimate of the taxable profits of the sector for corporate tax purposes.
In fact, a combination of falling profits and rising statutory rates for royalties mean that the resource taxes rose as a share of the taxable profits of Australia’s mining sector in 2009-10.
Deloitte Access Economics 29 August 2011

Minerals industry tax data collection - survey results
5 Deloitte Access Economics Commercial-in-confidence
1 Survey approach The 2010 mining tax debate was a bruising one. The data relied upon during the debate were often inappropriately used. Old data were relied on in some instances, while in other instances the use of different data sources led to erroneous calculations and misleading conclusions.
In late 2010, the Minerals Council of Australia (MCA) commissioned Deloitte Access Economics (DAE) to assist it in collecting its own data on taxes paid by mining companies. The survey collected data for the 2007-08, 2008-09 and 2009-10 financial years. This report is based on the resultant survey.
The survey collected financial information in relation to the direct resource taxes paid to Australian governments on account of the local mining operations of minerals companies.
The survey’s population frame is larger minerals resource companies, with information collected from a sample of 21 companies. The survey sample covered around 75% of annual revenue from the sale of minerals and over 90% of the larger minerals companies. Most of the companies surveyed record annual revenue from minerals production in Australia in excess of $1 billion.
The survey collected data for the main commodity groups of coal mining, iron ore mining and other metals mining. Mining can also involve the extraction of non-metallic minerals. This category was excluded from the survey on the grounds that it is not a significant category for resource taxation purposes.2
The focus of the survey is on mining operations (extraction). Fundamentally, this excludes the refining or smelting of minerals or ores (other than preliminary smelting of gold), or the manufacturing (processing) of products of mineral origin such as coke or cement. These excluded activities are in the nature of manufacturing, not mining.
The companies surveyed were also asked to exclude from the mining data they reported:
All oil and gas activities, on the grounds that the MCA’s focus is on minerals rather than petroleum products;
Any exploration activity or other mining support activity, on the grounds that resource rents by their nature arise on account of extraction of minerals or ores rather than any preceding exploration activity or any downstream or support activities; and
Any non-mining activities.
The companies surveyed were asked to report data in relation to their mining operations for each State and/or Territory in which they operated, if more than one.
In addition, they were asked to exclude all offshore activities, on the grounds that the focus of the data collection is on taxes paid to Australian governments, which by their nature do not reflect mining activities undertaken outside Australia.
2 Only one of the companies surveyed reported also being involved in non-metallic mining.
Minerals industry tax data collection - survey results
6 Deloitte Access Economics Commercial-in-confidence
The confidentiality undertaking signed by both the MCA and DAE for the assurance of companies surveyed means that the survey data collected at an individual company level cannot be disclosed under any circumstances. Survey data have been analysed solely in aggregate form.
The main tax data collected relate to State and Territory resource royalties and Commonwealth company income tax. In the minerals sector, prior to the proposed Minerals Resource Rent Tax (MRRT), these are the key fiscal instruments used to collect mineral resource revenue.
Other financial data collected via the survey provide the building blocks for calculating different net earnings/profit measures involving various treatments of depreciation, interest and capital expenditure. Such measures are necessary to estimate denominators involved in calculating a range of effective (or weighted average) tax ratios.
The survey database comprised data for the 2007-08, 2008-09 and 2009-10 financial years. Each company surveyed operated during that period.
The aim of the tax data collection is not to derive population estimates of total amounts (as is the ABS’s purpose). Rather, the aim is to derive ratio values that are indicative of those for the population frame (major miners) as a whole.
A key premise of this report is that in considering the tax burden it is best to focus on tax rates rather than absolute tax dollars:
Absolute dollars have grown because of the enormous growth in the demand for and price of industrial commodities.
Ratios provide a truer measure of the existing tax burden. Ratios abstract from the size of the sector and allow debate to focus on tax rates and the associated tax burden.
Further detail regarding the survey is provided in Appendix A.
Minerals industry tax data collection - survey results
7 Deloitte Access Economics Commercial-in-confidence
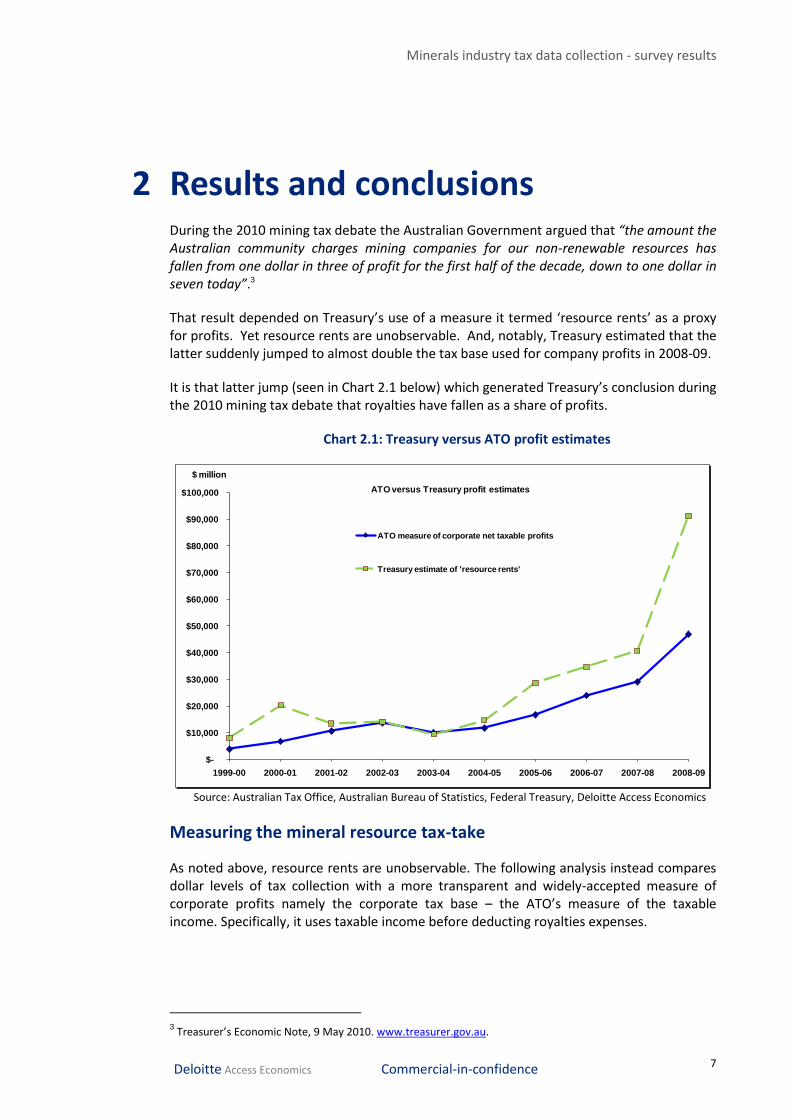
2 Results and conclusions During the 2010 mining tax debate the Australian Government argued that “the amount the Australian community charges mining companies for our non-renewable resources has fallen from one dollar in three of profit for the first half of the decade, down to one dollar in seven today”.3
That result depended on Treasury’s use of a measure it termed ‘resource rents’ as a proxy for profits. Yet resource rents are unobservable. And, notably, Treasury estimated that the latter suddenly jumped to almost double the tax base used for company profits in 2008-09.
It is that latter jump (seen in Chart 2.1 below) which generated Treasury’s conclusion during the 2010 mining tax debate that royalties have fallen as a share of profits.
Chart 2.1: Treasury versus ATO profit estimates
$-
$10,000
$20,000
$30,000
$40,000
$50,000
$60,000
$70,000
$80,000
$90,000
$100,000
1999-00 2000-01 2001-02 2002-03 2003-04 2004-05 2005-06 2006-07 2007-08 2008-09
ATO measure of corporate net taxable profits
Treasury estimate of 'resource rents'
ATO versus Treasury profit estimates
$ million
Source: Australian Tax Office, Australian Bureau of Statistics, Federal Treasury, Deloitte Access Economics
Measuring the mineral resource tax-take
As noted above, resource rents are unobservable. The following analysis instead compares dollar levels of tax collection with a more transparent and widely-accepted measure of corporate profits namely the corporate tax base – the ATO’s measure of the taxable income. Specifically, it uses taxable income before deducting royalties expenses.
3 Treasurer’s Economic Note, 9 May 2010. www.treasurer.gov.au.
Minerals industry tax data collection - survey results
8 Deloitte Access Economics Commercial-in-confidence
According to figures released by Treasury4 for the resources sector as a whole (including oil and gas) over the eight years to 2006-07, annual resource rent estimates totalled $143 billion. Similarly ABS 8155.0 data indicates that annual taxable income before deducting royalties totalled $155 billion.
On this basis, the substitution here of pre-tax corporate profits (as defined by the ATO) for more problematic estimates of “resource rents” does not tend to overstate the tax-take ratios from a Treasury perspective. Indeed, on average over this period, use of taxable income before royalties as the basis for calculating the mining sector’s tax-take slightly understates the take-take based on Treasury’s estimate of resource rents.
Royalties tax-take
The royalty tax-take is calculated here by:
Royalties expensesTaxable income before royalties
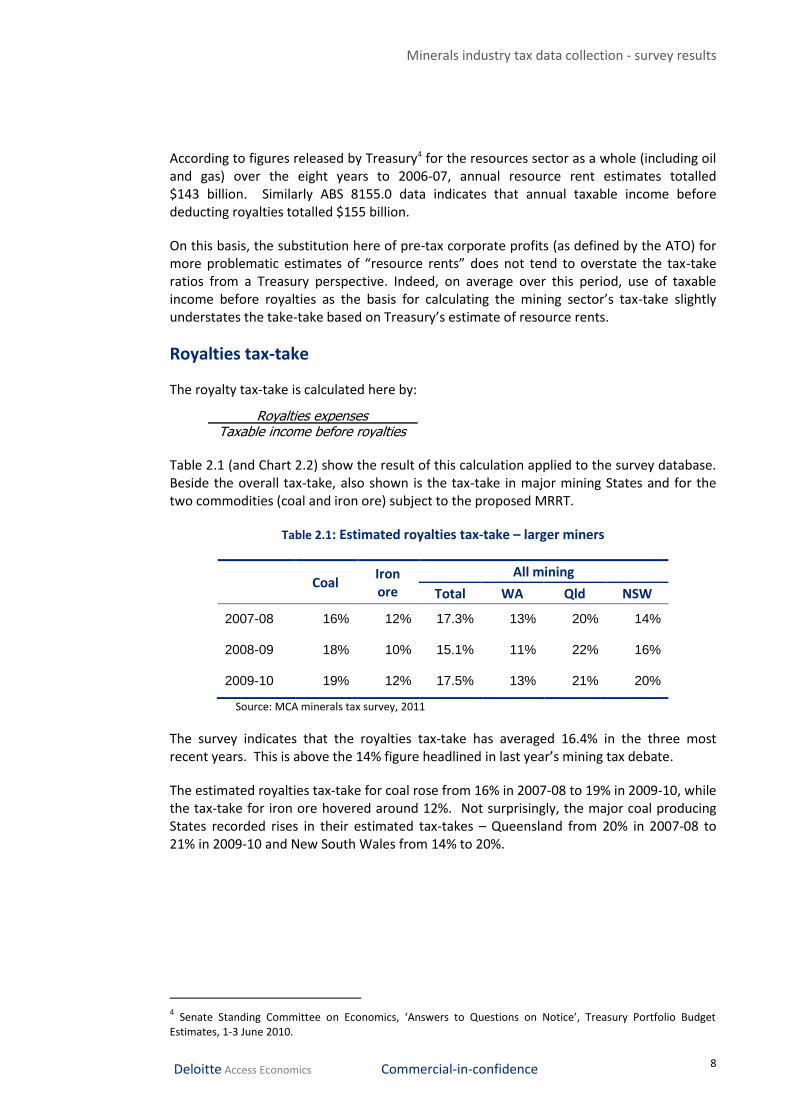
Table 2.1 (and Chart 2.2) show the result of this calculation applied to the survey database. Beside the overall tax-take, also shown is the tax-take in major mining States and for the two commodities (coal and iron ore) subject to the proposed MRRT.
Table 2.1: Estimated royalties tax-take – larger miners
Coal
Iron ore
All mining
Total WA Qld NSW
2007-08 16% 12% 17.3% 13% 20% 14%
2008-09 18% 10% 15.1% 11% 22% 16%
2009-10 19% 12% 17.5% 13% 21% 20%
Source: MCA minerals tax survey, 2011
The survey indicates that the royalties tax-take has averaged 16.4% in the three most recent years. This is above the 14% figure headlined in last year’s mining tax debate.
The estimated royalties tax-take for coal rose from 16% in 2007-08 to 19% in 2009-10, while the tax-take for iron ore hovered around 12%. Not surprisingly, the major coal producing States recorded rises in their estimated tax-takes – Queensland from 20% in 2007-08 to 21% in 2009-10 and New South Wales from 14% to 20%.
4 Senate Standing Committee on Economics, ‘Answers to Questions on Notice’, Treasury Portfolio Budget
Estimates, 1-3 June 2010.
Minerals industry tax data collection - survey results
9 Deloitte Access Economics Commercial-in-confidence
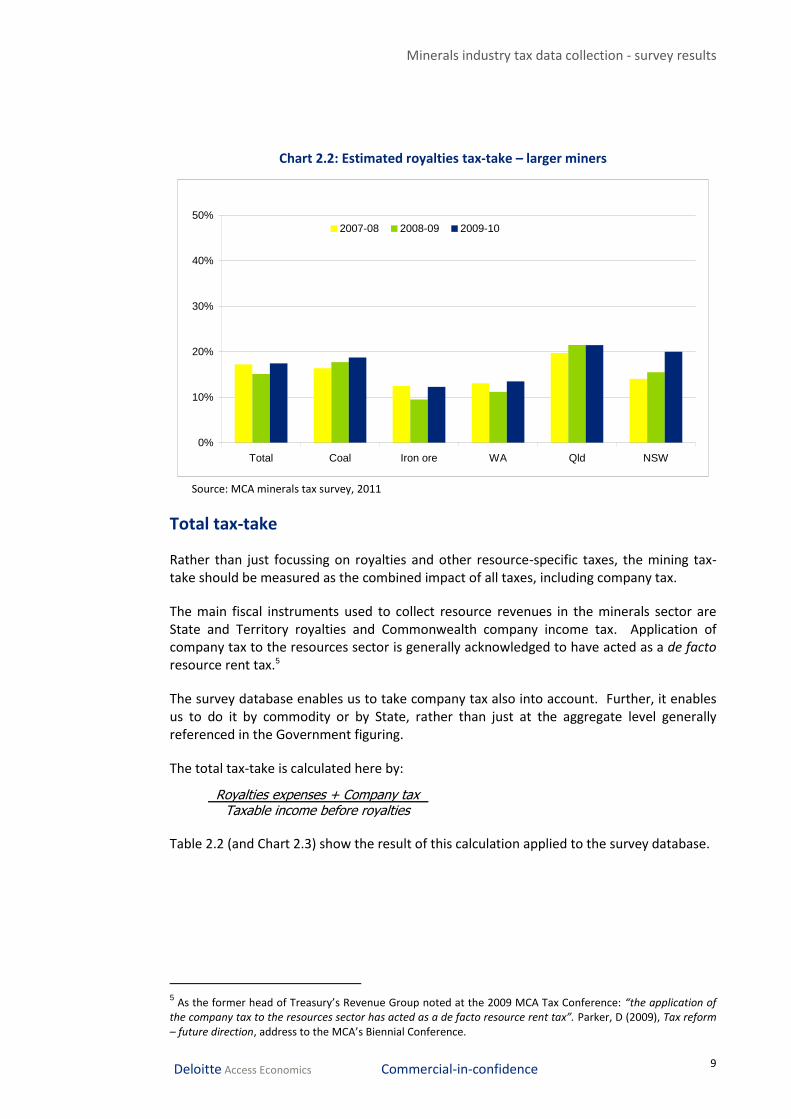
Chart 2.2: Estimated royalties tax-take – larger miners
0%
10%
20%
30%
40%
50%
Total Coal Iron ore WA Qld NSW
2007-08 2008-09 2009-10
Source: MCA minerals tax survey, 2011
Total tax-take
Rather than just focussing on royalties and other resource-specific taxes, the mining tax-take should be measured as the combined impact of all taxes, including company tax.
The main fiscal instruments used to collect resource revenues in the minerals sector are State and Territory royalties and Commonwealth company income tax. Application of company tax to the resources sector is generally acknowledged to have acted as a de facto resource rent tax.5
The survey database enables us to take company tax also into account. Further, it enables us to do it by commodity or by State, rather than just at the aggregate level generally referenced in the Government figuring.
The total tax-take is calculated here by:
Royalties expenses + Company taxTaxable income before royalties
Table 2.2 (and Chart 2.3) show the result of this calculation applied to the survey database.
5 As the former head of Treasury’s Revenue Group noted at the 2009 MCA Tax Conference: “the application of
the company tax to the resources sector has acted as a de facto resource rent tax”. Parker, D (2009), Tax reform – future direction, address to the MCA’s Biennial Conference.
Minerals industry tax data collection - survey results
10 Deloitte Access Economics Commercial-in-confidence
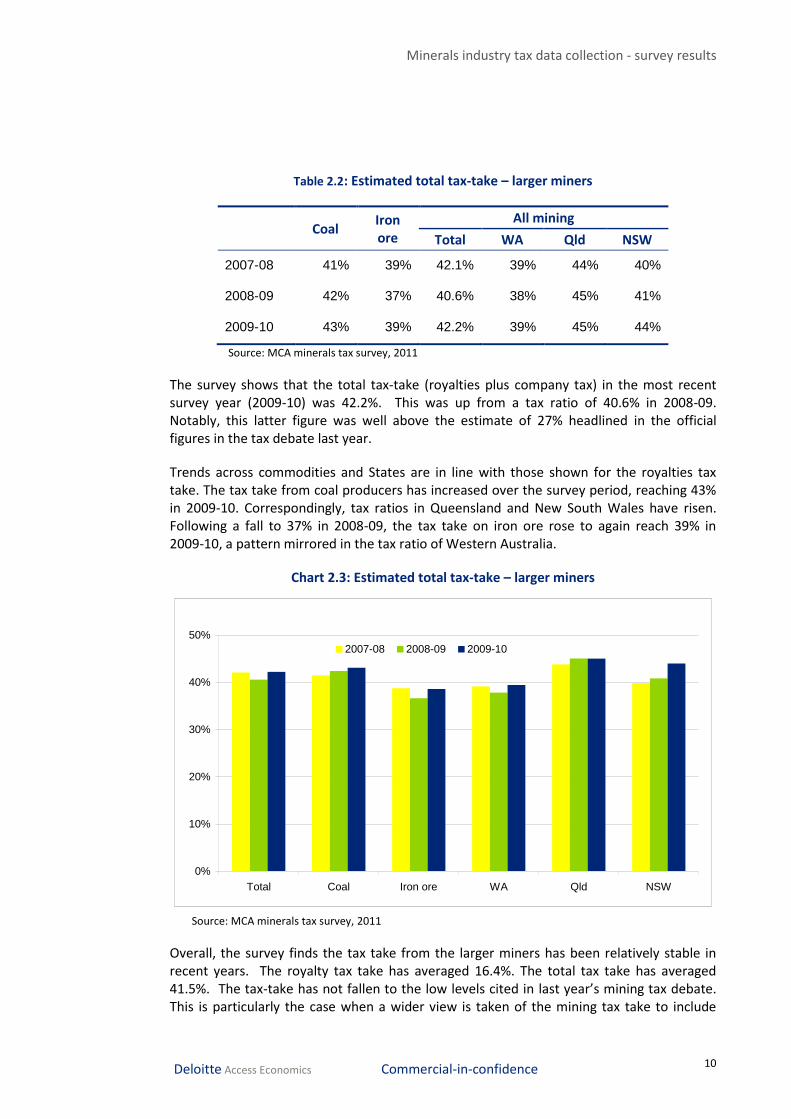
Table 2.2: Estimated total tax-take – larger miners
Coal
Iron ore
All mining
Total WA Qld NSW
2007-08 41% 39% 42.1% 39% 44% 40%
2008-09 42% 37% 40.6% 38% 45% 41%
2009-10 43% 39% 42.2% 39% 45% 44%
Source: MCA minerals tax survey, 2011
The survey shows that the total tax-take (royalties plus company tax) in the most recent survey year (2009-10) was 42.2%. This was up from a tax ratio of 40.6% in 2008-09. Notably, this latter figure was well above the estimate of 27% headlined in the official figures in the tax debate last year.
Trends across commodities and States are in line with those shown for the royalties tax take. The tax take from coal producers has increased over the survey period, reaching 43% in 2009-10. Correspondingly, tax ratios in Queensland and New South Wales have risen. Following a fall to 37% in 2008-09, the tax take on iron ore rose to again reach 39% in 2009-10, a pattern mirrored in the tax ratio of Western Australia.
Chart 2.3: Estimated total tax-take – larger miners
0%
10%
20%
30%
40%
50%
Total Coal Iron ore WA Qld NSW
2007-08 2008-09 2009-10
Source: MCA minerals tax survey, 2011
Overall, the survey finds the tax take from the larger miners has been relatively stable in recent years. The royalty tax take has averaged 16.4%. The total tax take has averaged 41.5%. The tax-take has not fallen to the low levels cited in last year’s mining tax debate. This is particularly the case when a wider view is taken of the mining tax take to include
Minerals industry tax data collection - survey results
11 Deloitte Access Economics Commercial-in-confidence
company tax as well as royalties. Rather, the fluctuations over time seem mainly to be cyclical in nature rather than evidence of any persistent trend.
Minerals industry tax data collection - survey results
12 Deloitte Access Economics Commercial-in-confidence
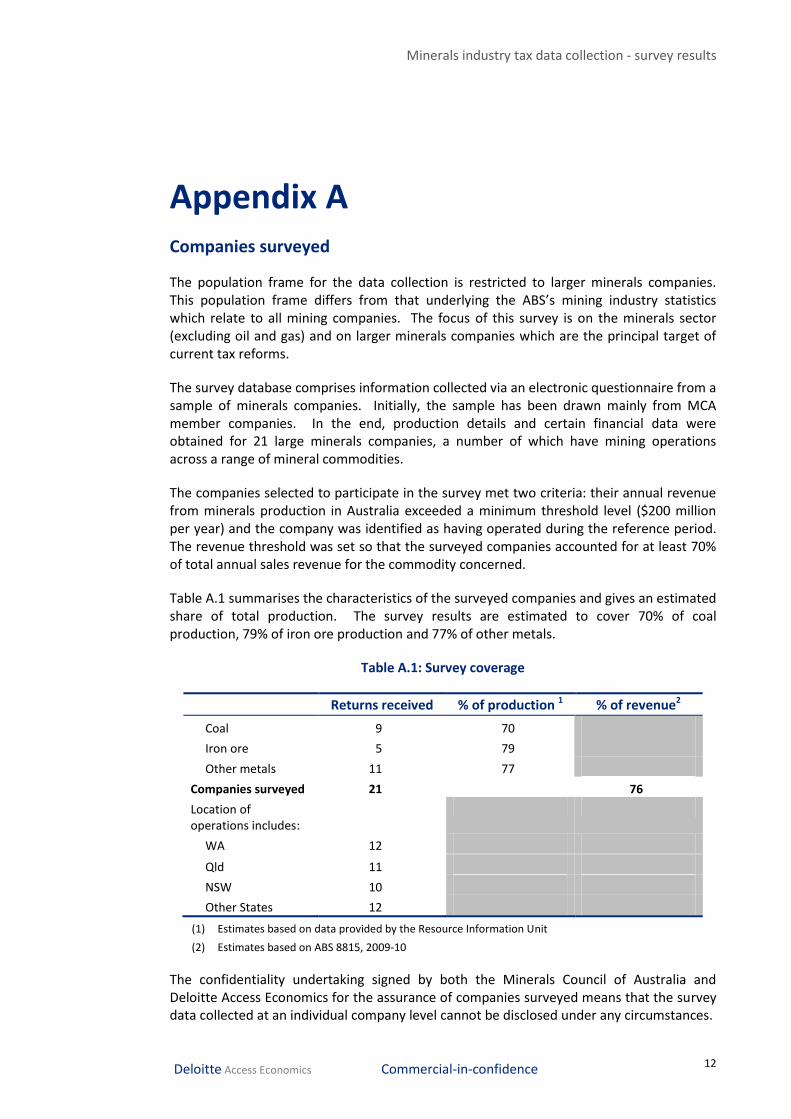
Appendix A Companies surveyed
The population frame for the data collection is restricted to larger minerals companies. This population frame differs from that underlying the ABS’s mining industry statistics which relate to all mining companies. The focus of this survey is on the minerals sector (excluding oil and gas) and on larger minerals companies which are the principal target of current tax reforms.
The survey database comprises information collected via an electronic questionnaire from a sample of minerals companies. Initially, the sample has been drawn mainly from MCA member companies. In the end, production details and certain financial data were obtained for 21 large minerals companies, a number of which have mining operations across a range of mineral commodities.
The companies selected to participate in the survey met two criteria: their annual revenue from minerals production in Australia exceeded a minimum threshold level ($200 million per year) and the company was identified as having operated during the reference period. The revenue threshold was set so that the surveyed companies accounted for at least 70% of total annual sales revenue for the commodity concerned.
Table A.1 summarises the characteristics of the surveyed companies and gives an estimated share of total production. The survey results are estimated to cover 70% of coal production, 79% of iron ore production and 77% of other metals.
Table A.1: Survey coverage
Returns received % of production 1 % of revenue2
Coal 9 70
Iron ore 5 79
Other metals 11 77
Companies surveyed 21 76
Location of operations includes:
WA 12
Qld 11
NSW 10
Other States 12
(1) Estimates based on data provided by the Resource Information Unit
(2) Estimates based on ABS 8815, 2009-10
The confidentiality undertaking signed by both the Minerals Council of Australia and Deloitte Access Economics for the assurance of companies surveyed means that the survey data collected at an individual company level cannot be disclosed under any circumstances.
Minerals industry tax data collection - survey results
13 Deloitte Access Economics Commercial-in-confidence
Commodity coverage (and groupings)
The focus of the survey database is on mining operations (extraction).
Fundamentally, this excludes the refining or smelting of minerals or ores (other than preliminary smelting of gold), or the manufacturing (processing) of products of mineral origin such as coke or cement. These excluded activities are in the nature of manufacturing not mining.
The companies surveyed were also asked to exclude the following from the mining data they reported:
all amounts associated with their oil and gas activities, on the grounds that the MCA’s focus is on minerals rather than energy,
any amounts reflecting exploration activity or other mining support activity, on the grounds that resource rents by their nature arise on account of extraction of minerals or ores rather than any preceding exploration activity or any downstream or support activities, and
any amounts derived from non-mining activities.
The survey database distinguishes between the main commodity groups of coal mining, iron ore mining and other metals mining. Consistent with the Australian and New Zealand Standard Industrial Classification (ANZSIC) (ABS cat. no. 1292.0):
coal mining mainly involves open-cut or underground mining of black or brown coal,
iron ore mining mainly involves mining iron ore or iron sands as well as the production of sinter and other agglomerates (except those associated with blast furnace operations), and
other metals ore mining includes the mining of bauxite, copper, gold, lead, nickel, silver, zinc and uranium.
Geographical coverage
The companies surveyed were asked to report data in relation to their mining operations for each State and/or Territory in which they operated, if more than one.
In addition, they were asked to exclude all offshore activities, on the grounds that the focus of the data collection is on taxes paid to Australian governments, which by their nature do not reflect mining activities undertaken outside Australia.
Variables included in the survey database
The survey database comprises data for each of the following four tax payment variables:

Minerals industry tax data collection - survey results
14 Deloitte Access Economics Commercial-in-confidence
Tax payment variables Comments
Royalty expenses within Australia
Company total as reported in the annual company tax return.
Generally involves an accrual/payable amount.
Australian royalties paid during year
Reflects amount paid (cash).
The difference with the accrual/payable amount is expected to be small because the delay between accrual and payment is typically as little as one month.
Australian gross company tax 30% of ‘taxable income’, the difference between
(i) the sum of Gross interest (income), and All other income, and “Other assessable income + non-deductible expenses”, and
(ii) the sum of Depreciation expense, Interest expenses, All other expenses (excluding depreciation, interest and royalties), and “Other deductible expenditure + non-assessable income”.
Both the “Other assessable income + non-deductible expenses” and “Other deductible expenditure + non-assessable income” items were provided by each respondent, but are not included directly in the survey database.
Generally involves an accrual/payable amount.
Australian company tax paid during year
Reflects both cash payments made during a year, and any:
rebates/tax offsets, and
tax credits.
This can differ substantially in any one year from gross company tax.
The survey database also comprises data for each of the following eight tax base variables:
Tax base variables Comments
Gross interest (income)
All other income Excludes gross interest income.
Depreciation expense
Interest expenses
All other expenses Excludes depreciation, interest & royalties expenses.
Total capital employed Based on survey response for “total assets” as sourced from each respondent’s annual tax return.
Includes both financial and non-financial assets.
Total debt Restricted to interest-bearing liabilities
Capex Based on survey response provided for “depreciable assets first deducted” as sourced from each respondent’s annual tax return
Minerals industry tax data collection - survey results
15 Deloitte Access Economics Commercial-in-confidence
Sources of data
The companies surveyed were asked to source the requisite financial information primarily from their annual tax return to the ATO and related working papers. A company’s annual tax return provides financial information based on its statutory accounts in addition to tax-specific adjustments and items.
These annual tax returns are typically held centrally by each company’s tax group, which is responsible for collating subsidiary company or divisional annual tax-related information and for aggregating this component information into the corporate/parent annual tax return required by the ATO. This latter feature provides a basis on which companies surveyed are able to allocate the data sought across activities.
Exchange rate
Most survey respondents provide financial information in Australian dollars. However, a small number opted to provide the survey data in terms of US dollars (“USD”).
The survey database has been compiled by converting any USD amounts reported in the survey returns into an AUD equivalent as follows:
annual financial transaction amounts are converted using the average daily exchange rate over the relevant 12 months, and
year-end stock or balance sheet amounts are converted using the exchange rate on the relevant year-end date.
The exchange rates used are as published by the RBA.
Annual reporting period
The survey database contains data for the 2008, 2009 and 2010 financial years.
The annual period covered by the survey database is intended to be the 12 months ending 30 June, as this is generally the annual period covered by official economic and financial statistics in Australia. However, where companies are unable to supply information on this basis, the survey permits use of an accounting period covering any 12 month period for which data can be provided.
Approximately three quarters of minerals companies surveyed report annually – for statutory and taxation purposes – using the 12 months ending 31 December.
The ABS typically reports a single figure for each year making no allowance for the differing reporting periods. As a result, its estimates can reflect trading conditions prevailing in periods outside the 12 months ending June in the relevant year.
By contrast, for each year (and for each variable), the survey database includes an estimate made by Deloitte Access Economics of the aggregate encompassing all survey respondents reflecting trading conditions in the year ending 30 June. The methodology used for this purpose systematically applies adjustments based on underlying half-yearly (or quarterly) commodity-wide output or production value series.
Minerals industry tax data collection - survey results
16 Deloitte Access Economics Commercial-in-confidence
Rounding
Where figures have been rounded, discrepancies may occur between totals and the sum of components.
Calculated figures shown in the survey database have been calculated using unrounded estimates and may be different from, but are more accurate than, calculations based on any rounded components.
Potential errors
The data contained in the survey database have been obtained from a sample of minerals companies. As such, the ratios produced by these data may be subject to sampling error; that is, they may differ from the ratios produced were the data obtained from all mining companies in the population frame.
The sample was not selected randomly from among larger miners, but initially taken from the MCA membership. Offsetting this is the fact that the companies surveyed nevertheless provide extensive coverage of both total production and larger companies.
In addition, inaccuracies in reporting by survey respondents can give rise to non-sampling errors.
Every effort has been made to reduce inaccuracies in reporting by survey respondents:
The survey questionnaire was designed to be easy to complete and was supported by detailed explanatory material to assist companies to report accurately. The questionnaire design also involved two ’preliminary’ rounds which gave ample opportunity for any ‘bugs’ to be ironed out of the final survey.
The source of most data requested has been restricted to a single (common) source, namely a company’s annual tax return and associated working papers.
A number of internal and external checks were performed to assess the accuracy of completed returns.
Inaccuracies can occur because of errors made in recording, coding and processing data. The scope for such errors was minimised by the development and adoption of documented operating procedures for compilation of the survey database from individual company survey returns.
In a few instances, some information was missing from a survey return for a year in which other requested data was provided by the survey respondent or the information was not provided in the form required. In such cases, Deloitte Access Economics devised and applied certain estimation procedures to fill such information gap. Every effort has been made to reduce estimation error inherent in the above estimation procedures by careful selection of the method used and double checking of each application of the estimation procedure.
Limitation of our work
General use restriction
This report is prepared solely for the use of the Minerals Council of Australia. This report is
not intended to and should not be used or relied upon by anyone else and we accept no duty
of care to any other person or entity. The report has been prepared for the purpose of the
brief provided by the Minerals Council of Australia. You should not refer to or use our name
or the advice for any other purpose.
18 Deloitte Access Economics Commercial-in-confidence
Contact us
Deloitte Access Economics ACN: 49 633 116 Level 1 9 Sydney Avenue Barton ACT 2600 PO Box 6334 Kingston ACT 2604 Australia Tel: +61 2 6175 2000 Fax: +61 2 6175 2001
19 Deloitte Access Economics Commercial-in-confidence
Deloitte Access Economics is Australia’s pre-eminent economics advisory practice and a member of Deloitte's global economics group. The Directors and staff of Access Economics joined Deloitte in early 2011.
Deloitte refers to one or more of Deloitte Touche Tohmatsu Limited, a UK private company limited by guarantee, and its network of member firms, each of which is a legally separate and independent entity. Please see www.deloitte.com/au/about for a detailed description of the legal structure of Deloitte Touche Tohmatsu Limited and its member firms.
About Deloitte
Deloitte provides audit, tax, consulting, and financial advisory services to public and private clients spanning multiple industries. With a globally connected network of member firms in more than 150 countries, Deloitte brings world-class capabilities and deep local expertise to help clients succeed wherever they operate. Deloitte's approximately 170,000 professionals are committed to becoming the standard of excellence.
About Deloitte Australia
In Australia, the member firm is the Australian partnership of Deloitte Touche Tohmatsu. As one of Australia’s leading professional services firms. Deloitte Touche Tohmatsu and its affiliates provide audit, tax, consulting, and financial advisory services through approximately 5,400 people across the country. Focused on the creation of value and growth, and known as an employer of choice for innovative human resources programs, we are dedicated to helping our clients and our people excel. For more information, please visit our web site at www.deloitte.com.au.
Liability limited by a scheme approved under Professional Standards Legislation.
Member of Deloitte Touche Tohmatsu Limited
© 2011 Deloitte Access Economics Pty Ltd