miningmart evaluation report - tu dortmund · miningmart evaluation report marco richeldi and...
TRANSCRIPT

Enabling End-User Datawarehouse Mining Contract No.: IST-1999-11993
Deliverable No. D17.3
MiningMart Evaluation Report
Marco Richeldi and Alessandro Perrucci
Telecom Italia Lab Via G. Reiss Romoli 274 – 10148 Torino, Italy
{marco.richeldi, alessandro.perrucci}@tilab.com
December 17, 2002

2
Abstract
This document summarizes the experiments performed by Telecom Italia Lab to verify whether the MiningMart system achieved its objectives. Project results were applied to perform a real-world discovery task that was accomplished by TILAB in the past. The case study concerns developing a Churn Analysis system based upon data mining technology that performs analysis of the customer database of a telecommunication company and predicts customer unsubscription and move to a competitor. Evaluation results are definitely positive. The MiningMart system meets all the success criteria that were defined at the beginning of the project, namely efficient support of pre-processing tasks, pre-processing speed up, user friendliness, scalability, and quality of data mining output.
3
1 Introduction
The goal of the MiningMart is to develop an environment for the support of knowledge discovery from databases (KDDSE) that provides decision-makers with advanced knowledge extraction from large distributed data sets.
Within the project framework, new techniques for selecting and constructing features on the basis of given data have been developed that are supposed to ease knowledge discovery where currently most time is spent in pre-processing. MiningMart let domain knowledge be exploited during the data mining task, in order to enhance the quality of data mining results. In addition, a case-base of discovery tasks together with the required pre-processing techniques offers an adaptive interface to the KDDSE. This should speed-up similar applications of knowledge discovery and make the KDDSE self-improving.
Telecom Italia Lab (TILAB) carried out extensive experiments to verify if MiningMart project fulfilled its objectives. Project results were applied to perform a real-world discovery task that was accomplished by TILAB in the past by using a number of pre-processing and predictive modeling technologies. The case study concerns developing a Churn Analysis system based upon data mining technology to analyze the customer database of a telecommunication company and predict customer turnaround.
Evaluation results are definitely positive and are presented in the next chapters of this documents. Indeed,
• Speed up for most of the pre-processing tasks increased by at least 50% by using MiningMart.
• Power users will find MiningMart system as much easy to use as the leading commercial data mining platforms (e.g., SAS Enterprise Miner or SPSS Clementine).
• MiningMart makes it possible to build libraries of predefined data mining applications that can be easily reused and customized to fulfill specific needs.
• MiningMart features the highest scalability, since it builds upon and fully exploits state-of-the-art database technology.
• Quality of data mining output increased as domain knowledge may be exploited during the discovery process and the number of preprocessing trials decreased in number.
The rest of the document is organized as follows. Chapter 2 and Chapter 3 present the metrics and the case study used to assess MiningMart, respectively. Chapter 4 describes the results of the evaluation task.
2 Evaluation criterias
Goal of the MiningMart project was that knowledge discovery becomes a powerful, but not difficult, query facility for very large databases. End users should ideally be able to run application-driven queries against large and heterogeneous data sets in a simplified language.
In order to make knowledge discovery a powerful and easy query facility for very large databases, the current tools needed to be enhanced in the following ways:
• Supporting advanced, partially automated pre-processing of data.

4
• Supporting the view of the end-user by a case base of pre-processing and analysis tasks for re-use.
• Reducing the number and complexity of trial and error pre-processing and analysis cycles for each discovery task.
• Minimizing the amount of data that is kept within the data mining operators.
• Improving the quality of data mining results by improving the quality of data
The success criterion that was set for the overall project was that by the end of the project, some discovery tasks (for which entries in the case-base exist) could be solved with only 20% of the time for pre-processing, where the time for the data mining step remained the same as before the project.
Further, the measures listed below were considered to enable in-depth evaluation of MiningMart systems:
• Measure to creating user-friendly access to data mining for non-expert users.
Is MiningMart easy to use, transparent, and supportive? Is the flow of control natural to the user? Can the user make good use of the results? How do the user assess the results? Is the user faster when using the system? Can he/she do more when using the system?
• Speed-up the discovery process.
The time for finding the appropriate data transformations with and without MiningMart has to be measured.
• Minimize the amount of data kept within data mining operators
The aim is to perform extensive processes directly within the datawarehouse. A clear and operational measure of success is whether a huge datawarehouse can be handled by the MiningMart.
• Improve the quality of mining by improving the quality of data.
The main measure for the quality of data mining results is their accuracy on test data. Mining results with and without MiningMart have to be compared.
3 The Case Study – Business model
Evaluation of MiningMart was performed by carrying out a difficult knowledge and data discovery task concerning understanding the behavior of customers of a telecommunication company that unsuscribe and move their business to a competitor and predicting the likelihood of this event to occur. Customers who turnaround are called churners and the process of exploring and modeling their behavior is named Churn Analysis.
The Churn Analysis case study was selected as the massive volume and complexity of data collected by telcos about their customers and the difficulty of modeling this data make churn analysis a very good test bed for evaluating MiningMart features. In addition, TILAB developed several Churn Analysis systems for different companies of the Telecom Italia Group. The knowledge and data discovery process required to build effective churn prediction models has been widely explored along the years, and it reveals quite easy to assess how MiningMart supports it.

5
3.1 Churn Analysis
Customers become “churners” when they discontinue their subscription and move their business to a competitor. That is, churning is the process of customer turnover. This is a major concern for companies with many customers who can easily switch to other competitors. Examples include credit card issuers, insurance companies and telecommunication companies.
The telecommunication industry has seen many changes in the few last years. Examples are liberalization of markets – almost all European countries are now allowing foreign carriers to compete on local and long distance services –, de-regulation and a fierce competition from other industry sectors. An immediate manifestation of the new competitive environment is the escalating problem of churn. Long-distance carriers and cellular companies are well acquainted with the issue of valued customers unsuscribing to purchase product and services offered by a competitor. In the United States, an estimated two millions long-distance customers churn each month. The monthly churn rate for European cellular carriers averages between 8 and 12 percent.
The cost of churn in the telecommunication industry is large. The cost of churn in wireless communication may be around 500 euros. In addition, it costs a great deal more to win new customers than it does to retain current ones. And, frequently, a new customer will churn away before the company can fully recoup its acquisition costs. It is clear that spending money holding on to existing customers is more efficient than acquiring new customers.
Consequently, churn management has emerged as a crucial competitive weapon, and a foundation for an entire range of customer-focuced marketing efforts. With effective churn management, a company is able to determine what kind of customers are most likely to churn, and which ones are most likely to remain loyal. Part of the process is determining customer value, as sometimes you may want to let go customers that are no or very little profitable. When this kind of knowledge is available to a company, marketing managers may take informed and strategic action to minimize defections, win back valued defectors, and attract more cost-effectively the right kind of customers in the future – including those that are least likely to churn.
However, given that most customers will only signal their intention to churn when they call to cancel their account, it is difficult using standard techniques to target for anti-churn marketing. One solution to combating churn in telecommunications industries is to use data mining techniques. Data mining may be used in churn analysis to perform two key tasks:
• Predict whether a particular customer will churn and when it will happen;
• Understand why particular customers churn.
These two tasks are referred to as “prediction” and “understanding”. They represent the two most important aspects of data mining in use today. By predicting which customers are likely to churn, the telecommunication company can reduce the rate of churn by offering the customer new incentives to stay. By understanding why customers churn the telco can also work on changing their service so as to satisfy these customers ahead of time. In addition, the chance of the customer churning after action is taken can be assessed by the data mining tool so as to choose the best strategy in terms of cost and effort.
Before either prediction or understanding are performed, however, data must be gathered. This is tipycally done in a data warehouse, which is a large repository of clean,
6
non volatile and historical data. The types of information that are stored in a data warehouse for a churn analysis include:
• Customer demographics, i.e., age, gender, marital status, location, etc.
• Call statistics: length of calls at different times of the day, number of long distance and local calls.
• Billing information for each customer – what the customer is paying for local and long distance.
• Extra service information, that is, what extra plan the customer is registered on, e.g. special long distances rates.
• Voice and data product and services purchased by the customer, e.g., broad-band services, private virtual networks, dedicated data transport links, etc.
• Complaint information: how many customer service calls are made for disputed billing, dropped calls, slow service provisioning, unworking special services, and so on.
• Credit history.
3.2 Case study description
3.2.1 Input data
In this case study we describe a data mining solution to predict and understand churn behavior of customers of a mobile operator. The raw data file were generated by different Operational and Business Support Systems and are structured into the following large tables, namely:
• Customers: basic customer information;
• Cdr: call data records aggregated by month;
• Services: basic information concerning service subscripted;
• Revenues: basic billing data aggregated by month.
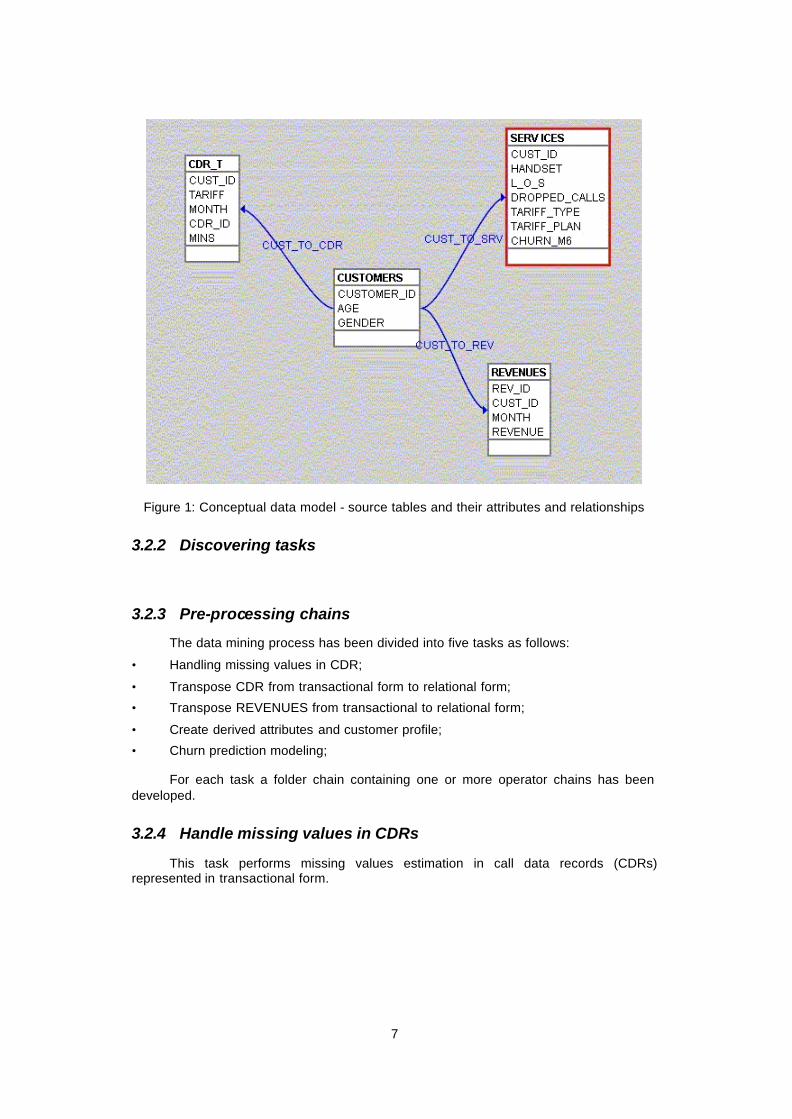
The Figure 1 depicts source tables and their attributes and relationships.
CUSTOMERS table: contains customer information: a key that identifies customers in the source systems and other basic information, e.g., age and gender.
CDR_T table: contains call data records (CDRs) in transactional form. Each record provides the duration of a specific type of calls (peak, off peak, weekend, international calls) aggregated on a monthly basis (5 months are available: month labels are from 1 to 5).
SERVICES table: contains basic information concerning service subscripted by customers, such as: handset (cell-phone model/class), length of service (contract duration in months), number of dropped calls, tariff plan and tariff type used for billing, and target attribute, that is, the churn state in month 6.
REVENUES table: contains basic billing data in transactional form. Each record provides the revenue (difference between income and costs) related to each user aggregated on a monthly basis (from month 1 to month 5).
7
Figure 1: Conceptual data model - source tables and their attributes and relationships
3.2.2 Discovering tasks
3.2.3 Pre-processing chains
The data mining process has been divided into five tasks as follows:
• Handling missing values in CDR;
• Transpose CDR from transactional form to relational form;
• Transpose REVENUES from transactional to relational form;
• Create derived attributes and customer profile;
• Churn prediction modeling;
For each task a folder chain containing one or more operator chains has been developed.
3.2.4 Handle missing values in CDRs
This task performs missing values estimation in call data records (CDRs) represented in transactional form.

8
• Sel customers having miss vals: Filter out all those customer for whom at least one CDR in the set of CDRs generated by the customer features a missing value. A list of keys of customers with missing values in associated CDRs is generated.
• Sel incomplete CDR: Select incomplete CDRs (CDRs with missing values) by joining the list of customers keys generated by the “Sel customers having miss vals node” and the CDR table.
• Segm by customer: Create a view containing incomplete CDRs for each customer.
• Segm by tariff: Create a view containing incomplete CDRs for each tariff and customer.
• Build miss vals estimation: Substitute any missing value in a CDR with the average of the attribute values availabe in the CDR. Adds the result to the CDR view.
• UnSegm by tariff: Rebuild incomplete CDR views for each tariff and customer.
• UnSegm by customer: Rebuild incomplete CDR views for each customer. The result consists of incomplete CDRs where missing values have been filled in using the estimate provided by “Build miss vals estimation” node.
• Sel complete CDR: Select CDRs with no missing values.
• Merge complete and incomplete CDRs: Merge complete and incomplete CDRs (by substituting missing values with their estimates).
• Assign estimated miss vals: Assign missing values their estimation.
9
• Store transactional CDR: Store transactional CDRs by joining CDRs and customer records by customer key. Discard attributes used to perform the missing values estimation process.
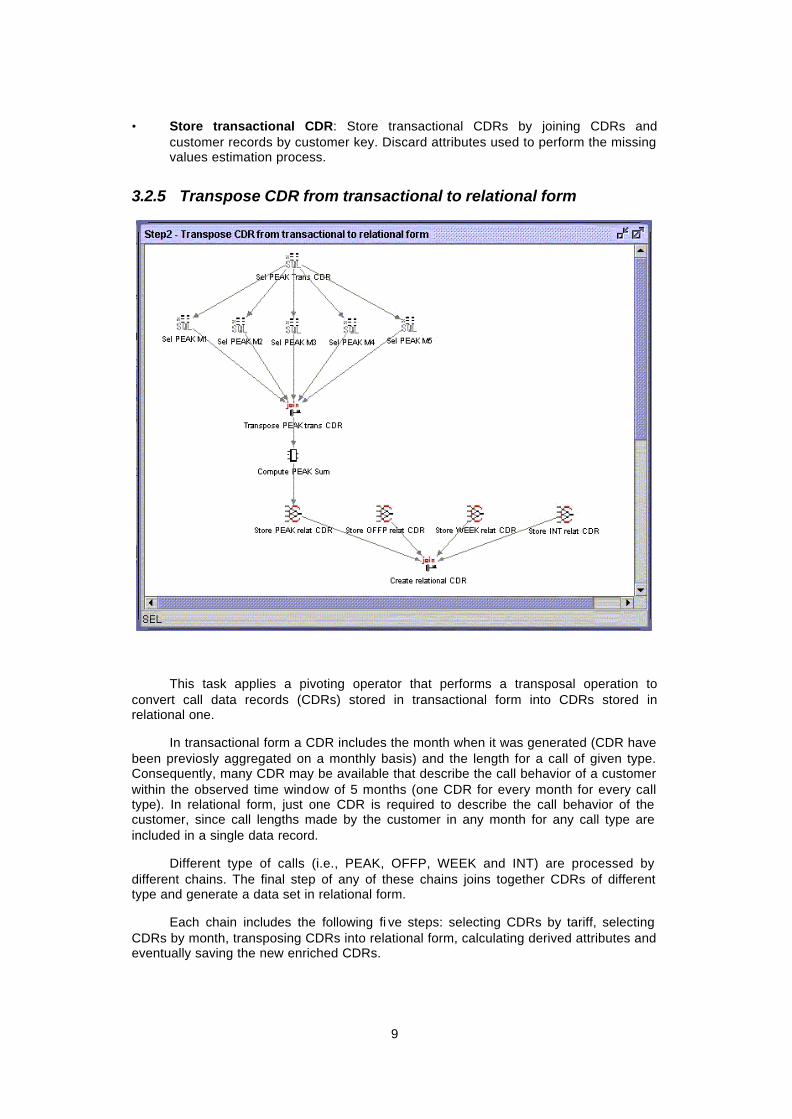
3.2.5 Transpose CDR from transactional to relational form
This task applies a pivoting operator that performs a transposal operation to convert call data records (CDRs) stored in transactional form into CDRs stored in relational one.
In transactional form a CDR includes the month when it was generated (CDR have been previosly aggregated on a monthly basis) and the length for a call of given type. Consequently, many CDR may be available that describe the call behavior of a customer within the observed time window of 5 months (one CDR for every month for every call type). In relational form, just one CDR is required to describe the call behavior of the customer, since call lengths made by the customer in any month for any call type are included in a single data record.
Different type of calls (i.e., PEAK, OFFP, WEEK and INT) are processed by different chains. The final step of any of these chains joins together CDRs of different type and generate a data set in relational form.
Each chain includes the following fi ve steps: selecting CDRs by tariff, selecting CDRs by month, transposing CDRs into relational form, calculating derived attributes and eventually saving the new enriched CDRs.

10
• Sel PEAK trans CDR: Select transactional CDRs associated with calls of PEAK type.
• Sel PEAK M1 … Sel PEAK M5: Select CDRs associated with calls of PEAK type performed in a specific month (from M1 to M5).
• Transpose PEAK trans CDR: Convert CDRs associated with calls of PEAK type from the transactional form to the relational one. Indeed, it first joins together all selections generated by “Sel PEAK M1 … Sel PEAK M5” node and then renames CDRs so that the new name recalls the call type (e.g., PEAK) and the month when the call was generated (labels from M1 to M5).
• Compute PEAK Sum: Add to CDRs associated with calls of PEAK type a new attribute that sums up the duration of all calls performed from month M1 to month M5.
• Store PEAK relat CDR: Save CDRs associated with calls of PEAK type by joining CDRs and customer records by customer key. It discards attributes that were used to support the pivoting operation.
• Create relational CDR: Join together all CDRs associated with different call types, i.e., PEAK, OFFP, WEEK call types.
3.2.6 Transpose REVENUES from transactional to relational form
This task applies a pivoting operator that performs a transposal operation to convert REVENUES records stored in transactional form into REVENUES records stored in relational one.

11
The pre-processing chain transposes revenue records from the transactional form into the relational one. Four processing steps are required: selecting revenue records by month, converting revenue records into relational form, calculating derived attribute and eventually saving the new revenue records.
• Sel REV M1 … Sel REV M5: Select revenue records associated with calls originated in a given month (from M1 to M5).
• Transpose REV trans CDR: Convert revenue records from a transactional form into a relational one. This node joins together revenue records selected by the “Sel REV M1 … Sel REV M5” node. Every selected revenue attribute is renamed by appending a suffix that provides the month when the call was originated to a prefix (namely, REV) that reminds that it is a revenue record.
• Compute REV Sum: Add a new attribute that sums up the revenue of calls originated from month M1 to month M5.
• Store REV relat CDR: Save revenue records by joining revenue records in relational form and customer records by customer key. Attributes used to perform the pivoting operation are discarded.
3.2.7 Create derived attributes and customer profile
This task extends information power of source data. Construction operators are applied to create new attributes that provide interesting knowledge about the customer behavi or at a higher level of detail with respect to CDRs. Derived attributes are joined together in a new customer profile table. The pre-processing chain includes the following nodes:
• Create ALL measures: Calculate call duration by aggregating CDRs on a monthly basis. Adds duration of peak, off peak, week and international calls for every single month – from month M1 to M5.
• Derive ALL measures: Calculate call duration at the month level of aggregation.

12
• Create USAGE measure : Calculate difference between call durations for different time lags. That is, four differences (namely ALL_DV51, ALL_DV52, ALL_DV53, ALL_DV54) are computed by subtracting call duration at months M1, M2, M3 and M4, respectively, from call duration at month M5. Further, slope of the straight line (ALL_ANG51) that passes through the points whose Y coordinates are the call durations at month M1 and M5 is computed.
• Sel Customers by plan: Selects customers by tariff plan. There exists 3 tariff types (CAT, PLUS and PLAY). Investigation was focussed on CAT and PLAY plans as the most interesting ones.
• Derive service measures: Apply a discretization operator to dropped call attribute DROPPED_CALLS and lenght of service attribute L_O_S. Q_O_S BAND and L_O_S band attributes are derived.
• Create revenue : Apply a discretization operator to the attribute providing overall revenue by customer (REV_TOT_SUM). VALUE_BAND attribute is derived.
• Create customer profile: Join new attributes created in the previous steps.
3.2.8 Churn modeling chain
This task is aimed at building a predictive model for each of the four groups of customers originated by segmenting customers according to their value (basically, customers are grouped according to the value of attribute VALUE_BAND).
Four similar processing chains have been defined. Every chain includes the following steps:
• Sel HIGH value customers: High value customers are selected.
• Create a random sample: A random sample is drawn to create a training set.
• model HIGH churners pred: The decision tree operator is applied to fit the data in the training set and create a model that predicts the likelihood of a customer to become a churner in the month M6.
13
• Store HIGH churners pred: Save output of the modeling stage in a view table, so that performance evaluation of the final model can be carried out.
4 Evaluation
As mentioned in the chapter “Evaluation Criterias”, the evaluation task focussed on the following topics:
• Usability.
• Mining process speed-up.
• Scalability.
• Mining process quality.
• Integrability (into the business processes).
4.1 Usability
MiningMart’s Human Computer Interface builds upon a state-of-the-art visual programming approach. Preprocessing chains may be created just dragging operators icon into the application framework and adding links to chain them. This is a very effective manner to perform discovering tasks. (Preprocessing chains are sequence of preprocessing operators that depend on each other. They are of paramount importance since while preparing raw data several transformation steps are necessary, where the output of the previous operator becomes the input of the one which follows in the chain).
The interface look -and-feel is quite good and it reveals user-friendly. Few steps are required to implement any data mining process, and meta data helps the user in selecting the right ones. The flow of control is rather clear and well documented.
Interface quality compares to the one of leading commercial tools (e.g., SPSS Clementine, SAS Enterprise Miner).
With MiningMart, best practices can be easily pre-packaged. Indeed, the tool allows each user to store entire chains of pre-processing and analysis steps for later re-use in a case-base (for example, a case of pre-processing for churn analysis, or a case of pre-processing for monthly business reports). This way, libraries of data mining applications may be developed and customized to satisfy new business requirements.
Further enhancements
Should MiningMart be enhanced, we suggest putting some effort to further simplify the Definition of Concepts stage, for example by making it possible to define new attributes by directly editing table column names.
4.2 Mining process speed-upLess trial and error pre-processing and analysis cycles are required to develop the data mining solution by using MiningMart. Indeed:
• Meta data and operator constraints drive unskilled users to build correct and effective analytical applications;
• The case-base of pre-processing and analysis tasks assists in the exploitation of experienced guidance from past successful applications. More, when analysis tasks are repeated regularly, the case base of stored discovery tasks can be used and the same steps need not to be repeated.

14
In the churn analysis case study, the preprocessing stage took 2.5 days by using MiningMart (2 data miners working full time). The same tasks was carried out in 12 days by using standard sql-based preprocessing tools.
A saving of almost 80% time was obtained.
• Users achieve a better understanding of data underlying structure by browsing source and processed data while computing descriptive statistics and transforming data.
• Processing chains can be quickly tested during chain set-up.
• Processing chains can be saved an restored, allowing versioning.
• Multistep and loopable operators enable users to define parallel mining tasks consistently and effectively.
Further enhancements
Should MiningMart be enhanced, we suggest developing more powerful graphical investigation features and improving workgroup enabling features, e.g., multiple users capabilities, definition of user roles and access rights.
4.3 ScalabilityKDD systems that have to load all data for data mining into main memory cannot handle large data volumes. MiningMart provides a new work-share between datawarehouse and KDD operators so that it can minimize the amount of data kept within KDDSE and perform extensive processes directly within the datawarehouse.
This claim was verified by running the pre-processing task described in section 3.2.2 on datasets of increasing size.
MiningMart server (compiler and data base) was installed on a SUN E450, 4 400MHz CPUs and 4Gb RAM. Raw data tables were stored in a Oracle 9.1 data base with table partitioning. Data sets of 8000, 800,000, and 2,000,000 records with 20 attributes were created. Notice that 40 more new attributes are created during the construction stage aimed at increasing the information power of data.
The time required to perform the pre-processing task is shown in the table below. As it can seen, MiningMart scales linearly. This is due to its fully leveraging on Oracle scaling capability. Overhead due to parsing of operators is negligible, unless for very small datasets.
data set size (# of tuples) Pre-processing time (mins)
8,000 60 800,000 600
2,000,000 1200
Conversely, modeling operators currently implemented in MiningMart have not been optimized, so they scale exponentially.
4.4 Mining process qualityTransforming raw data into a high-value basis for discovery is a time-consuming task, but it is also the most import ant step in the knowledge discovery cycle. and a particular challenge in real world applications. •
MiningMart makes available a set of transformation tools/operators to ease this task. In particular, a number of tools are aimed at assisting the user in selecting
15
appropriate samples, aggregating data to change its level of detail, discretizing numeric data, and reducing the dimensionality of data. and changing the level of detail of the data by means of aggregation operators, according to the task and/or the algorithm used. By automating these time-consuming tasks, the likelihood of doing processing mistakes decreases.
Similarly, MiningMart framework avoids potential conceptual mistakes by enforcing chain consistence and correctness.
In addition, quality of mining results improves as MiningMart makes it possible to build libraries of data mining applications that can be tailored to meet new business requirements.
However, the main measure for the quality of data mining results is their accuracy on test data. Consequently, a comparison was done in the framework of the case study between the predictive performance of MiningMart with the one obtained in the past using alternative mining technologies. The predictive accuracy of the model generated by MiningMart is slightly less than the one of the original model (79% vs. 82%). This is a very good result since MiningMart implements just a basic version of a source-free decision tree algorithm.
4.5 Integrability into the business process
The MiningMart system can be integrated into an Analytical CRM platform as the analytical extension of either the enterprise data warehouse or the business-oriented data marts.