ministry of transport republic of latvia development of ...€¦ · ministry of transport republic...
TRANSCRIPT

Ministry of Transport
Republic of Latvia
Development of Riga and Pieriga
Mobility Plan
No. SM 2009/07/FM-KF-TP/01/02-01
THIRD INTERIM REPORT
Variants
Mobility Plan Riga and Pieriga
Tornu iela 4, III C, office no. 203
Riga, LV-1050
Latvia
Phone: +371 7 223 144
Fax: +371 7 223 830

LET106-1 Development of Riga and Pieriga Mobility Plan THIRD INTERIM REPORT Variants, final version, dated June 9, 2010 1
INDEX P.
MANAGEMENT SUMMARY 3
1. INTRODUCTION 12 1.1. Objective of the RPMP 12 1.2. Report outline 12
2. APPROACH FOR VARIANT DEVELOPMENT 13 2.1. Development process 13 2.2. Level of detail of variants 14 2.3. Level of ambition of variants 14
3. DESCRIPTION REFERENCE SCENARIO 15 3.1. Introduction 15 3.2. Background scenario 15 3.3. Policy scenario 17
4. TRANSPORT SYSTEM VARIANTS 21 4.1. Introduction 21 4.2. Principles for development of realistic variants 21
4.2.1. Main philosophy 22 4.2.2. Traffic analysis 23 4.2.3. Road infrastructure development 24 4.2.4. Rail infrastructure development 26 4.2.5. Public transport development 27 4.2.6. Soft measures 27
4.3. Basic set of measures for road and rail infrastructure 28 4.4. Basic set of measures for public transport 32 4.5. Variant A: sparse, high capacity main road network 41 4.6. Variant B: dense main road network 42 4.7. Variant C: use of the Southern bridge 43 4.8. Bicycle and pedestrian network 45
5. SOFT MEASURES 47 5.1. Demand management measures and road pricing 47 5.2. Parking 49 5.3. Public transport fares, tickets and organisation 50 5.4. Influence of quality of public transport on patronage, costs and revenues 53 5.5. Traffic management and control 54 5.6. Traffic safety measures 55 5.7. Marketing 56
6. MODELLING RESULTS 58 6.1. Base year 2007 58 6.2. Reference variant 58 6.3. Results Variant A 59 6.4. Results Variant B 62 6.5. Results variant C 64 6.6. Discussion modelling results 65
7. STRATEGIC ENVIRONMENTAL IMPACT ASSESSMENT 67 7.1. Screening and scoping 67

LET106-1 Development of Riga and Pieriga Mobility Plan THIRD INTERIM REPORT Variants, final version, dated June 9, 2010 2
7.2. Strategy for the RPMP 68 7.3. Activities for the next phase 69
8. ECONOMIC COST BENEFIT ANALYSIS 70 8.1. Introduction 70 8.2. Basic assumptions 70 8.3. Methodology 70 8.4. Costs 72 8.5. Benefits 73 8.6. Cost benefit analysis 78 8.7. Conclusion 80
9. FINANCIAL SOURCES 81 9.1. Type of budgets relevant to RPMP 81 9.2. Budgets 81 national budgets 82 Riga City Council 82 9.3. Scenario development 82 9.4. Total Riga and Pieriga budget available for (main) transport infrastructure development 83 9.5. RPMP investments and budget requirements 84 9.6. Latvia liability limits 86 9.7. PPP road projects and private funding 88 9.8. Loans, EBRD and EIB 90 9.9. Conclusion 91
10. CONCLUSIONS AND RECOMMENDATION 92 10.1. Multi criteria assessment 92 10.2. Conclusion 94 10.3. Recommendation 95 10.4. Elaboration preferred variant 95
Appendices number of pagesI Reference networks (mini)bus and train 7II Road traffic analyses 8III Analysis rail capacity 2IV Measures road network Riga 2V Measures road network Pieriga 1VI Investigation Pieriga 19VII Public transport measures 12VIII Crossing the railways 2IX Examples of traffic control improvement 2X Traffic safety analysis 2XI Reconstruction state roads 2007-2011 3XII Modelling results base year 2007 5XIII Modelling results reference variant 2025 6XIV Modelling results Variant A 8XV Modelling results Variant B 8XVI Modelling results Variant C 8XVII Modelling results alternative measures variant A 7XVIII Calculation of investment amounts CBA 6
LET106-1 Development of Riga and Pieriga Mobility Plan THIRD INTERIM REPORT Variants, final version, dated June 9, 2010 3
MANAGEMENT SUMMARY
approach
In the third task for the development of the Riga and Pieriga Mobility Plan (RPMP) four variants have been developed for the structure of the transport system: the reference variant and three realistic vari-ants. The variants have been developed in three steps:
- test scenarios: the possibilities for the transport system in Riga and Pieriga have been explored with test scenarios in the transport model;
- reference variant: a reference variant has been developed based on the current situation com-bined with infrastructure developments which are currently (2010) being built or contracted as well as demographic and economical trends. The reference variant is used as a basis for com-parison;
- realistic variants: three RPMP variants have been developed based on the RPMP objectives, re-sults of the problem analysis, results of the test scenarios, expert judgement and existing plans and ideas.
The reference variant and the RPMP variants have been assessed with a traffic model analysis, a cost-benefit analysis and a multi criteria analysis. The variants give a proposal for the main road, rail and public transport structures in Riga and Pieriga. Based on the results a choice can be made for the fu-ture structure of the transport system. In the next phase of the project the chosen road hierarchy will be elaborated, detailed measures are added and the mobility plan and action program will be completed for both Riga and Pieriga. main philosophy The three RPMP variants consist of the reference variant added with a basic set of measures which is included in all three variants and additional, distinguishing measures. The three variants represent sev-eral main choices which have to be made for the transport system. The idea for the combination of the basic set of measures and the sets per variant is to further develop a road hierarchy in Riga and Pieriga, to complete and improve the network of main roads and to guide traffic as much as possible to the main road network. This basis enables an improvement of liveability and public space in the areas within the main road structure and opens possibilities for public transport and non-motorized transport. The philosophy is in line with the main objectives for the transport system that have been agreed upon in a previous stage. basic measures
The previous modelling and analysis activities have clearly shown important bottlenecks and drawbacks in the transport system, which can be solved with the proposed measures in the RPMP. Several main measures have been identified, which are at least necessary to improve the traffic and transport situa-tion. These measures form the basic set of measures, which is included in all variants. The main measures included in the basic set are:
- completion of connections to the Southern bridge (stage 3 from Southern bridge till A7); - downgrade of Akmens bridge (not in variant C) and traffic calming in the Riga city centre; - introduction of a one-way street system to solve bottlenecks on radials crossing the eastern rail-
way loop; - improvement of the port connection (rail track in reference); - cohesion fund project E22 Riga-Koknese; - reconstruction of E77/A2, section between the Riga bypass and Senite and of E67/A4 Riga by-
pass, section between the A6 and the A2; - construction of the E67/A7 Kekava bypass; - improvement of the public transport network in Riga and Pieriga, with passenger train, tram and
trolleybus as backbone.
LET106-1 Development of Riga and Pieriga Mobility Plan THIRD INTERIM REPORT Variants, final version, dated June 9, 2010 4
RPMP variants
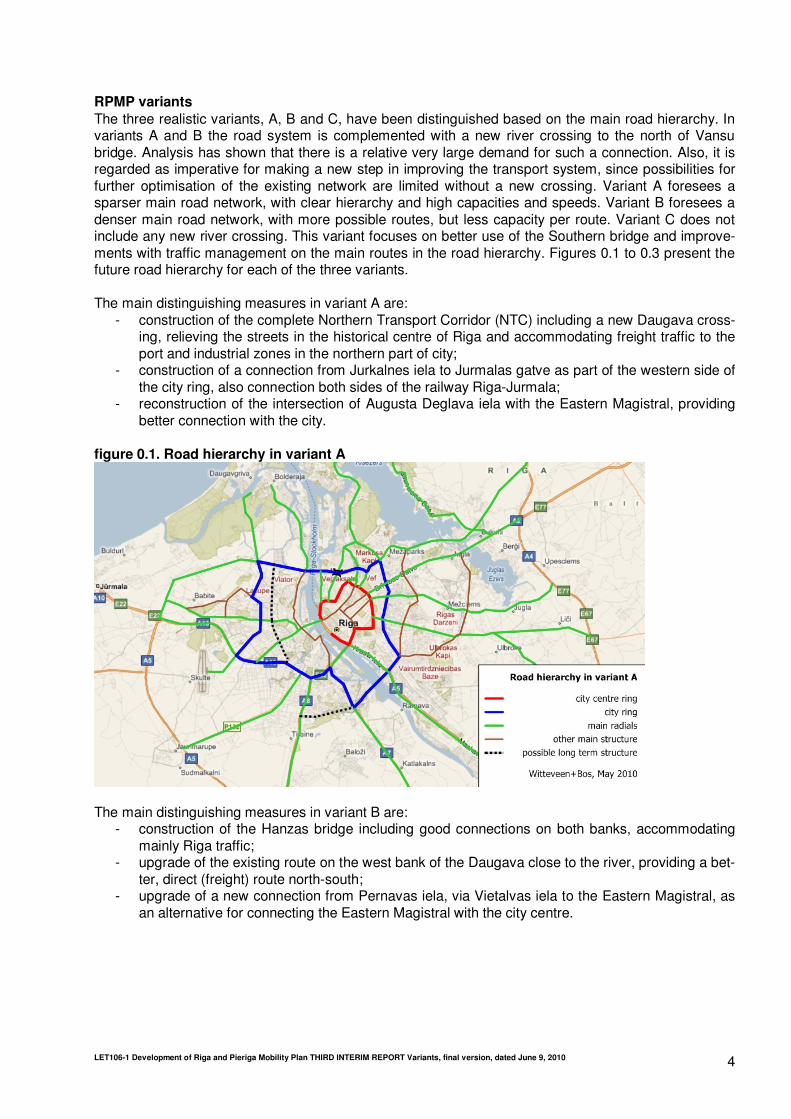
The three realistic variants, A, B and C, have been distinguished based on the main road hierarchy. In variants A and B the road system is complemented with a new river crossing to the north of Vansu bridge. Analysis has shown that there is a relative very large demand for such a connection. Also, it is regarded as imperative for making a new step in improving the transport system, since possibilities for further optimisation of the existing network are limited without a new crossing. Variant A foresees a sparser main road network, with clear hierarchy and high capacities and speeds. Variant B foresees a denser main road network, with more possible routes, but less capacity per route. Variant C does not include any new river crossing. This variant focuses on better use of the Southern bridge and improve-ments with traffic management on the main routes in the road hierarchy. Figures 0.1 to 0.3 present the future road hierarchy for each of the three variants. The main distinguishing measures in variant A are:
- construction of the complete Northern Transport Corridor (NTC) including a new Daugava cross-ing, relieving the streets in the historical centre of Riga and accommodating freight traffic to the port and industrial zones in the northern part of city;
- construction of a connection from Jurkalnes iela to Jurmalas gatve as part of the western side of the city ring, also connection both sides of the railway Riga-Jurmala;
- reconstruction of the intersection of Augusta Deglava iela with the Eastern Magistral, providing better connection with the city.
figure 0.1. Road hierarchy in variant A
The main distinguishing measures in variant B are:
- construction of the Hanzas bridge including good connections on both banks, accommodating mainly Riga traffic;
- upgrade of the existing route on the west bank of the Daugava close to the river, providing a bet-ter, direct (freight) route north-south;
- upgrade of a new connection from Pernavas iela, via Vietalvas iela to the Eastern Magistral, as an alternative for connecting the Eastern Magistral with the city centre.

LET106-1 Development of Riga and Pieriga Mobility Plan THIRD INTERIM REPORT Variants, final version, dated June 9, 2010 5
figure 0.2. Road hierarchy in variant B
The main distinguishing measures in variant C are:
- upgrade of the existing route on the west bank of the Daugava close to the river, including a new tunnel connecting Ranka dambis directly to Mukusalas iela, with this route being the major north-south route for years to come;
- upgrade of a new connection from Pernavas iela, via Vietalvas iela to the Eastern Magistral, as an alternative for connecting the Eastern Magistral with the city centre;
- implementation of an extensive traffic management system on the main radials with a focus on the routes connecting to the Southern bridge.
figure 0.3. Road hierarchy in variant C1
1 Vansu bridge is part of the city ring in this variant, however this bridge is not accessible for heavy freight traffic

LET106-1 Development of Riga and Pieriga Mobility Plan THIRD INTERIM REPORT Variants, final version, dated June 9, 2010 6
cost benefit analysis
Table 0.1 presents the results of the cost benefit analysis for the three variants. Variants A, B and C are all economically feasible variants with (quite) high rates of return on investment. Variant A scores better than C, and C better than B. It should be noted, though, that next to the cost benefit analysis, all vari-ants need to be judged upon the ability to reach the objectives for the transport system (see previous reports and this report). table 0.1. Summary of CBA results
Variant A Variant B Variant C
Total amount of in-vestments (MEuro)
2,088 646 576
Economic value of in-vestments (MEuro)
1,637 507 451
EIRR (%) + 11.4 % + 6.6 % + 8.4 % ENPV (5.5%, MEuro) + 1,075 + 73 + 119 Funding of variants A and B (to a lesser extent) might prove difficult. The main types of budgets avail-able for transport infrastructure development in Riga and Pieriga are from the EU, Latvian State Roads and Riga City Council. For these budgets an inventory has been made of current (and historic) budgets relevant to invest in (new) infrastructure. A projection is prepared based on the economic growth fore-cast for Latvia. Four scenario’s have been developed for these budgets, in which the uncertainty of EU budgets in the next programming period is emphasized, and the Latvian transport investment budgets and the share of EU funds attributed to Riga and Pieriga are also included. The size of these budgets in the scenario’s is compared with the budgets required for the realization of the RPMP variants. In principle it can be concluded for Variants B and C that, even in the Low scenario, it appears possible to fund the investments from budgets and loans (for (pre)financing), especially when these can be phased for several years. For Variant A (including NTC) it appears that funding might be possible only in very favourable conditions, but this will probably be quite difficult. Several laws and regulations and obligations to international lenders severely limit the capacity of Lat-vian public authorities to borrow funds or increase liabilities in another way. PPP projects combined with EU-co-funding are unlikely to be realized in the short term, because this is very complex set-up which has very few successful examples in Europe so far. PPP results in a liability to the public authorities, unless the capital and maintenance costs can be fully paid by the road users. However, from preliminary studies this appears to be an unlikely situation. traffic model results In this third interim report the transport model and CBA results of three RPMP variants and the refer-ence variant are presented. The variants consist of a package with basic measures and several distin-guishing measures per variant. They follow the philosophy of implementing a road hierarchy with main roads to accommodate interurban traffic and local roads for dwelling and local traffic. The results show that this philosophy does work well for variants A and B. Variant C does have a less clear road hierar-chy due to the limited investments. Table 0.2 gives a summary of the results of the traffic model for the reference variant and the variants A, B and C. Compared to the reference the variants show a longer trip distance, especially in variants A and B. Due to the introduction of a new river crossing more cross river trips are made. This means that there is an increase in mobility and connectivity in these variants. This increase results in mobility bene-fits for the inhabitants of Riga and Pieriga. The slight increase in trip distance in variant C is related to an increase in traffic via the Southern bridge.

LET106-1 Development of Riga and Pieriga Mobility Plan THIRD INTERIM REPORT Variants, final version, dated June 9, 2010 7
Furthermore, the variants show an increase in average travel speed compared to the reference. This indicates that there is a reduction in delays and congestion and a better traffic circulation. Especially in variant A there is a large improvement of 9% in travel speed. Variant B shows an improvement of 2%. In variant C there is only a marginal improvement in travel speed compared to the reference. On the routes towards the Southern bridge there are considerable improvements in this variant, however, the small average improvement is caused by the introduction of a low speed zone in the city centre, which has large effect on the average travel times. The traffic model clearly shows that the road hierarchy in variant A leads to the most optimal traffic cir-culation. Also in variant B there is a clear improvement, however less than in variant A. Variant C shows only marginal positive effects compared to the reference variant. table 0.2. Summary of traffic model results for the three variants
Vari-
ant
Average travel time
(min/trip)
Average travel dis-
tance (km/trip)
Average travel speed
(km/h/trip)
Change in car trips
(compared to Ref)
Change in PT trips
(compared to Ref)
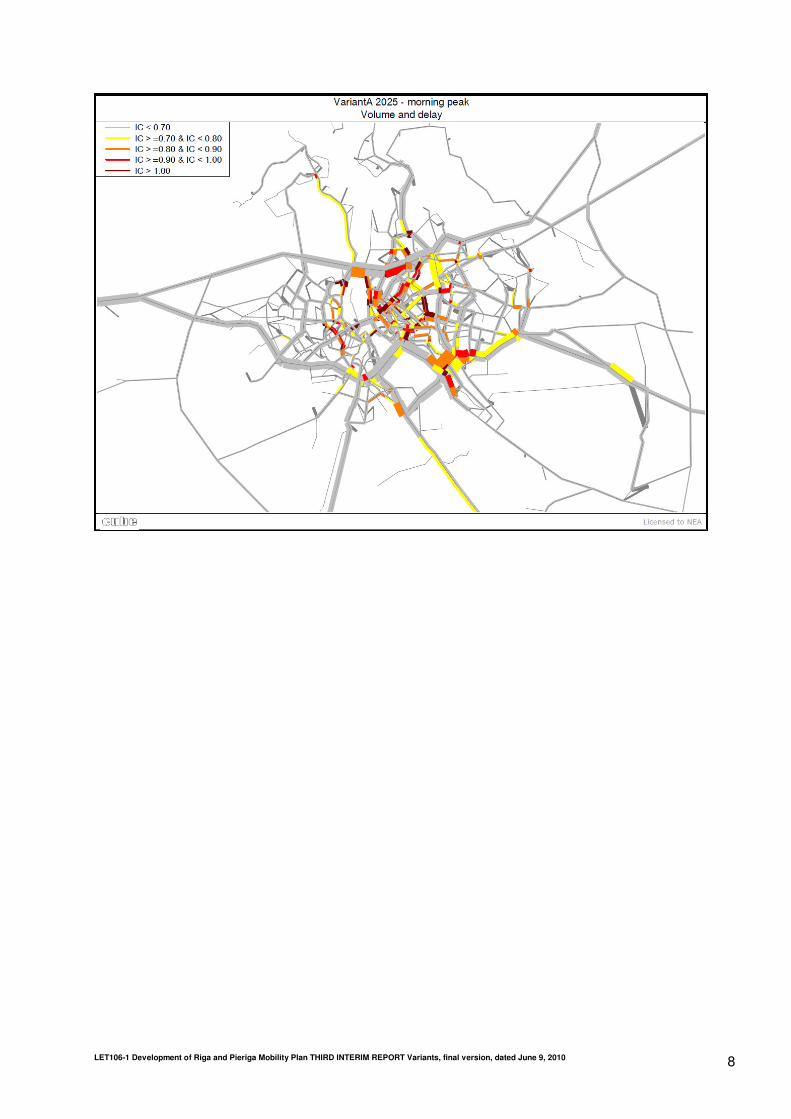
Ref 28,4 14,4 30,3 - - A 26,8 14,8 33,1 - 2.0 % + 18 % B 28,5 14,7 31,0 - 2.4 % + 18 % C 28,5 14,5 30,5 - 2.5 % + 18 % Figures 0.4 to 0.6 give an overview of the IC ratios2 in the morning peak for each of the proposed road hierarchies. figure 0.4. Intensity capacity ratios in the morning peak in the variant A 2025
2 The intensity capacity or volume capacity ratio is a measure for the level of service on the road network. Low ratios mean that there is
capacity left for extra traffic. High ratios mean that most capacity is in use and congestion can develop. Intensity capacity ratios close
to 1 or larger than 1 indicate congestion.
LET106-1 Development of Riga and Pieriga Mobility Plan THIRD INTERIM REPORT Variants, final version, dated June 9, 2010 8

LET106-1 Development of Riga and Pieriga Mobility Plan THIRD INTERIM REPORT Variants, final version, dated June 9, 2010 9
figure 0.5. Intensity capacity ratios in the morning peak in the variant B 2025
figure 0.6. Intensity capacity ratios in the morning peak in the variant C 2025

LET106-1 Development of Riga and Pieriga Mobility Plan THIRD INTERIM REPORT Variants, final version, dated June 9, 2010 10
multi criteria analysis
table 0.2. Results multi criteria analysis
Criterion Variant A Variant B Variant C
Coherent road hierarchy ++ + 0 Network robustness ++ + 0 Connections of Riga Freeport ++ + 0 Connection of Riga airport + + + Accessibility Pieriga ++ + + Multi modal accessibility ++ ++ + Public transport development ++ ++ + Congestion reduction ++ ++ + Mobility ++ + 0 Durability for future developments ++ + 0 Concurrence with existing plans ++ 0 0 Traffic safety ++ + + Liveability in Riga ++ + + Use of existing infrastructure in Riga -- - 0 Effect on nature and landscape -- - - Investment costs -- - 0 Travel time gains ++ + 0 IERR ++ + + The multi criteria analysis shows that both variants A and B score better than the reference situation and variant C. On most criteria variant A has the best scores. This is related to the extra infrastructure in this variant. On three criteria variant A scores worse than the other variants, e.g. on investment costs and environmental burden. conclusion Variant A has a sparse main road structure including construction of the NTC. This variant has the larg-est positive effects on the functioning of the transport system, but also the largest investments and the largest impact on the environment. However, the investments turn out positive in the cost benefit analy-sis due to the large benefits of this variant. Variant B has a more dense main structure with construction of the Hanza crossing. Also this variant has quite large positive effects on the functioning of the trans-port, but this variant is less positive in the CBA than variant A, due to less benefits. Variant C has only a small positive impact on the functioning of the transport system in line with the small investments. This variant turns out positive in the CBA, but performs worse than other variants on the other instruments used (modelling and MCA). This variant clearly shows that real investments are necessary to improve the functioning of the traffic and transport system on the longer term. recommendation
Based on the results of traffic modelling, the cost-benefit analysis and the multi criteria analysis variant A clearly achieves the best results for the RPMP. Therefore, the recommendation is to choose this vari-ant as preferred variant. Financing of the Northern Transport Corridor, which accounts for 75% of the variant’s costs, is an important condition for this variant and needs to be studied in the next phase to-gether with the Client. The method of financing of the NTC is also part of the ongoing NTC study and therefore the latest information / possibilities from the ongoing study will be used for the final report of

LET106-1 Development of Riga and Pieriga Mobility Plan THIRD INTERIM REPORT Variants, final version, dated June 9, 2010 11
the RPMP. In the mean time further study can be conducted as to how to simplify the design, to save on investment costs.
LET106-1 Development of Riga and Pieriga Mobility Plan THIRD INTERIM REPORT Variants, final version, dated June 9, 2010 12
1. INTRODUCTION
This document is the third interim report for the Mobility and Action Program for Riga and Pieriga (RPMP). This report presents the approach for the variant development, the variants which have been developed and the assessment of the variants. 1.1. Objective of the RPMP
The RPMP is meant to create an overall framework in which all existing and new plans for construction and improvement of the traffic and transport system are evaluated and prioritised. The plan has to pro-vide solutions for the traffic and transport problems which the Ministry of Transport of Latvia is facing, contributing to spatial, ecological, economical, social and institutional optimization. The RPMP has the following overall goal: ‘To determine a vision and necessary actions in order to
promote unified traffic system development in Riga and Pieriga, thus improving accessibility of
the territory’.
The development of the RPMP is accomplished in six tasks:
- task I: description and analysis of the current situation; - task II: definition of vision and sub-objectives; - task III: traffic modelling; - task IV: development of transport system variants; - task V: development of the recommended transport system variant; - task VI: development of an action program.
1.2. Report outline
This report presents the main results of task IV: the development of transport system variants. The sec-ond chapter starts with an explanation of the approach which has been used for the development of variants. In a first step three extreme theme variants have been developed to explore the possibilities for Riga and Pieriga. Simultaneously with the theme variants, a reference variant (‘do nothing extra’) has been developed. In the second step, based on transport modelling results for these theme variants, three realistic RPMP variants have been developed. The reference variant is described in chapter three and the realistic variants in chapter four. The results of the first step, for the theme variants, are not in-cluded in this report. A separate report is available which describes these results. Additional soft measures, which will be included in the preferred variant, are described in chapter five. The modelling results for the RPMP variants and the reference variant are described in chapter six, the strategic environmental impact assessment in chapter seven and the cost benefit assessment in chap-ter eight. Chapter nine analyzes the available financial funds for the RPMP. Finally, chapter ten gives conclusions and recommendations for the choice of the preferred variant.

LET106-1 Development of Riga and Pieriga Mobility Plan THIRD INTERIM REPORT Variants, final version, dated June 9, 2010 13
2. APPROACH FOR VARIANT DEVELOPMENT
2.1. Development process
Figure 2.1 presents an overview of the variant development process. In the previous tasks the objec-tives for the RPMP have been established and possible measures and projects for the Riga and Pieriga transport system have been identified. In the first step of the variant development three so-called theme variants have been developed, based on themes, with a focus on different aspects of the transport system: 1. focus on accessibility, connectivity and road infrastructure (the ‘economy’ theme); 2. focus on public transport competitiveness (the ‘environment’ theme); 3. focus on reducing traffic hindrance and establishing traffic calmed areas (the ‘liveability’ theme). With these theme variants diverse (extreme) possibilities for the transport system in Riga and Pieriga have been explored. They have been used as test scenarios for the transport model that was devel-oped in the previous task. The model results provided insight into maximum possibilities and effect of sets of measures. With the theme variants the transport model has been optimally used, through im-plementation of clearly distinguishable sets of measures. Simultaneously with the theme variants, a reference variant has been developed. This reference variant consists of the current situation combined with infrastructure developments which are currently (2010) being built or contracted as well as demographic and economical trends. The reference variant is used as a basis for comparison. figure 2.1. Variant development process
LET106-1 Development of Riga and Pieriga Mobility Plan THIRD INTERIM REPORT Variants, final version, dated June 9, 2010 14
In the second step three realistic RPMP variants have been developed, based on the results of the pre-vious step. The RPMP variants consist of a combination of components of the theme variants, added with more detailed measures. The reference variant and the RPMP variants have been modelled and assessed with a cost-benefit analysis. On the basis of this assessment a recommendation for the pre-ferred variant is given. 2.2. Level of detail of variants
The RPMP is meant to be a planning document which guides the development of the transport system on the short (7 years), medium (12-15 years) and long term (20-30 years). The RPMP variants describe projects and measures to be implemented on the short and medium term. These measures have been assessed with the traffic model and a cost-benefit analysis. For the preferred variant also an action pro-gram for the first 7 years will be developed as well as a strategic outline for the long term. The action program gives a prioritization of measures to be elaborated and implemented on the short term. The RPMP gives a first description of these measures, but does not include designs. Before implementing measures additional feasibility and traffic engineering studies need to be conducted. The variants described in this report have been developed on the level of network structures. Measures relate to the main transport system structure and the functioning of this system. For the preferred vari-ant, elaborated in task V, the measures will be detailed on route level. Furthermore, for strategic loca-tions in the network first outline drawings will be prepared, e.g. outlines for reconstruction of several im-portant intersections. Additionally, the elaboration of the preferred variant will include plans for non-infrastructural measures, related to efficiency and attractiveness of the transport system. 2.3. Level of ambition of variants There have been many feasibility studies in the past about possible new road works to increase acces-sibility and liveability. However, it is not realistic to include all plans in the RPMP variants for the me-dium term (till 2025). Firstly, because some projects are regarded as low priority (also as stated in the workshop on objectives and measures) or are exchangeable. The second main reason is the unlikeli-ness for major road and construction works to be finished within 15 years. So, when developing the variants, for Riga the following qualitative criteria for measures have been used:
- effectiveness for reaching the objectives as defined in previous tasks; - coherence with existing regional and municipal planning documents; - coherence with main philosophy, hence coherent with other measures; - flexibility for future developments; - a good cost-benefit ratio; - expected public and political support; - ease of implementation.
This basically means that measures have been selected that are either expensive, but considered fea-sible and imperative regardless of other developments (no regret), or relatively cheap and quick to im-plement (quick wins). Important is that in a different future context the measures will not be considered as a waste of money or obstacles for further development. For Pieriga the case is different, since possible measures are closer linked to local liveability issues and spatial planning, and many stakeholders are involved. Prioritisation of measures for inclusion in variants can not be done based on an inventory of problems and possible solutions (and available studies) alone. Just one major criterion has been used in this stage, which is the travel time benefits for the ag-glomeration, leading to better connectivity, economy and liveability in the agglomeration. For developing the preferred variant, further prioritisation will take place on the basis of expertise of the stakeholders (Latvian State Roads, municipalities) and on basis of additional analyses, such as on traffic safety.

LET106-1 Development of Riga and Pieriga Mobility Plan THIRD INTERIM REPORT Variants, final version, dated June 9, 2010 15
3. DESCRIPTION REFERENCE SCENARIO
3.1. Introduction
For the RPMP use has been made of the Extended Riga and Pieriga Model in order to assess different variants. The first step towards modelling the variants consists of a good and robust reference scenario (basis development variant). This scenario serves as a reference with which the variants will be com-pared. The reference scenario for the RPMP consists of two important elements:
- the background scenario; - the policy scenario.
Both elements are discussed below. For the RPMP one reference scenario is used. The use of one scenario is chosen in order to keep interpretation and analyses of the results transparent and simple. 3.2. Background scenario The background scenario provides an overview of the developments in population, employment, car ownership and GDP. We propose to use 2025 as a horizon for the forecasts. This is in line with the time frame of the project (12-15 years). For 2025, data about population, employment and car ownership in Latvia is not yet available. There-fore, data of existing scenarios for 2018 and 2030 (delivered by Rigas Geometrs) were used and inter-polated in order to get data for 2025. The second interim report provides a quick overview of the vari-ables for 2018 and 2030. The table below shows a summary of the data and the interpolated results for 2025.
table 3.1. Demographic data in reference scenario
variable 2007 2025
Latvia Riga Pieriga Latvia Riga Pieriga Population 2296699 722232 219940 2234733 704170 220000 Change (%) - - - - 2.7 % - 2.5 % 0.0 % Employment 1031466 409801 63334 1056686 424200 65600 Change (%) - - - 2.4 % 3.5 % 3.6 % Car ownership (% change) - - - 59.8 % 59.8 % 59.8 % Source: Data delivered by Riga Geometrs (2009), plus adaptations based on discussions with City
Council Riga
As can be seen, the growth figure for population is declining, while for employment a small growth is foreseen. The growth for population and employment varies per area. Also, for car ownership growth figures are used3. This growth is assumed to be equal for all areas. The figures for population, employment and car ownership have been compared against figures from the EU project iTREN-2030, which recently was finished for the European Commission4. The iTREN-2030 project aims at designing a powerful toolbox for EU transport policy making, by creating an inter-face of transport, economics, energy and environment. One of the sub goals of the project consists of the development of sound scenarios. These have been constructed by using different models as well as by using input from different stakeholders throughout Europe. The horizon of the scenarios is 2030, while intermediate years like 2025 were constructed as well. Comparison of the iTREN scenarios with
3 Relative figures are presented to avoid confusion on absolute numbers related to either using registered or using all vehicles in the car
ownership number 4 http://isi.fraunhofer.de/isi/projects/itren-2030/?pathAlias=/projects/itren-2030/

LET106-1 Development of Riga and Pieriga Mobility Plan THIRD INTERIM REPORT Variants, final version, dated June 9, 2010 16
the already available scenarios in Riga (for the long term development strategy), helps to see whether the available scenarios are realistic and robust. The iTREN-2030 project shows for Latvia a change in population between 2005 and 2020 of - 8 % and between 2005 and 2030 of - 12 %. After correction for the base year, it is estimated that the change in population between 2007 and 2025 (forecasted by iTREN) will be approximately - 9 %. The forecasted decline of the population in the iTREN project is sharper than the decline that has been used up to now in studies with the Riga Model. Nevertheless, a decline of 2.7 % in population growth for Latvia as a whole seems realistic, since it is an extrapolation of existing trends. For Riga and Pieriga some addi-tional assumptions were made5. The change for Riga is kept at - 2.5 % (which is similar to what has been used in earlier studies). For Pieriga, population size is kept constant. This reflects the urbanisation of Pieriga and the migration of population from the rest of Latvia to Pieriga. The population is relatively growing, compared to Riga. Concerning employment, the iTREN project shows a change in employment between 2005 and 2020 of - 10 %. Between 2005 and 2030 the change is estimated at - 19 %. After correction for the base and forecast year, the change in growth between 2007 and 2025 is estimated at - 10 %. This is in contrast with the scenarios that are currently used in Riga. While the iTREN project shows a decline (which is in line with the decline of the population), the current scenarios in Riga show a small increase of 3.5 %. This growth is assumed to represent a slight increase in labour participation, migration from the rest of Latvia to Riga/Pieriga and an extension of the retirement age (from 65 to 67). Also here, we decided to set aside the iTREN figures. The growth of car ownership is nearly equal in both iTREN and the Riga long term development strat-egy. The iTREN project shows an increase of 57.8 %, while the growth in the Riga scenario is 59.8. As these figures are nearly identical, they seem to be robust. Nevertheless, there is a question mark whether these figures are too high, considering the recent downfall in car ownership by 27 % in one year in the absence of a valid technical inspection (www.csdd.lv). However, it must be kept in mind that the iTREN car ownership includes the effects of the current economic crisis. Given the crisis, iTREN still predicts an increase of 57.8 %. Since the effects of the economic crisis are included in the figure for iT-REN, the growth of 59.8 % seems still realistic. Therefore the car ownership figures are not decreased. The GDP figures are retrieved from the iTREN project as there is no scenario available in the previous studies in Riga which includes the economic crisis. The forecast of the annual real growth in GDP by the Ministry of Finance was about 7 % up to the year 2010 and afterwards 6 % up to the year 2030.The GDP in iTREN shows an annual growth of 2.3 % up to 2025. It includes the effects of the current eco-nomic crisis. Currently, the iTREN figures seem more realistic for the period between 2007 and 2025. This figure will be used for forecasts for freight transport within, to and from Riga. The GPD growth is a general growth figure and does not vary per area. Last but not least, an assumption is made for costs of the car and for prices of public transport (bus, trolleybus, and tram) that have to be paid by the passenger, calculated per passenger kilometre. These costs in 2007 are estimated at an average of 0.06 LVL/pass.km for car and 0.03 LVL/pass.km for public transport. For the car these costs are the variable costs (amongst others fuel, maintenance). It is as-sumed that the costs of car and public transport will grow at the same pace between 2007 and 2025. This implies that the relative cost difference between car and public transport will be the same in 2025. One more aspect concerning the background scenario needs to be mentioned. Due to the removal of the port activities in the areas Andrejsala and Eksportosta from the east bank to the west bank of the Daugava river (Krievu sala), the number of employees in Andrejsala and Eksportosta zones will de-
5 These assumptions have been discussed with the Municipality of Riga.

LET106-1 Development of Riga and Pieriga Mobility Plan THIRD INTERIM REPORT Variants, final version, dated June 9, 2010 17
crease and the number in Krievu sala will increase. This will be discussed in the next section on the pol-icy scenario for the reference situation. 3.3. Policy scenario The policy scenario for the reference situation only contains projects which are currently (2010) in pro-gress or finished. The base year is 2007. Changes in infrastructure between 2007 and 2010 (like the Southern bridge) were taken into account. Below an overview is provided of the changes for road and public transport. Also, the removal of the port activities from Andrejsala and Eksportosta to Krievu sala is taken into account. The port activities concerning dry bulk are moved from Andrejsala and Eksportosta (east bank Dau-gava) to zone Krievu sala (west bank Daugava). The activities concerning general cargo are moved to Rīnūži, Kundziņsala, Jaunmīlgrāvis and Sarkandaugava. The employment related to the dry bulk and general cargo activities in Andrejsala and Eksportosta will be relocated as well (400 jobs). The other employment related to current activities and developments in the Riga spatial plan remains in this area. For road and rail transport the main projects listed in table 3.2 were included in the reference situation 2025. table 3.2. Main road and rail projects for reference 20256
ID project from to capacity speed
ref1 Dienvidu tilts (stage 1 + 2 Southern bridge)
Slavu iela round-about
Daugava West bank
2x3 lanes 70 km/h
ref2 Slavu ring (new connection)
Dreilini roundabout P2/Juglas iela 2x2 lanes 70 km/h
ref3 Extension Gustava Zemgala gatve (part of eastern arte-rial)
Gustava Zemgala gatve
Viestura Prospekts 2x2 lanes 70 km/h
ref4 Eastern arterial (up-grade)
Slavu iela Ieriku iela 2x2 lanes 50 km/h
ref5 Eastern arterial (up-grade)
Ieriku iela Gaujas iela 2x2 lanes 70 km/h
ref6 Eastern arterial (new connection)
Braslas iela Gustava Zemgala gatve
2x2 lanes 50 km/h
ref7 Slavu/Jugla ring road (upgrade)
Southern bridge A2 2x2/2x1 lanes
50/70 km/h
ref8 Rail connection current network Krievu sala ref9 E22 Riga-Koknese Ogre Viskali 2x1 lanes 90 km/h
Also, there are some minor projects considered finished in 2025: the intersection Vienibas gatve/K. Ulmana gatve in Riga, widening of part of Vienibas gatve (2 x 2 lanes), and a connection between Viestura prospects and Tvaika Iela.
It is well possible that in 2025 there will be a new river crossing as part of the Northern Transport corri-dor (NTC). Also, the road to the port (Daugavgrivas iela) on the west bank might be upgraded. There are also several other plans listed, like the Baltezers bypass, reconstruction of P5 Ulbroka-Koknese,
6 It is assumed that financial sources have already been allocated for the projects in the reference variant. Due to recent circumstances
it is not certain if finance is available for the finalization of the sections in the eastern arterial. Therefore, it should be kept in mind when
assessing the RPMP variants, that extra financial sources might be necessary for one or more projects which are included in the ref-
erence variant.

LET106-1 Development of Riga and Pieriga Mobility Plan THIRD INTERIM REPORT Variants, final version, dated June 9, 2010 18
and a reconstruction of A. Deglava iela. However, it is yet uncertain whether there will be financial re-sources to pursue these projects. Since these projects are not yet contracted, they are not part of the policy scenario for the reference situation. Figure 3.1 shows the adaptations to the reference road net-work in relation to the 2007 network. figure 3.1. Road and rail network in reference variant 2025, with adaptations highlighted
For public transport in Riga the services for tram and trolleybus are included in the reference variant as they are existing in 2010. These lines form the backbone of the public transport system in Riga. All other changes in public transport will be taken into account in the variants.
table 3.3. Tram lines in reference variant 2025
Line From To Average frequency Runtime (min)
2 Central Tirgus Tapesu iela 4/hr 27 3 Jugla Dole 1/hr 58 4 Central Tirgus Imanta 12/hr 28 5 Ilguciems Milgravis 5/hr 56 6 Stacijas Laukums Jugla 10/hr 36 7 Ausekla iela Dole 9/hr 33 9 Aldaris Dole 1/hr 52 10 Central Tirgus Bisumuiza 6/hr 32 11 Stacijas Laukums Mezaparks 8/hr 30
Tram line 8 is out of service in 2010 (and thus in 2025).

LET106-1 Development of Riga and Pieriga Mobility Plan THIRD INTERIM REPORT Variants, final version, dated June 9, 2010 19
figure 3.2. Tram lines in reference variant 2025
table 3.4. Trolleybuses in reference variant 2025
Line From To Average frequency Runtime (min)
1 Valmieras iela Petersalas iela 5/hr 15 3 Central tirgus Sarkandaugava 12/hr 23 4 Central tirgus Smerlis 5/hr 30 5 Daugavas stadions Kliniska slimnica 4/hr 33 7 Agenskalna priedes Keguma iela 3/hr 38 9 Stacijas laukums Ilguciems 3/hr 31 11 Centrala stacija Ieriku iela 5/hr 23 13 Central tirgus Ieriku iela 5/hr 28 14 Esplanade Mezciems 8/hr 35 15 Latvijas Universitate Visku iela 24/hr 29 16 Plavnieki Smerlis 5/hr 35 17 Centrala stacija Purvciems 13/hr 35 18 Centrala stacija Mezciems 6/hr 32 19 Petersalas iela Ziepniekkalns 10/hr 37 20 Latvijas Universitate Televizijas centrs 1/hr 12 22 E.Birznieka-Upisa iela Plavnieki 17/hr 31 23 Centrala stacija Purvciems 14/hr 25 24 A/s Dzintars Petersalas iela 5/hr 37 25 Brivibas iela Ilguciems 11/hr 32 27 Stacijas laukums Abolu iela 4/hr 26

LET106-1 Development of Riga and Pieriga Mobility Plan THIRD INTERIM REPORT Variants, final version, dated June 9, 2010 20
Compared to 2007 the following trolleybus lines have changed: Line 5: extended route; Line 6: out of service; Line 8: out of service; Line 9: extended route; Line 13: ex-tended route; Line 20: extended route; Line 21: out of service; Line 24: extended route; Line 25: added (old line 21); Line 27: added (old line 8 extended to east bank Daugava). figure 3.3. Trolleybus lines in reference variant 2025
The bus and minibus networks have not been adapted in the reference variant to the situation 2010. The network in the current situation (2007) was implemented for 2025 without adaptations. In appendix I the reference networks for bus and minibus are presented. For the rail network in Riga and Pieriga also the situation of 2007 has been used as basis. The main changes between 2007 and 2010 (closure of several services) have been taken into account. There are no other significant adaptations foreseen till 2025. Also, for regional and intercity buses in Pieriga the situation 2007 is used. In appendix I the network for rail is presented.

LET106-1 Development of Riga and Pieriga Mobility Plan THIRD INTERIM REPORT Variants, final version, dated June 9, 2010 21
figure 4.1. Composure of variants
4. TRANSPORT SYSTEM VARIANTS
4.1. Introduction
In addition to the reference variant as described in the previous chapter, three realistic variants have been developed for the structure of the Riga and Pieriga transport system. They are based on the RPMP objectives, the results of the problem analysis, the modelling of theme variants, expert judge-ment and existing plans. Section 4.2 presents the main principles underlying the development of the re-alistic variants and the method used for selection of measures. Sections 4.3 and 4.4 give a description of the set of basic measures which has been included in both variants. These measures are necessary to achieve the objectives and solve main bottlenecks in the Riga and Pieriga transport system. Sections 4.5 to 4.8 describe the additional, distinguishing measures which have been included in the three vari-ants. The variants represent several main choices which have to be made for the transport system. Based on qualitative assessment, model results and cost-benefit analysis one of the variants is pro-posed as preferred variant for the RPMP. The idea for the combination of the basic set of measures and the sets per variant is to further develop a road hierarchy in Riga and Pieriga, to complete and improve the network of main roads and to guide traffic as much as possible to the main road network. The variants have been distinguished by the in-frastructural measures, which are necessary to create a certain road and public transport structure. Of course also soft measures, such as traffic management and road pricing, have a large influence on the functioning of the system. These measures are described in chapter 5 and will be further elaborated for the preferred variant.
4.2. Principles for development of realistic variants
This section gives a description of the method used for selection of measures and the main principles used in the design of the re-alistic variants. Figure 4.1 gives an outline of the composure of the variants and the preferred variant. The first step in the approach is the definition of a main philosophy for the de-velopment of the RPMP and several principles (described in section 4.2). The philosophy and the principles together form the framework for the contents of the variants. This framework is based on the overall objectives for the RPMP and the results of the theme variant study. Section 4.2 also describes additional traffic model analyses which have been performed to study possibilities and impact of measures. Based on the philosophy and the principles a set of basic meas-ures for road and rail and for public transport is developed (described in sections 4.3 and 4.4). These basic measures are considered to be required as part of the RPMP and are therefore included in each variant. In addition to the basic set there are several projects and measures, which are considered to be important, but which are debatable or which are interchangeable for other projects. These measures are incorporated in either variant A, B or C (described in sections 4.5 to 4.7). Measures related to the bicycle and pedestrian network are described in section 4.8. Furthermore, there are several measures which are less distinguishable for variants, not yet concrete in this stage or have

LET106-1 Development of Riga and Pieriga Mobility Plan THIRD INTERIM REPORT Variants, final version, dated June 9, 2010 22
less influence on the functioning of the transport system as a whole. Examples are traffic management measures, pricing measures, marketing and local projects. These soft measures are described in chap-ter 5 and are further elaborated in the next task for the preferred variant. 4.2.1. Main philosophy
The main philosophy for the RPMP provides a framework for integrated development of the trans-port system in Riga and Pieriga. The main philoso-phy for Riga is to further develop and implement a road hierarchy, along the lines as set out by the Riga City Council. The idea of a road hierarchy is that roads are used according to their function. In order to achieve this, the road design has to be in accordance with the function, and the network needs to be coherent, to stimulate the right use of the different network links. To improve safety and liveability it is recommended to make a clear distinction between main roads and local roads. Within the grid of main roads local roads can be downgraded. However, the wider the grid and the more extensive the traffic calmed areas within the grid, the more problems arise along the major roads and in the grids as well, since traffic is accumulating there. Hence, there is a trade-off be-tween the extensiveness of traffic calmed areas and the traffic related problems on the main grid. Figure 4.2 illustrates this principle. Based on the philoso-phy of road hierarchy, the realistic variants have been distinguished in the density of the main roads grid. As a first step to traffic calming within the grids, the recommendation is to start with a pilot in the city centre, wherein speeds and traffic volumes on roads not belonging to the main structure are reduced. This will enhance liveability in the city centre and will create new opportunities for spatial development. For each variant the aim is to develop a main road network that can accommodate interlocal and long distance traffic, relieving other roads from this type of traffic. This means that road design should match the main road function in terms of speed, number of lanes and capacity, and also in terms of mitigating measures against traffic hindrance for local residents. As the main road system needs to be coherent in order to function well, weak and missing links need to be eliminated. Hence, road hierarchy not only re-duces traffic related liveability problems, it enhances accessibility and connectivity between neighbour-hoods and city quarters as well. In order to disentangle local from interlocal and through traffic each variant consists of an outer ring, an inner ring and radials connecting the rings. The principle is that traf-fic should stick to the outer ring as long as possible, before using a radial to penetrate the city centre. Usage of the inner ring is only meant for traffic that does not have the outer ring as alternative for that part of the trip. In Pieriga road hierarchy is also an important means for reducing problems, like making a clear distinc-tion between roads with and without direct access of houses, farms and estates. However, the main philosophy for Pieriga is based on spatial planning for the region, as in Pieriga transport and spatial planning are even more interlinked. The Riga Planning Region states that the transport infrastructure of the region should be developed in connection with the planned polycentric development of habitation and distribution of work places. In the context of net outmigration and shrinking population, it is consid-ered essential to the sustainable and balanced development of the region to keep critical mass in towns
figure 4.2. Principles of road hierarchy
LET106-1 Development of Riga and Pieriga Mobility Plan THIRD INTERIM REPORT Variants, final version, dated June 9, 2010 23
and villages. With this critical mass the living conditions can be maintained and improved, since the lo-cation becomes more attractive for employment, services and dwellers. Accessibility is regarded as the key to maintain critical mass. This is the basis for the RPMP philosophy for Pieriga. As stated in chapter 2 travel time gains for the agglomeration have been the main criterion for selecting measures. In order to avoid widespread low density housing and industrial estates, the Riga Planning Region rec-ommends to concentrate new developments along existing railway lines. This objective is adopted for the RPMP. In the RPMP also the railways are chosen as the regional backbone for public transport and spatial development. 4.2.2. Traffic analysis
Several additional analyses have been performed to be able to select and support the measures to be included in the RPMP. This section presents summary of the analysis relating to the river crossings, through going traffic, an A7-A8 connection connecting to the Southern Bridge and Slavu Iela. The com-plete analyses, including figures, is attached in appendix II. river crossings
An analysis has been performed to study the function and use of the existing river crossings and the need for new connections. The results of the analysis are given in appendix II. The conclusion of this study is that a new crossing to the north of Vansu bridge (e.g. the NTC or Hanzas crossing) does have a substantial demand value. In the case of a NTC crossing, the accommodated traffic stems from all river crossings, but from Vansu and Southern bridge in particular. In the case of a Hanzas crossing most traffic comes from Vansu bridge. A new northern crossing can therefore relieve the traffic burden around Vansu bridge and at the same time accommodate longer distance traffic, saving on vehicle kilometres and travel time. A Hanzas bridge instead of a NTC crossing would lead to a bigger reduction of traffic on Vansu bridge, but also to a more limited reduction in travel time and kilometres, since it would be a lesser alternative to long distance traffic. Furthermore, the analysis shows that on the short term the demand for a new A4-A5 crossing is limited. However, such a crossing has a large value for Pieriga in respect to liveability and accessibility issues. Also, traffic over the existing dam can then be restricted, not further endangering the drainage system and the stability of the dam (on the north side). The dam itself accomodates long distance traffic that has the Southern bridge and to a lesser extent a NTC crossing as route choice options. Based on the analysis the choice was made to develop two variants with a new northern crossing: one with the NTC crossing (sparser structure) and one with the Hanza crossing (denser structure). Further-more, a third variant is developed without any new crossing across the Daugava river. This variant fo-cuses on better use of the Southern bridge, since currently there is capacity left at this bridge. A new A4-A5 crossing will be included in the longer term strategy for the preferred variant. through going traffic
The analysis in appendix II gives an overview of car and freight volumes by type of relation (within Riga, through going, etc.). Car traffic on the bridges in Riga is mostly intra Riga traffic or traffic which is going to or coming from the CBD. The Salu bridge shows also traffic coming from the rest of Latvia and head-ing for the CBD, as well as traffic between the rest of Riga and the rest of Latvia. The Southern bridge shows traffic with hardly a relation with the CBD. Only intra Riga traffic and Riga-Rest of Latvia traffic uses this bridge. It is important to note that almost all traffic has an origin or a destination in Riga. Tran-sit car traffic hardly exists on the bridges. When zooming out, it can be seen that transit traffic occurs in small volumes on the ring around Riga, including the Riga HES dam. Looking at freight transport in the morning peak, similar patterns occur, though in smaller quantities than car. The broader view shows that freight transport is partly directed towards areas outside Riga.

LET106-1 Development of Riga and Pieriga Mobility Plan THIRD INTERIM REPORT Variants, final version, dated June 9, 2010 24
The different arterial roads are used for transport to the different parts of Latvia. Transit freight traffic ex-ists, but the proportion of transit traffic is limited. The ring around Riga shows some transit traffic. Traffic on the Riga dam shows that about 17% of all traffic is transit (in total approximately 170 vehicles per hour in the morning peak in both directions together). The rest of the traffic has an origin or destina-tion in Riga. Concluding, the traffic on the roads in Riga has its origin or destination in Riga. Therefore, redirecting transit traffic will not solve the problems on the infrastructure in Riga. A7-A8 connection A selected link analysis of the A7-A8 connection has been made (see appendix II). The analysis shows that the absolute volume on an A7/A8 connection is limited. The connection serves mainly for traffic to and from the Southern bridge. Traffic to and from Olaine as well as Northwest Riga uses this connec-tion. The relation with Northwest Riga shows that the route via the A5 is more attractive than a route via the city. It is concluded that the A7/A8 connection complements to the Southern Bridge, but not sufficiently. The infrastructure is not used up to its maximum. However, the connection does have other advantages, like avoiding rat run traffic through Ziepniekkalns. If a decision is taken to connect the A7 and A8, one could start with a 1x1 road, with an option to make it 2x2 in the longer run. In the variants the A7/A8 connec-tion is not included for the reason of limited demand. Slavu iela
Slavu Iela is in both 2007 and 2025 a bottleneck. The capacity has increased between 2007 and 2025, but so has car ownership and thus the use of cars. The volumes have increased by 50-60 %. This in-crease is one of the reasons that Slavu Iela remains a bottleneck in the future. Another reason is the at-tractiveness of routes via Slavu iela, related to the completion of the Eastern Arterial and the route to Jugla/A2. All traffic via these routes has to pass Slavu Iela in order to go from westbank to eastbank. Although Slavu iela is a bottleneck, it provides for a lot of traffic the most favourable route, avoiding congestion problems elsewhere. Providing extra capacity will lead to even more latent demand coming to Slavu Iela. Appendix II analyses traffic on Slavu Iela and shows the importance of this connection. The road pro-vides an important connection between the two parts of the city. Even with the existence of travel delay, Slavu Iela provides a favourable route for many drivers. It will be not so much a question of how to get rid of all congestion, but of how to manage the traffic load in a safe and smooth manner, e.g. with the help of dynamic traffic management. This will be a topic in the next phase of the development of the RPMP. 4.2.3. Road infrastructure development the road ahead Although there are still some weak links existing in the Riga road network, many parts of the network have been locally optimised in the past, mostly with the help of restrictions like one-way systems and prohibitions for left turning and freight trucks. This patchwork kept the system functioning, but has also led to extra vehicle movements, new conflicts and unwanted ‘priority’ for through going traffic. The pos-sibilities for further optimisation are limited and the system needs a great leap forward to be able to cope with future mobility. In our belief this leap can be provided by new important infrastructure, stimu-lating alternative modes and sorting out accessibility, safety and liveability issues by means of a road hierarchy at the same time. Very important in this respect is an Eastern Magistral without at-grade in-tersections, as envisaged by Riga City Council, to reduce traffic on other roads in the centre, like 11. Novembra krastmala. In order to also facilitate traffic related to the centre, strong connections with the centre network need to be established. Additionally to the Eastern Magistral a new east-west connec-tion to the north of the Riga city centre is necessary to further disentangle local from interlocal and through traffic. This new east-west connection should include a new river crossing and will give way to

LET106-1 Development of Riga and Pieriga Mobility Plan THIRD INTERIM REPORT Variants, final version, dated June 9, 2010 25
adjust the function of the other crossings and routes. For further strengthening the main road network Riga could do with a proper western arterial, increasing local accessibility at the same time. Next to improvements of the main road network other parts of the network should be downgraded to match their usage with their (new) function. This downgrading does not necessarily involve very large reconstruction costs. On the contrary, downgrading will save on maintenance costs and will improve traffic safety, liveability and the attractiveness of using alternative modes. Finally, in order to arrive to a sustainable transport system, system optimisation should go hand in hand with spatial and economic development and before pursuing a policy intervention the contribution to so-ciety and ecology should be assessed. In the RPMP this will only partly be addressed. road network Riga
Measures for the road network in Riga, other than the river crossings, are related to the following five principles:
- western tangential route: there is a need for an improved or new north-south tangential route on the west bank of the Daugava. Model results show that without such a route traffic congestion around Kalnciema iela will arise. Furthermore, Daugavgrivas iela is already congested in the current situation. Since there are several options available, in each variant one option is in-cluded, that also connects the new river crossing to the network in an optimal way. The options are partly based on the existing network and are partly new construction. In the elaboration of the preferred variant the exact routing, the integration and possible planning will be studied;
- connection Southern bridge: this bridge has quite some reserve capacity according to the model results. In order to improve the usage of this bridge extra attention needs to be given to the ac-cess roads on both sides and to routes using this bridge;
- traffic calming 11. Novembra krastmala: in order to allow future spatial developments on the river banks, such as the new centre on the west bank and traffic calming of 11. Novembra krastmala, traffic will be guided away from the route along the river bank. This means that 11. Novembra krastmala will not be a formal part of a centre ring. The design of this road can be adapted on several sections to reduce the space assigned to traffic functions and to enable an extension and improvement of public space. Also, in combination with a downgrade of Akmens bridge Krastmala iela can be reconstructed to make more logical routes, reinforcing the func-tions for the area;
- bottlenecks: the radials crossing the railway loop on the east bank form bottlenecks for traffic, according to the modelling results. Because of the railway barrier the number of crossings is lim-ited, while the radials provide the eastern access to the city centre. Specific measures are taken, some depending on the variant;
- defragmentation: some minor bottlenecks are related to the fragmentation of the road network. In order to make a hierarchy function well, all segments with the same hierarchy should have similar throughput characteristics. Measures related to complete defragmentation and solving of minor bottlenecks are elaborated in the preferred variant.
road network Pieriga
For Pieriga one standard package has been developed so far, to be included in all variants. This is re-lated to the fact that the model is not very capable of showing local effects on route choice and travel time. Furthermore, the package is based on projects planned by Latvian State Roads, which are not distinguishable into three variants. For the choice of measures, first a distinction in different types of measures has been made:
- local measures to relieve traffic hindrance, or to improve accessibility, safety and traffic circula-tion (like pedestrian facilities to increase traffic safety);
- local measures to better connect to the main road network or the regional public transport sys-tem (like routes to Park and Ride, non-motorised transport and bus stations to feed local railway stations);

LET106-1 Development of Riga and Pieriga Mobility Plan THIRD INTERIM REPORT Variants, final version, dated June 9, 2010 26
- measures to increase regional accessibility via the main road network or the regional public transport system (like the idea of a Pieriga highway from Engure to Saulkrasti, or connections with TEN-T);
- measures to increase accessibility to Riga, via the main road network or the regional public transport system (like the idea of upgrading the road or reinstating the railway to Ergli).
Since local measures are very hard to prioritise, these are excluded in this stage. For the preferred variant the expertise of local stakeholders and a black spots analysis will serve as ground for prioritisa-tion. As for the measures on regional scale the sum of travel time gains has been used as a qualitative criterion, keeping in mind the main philosophy of further developing the corridors. Further prioritisation will be made with the help of Latvian State Roads, in the stage of developing the preferred variant. 4.2.4. Rail infrastructure development
The capacity of the rail network is determined for a large part by the Daugava crossings. The only Dau-gava railway crossing in Riga and Pieriga is located in Riga. The other Daugava river crossings are lo-cated to the east of Riga at Krustpils/Jekabpils (140 km from Riga) and Daugavpils (230 km from Riga). The railway bridge in Riga is used by passenger transport and freight transport. Appendix III gives an analysis of the railway capacity for passenger and freight transport. The analysis results in the conclusion that the capacity of the existing railway bridge is enough to han-dle both passenger and freight traffic in the period to 2025. This means that based on capacity analysis there is no need to build a new railway bridge. Creation of some extra capacity might even be possible by installing newer signalling systems in the future. However, there are other reasons for construction of new rail infrastructure such as environmental issues caused by the type of transported goods, hin-drance to close to the railway track living inhabitants and hindrance of freight traffic at the Central Sta-tion. Currently the alternatives for new rail infrastructure are examined in the project: ‘Feasibility Study on Railway Routes to the Port Terminals on the left bank of the Daugava River and to the International Airport Riga’ which is scheduled to be finished at the end of 2010. In the feasibility study several alter-natives for a new railway connection are analysed. Some alternatives are based on maximum use of existing infrastructure and add only specific bypasses or connections to existing infrastructure, whereas other alternatives consist of new infrastructure and constructing a new rail bridge/tunnel. Three alternatives in which the freight traffic is diverted out of the city centre are: 1. use of existing infrastructure with construction of new bypasses at Tornakalns and Jelgava. The
Daugava river is crossed by use of the existing railway bridge near Krustpils/Jekabpils; 2. construction of the Riga railway circle with a new crossing at the Riga HES lake near Salaspils; 3. construction of half Riga railway circle from the port area to the railway track to Jelgava with a new
railway bypass at Jelgava. The Daugava river is crossed by use of the existing railway bridge near Krustpils/Jekabpils.
Alternative 1 provides a mid-term solution to divert freight traffic away from the right bank part of the city centre. In this alternative there will remain residential zones which are affected by the freight traffic e.g. Dzirciems, Tornakalns and Atgazene. This alternative causes a shift in affected areas from right to left bank. For construction of the bypass at Tornakalns, removal or relocation of existing houses is neces-sary. It can be questioned whether this alternative provides an acceptable solution for a long term de-velopment of the railway infrastructure. Alternative 2 provides a long term solution and can be combined with upgrading of the A5 road infra-structure. This alternative diverts freight traffic out of the city centre and out of densely populated areas. The downside is that the alternative consists of completely new infrastructure and a new Daugava crossing with large costs. The feasibility study which is currently elaborated should indicate whether such an investment will be economically feasible. For the Mobility Plan this alternative is considered to be a long term development which is not realistic for 2025. Alternative 3 provides a less expensive solu-

LET106-1 Development of Riga and Pieriga Mobility Plan THIRD INTERIM REPORT Variants, final version, dated June 9, 2010 27
tion than alternative 2, since there is no need for constructing a new bridge to cross the Daugava. How-ever, also this alternative is a long term solution. For the short and middle term (till 2025) the construction of comprehensive new rail infrastructure is not incorporated in the RPMP. Till 2025 the current rail capacity is sufficient and although the transport of goods through the city centre is not desirable, it is acceptable as long as most transport is not danger-ous to the environment and the inhabitants. For the longer term possibilities for new rail infrastructure are described in the elaboration of the preferred variant. 4.2.5. Public transport development A complete set of PT measures, combined with a marketing strategy is necessary to reach the objective of PT improvement. The existing public transport system is of good standards in terms of level of ser-vice and catchment. The main idea for the realistic variants is to keep and safeguard the good, by build-ing upon the backbone systems in urban corridors and increasing accessibility of main centres. The same public transport measures are implemented in each of the three realistic variants, since the com-plete set is necessary to be able to reach improvement. These measures are seen as a necessary ba-sis. Additional measures are elaborated for the preferred variant. The following five principles are used as basis for public transport (PT) in the realistic variants:
- redesign of the passenger railway system as backbone for PT in Pieriga; - improvement of the tramway network to form a backbone of the PT network in Riga; - redesign of the trolleybus network to realize a complete and coherent PT network in Riga; - redesign of the bus network to increase efficiency and reduce parallelism with the other PT
modes; - introduction of transfer points between car and PT and between different PT modes to stimulate
people to enter the city centre by PT instead of private car. The backbone for public transport is formed by passenger rail, tram and trolleybus. In many urban ar-eas in Europe tramway systems and commuter rail systems are able to seduce car owners to use pub-lic transport on trips to city centres. Modern rail systems are more attractive to car owners and therefore more competitive then the use of the bus. Minibuses can also be attractive, because they have direct and frequent connections with short walking distances. The trolleybus network in Riga has relatively new, accessible, low floor buses. Trolleybuses cause no pollution in the city and are much quieter than other buses or even cars. Trolleybuses also have a longer life (15-20 years is common) than other buses. When using sustainable energy, such as water or wind they run even without CO2 emissions. Although new developments lead to cleaner buses it is rec-ommended to maintain and even extend the trolleybus network. The average speed of the trolleybus network is currently lower than that of tram and bus. This is caused by several reasons such as the catenary system and the operation in the densest parts of the city. Measures, such as priority at inter-sections and exclusive infrastructure, will be included in the elaboration of the preferred variant to in-crease the speed of trolleybuses. 4.2.6. Soft measures In the further elaboration of the realistic variants and the preferred variant several soft measures will be studied and elaborated. A first introduction to several soft measures and their effects is given in chapter 5. Examples of these measures are a marketing strategy and solutions in the field of traffic manage-ment and information. Traffic management solutions (and ITS) will be studied and implemented where possible. With changes in traffic control at intersections considerable improvements are possible. Traffic management solutions in general have low costs, compared to infrastructural measures, for relatively large effects. No extensive procedures are needed for implementation and gradual investment is possi-ble. In the realistic variants several intersection reconstructions/improvements are included. Measures

LET106-1 Development of Riga and Pieriga Mobility Plan THIRD INTERIM REPORT Variants, final version, dated June 9, 2010 28
for these intersections are further elaborated for the preferred variant and where possible traffic man-agement measures are used. In variant C traffic management forms an important package, in order to increase capacity and to direct traffic to main routes. This package should contain measures regarding input (metering with traffic lights, diverting traffic with variable message signs etcetera), throughput (parking prohibitions, widening lanes, separate bicycle infrastructure, slip roads etcetera) and output (left turn lanes, traffic light optimi-sation, extra exit lanes etcetera). It can be supplemented with demand strategies trying to reduce the number of car trips at certain times and locations. 4.3. Basic set of measures for road and rail infrastructure
The previous modelling and analysis activities have clearly shown several important bottlenecks and drawbacks in the transport system, which can be solved with the proposed measures in the RPMP. Several main measures have been identified, based on the principles in section 4.2, which are at least necessary to improve the traffic and transport situation. These measures form the basic set of meas-ures, which are included in each variant. The measures are chosen based on the ambition and criteria given in chapter 2. road infrastructure Riga
This section gives a short description of the road infrastructure measures in Riga in the basic set7. A more detailed description is included in appendix IV. The measures are also depicted in figure 4.3.
- Bs1: Connection Southern bridge: to improve the use of the Southern bridge good connections to the main network are imperative. Parts of the connections are already included in the refer-ence variant (stage 1 and 2). The finalization of the connection to the A7 is included in the basic set (part of stage 3). Further extension of the connection to the A8 is not part of the basic set. The added value of this connection is limited and depends on choices made in the road struc-ture. Therefore, this extension is only included in one of the variants;
- Bs2: Downgrade of Akmens bridge and NMT improvement: this bridge gives direct access to the city centre, but currently facilitates traffic that is not related to the centre economy, leading to liveability and road safety problems. The capacity of the bridge is reduced and speed is lowered to discourage through going traffic of using this bridge. The bridge will not be downgraded for public transport and non-motorised transport, making these modes more competitive with e.g. a high quality cycling connection between the new location of the university and the city centre. For variant C the speed and capacity are not changed, only facilities for NMT are improved;
- Bs3: Traffic calming in the city centre: For the city centre a system of traffic calming is imple-mented on roads which do not belong to the main structure. Traffic calming is effectuated with measures such as narrowing road surface, reducing speeds, and route guidance to main roads. The implementation of measures can be started with pilot projects on the roads with most traffic hindrance. Based on the results of the first pilots measures on other roads can be implemented. Traffic calming measures in Amsterdam and Copenhagen have shown good results. For Riga traffic calming in the centre can also open the possibilities for reducing the one-way system;
- Bs4: One-way system railway crossing: the crossings of the railway loop on the east (right) bank of the Daugava are clearly capacity bottlenecks for traffic flow. Brivibas gatve and Aleksandra Caka iela are two main radials from Pieriga towards the Riga city centre with severe problems in both the current and future situation. The model results show that these radials are congested around the crossings with the railway loop. The Mobility Plan includes a one-way system, with Aleksandra Caka iela leading into the city centre from Gustava Zemgala gatve until Merkela iela (with possible extension to Krasta iela) and Brivibas iela outside the centre, from Kapaka bul-varis until Gustava Zemgala gatve. The advantages are as follows:
7 The complete Eastern Magistral is included in the reference variant , however during the project it became clear that finance of a part
of this route is not certain yet. A cost estimate for the completion is given in the analysis of necessary investments.

LET106-1 Development of Riga and Pieriga Mobility Plan THIRD INTERIM REPORT Variants, final version, dated June 9, 2010 29
⋅ Aleksandra Caka/Ieriku iela has more capacity than Brivibas gatve, being better able to ac-commodate the morning peak, which is of most economical value;
⋅ There will be more capacity overall on the railway bridges, since a better distinction will be made between slow and faster vehicles on the lanes available;
⋅ The strategic junctions with Pernavas iela will gain capacity, since a phase in the traffic signals can be skipped;
⋅ The system will combine well with the existing one way system, leading to several parallel shortcuts between the radials. Also, the junctions with the radials can improve;
⋅ Traffic safety on both roads can be improved; ⋅ Due to the removal of several car traffic directions extra space becomes available for other di-
rections and for public transport. There is for example a possibility to introduce a dedicated bus lane on Brivibas gatve; this will be further elaborated in the preferred variant.
Of course, there are some disadvantages as well, like rerouting of public transport lines and the dif-ficult accessibility of the parking places and the railway station around the railway crossing, but these are considered solvable and are elaborated in the preferred variant; - Bs5: Non-motorised and public transport only roads: In order to avoid traffic rerouting because of
the one-way system Terbatas iela and K. Barona iela are downgraded to city boulevards for non motorised transport (NMT) and PT only. This is in line with the idea of traffic calming for the city centre area. In order to reach private parking places and premises, a system with exemptions needs to be worked out;
- Bs6: Bypass for Valmieras iela: in order to relieve Valmieras iela from traffic flows and hindrance a new connection is proposed between Satekles iela and Pernavas iela, just to the north of the railways. Together with Pernavas iela this connection will form a bypass for Valmieras iela. This idea has been part of Riga City Council plans. Furthermore, traffic management is introduced on the city ring to facilitate traffic flow.
figure 4.3. Basic measures road infrastructure realistic variants Riga
Measures for other railway crossings bottlenecks are not included in the basic set. As for Augusta De-glava iela capacity can be increased by redesigning the triangle Valmieras/Pernavas/A. Deglava iela. In

LET106-1 Development of Riga and Pieriga Mobility Plan THIRD INTERIM REPORT Variants, final version, dated June 9, 2010 30
some variants a new connection has been made between the Eastern Magistral and Pernavas iela, re-ducing traffic flows on A. Deglava iela. For Lacplesa iela reconstruction of the junction with Marijas Satekles will increase capacity to satisfying levels. There is a plan for a tunnel from Gertrudes to Dau-gavpils iela, also relieving the pressure on Lacplesa iela. This idea has not been included in the variants and is seen as a project farther in the future. Reconstruction of intersections and/or traffic management measures will be further elaborated in the preferred variant. Not included in the basic set nor in the supplemental sets for the variants are local bottlenecks related to fragmentation. These bottlenecks are elaborated in the preferred variant, since the priority for solving them is dependent on the preferred variant (arguably apart from the junction Vienibas gatve/K. Ulmana gatve) and the transport model is not always reflecting them. By analyzing the number of lanes per road section in the network the fragmentation is clearly shown. For the chosen variant the main bottlenecks in the road hierarchy due to fragmentation will be solved in the preferred variant. road infrastructure Pieriga
This section gives a short description of the road infrastructure measures in Pieriga in the basic set. A more detailed description is included in appendix V. As explained in the previous section, in the variants only basic measures on regional scale are included. Other measures will be elaborated for the pre-ferred variant. The measures are chosen based on the already started projects and priorities of Latvian State Roads for Pieriga. These projects have the largest contribution to improvement of the regional accessibility. The following measures are included as basic set for the realistic variants:
- Bs7: Cohesion Fund Project E22: This project consists of the (re)construction of a route parallel to the A6 highway. The highway A6 crosses through several towns. This causes delays and liveability problems. The E22 project will allow for traffic to choose this route instead of the A6. The route of E22 follows for a large part the existing alignment of the P5 and P80. The recon-struction is already started for sections 3, 4 and 5 (part between Ogre and Viskali). Therefore, the reconstruction of these sections is included in the reference variant. Reconstruction of the P5 between the Riga bypass and Ogre and construction of section 6 between Viskali and Kok-nese are included in the RPMP variants. The road is designed with 1 lane per direction and a speed of 100 km/h. On the longer term (not included in the RPMP) the E22 can be further up-graded to highway level, with 2 lanes per direction;
- Bs8: reconstruction of E77/A2, section between the Riga bypass and Senite, into a safe, high quality dual carriageway. This reconstruction is a pilot project for Latvian State Roads for the use of a PPP financing construction. DBFM (design-build-finance-maintain) principles are used to-gether with long-term service contracts and attracting of financing from private investors. The planned construction period is 2010-2012;
- Bs9: construction of the E67/A7 Kekava bypass. This project is planned to be implemented be-tween 2013 and 2016 with a PPP financing construction;
- Bs10: reconstruction of the E67/A4 Riga bypass, section between the A6 and the A2. This pro-ject is planned to be implemented between 2013 and 2016 with a PPP financing construction;
- Bs7: Traffic safety measures: one of the main objectives for the RPMP is to improve traffic safety. Therefore, budget is assigned to measures for improving traffic safety in Riga and Pieriga (e.g. reconstruction of intersections, NMT crossings).
Furthermore, Latvian State Roads has plans to develop the following projects in Pieriga till 2020:
- reconstruction of road E22/A10 section Priedaine - Sloka; - reconstruction of road E77/A8 section Riga - Jelgava.
These projects are not included in the basic set of measures, because of the lower priority compared to the other projects. Furthermore, the expectation is that not all reconstructions can be realized before 2025. In the elaboration of the preferred variant first improvements on other road sections than those in
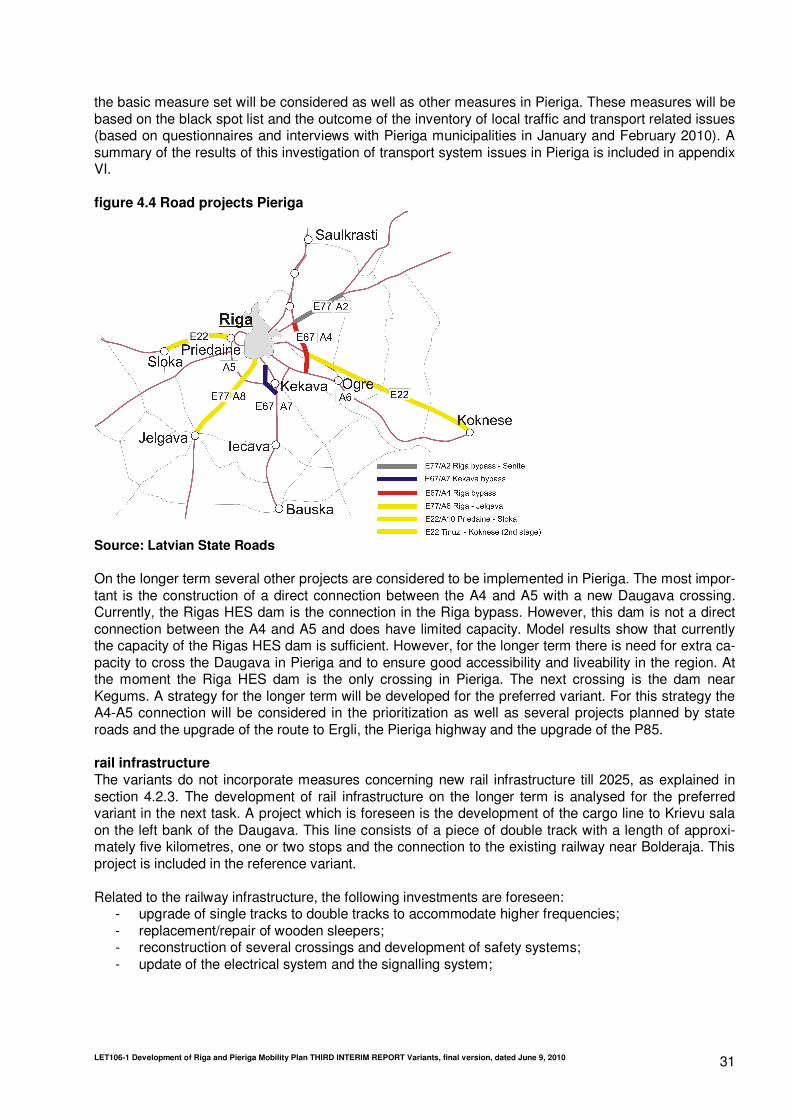
LET106-1 Development of Riga and Pieriga Mobility Plan THIRD INTERIM REPORT Variants, final version, dated June 9, 2010 31
the basic measure set will be considered as well as other measures in Pieriga. These measures will be based on the black spot list and the outcome of the inventory of local traffic and transport related issues (based on questionnaires and interviews with Pieriga municipalities in January and February 2010). A summary of the results of this investigation of transport system issues in Pieriga is included in appendix VI. figure 4.4 Road projects Pieriga
Source: Latvian State Roads On the longer term several other projects are considered to be implemented in Pieriga. The most impor-tant is the construction of a direct connection between the A4 and A5 with a new Daugava crossing. Currently, the Rigas HES dam is the connection in the Riga bypass. However, this dam is not a direct connection between the A4 and A5 and does have limited capacity. Model results show that currently the capacity of the Rigas HES dam is sufficient. However, for the longer term there is need for extra ca-pacity to cross the Daugava in Pieriga and to ensure good accessibility and liveability in the region. At the moment the Riga HES dam is the only crossing in Pieriga. The next crossing is the dam near Kegums. A strategy for the longer term will be developed for the preferred variant. For this strategy the A4-A5 connection will be considered in the prioritization as well as several projects planned by state roads and the upgrade of the route to Ergli, the Pieriga highway and the upgrade of the P85. rail infrastructure The variants do not incorporate measures concerning new rail infrastructure till 2025, as explained in section 4.2.3. The development of rail infrastructure on the longer term is analysed for the preferred variant in the next task. A project which is foreseen is the development of the cargo line to Krievu sala on the left bank of the Daugava. This line consists of a piece of double track with a length of approxi-mately five kilometres, one or two stops and the connection to the existing railway near Bolderaja. This project is included in the reference variant. Related to the railway infrastructure, the following investments are foreseen:
- upgrade of single tracks to double tracks to accommodate higher frequencies; - replacement/repair of wooden sleepers; - reconstruction of several crossings and development of safety systems; - update of the electrical system and the signalling system;

LET106-1 Development of Riga and Pieriga Mobility Plan THIRD INTERIM REPORT Variants, final version, dated June 9, 2010 32
- increase of platform heights to improve accessibility of trains and to reduce necessary waiting times at stops.
These measures are investigated for the preferred variant and are elaborated in the next interim report. For passenger rail several improvements are proposed; these are described in the next section. 4.4. Basic set of measures for public transport
Car ownership is expected to increase up to 60 % until 2025. This will have a great impact on the use of public transport (PT) as well. Without specific measures the number of PT passengers is expected to decrease by more than 30 % (based on modelling results reference variant). The attractiveness of PT will further decrease due to reductions in number and quality of services when passenger numbers de-crease. To stop this expected trend and even try to create growth on certain corridors, measures should be taken to develop an attractive and efficient public transport system. The focus in this network for the re-alistic variants lies on creating corridors served by high frequent connections that have a travel time which is competitive with travel times by car. Another goal is to decrease the parallelism between bus, trolley bus lines and tramlines. By making short extensions on the trolleybus network existing parallel bus lines can become obsolete and eliminated, thus leading to more efficiency in the network. An over-view of these changes is given in the sections below (tram, trolleybus, bus). For the preferred variant the consequences for the rolling stock will be elaborated. In the theme variants the effects of different PT networks have been studied. With small improvements in PT the decrease of passenger volumes, due to increase in car ownership, can not be prevented. Therefore, a quite comprehensive set of PT measures is necessary to be able to contribute to the RPMP objectives. The results of the theme variants have shown that with an extensive set of PT meas-ures it is possible to have a growth of passenger volumes of up to 18 % compared with the reference variant. Since one of the main objectives of the RPMP is to improve PT use, this extensive set is chosen as ba-sis for all variants. However, the set has been simplified for the realistic variant to improve the cost ef-fectiveness. The focus is on reaching a higher efficiency of the network and reaching the objectives as stated for the RPMP. To reach the objectives the following conditions have to be met on the long term: 1. realisation of reserved lanes in congested areas to increase the travel speed of PT; 2. public financing of infrastructure costs for improvements and extensions of train, tram and trolleybus
network; 3. marketing of the entire public transport network; 4. coherent financing of the operations costs that are not covered with by fares. Based on the results of the previous tasks it is clear which adaptations are necessary for PT. There are no main choices to be made between variants for PT, as explained it is necessary to implement a com-plete set, to be able to work towards the desired results. The different public transport modes have been further elaborated in this section. More detailed information on the measures for train, tram, trolleybus and bus networks is included in appendix VII. Investments for rolling stock are necessary as part of the complete set of measures for public transport. However, these investments are regarded as part of the operation of the public trans-port providers and are therefore not included in the cost estimation of the RPMP. train network (Pieriga) The philosophy for Pieriga is to use the existing train network as the backbone for transport and spatial development. Essential for an attractive train system and to bend the expected trend of decreasing passengers volumes the introduction of faster regional connections with regular intervals and easy to

LET106-1 Development of Riga and Pieriga Mobility Plan THIRD INTERIM REPORT Variants, final version, dated June 9, 2010 33
remember departure times is crucial. Although in the long term higher frequencies of every 15-minutes are possible and wishful the first step can be an interval of every 30 minutes on the suburban lines. The accent for the train network should be bringing people from Pieriga to Riga, inside Riga people use the dense and frequent network of tram, trolleybuses, buses and minibuses. Therefore, it is not recom-mended to increase the number of stations within Riga. The train network is redesigned to a fast metro-like system, operated as ‘Sprinter’ with a clear network and timetable with regular intervals of 30 min-utes or more frequent. To reach shorter travel times, existing speed restrictions should be eliminated by taking adequate ac-tions. Additional measures are necessary to improve the rolling stock, accessibility of the trains and sta-tions and the connection to car and other PT modes, including Park and Ride facilities. These meas-ures will be part of the preferred variant. The Pieriga train network could best be operated with electric trains, because of the availability of cate-naries, the environmental impact, the higher acceleration and the level of comfort for the passengers (less noise and vibrations). In the extensions of the electrified network, diesel trains can be used, al-though it could be considered on the longer term to use hybrid trains. The proposed train network is based on the existing electrified lines from Riga to Tukums, Jelgava, Aizkraukle and Skulte. As a backbone of the Pieriga transport system, this serves passengers in a fast way to travel from suburbs in Pieriga to Riga. Closure of stations with very few passengers (e.g. less then 100 per day) is recommended. This leads to shorter travel times for most passengers and de-creases operation costs and investments in platforms and stations. A new railway station Riga Torna-kalns nearer to new developments on the Daugava west bank is proposed in line with the Riga city de-velopment plan. In order to reach shorter travel times by train on longer destinations a Regional Express (RE) service is introduced. This RE has fewer stops than a so called Sprinter train, which has short stops on all sta-tions. A reactivation of the line to Ergli is not included in the realistic variant; since the potential demand for this line is limited (Ergli and Suntazi are the largest villages along the line, but both have less than 5000 inhabitants). Also reactivating of the connection from Skulte to Limbazi is not included due to the expected high investments for reactivating and relatively low perspective for the number of passengers. Table 4.1 gives a description of the proposed train services.
table 4.1. Train network realistic variants
Line
number
From Via To Headway
peak hours
Headway
Off peak
Status Power
RE1 Tukums Kemeri, Sloka Melluzi, Riga Tornakalns, Riga, Salaspils, Ogre, Lielvarde
Aizkraukle 30 60 Regional Ex-press (RE)
Electric (or Hybrid /Diesel)
S1 Sloka Riga Ogre 30 30 Sprinter Electric S2 Jelgava Riga Saulkrasti /
Skulte 30 30 Sprinter Electric
S3 Riga Incukalns Sigulda 30 60 Sprinter Diesel Remarks: 1. RE1: this Region Express can be extended to Krustpils and Daugavpils in the east, for example
every hour in peak hours and every two hours in off-peak periods (6-8 trains per day/direction). In-

LET106-1 Development of Riga and Pieriga Mobility Plan THIRD INTERIM REPORT Variants, final version, dated June 9, 2010 34
stead of routing all trains to Daugavpils it can also be considered to have an alternating service to Rezekne or offering a connecting train from Aizkraukle. These options are further elaborated in the preferred variant. To reach shorter travel times for passengers from Riga to Tukums it is recom-mended to close the existing stations between Sloka and Tukums except Kemeri;
2. S2: the current terminal of this line is Skulte; although Saulkrasti is the last station with a lot of pas-sengers. Line S2 has a frequency of 2 trains per hour of which in off peak hours only one train per hour ends in Skulte;
3. S3: extension to Valmiera and Valga in the north can be considered, for example every 60-120 minutes (6-8 trains per day/direction).
tram network
The tramway network has been redesigned to increase the attractiveness and efficiency. The tram re-lated measures are estimated to result in a 20 % increase of average travel speed. The current radial network is partly transformed into a transversal network to create more direct routes and to reduce the need for transfers for passengers (more destinations without changing tram). Another benefit of a transversal network is that no turning points are necessary at the main tram stop in front of the Central Station, so less platforms and tracks are needed at this main tram stop. A new tramline to the Airport (RPMP line 1), re-placing tramline 2, gives a good connection from the Airport to the Central station and the city centre. Examples of successful tramlines to the airport can be found in several cities, as in Bre-men, Germany (see figure 4.5). The new tram-line from the airport is connected to the existing tramline to Jugla, which will be the first line to be operated with the new low floor trams. This line must be the first line to be upgraded in order to improve travel speed and quality of stops. The Riga City Council has plans for an extension of this tramline (current line 6) to Bergi. This ex-tension has not been included in the realistic variants for the RPMP, because of expected poor benefits in relation to the costs. The num-ber of passengers will strongly depend on the success of the planned new P+R, which is a high risk. The costs of the extensions are expected to be relatively high, because of the route along the water and the construction of the P+R facility and termi-nal. Considering the limited financial funds it is recommended not to give priority to this extension and postpone this to the longer term (after 2025). Current tramline 5 between Ausekla Iela and Milgravis is closed instead of upgraded: the perspective of this line is not very high and bus line 2 and a short extension of the trolleybus line 3 towards Aldaris form a good and much more efficient alternative to the passengers. Current tramline 7 (RPMP line 5) is extended over a short distance to the Passenger Terminal and the new developments in the port area. It is a possibility to reroute this tramline to the 11.Novembra Krast-mala on the long term, but this is not part of the RPMP variants because of the high infrastructural costs. The existing tramline 4 from Imanta to Central Station is combined with the existing tramline 11 to Mezaparks giving direct connections from Imanta to the city centre (RPMP line 2).
figure 4.5. Example: tram from airport to city centre in Bremen (Germany)
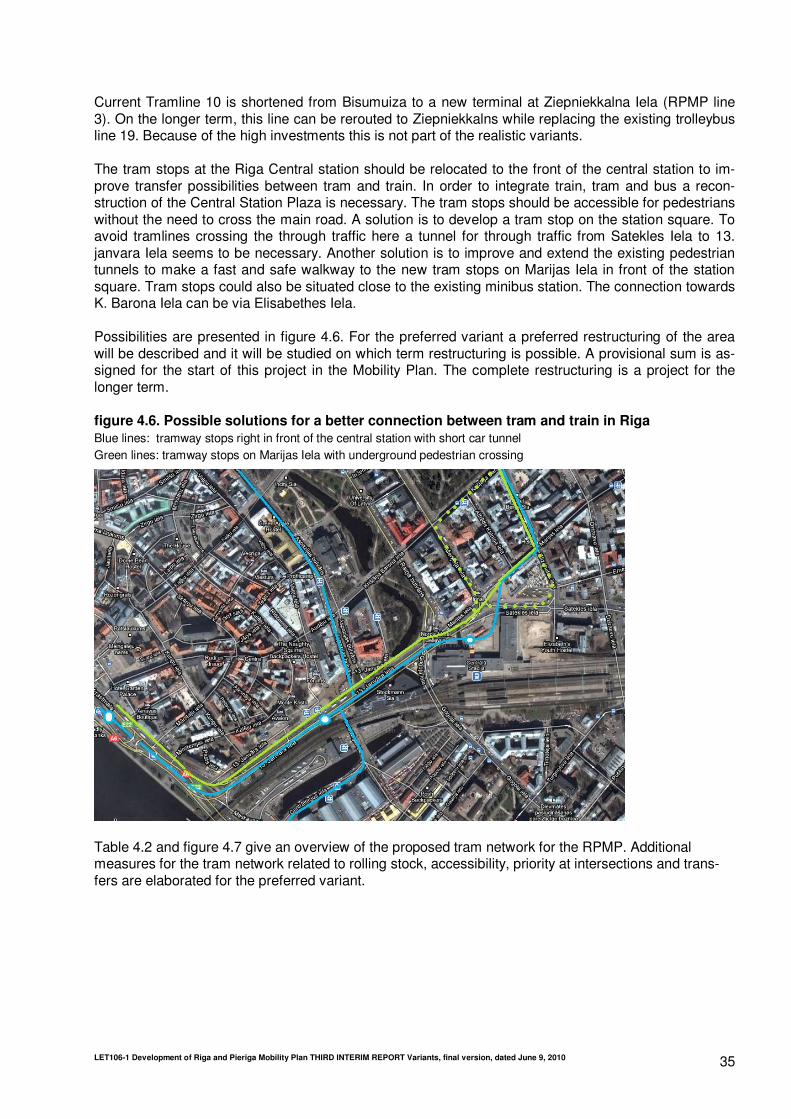
LET106-1 Development of Riga and Pieriga Mobility Plan THIRD INTERIM REPORT Variants, final version, dated June 9, 2010 35
Current Tramline 10 is shortened from Bisumuiza to a new terminal at Ziepniekkalna Iela (RPMP line 3). On the longer term, this line can be rerouted to Ziepniekkalns while replacing the existing trolleybus line 19. Because of the high investments this is not part of the realistic variants. The tram stops at the Riga Central station should be relocated to the front of the central station to im-prove transfer possibilities between tram and train. In order to integrate train, tram and bus a recon-struction of the Central Station Plaza is necessary. The tram stops should be accessible for pedestrians without the need to cross the main road. A solution is to develop a tram stop on the station square. To avoid tramlines crossing the through traffic here a tunnel for through traffic from Satekles Iela to 13. janvara Iela seems to be necessary. Another solution is to improve and extend the existing pedestrian tunnels to make a fast and safe walkway to the new tram stops on Marijas Iela in front of the station square. Tram stops could also be situated close to the existing minibus station. The connection towards K. Barona Iela can be via Elisabethes Iela. Possibilities are presented in figure 4.6. For the preferred variant a preferred restructuring of the area will be described and it will be studied on which term restructuring is possible. A provisional sum is as-signed for the start of this project in the Mobility Plan. The complete restructuring is a project for the longer term. figure 4.6. Possible solutions for a better connection between tram and train in Riga Blue lines: tramway stops right in front of the central station with short car tunnel Green lines: tramway stops on Marijas Iela with underground pedestrian crossing
Table 4.2 and figure 4.7 give an overview of the proposed tram network for the RPMP. Additional measures for the tram network related to rolling stock, accessibility, priority at intersections and trans-fers are elaborated for the preferred variant.

LET106-1 Development of Riga and Pieriga Mobility Plan THIRD INTERIM REPORT Variants, final version, dated June 9, 2010 36
table 4.2. Description of RPMP tramlines
Tram From To Headway
(peak)
Runtime
(min)
Vehicles
/trams
Remarks
1 Jugla Airport 6 57 22 route between station and air-port
2 Mezaparks Imanta 6 55 22 combination of existing lines 4 and 11
3 Ziepniek-kalna iela
Centrala stacija 10 27 8 shortened route of existing line 10
4 Ilguciems Stacijas lau-kums
10 28 8 part of the route of existing line 5
5 Dole Passazieru osta/new port
6 31 14 extended existing route of line 7
Due to the more efficient network the number of trams needed in the RPMP network is less than in the reference (current) situation. figure 4.7. RPMP tram network
park and ride The basic principle for a Park and Ride is to decrease the use of passenger cars at certain locations (mostly city centres or central business districts) by providing a solution to park outside these areas and change to public transport. Park and Ride can be distinguished in two types based on the location where the modal shift from car to public transport takes place:
- origin Park and Ride; - destination Park and Ride.
An origin Park and Ride accommodates travellers who prefer to use PT for covering the greater part of their journey. A destination Park and Ride accommodates travellers who prefer to use PT for covering the last part of their journey. For a successful destination Park and Ride there must be substantial

LET106-1 Development of Riga and Pieriga Mobility Plan THIRD INTERIM REPORT Variants, final version, dated June 9, 2010 37
benefits for travellers. The objective for creating Park and Ride locations in Riga is to decrease the amount of passenger car traffic in the city centre and central business district, especially in the peak hours. Origin Park and Ride is interesting for Pieriga and destination Park and Ride for Riga. Many studies that have been carried out in Europe show different strategies and success factors for implementing Park and Ride. However, there is no guaranteed success factor. Therefore it is proposed to start with Park and Ride at a few locations and expand the network of Park and Ride locations gradually when these primary locations turn out to be successful. The most important reasons for travellers to use Park and Ride systems are congestion on the main roads and parking problems or high parking fees at their destination. If the Park and Ride is located at the start of the congested area and offers a fast and cheaper solution then covering the last part of the journey by car, it might become a success. Furthermore European surveys indicate commuters who use destination Park and Ride locations have a travel distance of at least 10-30 kilometres. Good situ-ated Park and Ride locations can save travel time for the traveller while not being affected by conges-tion in the city and can save money because of lower parking costs. Park and Ride in Pieriga region In Pieriga origin Park and Ride is found at various locations at train stations and/or regional bus sta-tions, although it is not called Park and Ride. This type of Park and Ride is already popular in Sigulda, Ogre, Aizkraukle, Iecava and Tukums. The city of Jelgava is surprisingly missing in this list. Typical for origin Park and Ride is that they are formed spontaneously. The Park and Ride strategy for these loca-tions is facilitating the existing parking lots with additional measures and promoting with a marketing campaign. This type of Park and Ride is considered of up most importance for improving regional ac-cessibility and is not very expensive to create. The locations at railway stations should be combined with bus stations where buses are terminating, collecting and delivering passengers from outside the railway corridors. First steps to expand this type of Park and Ride together with suggestions for a mar-keting campaign will be part of the preferred variant. Park and Ride in Riga city In Riga the policy of the city council focuses on combination of Park and Ride and additional facilities like shops, kindergartens and schools. International surveys show a Park and Ride can benefit from additional facilities but only if they are additional to a good located and well used Park and Ride. Creat-ing shops at a wrong placed Park and Ride will not automatically turn it into a popular Park and Ride. In Budapest the first Park and Rides were combined with large shopping centres in the surrounding neighbourhoods from the city centre. As a result these Park and Rides became very popular, but as parking lots at the shopping centres instead of park and ride facility. The actual amount of car traffic in-creased because visitors to the shopping centres were coming by car from different locations in the city. The expectations for destination Park and Ride’s in Riga are not considered high at present day. This is mostly because travel times by means of public transport are not faster but probably even slower than covering the last part of the trip by car. This means one of the main pull factors for the existence of Park and Ride is not available yet. Development of Park and Ride facilities in Riga will need investments in public transport priority systems at traffic lights and exclusive infrastructure at congested routes. For the preferred variant such measures will be studied. The second main reason to use Park and Ride facili-ties, lack of parking places or expensive paid parking at the destination, exists in Riga. Because of these reasons, it is recommended only to start with a few relatively small Park and Ride projects in Riga:
- Spice (500 parking places): after realisation of the new tramway to Riga Airport, later a new lar-ger P&R can be realised near the planned Exhibition Centre that will be realised in cooperation with the Frankfurter Messe;
- Alfa (500 parking places): near the terminal Smerlis (trolleybus lines) and a tramway stop of the new tramline Jugla – Central Station – Airport;
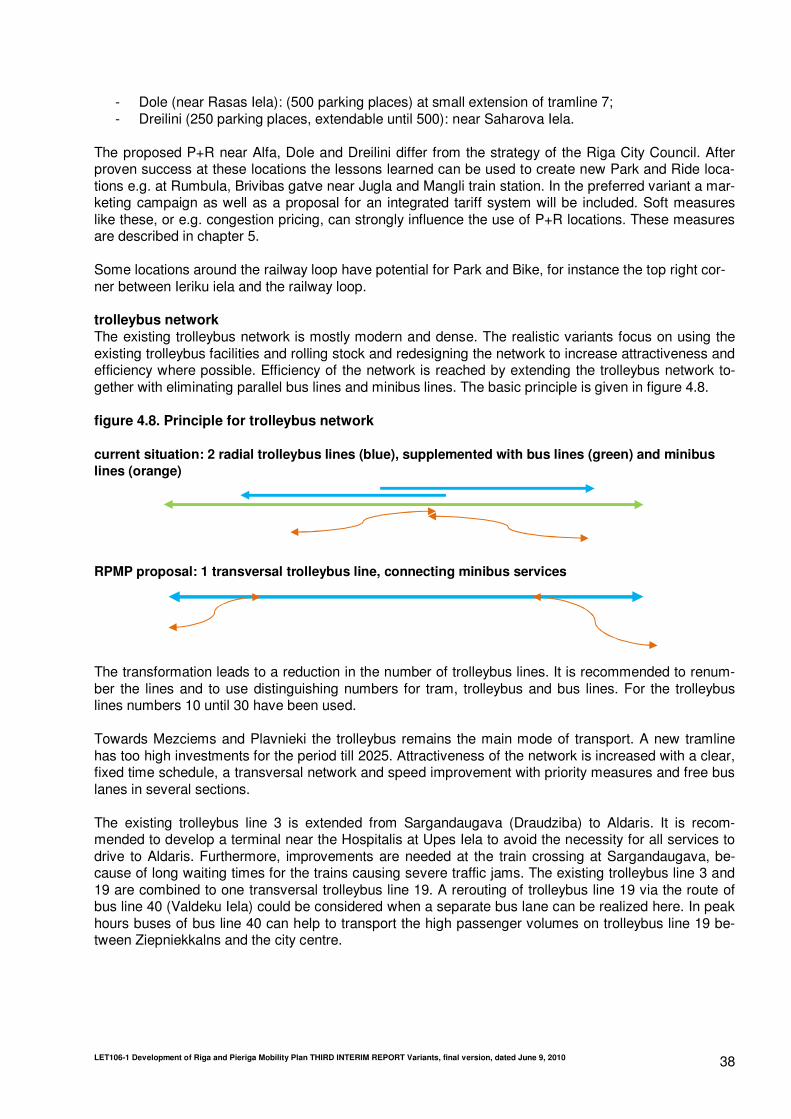
LET106-1 Development of Riga and Pieriga Mobility Plan THIRD INTERIM REPORT Variants, final version, dated June 9, 2010 38
- Dole (near Rasas Iela): (500 parking places) at small extension of tramline 7; - Dreilini (250 parking places, extendable until 500): near Saharova Iela.
The proposed P+R near Alfa, Dole and Dreilini differ from the strategy of the Riga City Council. After proven success at these locations the lessons learned can be used to create new Park and Ride loca-tions e.g. at Rumbula, Brivibas gatve near Jugla and Mangli train station. In the preferred variant a mar-keting campaign as well as a proposal for an integrated tariff system will be included. Soft measures like these, or e.g. congestion pricing, can strongly influence the use of P+R locations. These measures are described in chapter 5. Some locations around the railway loop have potential for Park and Bike, for instance the top right cor-ner between Ieriku iela and the railway loop. trolleybus network The existing trolleybus network is mostly modern and dense. The realistic variants focus on using the existing trolleybus facilities and rolling stock and redesigning the network to increase attractiveness and efficiency where possible. Efficiency of the network is reached by extending the trolleybus network to-gether with eliminating parallel bus lines and minibus lines. The basic principle is given in figure 4.8. figure 4.8. Principle for trolleybus network current situation: 2 radial trolleybus lines (blue), supplemented with bus lines (green) and minibus
lines (orange)
RPMP proposal: 1 transversal trolleybus line, connecting minibus services
The transformation leads to a reduction in the number of trolleybus lines. It is recommended to renum-ber the lines and to use distinguishing numbers for tram, trolleybus and bus lines. For the trolleybus lines numbers 10 until 30 have been used. Towards Mezciems and Plavnieki the trolleybus remains the main mode of transport. A new tramline has too high investments for the period till 2025. Attractiveness of the network is increased with a clear, fixed time schedule, a transversal network and speed improvement with priority measures and free bus lanes in several sections. The existing trolleybus line 3 is extended from Sargandaugava (Draudziba) to Aldaris. It is recom-mended to develop a terminal near the Hospitalis at Upes Iela to avoid the necessity for all services to drive to Aldaris. Furthermore, improvements are needed at the train crossing at Sargandaugava, be-cause of long waiting times for the trains causing severe traffic jams. The existing trolleybus line 3 and 19 are combined to one transversal trolleybus line 19. A rerouting of trolleybus line 19 via the route of bus line 40 (Valdeku Iela) could be considered when a separate bus lane can be realized here. In peak hours buses of bus line 40 can help to transport the high passenger volumes on trolleybus line 19 be-tween Ziepniekkalns and the city centre.

LET106-1 Development of Riga and Pieriga Mobility Plan THIRD INTERIM REPORT Variants, final version, dated June 9, 2010 39
Trolleybus line 4 is extended from Smerlis to Jugla-3 for half of the services. This line forms a new transversal line 14 together with existing line 27 towards Ilguciems. Bus line 40 can than be eliminated between Jugla-3 and Ziepniekkalns. Passengers from Jugla-3 to the central station can use the new trolleybus to the tramline and change to the tram. This leads to a more efficient operation with less par-allelism between lines. Passengers still have direct connections to the city centre. Trolleybus line 18 (Central Station – Mescziems) gets a new route via Purvciems and Dreilini to Mez-ciems. A new, separate bus infrastructure is needed between Purvciems and Hippocrata Iela. By ex-tending trolleybus line 18 to a new terminal at Motoru Muzejs (Mezciems) bus line 5 can be eliminated. This makes the network more efficient. Trolleybus line 11 and 27 has been combined to a new trolley-bus line 11. Trolleybus line 9 has been eliminated because of parallelism with the tram between Ilguciems and cen-tral station. Other lines are rerouted to minimise parallelism with tram and bus. The Brivibas gatve and Vansu bridge are important axles within the trolleybus network. Extensions of the trolleybus network give the possibility to reduce the number of buses and minibuses in the city centre and at the same time providing direct connections for passengers. Table 4.3 and Figure 4.9 give an overview of the trolleybus network. Additional measures related to bus stops, speeds improvements, time tables and connections to other PT modes are elaborated in the pre-ferred variant. In appendix VII (table VII.3) an overview of the trolley bus lines has been given. table 4.3. Description of RPMP trolleybus lines
Trolleybus lines From To Headway-peak number of trolleybuses
10 Upesgriva Iela Daugava 8 12 11 Abolu Iela Ieriku Iela 6 20 12 Andrejosta Iela Valmieras Iela 8 8 14 Ilguciems Jugla-3 6 22 14 Ilguciems Smerlis 6 16 15 Latvijas Universitate Viskus Iela 4 19 16 Smerlis Katlakalna Iela 8 11 17 Marupe Keguma Iela 8 15 18 Centrala stacija Motormzejs 4 22 19 Ziepniekkalns Aldaris 6 22 19 Ziepniekkalns Hospitalis (Brasa) 6 18 20 Latvijas Universitate Televizijas centrs 20 3 22 Petersalas Iela Plavnieki 4 22 Although many trolleybus lines have been extended have increased frequencies, the number of trolley-buses can be decreased compared to the current situation.
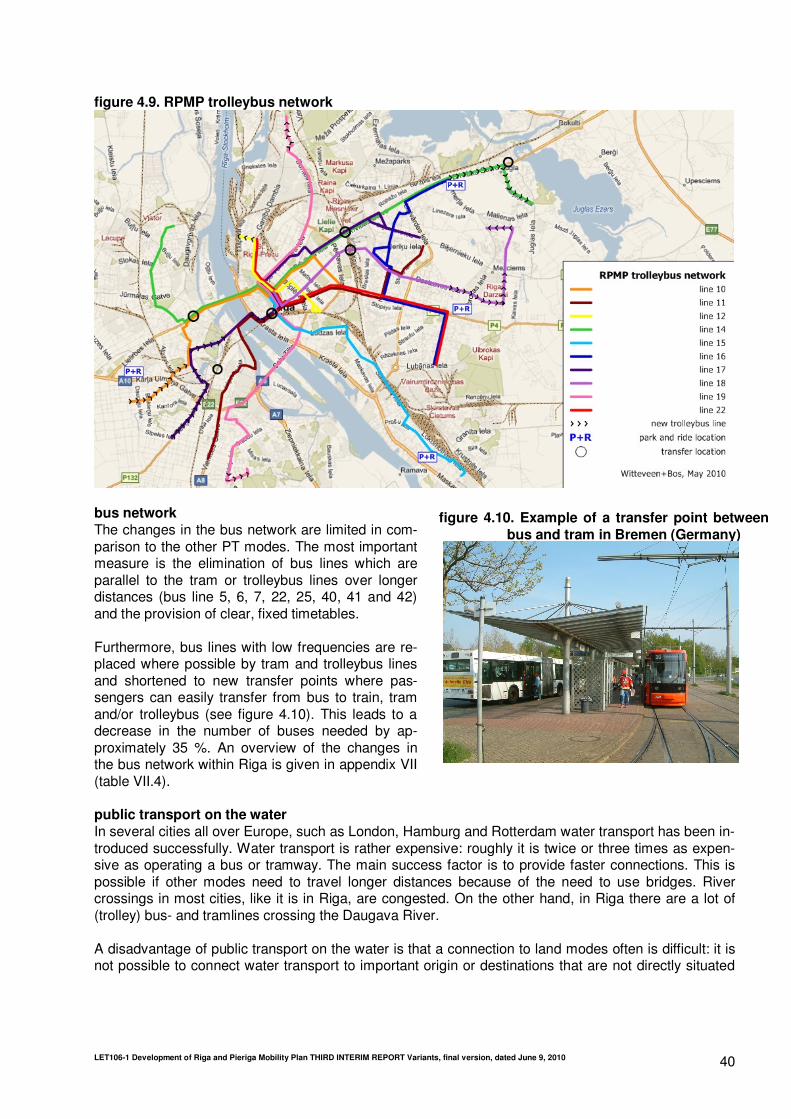
LET106-1 Development of Riga and Pieriga Mobility Plan THIRD INTERIM REPORT Variants, final version, dated June 9, 2010 40
figure 4.9. RPMP trolleybus network
bus network The changes in the bus network are limited in com-parison to the other PT modes. The most important measure is the elimination of bus lines which are parallel to the tram or trolleybus lines over longer distances (bus line 5, 6, 7, 22, 25, 40, 41 and 42) and the provision of clear, fixed timetables. Furthermore, bus lines with low frequencies are re-placed where possible by tram and trolleybus lines and shortened to new transfer points where pas-sengers can easily transfer from bus to train, tram and/or trolleybus (see figure 4.10). This leads to a decrease in the number of buses needed by ap-proximately 35 %. An overview of the changes in the bus network within Riga is given in appendix VII (table VII.4). public transport on the water In several cities all over Europe, such as London, Hamburg and Rotterdam water transport has been in-troduced successfully. Water transport is rather expensive: roughly it is twice or three times as expen-sive as operating a bus or tramway. The main success factor is to provide faster connections. This is possible if other modes need to travel longer distances because of the need to use bridges. River crossings in most cities, like it is in Riga, are congested. On the other hand, in Riga there are a lot of (trolley) bus- and tramlines crossing the Daugava River. A disadvantage of public transport on the water is that a connection to land modes often is difficult: it is not possible to connect water transport to important origin or destinations that are not directly situated
figure 4.10. Example of a transfer point between bus and tram in Bremen (Germany)
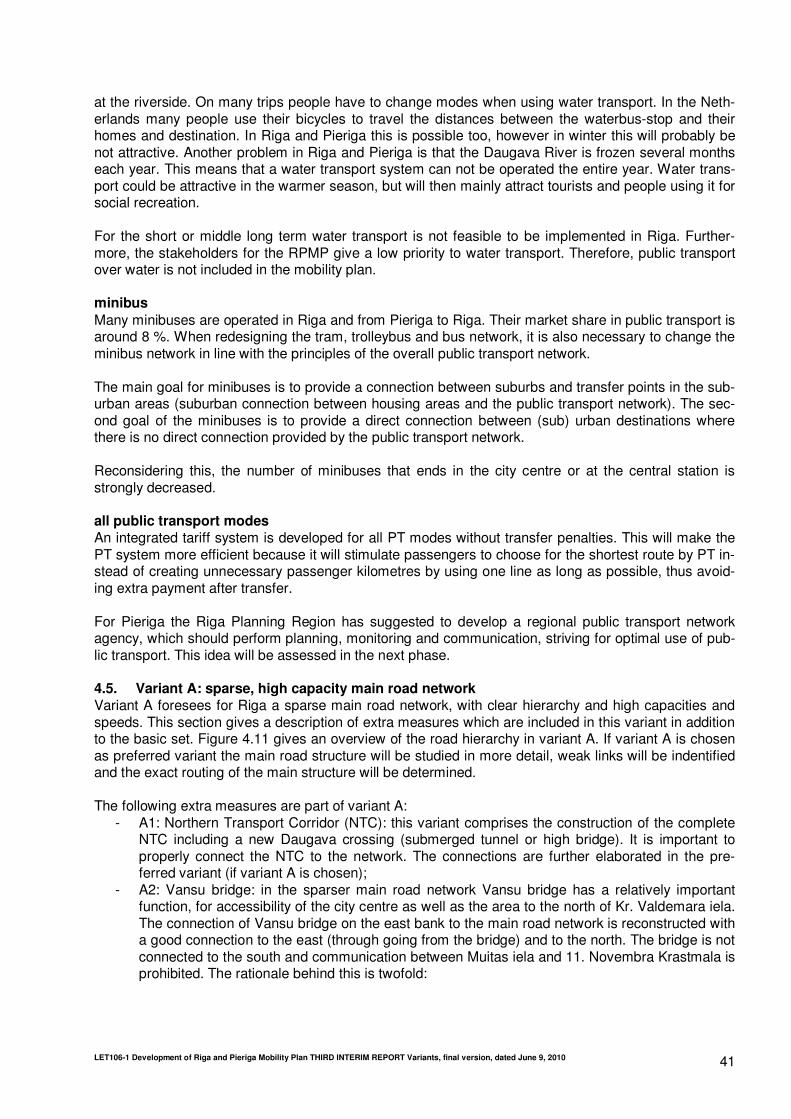
LET106-1 Development of Riga and Pieriga Mobility Plan THIRD INTERIM REPORT Variants, final version, dated June 9, 2010 41
at the riverside. On many trips people have to change modes when using water transport. In the Neth-erlands many people use their bicycles to travel the distances between the waterbus-stop and their homes and destination. In Riga and Pieriga this is possible too, however in winter this will probably be not attractive. Another problem in Riga and Pieriga is that the Daugava River is frozen several months each year. This means that a water transport system can not be operated the entire year. Water trans-port could be attractive in the warmer season, but will then mainly attract tourists and people using it for social recreation. For the short or middle long term water transport is not feasible to be implemented in Riga. Further-more, the stakeholders for the RPMP give a low priority to water transport. Therefore, public transport over water is not included in the mobility plan. minibus
Many minibuses are operated in Riga and from Pieriga to Riga. Their market share in public transport is around 8 %. When redesigning the tram, trolleybus and bus network, it is also necessary to change the minibus network in line with the principles of the overall public transport network. The main goal for minibuses is to provide a connection between suburbs and transfer points in the sub-urban areas (suburban connection between housing areas and the public transport network). The sec-ond goal of the minibuses is to provide a direct connection between (sub) urban destinations where there is no direct connection provided by the public transport network. Reconsidering this, the number of minibuses that ends in the city centre or at the central station is strongly decreased. all public transport modes An integrated tariff system is developed for all PT modes without transfer penalties. This will make the PT system more efficient because it will stimulate passengers to choose for the shortest route by PT in-stead of creating unnecessary passenger kilometres by using one line as long as possible, thus avoid-ing extra payment after transfer. For Pieriga the Riga Planning Region has suggested to develop a regional public transport network agency, which should perform planning, monitoring and communication, striving for optimal use of pub-lic transport. This idea will be assessed in the next phase. 4.5. Variant A: sparse, high capacity main road network Variant A foresees for Riga a sparse main road network, with clear hierarchy and high capacities and speeds. This section gives a description of extra measures which are included in this variant in addition to the basic set. Figure 4.11 gives an overview of the road hierarchy in variant A. If variant A is chosen as preferred variant the main road structure will be studied in more detail, weak links will be indentified and the exact routing of the main structure will be determined. The following extra measures are part of variant A:
- A1: Northern Transport Corridor (NTC): this variant comprises the construction of the complete NTC including a new Daugava crossing (submerged tunnel or high bridge). It is important to properly connect the NTC to the network. The connections are further elaborated in the pre-ferred variant (if variant A is chosen);
- A2: Vansu bridge: in the sparser main road network Vansu bridge has a relatively important function, for accessibility of the city centre as well as the area to the north of Kr. Valdemara iela. The connection of Vansu bridge on the east bank to the main road network is reconstructed with a good connection to the east (through going from the bridge) and to the north. The bridge is not connected to the south and communication between Muitas iela and 11. Novembra Krastmala is prohibited. The rationale behind this is twofold:

LET106-1 Development of Riga and Pieriga Mobility Plan THIRD INTERIM REPORT Variants, final version, dated June 9, 2010 42
⋅ without measures the bridge will be hardly accessible, and there is no space available for radi-cal measures;
⋅ connection with the south will be established by Akmens bridge, less than a kilometre south, and Salu bridge;
- A3: tangential route west bank: In this variant a route with some distance to the river bank is chosen to relieve the area between this route and the river bank from traffic wanting to use the NTC crossing. The route consists for the largest part of existing road. Furthermore, it includes construction of a connection from Jurkalnes iela to Jurmalas gatve as;
- A4: construction of an intersection of Augusta Deglava iela with the Eastern Magistral: this inter-section is necessary to create good connections between the inner and outer ring.
With the traffic model also the effect of a shortened NTC (only part belonging to city ring), a western ar-terial along the railway and an A7-A8 connection have been studied for this variant. The results are de-scribed in chapter 6. Based on the results the hierarchy as depicted in figure 4.11 is chosen for variant A. figure 4.11. Road hierarchy in variant A
4.6. Variant B: dense main road network
Variant B foresees for Riga a denser main road network, with more possible routes, but less capacity per route. This section gives a description of extra measures which are included in this variant in addi-tion to the basic set. Figure 4.12 gives an overview of the road hierarchy in variant B. If variant B is cho-sen as preferred variant the main road structure will be studied in more detail, weak links will be indenti-fied and the exact routing of the main structure will be determined. The following measures are part of variant B:
- B1: Hanzas bridge: Hanzas bridge is included in this variant as an important connection be-tween the two banks of the Daugava for both through going traffic and local traffic. This bridge is realized with good connection in all directions. This means a connection with Daugavgrivas iela in the west and Hanzas iela in the east, connecting on both banks in north south direction;

LET106-1 Development of Riga and Pieriga Mobility Plan THIRD INTERIM REPORT Variants, final version, dated June 9, 2010 43
- B2: Vansu bridge: in the road hierarchy of variant B Vansu bridge has a less important function. The connection of this bridge to the main road network is reconstructed with only one possible direction for traffic leaving the bridge on the east bank: in eastern direction. Right and left turns from the Kr. Valdemara iela close to the bridge are closed. This will solve congestion problems in the near future. Communication with the east bank north-south and vice versa is established with the Hanzas crossing;
- B3: tangential route west bank: upgrade of existing roads (Daugavgrivas iela, Slokas iela, Muku-salas iela) to realize a good north-south connection on the west bank. In this variant a route closer to the river bank is chosen to guide traffic between Kalnciema iela and the Hanzas cross-ing. A tunnel at Tornakalns is not considered of great transport importance for the short term, since the Hanzas bridge will reduce the traffic pressure on this route;
- B4: construction of connection from Pernavas iela (city centre ring) to the Eastern Magistral: a good connection between the inner and outer ring is necessary; this proposed connection is an alternative for connection of A. Deglava iela.
In the situation with the Hanzas crossing and without the NTC crossing the model shows some conges-tion related to the radials Ganibu dambis, Duntes iela and Gaujas iela, to the north of the railway cross-ings. These minor bottlenecks will be optimised by local traffic engineering measures, depending on variant choice elaborated in the preferred variant. figure 4.12. Road hierarchy in variant B
4.7. Variant C: use of the Southern bridge Variant C focuses on better use of the Southern bridge and proposes a road hierarchy without the con-struction of a new river crossing in Riga. This section gives a description of extra measures which are included in this variant in addition to the basic set. Figure 4.13 gives an overview of the road hierarchy in variant C. If variant C is chosen as preferred variant the main road structure will be studied in more detail, weak links will be indentified and the exact routing of the main structure will be determined.

LET106-1 Development of Riga and Pieriga Mobility Plan THIRD INTERIM REPORT Variants, final version, dated June 9, 2010 44
The following measures are part of variant C: - C1: tangential route west bank including direct connection (tunnel) between Ranka Dambis and
Mukusalas iela: without a new river connection the Southern bridge becomes more important in the road hierarchy. To relieve congestion on the other bridges more traffic should use the Southern bridge. Therefore, an improved route on the west bank leading to this bridge is neces-sary. The route consists in this variant of an upgrade of existing roads (Daugavgrivas iela, Slo-kas iela, Mukusalas iela). To be able to accommodate the large traffic flow in this variant a better connection between Ranka Dambis and Mukusalas iela is included;
- C2: construction of connection from Pernavas iela (city centre ring) to the Eastern Magistral: a good connection between the inner and outer ring is necessary; this proposed connection is an alternative for connection of A. Deglava iela. It can be established with an upgrade of the Vietal-vas iela between Pernavas and Vestienas iela;
- C3: traffic management: an extensive set of traffic management measures will be implemented on the routes leading toward the Southern bridge to improve the use of this bridge. Furthermore, also on the main radials traffic management will be implemented.
figure 4.13. Road hierarchy in variant C8
8 Vansu bridge is part of the city ring in this variant, however this bridge is not accessible for heavy freight traffic

LET106-1 Development of Riga and Pieriga Mobility Plan THIRD INTERIM REPORT Variants, final version, dated June 9, 2010 45
4.8. Bicycle and pedestrian network
Part of the RPMP will be a bicycle and pedestrian network. For Pieriga the focus will be on safe cross-ings of the state roads and railways. Measures will be developed based on a traffic safety analysis. For Riga the focus is on connecting to the main attraction points within the city in a direct and safe way. For Riga city centre a first sketch of a bicycle and pedestrian network has been made. In principle there can be two separate networks for bicycles and pedestrians. However, combining them into one network will give more emphasis on necessary facilities for non-motorised transport (NMT). Moreover, cyclists are also pedestrians for parts of their trips. For drawing up the NMT network the following issues have been taken into account:
- existing plans (figure 3.3 from the first interim report; analysis current situation); - the entire downgrading of Akmens bridge and 11. Novembra krastmala; - the entire downgrading of Terbatas iela and Kr. Barona iela; - the possible downgrading of Kr. Valdemara iela; - the connection with railway stations; - the connection with the marine passenger terminal; - the connection with main activity centres, like sports facilities, libraries, schools etc; - the connection with Riga outside the railway loop on the east bank; - the difficulty to cycle in the old town.
Figure 4.14 shows the NMT network for the Riga city centre. Routes have been chosen that connect important activity centres, but at the same time are relatively quiet with car traffic. It is not the case that NMT will make trips from activity centre to activity centre. The reason for connecting them is to increase NMT demand and to make routes more attractive for travelling. It is possible and often inevitable to use also major car roads for the NMT network. Studies in the Netherlands have shown, however, that those links are considered less attractive. Also, they are more subject to accidents with cars and cyclists in-volved. It should be noted that figure 4.14 does not want to suggest that on all the streets of the network reconstruction is necessary. Already with soft measures cyclists can be pointed towards the network. Moreover, in a 30 km zone separate infrastructure for cycling is not considered preferable. As already stated in the analysis report the old town is not attractive for cycling, due to the cobble stone roads. In order to connect Akmens bridge and the west bank to the city centre it is however necessary to be able to cross the old town by bike. For this one or two through going routes should be (partly) adapted as far as possible in relation to protection of the cobble stone roads in the Latvian Law and the UNESCO status of the old town. For NMT terminating in the old town, bicycle parking places should be established (preferably guarded and free of charge). Difficult points in the network are crossings of the river and the railway lines. Vansu bridge is included in the network, because there is already a bicycle route established. When the university has migrated to Tornakalns, Akmens bridge becomes a more obvious choice for crossing the river, also because cy-clists do not need to climb. For the crossings of the railway loop there are several options. Appendix VIII gives some basic examples of these options. For NMT as well as car traffic it would be best to make dedicated crossings for NMT, although these crossings might suffer more from a lack of social safety. They can be bridges or tunnels, as stand alone infrastructure or incorporated in buildings. In the case of development of the railway loop areas, plans should incorporate solutions for NMT. For the preferred variant a sketch will be made of the area around the railway station Zemitani and the central station. There, NMT could connect with rail and car, offering an opportunity to travel by bicycle into the city cen-tre and park the bicycle in a special locker once returned at the interchange (Park and Bike). Of course, commuters would then also need to have the opportunity to park their bicycle at the employer. For pedestrians a more detailed analysis should point out the locations where improvements are desir-able. One can for instance think of the connection between the central station, the market area and the riverfront. Currently, this connection is hardly existing.
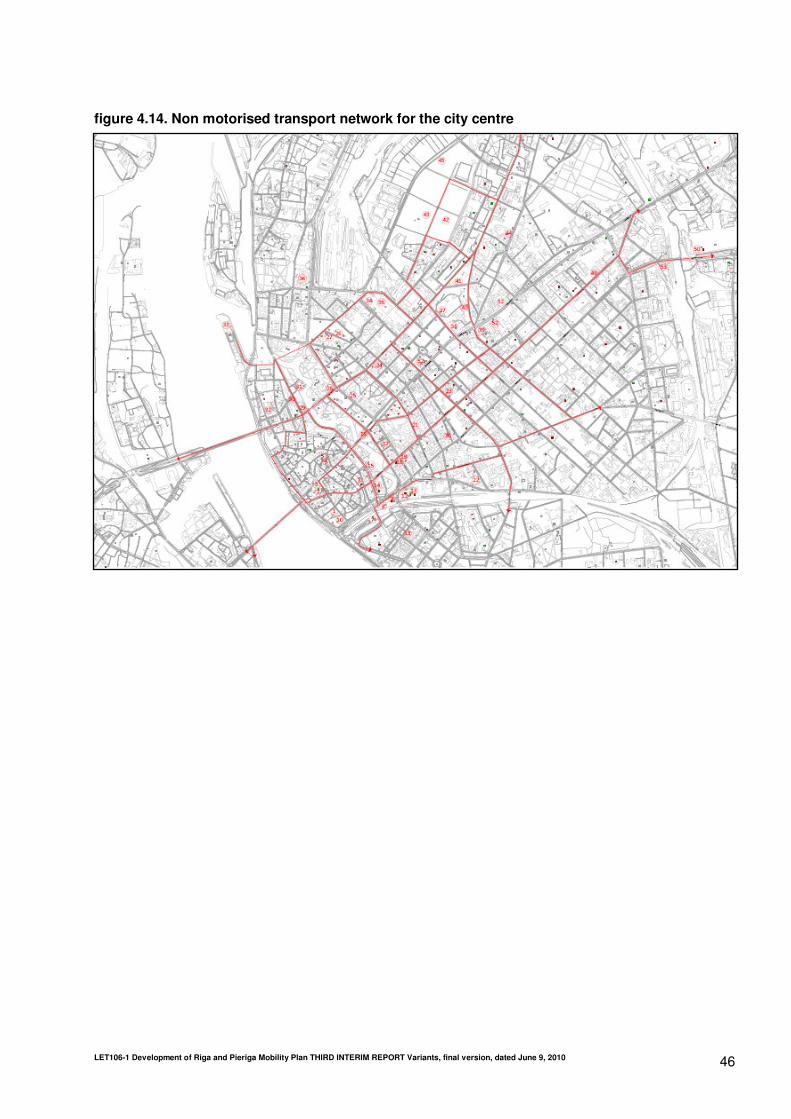
LET106-1 Development of Riga and Pieriga Mobility Plan THIRD INTERIM REPORT Variants, final version, dated June 9, 2010 46
figure 4.14. Non motorised transport network for the city centre
LET106-1 Development of Riga and Pieriga Mobility Plan THIRD INTERIM REPORT Variants, final version, dated June 9, 2010 47
5. SOFT MEASURES
This chapter presents several soft measures which can be part of the final RPMP. The previous chapter described the three variants, which have been distinguished by the structure of the traffic and transport system. Soft measures are implemented to change or improve the functioning of this system. The word ‘soft’ does not necessarily mean that effects are small, but is instead related to measures outside the scope of infrastructure improvements and road construction.This chapter presents possibilities for soft measures and their effect on the functioning of the transport system. After choosing the preferred struc-ture for the transport system, the soft measures in this chapter will be further developed for the pre-ferred variant. One of the categories of soft measures, mobility management, is not included in this chapter, but will also be addressed in the next phase of the RPMP development. 5.1. Demand management measures and road pricing
Next to infrastructure and transport system development stand all kind of demand management strate-gies aiming at reducing demand for infrastructure. Current examples in Riga are parking control, entry prohibitions for trucks and the loop system in the old town. Examples elsewhere are the establishment of environmental/LOW Emission Zones, high occupancy lanes and road pricing measures. This section focuses on road pricing. Just as parking policy this policy can combine accessibility with liveability objectives, raising revenues at the same time. Road pricing might reduce the need for new in-frastructure, but can also be used to subsidize this and other transport system improvements. The main rationale behind road pricing as a demand strategy is that users should pay for the negative external-ities they create by consuming road space, thus encouraging the redistribution of the demand in space or in time, or shifting it to the consumption of a substitute public good; for example, switching from pri-vate transport to public transport. Objectives in line with this approach are related to e.g. efficiency, economic growth, equity, and environment. Sometimes it is not used as demand strategy, but solely to raise revenues. The French toll roads are an example of that approach. Sometimes it is seen as an op-tion to restructure the parking policy and parking infrastructure. Four general types of systems can be distinguished: - one or more cordons around areas, with charges for passing the cordon line (e.g. in Stockholm,
Singapore and several Norwegian cities). The charges may vary with access location, time of day, vehicle type, and direction of travel;
- area licensing, with charges for being authorized to enter or stay inside an area during a period of time (e.g. in London). The charge may vary with time and vehicle type;
- distance or time based pricing. The charge is based upon distance or time a vehicle travels in an area or on a certain route, and may vary with time, location and vehicle type;
- corridor or single facility pricing, where access to a lane or a facility is priced. All systems have their own advantages and disadvantages. Single facility pricing is arguably the easiest to implement, but might lead to adverse route effects in the case of clear alternative routes. Area licens-ing can also be easy to install, but 24hour licenses provide the opportunity to drive through the area as much as wanted. Cordon pricing does not give an incentive to limit the time spent in the area and might boost internal car traffic, taking advantage of freed road space. Distance or time based pricing gives ex-tra pressure on roads around the area, since drivers want to make the route in the pricing area as short as possible. The systems can also be mixed, even together with parking control, to arrive to more com-prehensive systems with better results. Public acceptance for these systems might on the other hand be more difficult to establish. Road pricing systems and parking policy can have similar effects on the transport system and can raise similar revenues. However, road pricing strategies can reach further than parking policy strategies, in that they can: - reduce through and rat run traffic;
LET106-1 Development of Riga and Pieriga Mobility Plan THIRD INTERIM REPORT Variants, final version, dated June 9, 2010 48
- reduce (working) trips to parking places outside the control of parking policy; - manage the traffic over the network; - establish charges in a monopoly condition, whereas parking charges have to be in line with
charges levied by commercial stakeholders. They can form an alternative to priced parking, but can also be complementary. The question is how feasible a road pricing system would be in Riga city. First of all, the city has some strong point for establishing a road pricing scheme: - the city is monocentric, with strong commuting streams into the city; - there are no neighbouring, competitive centres; - through traffic can use alternative routes, like the route via the Southern bridge; - there are suitable locations for establishing a cordon, like the railway loop and the river. From a network perspective, in all variants a road pricing scheme is feasible. All variants contain a package with public transport measures, including P&R facilities, to give car drivers a better alternative (carrot-and-stick approach). In variant C toll can be raised on Vansu, Akmens and Salu bridge to stimu-late traffic to use the route via the Southern bridge. The drawback of this scheme is that Slavu Iela will become more congested, so car drivers are not provided with a good alternative. It will be more accept-able to combine a road pricing scheme with new infrastructure for cars and trucks, as is the case in variant A and B. In those variants facility pricing can be implemented on the central bridges to push traf-fic to the outer crossings and the ring. This system can be combined or replaced with area licensing or cordon based pricing, with which the cordon could lie on the inside of the city ring. A combination will avoid internal car traffic using the freed capacity on the bridges. Further traffic calming and environ-mental benefits can be established by introducing a distance or time based pricing, so that drivers tend to drive along the city ring as long as possible before entering the pricing area. This would prevent car traffic within the area on both river banks. On the other hand, it might lead to extra car kilometers, and less reduction of car traffic directed to the centre. From variant A and B the first variant gives arguably the best conditions for implementing a road pricing scheme, since the NTC route and crossing, as well as the city ring in this variant, will provide more capacity to accommodate toll-free traffic. Facility pricing on the NTC route is not considered to be a good option, since it will divert traffic to centre routes and bridges. The conclusion is that a road pricing scheme could reinforce the road hierarchy and raise funds for pub-lic transport and road infrastructure at the same time. It can be combined with all variants, but variant A provides the best conditions. In all situations Slavu Iela will remain a bottleneck. This bottleneck can be partly controlled with the charging schemes, although charges should be more or less fixed in order to gain public acceptance. There are many elements that need to be considered for a proper implementation of a road pricing scheme. A study on judgmental approaches to cordon design among six UK local authorities at different stages in the development of road pricing proposals led to the following recommendations (May et al, 2002). Avoid adverse impacts • Provide alternative routes for drivers who want to bypass the charged area • Avoid dispersion of environmental or congestion problem to other areas • Only cover the area having good public transport service • Provide interchange facilities outside the cordon • Charge all entries to the charge area • Avoid making entry points visually unattractive • Place cordons at boundaries between land use types Gain public acceptance • Ensure that the cordon and charge structure is simple and easy to understand

LET106-1 Development of Riga and Pieriga Mobility Plan THIRD INTERIM REPORT Variants, final version, dated June 9, 2010 49
• Charge at levels which are perceived as fair and acceptable by the public • Avoid problems of local and commercial inequities • Charge traffic which contributes most to congestion and pollution • Charge traffic which is of least benefit to the area • Avoid charging the city’s residents • Avoid charging people from low income areas of the city Practicality • Minimise the number of charging points • Design to limit the scheme’s operating costs • Avoid types of road that cannot be charged • Avoid areas or locations that may cause communication problems for the system • Locate cordon wholly inside the city authority area Public acceptance has proven to be the Achilles heel for the implementation of road pricing systems. Critics state that congestion pricing is not equitable, places an economic burden on neighbouring com-munities, has a negative effect on retail businesses and on economic activity in general, and is just an-other tax. Experience from the few cities where road pricing has been implemented shows that social and political acceptability is an essential requirement. In several cities pilots were started, but public or political opposition prevented actual implementation. Also in Riga a pilot project has been carried out regarding the old town, but has been suspended. Public acceptance is considered to be strongly related to the objectives of the system as communicated with the public, and the way how revenues are used. There is a strong link between scheme design and the cost of operation. It is therefore advisable to conduct some business modelling early on in the scheme design process. This would allow the various scheme options to be assessed in line with the objectives that have been set and assist with selecting the best solution. It would also assist with the selection of an appropriate range of charges and exemp-tions. Finally, a note on behavioural reactions to road pricing schemes needs to be addressed. On the short term, reactions can be related to rerouting, retiming or modal shift. Reactions on the longer term are re-lated to e.g. destination choice, car ownership and location decisions. In the case of high charges com-panies might relocate to areas outside the city centre. This deconcentration might be regarded as a fa-vourable trend for monocentric Riga, but if uncontrolled, it might lead to more car kilometres and there-fore more emission of CO2. 5.2. Parking
Parking policy is supportive to the preferred variant and is considered as a soft measure in the model-ling perspective, although effects of a well balanced parking policy can be very well visible. In the plan-ning horizon of the RPMP a growth of car ownership is foreseen in 2025 of nearly 60 % compared to 2007. This will increase the demand for parking places in Riga and Pieriga as well. The main idea is not to increase the amount of parking places with the same level as car ownership growth. Instead regula-tion of demand versus capacity by means of a mix of paid parking, park and ride and possibly a system of road charging is proposed. Constructing new parking lots or parking garages at city centres should be considered carefully, since these also attract traffic to the locations and thus into the city centres. Every used parking place in a city centre generates roughly 6-10 car trips per day and therefore in-creases the traffic flow on the main roads leading towards the parking place. Parking policy is a municipal responsibility and should be seen as part of the strategy for the complete mobility system in the municipality. Main ideas for the parking policy are: - parking places in the city centres or community centres should be available for visitors; - increasing the amount of parking places in city centres, especially in Riga centre should be consid-
ered carefully due to the amount of extra car trips they generate;
LET106-1 Development of Riga and Pieriga Mobility Plan THIRD INTERIM REPORT Variants, final version, dated June 9, 2010 50
- Park and Ride locations (start with approximately 1.750 - 2.000 new places and expandable when proven successful) are mainly for workers and visitors. These locations are also the main locations to increase the total amount of parking places in Riga;
- a structural occupancy rate of 80% in an area or zone is seen as indicator to raise parking tariffs or to install paid parking at these locations in order to lower pressure in these areas;
- municipality as co-ordinator of the available parking places. Development of new parking lots or ga-rages in areas should be confronted with the parking policy for the area. This means the new devel-oped parking lots, independent of whether it is a public or private initiative, should have the same parking tariff structure and regulations as set for the area;
- development plans for new residential buildings or commercial buildings should create the neces-sary parking places in principle at their own property.
5.3. Public transport fares, tickets and organisation
The fare and ticket system has considerable influence on the number of travellers who choose for pub-lic transport and therefore on the revenues from ticket sales. Although the fare structure and the ticket system are strongly interrelated, different requirements on both elements can be defined. fare structure
The fare structure should fulfil the following requirements: 1. The fare level should be acceptable in relation to the average income of the target groups. This me-ans that the fares should be affordable, especially for so-called captive passengers who have no rea-sonable travel alternative for public transport. Patronage of public transport is influenced by the fare level to a certain degree, which is the so-called price elasticity. This elasticity is usually around - 0.4 which means that if the fare level is increased by for example 10 % (above the normal inflation rate), the patronage will decrease by (- 0.4 x 10 % =) - 4.0 %. The actual level of the price elasticity depends on several factors, among which the time scope (it takes some time for travellers to react on a price change), the travel purpose (work or private), the trip length, increase or decrease of the price, the current fare level in relation to the income of travellers, the per-centage of increase or decrease of the price, and it is different for frequent and not-frequent passen-gers. 2. The fare level should be reasonable in relation to the quality of the public transport product that is provided in terms of availability, punctuality, travel speed, comfort, etc. 3. The fare structure should meet the travel needs of the different categories of passengers. This me-ans that there should be an assortment of different fares for different travel purposes. For example fre-quent travellers prefer a fare that allows an unlimited number of trips in a certain period whereas not frequent passengers prefer single trip fares. 4. Generally speaking all passengers prefer a fare structure that allows access to all public transport modes (train, tram, trolleybus, bus, minibus) and to all lines within the area where they travel on a regu-lar basis. 5. Rigas Satiksme currently applies a fare structure which is mainly based on a flat rate and does not take the trip duration and/or trip length into account. However, the costs of the operation are mainly ba-sed on the duration and the length of the vehicle trips. Most passengers accept that the fare for a trip is higher in relation to the length of the trip. A distance-based fare will discourage passengers to choose for trips with a detour instead of a shorter trip with transfers. This will no doubt reduce the number of passenger kilometres and will thus reduce the operation costs.
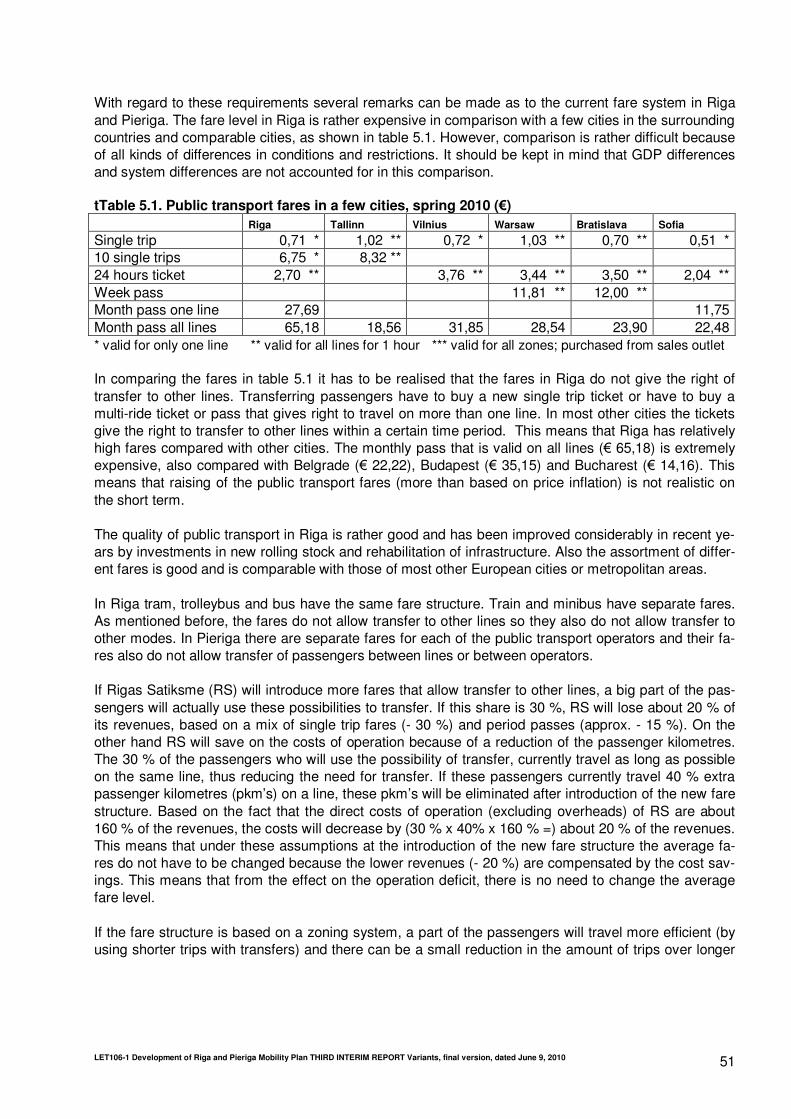
LET106-1 Development of Riga and Pieriga Mobility Plan THIRD INTERIM REPORT Variants, final version, dated June 9, 2010 51
With regard to these requirements several remarks can be made as to the current fare system in Riga and Pieriga. The fare level in Riga is rather expensive in comparison with a few cities in the surrounding countries and comparable cities, as shown in table 5.1. However, comparison is rather difficult because of all kinds of differences in conditions and restrictions. It should be kept in mind that GDP differences and system differences are not accounted for in this comparison.
tTable 5.1. Public transport fares in a few cities, spring 2010 (€)
Riga Tallinn Vilnius Warsaw Bratislava Sofia
Single trip 0,71 * 1,02 ** 0,72 * 1,03 ** 0,70 ** 0,51 * 10 single trips 6,75 * 8,32 ** 24 hours ticket 2,70 ** 3,76 ** 3,44 ** 3,50 ** 2,04 ** Week pass 11,81 ** 12,00 ** Month pass one line 27,69 11,75 Month pass all lines 65,18 18,56 31,85 28,54 23,90 22,48 * valid for only one line ** valid for all lines for 1 hour *** valid for all zones; purchased from sales outlet In comparing the fares in table 5.1 it has to be realised that the fares in Riga do not give the right of transfer to other lines. Transferring passengers have to buy a new single trip ticket or have to buy a multi-ride ticket or pass that gives right to travel on more than one line. In most other cities the tickets give the right to transfer to other lines within a certain time period. This means that Riga has relatively high fares compared with other cities. The monthly pass that is valid on all lines (€ 65,18) is extremely expensive, also compared with Belgrade (€ 22,22), Budapest (€ 35,15) and Bucharest (€ 14,16). This means that raising of the public transport fares (more than based on price inflation) is not realistic on the short term. The quality of public transport in Riga is rather good and has been improved considerably in recent ye-ars by investments in new rolling stock and rehabilitation of infrastructure. Also the assortment of differ-ent fares is good and is comparable with those of most other European cities or metropolitan areas. In Riga tram, trolleybus and bus have the same fare structure. Train and minibus have separate fares. As mentioned before, the fares do not allow transfer to other lines so they also do not allow transfer to other modes. In Pieriga there are separate fares for each of the public transport operators and their fa-res also do not allow transfer of passengers between lines or between operators. If Rigas Satiksme (RS) will introduce more fares that allow transfer to other lines, a big part of the pas-sengers will actually use these possibilities to transfer. If this share is 30 %, RS will lose about 20 % of its revenues, based on a mix of single trip fares (- 30 %) and period passes (approx. - 15 %). On the other hand RS will save on the costs of operation because of a reduction of the passenger kilometres. The 30 % of the passengers who will use the possibility of transfer, currently travel as long as possible on the same line, thus reducing the need for transfer. If these passengers currently travel 40 % extra passenger kilometres (pkm’s) on a line, these pkm’s will be eliminated after introduction of the new fare structure. Based on the fact that the direct costs of operation (excluding overheads) of RS are about 160 % of the revenues, the costs will decrease by (30 % x 40% x 160 % =) about 20 % of the revenues. This means that under these assumptions at the introduction of the new fare structure the average fa-res do not have to be changed because the lower revenues (- 20 %) are compensated by the cost sav-ings. This means that from the effect on the operation deficit, there is no need to change the average fare level. If the fare structure is based on a zoning system, a part of the passengers will travel more efficient (by using shorter trips with transfers) and there can be a small reduction in the amount of trips over longer

LET106-1 Development of Riga and Pieriga Mobility Plan THIRD INTERIM REPORT Variants, final version, dated June 9, 2010 52
distances. More efficient travelling can lead to cost reduction and an increase in the current cost cover-age percentage. ticket system
All over the world the traditional paper ticket systems are being replaced by electronic ticket systems. Reasons for this development are the better possibilities on automatic inspection of the tickets and the collection of information on patronage. This information can be a basis for allocation of the revenues of ticket sales to the different operators and transport modes in case of an integrated fare structure in a certain area. As a result of the increased use of electronic ticket systems the price of implementation of these systems has decreased in recent years and is now comparable with paper systems. Rigas Satik-sme (RS) has recently implemented an electronic ticket system. improvements of the fare structure and the ticket system
The new electronic ticket system in Riga is still based on a flat fare which does not allow transfer to other modes and lines; if passengers board another vehicle, they have to validate their ticket again. It is advised that Riga will introduce fares that are based on free transfer within certain time limits. This will improve the efficiency of the operation and will probably not lead to decrease of the revenues as ex-plained above (Sub 4 of ‘fare structure’). Many other cities apply time-related fares allowing free trans-fer during time periods of 15 minutes, 30 minutes, 60 minutes and 90 minutes. This will offer a choice for passengers who will have a better understanding that they pay for what they actually use. On a longer term introduction of a zoning system in the fare structure is recommended in which the area which is served by RS will be divided in two or three zones. As explained above this will raise the cost coverage of RS and in combination with the time-related free transfer this system will provide opti-mum value for money to passengers. Like most electronic systems that are currently in use, the ticket system of RS is a so-called ‘check-in system’ which means that passengers only have to validate their ticket when they board the vehicle at a stop. Consequently, no information is collected about the stops where the passengers leave the vehi-cle. Complete data of the origin to destination flows of passengers is available only if ‘check-in-and-check-out systems’ are applied. These systems are much more complicated and consequently, much more expensive. Besides this, complications arise if passengers forget to check out. A check-in and check-out system is being applied for the nationwide fare structure in the Netherlands. It is advised that Riga will not apply a check-in-and-check-out system in the coming years because of operational com-plexity and the costs. Public Transport Authority
Based on current bottlenecks in public transport a new concept for organising public transport in Riga and Pieriga is developed, taking in mind the best practices from mayor urban areas in North and West-ern Europe. The institutional framework foresees in the establishment of a public transport authority which is organising the public transport for the whole Pieriga region, for all modes of public transport: local PT, minibuses, regional buses and regional trains. Integrating will promote the service level of the PT and the ridership. The tasks and responsibilities of the PTA will be integrated. The Riga Planning Region is the most suitable existing organisation to get this tasks delegated to. The costs analysis showed the financial benefits integrating PT. The legal impact amending the necessary laws and regu-lation are limited, most probably the political will to change the institutional framework is more impor-tant.
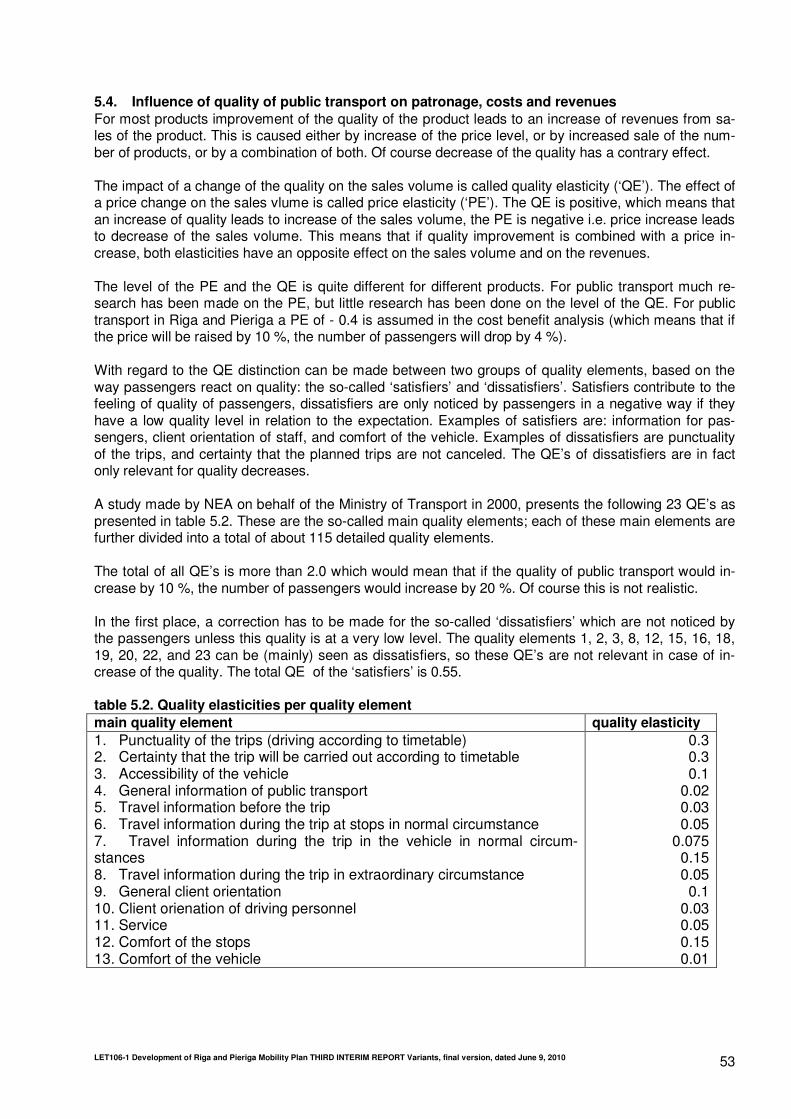
LET106-1 Development of Riga and Pieriga Mobility Plan THIRD INTERIM REPORT Variants, final version, dated June 9, 2010 53
5.4. Influence of quality of public transport on patronage, costs and revenues
For most products improvement of the quality of the product leads to an increase of revenues from sa-les of the product. This is caused either by increase of the price level, or by increased sale of the num-ber of products, or by a combination of both. Of course decrease of the quality has a contrary effect. The impact of a change of the quality on the sales volume is called quality elasticity (‘QE’). The effect of a price change on the sales vlume is called price elasticity (‘PE’). The QE is positive, which means that an increase of quality leads to increase of the sales volume, the PE is negative i.e. price increase leads to decrease of the sales volume. This means that if quality improvement is combined with a price in-crease, both elasticities have an opposite effect on the sales volume and on the revenues. The level of the PE and the QE is quite different for different products. For public transport much re-search has been made on the PE, but little research has been done on the level of the QE. For public transport in Riga and Pieriga a PE of - 0.4 is assumed in the cost benefit analysis (which means that if the price will be raised by 10 %, the number of passengers will drop by 4 %). With regard to the QE distinction can be made between two groups of quality elements, based on the way passengers react on quality: the so-called ‘satisfiers’ and ‘dissatisfiers’. Satisfiers contribute to the feeling of quality of passengers, dissatisfiers are only noticed by passengers in a negative way if they have a low quality level in relation to the expectation. Examples of satisfiers are: information for pas-sengers, client orientation of staff, and comfort of the vehicle. Examples of dissatisfiers are punctuality of the trips, and certainty that the planned trips are not canceled. The QE’s of dissatisfiers are in fact only relevant for quality decreases. A study made by NEA on behalf of the Ministry of Transport in 2000, presents the following 23 QE’s as presented in table 5.2. These are the so-called main quality elements; each of these main elements are further divided into a total of about 115 detailed quality elements. The total of all QE’s is more than 2.0 which would mean that if the quality of public transport would in-crease by 10 %, the number of passengers would increase by 20 %. Of course this is not realistic. In the first place, a correction has to be made for the so-called ‘dissatisfiers’ which are not noticed by the passengers unless this quality is at a very low level. The quality elements 1, 2, 3, 8, 12, 15, 16, 18, 19, 20, 22, and 23 can be (mainly) seen as dissatisfiers, so these QE’s are not relevant in case of in-crease of the quality. The total QE of the ‘satisfiers’ is 0.55. table 5.2. Quality elasticities per quality element
main quality element quality elasticity
1. Punctuality of the trips (driving according to timetable) 2. Certainty that the trip will be carried out according to timetable 3. Accessibility of the vehicle 4. General information of public transport 5. Travel information before the trip 6. Travel information during the trip at stops in normal circumstance 7. Travel information during the trip in the vehicle in normal circum-stances 8. Travel information during the trip in extraordinary circumstance 9. General client orientation 10. Client orienation of driving personnel 11. Service 12. Comfort of the stops 13. Comfort of the vehicle
0.3 0.3 0.1
0.02 0.03 0.05
0.075 0.15 0.05 0.1
0.03 0.05 0.15 0.01
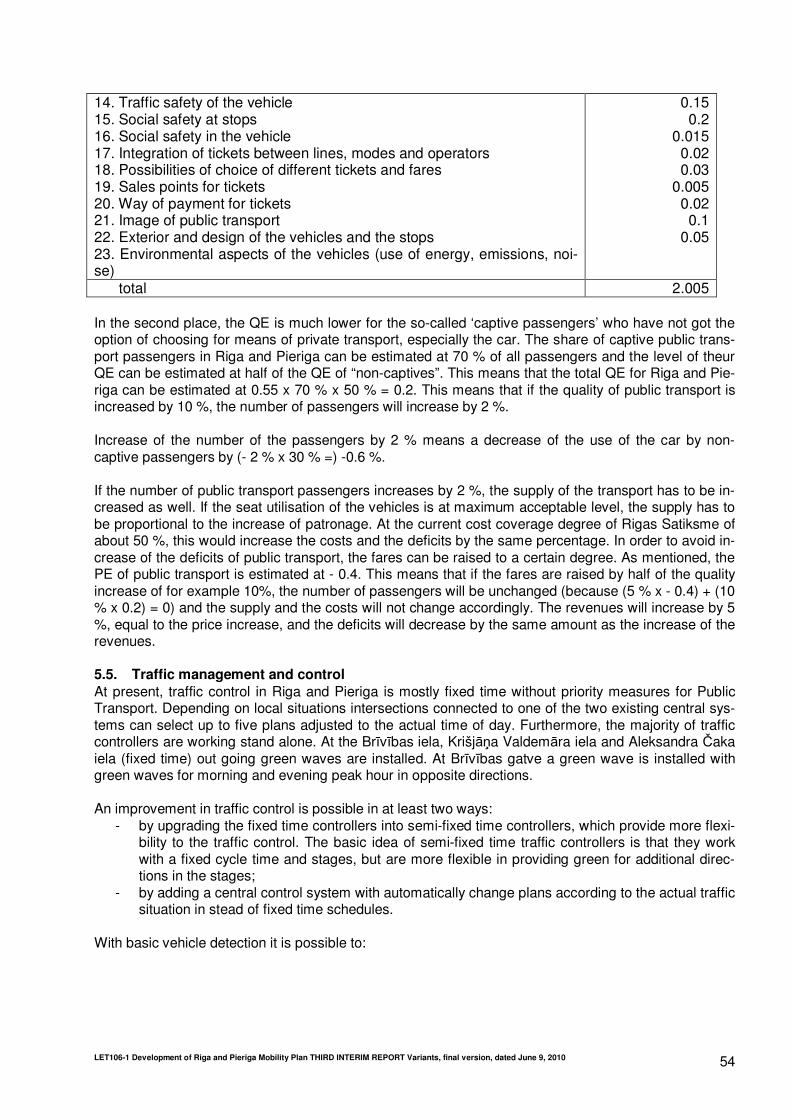
LET106-1 Development of Riga and Pieriga Mobility Plan THIRD INTERIM REPORT Variants, final version, dated June 9, 2010 54
14. Traffic safety of the vehicle 15. Social safety at stops 16. Social safety in the vehicle 17. Integration of tickets between lines, modes and operators 18. Possibilities of choice of different tickets and fares 19. Sales points for tickets 20. Way of payment for tickets 21. Image of public transport 22. Exterior and design of the vehicles and the stops 23. Environmental aspects of the vehicles (use of energy, emissions, noi-se)
0.15 0.2
0.015 0.02 0.03
0.005 0.02 0.1
0.05
total 2.005 In the second place, the QE is much lower for the so-called ‘captive passengers’ who have not got the option of choosing for means of private transport, especially the car. The share of captive public trans-port passengers in Riga and Pieriga can be estimated at 70 % of all passengers and the level of theur QE can be estimated at half of the QE of “non-captives”. This means that the total QE for Riga and Pie-riga can be estimated at 0.55 x 70 % x 50 % = 0.2. This means that if the quality of public transport is increased by 10 %, the number of passengers will increase by 2 %. Increase of the number of the passengers by 2 % means a decrease of the use of the car by non-captive passengers by (- 2 % x 30 % =) -0.6 %. If the number of public transport passengers increases by 2 %, the supply of the transport has to be in-creased as well. If the seat utilisation of the vehicles is at maximum acceptable level, the supply has to be proportional to the increase of patronage. At the current cost coverage degree of Rigas Satiksme of about 50 %, this would increase the costs and the deficits by the same percentage. In order to avoid in-crease of the deficits of public transport, the fares can be raised to a certain degree. As mentioned, the PE of public transport is estimated at - 0.4. This means that if the fares are raised by half of the quality increase of for example 10%, the number of passengers will be unchanged (because (5 % x - 0.4) + (10 % x 0.2) = 0) and the supply and the costs will not change accordingly. The revenues will increase by 5 %, equal to the price increase, and the deficits will decrease by the same amount as the increase of the revenues. 5.5. Traffic management and control
At present, traffic control in Riga and Pieriga is mostly fixed time without priority measures for Public Transport. Depending on local situations intersections connected to one of the two existing central sys-tems can select up to five plans adjusted to the actual time of day. Furthermore, the majority of traffic controllers are working stand alone. At the Brīvības iela, Krišjāņa Valdemāra iela and Aleksandra Čaka iela (fixed time) out going green waves are installed. At Brīvības gatve a green wave is installed with green waves for morning and evening peak hour in opposite directions. An improvement in traffic control is possible in at least two ways:
- by upgrading the fixed time controllers into semi-fixed time controllers, which provide more flexi-bility to the traffic control. The basic idea of semi-fixed time traffic controllers is that they work with a fixed cycle time and stages, but are more flexible in providing green for additional direc-tions in the stages;
- by adding a central control system with automatically change plans according to the actual traffic situation in stead of fixed time schedules.
With basic vehicle detection it is possible to:

LET106-1 Development of Riga and Pieriga Mobility Plan THIRD INTERIM REPORT Variants, final version, dated June 9, 2010 55
- prevent intersections to be blocked, by delaying the green phase when there is a queue at the other side of the intersection (this is not only a capacity measure but also a measure to improve safety);
- adapt the time of a stage, when all the traffic is gone the next stage can be selected earlier; - introduce sub stages, in which individual signal groups from the first stage can be switched to
red to be able to create earlier green for specific signal groups of the second stage; - to handle left turning traffic on single direction left turning lanes as a specific signal group (pro-
tected left turns). This measure will cost al little extra time, but will prevent left turning traffic from driving too early in a situation which is difficult to overview, especially when there is also left turning traffic in opposite direction. This measure is mostly a traffic safety measure which can be used at for example Latvian State roads.
With selective PT detection of basic vehicle detection on PT-only lanes it is possible to create PT-priority windows by using short term in-between stages which can be skipped when there is no bus pre-sent. Using more PT-priority windows gives a bigger change on a quick passage without negative influ-ence on intersection capacity. Another possibility to use detection to keep longer green for nearing PT-vehicles on their route or to early cut off conflicting directions of PT-vehicles. PT-priority can be cost effective if the amount of time gained by the measure can be used to reduce the number of vehicles necessary for the schedule. It’s necessary to implement priority measures on sev-eral intersections on a route. Due to the serious congestion on a number of intersections near the bridges and the railway crossings it is suggested for PT-priority to look first at intersections without con-gestion because there travel time can be gained without negative influence on road capacity. The techniques mentioned above are easy to implement in stand-alone intersections. It is also possible to implement them in fixed time green waves. In that case changes of time in a certain stage need to be compensated in another stage in the same cycle. The mentioned techniques can be implemented by using basic vehicle detection systems. It can easily be implemented step by step. Appendix IX gives examples of the use of vehicle detection. For the pre-ferred RPMP variant a traffic management plan will be elaborated. Detection has been implemented so far is several test cases with often disappointing results. New systems need to be tested in pilot studies for at least one year to be able to judge the effects. Next to direct traffic control functions detection can be used for counting traffic in order to collect data which can be used to further improve all kinds of traffic models. Improved modelling makes it possible to raise the quality of all kind of traffic- and feasibility studies. To get a cost effective use of detection combination of functions (PT-priority, increase capacity on intersections, increase quality of traffic mod-elling by monitoring) is necessary. In Pieriga, for safety reasons the traffic signals can be changed to allow for conflict-free movements (protected left turns). This might invoke some extra delay, but in many cases this will be acceptable. An example of a junction where conflict-free traffic signals are beneficial is the junction between the A4 and P5. 5.6. Traffic safety measures Improvement of traffic safety is one of the objectives of the Mobility Plan. Appendix X presents a short analysis of traffic safety in Riga and Pieriga. This analysis will be used in the more detailed develop-ment of the Mobility Plan in the next task. In Pieriga several locations have already been reconstructed between 2007 and 2010 to improve traffic safety, e.g. several location in the A7. Appendix XI gives an overview of reconstructions which have been or will be accomplished between 2007 and 2011.

LET106-1 Development of Riga and Pieriga Mobility Plan THIRD INTERIM REPORT Variants, final version, dated June 9, 2010 56
5.7. Marketing PR and communication: a first move
The current situation in Riga and Pieriga is one in which the market share of public transport as a whole is decreasing, while the number of cars is expected to increase by approximately 60 % till 2025. This can be seen as a threat as well as an opportunity for the position of public transport. Nevertheless, marketing for public transport can help changing the trend of more cars, more congestion and less accessibility of Riga. And in relation to this: marketing is much more than just advertising and marketing should be a cyclical process to improve the entire public transport system to customer needs. For marketing of public transport in Riga and Pieriga the following SMART targets are proposed:
- keep a 35 % market share of transport movements in Riga; - realise 50 % market share on suburb-city-centre movements in Riga; - realise 50 % market share on all trips from Pieriga to Riga city-centre in 2025 (public transport
and combination with car/P&R). These targets can only be reached with a strong focus on the attractiveness of the public transport sys-tem for car-owners, especially towards the city centre. In marketing the so-called ‘seven P’s of market-ing’ are used: product, place, promotion, price, people, process and for public transport also politics. Place is not that relevant: the most important elements of the aspect 'place' are already captured in 'product'.
1. product: the product should meet customer-needs. As the future customer also has a car the focus should be on creating fast, reliable, frequent and (congestion) free connections with enough comfort and safety, especially to the city centre. The product should be easy understandable: clear lines, easy to remember departure times for less frequent lines9 and easy interchanges between modes and lines. The recommendation is to reorganize the network in a network with more transversal lines, thus increasing the number of direct connections and reducing the number of lines to reach a better understandable network. Because car owners do prefer to use rail, it is recommended to in-crease the tramway network and to connect the airport and Mezciems to the city with a tramway or light-tram (guided trolleybus). The trolleybus network can be extended to reach a maximum cover-age of the city by electric modes. The train network should be operated as if it is a metro-network: with smaller, good accessible, trains which allow short stopping times at stations and faster connec-tions from Pieriga into Riga. Regional buses can be connected to the train network and Minibus services in the larger towns in Pieriga can help people to have a convenient trip to and from the sta-tion;
2. people: the drivers, conductors and staff are an important factor to reach the quality that is needed and to reach a higher customer satisfaction. All people that are in contact with the customer must be trained regularly;
3. process: the process of producing public transport should be efficient and flexible to reach high quality standards. Unique for public transport is that producing and consuming take place at the same time;
4. price: prices should be attractive, especially to frequent users and be less expensive than the vari-able costs of the private car. An integrated tariff should be realized that makes it easy to change be-tween modes, without the need to buy a new ticket;
5. promotion: the focus has to be on the strong points of public transport: no parking problems, fast connection to the city centre, available without a driver’s license, cheaper than use of car, environ-mentally friendly, safe at home when drinking alcohol, meeting people, can work or read at larger distances. Improve the image of modes when positive changes (new vehicles, schedule, free lanes
9 Lines with intervals greater than 10 minutes

LET106-1 Development of Riga and Pieriga Mobility Plan THIRD INTERIM REPORT Variants, final version, dated June 9, 2010 57
etc.) can be observed. Make a schematic map of the public transport that helps people to find their way in the network;
6. politics: politics should create the conditions for the public transport companies to have efficient and customer oriented, attractive operations that contribute to the goals to be achieved. When there is not enough money to achieve everything (which is usually the case) priorities should be set in co-operation between public transport companies and customer organizations.
An overview of marketing measures for public transport is included in appendix VII in table VII.5. effects of marketing Most of the measures mentioned in the marketing section are part of the marketing campaign. In gen-eral, in relation to the costs and benefits of marketing, it is important to keep a few things in mind:
- it is easier to loose what you have than to win what you do not have; - marketing does always work; - to make benefits; you first have to make costs.
With that in mind it is difficult to translate the efforts in marketing into benefits. According to the sug-gested measures, and assumed that the ticket price is stable, the proposed marketing measures should increase the amount of passengers by 3 - 5 %. Assuming a realistic increase of 3 %, the passenger revenues for Rigas Satiksme would increase to € 72 million a year, supposing (realistic assumption) that the growth of passengers can be handled by the current capacity (which means that no extra trams or (trolley)buses are needed), so the rate of cost-effectiveness will rise. This means that for annual investments for marketing an amount of € 2.1 million can be assigned (at break-even). A passenger growth of 3 % can roughly be divided into:
- 1 % new passengers (passengers who did not travel before); - 1 % former car users; - 1 % existing passenger who will travel more.
In Riga, the total travel distance for all public transport passengers (from both Riga and Pieriga) is about 1.3 billion kilometres. The average travel distance in Riga is about 4.3 kilometres (tram, trolleybus and bus). According to a 3 % increase, this means that the annual passenger kilometres will rise by ap-proximately 32 million. Assuming that 1 % of the passenger growth consists of former car users, the annual car kilometres in Riga could decrease by 11 million kilometres, under the circumstances that the travel speed of public transport is at least constant. Concluding, marketing in order to get more passengers needs investments, but will lead to an increase in the number of passenger kilometres. However, it is necessary that a certain basic quality in public transport (travel speed) can be provided. Regarding the fact that transport in Riga and Pieriga in gen-eral will increase, this means that this quality only can be realized by investments in public transport in-frastructure. These investments therefore have been proposed for all three RPMP variants.
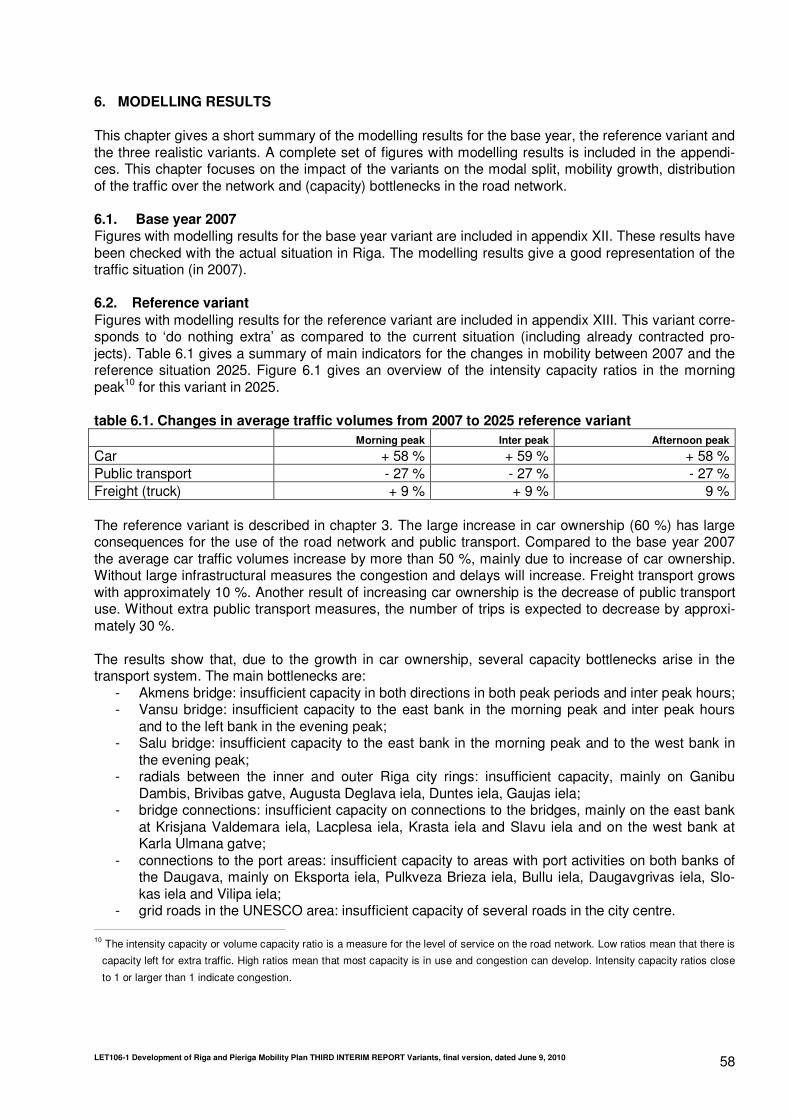
LET106-1 Development of Riga and Pieriga Mobility Plan THIRD INTERIM REPORT Variants, final version, dated June 9, 2010 58
6. MODELLING RESULTS
This chapter gives a short summary of the modelling results for the base year, the reference variant and the three realistic variants. A complete set of figures with modelling results is included in the appendi-ces. This chapter focuses on the impact of the variants on the modal split, mobility growth, distribution of the traffic over the network and (capacity) bottlenecks in the road network. 6.1. Base year 2007 Figures with modelling results for the base year variant are included in appendix XII. These results have been checked with the actual situation in Riga. The modelling results give a good representation of the traffic situation (in 2007). 6.2. Reference variant
Figures with modelling results for the reference variant are included in appendix XIII. This variant corre-sponds to ‘do nothing extra’ as compared to the current situation (including already contracted pro-jects). Table 6.1 gives a summary of main indicators for the changes in mobility between 2007 and the reference situation 2025. Figure 6.1 gives an overview of the intensity capacity ratios in the morning peak10 for this variant in 2025. table 6.1. Changes in average traffic volumes from 2007 to 2025 reference variant
Morning peak Inter peak Afternoon peak
Car + 58 % + 59 % + 58 % Public transport - 27 % - 27 % - 27 % Freight (truck) + 9 % + 9 % 9 % The reference variant is described in chapter 3. The large increase in car ownership (60 %) has large consequences for the use of the road network and public transport. Compared to the base year 2007 the average car traffic volumes increase by more than 50 %, mainly due to increase of car ownership. Without large infrastructural measures the congestion and delays will increase. Freight transport grows with approximately 10 %. Another result of increasing car ownership is the decrease of public transport use. Without extra public transport measures, the number of trips is expected to decrease by approxi-mately 30 %. The results show that, due to the growth in car ownership, several capacity bottlenecks arise in the transport system. The main bottlenecks are:
- Akmens bridge: insufficient capacity in both directions in both peak periods and inter peak hours; - Vansu bridge: insufficient capacity to the east bank in the morning peak and inter peak hours
and to the left bank in the evening peak; - Salu bridge: insufficient capacity to the east bank in the morning peak and to the west bank in
the evening peak; - radials between the inner and outer Riga city rings: insufficient capacity, mainly on Ganibu
Dambis, Brivibas gatve, Augusta Deglava iela, Duntes iela, Gaujas iela; - bridge connections: insufficient capacity on connections to the bridges, mainly on the east bank
at Krisjana Valdemara iela, Lacplesa iela, Krasta iela and Slavu iela and on the west bank at Karla Ulmana gatve;
- connections to the port areas: insufficient capacity to areas with port activities on both banks of the Daugava, mainly on Eksporta iela, Pulkveza Brieza iela, Bullu iela, Daugavgrivas iela, Slo-kas iela and Vilipa iela;
- grid roads in the UNESCO area: insufficient capacity of several roads in the city centre.
10 The intensity capacity or volume capacity ratio is a measure for the level of service on the road network. Low ratios mean that there is
capacity left for extra traffic. High ratios mean that most capacity is in use and congestion can develop. Intensity capacity ratios close
to 1 or larger than 1 indicate congestion.

LET106-1 Development of Riga and Pieriga Mobility Plan THIRD INTERIM REPORT Variants, final version, dated June 9, 2010 59
Interesting to note is that the capacity of the Southern bridge (Dienvidu tilts) is not used very well in the reference situation. There is capacity left at this bridge, while the other bridges are overloaded. Fur-thermore, there is capacity left at the eastern arterial (connected to the Southern bridge). By guiding traffic to use routes over the Southern bridge and eastern arterial some bottlenecks in other routes could be solved. figure 6.1. Intensity capacity ratios in the morning peak in the reference variant 2025 (colour
indicates IC ratio, bandwidth indicates the traffic volume)
6.3. Results Variant A A complete set of figures with modelling results for variant A is included in appendix XIV. Figure 6.2 gives an overview of the intensity capacity ratios in the morning peak for this variant in 2025. Figure 6.3 presents the changes compared to the reference variant (green is an increase, red a decrease com-pared to the reference situation). On average the traffic volumes decrease by 2 % in variant A com-pared to the reference variant. Public transport volumes increase by 18 % due to the large improve-ments in the network. Additionally, for variant A the effect of a shortened NTC (only part belonging to city ring), a western ar-terial along the railway and an A7-A8 connection have been studied for this variant. The results are in-cluded in appendix XVII. These results support the choices made for the road hierarchy of variant A.

LET106-1 Development of Riga and Pieriga Mobility Plan THIRD INTERIM REPORT Variants, final version, dated June 9, 2010 60
figure 6.2. Intensity capacity ratios in the morning peak in the variant A 2025 (colour indicates IC ratio, bandwidth indicates the traffic volume)
figure 6.3. Comparison traffic volumes variant A and reference variant, morning peak11
11 Due to a change in the road network the A8 and P5 have different links in the model for the variants than for the reference. Therefore,
the plots with volume differences show a large change of volumes here. However, when studying the volume and IC plots it is clear
that there are only small changes on these links. The model results are correct; only the visualization is not correct for these links.
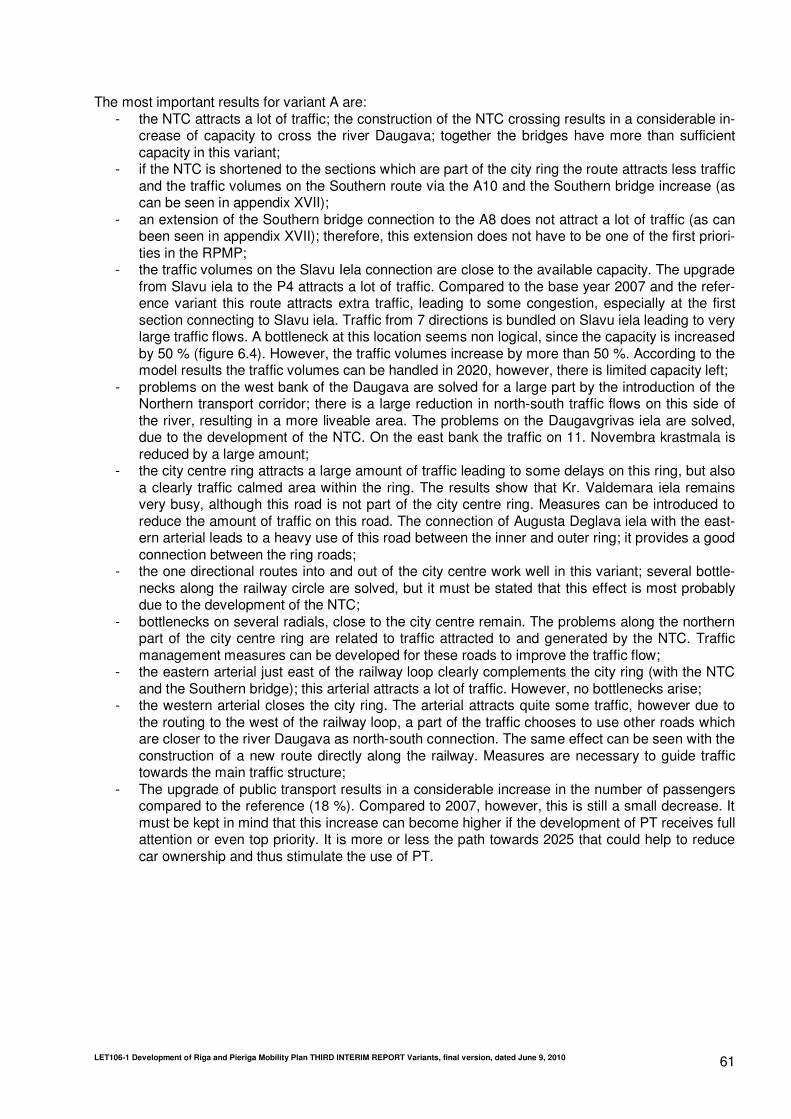
LET106-1 Development of Riga and Pieriga Mobility Plan THIRD INTERIM REPORT Variants, final version, dated June 9, 2010 61
The most important results for variant A are: - the NTC attracts a lot of traffic; the construction of the NTC crossing results in a considerable in-
crease of capacity to cross the river Daugava; together the bridges have more than sufficient capacity in this variant;
- if the NTC is shortened to the sections which are part of the city ring the route attracts less traffic and the traffic volumes on the Southern route via the A10 and the Southern bridge increase (as can be seen in appendix XVII);
- an extension of the Southern bridge connection to the A8 does not attract a lot of traffic (as can been seen in appendix XVII); therefore, this extension does not have to be one of the first priori-ties in the RPMP;
- the traffic volumes on the Slavu Iela connection are close to the available capacity. The upgrade from Slavu iela to the P4 attracts a lot of traffic. Compared to the base year 2007 and the refer-ence variant this route attracts extra traffic, leading to some congestion, especially at the first section connecting to Slavu iela. Traffic from 7 directions is bundled on Slavu iela leading to very large traffic flows. A bottleneck at this location seems non logical, since the capacity is increased by 50 % (figure 6.4). However, the traffic volumes increase by more than 50 %. According to the model results the traffic volumes can be handled in 2020, however, there is limited capacity left;
- problems on the west bank of the Daugava are solved for a large part by the introduction of the Northern transport corridor; there is a large reduction in north-south traffic flows on this side of the river, resulting in a more liveable area. The problems on the Daugavgrivas iela are solved, due to the development of the NTC. On the east bank the traffic on 11. Novembra krastmala is reduced by a large amount;
- the city centre ring attracts a large amount of traffic leading to some delays on this ring, but also a clearly traffic calmed area within the ring. The results show that Kr. Valdemara iela remains very busy, although this road is not part of the city centre ring. Measures can be introduced to reduce the amount of traffic on this road. The connection of Augusta Deglava iela with the east-ern arterial leads to a heavy use of this road between the inner and outer ring; it provides a good connection between the ring roads;
- the one directional routes into and out of the city centre work well in this variant; several bottle-necks along the railway circle are solved, but it must be stated that this effect is most probably due to the development of the NTC;
- bottlenecks on several radials, close to the city centre remain. The problems along the northern part of the city centre ring are related to traffic attracted to and generated by the NTC. Traffic management measures can be developed for these roads to improve the traffic flow;
- the eastern arterial just east of the railway loop clearly complements the city ring (with the NTC and the Southern bridge); this arterial attracts a lot of traffic. However, no bottlenecks arise;
- the western arterial closes the city ring. The arterial attracts quite some traffic, however due to the routing to the west of the railway loop, a part of the traffic chooses to use other roads which are closer to the river Daugava as north-south connection. The same effect can be seen with the construction of a new route directly along the railway. Measures are necessary to guide traffic towards the main traffic structure;
- The upgrade of public transport results in a considerable increase in the number of passengers compared to the reference (18 %). Compared to 2007, however, this is still a small decrease. It must be kept in mind that this increase can become higher if the development of PT receives full attention or even top priority. It is more or less the path towards 2025 that could help to reduce car ownership and thus stimulate the use of PT.
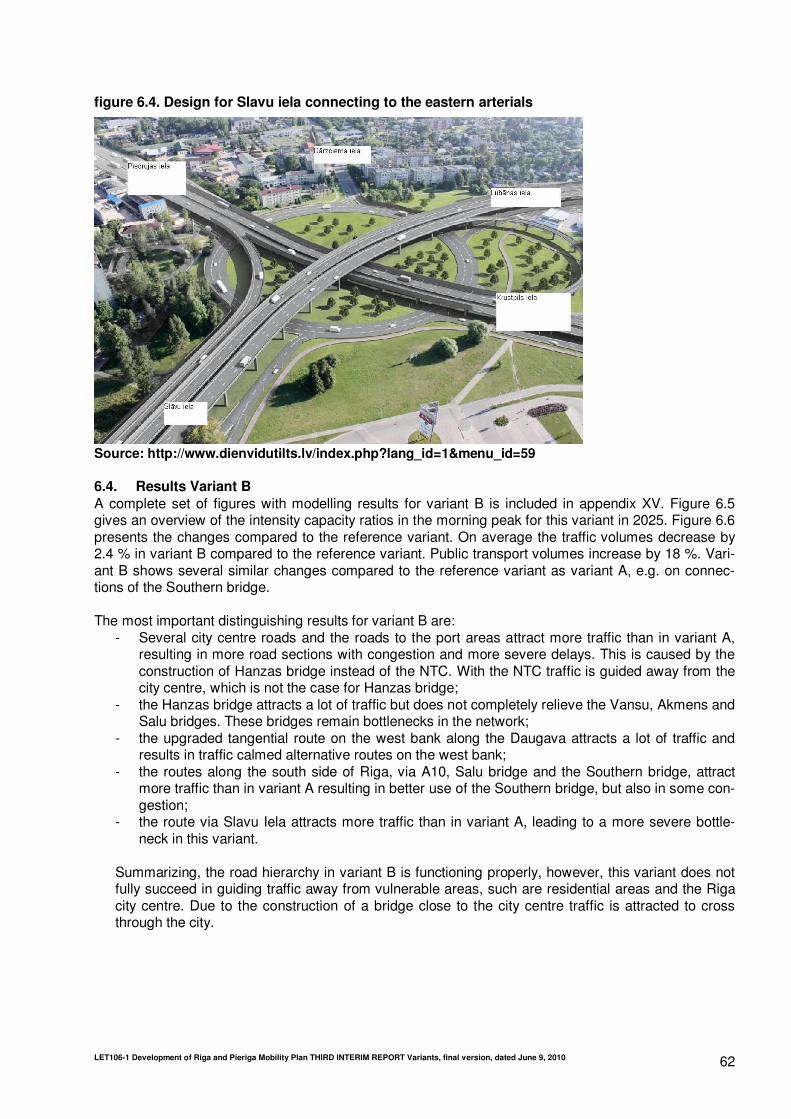
LET106-1 Development of Riga and Pieriga Mobility Plan THIRD INTERIM REPORT Variants, final version, dated June 9, 2010 62
figure 6.4. Design for Slavu iela connecting to the eastern arterials
Source: http://www.dienvidutilts.lv/index.php?lang_id=1&menu_id=59
6.4. Results Variant B
A complete set of figures with modelling results for variant B is included in appendix XV. Figure 6.5 gives an overview of the intensity capacity ratios in the morning peak for this variant in 2025. Figure 6.6 presents the changes compared to the reference variant. On average the traffic volumes decrease by 2.4 % in variant B compared to the reference variant. Public transport volumes increase by 18 %. Vari-ant B shows several similar changes compared to the reference variant as variant A, e.g. on connec-tions of the Southern bridge. The most important distinguishing results for variant B are:
- Several city centre roads and the roads to the port areas attract more traffic than in variant A, resulting in more road sections with congestion and more severe delays. This is caused by the construction of Hanzas bridge instead of the NTC. With the NTC traffic is guided away from the city centre, which is not the case for Hanzas bridge;
- the Hanzas bridge attracts a lot of traffic but does not completely relieve the Vansu, Akmens and Salu bridges. These bridges remain bottlenecks in the network;
- the upgraded tangential route on the west bank along the Daugava attracts a lot of traffic and results in traffic calmed alternative routes on the west bank;
- the routes along the south side of Riga, via A10, Salu bridge and the Southern bridge, attract more traffic than in variant A resulting in better use of the Southern bridge, but also in some con-gestion;
- the route via Slavu Iela attracts more traffic than in variant A, leading to a more severe bottle-neck in this variant.
Summarizing, the road hierarchy in variant B is functioning properly, however, this variant does not fully succeed in guiding traffic away from vulnerable areas, such are residential areas and the Riga city centre. Due to the construction of a bridge close to the city centre traffic is attracted to cross through the city.
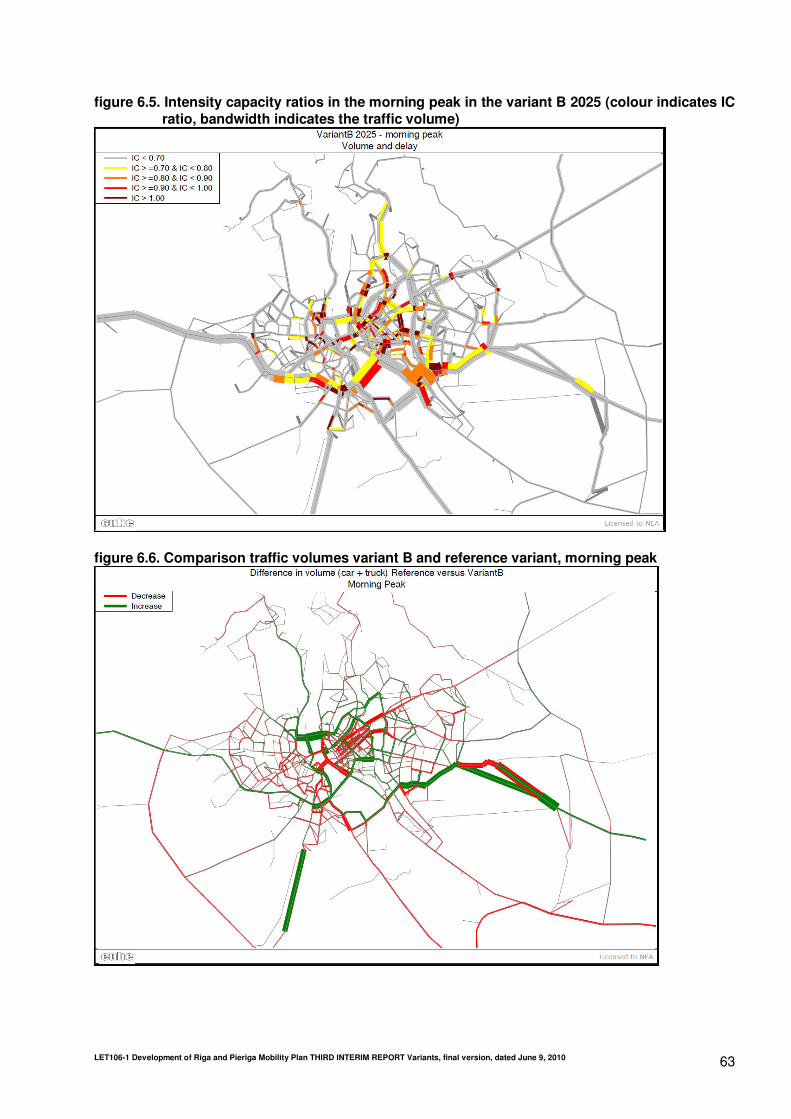
LET106-1 Development of Riga and Pieriga Mobility Plan THIRD INTERIM REPORT Variants, final version, dated June 9, 2010 63
figure 6.5. Intensity capacity ratios in the morning peak in the variant B 2025 (colour indicates IC ratio, bandwidth indicates the traffic volume)
figure 6.6. Comparison traffic volumes variant B and reference variant, morning peak

LET106-1 Development of Riga and Pieriga Mobility Plan THIRD INTERIM REPORT Variants, final version, dated June 9, 2010 64
6.5. Results variant C
A complete set of figures with modelling results for variant C is included in appendix XVI. Figure 6.7 gives an overview of the intensity capacity ratios in the morning peak for this variant in 2025. Figure 6.8 presents the changes compared to the reference variant. On average the traffic volumes decrease by 2.5 % in variant C compared to the reference variant. Public transport volumes increase by 18 %. This variant shows the largest decrease in traffic volumes, since similar public transport measures are intro-duced as in the other variants and fewer measures for car traffic are introduced. Variant C shows less changes compared to the reference than variants A and B. Important results are:
- in general this variant shows a less clear road hierarchy than the other two variants. There is clearly a missing northern part of the structure resulting in bottlenecks and congestion towards the northern part of Riga;
- compared to the other variants, there is less traffic (in total) crossing the river. This indicates that a new river crossing does not only relieve the existing river crossing, but also attracts new cross river trips;
- the city centre area and the connections between the city centre ring and the city ring get heavily congested, due to the lack of possibilities for traffic to choose a route around the centre;
- the Akmens bridge and the route along the Daugava (east bank) are heavily used, resulting in several bottlenecks;
- the north-south routes to the northern parts of Riga (port areas) are heavily congested, since there is no east-west route available in this variant for traffic in the northern part of the city;
- the upgraded tangential route on the west bank along the Daugava attracts a lot of traffic and fa-cilitates a smooth traffic flow; only to the north of Vansu bridge bottlenecks arise (on both sides);
- the Southern bridge attracts extra traffic as intended, however, this also enforces the bottleneck on Slavu Iela.
figure 6.7. Intensity capacity ratios in the morning peak in the variant C 2025 (colour indicates IC
ratio, bandwidth indicates the traffic volume)
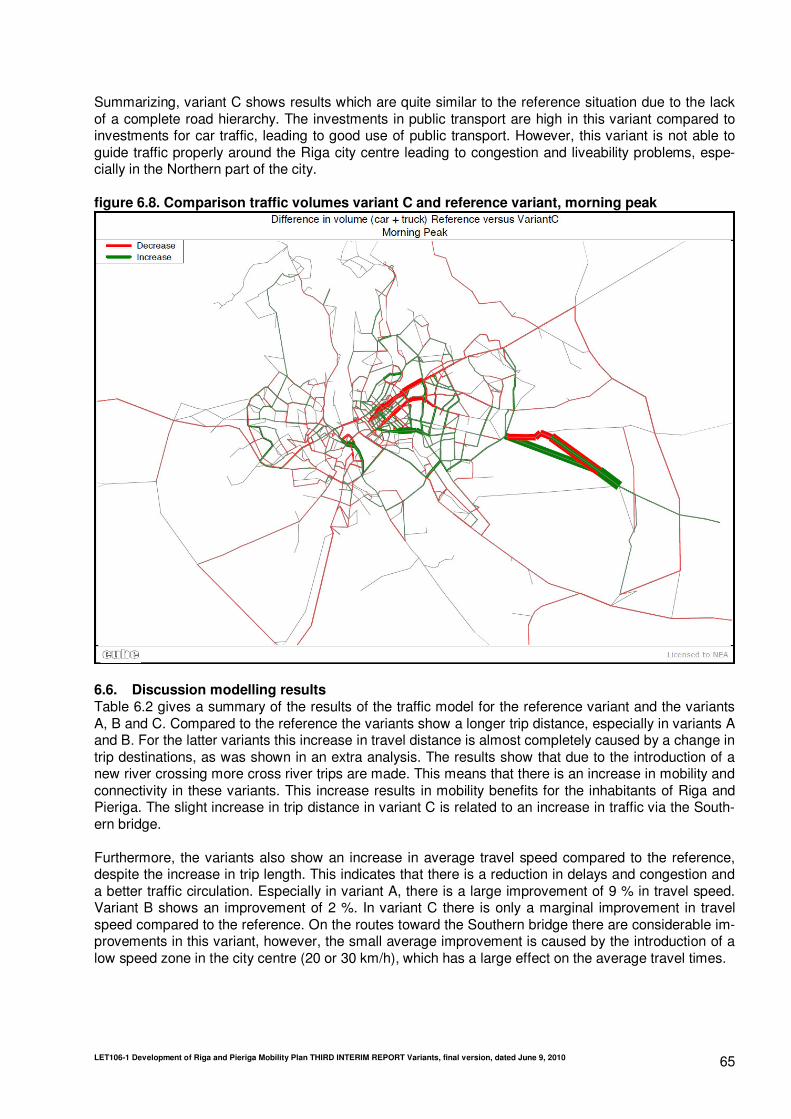
LET106-1 Development of Riga and Pieriga Mobility Plan THIRD INTERIM REPORT Variants, final version, dated June 9, 2010 65
Summarizing, variant C shows results which are quite similar to the reference situation due to the lack of a complete road hierarchy. The investments in public transport are high in this variant compared to investments for car traffic, leading to good use of public transport. However, this variant is not able to guide traffic properly around the Riga city centre leading to congestion and liveability problems, espe-cially in the Northern part of the city. figure 6.8. Comparison traffic volumes variant C and reference variant, morning peak
6.6. Discussion modelling results Table 6.2 gives a summary of the results of the traffic model for the reference variant and the variants A, B and C. Compared to the reference the variants show a longer trip distance, especially in variants A and B. For the latter variants this increase in travel distance is almost completely caused by a change in trip destinations, as was shown in an extra analysis. The results show that due to the introduction of a new river crossing more cross river trips are made. This means that there is an increase in mobility and connectivity in these variants. This increase results in mobility benefits for the inhabitants of Riga and Pieriga. The slight increase in trip distance in variant C is related to an increase in traffic via the South-ern bridge. Furthermore, the variants also show an increase in average travel speed compared to the reference, despite the increase in trip length. This indicates that there is a reduction in delays and congestion and a better traffic circulation. Especially in variant A, there is a large improvement of 9 % in travel speed. Variant B shows an improvement of 2 %. In variant C there is only a marginal improvement in travel speed compared to the reference. On the routes toward the Southern bridge there are considerable im-provements in this variant, however, the small average improvement is caused by the introduction of a low speed zone in the city centre (20 or 30 km/h), which has a large effect on the average travel times.

LET106-1 Development of Riga and Pieriga Mobility Plan THIRD INTERIM REPORT Variants, final version, dated June 9, 2010 66
The traffic model clearly shows that the road hierarchy in variant A leads to the most optimal traffic cir-culation. Also in variant B there is a clear improvement compared to the reference situation. Variant C shows only marginal positive effects compared to the reference variant. table 6.2. Summary of traffic model results
Vari-
ant
Average travel time
(min/trip)
Average travel dis-
tance (km/trip)
Average travel speed
(km/h/trip)
Change in car trips
(compared to Ref)
Change in PT trips
(compared to Ref)
Ref 28,4 14,4 30,3 - - A 26,8 14,8 33,1 - 2.0 % + 18 % B 28,5 14,7 31,0 - 2.4 % + 18 % C 28,5 14,5 30,5 - 2.5 % + 18 % Based on the modelling assumptions and results for the reference variant and the variants A, B and C the following general remarks and conclusions can be made:
- the measures taken in the variants have effects as expected, although some bottlenecks remain. This means that it seems actually possible to arrive to well used main roads and traffic calmed areas, like the area around the Daugava river;
- with a new northern crossing the bridges Vansu and Akmens will become less used and can be downgraded in favour of public transport and NMT;
- the overall results show that with variant A and B an effective road hierarchy can be achieved; in variant C clearly the northern part of a city ring is missing and there is also no clear western part resulting in more scattered traffic patterns;
- the overall picture shows that variant A has more positive effects than variant B. Hence, the sparser main roads network seems to work better for at least the city centre, keeping away traf-fic that can use the wider city ring. Variant A does attract some extra car trips as compared to variants B and C, due to the attractiveness of the new infrastructure;
- the growth in car ownership is the main cause for the increase in congestion and delays. Meas-ures for reducing car ownership and car use have not been taken into account in the variants. One can think of measures such as raising taxes, parking tariffs and road pricing schemes;
- no attention has been paid in traffic modelling to a relative increase of car costs. If somehow (toll, fuel, tax) the costs of car increase, this will have a positive effect upon use of public trans-port. Possible effects of soft measures have been discussed in chapter 5.
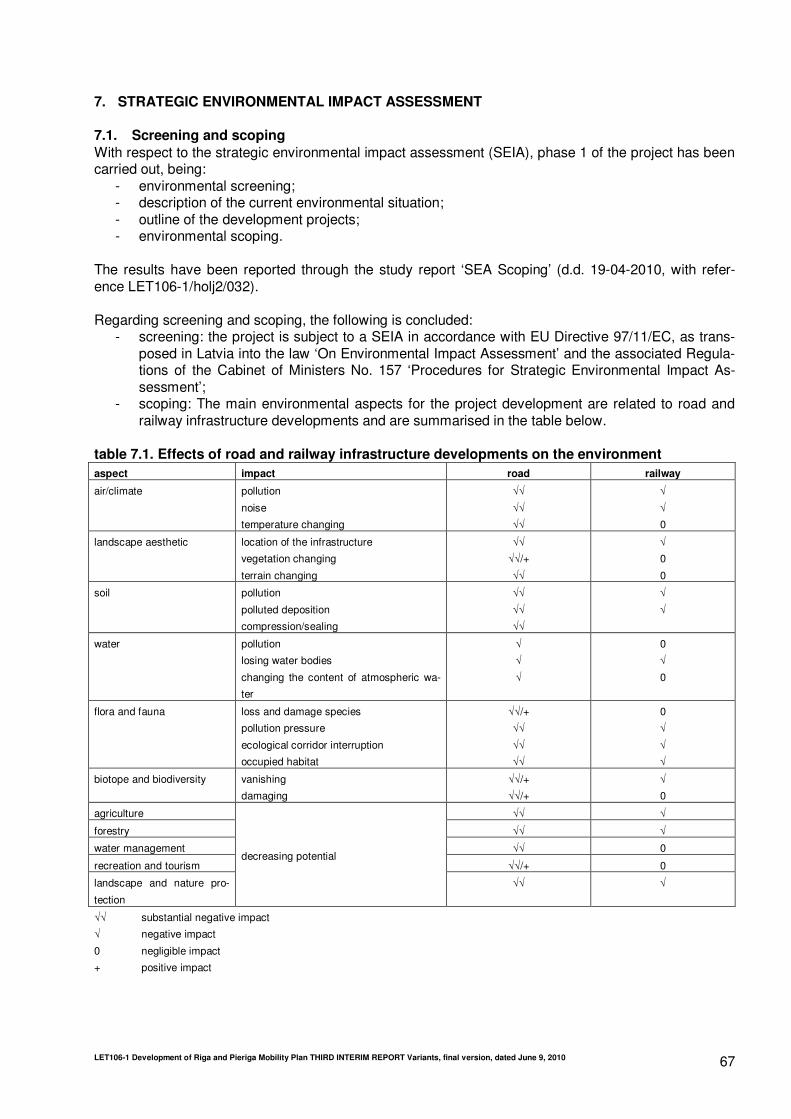
LET106-1 Development of Riga and Pieriga Mobility Plan THIRD INTERIM REPORT Variants, final version, dated June 9, 2010 67
7. STRATEGIC ENVIRONMENTAL IMPACT ASSESSMENT
7.1. Screening and scoping
With respect to the strategic environmental impact assessment (SEIA), phase 1 of the project has been carried out, being:
- environmental screening; - description of the current environmental situation; - outline of the development projects; - environmental scoping.
The results have been reported through the study report ‘SEA Scoping’ (d.d. 19-04-2010, with refer-ence LET106-1/holj2/032). Regarding screening and scoping, the following is concluded:
- screening: the project is subject to a SEIA in accordance with EU Directive 97/11/EC, as trans-posed in Latvia into the law ‘On Environmental Impact Assessment’ and the associated Regula-tions of the Cabinet of Ministers No. 157 ‘Procedures for Strategic Environmental Impact As-sessment’;
- scoping: The main environmental aspects for the project development are related to road and railway infrastructure developments and are summarised in the table below.
table 7.1. Effects of road and railway infrastructure developments on the environment
aspect impact road railway
air/climate pollution
noise
temperature changing
√√
√√
√√
√
√
0
landscape aesthetic location of the infrastructure
vegetation changing
terrain changing
√√
√√/+
√√
√
0
0
soil pollution
polluted deposition
compression/sealing
√√
√√
√√
√
√
water pollution
losing water bodies
changing the content of atmospheric wa-
ter
√
√
√
0
√
0
flora and fauna loss and damage species
pollution pressure
ecological corridor interruption
occupied habitat
√√/+
√√
√√
√√
0
√
√
√
biotope and biodiversity vanishing
damaging
√√/+
√√/+
√
0
agriculture √√ √
forestry √√ √
water management √√ 0
recreation and tourism √√/+ 0
landscape and nature pro-
tection
decreasing potential
√√ √
√√ substantial negative impact
√ negative impact
0 negligible impact
+ positive impact

LET106-1 Development of Riga and Pieriga Mobility Plan THIRD INTERIM REPORT Variants, final version, dated June 9, 2010 68
7.2. Strategy for the RPMP For the RPMP, the following should be realised: - project alternatives are developed to a detail that they can be qualitatively compared (and to a
lesser extend quantitatively); - the alternatives consists of a bundle of individual projects, to be evaluated on their individual merits; - not all projects have a significant environmental impact; As a consequence of this, the methodology for the SEIA needs to be customised for this specific cir-cumstance. The most obvious strategy for this is to include environmental issues into the CBA model. By allocating budget for environmental investments related to the infrastructure development, it can be assured that the environment is properly addressed. The exact (amount of) measures strongly depend on the (more) detailed design of the individual projects, which will take place in a later stage, when also the EIA procedures are carried out (which has already been done for some projects). It should be em-phasised that the purpose of the EIA procedures should be to identify full alternatives (including the en-vironmentally friendliest option) per project. Chapter 8 describes in which manner the environmental aspects are incorporated in the CBA for the RPMP variants. In the next phase a new CBA will be prepared for the preferred variant based on more detailed input data. For this CBA the following activities will be performed for the environmental as-pects: - the CBA Model will take costs into account for the main environmental impacts related to the project
developments, focussing on: ⋅ emissions of air pollutants; ⋅ noise; ⋅ climate change (emissions of greenhouse gases);
- for each project development with a significant environmental impact, project fiches will be prepared containing relevant environmental information: ⋅ screening against Annex I and Annex II of the EU Directive; ⋅ overview of qualitative environmental impacts; ⋅ influences on nearby special locations.
The template for the project fiche is presented in table 7.2.
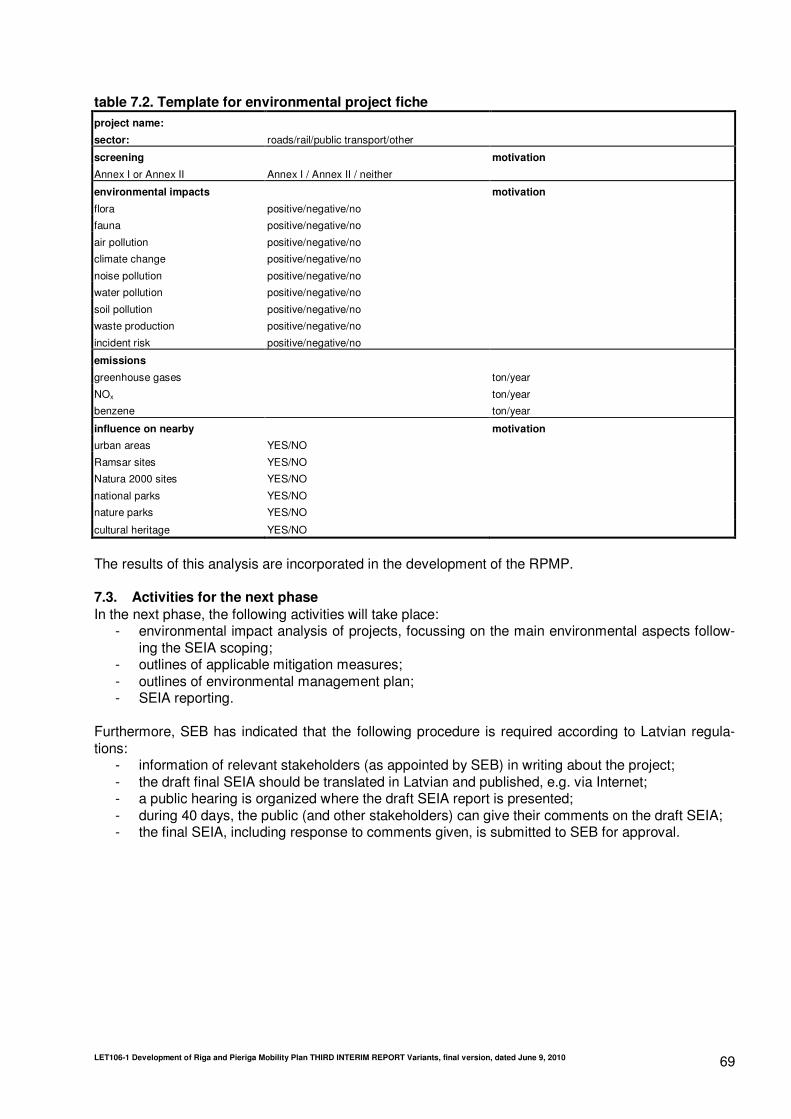
LET106-1 Development of Riga and Pieriga Mobility Plan THIRD INTERIM REPORT Variants, final version, dated June 9, 2010 69
table 7.2. Template for environmental project fiche
project name:
sector: roads/rail/public transport/other
screening motivation
Annex I or Annex II Annex I / Annex II / neither
environmental impacts motivation
flora positive/negative/no
fauna positive/negative/no
air pollution
climate change
noise pollution
positive/negative/no
positive/negative/no
positive/negative/no
water pollution positive/negative/no
soil pollution positive/negative/no
waste production positive/negative/no
incident risk positive/negative/no
emissions
greenhouse gases ton/year
NOx ton/year
benzene ton/year
influence on nearby motivation
urban areas YES/NO
Ramsar sites YES/NO
Natura 2000 sites YES/NO
national parks YES/NO
nature parks YES/NO
cultural heritage YES/NO
The results of this analysis are incorporated in the development of the RPMP. 7.3. Activities for the next phase
In the next phase, the following activities will take place: - environmental impact analysis of projects, focussing on the main environmental aspects follow-
ing the SEIA scoping; - outlines of applicable mitigation measures; - outlines of environmental management plan; - SEIA reporting.
Furthermore, SEB has indicated that the following procedure is required according to Latvian regula-tions:
- information of relevant stakeholders (as appointed by SEB) in writing about the project; - the draft final SEIA should be translated in Latvian and published, e.g. via Internet; - a public hearing is organized where the draft SEIA report is presented; - during 40 days, the public (and other stakeholders) can give their comments on the draft SEIA; - the final SEIA, including response to comments given, is submitted to SEB for approval.
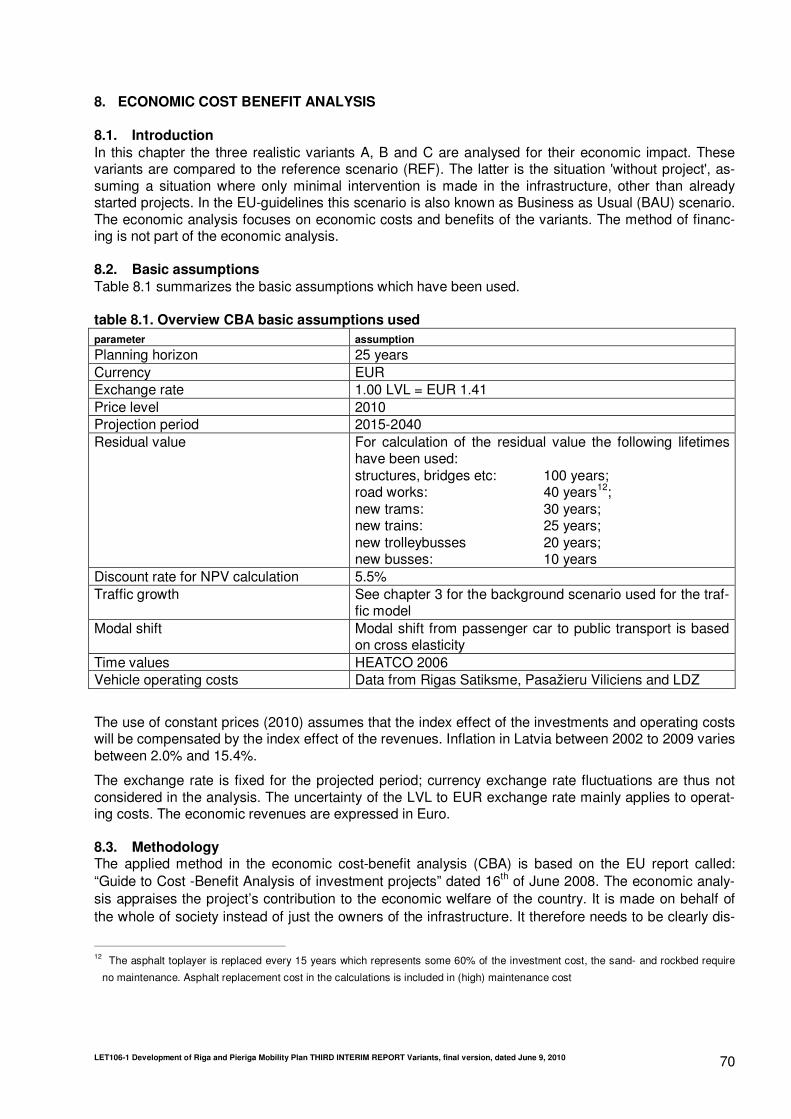
LET106-1 Development of Riga and Pieriga Mobility Plan THIRD INTERIM REPORT Variants, final version, dated June 9, 2010 70
8. ECONOMIC COST BENEFIT ANALYSIS
8.1. Introduction
In this chapter the three realistic variants A, B and C are analysed for their economic impact. These variants are compared to the reference scenario (REF). The latter is the situation 'without project', as-suming a situation where only minimal intervention is made in the infrastructure, other than already started projects. In the EU-guidelines this scenario is also known as Business as Usual (BAU) scenario. The economic analysis focuses on economic costs and benefits of the variants. The method of financ-ing is not part of the economic analysis. 8.2. Basic assumptions
Table 8.1 summarizes the basic assumptions which have been used. table 8.1. Overview CBA basic assumptions used
parameter assumption
Planning horizon 25 years Currency EUR Exchange rate 1.00 LVL = EUR 1.41 Price level 2010 Projection period 2015-2040 Residual value For calculation of the residual value the following lifetimes
have been used: structures, bridges etc: 100 years; road works: 40 years12; new trams: 30 years; new trains: 25 years; new trolleybusses 20 years; new busses: 10 years
Discount rate for NPV calculation 5.5% Traffic growth See chapter 3 for the background scenario used for the traf-
fic model Modal shift Modal shift from passenger car to public transport is based
on cross elasticity Time values HEATCO 2006 Vehicle operating costs Data from Rigas Satiksme, Pasažieru Viliciens and LDZ
The use of constant prices (2010) assumes that the index effect of the investments and operating costs will be compensated by the index effect of the revenues. Inflation in Latvia between 2002 to 2009 varies between 2.0% and 15.4%.
The exchange rate is fixed for the projected period; currency exchange rate fluctuations are thus not considered in the analysis. The uncertainty of the LVL to EUR exchange rate mainly applies to operat-ing costs. The economic revenues are expressed in Euro. 8.3. Methodology The applied method in the economic cost-benefit analysis (CBA) is based on the EU report called: “Guide to Cost -Benefit Analysis of investment projects” dated 16th of June 2008. The economic analy-sis appraises the project’s contribution to the economic welfare of the country. It is made on behalf of the whole of society instead of just the owners of the infrastructure. It therefore needs to be clearly dis-
12 The asphalt toplayer is replaced every 15 years which represents some 60% of the investment cost, the sand- and rockbed require
no maintenance. Asphalt replacement cost in the calculations is included in (high) maintenance cost
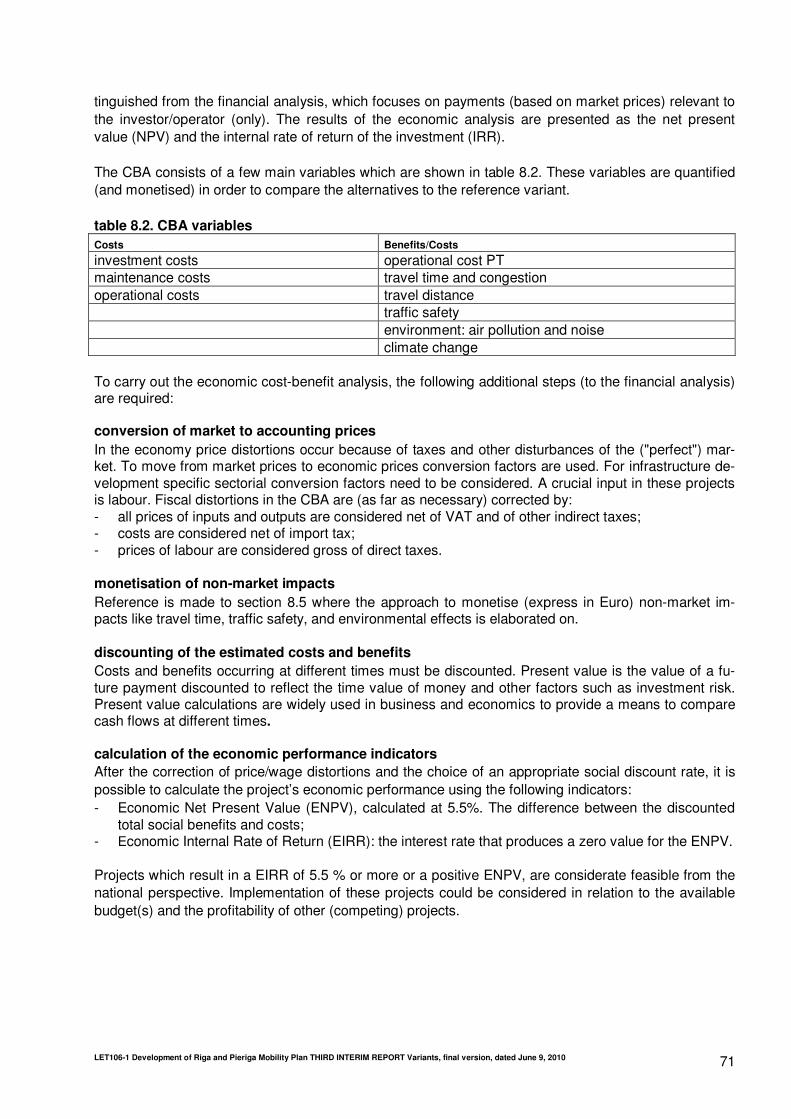
LET106-1 Development of Riga and Pieriga Mobility Plan THIRD INTERIM REPORT Variants, final version, dated June 9, 2010 71
tinguished from the financial analysis, which focuses on payments (based on market prices) relevant to the investor/operator (only). The results of the economic analysis are presented as the net present value (NPV) and the internal rate of return of the investment (IRR). The CBA consists of a few main variables which are shown in table 8.2. These variables are quantified (and monetised) in order to compare the alternatives to the reference variant.
table 8.2. CBA variables
Costs Benefits/Costs
investment costs operational cost PT maintenance costs travel time and congestion operational costs travel distance traffic safety environment: air pollution and noise climate change To carry out the economic cost-benefit analysis, the following additional steps (to the financial analysis) are required: conversion of market to accounting prices
In the economy price distortions occur because of taxes and other disturbances of the ("perfect") mar-ket. To move from market prices to economic prices conversion factors are used. For infrastructure de-velopment specific sectorial conversion factors need to be considered. A crucial input in these projects is labour. Fiscal distortions in the CBA are (as far as necessary) corrected by: - all prices of inputs and outputs are considered net of VAT and of other indirect taxes; - costs are considered net of import tax; - prices of labour are considered gross of direct taxes. monetisation of non-market impacts
Reference is made to section 8.5 where the approach to monetise (express in Euro) non-market im-pacts like travel time, traffic safety, and environmental effects is elaborated on. discounting of the estimated costs and benefits
Costs and benefits occurring at different times must be discounted. Present value is the value of a fu-ture payment discounted to reflect the time value of money and other factors such as investment risk. Present value calculations are widely used in business and economics to provide a means to compare cash flows at different times. calculation of the economic performance indicators
After the correction of price/wage distortions and the choice of an appropriate social discount rate, it is possible to calculate the project’s economic performance using the following indicators: - Economic Net Present Value (ENPV), calculated at 5.5%. The difference between the discounted
total social benefits and costs; - Economic Internal Rate of Return (EIRR): the interest rate that produces a zero value for the ENPV. Projects which result in a EIRR of 5.5 % or more or a positive ENPV, are considerate feasible from the national perspective. Implementation of these projects could be considered in relation to the available budget(s) and the profitability of other (competing) projects.
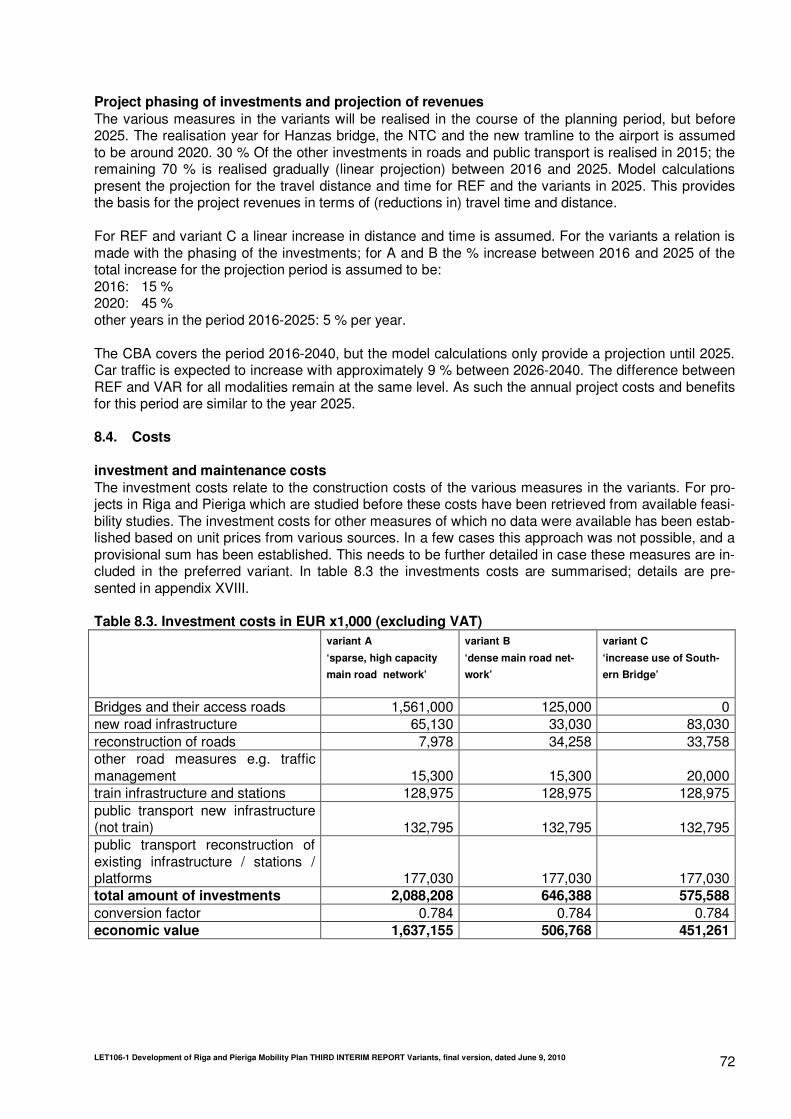
LET106-1 Development of Riga and Pieriga Mobility Plan THIRD INTERIM REPORT Variants, final version, dated June 9, 2010 72
Project phasing of investments and projection of revenues
The various measures in the variants will be realised in the course of the planning period, but before 2025. The realisation year for Hanzas bridge, the NTC and the new tramline to the airport is assumed to be around 2020. 30 % Of the other investments in roads and public transport is realised in 2015; the remaining 70 % is realised gradually (linear projection) between 2016 and 2025. Model calculations present the projection for the travel distance and time for REF and the variants in 2025. This provides the basis for the project revenues in terms of (reductions in) travel time and distance. For REF and variant C a linear increase in distance and time is assumed. For the variants a relation is made with the phasing of the investments; for A and B the % increase between 2016 and 2025 of the total increase for the projection period is assumed to be: 2016: 15 % 2020: 45 % other years in the period 2016-2025: 5 % per year. The CBA covers the period 2016-2040, but the model calculations only provide a projection until 2025. Car traffic is expected to increase with approximately 9 % between 2026-2040. The difference between REF and VAR for all modalities remain at the same level. As such the annual project costs and benefits for this period are similar to the year 2025. 8.4. Costs investment and maintenance costs
The investment costs relate to the construction costs of the various measures in the variants. For pro-jects in Riga and Pieriga which are studied before these costs have been retrieved from available feasi-bility studies. The investment costs for other measures of which no data were available has been estab-lished based on unit prices from various sources. In a few cases this approach was not possible, and a provisional sum has been established. This needs to be further detailed in case these measures are in-cluded in the preferred variant. In table 8.3 the investments costs are summarised; details are pre-sented in appendix XVIII. Table 8.3. Investment costs in EUR x1,000 (excluding VAT)
variant A
‘sparse, high capacity
main road network’
variant B
‘dense main road net-
work’
variant C
‘increase use of South-
ern Bridge’
Bridges and their access roads 1,561,000 125,000 0 new road infrastructure 65,130 33,030 83,030 reconstruction of roads 7,978 34,258 33,758 other road measures e.g. traffic management 15,300 15,300 20,000 train infrastructure and stations 128,975 128,975 128,975 public transport new infrastructure (not train) 132,795 132,795 132,795 public transport reconstruction of existing infrastructure / stations / platforms 177,030 177,030 177,030 total amount of investments 2,088,208 646,388 575,588
conversion factor 0.784 0.784 0.784 economic value 1,637,155 506,768 451,261
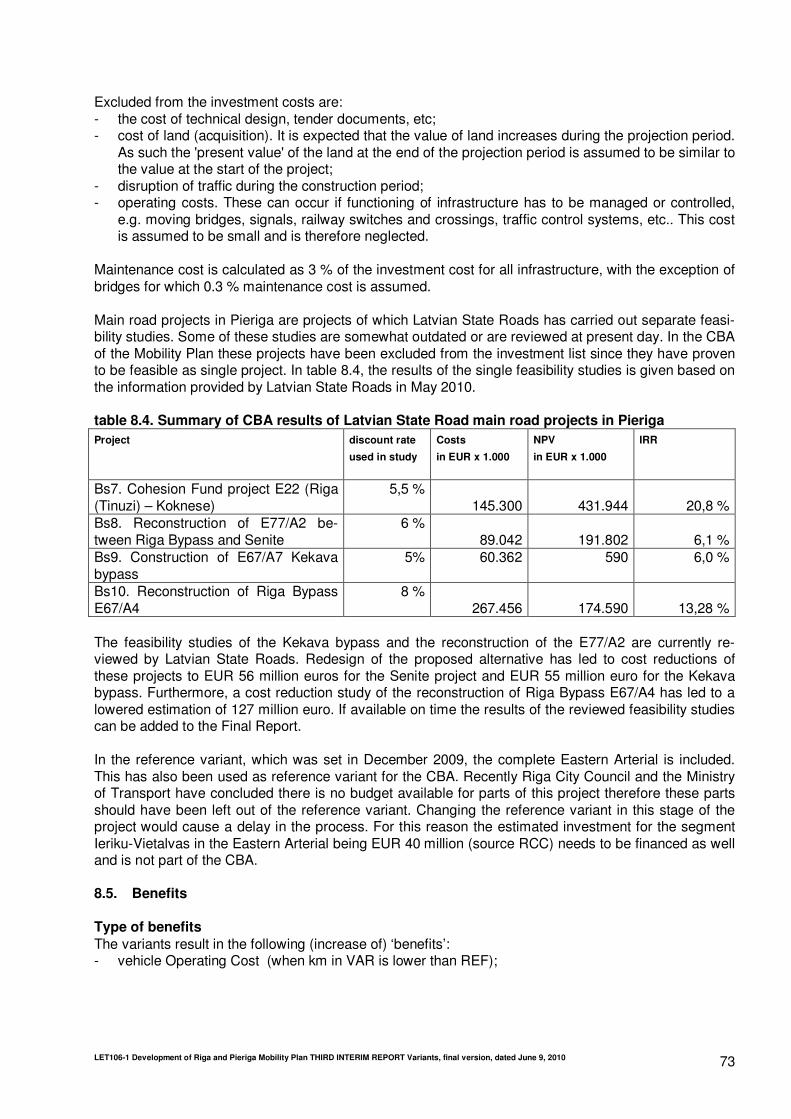
LET106-1 Development of Riga and Pieriga Mobility Plan THIRD INTERIM REPORT Variants, final version, dated June 9, 2010 73
Excluded from the investment costs are: - the cost of technical design, tender documents, etc; - cost of land (acquisition). It is expected that the value of land increases during the projection period.
As such the 'present value' of the land at the end of the projection period is assumed to be similar to the value at the start of the project;
- disruption of traffic during the construction period; - operating costs. These can occur if functioning of infrastructure has to be managed or controlled,
e.g. moving bridges, signals, railway switches and crossings, traffic control systems, etc.. This cost is assumed to be small and is therefore neglected.
Maintenance cost is calculated as 3 % of the investment cost for all infrastructure, with the exception of bridges for which 0.3 % maintenance cost is assumed. Main road projects in Pieriga are projects of which Latvian State Roads has carried out separate feasi-bility studies. Some of these studies are somewhat outdated or are reviewed at present day. In the CBA of the Mobility Plan these projects have been excluded from the investment list since they have proven to be feasible as single project. In table 8.4, the results of the single feasibility studies is given based on the information provided by Latvian State Roads in May 2010. table 8.4. Summary of CBA results of Latvian State Road main road projects in Pieriga
Project discount rate
used in study
Costs
in EUR x 1.000
NPV
in EUR x 1.000
IRR
Bs7. Cohesion Fund project E22 (Riga (Tinuzi) – Koknese)
5,5 % 145.300
431.944 20,8 %
Bs8. Reconstruction of E77/A2 be-tween Riga Bypass and Senite
6 % 89.042
191.802 6,1 %
Bs9. Construction of E67/A7 Kekava bypass
5% 60.362 590 6,0 %
Bs10. Reconstruction of Riga Bypass E67/A4
8 % 267.456
174.590 13,28 %
The feasibility studies of the Kekava bypass and the reconstruction of the E77/A2 are currently re-viewed by Latvian State Roads. Redesign of the proposed alternative has led to cost reductions of these projects to EUR 56 million euros for the Senite project and EUR 55 million euro for the Kekava bypass. Furthermore, a cost reduction study of the reconstruction of Riga Bypass E67/A4 has led to a lowered estimation of 127 million euro. If available on time the results of the reviewed feasibility studies can be added to the Final Report. In the reference variant, which was set in December 2009, the complete Eastern Arterial is included. This has also been used as reference variant for the CBA. Recently Riga City Council and the Ministry of Transport have concluded there is no budget available for parts of this project therefore these parts should have been left out of the reference variant. Changing the reference variant in this stage of the project would cause a delay in the process. For this reason the estimated investment for the segment Ieriku-Vietalvas in the Eastern Arterial being EUR 40 million (source RCC) needs to be financed as well and is not part of the CBA. 8.5. Benefits
Type of benefits
The variants result in the following (increase of) ‘benefits’: - vehicle Operating Cost (when km in VAR is lower than REF);

LET106-1 Development of Riga and Pieriga Mobility Plan THIRD INTERIM REPORT Variants, final version, dated June 9, 2010 74
- lower operational costs public transport (when VAR is lower than REF). These benefits are established based on current ticket prices/operational costs. Conversion factors are used to convert market into economic prices. In addition several effects result from the variants for which no market prices exist. In the CBA these ef-fects are quantified and monetized (calculated into Euro): - benefits of value of time; - benefits of traffic safety; - environmental benefits, air pollution (health effects), noise, climate change. The residual value, the remaining value of the investment in 2040 (end of projection period ), is also a benefit used in the CBA. The residual value is calculated based on the investment cost and the eco-nomic lifetime. No revenue like toll or other road user charges is part of the CBA. Currently Riga City Council is study-ing the possibilities for introducing a toll system to divert (transit) traffic out of the city centre. vehicle operating cost (VOC) The investments in transport infrastructure result in changes in the travel distances (km per mode) and time (hours per mode). These changes are calculated in the traffic modelling, and the cost/benefit is subsequently monetized using VOC costs per kilometre and hour for various transport modes. The VOC per vehicle km and per vehicle hour depends on the average travel speed (km per hour). The latter is related to congestion, road dimensions etc. For rail vehicles improvement of the technical qual-ity of the rail track may lead to elimination of speed restrictions. In table 8.5 the cost prices for Latvia on the price level € 2008 are shown for rail transport and for a few selected modes of road transport. table 8.5. Financial vehicle operation costs; price level 2008 (x € 1,-)
passen- PT PT PT PT pass. freight
ger medium mini- trolley- train train
car coach truck Bus bus bus tram electric diesel
Total costs per km. Total costs per hour
0.326 9.79
0.999 34.97
0.899 22.47
0.543 10.87
1.396 27.91
2.004 35.07
4.072 61.08
6.332 253.29
8.962 313.66
Conversion factors of vehicle operation costs
0.706 0.807 0.786 0.792 0.742 0.908 0.920 0.920 0.841 Economic vehicle operation costs price level 2008 (x € 1.-)
Total costs per km. Total costs per hour
0.230 6.91
0.806 28.21
0.706 17.66
0.430 8.61
1.035 20.70
1.820 31.86
3.747 56.20
5.827 233.06
7.533 263.66
Source: data from Rigas Satiksme, Pasažieru Viliciens and LDZ PT = public transport
benefits of value of time (VoT)
For many, if not most infrastructure investments the VoT appears to be the main factor of the benefits and thus of major impact on the outcome of the CBA analysis. The VoT (also called Value of Travel Time Savings – VTTS) expresses the willingness to pay of passengers or clients of freight for (reduction of) travel time if they would have the choice. For freight the VoT is based on the costs related to the value of the cargo. Time-bound costs are inter-est and possibly deterioration of the cargo. The VoT can be connected to the transport mode.

LET106-1 Development of Riga and Pieriga Mobility Plan THIRD INTERIM REPORT Variants, final version, dated June 9, 2010 75
Most CBA studies use the VoT as calculated in the HEATCO study (February 2006). Table 8.6 (pas-sengers transport) and table 8.7 (freight transport) show the HEATCO values for the EU25 countries and for Latvia. These values have been applied for the RPMP. table 8.6. Value of time of passengers per passenger hour (x € 1,-)
mode
private car & railways public transport air transport
Purpose of travel: EU25 Latvia EU25 Latvia EU25 Latvia Business
23.82 11.73 19.11 9.41 32.80 16.15
Private
commute short distance 8.48 4.55 6.10 3.27 12.65 6.79 commute long distance 10.89 5.85 7.83 4.20 16.25 8.72 other short distance 7.11 3.82 5.11 2.74 10.61 5.69 other long distance 9.13 4.90 6.58 3.52 13.62 7.31 average 8.90 4.78 6.41 3.43 13.28 7.13 Avg business/private 6.17 4.03 10.44
Source: Heatco 2006
table 8.7. Value of time of freight per ton-hour (x € 1,-)
Mode road railways
EU25 Latvia EU25 Latvia All freight transport 2.98 1.78 1.22 0.73 Source: Heatco 2006
Benefits of traffic safety
The impact of investment projects on safety is particularly relevant for road projects. For rail projects only specific investments have impact on traffic safety such as traffic management systems, signalling systems, security systems for level crossings, etc., as well as investments that divert traffic from road to rail. The costs of accidents include the costs of fatalities and severe and slight injuries. table 8.8. Costs of traffic accidents per casualty (x € 1,-)
Fatal
victims
Severe
injuries
Light
Injuries
Average
injuries
Latvia, on the basis of factor prices 275,000 37,200 2,700 7,600 Latvia, on the basis of ppp 534,000 72,300 5,200 14,800 Source: HEATCO 2006/ UNITE 2001
For using in CBA calculations, it is necessary to recalculate the costs of accidents per vehicle kilometre (vkm). Table 8.9 shows the costs per 100 vkm for transport modes and types of infrastructure. table 8.9. Costs of road traffic accidents per 100 vehicle kilometres (x € 1,-)
Car Medium
truck
PT
(mini)bus /
coach
PT
trolleybus
/ tram
Passenger train
(per 100
train-km)
Freight
train (per 100
train-km)
Average p.100 veh.km Motorways 2 x 2 0.215 0.18 0.14 Main roads 2 x 2 0.28 0.24 0.18 Main roads 1 x 2 0.70 1.20 0.45 Regional roads 1 x 2 0.425 0.70 0.27 Urban streets 1.30 5.25 0.85 0.85

LET106-1 Development of Riga and Pieriga Mobility Plan THIRD INTERIM REPORT Variants, final version, dated June 9, 2010 76
Car Medium
truck
PT
(mini)bus /
coach
PT
trolleybus
/ tram
Passenger train
(per 100
train-km)
Freight
train (per 100
train-km)
Railways double track 0.049 0.28 Railways single track 0.074 0.28 Source: calculation by Witteveen+Bos/NEA, based on various sources
Air pollution
All air pollution costs are caused by the principal air pollutants – dust particles PM10, PM2.5, NOx, SO2 and volatile organic compounds (VOC). The costs incurred by air pollution include: health costs, mate-rial damages, loss of crops and losses caused by damages incurred on the ecosystems (biosphere, soils, water). Health costs are the most important category. For road and rail transport the level of costs mainly depends on the vehicle standard emission, determined by the year of manufacture. The air pol-lution costs of transport in Latvia for different kinds of pollutants are shown in table 8.10. table 8.10. Air pollution costs per ton in transport (all modes) (x € 1,-)
Pollutant HEATCO Latvia; emissions 2010
Nox 1,800 VOC 500 SO2 1,000 PM2.5 urban 80,000 PM2.5 outside urban areas 22,000 PM10 urban 1,700 PM10 outside urban areas 1,300 Electricity production, urban 3,000 Electricity production outside urban areas 2,000 Source: Heatco 2006
On the basis of a vehicle emission factor, the damage costs in table 8.10 can be applied to obtain the specific costs per 100 vkm, as shown in table 8.11, specified for a number of transport modes and ty-pes of infrastructure 13. table 8.11. Costs of air pollution per 100 vehicle km (x € 1,-)
Car Medium
Truck
PT
mini-
bus
PT
bus /
coach
PT
trolleybus
/ tram
Passenger
train (per
100 train-km)
Freight
train (per 100
train-km)
Average p.100 vkm Motorways 2 x 2 0.60 4.00 0.90 2.60 Main roads 2 x 2 0.57 3.50 0.82 2.35 Main roads 1 x 2 0.50 3.00 0.70 2.00 Regional roads 1 x 2 0.54 3.30 0.76 2.20 Urban streets 0.45 5.70 1.30 3.80 3.00 Railways electr. 9.00
diesel 40.00 electr. 25.00
diesel 110.00 Source: calculation by Witteveen+Bos/NEA, based on various sources
13 based on the IMPACT study and on INFRAS-IWW Guide to CBA of investment projects 2006 which contains figures of the 17 EU Member States in 2000. The figures of IMPACT are much lower than the figures of the INFRAS/ IWW Guide. Therefore the consultant made an estimation, based on both sources and taking into account relatively old vehicle fleets.

LET106-1 Development of Riga and Pieriga Mobility Plan THIRD INTERIM REPORT Variants, final version, dated June 9, 2010 77
noise
Noise can be defined as undesirable sound or sounds of different duration, intensity and other charac-teristics causing mental disabilities in people. Noise in transport can be differentiated in irritation costs and health costs, related to time of the day, population density near the source of noise and existing noise level. In table 8.12 the noise emissions costs for 2000, average for EU-17, are based on INFRAS/IWW (2004), IMPACT and Jaspers. The data have been transferred to Latvia for 2000 and then estimated for 2008, taking account of the real GDP growth per capita in the country. table 8.12. Costs of noise per 100 vehicle kilometre (x € 1,-)
Car Medium
Truck
PT
mini-
bus
PT
bus /
coach
PT
trolleybus
/ tram
Passenger
train (per 100
train-km)
Freight
train (per 100
train-km)
Average p.100 vkm Motorways 2 x 2 0.11 1.50 0.40 1.00 Main roads 2 x 2 0.10 1.40 0.35 0.90 Main roads 1 x 2 0.09 1.30 0.34 0.85 Regional roads 1 x 2
0.085 1.20 0.32 0.80
Urban streets 0.15 2.00 0.50 1.30 0.90 Railways electr. 7.00
diesel 32.00 electr. 19.00 diesel 86.00
Source: calculation by Witteveen+Bos/NEA, based on various sources
benefits of climate change
Climate change is caused by global warming due to exhaust of greenhouse gases carbon dioxide (CO2), nitric oxide (N2O) and methane (CH4), hydro-flour-hydrogen compounds from vehicle air condi-tioners etc. The average price of one ton CO2 in the second period of the European emissions trade scheme (2008 - 2012) will be 20-25 euro/ton. The Kyoto Protocol is expected to result in a gradual rise of the price per ton of CO2 as shown in table 8.13. table 8.13. Expected prices per ton of СО2 (x € 1,-)
Year: 2010 2020 2030 2040 2050
Climate change, average 25 40 55 70 85 Source: IMPACT Handbook on estimation of external costs in the transport sector, 2007
Cost estimation per vehicle kilometre (vkm) is based on multiplication of vehicle emissions per kilometre and the cost factor for the specific type of emissions. Today the average CO2 emissions per car in the world are about 200 gr/vкm. At a price of 25 euro/ton CO2, that makes 0.005 €/km. By 2030 these fig-ures will be 120 gr/vкm, 55 €/tons CO2, or 0.007 €/vkm. Table 8.14 shows a calculation of the costs of climate change per vehicle kilometre, based on IMPACT and on much lower figures of INFRAS. table 8.14. Costs of climate change per 100 vehicle kilometre (x € 1,-)
Car Medium
truck
PT
mini-
bus
PT
bus /
coach
PT
trolleybus
/ tram
Passenger
train (per
train-km)
Freight
Train (per
train-km)
Average p.100 vkm Motorways 2 x 2 0.56 3.60 0.75 2.40 Main roads 2 x 2 0.52 3.30 0.69 2.20 Main roads 1 x 2 0.50 3.20 0.65 2.10
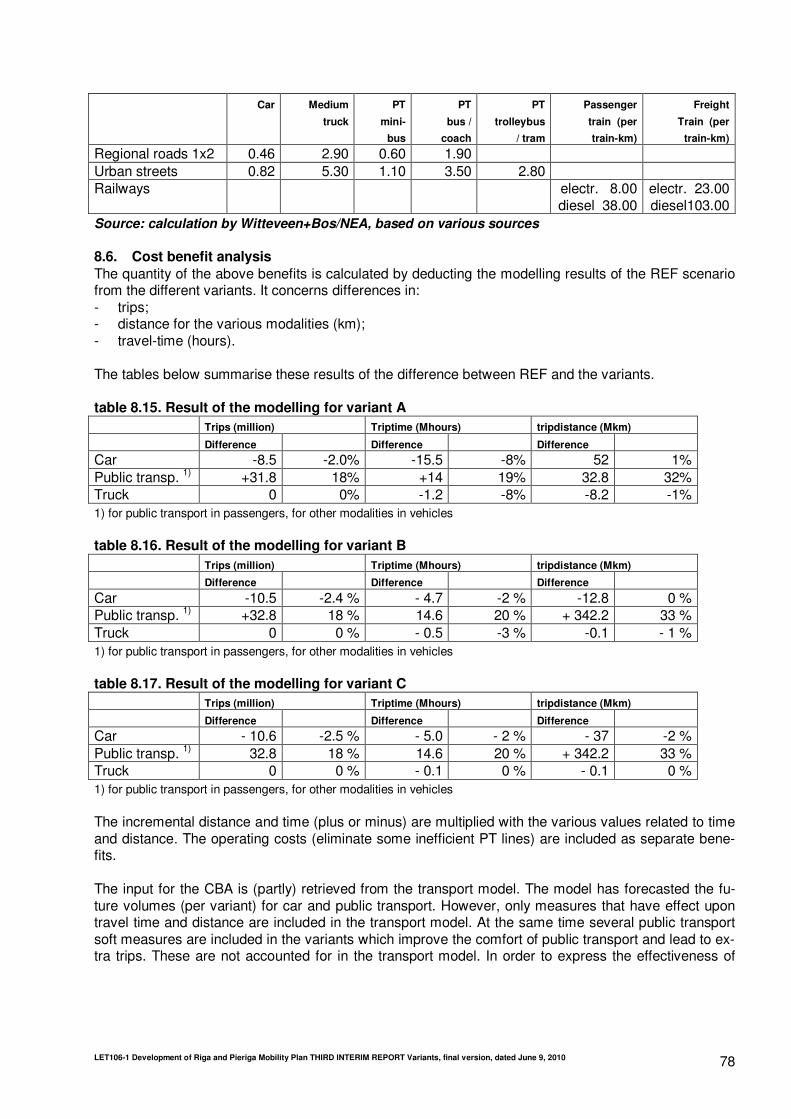
LET106-1 Development of Riga and Pieriga Mobility Plan THIRD INTERIM REPORT Variants, final version, dated June 9, 2010 78
Car Medium
truck
PT
mini-
bus
PT
bus /
coach
PT
trolleybus
/ tram
Passenger
train (per
train-km)
Freight
Train (per
train-km)
Regional roads 1x2 0.46 2.90 0.60 1.90 Urban streets 0.82 5.30 1.10 3.50 2.80 Railways electr. 8.00
diesel 38.00 electr. 23.00 diesel103.00
Source: calculation by Witteveen+Bos/NEA, based on various sources
8.6. Cost benefit analysis
The quantity of the above benefits is calculated by deducting the modelling results of the REF scenario from the different variants. It concerns differences in: - trips; - distance for the various modalities (km); - travel-time (hours). The tables below summarise these results of the difference between REF and the variants. table 8.15. Result of the modelling for variant A
Trips (million) Triptime (Mhours) tripdistance (Mkm)
Difference Difference Difference
Car -8.5 -2.0% -15.5 -8% 52 1% Public transp. 1) +31.8 18% +14 19% 32.8 32% Truck 0 0% -1.2 -8% -8.2 -1% 1) for public transport in passengers, for other modalities in vehicles table 8.16. Result of the modelling for variant B
Trips (million) Triptime (Mhours) tripdistance (Mkm)
Difference Difference Difference
Car -10.5 -2.4 % - 4.7 -2 % -12.8 0 % Public transp. 1) +32.8 18 % 14.6 20 % + 342.2 33 % Truck 0 0 % - 0.5 -3 % -0.1 - 1 % 1) for public transport in passengers, for other modalities in vehicles table 8.17. Result of the modelling for variant C
Trips (million) Triptime (Mhours) tripdistance (Mkm)
Difference Difference Difference
Car - 10.6 -2.5 % - 5.0 - 2 % - 37 -2 % Public transp. 1) 32.8 18 % 14.6 20 % + 342.2 33 % Truck 0 0 % - 0.1 0 % - 0.1 0 % 1) for public transport in passengers, for other modalities in vehicles The incremental distance and time (plus or minus) are multiplied with the various values related to time and distance. The operating costs (eliminate some inefficient PT lines) are included as separate bene-fits. The input for the CBA is (partly) retrieved from the transport model. The model has forecasted the fu-ture volumes (per variant) for car and public transport. However, only measures that have effect upon travel time and distance are included in the transport model. At the same time several public transport soft measures are included in the variants which improve the comfort of public transport and lead to ex-tra trips. These are not accounted for in the transport model. In order to express the effectiveness of
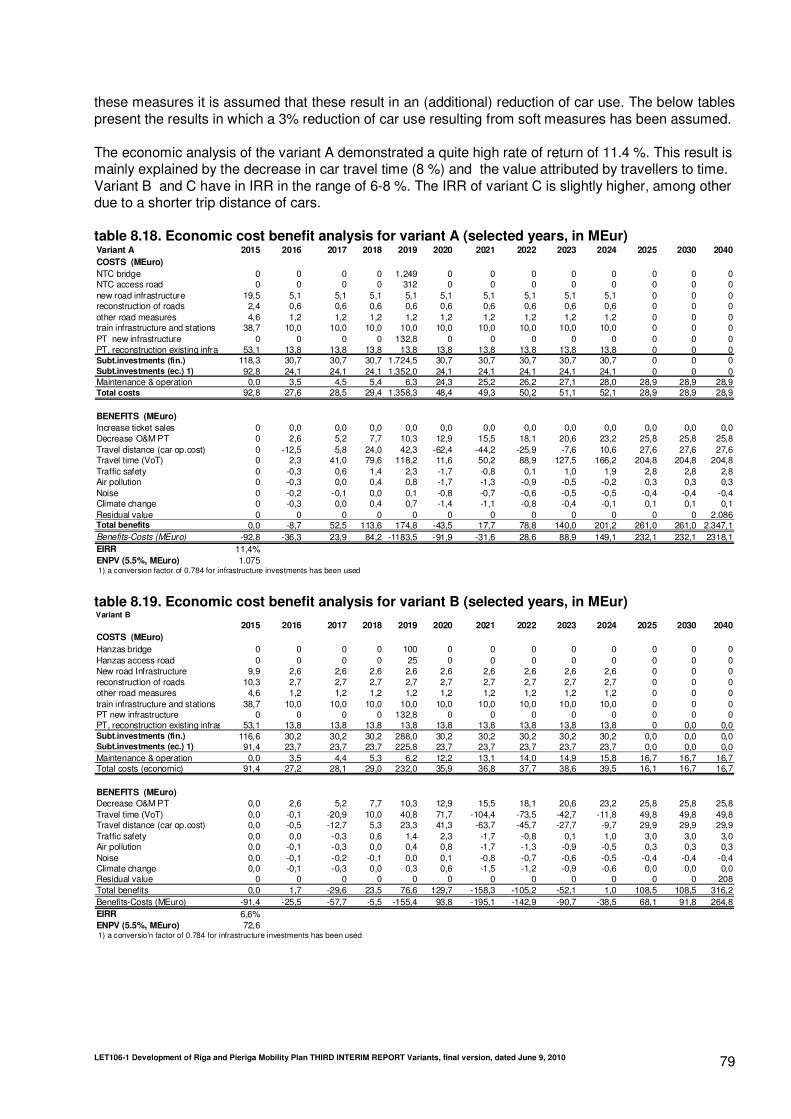
LET106-1 Development of Riga and Pieriga Mobility Plan THIRD INTERIM REPORT Variants, final version, dated June 9, 2010 79
these measures it is assumed that these result in an (additional) reduction of car use. The below tables present the results in which a 3% reduction of car use resulting from soft measures has been assumed. The economic analysis of the variant A demonstrated a quite high rate of return of 11.4 %. This result is mainly explained by the decrease in car travel time (8 %) and the value attributed by travellers to time. Variant B and C have in IRR in the range of 6-8 %. The IRR of variant C is slightly higher, among other due to a shorter trip distance of cars. table 8.18. Economic cost benefit analysis for variant A (selected years, in MEur) Variant A 2015 2016 2017 2018 2019 2020 2021 2022 2023 2024 2025 2030 2040
COSTS (MEuro)
NTC bridge 0 0 0 0 1.249 0 0 0 0 0 0 0 0NTC access road 0 0 0 0 312 0 0 0 0 0 0 0 0new road infrastructure 19,5 5,1 5,1 5,1 5,1 5,1 5,1 5,1 5,1 5,1 0 0 0reconstruction of roads 2,4 0,6 0,6 0,6 0,6 0,6 0,6 0,6 0,6 0,6 0 0 0other road measures 4,6 1,2 1,2 1,2 1,2 1,2 1,2 1,2 1,2 1,2 0 0 0train infrastructure and stations 38,7 10,0 10,0 10,0 10,0 10,0 10,0 10,0 10,0 10,0 0 0 0PT new infrastructure 0 0 0 0 132,8 0 0 0 0 0 0 0 0PT, reconstruction existing infra 53,1 13,8 13,8 13,8 13,8 13,8 13,8 13,8 13,8 13,8 0 0 0Subt.investments (fin.) 118,3 30,7 30,7 30,7 1.724,5 30,7 30,7 30,7 30,7 30,7 0 0 0Subt.investments (ec.) 1) 92,8 24,1 24,1 24,1 1.352,0 24,1 24,1 24,1 24,1 24,1 0 0 0Maintenance & operation 0,0 3,5 4,5 5,4 6,3 24,3 25,2 26,2 27,1 28,0 28,9 28,9 28,9Total costs 92,8 27,6 28,5 29,4 1.358,3 48,4 49,3 50,2 51,1 52,1 28,9 28,9 28,9
BENEFITS (MEuro)
Increase ticket sales 0 0,0 0,0 0,0 0,0 0,0 0,0 0,0 0,0 0,0 0,0 0,0 0,0Decrease O&M PT 0 2,6 5,2 7,7 10,3 12,9 15,5 18,1 20,6 23,2 25,8 25,8 25,8Travel distance (car op.cost) 0 -12,5 5,8 24,0 42,3 -62,4 -44,2 -25,9 -7,6 10,6 27,6 27,6 27,6Travel time (VoT) 0 2,3 41,0 79,6 118,2 11,6 50,2 88,9 127,5 166,2 204,8 204,8 204,8Traffic safety 0 -0,3 0,6 1,4 2,3 -1,7 -0,8 0,1 1,0 1,9 2,8 2,8 2,8Air pollution 0 -0,3 0,0 0,4 0,8 -1,7 -1,3 -0,9 -0,5 -0,2 0,3 0,3 0,3Noise 0 -0,2 -0,1 0,0 0,1 -0,8 -0,7 -0,6 -0,5 -0,5 -0,4 -0,4 -0,4Climate change 0 -0,3 0,0 0,4 0,7 -1,4 -1,1 -0,8 -0,4 -0,1 0,1 0,1 0,1Residual value 0 0 0 0 0 0 0 0 0 0 0 0 2.086Total benefits 0,0 -8,7 52,5 113,6 174,8 -43,5 17,7 78,8 140,0 201,2 261,0 261,0 2.347,1Benefits-Costs (MEuro) -92,8 -36,3 23,9 84,2 -1183,5 -91,9 -31,6 28,6 88,9 149,1 232,1 232,1 2318,1EIRR 11,4%ENPV (5.5%, MEuro) 1.075 1) a conversion factor of 0.784 for infrastructure investments has been used table 8.19. Economic cost benefit analysis for variant B (selected years, in MEur) Variant B
2015 2016 2017 2018 2019 2020 2021 2022 2023 2024 2025 2030 2040
COSTS (MEuro)
Hanzas bridge 0 0 0 0 100 0 0 0 0 0 0 0 0Hanzas access road 0 0 0 0 25 0 0 0 0 0 0 0 0New road Infrastructure 9,9 2,6 2,6 2,6 2,6 2,6 2,6 2,6 2,6 2,6 0 0 0reconstruction of roads 10,3 2,7 2,7 2,7 2,7 2,7 2,7 2,7 2,7 2,7 0 0 0other road measures 4,6 1,2 1,2 1,2 1,2 1,2 1,2 1,2 1,2 1,2 0 0 0train infrastructure and stations 38,7 10,0 10,0 10,0 10,0 10,0 10,0 10,0 10,0 10,0 0 0 0PT new infrastructure 0 0 0 0 132,8 0 0 0 0 0 0 0 0PT, reconstruction existing infrastructure53,1 13,8 13,8 13,8 13,8 13,8 13,8 13,8 13,8 13,8 0 0,0 0,0Subt.investments (fin.) 116,6 30,2 30,2 30,2 288,0 30,2 30,2 30,2 30,2 30,2 0,0 0,0 0,0Subt.investments (ec.) 1) 91,4 23,7 23,7 23,7 225,8 23,7 23,7 23,7 23,7 23,7 0,0 0,0 0,0Maintenance & operation 0,0 3,5 4,4 5,3 6,2 12,2 13,1 14,0 14,9 15,8 16,7 16,7 16,7Total costs (economic) 91,4 27,2 28,1 29,0 232,0 35,9 36,8 37,7 38,6 39,5 16,1 16,7 16,7
BENEFITS (MEuro)
Decrease O&M PT 0,0 2,6 5,2 7,7 10,3 12,9 15,5 18,1 20,6 23,2 25,8 25,8 25,8Travel time (VoT) 0,0 -0,1 -20,9 10,0 40,8 71,7 -104,4 -73,5 -42,7 -11,8 49,8 49,8 49,8Travel distance (car op.cost) 0,0 -0,5 -12,7 5,3 23,3 41,3 -63,7 -45,7 -27,7 -9,7 29,9 29,9 29,9Traffic safety 0,0 0,0 -0,3 0,6 1,4 2,3 -1,7 -0,8 0,1 1,0 3,0 3,0 3,0Air pollution 0,0 -0,1 -0,3 0,0 0,4 0,8 -1,7 -1,3 -0,9 -0,5 0,3 0,3 0,3Noise 0,0 -0,1 -0,2 -0,1 0,0 0,1 -0,8 -0,7 -0,6 -0,5 -0,4 -0,4 -0,4Climate change 0,0 -0,1 -0,3 0,0 0,3 0,6 -1,5 -1,2 -0,9 -0,6 0,0 0,0 0,0Residual value 0 0 0 0 0 0 0 0 0 0 0 0 208Total benefits 0,0 1,7 -29,6 23,5 76,6 129,7 -158,3 -105,2 -52,1 1,0 108,5 108,5 316,2Benefits-Costs (MEuro) -91,4 -25,5 -57,7 -5,5 -155,4 93,8 -195,1 -142,9 -90,7 -38,5 68,1 91,8 264,8EIRR 6,6%ENPV (5.5%, MEuro) 72,6 1) a conversio'n factor of 0.784 for infrastructure investments has been used

LET106-1 Development of Riga and Pieriga Mobility Plan THIRD INTERIM REPORT Variants, final version, dated June 9, 2010 80
table 8.20. Economic cost benefit analysis for variant C (selected years, in MEur) Variant C
2015 2016 2017 2018 2019 2020 2021 2022 2023 2024 2025 2030 2040
COSTS (MEuro)
New road Infrastructure 24,9 6,5 6,5 6,5 6,5 6,5 6,5 6,5 6,5 6,5 0 0 0reconstruction of roads 10,1 2,6 2,6 2,6 2,6 2,6 2,6 2,6 2,6 2,6 0 0 0other road measures 6,0 1,6 1,6 1,6 1,6 1,6 1,6 1,6 1,6 1,6 0 0 0train infrastructure and stations 38,7 10,0 10,0 10,0 10,0 10,0 10,0 10,0 10,0 10,0 0 0 0PT new infrastructure 133 0 0 0 0,1 0 0 0 0 0 0 0 0PT, reconstruction existing infrastructure53,1 13,8 13,8 13,8 13,8 13,8 13,8 13,8 13,8 13,8 0 0 0Subt.investments (fin.) 132,8 34,4 34,4 34,4 167,2 34,4 34,4 34,4 34,4 34,4 0 0 0Subt.investments (ec.) 1) 104,1 27,0 27,0 27,0 131,1 27,0 27,0 27,0 27,0 27,0 0 0 0Maintenance & operation 0,0 4,0 5,0 6,1 7,1 8,5 9,5 10,6 11,6 12,6 13,7 13,7 13,7Total costs (economic) 104,1 31,0 32,0 33,1 138,2 35,5 36,5 37,6 38,6 39,6 13,7 13,7 13,7
BENEFITS (MEuro)
Increase ticket sales 0 0,0 0,0 0,0 0,0 0,0 0,0 0,0 0,0 0,0 0,0 0,0 0,0Decrease O&M PT 0 2,6 5,2 7,7 10,3 12,9 15,5 18,1 20,6 23,2 25,8 25,8 25,8Travel distance (car op.cost) 0 2,6 5,3 7,9 10,5 13,1 15,8 18,4 21,0 23,6 26,8 26,8 26,8Travel time (VoT) 0 0,8 1,7 2,5 3,4 4,2 5,1 5,9 6,8 7,6 7,6 7,6 7,6Traffic safety 0 -0,3 0,6 1,4 2,3 -1,7 -0,8 0,1 1,0 1,9 3,0 3,0 3,0Air pollution 0 -0,3 0,0 0,4 0,8 -1,7 -1,3 -0,9 -0,5 -0,2 0,3 0,3 0,3Noise 0 0,0 0,0 0,0 0,0 0,0 0,0 0,0 0,0 0,0 0,0 0,0 0,0Climate change 0 0,0 0,0 0,0 0,0 0,0 0,0 0,0 0,0 0,0 -0,2 -0,2 -0,2Residual value 0 0 0 0 0 0 0 0 0 0 0 0 203Total benefits 0 5,3 12,7 20,0 27,4 26,8 34,2 41,5 48,9 56,2 63,3 63,3 216,6Benefits-Costs (MEuro) -104,1 -25,6 -19,3 -13,0 -110,8 -8,7 -2,4 3,9 10,2 16,6 49,6 49,6 202,9EIRR 8,4%ENPV (5.5%, MEuro) 119,0 1) a conversion factor of 0.784 for infrastructure investments has been used It is noted that the incremental hours of the variants have been multiplied with the VoT for the different modalities. For cars for example, a value of 11.7 euro per hour for 'business purposes' and 4.8 euro per hour for private purposes has been assumed (source Heatco, 2006), in the proportion 20% and 80%. In relation to the sensitivity of (value of) travel time changes, it is also noted that the VoT is income re-lated, which means that with an increasing wealth the VoT also becomes higher. An annual increase of 1% of the VoT increases the EIRR between 1 and 2%. 8.7. Conclusion Variant A, B and C are all economically feasible variants with (quite) high rates of return on investment. Table 8.21 gives a summary of the results of the cost benefit analysis for the three variants. table 8.21. Summary of CBA results
Variant A Variant B Variant C
Total amount of in-vestments (MEuro)
1,637 507 451
EIRR (%) 11.4 % 6.6 % 8.4 % ENPV (5.5 %, MEuro) 1,075 73 119
LET106-1 Development of Riga and Pieriga Mobility Plan THIRD INTERIM REPORT Variants, final version, dated June 9, 2010 81
9. FINANCIAL SOURCES
9.1. Type of budgets relevant to RPMP The following main types of budgets are available for transport infrastructure development in Riga and Pieriga14:
- EU budgets; - Latvia State Roads; - Riga City Council.
In the Mobility Plan for Pieriga the main investments concern public transport measures, creating Park and Ride facilities at train stations and improving traffic safety at main roads. These investments are likely funded by mainly national budgets. The measure to improve traffic safety in Pieriga (5 million Eu-ros) is the only specific municipal funded measure for the RPMP in this area. Because of this restricted use of the Pieriga budgets in the RPMP these budgets are not included in this section. The Freeport of Riga Authority also invests in the land transport infrastructure within the port bounda-ries, particularly in rail. Since the rail connection to the port is also part of the Reference scenario the RPMP does not require additional budget in relation to port development. Limited Liability Company ‘Rigas satiksme’ - a public transport company - invests particularly in rolling stock and tram rail. This public joint stock company generates revenues from among others ticket sales, but requires each year a substantial sum from RCC to cover deficits. As such the company fully relies upon RCC (e.g., a state public transport subsidy provided to RCC) and occasionally other public bodies for its investment capacity and budget. A similar situation applies to the state joint stock company ‘Pasazieru vilciens’ (Passenger train) which fulfills a public service agreement signed with state limited liability company ‘Autotransporta direkcija’ (Road Transport Directorate). Pasazieru vilciens has to de-liver public passenger train services in traffic routes and traffic intensity as set forth in the public service agreement. Road Transport Directorate is liable to compensate operating losses to Passenger train re-sulting from the fulfillment of public procurement. 9.2. Budgets EU budget EU budgets for Cohesion Fund (CF) and ERDF are defined for the current programming period 2007-2013. The budgets of Measures 3.3 ‘Development of transport network of European significance and promotion of sustainable transport’ (851 MEuro) and 3.2.1 ‘Development of availability and transport system’ (322 MEuro)15 for the period 2007-2013 are allocated for investments main transport infrastruc-ture. Of these measures an estimated 30 % (see also scenario analysis) has been spent/allocated to Riga and Pieriga. This budget represents the main funding budget for investments in new and upgraded transport infrastructure for Riga and Pieriga. In addition to CF and ERDF, EU funds for TEN-T projects may also be used. These are however mainly used for studies. The only TEN-T construction project funded so far (Viestura Meza) received an EU grant of 3.9 MEuro. It appears from communications with DG-Regio that for the next EU funds programming period 2014-2020 discussions on the planning have just started. Also the contributions of individual member states to the EU for this period have not been defined yet. Probably these budget decisions will only be clear in 2013. It is therefore too early to present any indications about resources available to the Member States and to Latvia, certainly after the worst economic crisis since decades. Even if EU resources for transport will remain at the same level, it is quite possible that environment friendly modes will be fa-
14 Budgets of other municipalities forming Pieriga territory are not included as budget sources. 15 Operational programme 3 “Infrastructure and Services” of the National Strategic Reference Framework 2007 -2013 (ERDF and
Cohesion Fund).

LET106-1 Development of Riga and Pieriga Mobility Plan THIRD INTERIM REPORT Variants, final version, dated June 9, 2010 82
voured, meaning that there will be less funds for roads/bridges construction and more for public trans-port, traffic management measures and cycle ways. Although officials tend to expect that the EU contri-bution for transport infrastructure development in Latvia will decrease compared to the current period, still assistance to Latvia will be provided. national budgets The national and municipal budgets depend upon (national, municipal) tax revenues, which are influ-enced by economic growth. The Latvian economy contracted by 22 % in 2008 and 2009. IMF economic growth projections indicate that the national income will have recovered by 2018 to the 2007 level. The total budget allocated for state roads amounted to 180 million LVL in 2008 and has dropped to 70 mil-lion LVL in 2010. Besides, LSR have access to the State Treasury loan issued in amount of 20 million LVL in 2010. Although maintenance and repair of state roads are financed from direct dues (fuel excise tax and annual vehicle due), such revenues have been reallocated for pending public spending needs in other sectors of national economy. As a result LSR has barely funds to provide periodic road mainte-nance (45 million LVL or 64 % out of 70 million LVL) and remaining funds for road repairs are very lim-ited (25 million LVL). If Latvian government continues to pursue such budgetary policy, it is nearly im-possible for LSR to raise funds for new transport investment projects. In line with this, it is assumed that the LSR funds for roads maintenance and investment will have re-covered in 2018 to the highest level so far since 2008. A linear increase over this period is assumed. The LSR budget for new transport investments is restricted to the budget for EU co-funding. Part of the ‘capital investments’ from the LSR budget concentrate on periodic maintenance, among others for state main roads. It is concluded that this budget cannot be shifted to fund RPMP projects, because road (pe-riodic) maintenance is necessary and can not be cancelled. An assumption is made for the allocation of this state budget financing to Riga and Pieriga. 17% of the State main roads are located in Riga district. The allocation and need for investment funds to Riga and Pieriga is however expected to be higher, both because of more intense road use as well as the eco-nomic dominance of Riga and Pieriga in Latvia. It is therefore assumed in the projection that 25% of the state budget spending is allocated to Riga and Pieriga. Riga City Council
RCC has prepared a projection of total capital expenditure until 2017, presenting among others EU pro-ject financing and 'other capital expenditures'. In 2007 and 2008 respectively 29 % and 36 % of the lat-ter category was spent on transport infrastructure; in the projections the ratio between transport and to-tal investment is assumed to be the average of these two percentages (33 %). It is also assumed that 50 % of this budget cannot be shifted to the RPMP because these investments relate to periodic main-tenance or other indispensable activities. The RCC also presents a forecast on EU project co-financing, part of which is used for transport infrastructure investments. Based on 2010 budget in which 8.8 of 26.9 million LVL was used to transport, (also) a ratio 33 % of transport to the total investment in the pro-jections is assumed 16. It is expected that this complete budget (100 %) can be used for RPMP projects. 9.3. Scenario development Forecasts in general as well as forecasted budgets are by definition uncertain. Therefore three scenar-ios are used for the budget forecast. It is expected that main uncertainty in the projection of budgets re-lates to EU funds. As a consequence of the objective of European governments to reduce their budget deficits, a lower EU Funds budget needs to be considered. Therefore the scenarios used for the period 2014-2020 are assumed similar, 33% lower and 66% lower in relation to the current budget. 16 This budget is also corrected for a pre-financing complement of EU projects, which are also included in the RCC fig-ures.
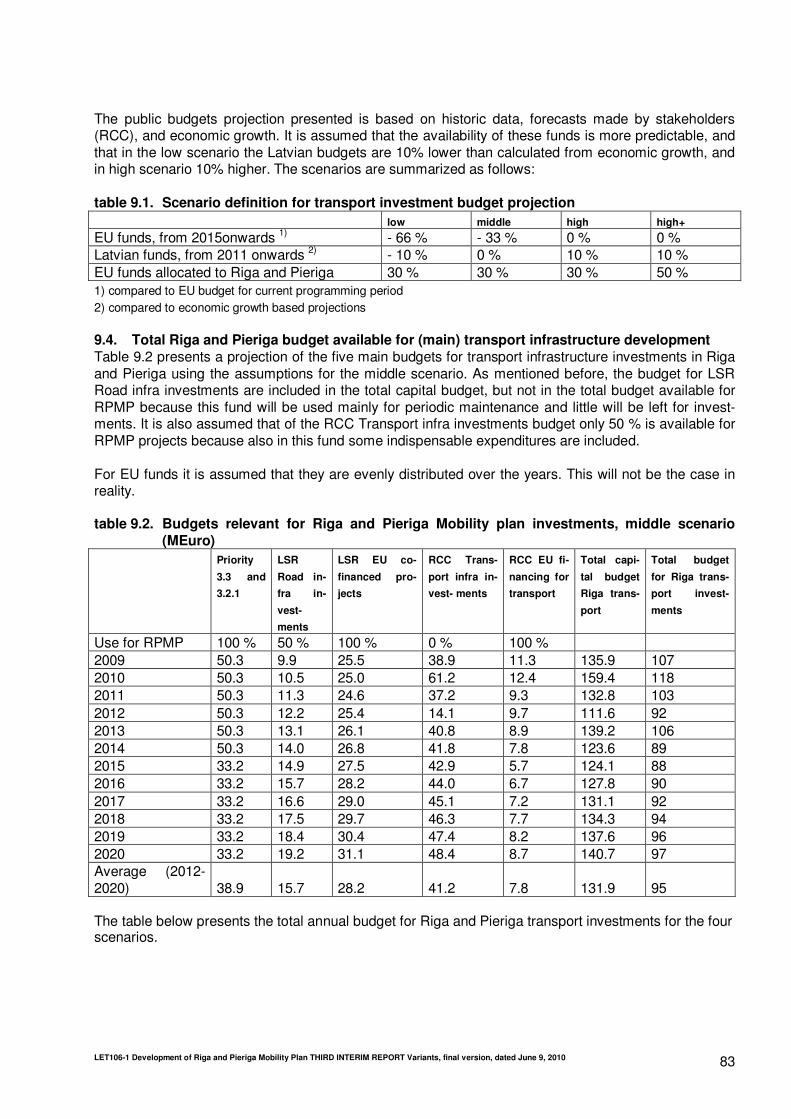
LET106-1 Development of Riga and Pieriga Mobility Plan THIRD INTERIM REPORT Variants, final version, dated June 9, 2010 83
The public budgets projection presented is based on historic data, forecasts made by stakeholders (RCC), and economic growth. It is assumed that the availability of these funds is more predictable, and that in the low scenario the Latvian budgets are 10% lower than calculated from economic growth, and in high scenario 10% higher. The scenarios are summarized as follows: table 9.1. Scenario definition for transport investment budget projection
low middle high high+
EU funds, from 2015onwards 1) - 66 % - 33 % 0 % 0 % Latvian funds, from 2011 onwards 2) - 10 % 0 % 10 % 10 % EU funds allocated to Riga and Pieriga 30 % 30 % 30 % 50 % 1) compared to EU budget for current programming period 2) compared to economic growth based projections 9.4. Total Riga and Pieriga budget available for (main) transport infrastructure development Table 9.2 presents a projection of the five main budgets for transport infrastructure investments in Riga and Pieriga using the assumptions for the middle scenario. As mentioned before, the budget for LSR Road infra investments are included in the total capital budget, but not in the total budget available for RPMP because this fund will be used mainly for periodic maintenance and little will be left for invest-ments. It is also assumed that of the RCC Transport infra investments budget only 50 % is available for RPMP projects because also in this fund some indispensable expenditures are included. For EU funds it is assumed that they are evenly distributed over the years. This will not be the case in reality. table 9.2. Budgets relevant for Riga and Pieriga Mobility plan investments, middle scenario
(MEuro)
Priority
3.3 and
3.2.1
LSR
Road in-
fra in-
vest-
ments
LSR EU co-
financed pro-
jects
RCC Trans-
port infra in-
vest- ments
RCC EU fi-
nancing for
transport
Total capi-
tal budget
Riga trans-
port
Total budget
for Riga trans-
port invest-
ments
Use for RPMP 100 % 50 % 100 % 0 % 100 % 2009 50.3 9.9 25.5 38.9 11.3 135.9 107 2010 50.3 10.5 25.0 61.2 12.4 159.4 118 2011 50.3 11.3 24.6 37.2 9.3 132.8 103 2012 50.3 12.2 25.4 14.1 9.7 111.6 92 2013 50.3 13.1 26.1 40.8 8.9 139.2 106 2014 50.3 14.0 26.8 41.8 7.8 123.6 89 2015 33.2 14.9 27.5 42.9 5.7 124.1 88 2016 33.2 15.7 28.2 44.0 6.7 127.8 90 2017 33.2 16.6 29.0 45.1 7.2 131.1 92 2018 33.2 17.5 29.7 46.3 7.7 134.3 94 2019 33.2 18.4 30.4 47.4 8.2 137.6 96 2020 33.2 19.2 31.1 48.4 8.7 140.7 97 Average (2012-2020) 38.9 15.7 28.2 41.2 7.8 131.9 95 The table below presents the total annual budget for Riga and Pieriga transport investments for the four scenarios.
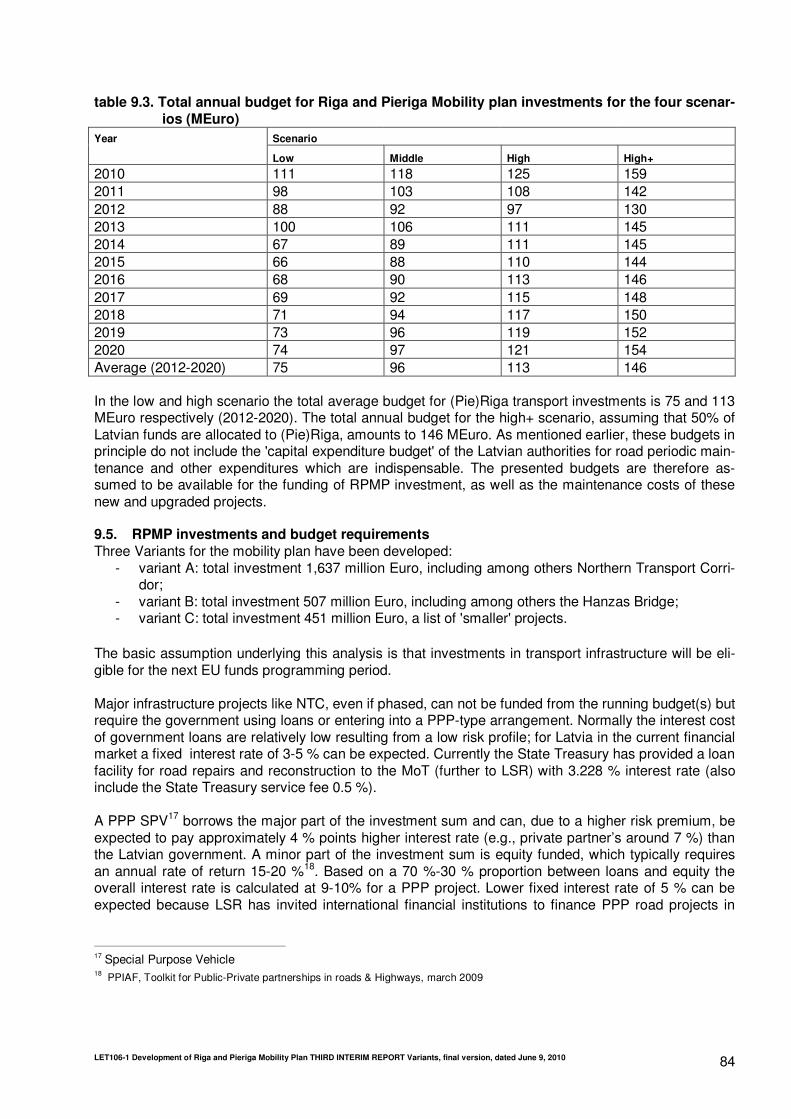
LET106-1 Development of Riga and Pieriga Mobility Plan THIRD INTERIM REPORT Variants, final version, dated June 9, 2010 84
table 9.3. Total annual budget for Riga and Pieriga Mobility plan investments for the four scenar-ios (MEuro)
Year Scenario
Low Middle High High+
2010 111 118 125 159 2011 98 103 108 142 2012 88 92 97 130 2013 100 106 111 145 2014 67 89 111 145 2015 66 88 110 144 2016 68 90 113 146 2017 69 92 115 148 2018 71 94 117 150 2019 73 96 119 152 2020 74 97 121 154 Average (2012-2020) 75 96 113 146 In the low and high scenario the total average budget for (Pie)Riga transport investments is 75 and 113 MEuro respectively (2012-2020). The total annual budget for the high+ scenario, assuming that 50% of Latvian funds are allocated to (Pie)Riga, amounts to 146 MEuro. As mentioned earlier, these budgets in principle do not include the 'capital expenditure budget' of the Latvian authorities for road periodic main-tenance and other expenditures which are indispensable. The presented budgets are therefore as-sumed to be available for the funding of RPMP investment, as well as the maintenance costs of these new and upgraded projects. 9.5. RPMP investments and budget requirements Three Variants for the mobility plan have been developed:
- variant A: total investment 1,637 million Euro, including among others Northern Transport Corri-dor;
- variant B: total investment 507 million Euro, including among others the Hanzas Bridge; - variant C: total investment 451 million Euro, a list of 'smaller' projects.
The basic assumption underlying this analysis is that investments in transport infrastructure will be eli-gible for the next EU funds programming period. Major infrastructure projects like NTC, even if phased, can not be funded from the running budget(s) but require the government using loans or entering into a PPP-type arrangement. Normally the interest cost of government loans are relatively low resulting from a low risk profile; for Latvia in the current financial market a fixed interest rate of 3-5 % can be expected. Currently the State Treasury has provided a loan facility for road repairs and reconstruction to the MoT (further to LSR) with 3.228 % interest rate (also include the State Treasury service fee 0.5 %). A PPP SPV17 borrows the major part of the investment sum and can, due to a higher risk premium, be expected to pay approximately 4 % points higher interest rate (e.g., private partner’s around 7 %) than the Latvian government. A minor part of the investment sum is equity funded, which typically requires an annual rate of return 15-20 %18. Based on a 70 %-30 % proportion between loans and equity the overall interest rate is calculated at 9-10% for a PPP project. Lower fixed interest rate of 5 % can be expected because LSR has invited international financial institutions to finance PPP road projects in
17 Special Purpose Vehicle 18 PPIAF, Toolkit for Public-Private partnerships in roads & Highways, march 2009

LET106-1 Development of Riga and Pieriga Mobility Plan THIRD INTERIM REPORT Variants, final version, dated June 9, 2010 85
Latvia, in particular European Investment Bank, European Reconstruction and Development Bank and Nordic Investment Bank. PPP's have among others the advantage of life-cycle design and operation, better costs control during construction and efficient maintenance, and in general involving the experience and expertise of the private sector. Eurostat regulations dictate that PPP can be funded 'off the (government) balance' (not part of government liabilities, and thus not affecting the government's liability limit), provide that the in-frastructure costs are completely covered by road user charges. This is however not expected to be a realistic option for Riga. Other bottlenecks with PPP relate to:
- in the current financial market private funding > 500 MEuro appears very high 19; - PPP combined with EU funding is so far not a proven model. The MoF is considering these
funding options, but it is still at a very early development stage and needs detailed analysis. Ex-perience in other European countries learns this often proves to be complex.
More information on these and other aspects of recent PPP experiences in infrastructure development is presented in section 9.8. The below analysis assumes loan funding for major infrastructure projects (NTC), and a combination of loan and budget funding for smaller investment packages (variants B and C). Indicative calculations are carried out based on 4 % fixed interest on loan and a repayment period of 16 years. The government budget is also charged with maintenance cost (1 % of the investment sum). The total available annual budgets, for which scenarios are defined (see section 3), are compared with both the investment cost (relevant to budget funding) and the annual capital cost (relevant to loan funding). In principle, it can be concluded for Variants B and C that, even in the Low scenario, it appears possible to fund the investments from budgets and loans (for (pre)financing), especially when these can be phased for several years. For Variant A (including NTC), even in the High+ scenario, the ratio investment cost to annual budget is 11, and for the Low scenario 21. This investment mainly needs to be loan funded (eventually PPP). The resulting annual capital cost (including maintenance) is even in the High scenario substantially higher than the total annual budget. In the High+ scenario the annual capital cost and the annual budget are more or less equal. From these assumptions it appears that funding Variant A might be possible in very favourable conditions, but this will probably be quite difficult. In addition the general context of the latter the economy and government budgets should be noted. The first priority of the Latvian government is to reduce the next year budget with around 400 million LVL, and in general it seems that infrastructure investments need to be postponed until the restructuring of government budgets is completed and the economy is growing again. It is also noted that, when budg-ets for transport infrastructure are increasing again, an emphasis on major periodic maintenance of ne-glected infrastructure appears recommendable. But indeed, for co-financing of EU funded projects this reasoning hardly applies.
19 Source: Capital markets in PPP financing, where we were and where we are we going. EPEC (European PPP exper-tise centre - a collaboration between EIB, EU and other partners), April 2010;

LET106-1 Development of Riga and Pieriga Mobility Plan THIRD INTERIM REPORT Variants, final version, dated June 9, 2010 86
table 9.4. Investment and capital cost compared with the total transport budgets for four sce-nario’s (MEuro)
Low scenarioAnnual budget (Pie)Riga transport investments (MEuro) 75
Investment
cost (MEuro)
Variant A 1.637Variant B 507Variant C 451
Middle scenario
Annual budget (Pie)Riga transport investments (MEuro) 96
Investment
cost (MEuro)
Variant A 1.637Variant B 507Variant C 451
High scenario
Annual budget (Pie)Riga transport investments (MEuro) 113
Investment
cost (MEuro)
Variant A 1.637Variant B 507Variant C 451
High scenario+Annual budget (Pie)Riga transport investments (MEuro) 146
Investment
cost (MEuro)
Variant A 1.637Variant B 507Variant C 451
15122
Fully loan funded,
annual capital cost
(MEuro)
5 42
Fully loan funded,
annual capital cost
(MEuro)
Investment /
Annual budget
47
7
5 47
47426
4 42
Investment /
Annual budget
Investment /
Annual budget
Fully loan funded,
annual capital cost
(MEuro)
17 1515
15 151
Investment /
Annual budget
Fully loan funded,
annual capital cost
(MEuro)
3 42
11 1513 47
9.6. Latvia liability limits Several laws and regulations limit the capacity of Latvian public authorities to borrow funds or increase liabilities in another way. The national borrowing capacity is limited because it is constrained due to obligations to international lenders (IMF, the World Bank and the EU). Latvian government intends to gradually fulfill Maastricht cri-teria by 2012 and reach a fiscal deficit 8.5 % of GDP in 2010, 6 % of GDP in 2011 and 3 % of GDP in 2012. Pursuing such tight fiscal policy the Latvian government does not have many possibilities to raise debt financing for support of transport infrastructure projects including RPMP. It explains why in the Law on State Budget national government or municipalities can undertake liabilities only in case if such li-
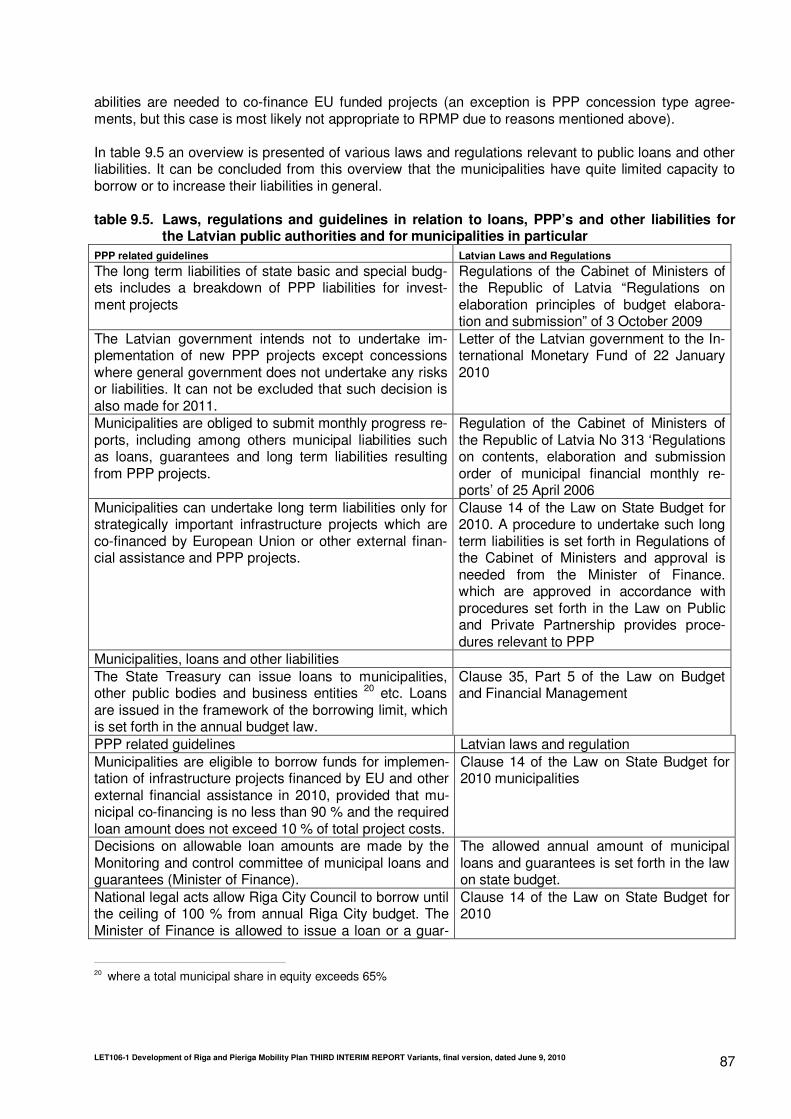
LET106-1 Development of Riga and Pieriga Mobility Plan THIRD INTERIM REPORT Variants, final version, dated June 9, 2010 87
abilities are needed to co-finance EU funded projects (an exception is PPP concession type agree-ments, but this case is most likely not appropriate to RPMP due to reasons mentioned above). In table 9.5 an overview is presented of various laws and regulations relevant to public loans and other liabilities. It can be concluded from this overview that the municipalities have quite limited capacity to borrow or to increase their liabilities in general. table 9.5. Laws, regulations and guidelines in relation to loans, PPP’s and other liabilities for
the Latvian public authorities and for municipalities in particular
PPP related guidelines Latvian Laws and Regulations
The long term liabilities of state basic and special budg-ets includes a breakdown of PPP liabilities for invest-ment projects
Regulations of the Cabinet of Ministers of the Republic of Latvia “Regulations on elaboration principles of budget elabora-tion and submission” of 3 October 2009
The Latvian government intends not to undertake im-plementation of new PPP projects except concessions where general government does not undertake any risks or liabilities. It can not be excluded that such decision is also made for 2011.
Letter of the Latvian government to the In-ternational Monetary Fund of 22 January 2010
Municipalities are obliged to submit monthly progress re-ports, including among others municipal liabilities such as loans, guarantees and long term liabilities resulting from PPP projects.
Regulation of the Cabinet of Ministers of the Republic of Latvia No 313 ‘Regulations on contents, elaboration and submission order of municipal financial monthly re-ports’ of 25 April 2006
Municipalities can undertake long term liabilities only for strategically important infrastructure projects which are co-financed by European Union or other external finan-cial assistance and PPP projects.
Clause 14 of the Law on State Budget for 2010. A procedure to undertake such long term liabilities is set forth in Regulations of the Cabinet of Ministers and approval is needed from the Minister of Finance. which are approved in accordance with procedures set forth in the Law on Public and Private Partnership provides proce-dures relevant to PPP
Municipalities, loans and other liabilities The State Treasury can issue loans to municipalities, other public bodies and business entities 20 etc. Loans are issued in the framework of the borrowing limit, which is set forth in the annual budget law.
Clause 35, Part 5 of the Law on Budget and Financial Management
PPP related guidelines Latvian laws and regulation Municipalities are eligible to borrow funds for implemen-tation of infrastructure projects financed by EU and other external financial assistance in 2010, provided that mu-nicipal co-financing is no less than 90 % and the required loan amount does not exceed 10 % of total project costs.
Clause 14 of the Law on State Budget for 2010 municipalities
Decisions on allowable loan amounts are made by the Monitoring and control committee of municipal loans and guarantees (Minister of Finance).
The allowed annual amount of municipal loans and guarantees is set forth in the law on state budget.
National legal acts allow Riga City Council to borrow until the ceiling of 100 % from annual Riga City budget. The Minister of Finance is allowed to issue a loan or a guar-
Clause 14 of the Law on State Budget for 2010
20 where a total municipal share in equity exceeds 65%

LET106-1 Development of Riga and Pieriga Mobility Plan THIRD INTERIM REPORT Variants, final version, dated June 9, 2010 88
PPP related guidelines Latvian Laws and Regulations
antee even in cases if total liabilities of a municipality exceeds 20 % of annual budget revenues for co-financing of EU projects 21 9.7. PPP road projects and private funding The information presented in this section is mainly based on the following recent studies:
- Capital markets in PPP financing, where we were and where we are we going. EPEC (European PPP expertise centre - a collaboration between EIB, EU and other partners), April 2010;
- the financial crisis and the PPP market - potential remediation actions. EPEC ( European PPP expertise centre- a collaboration between EIB, EU and other partners), August 2009;
- Mobilising private and public investment- for recovery and long-term structural changes: devel-oping public-private partnerships. commission of the European communities, November 2009;
- the Swedish model for PPP in infrastructure investment, summary of a report drawn up by a joint working group from Banverket, VTI, and the SRA, 2008.
basic characteristics of recent PPP road projects In PPP road projects design and construction is usually financed by the project company raising a loan. Loan repayments begin when the facility opens and continue during the operational period using funds paid by the state as payment for the service. This has two important consequences:
- incentives for an early traffic opening are strong, with the resulting socio-economic benefits; - interest costs are higher compared with state financing.
A suitable PPP model should also be so flexible so that it can handle user fees in order to achieve a broader financing base. Constructions with user fees should be designed carefully to stop any unde-sired impact on traffic control. In cases where the state is responsible for final financing then payments to the project company should be made as a fixed annual payment. In cases where users are responsible for all or part of the final fi-nancing through user fees then user fees are best paid to the state (the Norwegian model). A calculation example of charges during the contract period: assuming a private party invests 100 MEuro in the transport infrastructure and requires 15 % return on equity investment22 within an opera-tion period of 15 years: the availability charge paid by the public authorities amounts to 14 million Euro per year. budgetary consequences of road PPP versus traditional funding and loans If the project company is entirely responsible for financing investment costs (i.e. uses its own capital and loans on the capital market) then state budgets are not affected until the facility is opened. How-ever, PPP total contract value becomes part of the country’s long term liabilities). With regard to the Law on Budget and Financial Management PPP contract expenditure become a liability for the current budget year only if service availability payment is planned in particular year. However, IMF uses a dif-ferent methodological approach and assumes that PPP contract liabilities in full contract amount be-come part of annual government liability starting from the contract signature date (ESA 95 standard – European System of National and Regional Accounts). The economic and state-finance impact of PPP contracts is primarily periodisation effects. A transfer from financing of infrastructure investments via the main regulations for loan financing in budget law (loans from the National Debt Office) means increased appropriations (credit) scope today at the price
21
minus state categorised subsidies and contributions to the Municipal financial equalisation fund. 22
the project could be 70% loan financed (7% interest) and for 30% using equity (15% return required for international contractor incl. risk premium) and 1% mainte-nance cost in relation to investments
LET106-1 Development of Riga and Pieriga Mobility Plan THIRD INTERIM REPORT Variants, final version, dated June 9, 2010 89
of a reduction in appropriations (credit) scope tomorrow. PPP means increased scope below the budget ceiling at the time of investment compared with appropriations (credit) financing. If the project company is entirely responsible for financing investment costs (i.e. uses loans on the capi-tal market) then state budgets are not impacted until the facility is opened. The budget balance is charged during the contract period with periodic payments to the project company. observations from the current PPP market
- on the financial market ⋅ Project finance and PPP lending is competing for scarce regulatory capital allocations with more
attractive corporate opportunities. This is testing the viability of the current PPP model; ⋅ The syndicated loan market has stalled; ⋅ Bank margins have increased substantially; ⋅ Senior bank debt23 tenors have significantly reduced; ⋅ Some banks have partially or totally withdrawn from the Project Finance market. There is also
evidence that previously active international players have become more orientated to their do-mestic markets;
⋅ No viable capital market solution has emerged to replace the wrapped bond market which closed with the demise of the monoline business.
- on the projects ⋅ projects in excess of €500m are likely to be expensive or require substantial public support.
Most banks now argue that the very long tenors, i.e. over 25 years, observed in the PPP market before the crisis, were probably unsustainable;
⋅ There appears to be a consensus that shorter term loans, i.e. in the 15-18 years range, are much more “bankable” and that longer tenors should be the preserve of capital markets. The main driver of the PPP contract duration should however remain technical (life-cycle and obso-lescence considerations) rather than financial.
However, the PPP market has not entirely collapsed. Deals are still being brought to market and clos-ing, albeit more slowly. There is a high degree of selectivity on the part of banks and a general lack of consistency in the terms and conditions required by funders. state incentives for PPP projects Remedial actions within States’ or Public Authorities’ control In addition to expanding already existing forms of public support to PPPs, such as grants or multilateral lending, there are two main new avenues which are being explored by several countries:
- State guarantees, applied to project debt or project; - bonds (e.g. the French or Portuguese guarantee facilities); - Co-lending by the State, such as the Infrastructure Finance Unit of the UK Treasury.
EU co-funded PPP projects PPP’s which include a Structural or Cohesion Fund component are possible from a legal and technical point of view. However, projects of this kind are more complex than those with standard procurement, generally take longer to structure and involve more initial cost. For this reason there are not many suc-cessful examples and appear to be none so far in central and eastern Europe. Greece and Portugal have been the most active in using a PPP approach with a Structural Fund element for infrastructure projects (e.g. the new Athens airport, the Antirion bridge in Greece, the Vasco be Gama bridge in Lis-bon) where the EU grant element was a contribution to the capital cost. These examples in Greece and
23 In finance, senior debt, frequently issued in the form of senior notes or referred to as senior loans, is debt that takes priority over other unsecured or otherwise more "junior" debt owed by the issuer.

LET106-1 Development of Riga and Pieriga Mobility Plan THIRD INTERIM REPORT Variants, final version, dated June 9, 2010 90
Portugal all took place in the 2000-2006 funding period; there has been little new activity in the recent past although Portugal is planning a major high speed rail project as a PPP. There is no single guidance note or 'cookbook' for PPP projects involving the EU Funds. There are principles derived from EU law which PPP projects of this kind must observe - competition, value for money, equality of treatment, equal access to information, safeguarding of the public interest etc. As mentioned before, currently the Latvian MoF is exploring possibilities to apply PPP procurement to-gether with EU funds. conclusions for RPMP The analysis leads to the following conclusions for the RPMP on PPP:
- PPP projects combined with EU-co-funding are unlikely to be realized in the short term, because this is very complex set-up and very few successful examples. Therefore PPP projects should be either entirely private funded or private and co-funding by the public authorities. These op-tions in most cases create a financial liability for the public authorities for the contract period. In the case of public co-funding of the project an additional funding requirement is created;
- when the capital and maintenance costs can be fully paid by the road users there will be no li-ability to the government. Due to the relatively low traffic intensity and population purchasing power this appears to be a unlikely situation;
- the first priority for the public authorities should be to utilise the limited public funds to co-finance EU funded projects;
- in case after the full utilisation of EU funds some public funds to invest in transport infrastructure are still available, PPP transport projects could be considered. These will create liabilities to the public budget after the infrastructure has been realised for which these public budgets could be allocated;
- in the aftermath of the global financial crisis it will be difficult for Latvia to interest private parties to invest in transport infrastructure, even more so because Latvia has no experience in these ar-rangements and the new PPP legal framework is at the early stage of implementation. This situation increases the initial cost and the risk of aborted negotiations make investors even more careful. However, these judgments will be verified at the end of this year (the bid submission date is 30 September 2010) when bid evaluation will be completed for the first PPP roads tender in Latvia (Riga – Senite section of motor road E77/A2);
- PPP project should be sufficiently large and long term in operation to allow for a return on in-vestment including initial cost (advisory, banking). A 50 million Euro project is an indication for a minimum project size. On the other hand, in view of the scarcity of capital the project should not be too large (< €500m).
9.8. Loans, EBRD and EIB The EBRD and EIB are the two main international financing institutions for Latvia.
EBRD The EBRD uses the tools of investment to help build market economies and democracies in countries from central Europe to central Asia. The EBRD is the largest single investor in Europe and mobilises significant foreign direct investment beyond its own financing. It is owned by 61 countries and two inter-governmental institutions. But despite its public sector shareholders, it invests mainly in private enter-prises, usually together with commercial partners. According to its mandate the EBRD only works in countries that are committed to democratic principles and EBRD investments must be based on respect for the environment. The objectives of EBRD investments must support transition, i.e. help move a country closer to a full market economy. The strategy of the EBRD is to deepen and broaden the role of the private sector in the economy. Only in exceptional cases the EBRD will rely on state guarantees to underpin the projects. The EBRD has a few particular focuses in its investment policy, among which: infrastructure and en-ergy, particularly through transfer to private ownership and commercialisation of energy utilities; to sup-

LET106-1 Development of Riga and Pieriga Mobility Plan THIRD INTERIM REPORT Variants, final version, dated June 9, 2010 91
port municipal clients of making use of EU funding and to develop public and private partnerships; to support commercialisation in the transport sector and explore ways to increase opportunities where state guarantees are not required. From the year 2000 the EBRD invested a total value of 927 million Euros in Latvia in 32 different projects. EIB, European Investment Bank The EIB provides loans for projects of EU interest, such as rail and road connections, airports or envi-ronmental projects, in particular for less prosperous regions, candidate member states and for develop-ing countries. The EIB is financed from loans on the capital market and by the shareholders of the bank being the member states of the EU. The projects in which the EIB invests are carefully selected on the basis of the following criteria: help to achieve the EU objectives, such as improvement of the competi-tive power of the European industries and the small and medium sized enterprises (SME’s); realisation of Trans-European Networks (transport, telecommunication and energy); promotion of information technology; protection of natural and urban environments; improvement of health care and education; stimulate the least favoured regions; help to attract other financing sources. In the past five years the EIB has provided loans in Latvia with a total value of € 943 million, of which € 610 million in 2008. 9.9. Conclusion The main types of budgets available for transport infrastructure development in Riga and Pieriga are those from:
- EU; - Latvia State Roads; - Riga City Council.
For these budgets an inventory has been made of current (and historic) budgets relevant to invest in (new) infrastructure. A projection is prepared based on the economic growth forecast for Latvia. Four scenario’s have been developed for these budgets, in which the uncertainty of EU budgets in the next programming period is emphasized, and the Latvian transport investment budgets and the share of EU funds attributed to Riga and Pieriga are also included. The size of these budgets in the scenario’s is compared with the budgets required for the realisation of the RPMP variants. In principle it can be concluded for Variants B and C that, even in the Low scenario, it appears possible to fund the investments from budgets and loans (for (pre)financing), especially when these can be phased for several years. For Variant A (including NTC) it appears that funding might be possible only in very favourable conditions, but this will probably be quite difficult. Several laws and regulations and obligations to international lenders severely limit the capacity of Lat-vian public authorities to borrow funds or increase liabilities in another way. PPP projects combined with EU-co-funding are unlikely to be realized in the short term, because this is very complex set-up which has very few successful examples in Europe so far. PPP results in a liability to the public authorities, unless the capital and maintenance costs can be fully paid by the road users. However, from preliminary studies this appears to be an unlikely situation.

LET106-1 Development of Riga and Pieriga Mobility Plan THIRD INTERIM REPORT Variants, final version, dated June 9, 2010 92
10. CONCLUSIONS AND RECOMMENDATION This chapter describes the conclusions on the RPMP variants and gives a recommendation for choos-ing the preferred variant. In the first section the variants are assessed with a multi criteria analysis. The second and third section give the conclusions and recommendation. The last section gives a short summary of the activities in the next project phase. 10.1. Multi criteria assessment To be able to recommend on a preferred variant for the RPMP the variants have been assessed with the traffic model and the cost-benefit analysis. However, these assessments alone do not give a com-plete idea on the performance of each of the variants compared to the objectives for the RPMP. There-fore, also a multi-criteria analysis (MCA) for the variants has been prepared. In this analysis the variants are scored for several qualitative criteria which are closely related to the RPMP objectives. Together with the results of the CBA and the traffic modelling the MCA gives the basis for choosing the preferred variant. The following seven objectives were the basis for development of the RPMP: 1. to make effective use of the existing transport system of Riga and Pieriga and prefer soft measures
(management, organisation, ITS) over hard measures (infrastructure development) where possible; 2. develop an efficient, attractive and competitive public transport system, with priority for electric and
railway modes; 3. to eliminate bottlenecks in the road network to create a coherent network, with clear road classifica-
tions and prioritisation of modes; 4. increase the level of road safety, without hampering accessibility; 5. provide multi modal accessibility to different places; 6. ensure good and reliable connections between the Riga Freeport, Riga and other national and inter-
national (TEN-T) transport infrastructure networks; 7. ensure good and reliable connections between the Riga international airport, Riga and other main
regional centres in a sustainable way. Based on these objectives several criteria have been defined on which the variants are scored (relative to the reference). The scores are based on expert judgement. The multi criteria analysis gives an over-view of the effects of the variants for several aspects, but does not give a total score. Therefore, it would be necessary to assign weights to the criteria. The analysis without weights gives an objective overview of effects and is supportive to the decision making for the preferred variant. Table 10.1 gives a short explanation of the criteria used. The results of the analysis are shown in table 10.2. table 10.1. Explanation of criteria used in the analysis
criterion explanation
Coherent road hierarchy The road hierarchy is coherent if there is a complete, recognis-able and understandable network of main roads with similar de-sign characteristics
Network robustness The network is robust if for the important origin destination rela-tions there are several route options available; in case of an ac-cident on one route accessibility can still be guaranteed
Connections of Riga Freeport The quality of connection to the Riga freeport by road, rail and public transport
Connection of Riga airport The quality of connection to the Riga airport by road, rail and public transport
Accessibility Pieriga Quality of the accessibility Pieriga-Riga by road, rail and public transport
Multi modal accessibility Availability of connections for different travel modes on the main

LET106-1 Development of Riga and Pieriga Mobility Plan THIRD INTERIM REPORT Variants, final version, dated June 9, 2010 93
criterion explanation
origin destination relations Public transport development Improvement of the current public transport network and facili-
ties as well as the performance Congestion reduction Reduction of the total amount of congestion in Riga and Pieriga
(increase in the average travel speed) Mobility Improvement in the travel possibilities for travellers in Riga and
Pieriga (e.g. a new PT line leads to extra mobility) Durability for future developments The variant is durable if it contains reserve capacity, does not
limit possibilities for future developments, and anticipates on de-velopments
Concurrence with existing plans Concurrence with the existing spatial and infrastructural devel-opment plans of the stakeholders involved
Traffic safety Effect on the number of road accidents in Riga and Pieriga Liveability in Riga Effect on liveability aspects such as noise and air pollution Use of existing infrastructure in Riga Use of the existing infrastructure where possible, instead of de-
velopment of new infrastructure Effect on nature and landscape Effects on areas with important value for nature and landscape Investment costs The total investments needed for the variant (financial feasibility) Travel time gains Effect on the average travel time per origin destination relation
(reduction of travel times) IERR Internal economic rate of return table 10.2. Results of the multi criteria analysis
Criterion Variant A Variant B Variant C
Coherent road hierarchy ++ + 0 Network robustness ++ + 0 Connections of Riga Freeport ++ + 0 Connection of Riga airport ++ + + Accessibility Pieriga ++ + + Multi modal accessibility ++ ++ + Public transport development ++ ++ + Congestion reduction ++ ++ + Mobility ++ + 0 Durability for future developments ++ + 0 Concurrence with existing plans ++ 0 0 Traffic safety ++ + + Liveability in Riga ++ + + Use of existing infrastructure in Riga -- - 0 Effect on nature and landscape -- - - Investment costs -- - 0 Travel time gains ++ + 0 EIRR ++ + + The first set of criteria is related to supply side characteristics. From a network perspective variant A can be regarded as the best variant. The variant contains a hierarchy that clearly tries to separate short distance from longer distance traffic, providing options for traffic calming within the grids of the main road structure. Also the robustness of the network improves, since the NTC and the western tangential

LET106-1 Development of Riga and Pieriga Mobility Plan THIRD INTERIM REPORT Variants, final version, dated June 9, 2010 94
route provide extra route alternatives. The connections of the airport and the port areas with the main road structure are improved by the creation of a wide outer ring, a new railway link connecting Krievu Sala and a comfortable, high speed PT connection to the airport (in all variants). The accessibility for Pieriga is improved by means of a package of Latvian State Road projects and PT measures (in all variants) and by means of the NTC. The travel time gains in this variant, as opposed to variant B, are also taken by Pieriga trips. On the next two criteria variant A scores similar as variant B. In both variants multi modal accessibility is improved by offering more connections for different modes, enhancing the systems per mode and providing transfer points. Also, public transport is more developed, due to PT measures, and chances for further development are greater, since freed road space can be used for dedicated PT infrastructure. Apart from the last two criteria, variant B scores lower than variant A, which is mostly related to the fact that the main city ring is narrower, offering less alternative routes. Variant C provides a better connec-tion to the airport than the reference situation, due to a traffic management scheme. It also scores bet-ter on accessibility for Pieriga, multi modal accessibility and public transport development, because of the basic set of measures included in all variants. The second set of criteria is more related to the way the infrastructure is used and the side-effects of this usage, The first criterion congestion reduction is based on delay experienced on the network. All three variants lead to less delay, especially on the secondary road network. Since variants A and B provide new infrastructure and a coherent road hierarchy, they score better than variant C. Mobility is related to the extra distance per trip that is covered, as a result of destination choice instead of route choice. Variant A has the strongest impact on destination choice, i.e. car drivers prefer to travel to des-tinations further out. Durability refers to the amount of car traffic the system can cope with and the pos-sibilities to use reserve capacity for facilitating spatial development. Variant A gives the most durable system, variant C the least. As for concurrence with existing plans and the priority of measures, variant C scores the best. The next criterion traffic safety is correlated with the extent to which roads are used according to their hierarchy and with the amount of congestion. In variant A the hierarchy works the best, so the level of traffic safety is expected to be higher. But also in variant C traffic safety is expected to be better than in the reference situation, because part of car trips are substituted for public transport trips and the city centre becomes in all variants a 30 km/h zone. The criterion liveability stands for the extent of traffic hindrance like noise, waiting times for crossing roads, intrusion, feelings of traffic unsafety, local acces-sibility and alike. The scores are the same as for traffic safety. The last two criteria in this set are about space consumption and intrusion/disintegration of countryside. On both criteria variant C scores well. The third set of criteria are the major aspects in the cost benefit analysis. The higher the investment costs, the higher the travel time gains. Variant C and variant A represent both ends of this relationship. Following the internal economic rate of return, variant C scores slightly better than B. 10.2. Conclusion In this report the transport model and CBA results of three RPMP variants and the reference variant have been presented. The variants consist of a package with basic measures and several distinguish-ing measures per variant. They follow the philosophy of implementing a road hierarchy with main roads to accommodate interurban traffic and local roads for dwelling and local traffic. The results show that this philosophy does work well for variants A and B. Variant C does have a less clear road hierarchy due to the limited investments. Variant A has a sparse main road structure including construction of the Northern Transport Corridor. This variant has the largest positive effects on the functioning of the transport system, but also the larg-est investments and the largest impact on the environment. However, the investments turn out positive in the cost benefit analysis due to the large benefits of this variant. Variant B has a more dense main
LET106-1 Development of Riga and Pieriga Mobility Plan THIRD INTERIM REPORT Variants, final version, dated June 9, 2010 95
structure with construction of the Hanza crossing. Also this variant has quite large positive effects on the functioning of the transport, but this variant is less positive in the CBA than variant A, due to less benefits. Variant C has only a small positive impact on the functioning of the transport system in line with the small investments. This variant clearly shows that to really improve the functioning of the transport sys-tem and to create a clear road hierarchy, the construction of a new river crossing is necessary. All three variants turn out positive in an economic cost benefit analysis with the best results for variant A. However, financing is difficult for this variant. In principle it can be concluded for Variants B and C that, even in the Low investment scenario, it appears possible to fund the investments from budgets and loans (for (pre)financing), especially when these can be phased for several years. For Variant A (including NTC) it appears that funding might be possible only in very favourable conditions, but this will probably be quite difficult. Variant C involves low investment costs, but does not really help to arrive to the objectives for the transport system in the future. 10.3. Recommendation Based on the results of traffic modelling, the cost-benefit analysis and the multi criteria analysis variant A clearly achieves the best results for the RPMP. Therefore, the recommendation is to choose this vari-ant as preferred variant. Financing of the Northern Transport Corridor, which accounts for 75% of the variant’s costs, is an important condition for this variant and needs to be studied in the next phase to-gether with the Client. The method of financing of the NTC is also part of the ongoing NTC study and therefore the latest information / possibilities from the ongoing study will be used for the final report of the RPMP. In the mean time further study can be conducted as to how to simplify the design, to save on investment costs. 10.4. Elaboration preferred variant This report mentions in several places the aspects that will be further elaborated for the preferred vari-ant. For the variant which is chosen as preferred the structure described in this report is the basis. In the next task the following aspects are elaborated further:
- road and rail infrastructure: the road hierarchy is developed in more detail, a complete overview of necessary investments for this hierarchy and for the railways is given and outlines are given for example solutions for local bottlenecks;
- soft measures: this report presents a first introduction to soft measures (e.g. pricing), in the next task an overview is given of those soft measures which should be part of the RPMP;
- traffic management: an outline for a traffic management system for Riga and Pieriga is devel-oped;
- parking: an outline for parking policy is given, including information on parking locations, P+R and pricing;
- public transport: a complete overview of the necessary investments for PT is given and meas-ures related to PT reorganisation, traffic management, rolling stock capacities and planning, ticketing and passenger information are included;
- freight transport: a description is given of the route network for freight transport by road and rail and attention is given to intermodal management and freight parking;
- non motorized transport: NMT network and measures are developed in more detail; - marketing and commerce: a marketing and communication strategy is developed and the possi-
bilities for commerce at transit centres are described; - organization and management: description of the proposed structure and necessary adjust-
ments of the institutional and regulatory framework of management of traffic infrastructure and a list of proposed adjustments of present planning documents for investments in traffic infrastruc-ture and spatial planning are prepared;
- cost benefit analysis and financial sources: financial sources for every implementation period are described and a cost-benefit analysis is given for the final RPMP;

LET106-1 Development of Riga and Pieriga Mobility Plan THIRD INTERIM REPORT Variants, final version, dated June 9, 2010 96
- environmental assessment: a strategic environmental impact assessment (SEIA) is prepared and delivered as separate document together with the RPMP.
Summarizing, in the next task the projects and measures for the RPMP will be completed and will be presented in a clear and concrete structure. Attention is given to the prioritization of measures, financ-ing and the action program for the first 7 years.