minnesota sentencing guidelines commission · linda mcbrayer, management analyst 4 ... this data...
TRANSCRIPT
MINNESOTA SENTENCING GUIDELINES COMMISSION
Sentencing Practices Controlled Substance Offenses
Sentenced in 2014
Published November 2015
Sentencing Practices 2014
Commission Members
Christopher Dietzen, Chair and Minnesota Supreme Court Justice Angela Champagne-From, Public Member Jeffrey Edblad, Isanti County Attorney Sergeant Paul Ford, Peace Officer Representative, Washington County Caroline Lennon, First Judicial District Court Judge Cathryn Middlebrook, Chief Appellate Public Defender Tom Roy, Commissioner of Corrections Heidi Schellhas, Minnesota Court of Appeals Judge Yamy Vang, Public Member Mark Wernick, Senior Judge, Public Member Probation Officer Member – vacant
Commission Staff
Nathaniel J. Reitz, Executive Director Kathleen Madland, Research Analyst Linda McBrayer, Management Analyst 4 Jill Payne, Senior Research Analysis Specialist Anne Wall, Senior Research Analysis Specialist
Minnesota Sentencing Guidelines Commission 309 Administration Building
50 Sherburne Avenue St. Paul, MN 55155
Voice: 651.296.0144 Fax: 651.297.5757
TTY: 1-800-627-3529, ask for 651.296.0144
Website: http://mn.gov/sentencing-guidelines/
E-mail: [email protected]
Persons with hearing or speech disabilities may contact us via their preferred Telecommunications Relay Service.
Reports are available in alternative formats upon request.
MSGC: Controlled Substance Offenses

Sentencing Practices 2014 Table of Contents
Summary of 2014 Data ............................................................................................................. 1
Case Volume & Distribution .................................................................................................... 2
Volume of Cases .................................................................................................................... 2
Drug Type, Region, Race & Prior Drug Convictions ................................................................ 5
Sentencing Practices ..............................................................................................................12
Incarceration in State Prison ..................................................................................................12
Probation Cases ....................................................................................................................14
Departure Rates ......................................................................................................................16
Role and Definition of Departures in the Sentencing Guidelines System ...............................16
Description of Departure Types .............................................................................................16
Departure Rates for Drug Offenders and Non-Drug Offenders ..............................................17
Departure Rates for Drug Offenders by Race/Ethnicity ..........................................................22
Departure Rates for Drug Offenders by Drug Degree ............................................................24
Departure Rates for Subsequent Drug Offenders ..................................................................27
How the Guidelines Work, Judicial District Map, Standard Grid .........................................29
MSGC: Controlled Substance Offenses
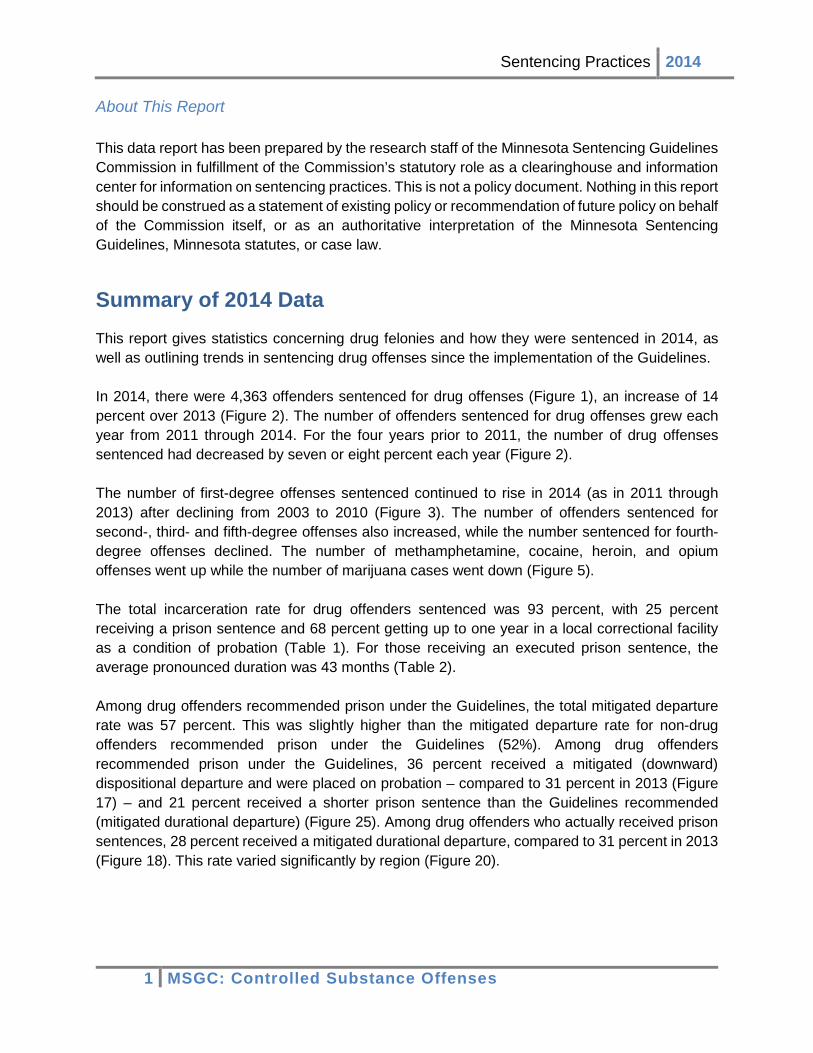
Sentencing Practices 2014 About This Report This data report has been prepared by the research staff of the Minnesota Sentencing Guidelines Commission in fulfillment of the Commission’s statutory role as a clearinghouse and information center for information on sentencing practices. This is not a policy document. Nothing in this report should be construed as a statement of existing policy or recommendation of future policy on behalf of the Commission itself, or as an authoritative interpretation of the Minnesota Sentencing Guidelines, Minnesota statutes, or case law.
Summary of 2014 Data This report gives statistics concerning drug felonies and how they were sentenced in 2014, as well as outlining trends in sentencing drug offenses since the implementation of the Guidelines. In 2014, there were 4,363 offenders sentenced for drug offenses (Figure 1), an increase of 14 percent over 2013 (Figure 2). The number of offenders sentenced for drug offenses grew each year from 2011 through 2014. For the four years prior to 2011, the number of drug offenses sentenced had decreased by seven or eight percent each year (Figure 2). The number of first-degree offenses sentenced continued to rise in 2014 (as in 2011 through 2013) after declining from 2003 to 2010 (Figure 3). The number of offenders sentenced for second-, third- and fifth-degree offenses also increased, while the number sentenced for fourth-degree offenses declined. The number of methamphetamine, cocaine, heroin, and opium offenses went up while the number of marijuana cases went down (Figure 5). The total incarceration rate for drug offenders sentenced was 93 percent, with 25 percent receiving a prison sentence and 68 percent getting up to one year in a local correctional facility as a condition of probation (Table 1). For those receiving an executed prison sentence, the average pronounced duration was 43 months (Table 2). Among drug offenders recommended prison under the Guidelines, the total mitigated departure rate was 57 percent. This was slightly higher than the mitigated departure rate for non-drug offenders recommended prison under the Guidelines (52%). Among drug offenders recommended prison under the Guidelines, 36 percent received a mitigated (downward) dispositional departure and were placed on probation – compared to 31 percent in 2013 (Figure 17) – and 21 percent received a shorter prison sentence than the Guidelines recommended (mitigated durational departure) (Figure 25). Among drug offenders who actually received prison sentences, 28 percent received a mitigated durational departure, compared to 31 percent in 2013 (Figure 18). This rate varied significantly by region (Figure 20).
1 MSGC: Controlled Substance Offenses
Sentencing Practices 2014
Case Volume & Distribution1
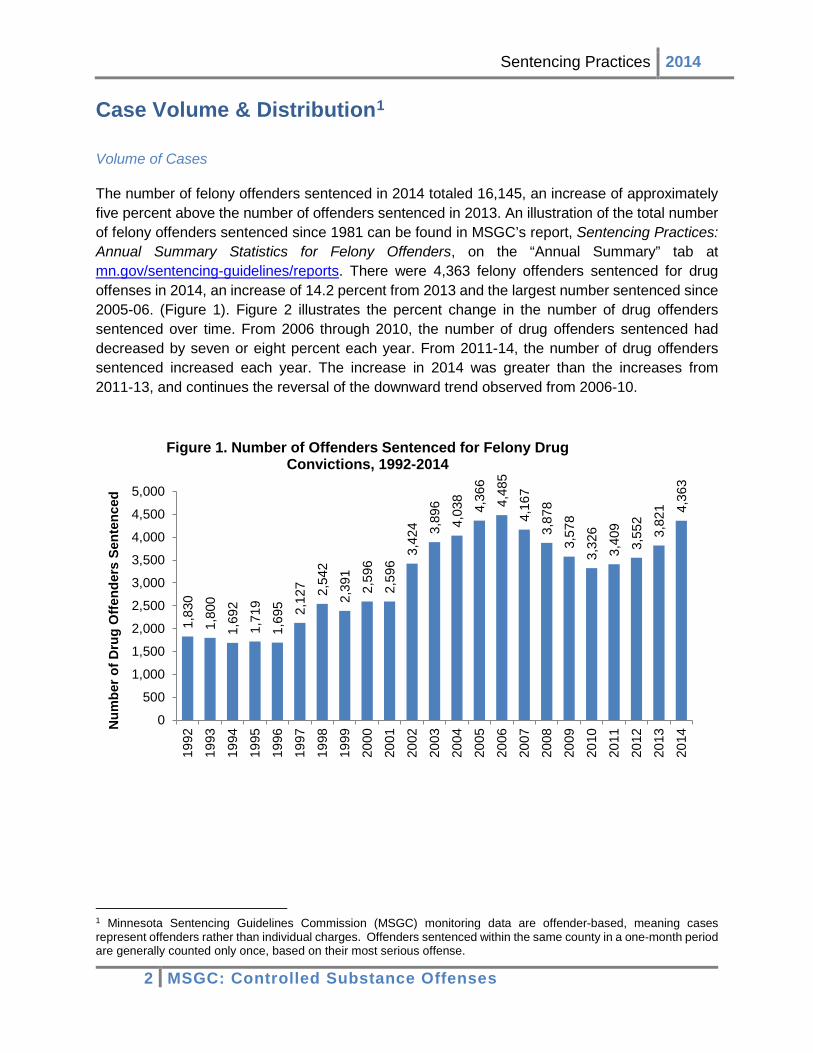
Volume of Cases The number of felony offenders sentenced in 2014 totaled 16,145, an increase of approximately five percent above the number of offenders sentenced in 2013. An illustration of the total number of felony offenders sentenced since 1981 can be found in MSGC’s report, Sentencing Practices: Annual Summary Statistics for Felony Offenders, on the “Annual Summary” tab at mn.gov/sentencing-guidelines/reports. There were 4,363 felony offenders sentenced for drug offenses in 2014, an increase of 14.2 percent from 2013 and the largest number sentenced since 2005-06. (Figure 1). Figure 2 illustrates the percent change in the number of drug offenders sentenced over time. From 2006 through 2010, the number of drug offenders sentenced had decreased by seven or eight percent each year. From 2011-14, the number of drug offenders sentenced increased each year. The increase in 2014 was greater than the increases from 2011-13, and continues the reversal of the downward trend observed from 2006-10.
1 Minnesota Sentencing Guidelines Commission (MSGC) monitoring data are offender-based, meaning cases represent offenders rather than individual charges. Offenders sentenced within the same county in a one-month period are generally counted only once, based on their most serious offense.
1,83
0
1,80
0
1,69
2
1,71
9
1,69
5 2,12
7 2,54
2
2,39
1
2,59
6
2,59
6
3,42
4 3,89
6
4,03
8
4,36
6
4,48
5
4,16
7
3,87
8
3,57
8
3,32
6
3,40
9
3,55
2
3,82
1 4,36
3
0
500
1,000
1,500
2,000
2,500
3,000
3,500
4,000
4,500
5,000
1992
1993
1994
1995
1996
1997
1998
1999
2000
2001
2002
2003
2004
2005
2006
2007
2008
2009
2010
2011
2012
2013
2014
Num
ber o
f Dru
g O
ffend
ers
Sent
ence
d
Figure 1. Number of Offenders Sentenced for Felony Drug Convictions, 1992-2014
2 MSGC: Controlled Substance Offenses

Sentencing Practices 2014
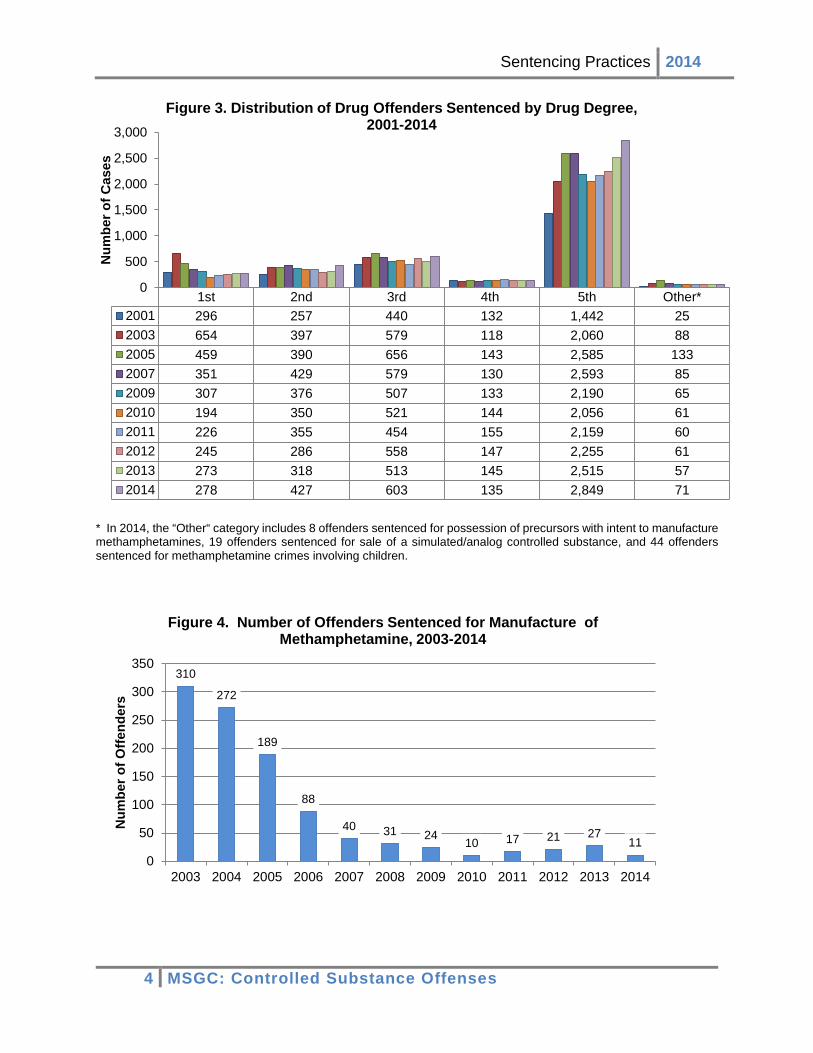
Volume of Cases by Degree Figure 3 shows the distribution of drug offenders across the controlled substance degrees. The largest group of cases sentenced was fifth-degree (65% of the cases). The largest increase was in the number of offenders sentenced for second-degree (34% increase). The number sentenced for third- and fifth-degree increased by 18 percent and 13 percent, respectively. The number sentenced for first-degree increased slightly (almost 2%), while the number sentenced for fourth-degree offenses decreased by 10 offenders (7%). The number of first-degree offenders sentenced declined nearly every year between 2003 and 2010, due in part to the decline in the number of offenders sentenced for the first-degree offense of manufacture of methamphetamine (10 offenders in 2010, compared to 310 in 2003) (Figure 4).2 However, in 2011, the number of offenders sentenced for first-degree began to increase again (from 226 offenders in 2011 for an increase of 16%; 245 offenders in 2012 for an increase of 8%; 273 offenders in 2013 for an increase of 11%). The increase in 2014 was more modest (278 offenders for an increase of 2%). The number of offenders sentenced for manufacture of methamphetamine decreased from 27 in 2013 to 11 in 2014 (Figure 4).
2 In 2005, the offense of manufacture of methamphetamine; possession of precursors (Minn. Stat. § 152.021, subd. 2a(b)) was reclassified, and is no longer a first-degree offense. This statutory change contributed to the decline in the total number of first-degree offenders. These “precursor offenses” are now reported in the “Other” category.
-1.6%
-6.0%
1.6%-1.4%
25.5%
19.5%
-5.9%
8.6%
0.0%
31.9%
13.8%
3.5%
8.1%
2.7%
-7.1%-6.9% -6.9%-7.0%
2.5%4.2%
7.6%
14.2%
-10%
-5%
0%
5%
10%
15%
20%
25%
30%
35%
1993
1994
1995
1996
1997
1998
1999
2000
2001
2002
2003
2004
2005
2006
2007
2008
2009
2010
2011
2012
2013
2014
Perc
ent C
hang
eFigure 2. Percent Change in Number of Offenders Sentenced for Felony
Drug Convictions, 1993-2014
3 MSGC: Controlled Substance Offenses
Sentencing Practices 2014
* In 2014, the “Other“ category includes 8 offenders sentenced for possession of precursors with intent to manufacture methamphetamines, 19 offenders sentenced for sale of a simulated/analog controlled substance, and 44 offenders sentenced for methamphetamine crimes involving children.
1st 2nd 3rd 4th 5th Other*2001 296 257 440 132 1,442 252003 654 397 579 118 2,060 882005 459 390 656 143 2,585 1332007 351 429 579 130 2,593 852009 307 376 507 133 2,190 652010 194 350 521 144 2,056 612011 226 355 454 155 2,159 602012 245 286 558 147 2,255 612013 273 318 513 145 2,515 572014 278 427 603 135 2,849 71
0
500
1,000
1,500
2,000
2,500
3,000
Num
ber o
f Cas
esFigure 3. Distribution of Drug Offenders Sentenced by Drug Degree,
2001-2014
310
272
189
88
40 31 24 10 17 21 2711
0
50
100
150
200
250
300
350
2003 2004 2005 2006 2007 2008 2009 2010 2011 2012 2013 2014
Num
ber o
f Offe
nder
s
Figure 4. Number of Offenders Sentenced for Manufacture of Methamphetamine, 2003-2014
4 MSGC: Controlled Substance Offenses

Sentencing Practices 2014 Drug Type, Region, Race & Prior Drug Convictions Distribution of Cases over Time (Drug Types) The distribution of cases among drug types, as coded on criminal complaints, has changed over time. In 1996, 48 percent of the cases sentenced involved cocaine, 24 percent involved marijuana, 14 percent were unknown or of some other type, and 14 percent involved amphetamines, a category that includes methamphetamine (meth). In 2002, cocaine still represented the largest number of drug cases (40%), but the amphetamines/meth category had grown to 38 percent, and marijuana had decreased to 13 percent. By 2004, over half (51%) of the drug cases sentenced involved the meth category. Between 2013 and 2014 there was a 23 percent increase in the number of offenders sentenced for meth offenses and a 7 percent increase in the number of offenders sentenced for cocaine offenses. The number sentenced for marijuana offenses declined by seven percent (Figure 5). Between 2013 and 2014, the number of cases coded as involving heroin increased by 42 percent while the number of offenses coded as involving opium decreased by 8 percent (from 126 to 116). Between 2008 and 2013, heroin and opium also showed the largest percentage increases (500% for heroin and 176% for opium). In that same period, the number of offenders sentenced for synthetic narcotics increased by 13 percent (Figure 5).
0
500
1,000
1,500
2,000
2002 2004 2006 2008 2010 2012 20142002 2004 2006 2008 2009 2010 2011 2012 2013 2014
Cocaine 1,353 1,243 1,471 1,256 1,112 855 770 681 549 588Meth 1,316 2,044 2,076 1,530 1,328 1,255 1,365 1,621 1,932 2,383Heroin 48 63 51 50 78 74 99 157 212 300Opium 24 26 46 42 48 75 83 93 126 116Synthetic narc. 116 108 138 213 223 262 235 233 240 241Marijuana 428 338 424 532 540 497 605 517 497 462Other/unknown 139 216 279 255 249 308 252 250 265 273
Figure 5: Distribution of Offenders by Drug Type Over Time, Sentenced 2002, 2004, 2006, 2008, 2010-2014
5 MSGC: Controlled Substance Offenses
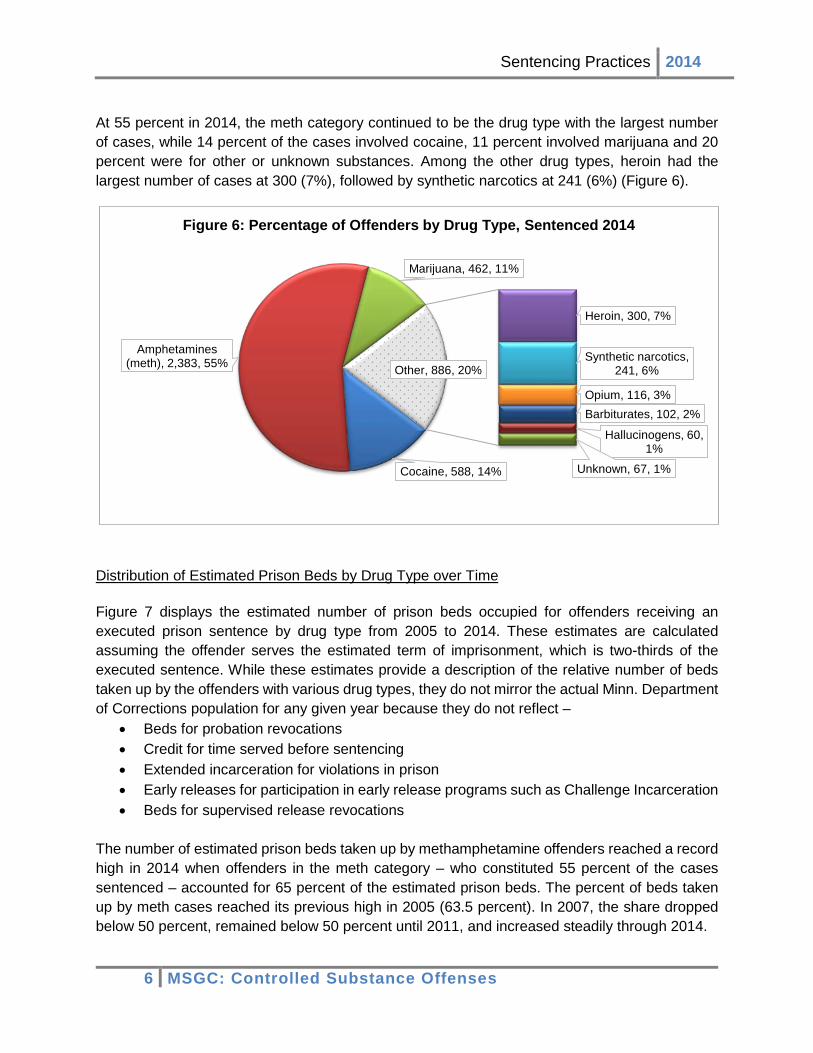
Sentencing Practices 2014 At 55 percent in 2014, the meth category continued to be the drug type with the largest number of cases, while 14 percent of the cases involved cocaine, 11 percent involved marijuana and 20 percent were for other or unknown substances. Among the other drug types, heroin had the largest number of cases at 300 (7%), followed by synthetic narcotics at 241 (6%) (Figure 6).
Distribution of Estimated Prison Beds by Drug Type over Time Figure 7 displays the estimated number of prison beds occupied for offenders receiving an executed prison sentence by drug type from 2005 to 2014. These estimates are calculated assuming the offender serves the estimated term of imprisonment, which is two-thirds of the executed sentence. While these estimates provide a description of the relative number of beds taken up by the offenders with various drug types, they do not mirror the actual Minn. Department of Corrections population for any given year because they do not reflect –
• Beds for probation revocations • Credit for time served before sentencing • Extended incarceration for violations in prison • Early releases for participation in early release programs such as Challenge Incarceration • Beds for supervised release revocations
The number of estimated prison beds taken up by methamphetamine offenders reached a record high in 2014 when offenders in the meth category – who constituted 55 percent of the cases sentenced – accounted for 65 percent of the estimated prison beds. The percent of beds taken up by meth cases reached its previous high in 2005 (63.5 percent). In 2007, the share dropped below 50 percent, remained below 50 percent until 2011, and increased steadily through 2014.
Cocaine, 588, 14%
Amphetamines (meth), 2,383, 55%
Marijuana, 462, 11%
Heroin, 300, 7%
Synthetic narcotics, 241, 6%
Opium, 116, 3%Barbiturates, 102, 2%
Hallucinogens, 60, 1%
Unknown, 67, 1%
Other, 886, 20%
Figure 6: Percentage of Offenders by Drug Type, Sentenced 2014
6 MSGC: Controlled Substance Offenses

Sentencing Practices 2014
Figure 7. Estimated Prison Beds for Felony Controlled Substance Crimes, by Drug Type, Sentenced 2005-14
Distribution of Cases over Time (Region) In recent years, the number of drug cases outside the seven county metro area of Anoka, Dakota, Carver, Hennepin, Ramsey, Scott, and Washington counties has increased more than the number of drug cases sentenced in the metro counties. In 1998, 33 percent of all drug cases were sentenced in Greater Minnesota (Figure 8). By 2004, that percentage had grown to 51 percent, and it has remained above 50 percent in almost every year since. In 2014, 58 percent of drug offenders were sentenced in Greater Minnesota, a decrease from the record high of 60 percent in 2013. In comparison, the percent of non-drug offenders sentenced in Greater Minnesota was 47 percent. In all other regions, the percent of drug offenders is lower than the percent of non-drug offenders (Figure 9).
2005 2006 2007 2008 2009 2010 2011 2012 2013 2014Other/Unknown 39 72 67 102 102 98 101 97 100 87Synthetic Narcotic 19 31 30 34 38 53 39 40 49 69Heroin 11 11 17 25 47 38 61 110 195 184Marijuana 60 39 39 48 58 40 57 58 64 61Cocaine 782 755 1,043 1,034 868 811 725 727 634 539Amphetamines 1,587 1,208 1,170 1,088 976 913 987 1,162 1,416 1,735
0
500
1,000
1,500
2,000
2,500
7 MSGC: Controlled Substance Offenses

Sentencing Practices 2014
18% 20%
9%14%
15% 19%
58%
47%
0%
10%
20%
30%
40%
50%
60%
70%
Drug Offenders Non-Drug Offenders
Figure 9. Distribution of Offenders by Region;2014 Drug Offenders vs. 2014 Non-Drug Offenders
Hennepin Ramsey Other Metro Greater MN
98 99 00 01 02 03 04 05 06 07 08 09 10 11 12 13 14Hennepin 27% 26% 28% 24% 23% 20% 19% 17% 22% 20% 21% 19% 17% 16% 17% 16% 18%Ramsey 27% 24% 21% 20% 17% 14% 13% 13% 10% 11% 14% 15% 11% 12% 9% 8% 9%Other Metro 12% 17% 15% 16% 16% 17% 18% 19% 19% 17% 17% 17% 18% 17% 16% 16% 15%Greater MN 33% 33% 37% 40% 45% 50% 51% 51% 49% 51% 50% 50% 54% 55% 58% 60% 58%
0%
10%
20%
30%
40%
50%
60%
70%Pe
rcen
tFigure 8. Distribution of Drug Cases by Region, 1998-2014
8 MSGC: Controlled Substance Offenses
Sentencing Practices 2014 2014 Distribution of Cases (Drug Types and Region)
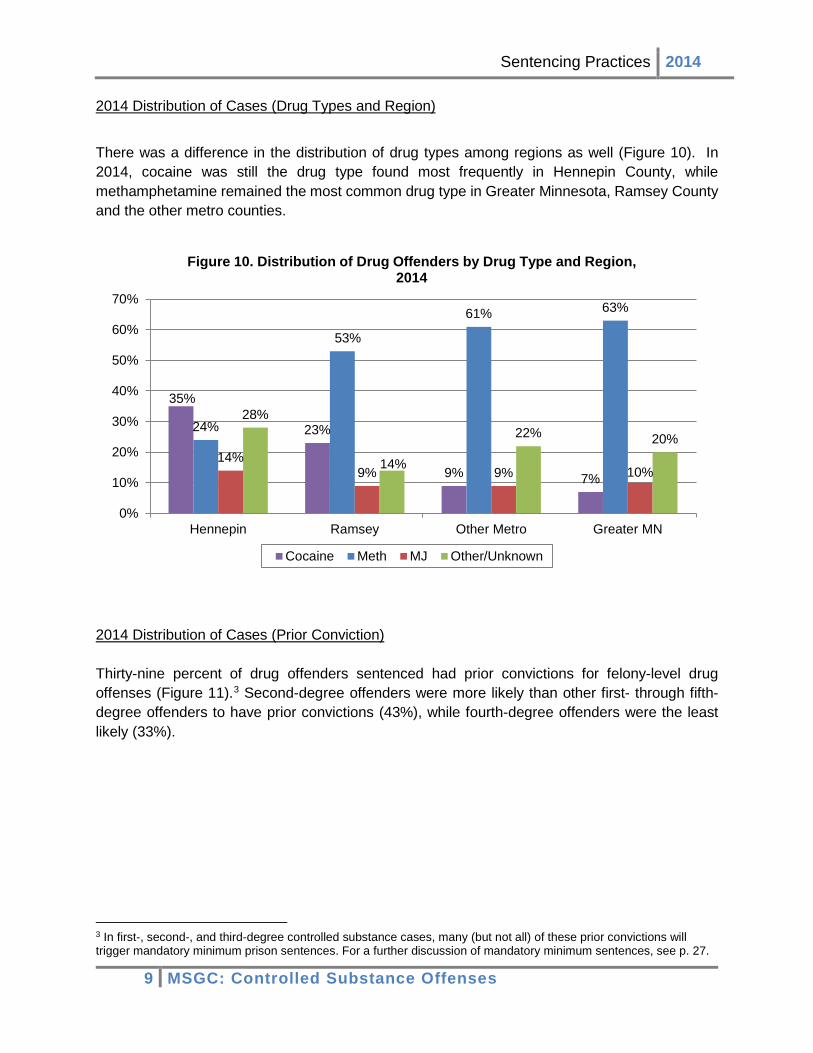
There was a difference in the distribution of drug types among regions as well (Figure 10). In 2014, cocaine was still the drug type found most frequently in Hennepin County, while methamphetamine remained the most common drug type in Greater Minnesota, Ramsey County and the other metro counties.
2014 Distribution of Cases (Prior Conviction) Thirty-nine percent of drug offenders sentenced had prior convictions for felony-level drug offenses (Figure 11).3 Second-degree offenders were more likely than other first- through fifth-degree offenders to have prior convictions (43%), while fourth-degree offenders were the least likely (33%).
3 In first-, second-, and third-degree controlled substance cases, many (but not all) of these prior convictions will trigger mandatory minimum prison sentences. For a further discussion of mandatory minimum sentences, see p. 27.
35%
23%
9% 7%
24%
53%
61% 63%
14%9% 9% 10%
28%
14%
22% 20%
0%
10%
20%
30%
40%
50%
60%
70%
Hennepin Ramsey Other Metro Greater MN
Figure 10. Distribution of Drug Offenders by Drug Type and Region, 2014
Cocaine Meth MJ Other/Unknown
9 MSGC: Controlled Substance Offenses

Sentencing Practices 2014
Racial Distribution Figure 12 displays the racial distribution of drug offenders by region. Black offenders make up the largest portion of drug offenders sentenced in Hennepin and Ramsey counties. These counties include the Metropolitan areas of Minneapolis and St. Paul.
In 1999, 51 percent of drug offenders were white and 36 percent were black, whereas in 2014, 66 percent of drug offenders were white and 19 percent were black. A larger percentage of drug offenders were white than of offenders sentenced for non-drug offenses (Figure 13). Sentencing data reveal that methamphetamine is a drug predominantly associated with white offenders and
39% 41% 43%
34% 33%
40%
0%5%
10%15%20%25%30%35%40%45%50%
Overall 1stDegree
2ndDegree
3rdDegree
4thDegree
5thDegree
Figure 11. Percent of Offenders with a Prior Felony Drug Sentence by Controlled Substance Degree, 2014
38%46%
78% 74%
53% 34%
10%9%
2%
2%4% 11%
4%
9%5% 5%
3%9% 4% 2%
0%
10%
20%
30%
40%
50%
60%
70%
80%
90%
100%
Hennepin Ramsey Other Metro Greater MN
Figure 12. Distribution of Offenders by Race and Region, 2014
Asian
Hispanic
American Indian
Black
White
10 MSGC: Controlled Substance Offenses
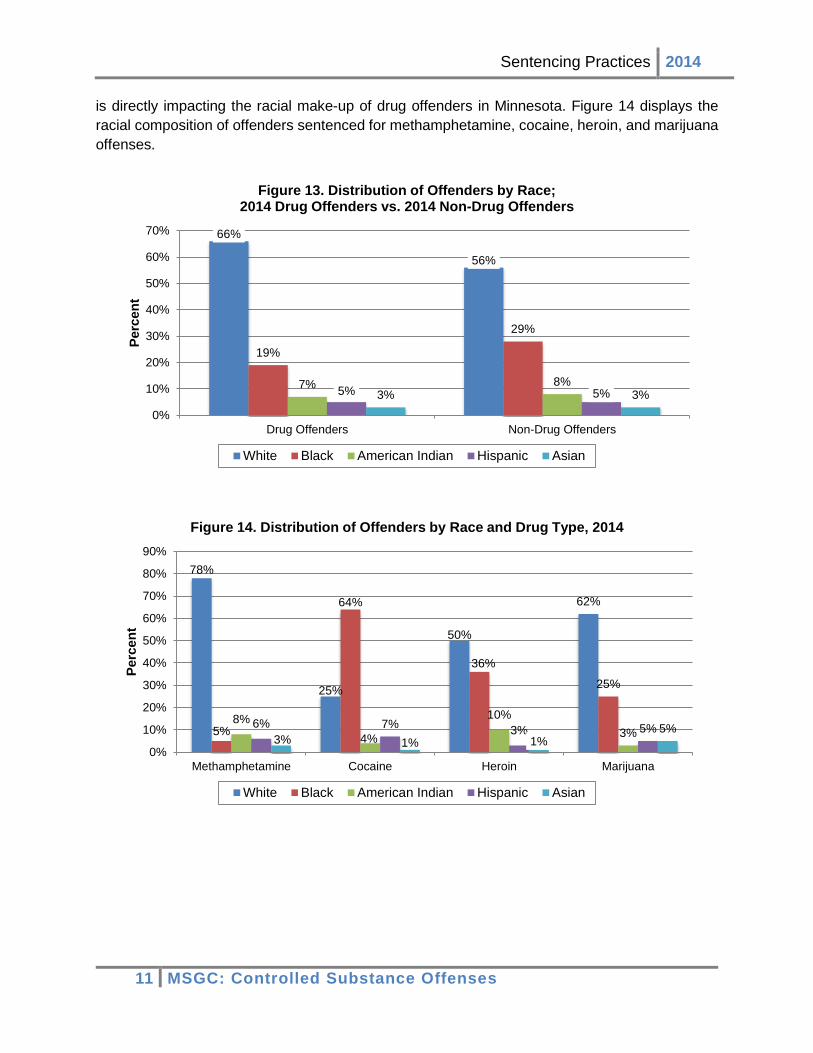
Sentencing Practices 2014 is directly impacting the racial make-up of drug offenders in Minnesota. Figure 14 displays the racial composition of offenders sentenced for methamphetamine, cocaine, heroin, and marijuana offenses.
66%
56%
19%
29%
7% 8%5% 5%3% 3%
0%
10%
20%
30%
40%
50%
60%
70%
Drug Offenders Non-Drug Offenders
Perc
ent
Figure 13. Distribution of Offenders by Race; 2014 Drug Offenders vs. 2014 Non-Drug Offenders
White Black American Indian Hispanic Asian
78%
25%
50%
62%
5%
64%
36%
25%
8%4%
10%3%
6% 7% 3% 5%3% 1% 1%
5%
0%
10%
20%
30%
40%
50%
60%
70%
80%
90%
Methamphetamine Cocaine Heroin Marijuana
Perc
ent
Figure 14. Distribution of Offenders by Race and Drug Type, 2014
White Black American Indian Hispanic Asian
11 MSGC: Controlled Substance Offenses

Sentencing Practices 2014
Sentencing Practices In 2014, 93 percent of felony drug sentences included incarceration: 25 percent in state prison and 68 percent in local correctional facilities (Table 1). The remaining seven percent were not incarcerated; however, they may have received sanctions such as drug treatment or home confinement.
Table 1. Total Incarceration, 2014
Incarceration Type Number Percent State Prison 1,107 25 Local Correctional Facilities
2,948 68
Total Incarceration 4,055 93
Incarceration in State Prison Since the controlled substance statutes were revised in 1989, the number of drug offenders sentenced has increased dramatically, as have imprisonment rates and average pronounced sentences. While the number of offenders sentenced for non-drug crimes has also increased during this same time period, the increase has not been as dramatic, and the imprisonment rates and average pronounced sentences in those cases have remained relatively stable (Table 2). Incarceration of felony drug offenders has increased significantly over the past 23 years, at a higher rate than for any other offense category. The reason for this increase may be two-fold: a larger total number of drug offenders are being sentenced and a higher percentage of them are receiving prison sentences.4 The imprisonment rate for drug offenders was highest in 2003, at 28 percent, and has generally remained between 24 percent and 27 percent since (Table 2). Despite the lower imprisonment rate trend in recent years, it is still true that more drug offenders are being sentenced to prison for longer periods of time than twenty years ago, which directly impacts the amount of correctional resources required to accommodate this offender population. In 1991, 217 drug offenders were imprisoned (13% imprisonment rate), with an average pronounced sentence of 35 months. By 2003, this number climbed to 1,107 offenders (28% imprisonment rate). The average drug sentence duration peaked at 52 months in 2003, falling into the 42-46 month range thereafter. In 2014, a record 1,110 drug offenders were imprisoned (25% imprisonment rate), with an average sentence duration of 43 months.
4 It is difficult to measure the extent to which the incarceration increases may have been driven by changes in offender behavior; in enforcement, prosecutorial, or judicial practice; or in policy. With that in mind, the following policy changes are notable: Minn. Sentencing Guidelines (1989) (at the same time legislature created five degrees of drug offense, durations increased for the severity levels to which some of those degrees would be assigned); 1992 Minn. Laws ch. 359 (sale redefined to include possession with intent to sell; cocaine thresholds reduced); 1997 Minn. Laws ch. 239, art. 4 (heroin thresholds reduced); 1998 Minn. Laws ch. 367, art. 4 (methamphetamine thresholds reduced).
12 MSGC: Controlled Substance Offenses

Sentencing Practices 2014 Table 2. Imprisonment Cases; Prison Rates and Average Pronounced Durations for Drug
and Non-Drug Offenders, 1991-2014
Year Sentenced
Drug Offenders Non-Drug Offenders
Total # Cases
Prison Rate Avg. Duration
Total # Cases
Prison Rate Avg. Duration
1991 1,693 13% 35 months 7,468 21% 46 months
1992 1,830 14% 38 months 7,495 22% 49 months
1993 1,800 19% 42 months 7,837 22% 47 months
1994 1,692 17% 44 months 8,095 22% 51 months
1995 1,719 19% 41 months 7,702 24% 46 months
1996 1,695 17% 42 months 7,785 24% 47 months
1997 2,127 16% 42 months 7,720 24% 44 months
1998 2,542 22% 40 months 8,345 24% 47 months
1999 2,391 22% 42 months 8,243 23% 48 months
2000 2,596 24% 47 months 7,799 23% 49 months
2001 2,596 24% 47 months 8,200 22% 48 months
2002 3,424 27% 50 months 9,554 22% 46 months
2003 3,896 28% 52 months 10,596 23% 50 months
2004 4,038 25% 46 months 10,713 23% 45 months
2005 4,366 23% 44 months 11,096 23% 46 months
2006 4,485 20% 42 months 11,961 22% 45 months
2007 4,167 24% 42 months 12,001 23% 46 months
2008 3,878 25% 43 months 11,516 25% 46 months
2009 3,578 25% 42 months 11,262 25% 43 months
2010 3,326 25% 43 months 10,985 26% 47 months
2011 3,409 24% 43 months 11,162 25% 46 months
2012 3,552 25% 44 months 11,655 27% 48 months
2013 3,821 27% 43 months 11,497 27.5% 46 months
2014 4,363 25% 43 months 11,782 26% 46 months
13 MSGC: Controlled Substance Offenses

Sentencing Practices 2014 Probation Cases
The rise in the number of drug cases has resulted in an increase in the number of drug offenders sentenced to probation, as well as an increase in the number of drug offenders serving time in local correctional facilities (i.e., jails and workhouses) as a condition of probation. In 2014, 3,253 offenders received probation sentences for drug offenses, a 120 percent increase over the number receiving probation sentences in 1991 (Table 3). In comparison, the number of non-drug offenders serving probation sentences increased by about 47 percent during this same time period. The increase in the number of drug offenders placed on probation expands the size of the pool of offenders who may eventually end up in prison through probation revocations, which impacts prison populations.
Offenders placed on probation for a felony offense can receive up to one year of time in a local correctional facility as a condition of probation. The vast majority of offenders placed on felony probation some local time. Since 1991, more than 80 percent of felony probationers have had local time imposed as a condition of probation, and drug offenders have had local time imposed at a slightly higher rate than non-drug offenders. Since 2012 the local incarceration rate has been 91 percent. Non-drug offenders have had slightly lower rates. For both groups, the average time pronounced in a local facility in most years has been more than 100 days. In 2014, the average pronounced local time for drug offenders was 121 days (Table 3).
14 MSGC: Controlled Substance Offenses

Sentencing Practices 2014 Table 3. Non-Imprisonment Cases; Rates and Avg. Pronounced Conditional Confinement
for Drug and Non-Drug Offenders, 1991-2014
Year Sentenced
Drug Offenders Non-Drug Offenders
# Stayed Cases
Local Rate
Avg. Pronounced
Duration # Stayed
Cases Local Rate
Avg. Pronounced
Duration
1991 1,476 86% 90 days 5,908 80% 110 days
1992 1,575 87% 101 days 5,825 83% 111 days
1993 1,459 86% 116 days 6,114 81% 112 days
1994 1,412 87% 98 days 6,332 80% 117 days
1995 1,398 87% 101 days 5,887 82% 110 days
1996 1,404 83% 104 days 5,887 81% 108 days
1997 1,781 87% 105 days 5,877 82% 107 days
1998 1,192 88% 99 days 6,334 83% 110 days
1999 1,872 88% 99 days 6,311 84% 104 days
2000 1,982 90% 101 days 5,985 85% 106 days
2001 1,973 91% 108 days 6,374 84% 104 days
2002 2,486 90% 114 days 7,435 86% 103 days
2003 2,789 91% 115 days 8,167 86% 109 days
2004 3,015 91% 117 days 8,290 88% 110 days
2005 3,353 91% 118 days 8,526 89% 99 days
2006 3,573 91% 118 days 9,278 89% 96 days
2007 3,165 90% 118 days 9,243 88% 106 days
2008 2,914 88% 117 days 8,628 87% 106 days
2009 2,696 90% 113 days 8,421 87% 105 days
2010 2,503 82% 120 days 8,168 80% 107 days
2011 2,591 89% 120 days 8,327 87% 104 days
2012 2,650 91% 122 days 8,553 87% 104 days
2013 2,795 91% 121 days 8,330 89% 101 days
2014 3,253 91% 121 days 8,674 89% 102 days
15 MSGC: Controlled Substance Offenses
Sentencing Practices 2014
Departure Rates Role and Definition of Departures in the Sentencing Guidelines System The Guidelines establish a presumptive sentence for felony offenses based on the severity of the offense and the offender’s criminal history score. The presumptive sentence is based on the typical case; however, the court may depart from the Guidelines when substantial and compelling circumstances exist. A “departure” is a pronounced sentence other than that recommended in the appropriate cell of the applicable Grid. There are two types of departures – dispositional and durational – as further explained below. Since the presumptive sentence is based on “the typical case,” the appropriate use of departures by the courts when substantial and compelling circumstances exist can actually enhance proportionality by varying the sanction in an atypical case. While the court ultimately makes the sentencing decision, other criminal justice professionals and victims participate in the decision-making process. Probation officers make recommendations to the courts regarding whether a departure from the presumptive sentence is appropriate, and prosecutors and defense attorneys arrive at agreements regarding acceptable sentences for which an appeal will not be pursued. Victims are provided an opportunity to comment regarding the appropriate sentence as well. Therefore, these departure statistics should be reviewed with an understanding that, when the court pronounces a particular sentence, there is commonly agreement or acceptance among the other actors that the sentence is appropriate. Only a small percent of cases (1% to 2%) result in an appeal of the sentence pronounced by the court. Description of Departure Types Dispositional Departure. A “dispositional departure” occurs when the court orders a disposition other than that recommended in the Guidelines. There are two types of dispositional departures: mitigated and aggravated. A mitigated dispositional departure occurs when the Guidelines recommend a prison sentence but the court pronounces a stayed sentence. An aggravated dispositional departure occurs when the Guidelines recommend a stayed sentence but the court pronounces a prison sentence. Durational Departure. A “durational departure” occurs when the court orders a sentence with a duration other than the presumptive fixed duration or range in the appropriate cell on the applicable Grid. There are two types of durational departures: aggravated durational departures and mitigated durational departures. An aggravated durational departure occurs when the court pronounces a duration that is more than 20 percent higher than the fixed duration displayed in the appropriate cell on the applicable Grid. A mitigated durational departure occurs when the court pronounces a sentence that is more than 15 percent lower than the fixed duration displayed in the appropriate cell on the applicable Grid.
16 MSGC: Controlled Substance Offenses

Sentencing Practices 2014 Departure Rates for Drug Offenders and Non-Drug Offenders Total Departure Rate: Drug Offenders vs. Non-Drug Offenders The total departure rate refers to the percentage of felony offenders who did not receive the presumptive Guidelines sentence. In 2014, the total departure rate for drug offenders was 26 percent compared to 29 percent for non-drug offenders. The overall mitigated departure rate was 18 percent for drug offenders and 25 percent for non-drug offenders (Table 4).
Table 4. Total Departure Rates; Drug and Non-Drug Offenders, 2014
Departure Type Drug Offenders Non-Drug Offenders No Departures 3,242 (74%) 8,352 (71%) Total Departures 1,121 (26%) 3,430 (29%)
• Mitigated 779 (18%) 2,950 (25%)
• Aggravated 286 (7%) 375 (3%)
• Mixed 56 (1%) 105 (1%) Total Sentenced 4,363 (100%) 11,782 (100%)
Aggravated Dispositional Departures: Drug Offenders vs. Non-Drug Offenders Aggravated dispositional departures occur relatively infrequently compared to other types of departures. Ten percent of drug offenders received aggravated dispositional departures (sentenced to prison when the Guidelines recommended a stayed sentence) (Table 5). Most aggravated dispositional departures occur when an offender requests an executed prison sentence or agrees to the departure as part of a plea agreement. Offender requests accounted for 82 percent of the aggravated dispositional departures in drug cases, excluding cases in which the departure reason was “unknown.” This request is usually made to allow the offender to serve the sentence concurrently (at the same time) with another prison sentence (Table 5). The aggravated dispositional departure rate for drug offenders was higher than for non-drug offenders.
Table 5. Aggravated Dispositional Departure Rates; 2014 Drug Offenders and Non-Drug Offenders
Drug Offenders
Non-Drug Offenders
Number Presumptive Stays 3,110 7,180
Aggravated Dispositions 302 (10%)
303 (4%)
Cases with Departure Reasons 297 294
Request for Prison 244 (82%)
268 (91%)
17 MSGC: Controlled Substance Offenses

Sentencing Practices 2014 Mitigated Dispositional Departures: Drug Offenders vs. Non-Drug Offenders Figure 15 shows that 36 percent of drug offenders who were recommended prison under the Guidelines instead received a non-prison (probationary) sentence. This compared to 35 percent for non-drug offenders. Departure rates vary greatly by general offense type and specific offense. (See Sentencing Practices: Annual Summary Statistics for Felony Offenders, on the “Annual Summary” tab for more information on departure rates by offense type at mn.gov/sentencing-guidelines/reports.)
Dispositional Departures: Frequently Cited Reasons for Departure Amenability to treatment and probation were the most frequently-cited departure reasons for the mitigated dispositions in drug cases. In a large percentage of these cases, the court noted either that there was a plea agreement for the departure or that the prosecutor recommended or did not object to the departure. Plea agreements or prosecutor recommendations occurred in 59 percent of drug cases, compared to 61 percent in non-drug cases. Information provided by the court revealed that the prosecutor was more likely to object to the mitigated disposition in drug offenses than in non-drug offenses (16% and 13%, respectively).5
36% 35%
0%
5%
10%
15%
20%
25%
30%
35%
Drug Non-Drug
Perc
ent
Figure 15. Mitigated Dispositional Departure Rates; 2014 Drug Cases vs. 2014 Non-Drug Cases
(Presumptive Prison Cases Only)
18 MSGC: Controlled Substance Offenses
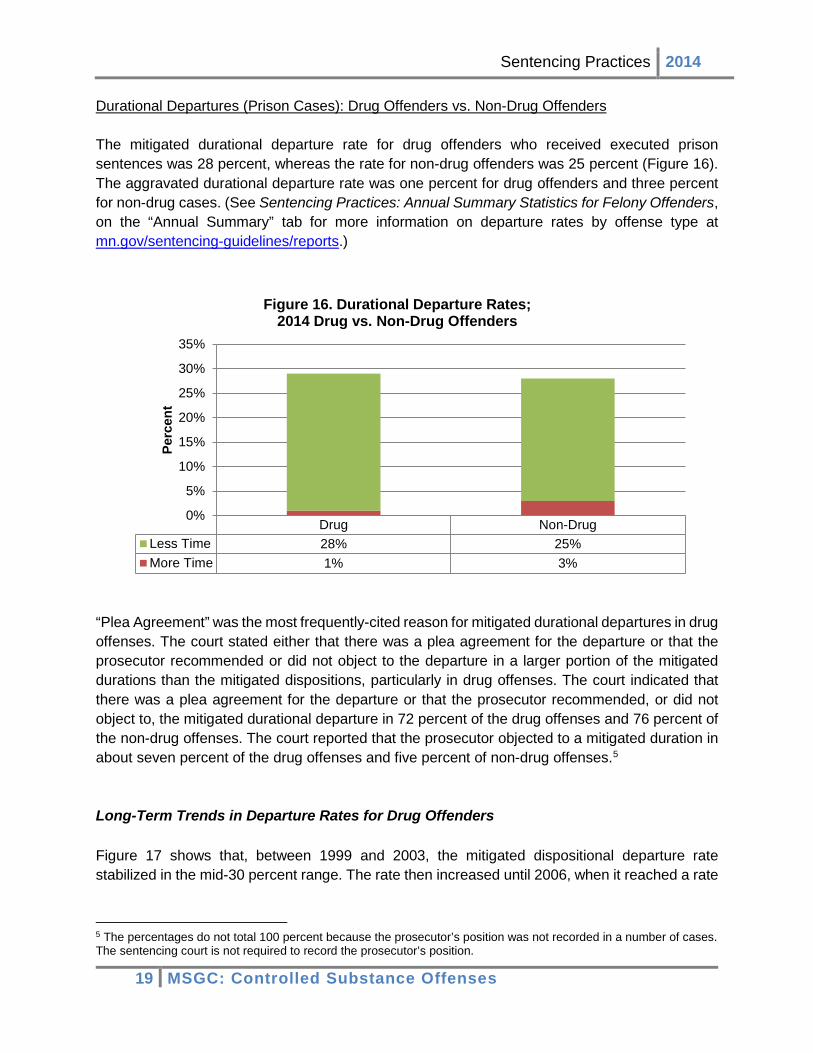
Sentencing Practices 2014 Durational Departures (Prison Cases): Drug Offenders vs. Non-Drug Offenders The mitigated durational departure rate for drug offenders who received executed prison sentences was 28 percent, whereas the rate for non-drug offenders was 25 percent (Figure 16). The aggravated durational departure rate was one percent for drug offenders and three percent for non-drug cases. (See Sentencing Practices: Annual Summary Statistics for Felony Offenders, on the “Annual Summary” tab for more information on departure rates by offense type at mn.gov/sentencing-guidelines/reports.)
“Plea Agreement” was the most frequently-cited reason for mitigated durational departures in drug offenses. The court stated either that there was a plea agreement for the departure or that the prosecutor recommended or did not object to the departure in a larger portion of the mitigated durations than the mitigated dispositions, particularly in drug offenses. The court indicated that there was a plea agreement for the departure or that the prosecutor recommended, or did not object to, the mitigated durational departure in 72 percent of the drug offenses and 76 percent of the non-drug offenses. The court reported that the prosecutor objected to a mitigated duration in about seven percent of the drug offenses and five percent of non-drug offenses.5 Long-Term Trends in Departure Rates for Drug Offenders Figure 17 shows that, between 1999 and 2003, the mitigated dispositional departure rate stabilized in the mid-30 percent range. The rate then increased until 2006, when it reached a rate
5 The percentages do not total 100 percent because the prosecutor’s position was not recorded in a number of cases. The sentencing court is not required to record the prosecutor’s position.
Drug Non-DrugLess Time 28% 25%More Time 1% 3%
0%
5%
10%
15%
20%
25%
30%
35%
Perc
ent
Figure 16. Durational Departure Rates; 2014 Drug vs. Non-Drug Offenders
19 MSGC: Controlled Substance Offenses

Sentencing Practices 2014 of 46 percent, which was the highest since 1997. In 2007, this rate returned to under 40 percent and had dropped to 31 percent by 2013. In 2014, the rate was 36 percent.
Figure 18 shows that the mitigated durational departure rate continued to increase through the 1990s, and peaked in 2000 at 44 percent. Since 2000, however, this rate steadily declined to a low of 23 percent in 2010. In 2011 the rate climbed back to 28 percent and increased again in 2012 and 2013 to 31 percent. In 2014 it returned to 28 percent. Aggravated durational departure rates were consistently low, and in 2010 reached a new low of 0.4 percent. In 2013 and 2014 the aggravated durational departure rate was one percent.
47%
55%
41%38%
35%37% 37%
36%
41% 42%46%
38% 39%37%
35% 36%32% 31%
36%
20%
30%
40%
50%
60%
70%
96 97 98 99 00 01 02 03 04 05 06 07 08 09 10 11 12 13 14
Figure 17. Mitigated Dispositional Departure Rates, 1996-2014(Presumptive Commitments Only)
96 97 98 99 00 01 02 03 04 05 06 07 08 09 10 11 12 13 14More Time 5% 6% 4% 6% 5% 5% 5% 4% 3% 3% 2% 2% 1% 1% 0% 1% 2% 1% 1%Less Time 31% 36% 32% 40% 44% 43% 40% 36% 34% 35% 29% 24% 26% 25% 23% 28% 31% 31% 28%Overall 37% 42% 38% 46% 49% 48% 45% 40% 37% 38% 31% 26% 27% 26% 23% 29% 32% 32% 30%
0%
10%
20%
30%
40%
50%
60%
Perc
ent
Figure 18. Durational Departure Rates for Cases ReceivingPrison Sentences, 1996-2014
20 MSGC: Controlled Substance Offenses

Sentencing Practices 2014 Departure Rates for Drug Offenders by Region While departure rates fluctuate from year to year and vary by region, they are fairly high across the state (Figure 19). In 2014 the dispositional departure rates increased for all regions, most dramatically in Ramsey County. In the last seven years, the other metro counties6 had the highest rates and Ramsey County or Greater Minnesota had the lowest. In 2014, Ramsey County had the highest mitigated dispositional departure rate at 50 percent. Greater Minnesota continued to have the lowest rate. Before 2007, the departure rates in Hennepin County were above 50 percent in all but one year. In 2007, the mitigated dispositional departure rate in Hennepin County dropped to 39 percent, and dropped again in 2009 and 2010. In 2011, the rate rose to 40 percent, but was still lower than the rates seen in the years before 2007. In 2012, the Hennepin County rate fell to 33 percent and fell again in 2013 to 31 percent. In 2014, it rose to 34 percent.
Part of this large drop may be the result of significant changes that took effect in 2007, when, for example, Hennepin County revised its Drug Court criteria.7 The decrease in departures may also
6 “Other metro counties” are Anoka, Carver, Dakota, Scott and Washington counties. 7 Minnesota Judicial Branch, State Court Administrator’s Office, Minnesota Statewide Adult Drug Court Evaluation (June 2012). Retrieved from http://www.mncourts.gov/Documents/0/Public/Drug_Court/2012%20Statewide%20Evaluation/MN_Statewide_Drug_Court_Evaluation_Report_-_Final_Public.pdf on Nov. 24, 2015.
96 97 98 99 00 01 02 03 04 05 06 07 08 09 10 11 12 13 14Hennepin 65% 70% 55% 51% 52% 56% 51% 46% 55% 53% 61% 39% 41% 35% 32% 40% 33% 31% 34%Ramsey 36% 40% 29% 32% 26% 32% 41% 26% 29% 45% 39% 32% 31% 25% 36% 27% 32% 33% 50%Other Metro 40% 56% 57% 48% 40% 44% 46% 51% 55% 54% 55% 58% 55% 51% 48% 44% 34% 41% 46%Greater MN 25% 35% 24% 22% 22% 28% 27% 30% 34% 34% 37% 33% 35% 36% 32% 34% 31% 29% 31%
15%
20%
25%
30%
35%
40%
45%
50%
55%
60%
65%
70%
75%
Perc
ent
Figure 19. Mitigated Dispositional Departure Rates by RegionPresumptive Prison Cases, 1996-2014
21 MSGC: Controlled Substance Offenses
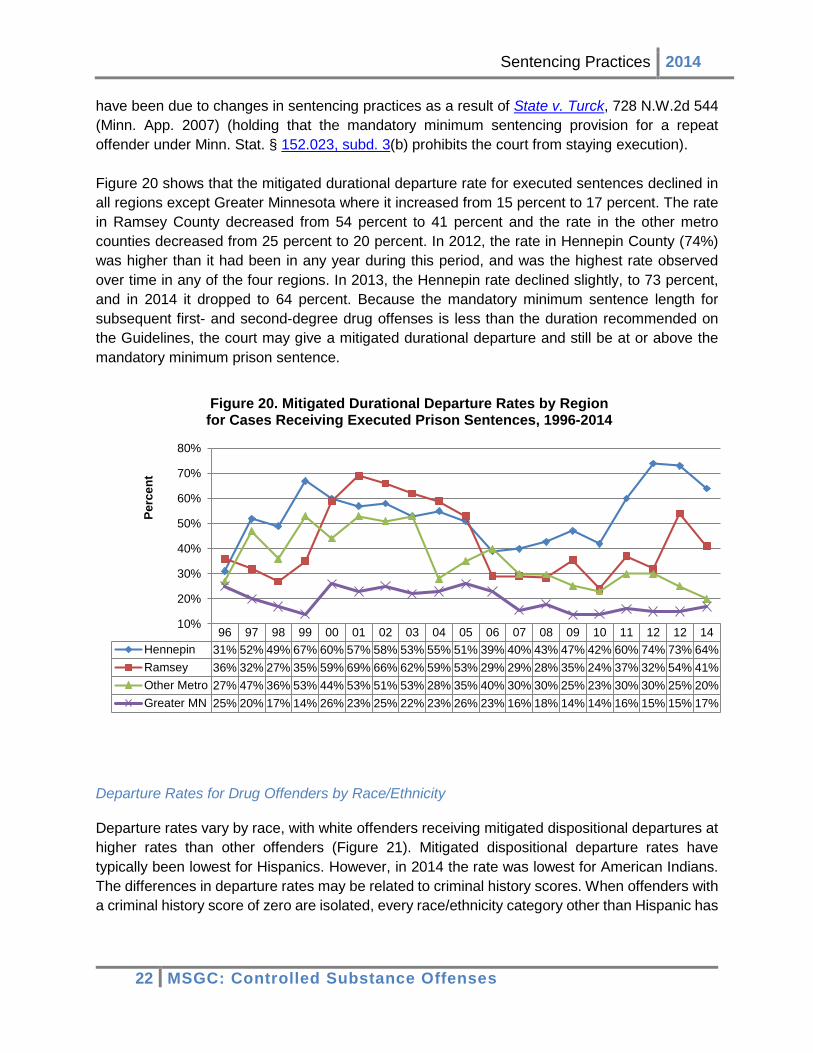
Sentencing Practices 2014 have been due to changes in sentencing practices as a result of State v. Turck, 728 N.W.2d 544 (Minn. App. 2007) (holding that the mandatory minimum sentencing provision for a repeat offender under Minn. Stat. § 152.023, subd. 3(b) prohibits the court from staying execution). Figure 20 shows that the mitigated durational departure rate for executed sentences declined in all regions except Greater Minnesota where it increased from 15 percent to 17 percent. The rate in Ramsey County decreased from 54 percent to 41 percent and the rate in the other metro counties decreased from 25 percent to 20 percent. In 2012, the rate in Hennepin County (74%) was higher than it had been in any year during this period, and was the highest rate observed over time in any of the four regions. In 2013, the Hennepin rate declined slightly, to 73 percent, and in 2014 it dropped to 64 percent. Because the mandatory minimum sentence length for subsequent first- and second-degree drug offenses is less than the duration recommended on the Guidelines, the court may give a mitigated durational departure and still be at or above the mandatory minimum prison sentence.
Departure Rates for Drug Offenders by Race/Ethnicity Departure rates vary by race, with white offenders receiving mitigated dispositional departures at higher rates than other offenders (Figure 21). Mitigated dispositional departure rates have typically been lowest for Hispanics. However, in 2014 the rate was lowest for American Indians. The differences in departure rates may be related to criminal history scores. When offenders with a criminal history score of zero are isolated, every race/ethnicity category other than Hispanic has
96 97 98 99 00 01 02 03 04 05 06 07 08 09 10 11 12 12 14Hennepin 31% 52% 49% 67% 60% 57% 58% 53% 55% 51% 39% 40% 43% 47% 42% 60% 74% 73% 64%Ramsey 36% 32% 27% 35% 59% 69% 66% 62% 59% 53% 29% 29% 28% 35% 24% 37% 32% 54% 41%Other Metro 27% 47% 36% 53% 44% 53% 51% 53% 28% 35% 40% 30% 30% 25% 23% 30% 30% 25% 20%Greater MN 25% 20% 17% 14% 26% 23% 25% 22% 23% 26% 23% 16% 18% 14% 14% 16% 15% 15% 17%
10%
20%
30%
40%
50%
60%
70%
80%
Perc
ent
Figure 20. Mitigated Durational Departure Rates by Regionfor Cases Receiving Executed Prison Sentences, 1996-2014
22 MSGC: Controlled Substance Offenses
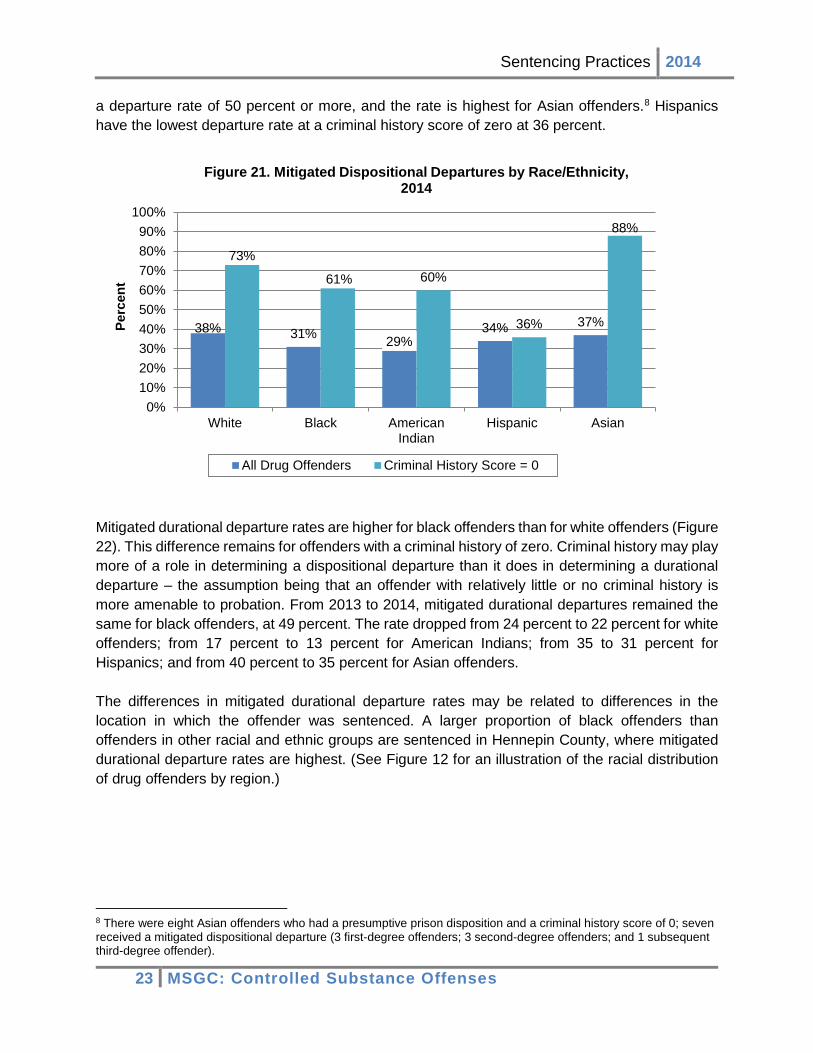
Sentencing Practices 2014 a departure rate of 50 percent or more, and the rate is highest for Asian offenders.8 Hispanics have the lowest departure rate at a criminal history score of zero at 36 percent.
Mitigated durational departure rates are higher for black offenders than for white offenders (Figure 22). This difference remains for offenders with a criminal history of zero. Criminal history may play more of a role in determining a dispositional departure than it does in determining a durational departure – the assumption being that an offender with relatively little or no criminal history is more amenable to probation. From 2013 to 2014, mitigated durational departures remained the same for black offenders, at 49 percent. The rate dropped from 24 percent to 22 percent for white offenders; from 17 percent to 13 percent for American Indians; from 35 to 31 percent for Hispanics; and from 40 percent to 35 percent for Asian offenders. The differences in mitigated durational departure rates may be related to differences in the location in which the offender was sentenced. A larger proportion of black offenders than offenders in other racial and ethnic groups are sentenced in Hennepin County, where mitigated durational departure rates are highest. (See Figure 12 for an illustration of the racial distribution of drug offenders by region.)
8 There were eight Asian offenders who had a presumptive prison disposition and a criminal history score of 0; seven received a mitigated dispositional departure (3 first-degree offenders; 3 second-degree offenders; and 1 subsequent third-degree offender).
38% 31% 29%34% 37%
73%
61% 60%
36%
88%
0%10%20%30%40%50%60%70%80%90%
100%
White Black AmericanIndian
Hispanic Asian
Perc
ent
Figure 21. Mitigated Dispositional Departures by Race/Ethnicity, 2014
All Drug Offenders Criminal History Score = 0
23 MSGC: Controlled Substance Offenses

Sentencing Practices 2014
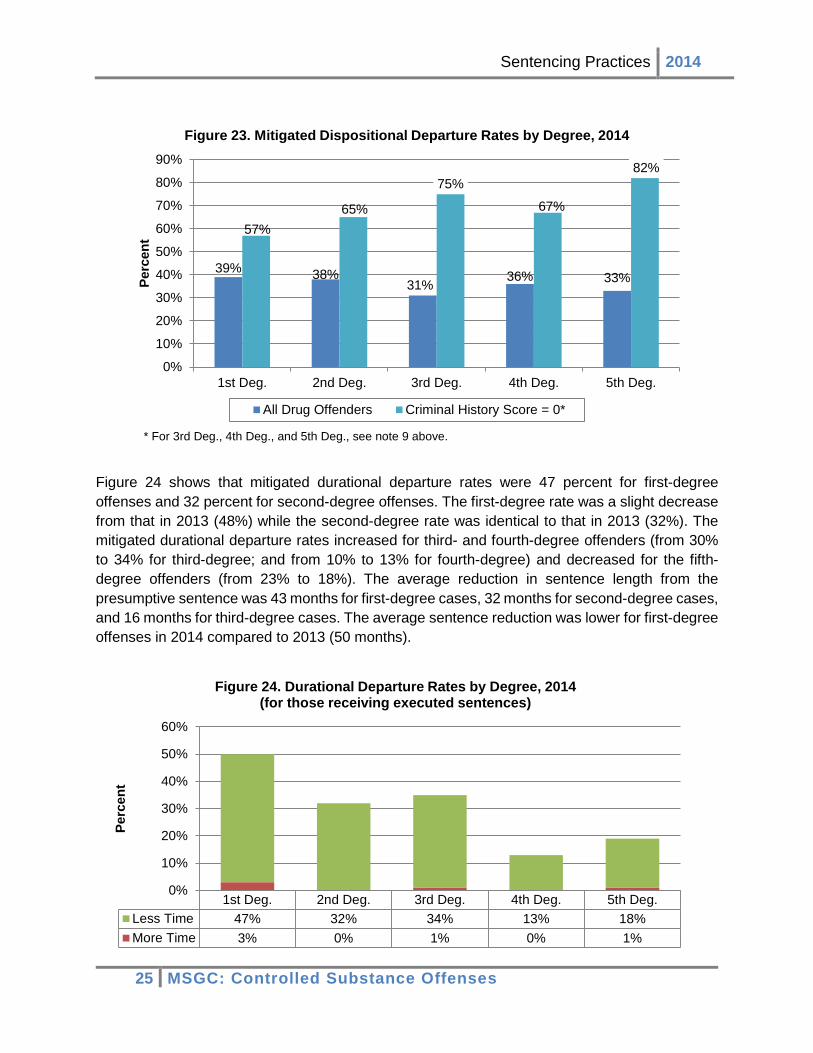
Departure Rates for Drug Offenders by Drug Degree Figure 23 shows the mitigated dispositional departure rates by drug degree. The rate for first-degree increased to 39 percent from 30 percent rate in 2013, which was lower than the rate had been in previous years (41% in 2012; and 47% in 2011). The rate for second-degree was 38 percent; also an increase over 2013 (31%). The third-degree rate was 31 percent; up from 2013 (28%). The fourth-degree rate was 36 percent; up from the 2013 rate (22%). The fifth-degree rate was the only rate that decreased, to 33 percent from 2013 (37%). Among offenders with a criminal history score of 0, the overall mitigated dispositional departure rate was 64 percent, an increase from the 2013 rate of 54 percent. Departure rates for offenders with a criminal history score of 0 increased for all degrees except third.9
9 For third-, fourth-, and fifth-degree controlled substance crime, the presumptive sentence for an offender with a criminal history score of 0 is a stayed prison sentence. Nevertheless, Figure 22 reflects mitigated dispositional departure rates for the small number of zero-criminal-history-score third-, fourth-, and fifth-degree drug offenders whose offenses are presumptive commits by operation of law. (See Minn. Sentencing Guidelines § 2.E.) For example, subsequent third-degree drug offenders (Minn. Stat. § 152.023, subd. 3(b)) and felony drug offenders in possession of a firearm (Minn. Stat. § 609.11) are always subject to a presumptive executed prison sentence.
22%
49%
13%
31%35%
0%5%
10%15%20%25%30%35%40%45%50%
White Black AmericanIndian
Hispanic Asian
Perc
ent
Figure 22. Mitigated Durational Departures by Race/Ethnicity, 2014(for those receiving executed prison sentences)
24 MSGC: Controlled Substance Offenses
Sentencing Practices 2014
* For 3rd Deg., 4th Deg., and 5th Deg., see note 9 above. Figure 24 shows that mitigated durational departure rates were 47 percent for first-degree offenses and 32 percent for second-degree offenses. The first-degree rate was a slight decrease from that in 2013 (48%) while the second-degree rate was identical to that in 2013 (32%). The mitigated durational departure rates increased for third- and fourth-degree offenders (from 30% to 34% for third-degree; and from 10% to 13% for fourth-degree) and decreased for the fifth-degree offenders (from 23% to 18%). The average reduction in sentence length from the presumptive sentence was 43 months for first-degree cases, 32 months for second-degree cases, and 16 months for third-degree cases. The average sentence reduction was lower for first-degree offenses in 2014 compared to 2013 (50 months).
39% 38%31% 36% 33%
57%65%
75%
67%
82%
0%
10%
20%
30%
40%
50%
60%
70%
80%
90%
1st Deg. 2nd Deg. 3rd Deg. 4th Deg. 5th Deg.
Perc
ent
Figure 23. Mitigated Dispositional Departure Rates by Degree, 2014
All Drug Offenders Criminal History Score = 0*
1st Deg. 2nd Deg. 3rd Deg. 4th Deg. 5th Deg.Less Time 47% 32% 34% 13% 18%More Time 3% 0% 1% 0% 1%
0%
10%
20%
30%
40%
50%
60%
Perc
ent
Figure 24. Durational Departure Rates by Degree, 2014 (for those receiving executed sentences)
25 MSGC: Controlled Substance Offenses
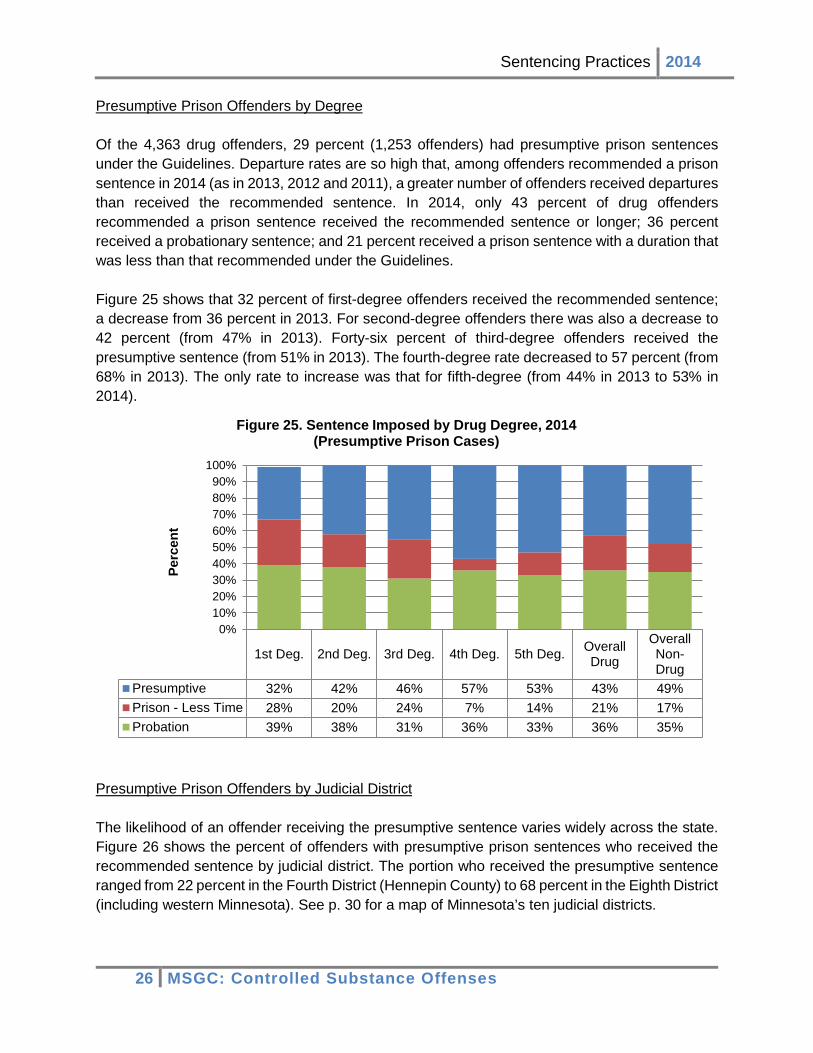
Sentencing Practices 2014 Presumptive Prison Offenders by Degree Of the 4,363 drug offenders, 29 percent (1,253 offenders) had presumptive prison sentences under the Guidelines. Departure rates are so high that, among offenders recommended a prison sentence in 2014 (as in 2013, 2012 and 2011), a greater number of offenders received departures than received the recommended sentence. In 2014, only 43 percent of drug offenders recommended a prison sentence received the recommended sentence or longer; 36 percent received a probationary sentence; and 21 percent received a prison sentence with a duration that was less than that recommended under the Guidelines. Figure 25 shows that 32 percent of first-degree offenders received the recommended sentence; a decrease from 36 percent in 2013. For second-degree offenders there was also a decrease to 42 percent (from 47% in 2013). Forty-six percent of third-degree offenders received the presumptive sentence (from 51% in 2013). The fourth-degree rate decreased to 57 percent (from 68% in 2013). The only rate to increase was that for fifth-degree (from 44% in 2013 to 53% in 2014).
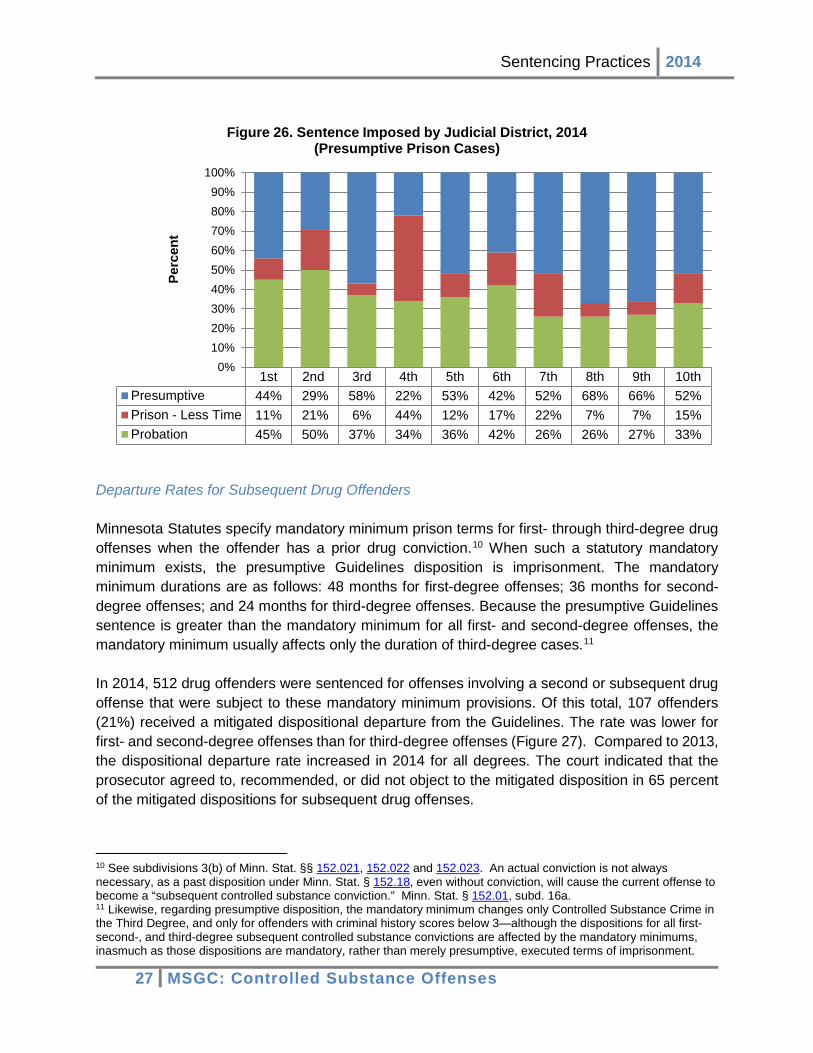
Presumptive Prison Offenders by Judicial District The likelihood of an offender receiving the presumptive sentence varies widely across the state. Figure 26 shows the percent of offenders with presumptive prison sentences who received the recommended sentence by judicial district. The portion who received the presumptive sentence ranged from 22 percent in the Fourth District (Hennepin County) to 68 percent in the Eighth District (including western Minnesota). See p. 30 for a map of Minnesota’s ten judicial districts.
1st Deg. 2nd Deg. 3rd Deg. 4th Deg. 5th Deg. OverallDrug
OverallNon-Drug
Presumptive 32% 42% 46% 57% 53% 43% 49%Prison - Less Time 28% 20% 24% 7% 14% 21% 17%Probation 39% 38% 31% 36% 33% 36% 35%
0%10%20%30%40%50%60%70%80%90%
100%
Perc
ent
Figure 25. Sentence Imposed by Drug Degree, 2014 (Presumptive Prison Cases)
26 MSGC: Controlled Substance Offenses
Sentencing Practices 2014
Departure Rates for Subsequent Drug Offenders Minnesota Statutes specify mandatory minimum prison terms for first- through third-degree drug offenses when the offender has a prior drug conviction.10 When such a statutory mandatory minimum exists, the presumptive Guidelines disposition is imprisonment. The mandatory minimum durations are as follows: 48 months for first-degree offenses; 36 months for second-degree offenses; and 24 months for third-degree offenses. Because the presumptive Guidelines sentence is greater than the mandatory minimum for all first- and second-degree offenses, the mandatory minimum usually affects only the duration of third-degree cases.11 In 2014, 512 drug offenders were sentenced for offenses involving a second or subsequent drug offense that were subject to these mandatory minimum provisions. Of this total, 107 offenders (21%) received a mitigated dispositional departure from the Guidelines. The rate was lower for first- and second-degree offenses than for third-degree offenses (Figure 27). Compared to 2013, the dispositional departure rate increased in 2014 for all degrees. The court indicated that the prosecutor agreed to, recommended, or did not object to the mitigated disposition in 65 percent of the mitigated dispositions for subsequent drug offenses.
10 See subdivisions 3(b) of Minn. Stat. §§ 152.021, 152.022 and 152.023. An actual conviction is not always necessary, as a past disposition under Minn. Stat. § 152.18, even without conviction, will cause the current offense to become a “subsequent controlled substance conviction.” Minn. Stat. § 152.01, subd. 16a. 11 Likewise, regarding presumptive disposition, the mandatory minimum changes only Controlled Substance Crime in the Third Degree, and only for offenders with criminal history scores below 3—although the dispositions for all first- second-, and third-degree subsequent controlled substance convictions are affected by the mandatory minimums, inasmuch as those dispositions are mandatory, rather than merely presumptive, executed terms of imprisonment.
1st 2nd 3rd 4th 5th 6th 7th 8th 9th 10thPresumptive 44% 29% 58% 22% 53% 42% 52% 68% 66% 52%Prison - Less Time 11% 21% 6% 44% 12% 17% 22% 7% 7% 15%Probation 45% 50% 37% 34% 36% 42% 26% 26% 27% 33%
0%10%20%30%40%50%60%70%80%90%
100%Pe
rcen
t
Figure 26. Sentence Imposed by Judicial District, 2014 (Presumptive Prison Cases)
27 MSGC: Controlled Substance Offenses
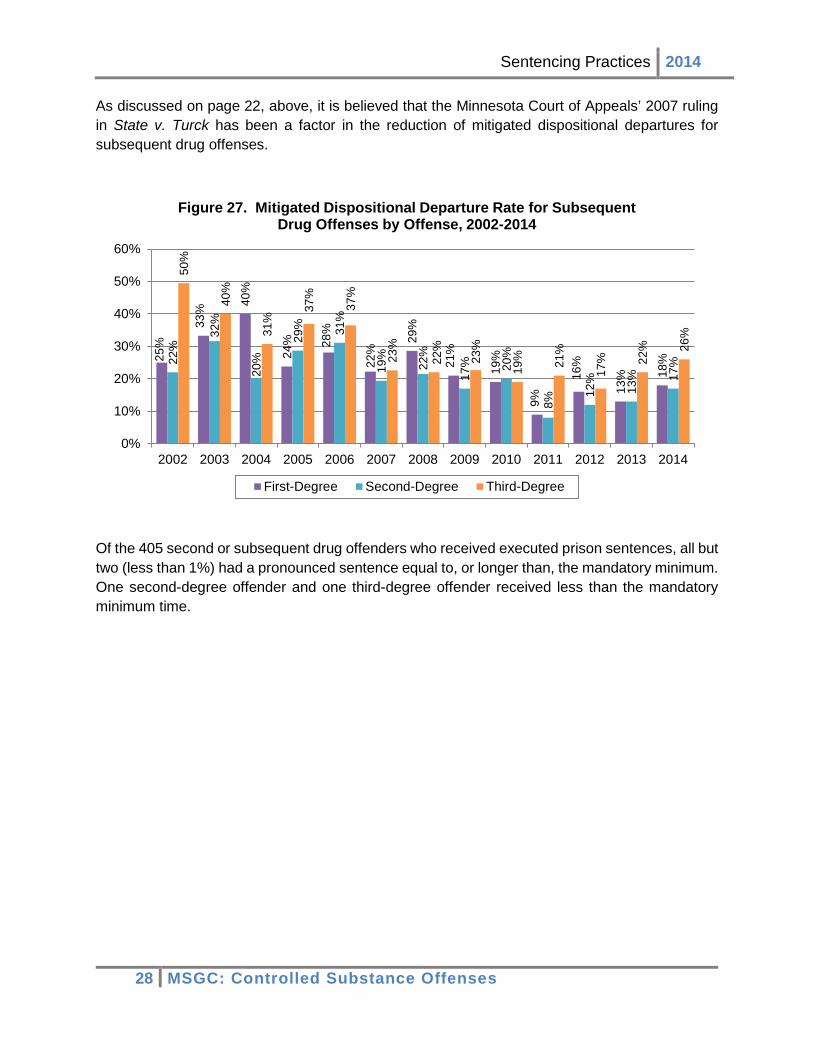
Sentencing Practices 2014 As discussed on page 22, above, it is believed that the Minnesota Court of Appeals’ 2007 ruling in State v. Turck has been a factor in the reduction of mitigated dispositional departures for subsequent drug offenses.
Of the 405 second or subsequent drug offenders who received executed prison sentences, all but two (less than 1%) had a pronounced sentence equal to, or longer than, the mandatory minimum. One second-degree offender and one third-degree offender received less than the mandatory minimum time.
25%
33%
40%
24% 28
%
22%
29%
21%
19%
9%
16%
13% 18
%22%
32%
20%
29% 31
%
19%
22%
17% 20
%
8%
12%
13% 17
%
50%
40%
31%
37%
37%
23%
22%
23%
19% 21%
17% 22
% 26%
0%
10%
20%
30%
40%
50%
60%
2002 2003 2004 2005 2006 2007 2008 2009 2010 2011 2012 2013 2014
Figure 27. Mitigated Dispositional Departure Rate for Subsequent Drug Offenses by Offense, 2002-2014
First-Degree Second-Degree Third-Degree
28 MSGC: Controlled Substance Offenses
Sentencing Practices 2014
How the Guidelines Work Minnesota’s Guidelines are based on a grid structure. The vertical axis of the Grid represents the severity of the offense for which the offender was convicted. The horizontal axis represents a measure of the offender’s criminal history. The Commission has ranked felony level offenses into eleven severity levels. Offenses included in each severity level are listed in the Severity Reference Table in the Minnesota Sentencing Guidelines and Commentary. The criminal history index measures the offender’s prior record and consists of four measures of prior criminal behavior: (1) a weighted measure of prior felony sentences; (2) a limited measure of prior misdemeanor/gross misdemeanor sentences; (3) a limited measure of the prior serious juvenile record; and (4) a “custody status” measure which indicates if the offender was on probation or parole when the current offense was committed. The recommended (presumptive) guideline sentence is found in the cell of the Grid in which the offender’s criminal history score and severity level intersect. The Guidelines recommend imprisonment in a state prison in the non-shaded cells of the Grid. The Guidelines generally recommend a stayed sentence for cells in the shaded area of the Grid. When a sentence is stayed, the court typically places the offender on probation and may require up to a year of conditional confinement in a local facility (i.e., jail or workhouse). Other conditions such as fines, restitution, community work service, treatment, house arrest, etc. may also be applied to an offender’s sentence. There are, however, a number of offenses that carry a presumptive prison sentence regardless of where the offender is on the Guidelines Grid (e.g., offenses involving dangerous weapons which carry mandatory minimum prison terms, and drug and burglary offenses). The number in the cell is the recommended length of the prison sentence in months. As explained above, sentences in shaded boxes are generally stayed probationary sentences. For cases in the non-shaded cells of the Grid, the Guidelines also provide a narrow range of months around the presumptive duration that a judge may pronounce and still be within the Guidelines. It is not possible to fully explain all of the policies in this brief summary. Additional information on the Guidelines is available by contacting the Commission’s office. The Minnesota Sentencing Guidelines and Commentary is available online at mn.gov/sentencing-guidelines.
29 MSGC: Controlled Substance Offenses

Sentencing Practices 2014
First Carver Dakota Goodhue LeSueur McLeod Scott Sibley
Second Ramsey
Third Dodge Fillmore Freeborn Houston Mower Olmsted Rice Steele Wabasha Waseca Winona
Fourth Hennepin
Fifth Blue Earth Brown Cottonwood Faribault Jackson Lincoln Lyon Martin Murray Nicollet Nobles Pipestone Redwood Rock Watonwan
Sixth Carlton Cook Lake St. Louis
Seventh Becker Benton Clay Douglas Mille Lacs Morrison Otter Tail Stearns Todd Wadena
Eighth Big Stone Chippewa Grant Kandiyohi LacQuiParle Meeker Pope Renville Stevens Swift Traverse Wilkin Yellow Medicine
Ninth Aitkin Beltrami Cass Clearwater Crow Wing Hubbard Itasca Kittson Koochiching Lake-Woods Mahnomen Marshall Norman Pennington Polk Red Lake Roseau
Tenth Anoka Chisago Isanti Kanabec Pine Sherburne Washington Wright
Minnesota Judicial Branch at http://mncourts.gov/?page=238
Minnesota Judicial District Map
30 MSGC: Controlled Substance Offenses

Sentencing Guidelines Grid
Presumptive sentence lengths are in months. Italicized numbers within the grid denote the discretionary range within which a court may sentence without the sentence being deemed a departure. Offenders with stayed felony sentences may be subject to local confinement.
SEVERITY LEVEL OF CONVICTION OFFENSE (Example offenses listed in italics)
CRIMINAL HISTORY SCORE
0 1 2 3 4 5 6 or more
Murder, 2nd Degree (intentional murder; drive-by- shootings)
11 306 261-367
326 278-391
346 295-415
366 312-439
386 329-463
406 346-480 2
426 363-480 2
Murder, 3rd Degree Murder, 2nd Degree (unintentional murder)
10 150 128-180
165 141-198
180 153-216
195 166-234
210 179-252
225 192-270
240 204-288
Assault, 1st Degree Controlled Substance Crime,
1st Degree 9 86
74-103 98
84-117 110
94-132 122
104-146 134
114-160 146
125-175 158
135-189
Aggravated Robbery, 1st Degree Controlled Substance Crime,
2nd Degree 8 48
41-57 58
50-69 68
58-81 78
67-93 88
75-105 98
84-117 108
92-129
Felony DWI; Financial Exploitation
of a Vulnerable Adult 7 36 42 48 54 46-64
60 51-72
66 57-79
72 62-84 2, 3
Controlled Substance Crime, 3rd Degree 6 21 27 33 39
34-46 45
39-54 51
44-61 57
49-68
Residential Burglary Simple Robbery 5 18 23 28 33
29-39 38
33-45 43
37-51 48
41-57
Nonresidential Burglary
4
121 15 18 21 24 21-28
27 23-32
30 26-36
Theft Crimes (Over $5,000) 3 121 13 15 17 19 17-22
21 18-25
23 20-27
Theft Crimes ($5,000 or less) Check Forgery ($251-$2,500) 2 121 121 13 15 17 19 21
18-25
Sale of Simulated Controlled Substance 1 121 121 121 13 15 17 19
17-22
1 121=One year and one day
Presumptive commitment to state imprisonment. First-degree murder has a mandatory life sentence and is excluded from the Guidelines under Minn. Stat. § 609.185. See section 2.E, for policies regarding those sentences controlled by law.
Presumptive stayed sentence; at the discretion of the court, up to one year of confinement and other non-jail sanctions can be imposed as conditions of probation. However, certain offenses in the shaded area of the Grid always carry a presumptive commitment to state prison. See sections 2.C and 2.E.
2 Minn. Stat. § 244.09 requires that the Guidelines provide a range for sentences that are presumptive commitment to state imprisonment of 15% lower and 20% higher than the fixed duration displayed, provided that the minimum sentence is not less than one year and one day and the maximum sentence is not more than the statutory maximum. See section 2.C.1-2. 3 The stat. max. for Financial Exploitation of Vulnerable Adult is 240 months; the standard range of 20% higher than the fixed duration applies at CHS 6 or more. (The range is 62-86.)
31 Effective August 1, 2014