minos results from the first year of numi beam …lss.fnal.gov/conf/c0606131/7.8nelson.pdf · 2 the...
TRANSCRIPT
MINOS Results from the First Year of NuMI Beam Operation
Jeff NelsonWilliam & Mary
(for the MINOS Collaboration)
Neutrino 2006 Santa Fe, NM
June 17th, 2006

2
The MINOS Experiment
A large detector at Soudan> The “far detector” or FD
A smaller detector at Fermilab > The “near detector” or ND
Measure the beam and neutrino energy spectrum near the source
> See how it differs far away
735 km
3
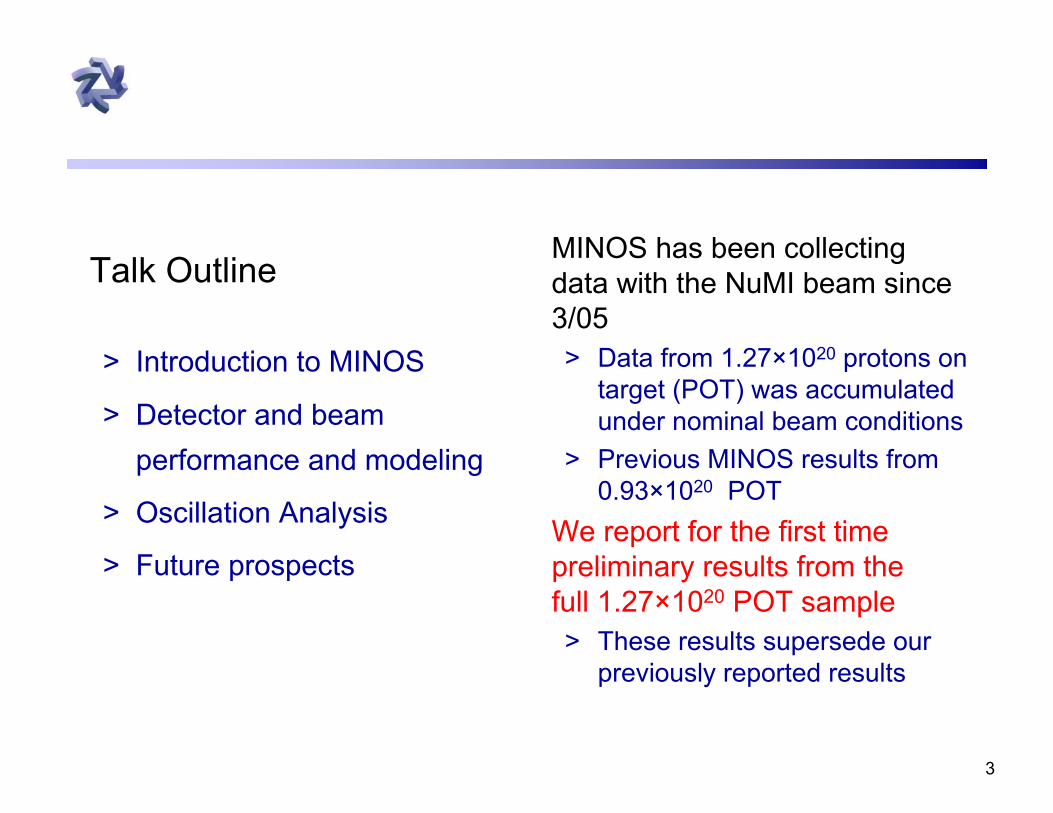
Talk Outline
> Introduction to MINOS
> Detector and beam performance and modeling
> Oscillation Analysis
> Future prospects
MINOS has been collecting data with the NuMI beam since 3/05 > Data from 1.27×10²⁰ protons on
target (POT) was accumulated under nominal beam conditions
> Previous MINOS results from 0.93×10²⁰ POT
We report for the first time preliminary results from the full 1.27×10²⁰ POT sample> These results supersede our
previously reported results

4
MINOS Collaboration
Argonne • Athens • Benedictine • Brookhaven • Caltech • Cambridge • Campinas • Fermilab College de France • Harvard • IIT • Indiana • ITEP-Moscow • Lebedev • Livermore
Minnesota-Twin Cities • Minnesota-Duluth • Oxford • Pittsburgh • Protvino • Rutherford Sao Paulo • South Carolina • Stanford • Sussex • Texas A&M
Texas-Austin • Tufts • UCL • Western Washington • William & Mary • Wisconsin
32 institutions175 scientists
5
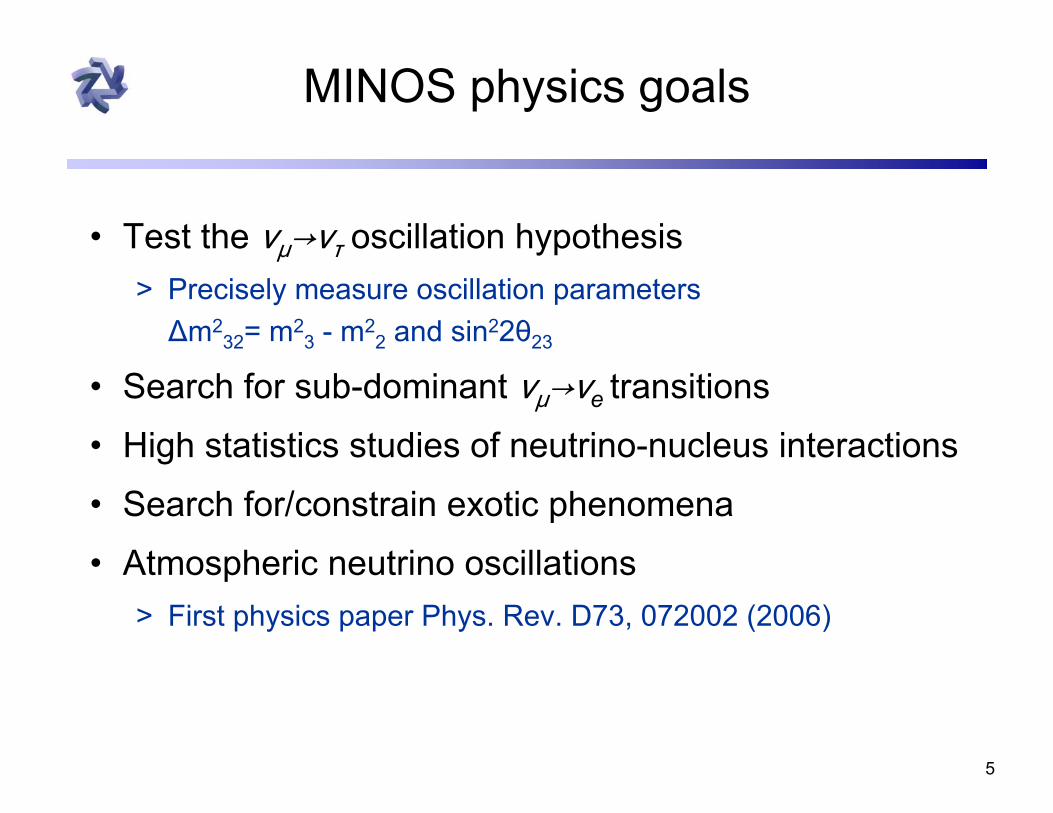
MINOS physics goals
• Test the νμ→ντ oscillation hypothesis > Precisely measure oscillation parameters
Δm232= m2
3 - m22 and sin22θ23
• Search for sub-dominant νμ→νe transitions
• High statistics studies of neutrino-nucleus interactions
• Search for/constrain exotic phenomena
• Atmospheric neutrino oscillations> First physics paper Phys. Rev. D73, 072002 (2006)
6
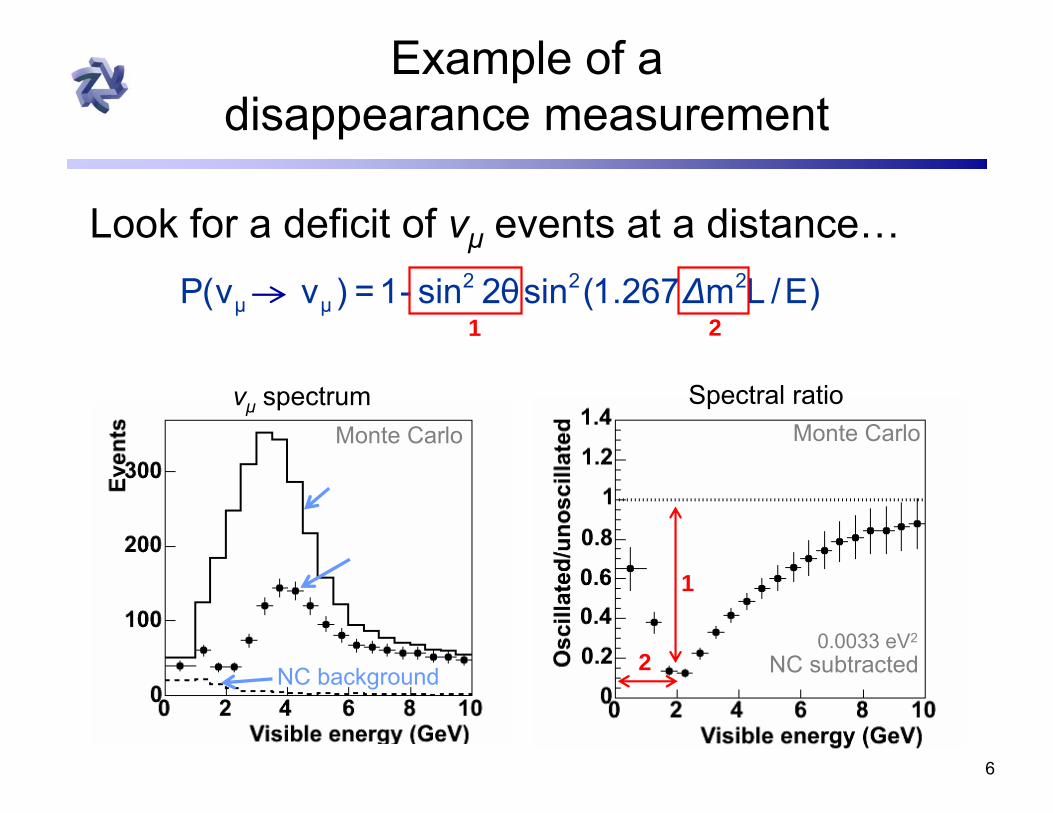
Example of a disappearance measurement
Look for a deficit of νμ events at a distance…
Unoscillated
Oscillated
νμ spectrumMonte Carlo
NC background
1
2
Monte CarloSpectral ratio
NC subtracted0.0033 eV2
)E/Lm267.1(sinθ2sin-1=)νν(P 222μμ Δ→
1 2
7
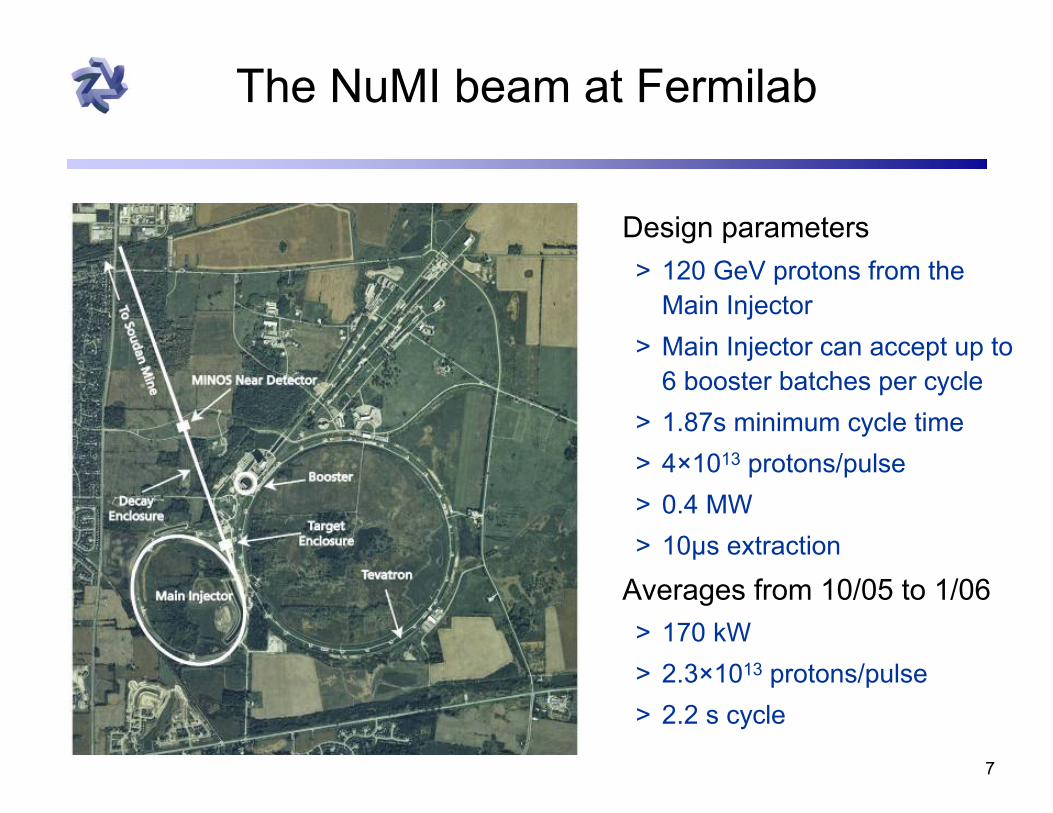
The NuMI beam at Fermilab
Design parameters> 120 GeV protons from the
Main Injector> Main Injector can accept up to
6 booster batches per cycle> 1.87s minimum cycle time> 4×10¹³ protons/pulse> 0.4 MW> 10µs extraction
Averages from 10/05 to 1/06 > 170 kW> 2.3×10¹³ protons/pulse> 2.2 s cycle
8
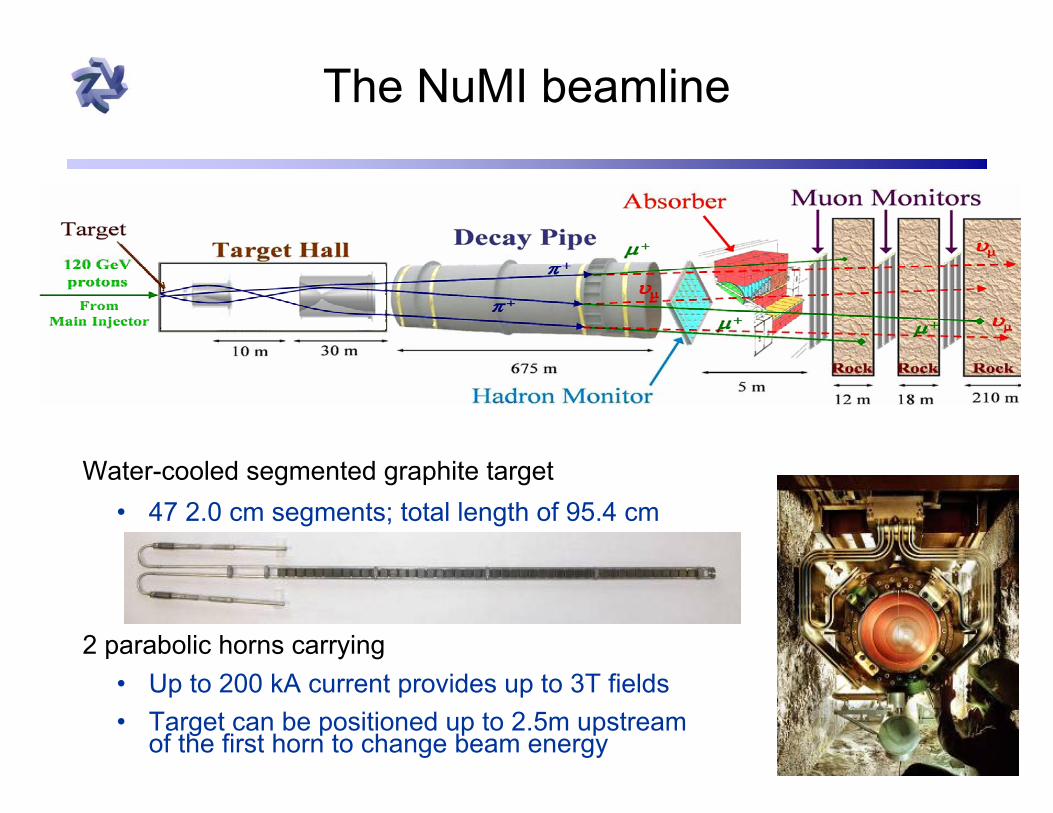
The NuMI beamline
Water-cooled segmented graphite target• 47 2.0 cm segments; total length of 95.4 cm
2 parabolic horns carrying • Up to 200 kA current provides up to 3T fields• Target can be positioned up to 2.5m upstream
of the first horn to change beam energy
9
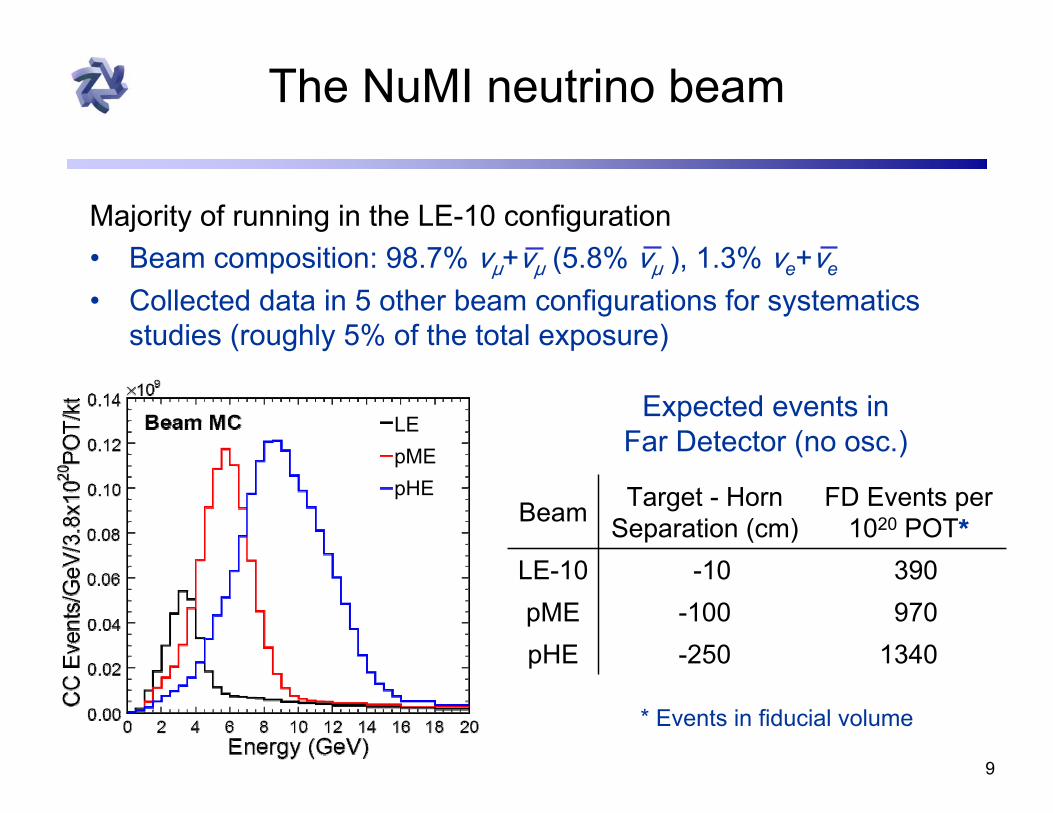
The NuMI neutrino beam
Majority of running in the LE-10 configuration• Beam composition: 98.7% νμ+νμ (5.8% νμ ), 1.3% νe+νe
• Collected data in 5 other beam configurations for systematics studies (roughly 5% of the total exposure)
390-10LE-10970-100pME
1340-250pHE
Beam Target - Horn Separation (cm)
FD Events per 1020 POT*
LEpMEpHE
Expected events in Far Detector (no osc.)
* Events in fiducial volume

10
MINOS Detectors
Iron and Scintillator tracking calorimeters2.54 cm thick magnetized steel planes <B> = 1.2T
1×4.1 cm2 scintillator stripsMulti-anode PMT readout
GPS time-stamping to synchronize FD data to ND/BeamSoftware triggering in DAQ PCs
Main Injector spill times sent to the FD for a beam trigger
Far Detector5.4 kton
8 × 8 × 30 m3
484 planes
Near Detector1 kton 3.8 × 4.8 × 15 m3
282 steel planes153 scintillator planes

11
MINOS Calibration system
ND & FD response > Light Injection system
(PMT gain)> Source scan
(within a strip)> Cosmic ray muons
(strip to strip)> Stopping cosmic ray
muons (detector to detector)
> Overall energy scale (Test beam)
Energy scale errors> 5.7% absolute> 2% ND/FD relative Raw response Calibrated response

12
A blind analysis
Far detector blinding> Unknown fraction of FD events were hidden
• Blinded as a function of event length and energy
> The “Open” FD data used to check data quality
All near detector data was open> Used to study beam properties, cross sections, and
detector systematics
Analysis procedures defined prior to box opening

13
Near detector events
• High event rate in the near detector > Over 1x10⁷ events in
the fiducial volume
• Multiple interactions per main injector spill
> 10 µs beam spills
• Events are separated by topology and 19ns timing
> Linear response to increasing intensity
Number of events vs intensity
14
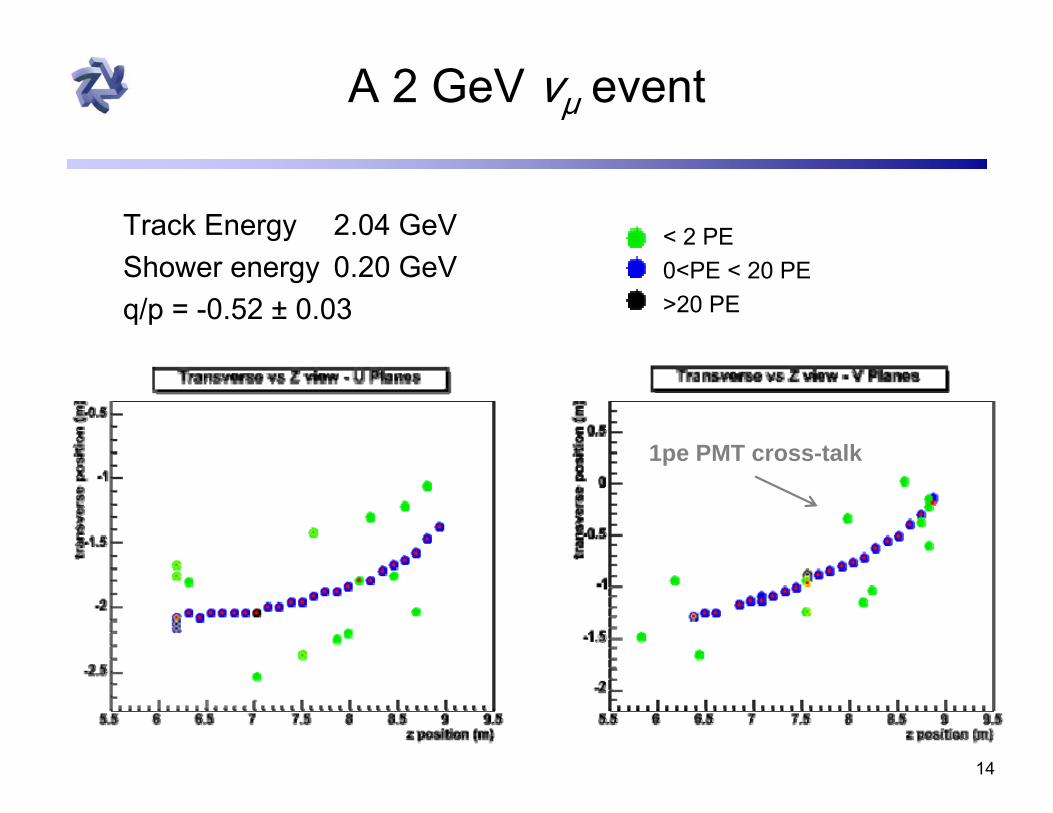
1pe PMT cross-talk
A 2 GeV νμ event
Track Energy 2.04 GeVShower energy 0.20 GeVq/p = -0.52 ± 0.03
< 2 PE0<PE < 20 PE>20 PE

15
νμ CC event pre-selection cuts
ν
Calorimeter Spectrometer
NEAR DETECTOR FAR DETECTOR
Fiducial Volume
• At least one good track• Fitted track with negative charge • Track vertex within the fiducial volume
> ND r < 1m from beam center> FD r < 3.7m
16
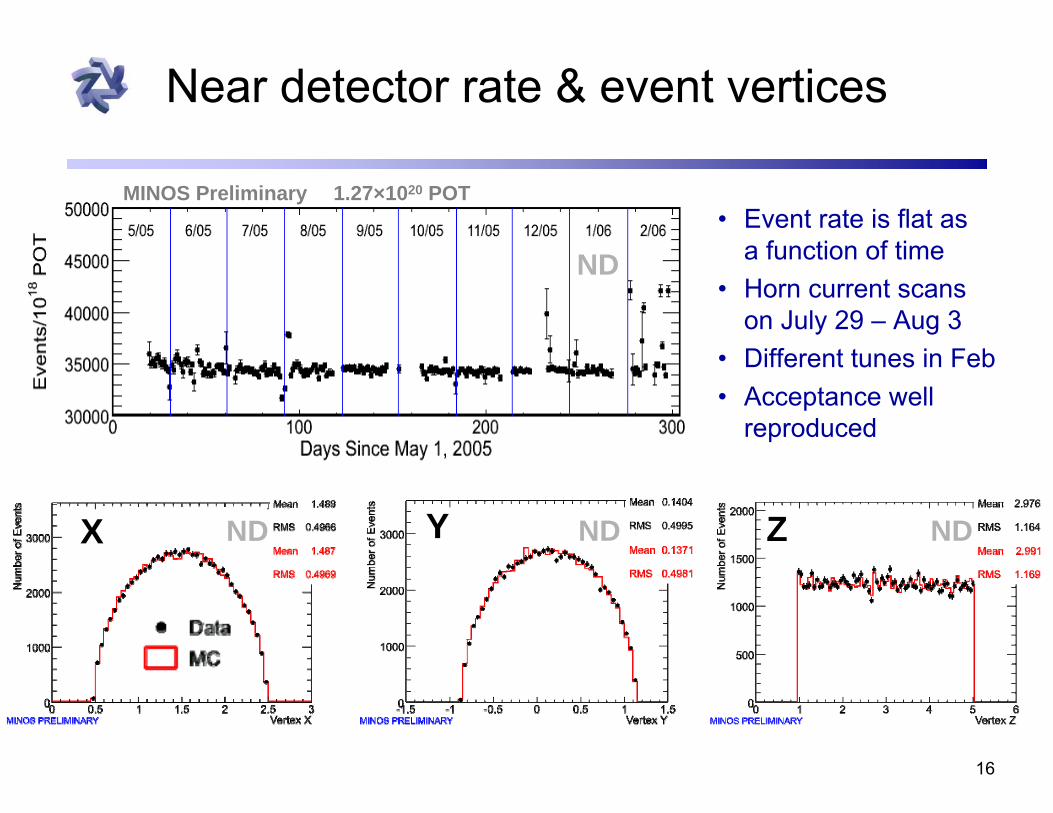
Near detector rate & event vertices
X ZY
• Event rate is flat as a function of time
• Horn current scans on July 29 – Aug 3
• Different tunes in Feb• Acceptance well
reproduced
MINOS Preliminary 1.27×10²⁰ POT
ND
NDND ND

17
Event selection performance
Charged current events are selected using a likelihood procedure> Combine probability density functions for 3 low level variables to
differentiate CC & NC interactions> Efficiency is reasonably flat vs visible energy over most of the
energy range> NC contamination is limited to the lowest bins (below 1.5 GeV)
(87%)
(97%)
Monte Carlo NDMINOS Preliminary
Event Classification Parameter
18
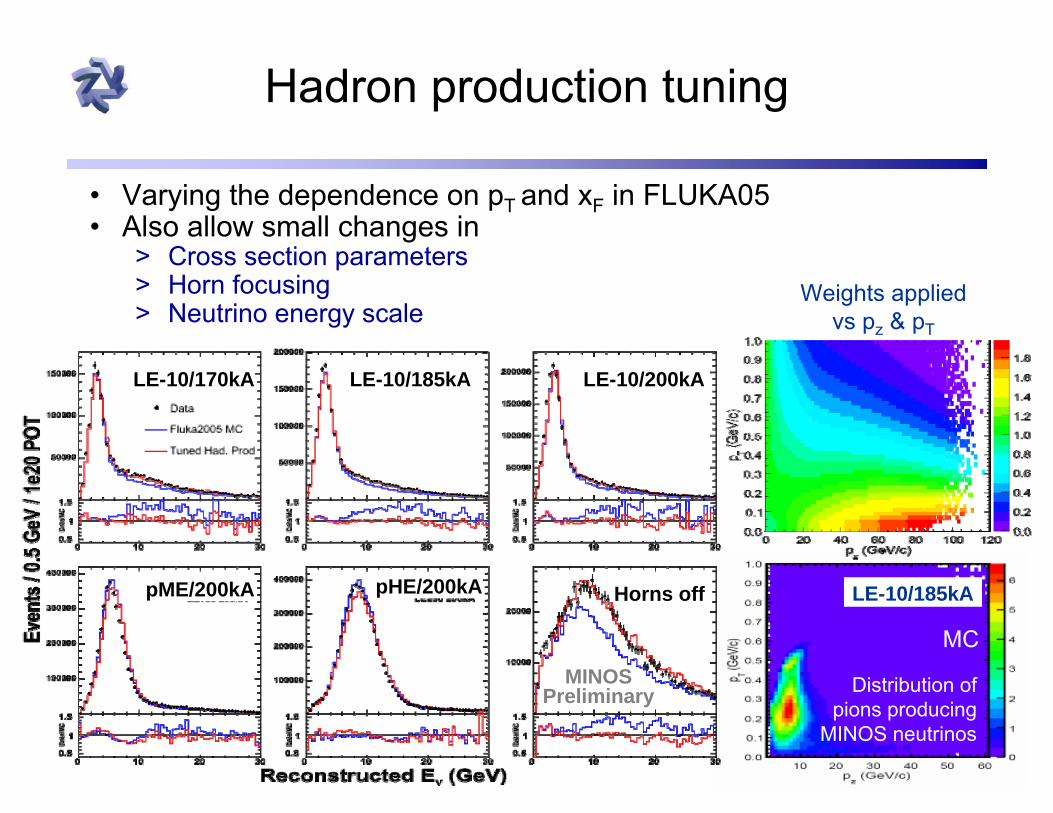
LE-10/185kA
pME/200kA pHE/200kA Horns off
LE-10/170kA LE-10/200kA
Hadron production tuning
• Varying the dependence on pT and xF in FLUKA05• Also allow small changes in
> Cross section parameters> Horn focusing> Neutrino energy scale
Weights applied vs pz & pT
LE-10/185kA
Distribution of pions producing
MINOS neutrinos
MCMINOS
Preliminary

19
Predicting the unoscillated FD spectrum
Start with near detector data & extrapolation to the far detector> Use Monte Carlo to provide corrections due to energy smearing and acceptance> Encode pion decay kinematics & the geometry of the beamline into a matrix used to
transform the ND spectrum into the FD energy spectrum This is the primary method used in our analysis
FD
Decay Pipe
π+Target
ND
p

20
Different methods of predicting the FD spectrum
ND fit methods>2 types of fits made to all 6 beams
• ND fit to Ev distribution • 2D fit to (Ev, y) grid
>The MC is then used to produce the extrapolation FD spectrum
ND data extrapolation methods>2 types of fit used
• Beam matrix• F/N ratio
– Events in each ND energy bin are scaled via MC into a number of FD events in the same bin
The methods are robust to different categories of systematics
1.27×10²⁰ POTMINOS Preliminary
21
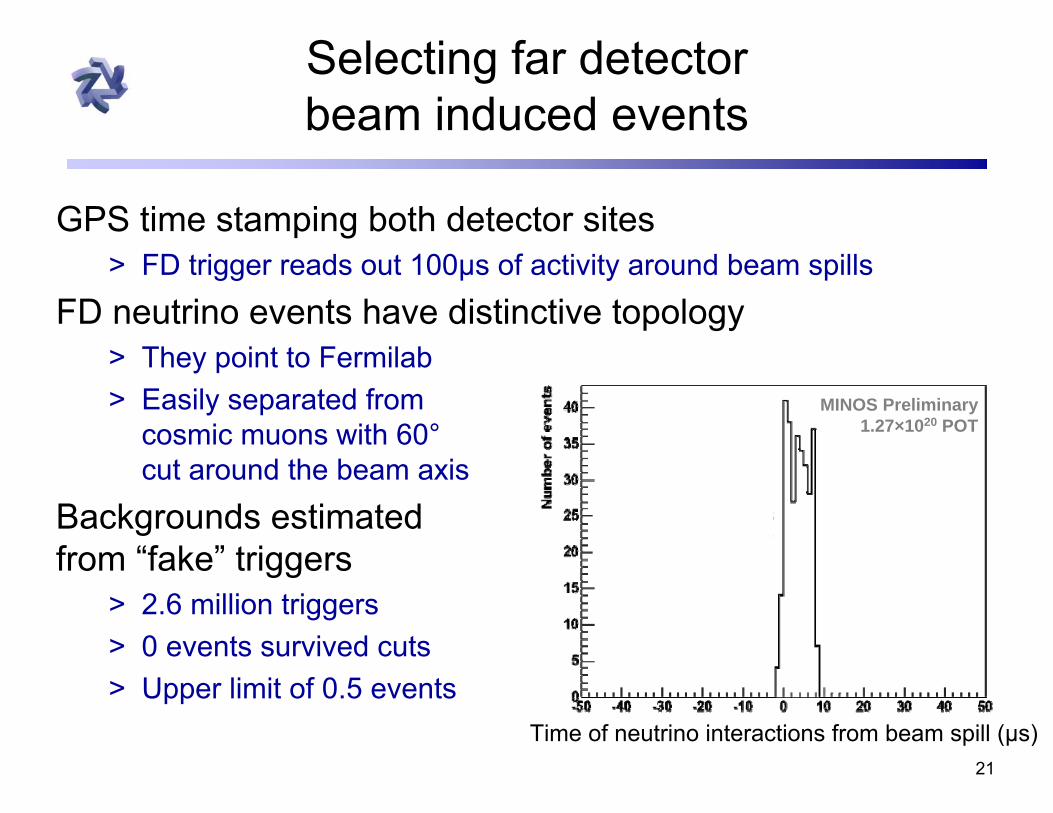
Selecting far detectorbeam induced events
GPS time stamping both detector sites> FD trigger reads out 100µs of activity around beam spills
FD neutrino events have distinctive topology > They point to Fermilab> Easily separated from
cosmic muons with 60°cut around the beam axis
Backgrounds estimated from “fake” triggers
> 2.6 million triggers> 0 events survived cuts > Upper limit of 0.5 events
Neutrino candidates are in 8.9us window
Time of neutrino interactions from beam spill (µs)
MINOS Preliminary1.27×1020 POT
22
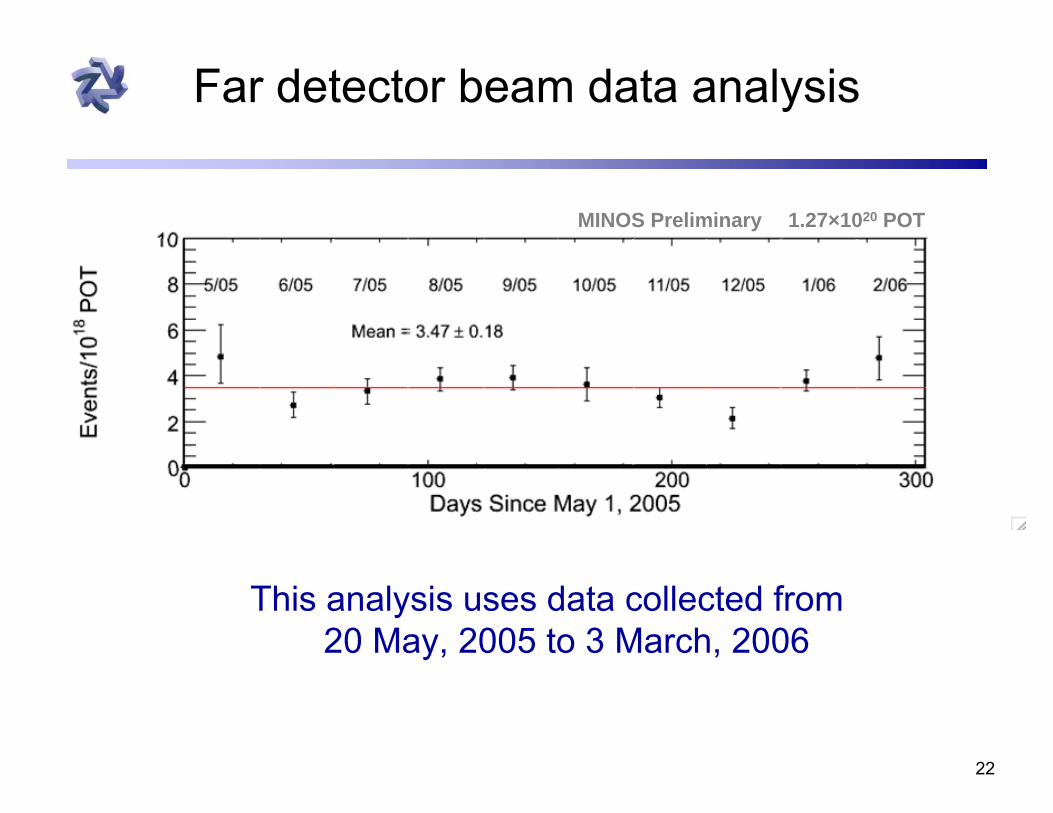
Far detector beam data analysis
This analysis uses data collected from 20 May, 2005 to 3 March, 2006
MINOS Preliminary 1.27×10²⁰ POT

23
Numbers of observed & expected events
A large energy dependent deficit > Below 10 GeV the significance of the deficit is 5.9σ (stat+syst)> Preliminary result from the 1.27×10²⁰ POT sample
168.6
237.7
332.8
Expected(Fit Method; Unoscillated)
168±12
239±17
336±21
Expected (Matrix Method;
Unoscillated)
0.51±0.08122νμ (<10 GeV)
0.45±0.0967νμ ( < 5 GeV)
0.64±0.08
Data/MC (Matrix Method)
215 νμ (<30 GeV)
Data sample Data
24
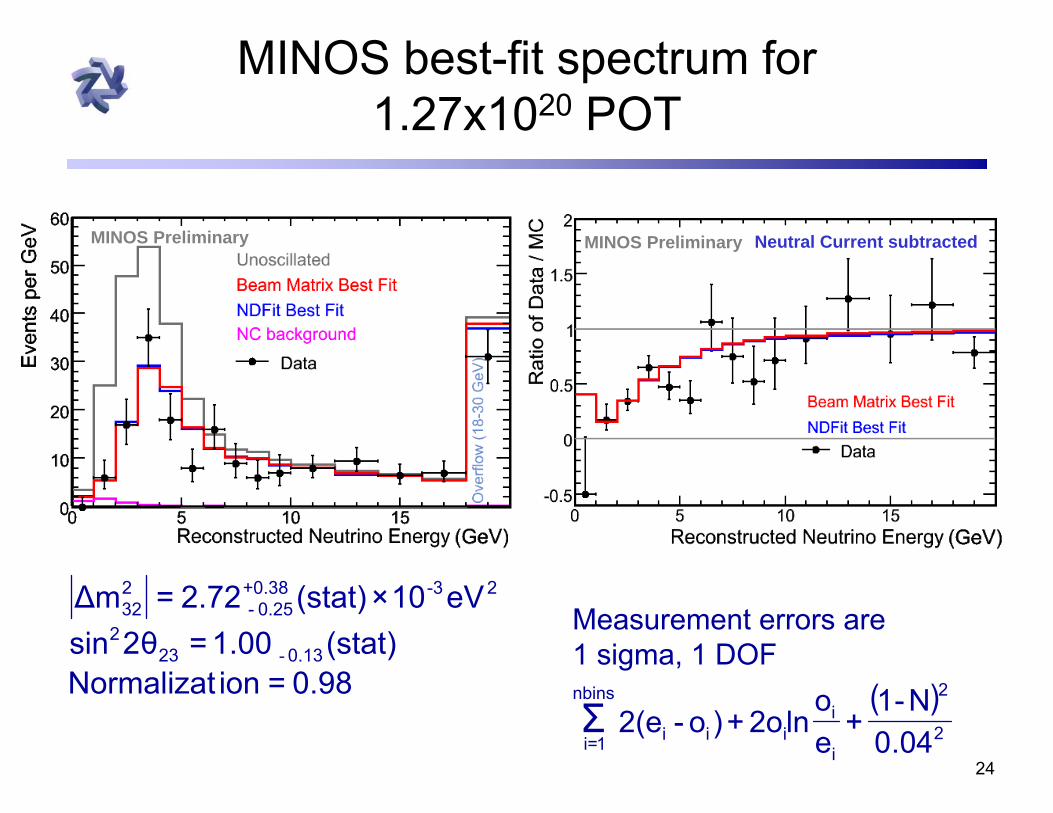
MINOS best-fit spectrum for 1.27x10²⁰ POT
Measurement errors are 1 sigma, 1 DOF
0.98=ionNormalizat(stat)1.00=2θsin
eV10×(stat)2.72=Δm
0.13232
2-3+0.380.25 -
232
-
MINOS Preliminary Neutral Current subtractedMINOS Preliminary
( )2
2
i
iiii
nbins
1=i 04.0N-1
+eo
ln2o+)o-2(eΣ
25
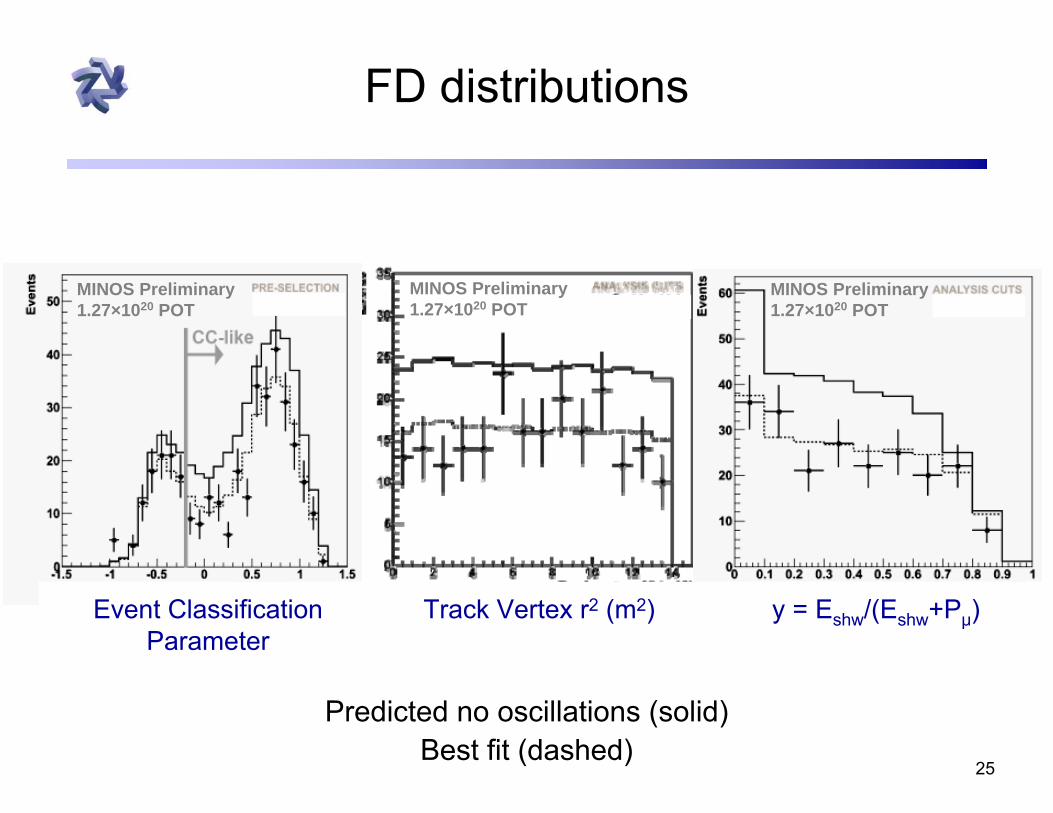
FD distributions
MINOS Preliminary1.27×1020 POT
MINOS Preliminary1.27×1020 POT
MINOS Preliminary1.27×1020 POT
Predicted no oscillations (solid)Best fit (dashed)
Track Vertex r2 (m2) y = Eshw/(Eshw+Pμ)Event Classification Parameter
26
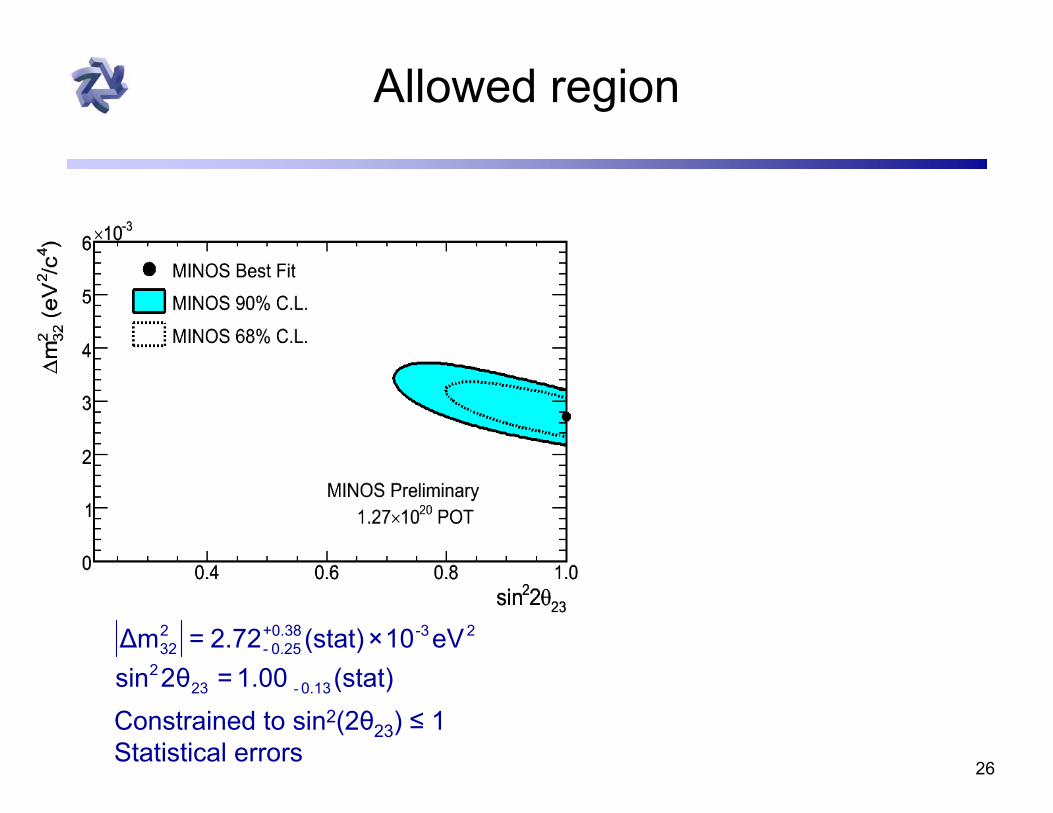
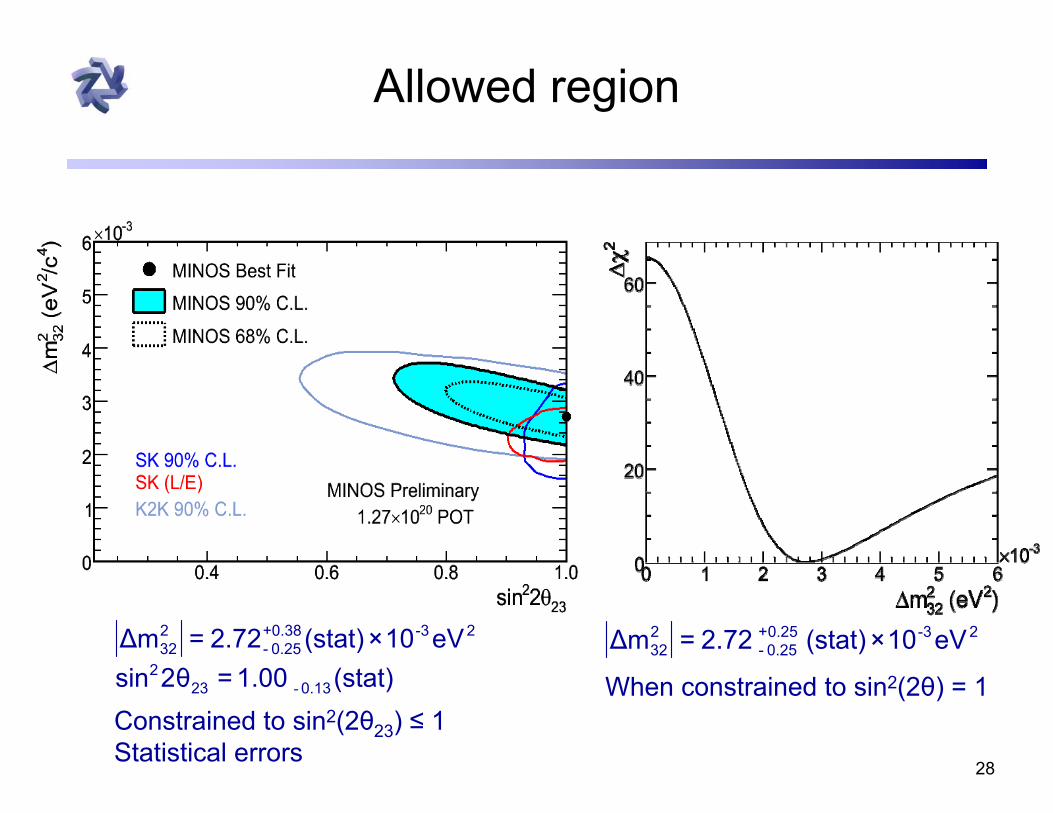
Allowed region
(stat)1.00=2θsineV10×(stat)2.72=Δm
0.13232
2-3+0.380.25 -
232
-
Constrained to sin2(2θ23) ≤ 1Statistical errors
27
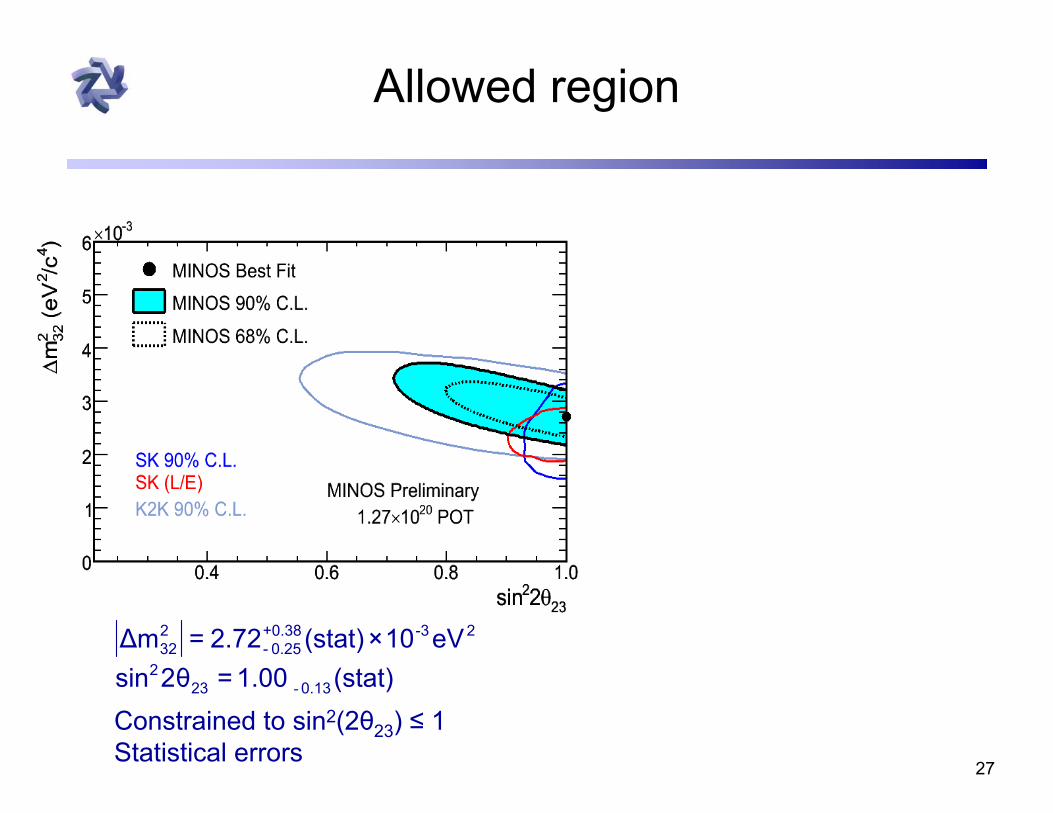
Allowed region
(stat)1.00=2θsineV10×(stat)2.72=Δm
0.13232
2-3+0.380.25 -
232
-
Constrained to sin2(2θ23) ≤ 1Statistical errors
28
Allowed region
2-30.25+ 0.25 -
232 eV10×(stat) 2.72=Δm
When constrained to sin2(2θ) = 1(stat)1.00=2θsineV10×(stat)2.72=Δm
0.13232
2-3+0.380.25 -
232
-
Constrained to sin2(2θ23) ≤ 1Statistical errors

29
Systematic errors
0.0050.25Beam uncertainties0.0100.10Fit bias0.0050.13Reconstruction
0.0030.10Near/Far shower energy scale ± 2%
0.0441.31Total Systematic (summed in quadrature)0.12 .3.6 .Statistical sensitivity
0.0180.83Intranuclear re-scattering / absolute energy scale (±6%)
0.0380.88NC contamination ± 50%0.0040.16CC cross-section uncertainties
0.0030.35Muon momentum scale ± 2%0.0000.03Near/Far normalization ± 4%
sin22θPreliminary Uncertainty Δm2 (10-4 eV2)
30
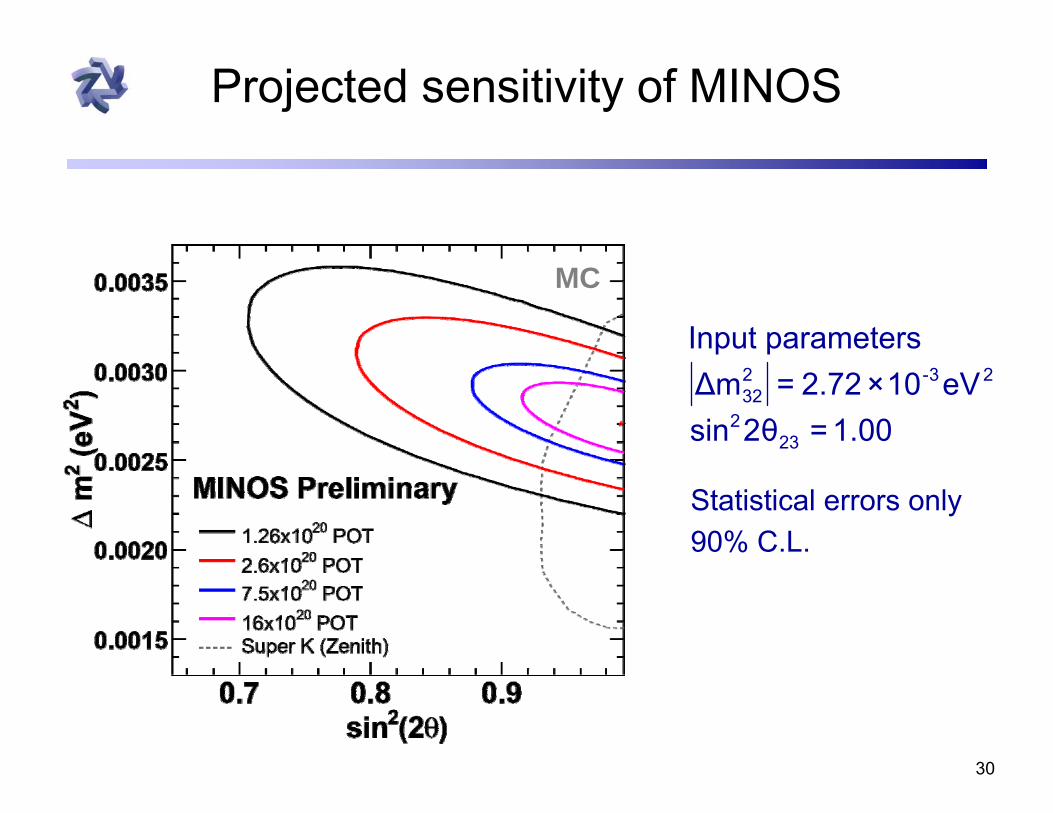
Projected sensitivity of MINOS
Statistical errors only90% C.L.
1.00=2θsineV10×2.72=Δm
parameters Input
232
23-232
MC

31
2nd year of MINOS running in the NuMI Beam is underway
The first FD beam event in the new run> A muon from an interaction in the cavern rock

32
MINOS Summary
Preliminary results from the first year of accelerator neutrino exposure> Our exposure to date is 1.27×10²⁰ POT> Disfavors no oscillations at 5.9 σ (rate only)> It is consistent with νμ disappearance with the following parameters
> A fit constrained to the sin2(2θ)=1 boundary yields
The systematics are under control> Many systematics are data driven and will improve with increasing
statistics and further analysis> We should be able to make significant improvements in precision with a
substantially larger dataset
(syst) 0.04±(stat)1.00=2θsineV10×(stat) 0.13±(stat)2.72=Δm
0.13232
2-3+0.380.25-
232
-
2-3+0.250.25-
232 eV10×2.72=Δm
33
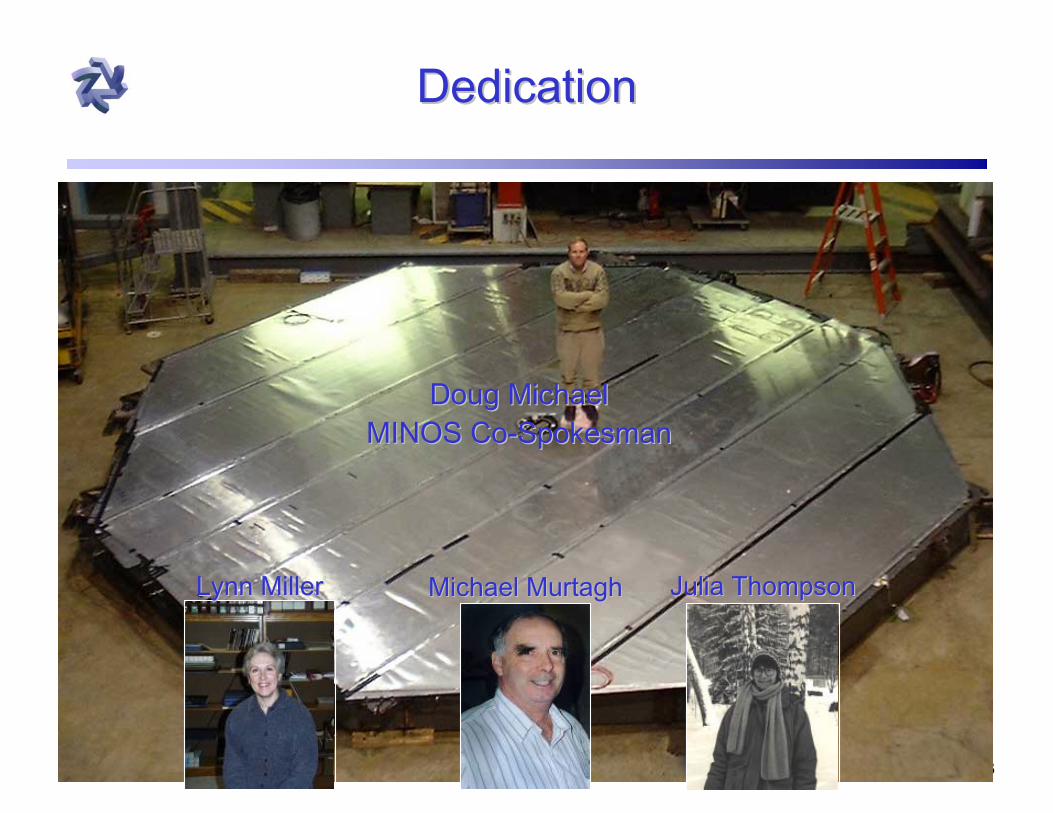
DedicationDedication
Lynn Miller Lynn Miller Julia ThompsonJulia Thompson
Doug MichaelDoug MichaelMINOS CoMINOS Co--SpokesmanSpokesman
Michael MurtaghMichael Murtagh