mir-186 serves as a tumor suppressor in lung
TRANSCRIPT

Page 1/18
MiR-186 serves as a tumor suppressor in lungadenocarcinoma cells by down-regulation of Shp2gene and inhibiting PI3K/Akt/mTOR signalingpathwayShao-Hui Yan
Qinhuangdao Cancer HospitalShu-Feng Xu
The First Hospital of QinhuangdaoLei Zheng
The First Hospital of QinhuangdaoLi-Ying Kang
Tianjin Wuqing District HospitalJun-Li Cao
The First Hospital of QinhuangdaoPing Wang
Chinese PLA General HospitalLiming Gao ( [email protected] )
The First Hospital of Qinhuangdao https://orcid.org/0000-0003-1299-7920
Research article
Keywords: MiR-186, Lung adenocarcinoma, Apoptosis, Metastasis
Posted Date: March 11th, 2020
DOI: https://doi.org/10.21203/rs.3.rs-16802/v1
License: This work is licensed under a Creative Commons Attribution 4.0 International License. Read Full License
Page 2/18
AbstractBackground The study aimed to investigate the effect and mechanism of miR-186, which targets proteintyrosine phosphatase (Shp2) PI3K/Akt/mTOR signaling pathway, on the biological characteristics of lungadenocarcinoma cells. Methods In this experimental study, Human lung adenocarcinoma cell line SPC-A-1 was grouped as Blank group, negative control (NC) group, miR-186 mimic group, miR-186 inhibitorgroup, si-Shp2 group and miR-186 inhibitor+si-Shp2 group. Results The results showed that miR-186 cantarget and down-regulate the expression of Shp2 gene. Compared with the Blank group, levels of Shp2, N-cadherin and Bcl-2 and level of PI3K/p-PI3K, Akt/P-Akt, mTOR/p-mTOR as well as cell proliferation,migration and invasion ability and the proportion of cells in S phase signi�cantly decreased in the miR-186 mimic group and the si-Shp2 group, while the levels of E-cadherin and Bax as well as the proportionof cells in G1 phase and cell gene and mediates apoptosis rate increased signi�cantly (all P < 0.05).Compared with the miR-186 inhibitor group, the miR-186 inhibitor + si-Shp2 group showed similar trend inall parameters with the comparison above (all P < 0.05). Conclusions The overexpression of miR-186 candown-regulate Shp2 gene expression, further inhibit the proliferation, invasion and migration and promoteapoptosis of lung adenocarcinoma cells by inhibiting the activation of PI3K/Akt/mTOR signalingpathway.
BackgroundWith the occurrence and development of cancer, the life quality and health of patients have been greatlyimpacted. In China, lung adenocarcinoma accounts for a large part of cancer cases as the risk of lungcancer as well as the morbidity and mortality of lung cancer patients is gradually increasing, whichseriously impacts human life safety [1, 2]. Therefore, it’s extremely important to explore the molecularmechanism of lung adenocarcinoma for the clinical treatment of lung cancer.
As a proto-oncogene, the expression of Shp2 up-regulated in lung cancer, which may affect the biologicalcharacteristics, such as migration, apoptosis, proliferation and invasion, of lung adenocarcinoma cells[3–6]. Shp2 gene can also promote the activation of Ras pathway, which further activates PI3K throughdirect interaction with p110 catalyst. Afterwards, it facilitates the transformation of PIP2 to PIP3. PIP3then integrates with Akt to promote the phosphorylation of Akt, so as to affect the cell proliferation,migration, invasion and apoptosis of lung adenocarcinoma [7–10]. mTOR, a kind of serine-threonineprotein kinase, is a member of PI3K protein kinase family. When p-mTOR is activated, it can form acomplex with downstream receptors to promote Akt phosphorylation, which can facilitate the expressionof Bcl-2 (anti-apoptotic protein) and inhibit the expression of Bax (pro-apoptotic protein).
E-cadherin protein can inhibit the invasion of cancer cells, while N-cadherin has an opposite effect.Activation of Akt inhibits the expression of E-cadherin, but facilitates the expression of N-cadherin, thuspromoting the invasion of lung adenocarcinoma cells [11–14]. MicroRNA has been a hot topic in recentyears, especially in the �eld of cancer research. Via bioinformatics prediction, we found that there is atargeting relationship between miR-186 and Shp2. Previous studies have reported that miR-186 is down-

Page 3/18
regulated in non-small lung cancer, colon cancer, cervical cancer and gastric cancer, and miR-186 caninhibit the migration and invasion of these cancers [15–19]. Therefore, we hypothesized that miR-186may down-regulate the expression of Shp2, in turn inhibiting the activation of PI3K/Akt/mTOR signalingpathway, so as to inhibit the proliferation, invasion and migration and promote the cell apoptosis of lungadenocarcinoma. Herein, we cultured SPC-A-1, a lung adenocarcinoma cell lines, and transfected the cellswith miR-186 mimic, miR-186 inhibitor, si-Shp2 and miR-186 inhibitor + si-Shp2, respectively, to detect theproliferation, migration, invasion and apoptosis of each group, so as to verify our hypothesis.
Methods
Dual-luciferase reporter assayThe analysis of miR-186 target gene was performed by using a biological prediction website(http://www.microrna.org/microrna/home.do), and the dual luciferase reporter assay was used to verifywhether Shp2 is a direct target gene of miR-186. The 3'-UTR gene fragment of the Shp2 gene was clonedand ampli�ed, and the PCR product was cloned into the multiple cloning site in downstream of theLuciferase gene of pmirGLO (Cat. E1330, Promega, USA), which were named Wt-Shp2. The predictedspeci�c binding site of miR-186 and Shp2 was mutated to construct the Mut-Shp2 vector. The Renillaluciferase pRL-TK vector (Cat. E2241, Promega, USA) was used as an internal reference. The luciferasereporter vector was co-transfected with miR-186 mimic and NC mimic into 293T cells, respectively. Theluciferase activity of each group was detected and compared.
Cell CultureIn this experimental study, Human lung adenocarcinoma cell line SPC-A-1 (purchased from ATCC, China)was cultured in a humidi�ed 5% CO2 incubator (Thromo 3111, Jinan Besun Medical Devices Co., Ltd.,Shandong, China) at 37 °C with RPMI 1640 medium (Gibco, USA) containing 10% fetal bovine serum(Gibco, USA), 50 U/ml penicillin (Gibco, USA), 100 µg/ml streptomycin (Gibco, USA) for 2 days, and thecells were passaged every 3 to 4 days.
Preparation Of Liposome ComplexesAfter 2 µl of 50 nmol/l miR-186 mimic, miR-186 inhibitor, si-Shp2 or NC (Shanghai Jima, China) wasrapidly centrifuged and mixed with 170 µl phosphate buffer (Thermo Fisher, USA), respectively, thesamples were stood for 5 min and 30 µl of Lipofectamine 2000 (Thermo Fisher, USA) were added. Finally,the samples were mixed thoroughly by gentle shaking, and then incubated for 20 min at roomtemperature.
Cell Grouping And Transfection
Page 4/18
SPC-A-1 cell line grown in log phase was inoculated into a 6-well culture plate at a density of 1*105
cells/well, and the cells were pretreated with DMEM medium without serum and antibiotics for one daybefore transfection. The cells were divided into 6 groups: Blank group (no treatment), NC group (negativecontrol, transfected with 50 nM si-NC + 50 nM mi-NC), miR-186 mimic group (transfected with 50 nM miR-186 mimic), miR-186 inhibitor group (transfected with 50 nM miR-186 inhibitor), si-Shp2 group(transfected with 50 nM si-Shp2) and miR-186 inhibitor + si-Shp2 group (transfected with 50 nM miR-186inhibitor and 50 nM si-Shp2). Transfection was carried out according to the instructions of Lipofectamine2000. After 6 h of transfection, the culture medium was replaced with RPMI1640 medium containing 10%fetal bovine serum. After transfection for 48 h, cells were harvested for subsequent experiments.
Qrt-pcrTotal RNA was extracted by Trizol (Thermo Fisher Scienti�c, New York, USA) from each group of cellsafter transfection for 48 h. PrimeScript™ RT reagent Kit with gDNA Eraser kit (TaKaRa, Japan) was usedfor the reverse transcription synthesis of cDNA. SYBR® Premix Ex Taq™ II Kit (Xingzhi Biotechnology Co.,Ltd., China) and ABI PRISM® 7300 (model Prism® 7300, Shanghai Kunke Instrument Equipment Co.,Ltd., China) were used for �uorescent quantitative real-time PCR detection. The reaction system waslisted as follows: 25 µl of SYBR® Premix Ex Taq™ II (2×), 2 µl of PCR upstream and downstream primers, lµl of ROX Reference Dye (50×), 4 µl of DNA template, 16 µl of ddH2O. The reaction conditions were asfollows: pre-denaturation at 95 °C for 10 min, denaturation at 95 °C for 15 sec, annealing at 60 °C for 30sec, 32 cycles, extended at 72 °C for 1 min. ∆Ct = CT (target gene) - CT (GAPDH), ∆∆Ct = ∆Ct (experimental group)
- ∆Ct (control group). miR-186 used U6 as internal reference and other genes adopted GAPDH as internal
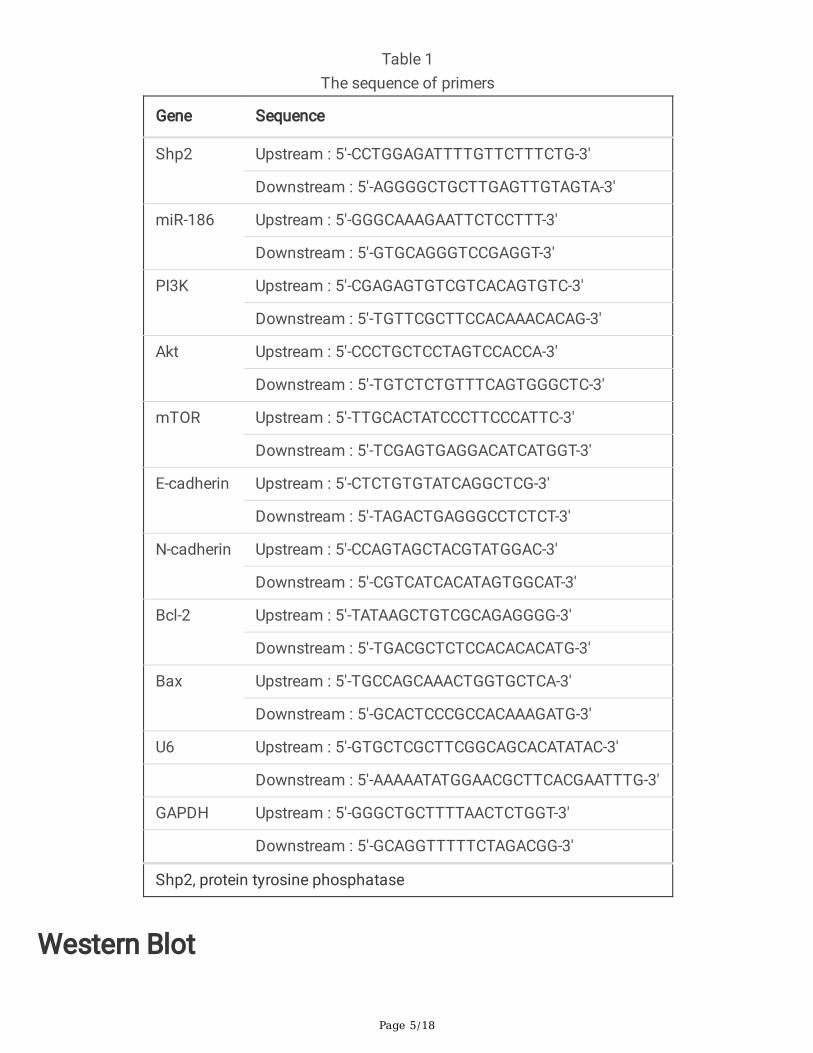
reference, and 2−ΔΔCt represents the relative expression level of target gene. The sequence of primers isshown in Table 1.
Page 5/18
Table 1The sequence of primers
Gene Sequence
Shp2 Upstream : 5'-CCTGGAGATTTTGTTCTTTCTG-3'
Downstream : 5'-AGGGGCTGCTTGAGTTGTAGTA-3'
miR-186 Upstream : 5'-GGGCAAAGAATTCTCCTTT-3'
Downstream : 5'-GTGCAGGGTCCGAGGT-3'
PI3K Upstream : 5'-CGAGAGTGTCGTCACAGTGTC-3'
Downstream : 5'-TGTTCGCTTCCACAAACACAG-3'
Akt Upstream : 5'-CCCTGCTCCTAGTCCACCA-3'
Downstream : 5'-TGTCTCTGTTTCAGTGGGCTC-3'
mTOR Upstream : 5'-TTGCACTATCCCTTCCCATTC-3'
Downstream : 5'-TCGAGTGAGGACATCATGGT-3'
E-cadherin Upstream : 5'-CTCTGTGTATCAGGCTCG-3'
Downstream : 5'-TAGACTGAGGGCCTCTCT-3'
N-cadherin Upstream : 5'-CCAGTAGCTACGTATGGAC-3'
Downstream : 5'-CGTCATCACATAGTGGCAT-3'
Bcl-2 Upstream : 5'-TATAAGCTGTCGCAGAGGGG-3'
Downstream : 5'-TGACGCTCTCCACACACATG-3'
Bax Upstream : 5'-TGCCAGCAAACTGGTGCTCA-3'
Downstream : 5'-GCACTCCCGCCACAAAGATG-3'
U6 Upstream : 5'-GTGCTCGCTTCGGCAGCACATATAC-3′
Downstream : 5′-AAAAATATGGAACGCTTCACGAATTTG-3′
GAPDH Upstream : 5'-GGGCTGCTTTTAACTCTGGT-3'
Downstream : 5'-GCAGGTTTTTCTAGACGG-3'
Shp2, protein tyrosine phosphatase
Western Blot

Page 6/18
After transfection for 48 h, the cells were digested and collected to extract total protein using RIPA lysatecontaining PMSF (R0010, Solarbio). The BCA kit (Thermo, Inc., USA) was used to measure the totalprotein concentration and deionized water was adopted to adjust the protein concentration. The samplewas mixed with the loading buffer, and boiled in water for 10 min. Protein samples (30 µl for each well)were loaded in each well and electrophoresis was carried out for 2 h at a constant voltage of 80 V. Theprotein was then transferred to a PVDF membrane (ISEQ00010, Millipore, Billerica, MA, USA) at a voltageof 110 V for 2 h. The proteins were blocked by 5% skim milk at 4 °C for 2 h. Then, the milk was discardedand the membrane was washed once with TBST. Subsequently, rabbit anti human primary antibodies,including Shp2 (ab32083, 1:2,000, Abcam, UK), PI3K (ab86714, 1:10,000, Abcam, UK), p-PI3K (ab86714,1:10,000, Abcam, UK), Akt (ab8805, 1:10,000, Abcam, UK), p-Akt phospho T308 (ab8805, 1:1,000, Abcam,UK), mTOR (ab2732, 1:2,000, Abcam, UK), p-mTOR phospho S2448 (ab131538, 1:1,000, Abcam, UK), E-cadherin (ab76055, 1:500, Abcam, UK), N-cadherin (ab18203, 1:1,000, Abcam, UK), Bax (ab32503, 1:1,000,Abcam, Cambridge, MA, UK), Bcl-2 (ab32124, 1:1,000, Abcam, UK), GAPDH (ab8226, 1:2,000, Abcam, UK)were added onto the membrane and the membrane was incubated at 4 °C overnight. After that, themembrane was washed by TBST for 3 times (10 min each time). Then, HRP-labeled goat anti-rabbit IgGantibody (Beijing Zhongshan Biotechnology Co., Ltd., diluted 1:5,000) was added and the membrane wasincubated at 37 °C for 1 h. After rinsing with TBST, the membrane was place on a clean glass plate,developed by ECL Fluorescence Detection Kit (Cat. No. BB-3501, Ameshame, UK), photographed by Bio-Rad image analysis system (BIO-RAD, USA) and analyzed by Image J software. The relative proteincontent and protein phosphorylation level were calculated by the gray value of the corresponding proteinband / the gray value of the GAPDH protein band and the amount of protein phosphorylated / totalprotein, respectively.
Mtt AssayAfter transfection for 48 h, the cells were collected and inoculated into 96-well plates at density of 3–6*103 cells/well. Each group had 6 duplicate wells. After transfection for 24 h, 48 h and 72 h, 20 µl of5 mg/ml MTT solution (Gibco, USA) was added to each well, and the plates were incubated for 4 h in thedark. Then, 100 µl of DMSO was added to each well, and the optical density (OD) of each well wasdetected at 570 nm by Microplate Spectrophotometer (NYW-96M, Beijing Noah Instrument Co., Ltd.,China). The cell viability curve was plotted with the time point as the abscissa and the OD value as theordinate.
Flow CytometryDetection of cell cycle: Cells were collected after transfection for 48 h and washed for three times withPBS, then the cells were centrifuges at 1,000 xg for 20 min. After discarding the supernatant, cellconcentration was adjusted to 1*105/ml by PBS and 1 ml of 75% ethanol which were pre-cold at -20 °Cwere added to �x cells at 4 °C for 1 h. Then, the samples were centrifuged at 200 xg for 5 min and

Page 7/18
washed twice with PBS. Subsequently, 100 µl of Rnase A (Siemo, USA) was added and the samples wereincubated in a water bath at 37 °C for 30 min in the dark surrounding. After that, 400 µl of PI (Sigma,USA) were mixed into the samples to dye the cells for 30 min at 4 °C in the dark surrounding. FlowCytometer (Beckman Coulter, USA) was used to record the red �uorescence detected at 488 nm toanalyzed the cell cycle of cells in each group.
Detection of apoptosis: After transfection for 48 h, the cells were digested with trypsin (Semer�y, USA)without EDTA and collected in a �ow tube, then the sample was centrifuged at 1,000 xg for 30 min, andthen the supernatant was discarded. The cells were washed for 3 times with cold PBS, centrifuged at1,000 xg for 15 min, and then the supernatant was discarded. HEPES buffer, Annexin-V-FITC and PI and(50:1:2) were mix as Annexin-V-FITC/PI dye solution according to the instruction of Annexin-V-FITCApoptosis Detection Kit (Sigma, USA). The sample was added with 100 µl of the dye solution and thesolution was mixed and stood at room temperature for 15 min. Then, 1 ml of HEPES buffer (Sermer�y,USA) were added and the solution was mixed by shaking. Apoptosis was detected by �ow cytometer withan excitation wavelength at 488 nm.
Wound Healing AssayAfter transfection for 48 h, the cells were collected and seeded at a density of 5*105 cells/well in a 6-wellplate. When the cell growth fusion reached 90%, use a sterile tip to gently traverse the central axis of thewell. The width of each scratch is consistent. The cells were continuously cultured by adding serum-freemedium, and the cells were photographed at 0 h and 24 h after the scratches, and the cell migrationdistance was measured by Image-Pro Plus Analysis software (Media Cybernetics, USA), and multiple�elds of view were randomly selected and photographed. Set 3 duplicate wells in each group.
Transwell AssayTranswell chamber (Shanghai Kelton Bio, China) was placed in a 96-well plate, and the upper suface ofthe bottom membrane of the Transwell chamber was coated with Matrigel gel (Shanghai QianchenBiotechnology, China) at 1:8 dilution, and air-dried at room temperature. Each group of cells was routinelydigested and rinsed with PBS twice and resuspended by RPMI 1640 medium to adjusted the cell densityto 1*105 cells/ml. Then, 200 µl of cell suspension was added to the upper surface of the bottommembrane of the Transwell chamber and 600 µl of RPMI 1640 medium containing 20% fetal bovineserum (Gibco, USA) was added to the lower chamber. After routine culture for 24 h, the Transwell chamberwas taken out and the cells on the upper surface were wiped with a cotton swab and then the chamberwere �xed with 4% paraformaldehyde (Beijing Reagan Bio, China) for 15 min and stained with 0.5%crystal violet solution (Beijing Solebao Bio, China) for 15 min. After washed for 3 times with PBS, thechamber was photographed with an inverted microscope and 5 �elds (200×) were randomly selected tocount transmembrane cells.

Page 8/18
Statistical analysisAll data were processed by using SPSS 21.0 statistical software. The measurement data were expressedas mean ± standard deviation. One-way ANOVA were adopted for the comparison among groups andTukey post-hoc test was used for pairwise comparison between groups. P < 0.05 indicated a signi�cantdifference.
Results
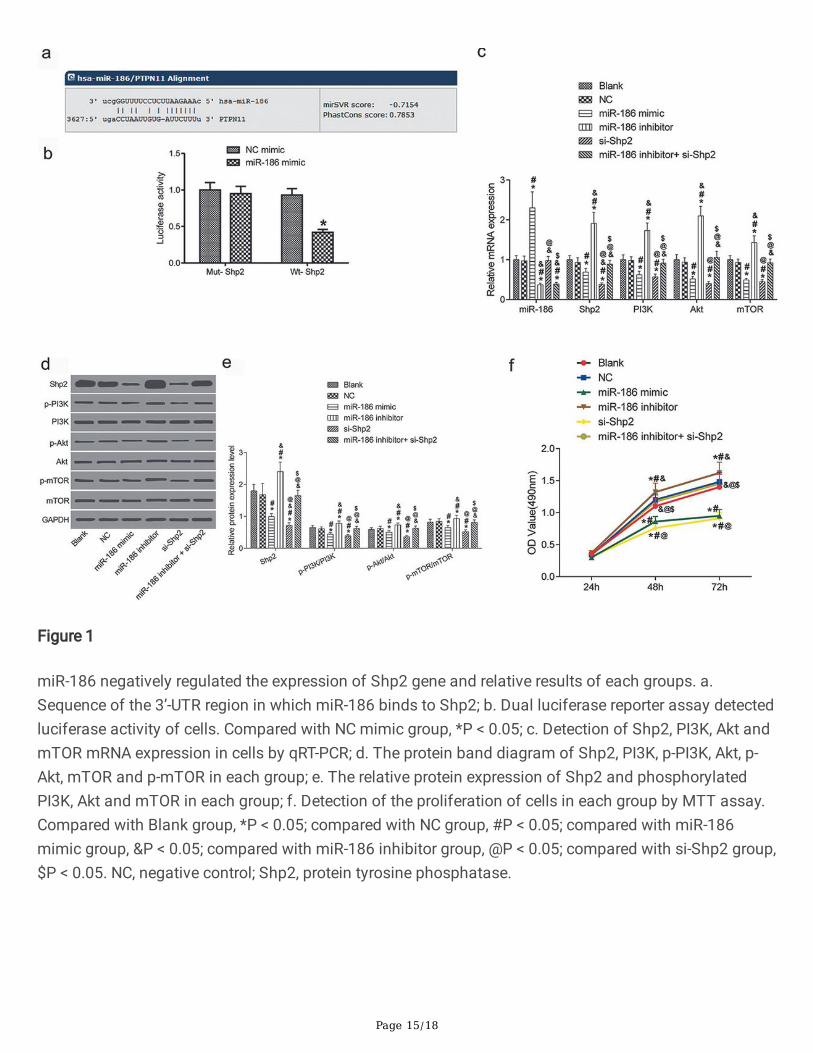
miR-186 targeted and negatively regulated the expressionof Shp2 geneThe biological prediction website microrna.org (http://www.microrna.org/microrna/home.do) predictedthat miR-186 had a speci�c binding site with Shp2 (also known as PTPN11, Fig. 1a). According to theresult of dual luciferase reporter assay (Fig. 1b), the miR-186 mimic transfected group showed a lowerluciferase activity of Wt-Shp2 group, compared with the NC mimic group (P < 0.05). The luciferaseactivity of Mut-Shp2 group was not signi�cant different between the two groups (P > 0.05). Therefore,miR-186 could target and negatively regulate the expression of the Shp2 gene.
Expression of Shp2, PI3K, Akt and mTOR mRNA in eachgroupTo investigate how miR-186 targeted the Shp2 gene and mediated mTOR signaling pathway to affect thebiological activity of lung adenocarcinoma cells, we detected the mRNA expression of miR-186, Shp2,PI3K, Akt and mTOR by qRT-PCR (Fig. 1c). Compared with the Blank group, there was no signi�cantdifference in the expression of each gene in the NC group (P > 0.05); the mRNA expression levels of Shp2,PI3K, Akt and mTOR were signi�cantly decreased in the miR-186 mimic group (P < 0.001, P = 0.016, P =0.001, P < 0.001) and the si-Shp2 group (P < 0.001, P = 0.004, P < 0.001, P < 0.001), which weresigni�cantly increased in the miR-186 inhibitor group (P < 0.001, P < 0.001, P < 0.001, P = 0.004); miR-186was signi�cantly increased in the miR-186 mimic group (P < 0.001) and was signi�cantly lowered in themiR-186 inhibitor group (P < 0.001) and miR-186 inhibitor+ si-Shp2 (P < 0.001). Compared with the miR-186 inhibitor group, the mRNA expression levels of PI3K, Akt and mTOR in the miR-186 inhibitor+si-Shp2group were signi�cantly lower (all P < 0.001).
Expression of Shp2 protein and phosphorylation proteins ofPI3K, Akt and mTOR in each groupAs shown in Fig. 1d, e, there was no evidently difference in the expression of each protein in the NC groupcompared with the Blank group (P > 0.05). Compared with the Blank group, the expression of Shp2

Page 9/18
protein and phosphorylation level of PI3K, Akt and mTOR proteins were decreased in the miR-186 mimicgroup (P < 0.001, P = 0.032, P = 0.021, P = 0.041) and the si-Shp2 group (P < 0.001, P = 0.014, P = 0.025,P = 0.006), which were signi�cantly increased in the miR-186 inhibitor group (P < 0.001, P = 0.081, P =0.007, P = 0.009). Compared with the miR-186 inhibitor group, phosphorylation level of PI3K, Akt andmTOR proteins was signi�cantly decreased in the miR-186 inhibitor+si-Shp2 group (P = 0.006, P = 0.029,P = 0.009).
Detection of the proliferation of cells in each group by MTTassayAs shown in Fig. 1f, the results of MTT assay showed that compared with the Blank group, there was nosigni�cant difference in cell proliferation in the NC group and the miR-186 inhibitor+si-Shp2 group (P >0.05), however, at 48h and 72 h after transfection, the proliferation ability of miR-186 mimic group (P =0.009, P < 0.001) and si-Shp2 group (P = 0.006, P < 0.001) were signi�cantly decreased, which wassigni�cantly enhanced in the miR-186 inhibitor group (P = 0.015, P = 0.015). Compared with the miR-186inhibitor group, the cell proliferation ability of the miR-186 inhibitor+ si-Shp2 group was signi�cantlydecreased (P = 0.005, P = 0.004).
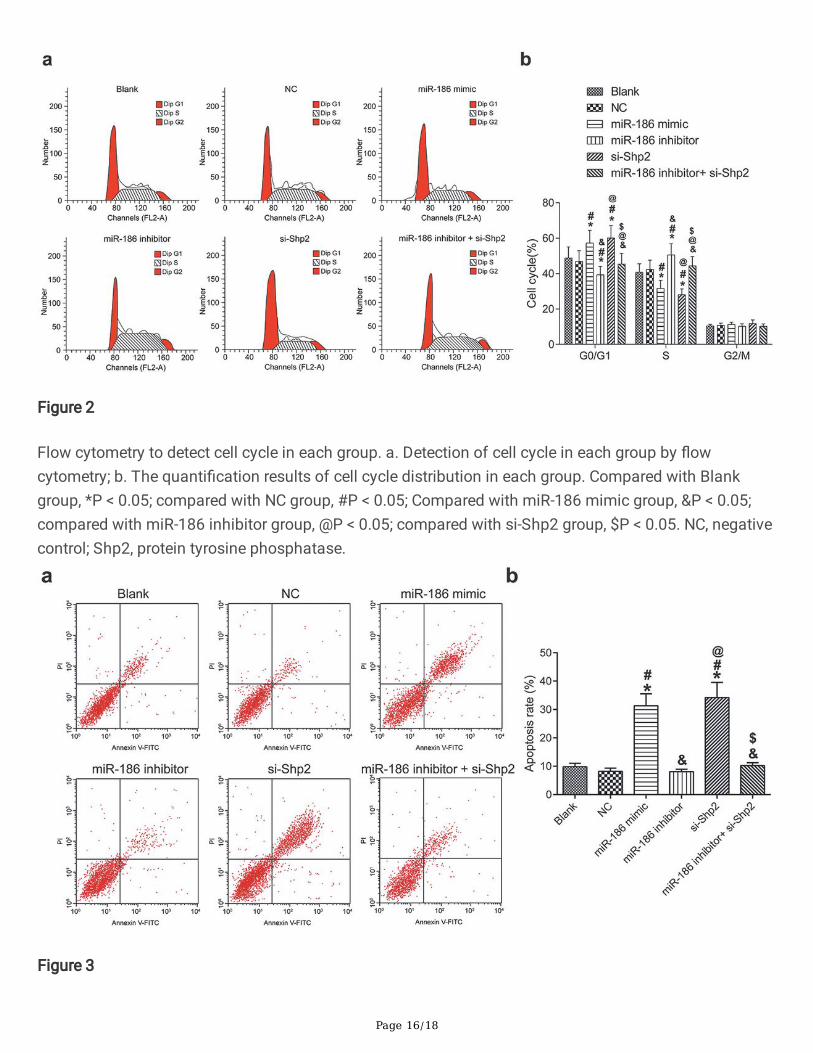
Flow cytometry to detect the cell cycle and apoptosis rateof each groupAs shown in Fig. 2, the results of �ow cytometry showed that compared with the Blank group, there wasno signi�cant difference in the NC group and the miR-186 inhibitor+si-Shp2 group (P > 0.05), however, theproportion of cells in G1 phase in miR-186 mimic group (P = 0.027) and si-Shp2 group (P = 0.061)increased signi�cantly, and the proportion of cells in S phase (P = 0.018, P = 0.002) decreasedsigni�cantly, while the miR-186 inhibitor group showed an opposite trend (P = 0.016, P = 0.015).Compared with the miR-186 inhibitor group, the proportion of cells in the G1 phase was signi�cantlyincreased but the proportion of cells in the S phase was signi�cantly decreased in the miR-186 inhibitor+si-Shp2 group (P = 0.006, P = 0.006).
The apoptosis rate was also detected by �ow cytometry (Fig. 3). The results showed that compared withthe Blank group, there was no signi�cant difference in apoptosis rate in the NC group and the miR-186inhibitor+si-Shp2 group (P > 0.05), however, the apoptosis rate of miR-186 mimic group (P < 0.001) andsi-Shp2 group (P < 0.001) was signi�cantly increased, which was obviously decreased in the miR-186inhibitor group when compared with miR-186 mimic group (P < 0.001).
Detection of cell migration in each group by wound healingassay

Page 10/18
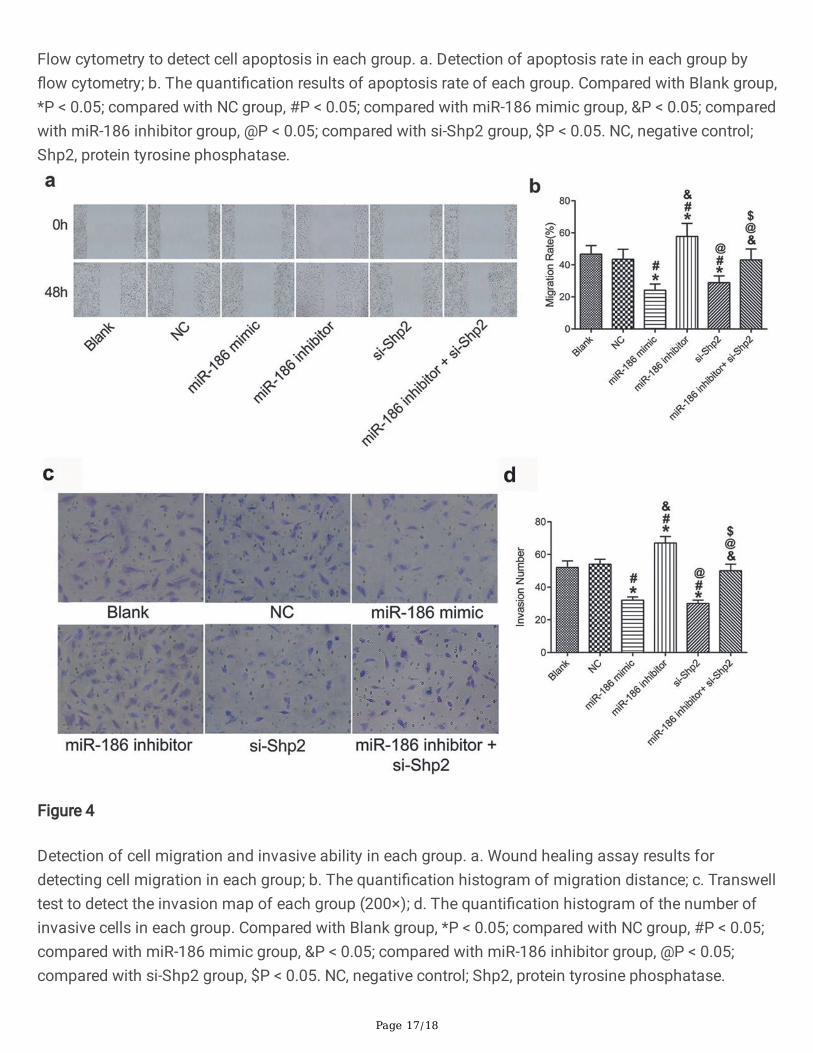
The cell migration ability was observed by the wound healing assay (Fig. 4a, b). The results showed thatcompared with the Blank group, there was no signi�cant difference in cell migration ability in the NCgroup and the miR-186 inhibitor+si-Shp2 group (P > 0.05), however, the migration ability of miR-186mimic group (P = 0.006) and si-Shp2 group (P = 0.029) was signi�cantly decreased, which was obviouslyincreased in the miR-186 inhibitor group when compared with miR-186 mimic group (P < 0.001).Compared with the miR-186 inhibitor group, the migration ability of miR-186 inhibitor+si-Shp2 group wassigni�cantly decreased (P = 0.019).
Transwell assay to detect cell invasion in each groupThe Transwell assay was used to detect the invasive ability of each group (Fig. 4c, d). The results showedcompared with the Blank group that there was no signi�cant difference in cell invasion in the NC groupand the miR-186 inhibitor+si-Shp2 group (P > 0.05), however, the number of invasive cells in miR-186mimic group (P < 0.001) and si-Shp2 group (P < 0.001) was signi�cantly decreased, which was obviouslyincreased in the miR-186 inhibitor group when compared with miR-186 mimic group (P < 0.001).Compared with the miR-186 inhibitor group, the number of invasive cells in the miR-186 inhibitor+si-Shp2group was signi�cantly decreased (P < 0.001).
Expression level of E-cadherin, N-cadherin, Bcl-2 and BaxmRNA and protein in each groupTo investigate how Shp2 gene silencing mediates the effect of mTOR signaling pathway on the biologicalactivity of lung adenocarcinoma cells, we examined mRNA and protein expression levels of epithelial-mesenchymal transition-related factors E-cadherin and N-cadherin, and apoptosis-related factor Bcl-2 andBax by qRT-PCR and western blot (Fig. 5). The results showed that compared with the Blank group, therewas no obviously difference in the mRNA and protein expression levels of each parameter in NC groupand miR-186 inhibitor + si-Shp2 group (P > 0.05), however, the mRNA and protein expression levels of N-cadherin and Bcl-2 in miR-186 mimic group (RNA: P = 0.010, P < 0.001; protein: P = 0.001, P < 0.001) andsi-Shp2 group (RNA: P = 0.024, P = 0.006; protein: both P < 0.001) were signi�cantly decreased and theexpression levels of E-cadherin (RNA: both P < 0.001; Protein: both P < 0.001) and Bax (RNA: both P <0.001; protein: both P < 0.001) were increased, while the miR-186 inhibitor group showed an oppositetrend in above parameters when compared with miR-186 mimic group (RNA: all P < 0.001; protein: all P <0.001). Compared with the miR-186 inhibitor group, the mRNA and protein expression levels of N-cadherinand Bcl-2 mRNA in the miR-186 inhibitor+si-Shp2 group (RNA: both P = 0.002; protein: all P < 0.001) weresigni�cantly decreased, and the mRNA and protein expression levels of E-cadherin and Bax wereincreased (RNA: both P = 0.037; protein: P = 0.038, P = 0.029).
Discussion
Page 11/18
In China, patients with lung adenocarcinoma account for a large proportion of people suffering fromcancer, moreover, the current death rate of lung adenocarcinoma patients is extremely high, of which theoccurrence and development is seriously affecting human health [20–23]. However, the molecularmechanisms involved in adenocarcinoma cells have not yet been fully elucidated now, exploring whichtherefore has far-reaching implications for the treatment of patients with lung adenocarcinoma.
Previous study has con�rmed that the expression of Shp2 is elevated in lung cancer, which can promotethe expression of the downstream molecular, PI3K, by activating Ras pathway, leading to the activation ofthe PI3K/Akt/mTOR signaling pathway, which can further facilitate the expression of Bcl-2 and N-cadherin, while inhibit the expression of Bax and E-cadherin, thus to affect the cell biologicalcharacteristics such as migration, apoptosis, proliferation and invasion in lung adenocarcinoma cells[24–26]. In the study, we used the SPC-A-1, a lung adenocarcinoma cell line, to silence the expression ofShp2 and our results showed that silencing of Shp2 inhibited the expression of PI3K/Akt/mTOR signalingpathway, thereby inhibiting the proliferation, migration and invasion, blocking the cell cycle progressionand promoting apoptosis of lung adenocarcinoma cells. This is consistent with the previously reportedliterature results.
To further explore the mechanism of upstream signaling of Shp2, we predicted the targeting relationshipbetween miR-186 and Shp2 through the website. It’s reported that miR-186 inhibits the development ofnon-small lung cancer, colon cancer, cervical cancer and gastric cancer [27–30]. In our study, dualluciferase reporter assay con�rmed that miR-186 negatively regulates Shp2 gene. We then transfectedmiR-186 mimic, miR-186 inhibitor, miR-186 inhibitor + si-Shp2 into SPC-A-1 cell line and the resultsshowed that overexpression of miR-186 inhibited proliferation, migration and invasion and promotedapoptosis of lung adenocarcinoma cells, however, silencing of miR-186 had an opposite effect. Moreover,silencing Shp2 can reverse the development of lung adenocarcinoma caused by miR-186 silencing.
ConclusionsWe demonstrated that miR-186 can achieve targeted inhibition of Shp2 expression, thereby inhibiting theexpression of PI3K/Akt/mTOR signaling pathway, to inhibit the proliferation, invasion and migration andpromote apoptosis of lung adenocarcinoma cells. This study further clari�ed the developmentmechanism of lung adenocarcinoma and laid a theoretical foundation for the treatment of clinical lungadenocarcinoma. In the further, we need to perform in vivo experiments to further verify the above results.Additionally, the exact mechanisms for inhibition of Shp2 by miR-186 and the targeted regulatory networkof miR-186 in lung adenocarcinoma is still unclear.
AbbreviationsShp2: protein tyrosine phosphatase
Declarations

Page 12/18
Ethics approval and consent to participate
Not applicable.
Consent for publication
Not applicable.
Availability of data and material
The datasets used and analyzed during the current study are available from the corresponding author onreasonable request.
Competing interests
The authors declare that they have no competing interests.
Funding
This work was supported by Key Project of the Medical Science Research of the Health Department ofHebei Province (No. 20130289).
Authors' Contributions
Conception and design: LMG and SFX. Administrative support: SHY. Provision of study materials: JLC.Collection and assembly of data: LZ. Data analysis and interpretation: LYK, PW. All authors read andapproved the �nal manuscript.
Acknowledgements
Not applicable.
References1. Chen YH, Zhou BY, Wu GC, Liao DQ, Li J, Liang SS, et al. Effects of exogenous IL-37 on the biological
characteristics of human lung adenocarcinoma A549 cells and the chemotaxis of regulatory T cells.Cancer Biomarkers. 2018;21:661-673.
2. Li M O. Author Correction: Comprehensive molecular pro�ling of lung adenocarcinoma. Nature.2018;559:E12.
3. Li X, Wang HY, Ni QG, Ni J, Xu L, Huang H, et al. Effects of silencing Rab27a gene on biologicalcharacteristics and chemosensitivity of non-small cell lung cancer. Oncotarget. 2017;8:94481-94492.
4. Olbromski M, Rzechonek A, Grzegrzolka J, Glatzel-Plucinska N, Chachaj A, Werynska B, et al.In�uence of miR-7a and miR-24-3p on the SOX18 transcript in lung adenocarcinoma. Oncol Rep.2018;39:201-208.

Page 13/18
5. Karki R, Man SM, Malireddi RKS, Kesavardhana S, Zhu Q, Burton AR, et al. NLRC3 is an inhibitorysensor of PI3K-mTOR pathways in cancer. Nature. 2017;540:583-587.
�. Dong LY, Pu YN, Zhang LN, Qi Q, Xu L, Li W, et al. Human umbilical cord mesenchymal stem cell-derived extracellular vesicles promote lung adenocarcinoma growth by transferring miR-410. CellDeath Dis. 2018;9:218.
7. Zhang Y, Kwok-Shing Ng P, Kucherlapati M, Chen F, Liu Y, Tsang YH, et al. A Pan-CancerProteogenomic Atlas of PI3K/Akt/mTOR Pathway Alterations. Cancer cell. 2017;31:820.
�. Dey N, De P, Leyland-Jones B. PI3K-Akt-mTOR inhibitors in breast cancers: From tumor cell signalingto clinical trials. Pharmacol Ther. 2017;175:91.
9. Feng H, Wang M, Wu C, Yu J, Wang D, Ma J, et al. High scavenger receptor class B type I expressionis related to tumor aggressiveness and poor prognosis in lung adenocarcinoma: A STROBEcompliant article. Medicine. 2018;97:e0203.
10. Yamasaki M, Funaishi K, Saito N, Sakano A, Fujihara M, Daido W, et al. Putative lungadenocarcinoma with epidermal growth factor receptor mutation presenting as carcinoma ofunknown primary site: A case report. Medicine. 2018;97:e9942.
11. Song NY, Zhu F, Wang Z, Willette-Brown J, Xi S, Sun Z, et al. IKKα inactivation promotes Kras-initiatedlung adenocarcinoma development through disrupting major redox regulatory pathways. Proc NatlAcad Sci U S A. 2018;115:201717520.
12. Zhu YC, Zhou YF, Wang WX, Xu CW, Zhuang W, Du KQ, et al. A novel ROS1 oncogenic fusion variantin lung adenocarcinoma identi�ed by next-generation sequencing. Thorac Cancer. 2018;9:652-655.
13. Li D, Yang W, Zhang J, Yang JY, Guan R, Yang MQ. Transcription Factor and lncRNA RegulatoryNetworks Identify Key Elements in Lung Adenocarcinoma. Genes. 2018;9:12.
14. Denisenko TV, Budkevich IN, Zhivotovsky B. Cell death-based treatment of lung adenocarcinoma. CellDeath Dis. 2018;9:117.
15. Lin J, Ma JC, Yang J, Yin JY, Chen XX, Guo H, et al. Arresting of miR-186 and releasing of H19 byDDX43 facilitate tumorigenesis and CML progression. Oncogene. 2018;37:2432-2443.
1�. Su BB, Zhou SW, Gan CB, Zhang XN. MiR-186 inhibits cell proliferation and invasion in humancutaneous malignant melanoma. J Cancer Res Ther. 2018;14:60.
17. Li H, Yin C, Zhang B, Sun Y, Shi L, Liu N, et al. PTTG1 promotes migration and invasion of humannon-small cell lung cancer cells and is modulated by miR-186. Carcinogenesis. 2013;34:2145-2155.
1�. Wei L, Cui LX, Zhao XB. miR-186 down-regulate EGFR expression and affect on proliferation andinvasion of cervical cancer. Progress in Obstetrics & Gynecology. 2018;30:155-158.
19. Chang Z, Cui J, Song Y. Long noncoding RNA PVT1 promotes EMT via mediating microRNA-186targeting of Twist1 in prostate cancer. Gene. 2018;654.
20. Magara K, Takasawa A, Osanai M, Ota M, Tagami Y, Ono Y, et al. Elevated expression of JAM-Apromotes neoplastic properties of lung adenocarcinoma. Cancer Science. 2017;108:2306-2314.

Page 14/18
21. Zhang XD, Liu DR. Correlation between the new lung adenocarcinoma classi�cation and epidermalgrowth factor receptor mutation. Journal of Peking University (Health Sciences). 2018;50:640-644.
22. Niegisch G, Albers P. Targeting mTOR in urothelial cancer-Beating a dead horse or ready for primetime. Urologic Oncology. 2017;35:S1078143917303460.
23. Ichikawa T, Saruwatari K, Mimaki S, Sugano M, Aokage K, Kojima M, et al. Immunohistochemical andgenetic characteristics of lung cancer mimicking organizing pneumonia. Lung Cancer. 2017;113:134-139.
24. Kuban-Jankowska A, Sahu KK, Gorska-Ponikowska M, Tuszynski JA, Wozniak M. Inhibitory Activityof Iron Chelators ATA and DFO on MCF-7 Breast Cancer Cells and Phosphatases PTP1B and Shp2.Anticancer Research. 2017;37:4799-4806.
25. Bondeson ML. Key insights into the protein tyrosine phosphatase PTPN11/Shp2 associated withnoonan syndrome and cancer. Human Mutation. 2017;38:337.
2�. Yang L, Sun L, Wang W, Xu H, Li Y, Zhao JY, et al. Construction of a 26‐feature gene support vectormachine classi�er for smoking and non‐smoking lung adenocarcinoma sample classi�cation.Molecular Medicine Reports. 2018;17:3005-3013.
27. Khachigian LM. The Yin and Yang of YY1 in tumor growth and suppression. International Journal ofCancer. 2018;143:460-465.
2�. Wu R, Shen D, Sohun H, Ge D, Chen X, Wang X, et al. miR‐186, a serum microRNA, induces endothelialcell apoptosis by targeting SMAD6 in Kawasaki disease. International Journal of MolecularMedicine. 2018;41:1899-1908.
29. Chen ML, Lin K, Lin SK. NLRP3 in�ammasome signaling as an early molecular response isnegatively controlled by miR-186 in CFA-induced prosopalgia mice. Brazilian journal of medical andbiological research. 2018;51:e7602.
30. Xiao Q, Wei Z, Li Y, Zhou X, Chen J, Wang T, et al. miR-186 functions as a tumor suppressor inosteosarcoma cells by suppressing the malignant phenotype and aerobic glycolysis. Oncol Rep.2018; 39:2703-2710.
Figures
Page 15/18
Figure 1
miR-186 negatively regulated the expression of Shp2 gene and relative results of each groups. a.Sequence of the 3’-UTR region in which miR-186 binds to Shp2; b. Dual luciferase reporter assay detectedluciferase activity of cells. Compared with NC mimic group, *P < 0.05; c. Detection of Shp2, PI3K, Akt andmTOR mRNA expression in cells by qRT-PCR; d. The protein band diagram of Shp2, PI3K, p-PI3K, Akt, p-Akt, mTOR and p-mTOR in each group; e. The relative protein expression of Shp2 and phosphorylatedPI3K, Akt and mTOR in each group; f. Detection of the proliferation of cells in each group by MTT assay.Compared with Blank group, *P < 0.05; compared with NC group, #P < 0.05; compared with miR-186mimic group, &P < 0.05; compared with miR-186 inhibitor group, @P < 0.05; compared with si-Shp2 group,$P < 0.05. NC, negative control; Shp2, protein tyrosine phosphatase.
Page 16/18
Figure 2
Flow cytometry to detect cell cycle in each group. a. Detection of cell cycle in each group by �owcytometry; b. The quanti�cation results of cell cycle distribution in each group. Compared with Blankgroup, *P < 0.05; compared with NC group, #P < 0.05; Compared with miR-186 mimic group, &P < 0.05;compared with miR-186 inhibitor group, @P < 0.05; compared with si-Shp2 group, $P < 0.05. NC, negativecontrol; Shp2, protein tyrosine phosphatase.
Figure 3
Page 17/18
Flow cytometry to detect cell apoptosis in each group. a. Detection of apoptosis rate in each group by�ow cytometry; b. The quanti�cation results of apoptosis rate of each group. Compared with Blank group,*P < 0.05; compared with NC group, #P < 0.05; compared with miR-186 mimic group, &P < 0.05; comparedwith miR-186 inhibitor group, @P < 0.05; compared with si-Shp2 group, $P < 0.05. NC, negative control;Shp2, protein tyrosine phosphatase.
Figure 4
Detection of cell migration and invasive ability in each group. a. Wound healing assay results fordetecting cell migration in each group; b. The quanti�cation histogram of migration distance; c. Transwelltest to detect the invasion map of each group (200×); d. The quanti�cation histogram of the number ofinvasive cells in each group. Compared with Blank group, *P < 0.05; compared with NC group, #P < 0.05;compared with miR-186 mimic group, &P < 0.05; compared with miR-186 inhibitor group, @P < 0.05;compared with si-Shp2 group, $P < 0.05. NC, negative control; Shp2, protein tyrosine phosphatase.

Page 18/18
Figure 5
Expression level of E-cadherin, N-cadherin, Bcl-2 and Bax expression in each group. a. Expression level ofE-cadherin, N-cadherin, Bcl-2 and Bax mRNA in each group; b. Protein band diagram of E-cadherin, N-cadherin, Bcl-2 and Bax in each group; c: A quanti�cation histogram of protein levels of E-cadherin, N-cadherin, Bcl-2 and Bax in each group. Compared with Blank group, *P < 0.05; compared with NC group,#P < 0.05; compared with miR-186 mimic group, &P < 0.05; compared with miR-186 inhibitor group, @P <0.05; compared with si-Shp2 group, $P < 0.05. NC, negative control; Shp2, protein tyrosine phosphatase.