mirrors or windows
TRANSCRIPT

How Well Do Large City Public Schools Overcome the Effects of Poverty and Other Barriers?
June 2021
MIRRORSOR
WINDOWS

ABOUT THE COUNCIL
The Council of the Great City Schools is the only national organization exclusively representing the needs of America’s urban public-school districts. Composed of 77 large city school districts, the organization’s mission is to promote the cause of urban schools and to advocate for inner-city students through legislation, research, instructional support, leadership, management, technical assistance, and media relations. The organization also provides a network for school districts sharing common problems to exchange information and to collectively address new challenges as they emerge to deliver the best education for urban youth.
Chair of the BoardMichael O’NeillSchool Committee, Boston Public Schools
Chair-ElectBarbara JenkinsSuperintendent, Orange County Public Schools
Secretary/Treasurer Kelly Gonez School Board, Los Angeles Unified School District
Immediate Past Chair Eric Gordon CEO, Cleveland Metropolitan School District
Executive Director Michael Casserly Council of the Great City Schools

Mirrors or Windows: How Well Do Large City Public Schools Overcome
the Effects of Poverty and Other Barriers?
Michael CasserlyRay Hart
Amanda CorcoranMoses PalaciosRenata LyonsEric Vignola
WithRicki Price-Baugh
Robin HallDenise Walston
June 2021

4 MIRRORS OR WINDOWS: HOW WELL DO LARGE CITY PUBLIC SCHOOLS OVERCOME THE EFFECTS OF POVERTY AND OTHER BARRIERS?
Executive Summary ................................................................................................................................................. 5
Introduction ................................................................................................................................................................ 7
Demographics of Large City Schools and All Others ..................................................................................... 9
Research Questions and Summary of Methodology ...................................................................................... 15
Analysis of NAEP Data ............................................................................................................................................ 18a. Trends on Scale Scores: Large City Schools vs. All Others ..................................................................... 18b. Trends on Adjusted Scale Scores: Large City Schools vs. All Other Schools.................................... 20c. City-by-City Results: Actual vs. Expected (Adjusted) Mean NAEP Performance ............................... 25d. City-by-City Trends ................................................................................................................................................ 39
Mitigating Circumstances ....................................................................................................................................... 41a. Influence of Abject and Concentrated Poverty ............................................................................................ 41b. Historical and Racial Context ............................................................................................................................. 44c. Effects of College- and Career-Ready Standards ........................................................................................ 45
Case Studies: How Districts Improved ............................................................................................................... 53
Discussion and Conclusions ................................................................................................................................. 71
Appendices ................................................................................................................................................................ 74Appendix A. Detailed Methodology ..................................................................................................................... 74Appendix B. Bibliography ........................................................................................................................................ 81
Table of Contents
This work is licensed under a Creative Commons Attribution-NonCommercial- NoDerivatives 4.0 International License (https://creativecommons.org/licenses/by-nc-nd/4.0/).This license allows noncommercial redistribution with credit to the Council of the Great City Schools.

5COUNCIL OF THE GREAT CITY SCHOOLS
Education is often depicted as one of the best ways out of poverty. At the same time, research over many decades finds that most educational outcomes are strongly correlated to poverty. It is not likely that these two themes are true at the same time. Either schools are windows of opportunity and help overcome or mitigate poverty and other barriers or they are mirrors of society’s inequities. Our question in this report is a straightforward one: Are urban public schools, which have the largest numbers and concentrations of poor students in the nation, windows or mirrors?
The Council of the Great City Schools used the latest ten years of data in reading and mathematics at the fourth- and eighth-grade levels from the National Assessment of Educational Progress (NAEP) to answer this question. What we found suggests that poverty was not necessarily destiny in urban public education. Students in Large City public schools scored higher than predicted on NAEP and showed greater district effects over the study period than other schools in the aggregate across the country. These Large City School students were about 50 percent more likely to be poor, twice as likely to be English learners, twice as likely to be Black or Hispanic, and about 50 percent more likely to have a parent who did not finish high school as students in All Other Schools. Specifically, the analysis showed that—
◆ Students in Large City Schools narrowed the gap with students in All Other Schools in both reading and math at fourth and eighth grade levels between 2003 and 2019 by a third to a half, depending on grade and subject.
◆ After considering differences in poverty, language status, race/ethnicity, disability, educational resources in the home, and parental education, Large City Schools had reading and mathematics scores on NAEP that were significantly above statistical expectations at both the fourth- and eighth-grade levels in 2019 (the latest year NAEP was administered) and in most years since 2009.
◆ After factoring in these variables, students in Large City Schools had significantly higher “district effects” on NAEP than students in All Other Schools in the aggregate.
◆ District effects in Large City Schools on NAEP were not significantly larger in 2019 than in 2009 in any grade/subject combination, although several city school systems showed significant gains over the period.
◆ If NAEP and college and career-readiness standards in mathematics were better aligned, then Large City Schools would have scored, on average, about 2.4 scale score points better in fourth-grade and 1.4 points better in eighth-grade in 2019.
Executive Summary

6 MIRRORS OR WINDOWS: HOW WELL DO LARGE CITY PUBLIC SCHOOLS OVERCOME THE EFFECTS OF POVERTY AND OTHER BARRIERS?
◆ Some Large City school districts showed larger district effects in mitigating poverty and other barriers than other Large City school districts.
To explore what drove district progress, the Council conducted site visits to six districts that seemed to do a better job than others in overcoming or mitigating barriers and two counterfactual districts. Case studies of these districts indicated that those who overcame barriers to some extent benefitted from many of the same strategies and characteristics, including strong and stable leadership that was uniquely focused on student instruction; high academic standards and well-defined instructional guidance and support; human capital strategies aimed at raising the capacity of leaders and teachers; the cohesion and differentiation of professional development; the ability to act at scale; strong accountability systems and cultures of collaboration; the ability to see opportunities in the challenges they faced; their district, school and special population strategies; and their community investments and engagement efforts.

7COUNCIL OF THE GREAT CITY SCHOOLS
One of the most consistent and long-standing relationships in social science research is the one between poverty and student academic performance. In nearly every case, the evidence demonstrates that student achievement declines as poverty rises. At least as far back as the Coleman report (1966), research has suggested that poor students do not do as well in school as students whose parents are better off financially and educationally. More recently, a study by Reardon (2016) showed similar results and concluded that the gap between high- and low-income students may have widened between the 1980s and the early 2000s.
At the same time, education has been depicted by countless politicians, philosophers, scientists, and advocates as the ticket out of poverty. Education is thought to be society’s main engine for smoothing out its inequities. In fact, Horace Mann (1848) once stated, “Education then, beyond all other devices of human origin, is the great equalizer of the conditions of men, the balance-wheel of the social machinery.” Schooling aspires to level the playing field for rich and poor alike. Immigrant and native born. But does it?
It is not likely that these two themes are true at the same time. Either schools help overcome poverty and other barriers, or they reflect those inequities. Either schools serve to perpetuate society’s inequities, or they serve to overcome them. Either schools work to level the playing field, or they keep opportunity at bay. Chicago journalist Sydney Harris (1978) once asserted, “The whole purpose of education is to turn mirrors into windows.”
Our question in this report is a straightforward one: Are urban public schools, which have the largest numbers and concentrations of poor students in the nation, mirrors or windows? Or are they something in between?
Do urban public schools overcome or mitigate poverty and other barriers like family background or language to any degree, or do they simply reflect them? Do urban public schools do a better job at mitigating the effects of poverty on achievement than other schools generally? Are urban school districts getting any better at overcoming these barriers over time or are they producing the same results they have always produced? Do some urban public-school districts do a better job at overcoming these variables than other urban school districts? Who are they? What is the difference between urban school districts that appear to be ‘beating the odds’ and those that are not progressing? What are these more effective urban school districts doing that other urban school districts are not doing? Finally, what lessons might we learn from districts that seem to be mitigating the effects of poverty and other barriers better than others?
Introduction

8 MIRRORS OR WINDOWS: HOW WELL DO LARGE CITY PUBLIC SCHOOLS OVERCOME THE EFFECTS OF POVERTY AND OTHER BARRIERS?
Why are these questions important? There are at least two reasons. One, the results may help us determine whether public education in cities and throughout the nation is a force for upward mobility. That is, does public education contribute to the expansion and strengthening of the middle class? Does it help lift people out of poverty and serve as a means for opportunity? This is critical because one of our national goals is to enhance the number of citizens in the middle class. It improves not only the quality of life for those individuals who are affected; it forms the backbone for the nation’s overall economic strength. In addition, the results could inform our broader notions of equity and where and how we should bear down harder. If public education serves as a lever for some people or groups but not others, we should know why and act accordingly.
Second, the global pandemic not only shuttered many public schools across the nation this last school year, particularly in our big cities, it also resulted in substantial unfinished learning for our students and it created the occasion by which we could rethink what works and does not work in public education. In other words, if public education is not producing the results we want, then now is the time to reimagine and redesign the system so that it produces better outcomes. This new analysis could help inform us about what does work—so far as it does—and should be kept, and what needs to change.
To conduct this analysis, the Council of the Great City Schools used student-level data from the National Assessment of Educational Progress (NAEP) for 2009 through 2019 (most recent available) and looked at not only poverty but also language status, parental education, disability, literacy materials in the home, and race/ethnicity to answer many of the questions above. We predict statistically what student results we would expect to see based on these variables, and we compare those predictions against actual results over six separate administrations of NAEP between 2009 and 2019.
In other words, we created a ‘value-added’ measure or ‘district effect’ using NAEP data to determine whether urban school districts are producing enough “educational torque” to mitigate poverty and other variables to any degree and to ascertain how they were doing it. We also look at districts that were not making as much progress and discuss their commonalities. In these ways, we attempt to discern whether public schools, and urban public education, in particular, is a force for upward social mobility or whether it simply reflects and perpetuates the inequities that society creates. Results from this study should help us define a path forward as we emerge from the global pandemic.

9COUNCIL OF THE GREAT CITY SCHOOLS
Members of the Council of the Great City Schools educate disproportionately large numbers of the nation’s students facing barriers to their educational success. The 77 cities whose school districts are members of the Council are home to about 19.4 percent of the U. S. population (63,744,443 of 328,239,523 est.). Their public-school districts enrolled about 7.5 million students in 2018-19, or about 15 percent of the nation’s public elementary and secondary school enrollment.
This report primarily looks at the educational performance of students in Large City Schools using data from the NAEP.1 In general, the Council’s membership comprises the bulk of the Large City Schools variable in NAEP, a variable that we use extensively in this report. Reading and mathematics performance on NAEP are controlled statistically for relevant background variables, i.e., race/ethnicity groups, school-level national school lunch program, Census poverty, students with disabilities, English language learners, literacy materials in the home, and parent education level for students in grade eight. Relevant background variables are defined in more detail in subsequent sections, but generally they were selected because previous research indicated that they consistently predicted student outcomes.
Our analysis looks at students in two distinct, mutually exclusive, and non-overlapping categories. We compare the results of the NAEP student sample2 in Large City Schools (public only) with the results from the NAEP student sample in All Other Schools, public and private. Both categories include charter schools identified within their jurisdictions. For charter schools, however, NAEP data only allows one to determine the charter status of a school but not its authorizing agency. Consequently, in this analysis, Large City Schools and All Other Schools include district-authorized charters, charters authorized by others, and independent charters. When looking at individual Trial Urban District Assessment (TUDA) districts, charters are included in those districts whose sample incorporates them, but they are excluded in districts where charters are independent and not counted in the district’s scores.
We start the analysis by looking at student demographic characteristics of Large City Schools and All Other Schools. One should keep in mind that the demographics of school types in the fourth-grade are slightly
1 Results on Large City Schools are for students in public schools located in the urbanized areas of cities with populations of 250,000 or more. Large City is not synonymous with “inner city.” Schools in participating TUDA districts are also included in the results for Large City Schools, even though some of these districts have schools that would otherwise not be defined as Large City Schools. Students in the TUDA districts represent about one-half of the students who attend Large City Schools nationally. The comparison to students in Large City Schools is made because the demographic characteristics of those students are most like the characteristics of students in urban districts. Both the districts and major cities overall generally have higher concentrations of Black or Hispanic students, lower-income students, and English learners than in the nation at large. 2 The descriptive statistics use the sample in mathematics in both fourth- and eighth-grades rather than the sample in English language arts, because the numbers of ELA test-takers are likely to be more skewed by testing exclusions related to English proficiency or disability status.
Demographics of Large City Schools and All Others

10 MIRRORS OR WINDOWS: HOW WELL DO LARGE CITY PUBLIC SCHOOLS OVERCOME THE EFFECTS OF POVERTY AND OTHER BARRIERS?
different from demographics in the eighth-grade. Exhibits 1 through 5 summarize major demographic characteristics of students in the two types of schools that we examined: students in Large City Schools and All Others. (When we refer in this report to Large City Schools and All Other Schools, we are referring to students in Large City Schools and All Other Schools.)
Data in Exhibit 1 show that Large City Schools had an aggregate fourth-grade enrollment in 2019 that was 24 percent Black, 44 percent Hispanic, and 19 percent White. The percentage of Black students in Large City Schools declined from 27 percent to 24 percent over the ten-year period, while Hispanic students increased slightly from 43 percent to 44 percent.3 The percentage of White students also declined somewhat.
By contrast, Black students made up about 13 percent of the fourth-grade enrollments of schools that were not in Large City Schools in 2019 (i.e., All Other Schools). Hispanic students made up approximately 23 percent and White students made up about 53 percent. Between 2009 and 2019, the proportion of White students in All Other Schools became lower and the proportion of Hispanic students became higher.
Exhibit 1. Percentages of NAEP Fourth-grade Mathematics Sample by Race/Ethnicity and Type of school (Large City and All Others), 2009 to 2019.
% BLACK % HISPANIC % WHITELarge City Schools2009 27% 43% 21%2011 25% 45% 20%2013 24% 44% 22%2015 22% 47% 20%2017 22% 46% 20%2019 24% 44% 19%All Others2009 14% 19% 61%2011 14% 20% 59%2013 14% 22% 58%2015 14% 22% 56%2017 13% 23% 54%2019 13% 23% 53%Source: NAEP Data Explorer (NDE) based on NAEP reported demographics for mathematics.
The NAEP data also show that the percent of fourth-grade students in Large City Schools who were free or reduced-price lunch (FRPL) eligible in 2019 was 68 percent, down slightly from 2009. (Exhibit 2.) The percent of these students in All Other Schools was 47 percent in 2019, an uptick from 43 percent in 2009. In other words, in 2019, the enrollment of FRPL students in Large City Schools was about 45 percent higher than that in All Other Schools.
3 These are the three largest racial and ethnic groups in the nation’s largest urban school systems. Asian American, Pacific Islander, Native American, and Native Alaskan students make up about 10 percent of the Great City Schools enrollment.

11COUNCIL OF THE GREAT CITY SCHOOLS
At the same time, we should note that FRPL rates dipped between 2009 and 2019 in Large City Schools over the same period when rates in All Other Schools increased. Others have called attention to the changing demographics of cities and the rising affluence of some urban communities.4 We have taken these changes into account in the statistical models by using the racial, language, and FRPL rates in each NAEP testing year.
In addition, NAEP data on fourth-grade English Language Learners (ELLs) show that these students made up 20 percent of the enrollment in Large City Schools in 2019, the same as in 2009. The enrollment of ELLs in All Other Schools was about ten percent in 2019, up from 2009 when it was 8 percent.
Finally, NAEP data in 2019 showed fourth-grade students with Individualized Education Plans (IEPs)5 comprised about 14 percent of the Large City School sample, the same as the All Other sample. Both school types showed increases in their proportions of IEP students over the study period, 2009 to 2019 (i.e., 11 percent to 14 percent in Large City Schools and 12 percent to 14 percent in All Others). Our analysis did not include data on each individual disability.
Exhibit 2. Percentages of NAEP Fourth-grade Mathematics Sample by FRPL-status, Language-status, and IEP Status and Type of School (Large City and All Others), 2009 to 2019.
% FRPL % ELLS % IEPSLarge City Schools2009 71% 20% 11%2011 74% 22% 11%2013 73% 20% 12%2015 74% 21% 13%2017 70% 21% 13%2019 68% 20% 14%All Others2009 43% 8% 12%2011 48% 9% 12%2013 50% 9% 13%2015 51% 10% 14%2017 47% 9% 13%2019 47% 10% 14%Source: NAEP Data Explorer (NDE) based on NAEP reported demographics for mathematics.
Eighth-grade NAEP data showed similar patterns as those in the fourth-grade, although the percentages were not precisely the same. (Exhibit 3.) Black students made up approximately 24 percent of students in Large City Schools and 12 percent of students in All Others. Both settings showed drops in the percent of Black students over the ten years. In addition, Hispanic students made up approximately 45 percent of the enrollments in Large City Schools in 2019, compared to 22 percent in All Others. The percent of Hispanic students in both settings increased between 2009 and 2019.
4 Florida, Richard. 2017. The New Urban Crisis: How Our Cities Are Increasing Inequality, Deepening Segregation, and Failing the Middle Class and What We Can Do About It. New York: Basic Books, 20175 NAEP uses the ID code IEP to include students with disabilities, IEPs, or those with 504 plans.

12 MIRRORS OR WINDOWS: HOW WELL DO LARGE CITY PUBLIC SCHOOLS OVERCOME THE EFFECTS OF POVERTY AND OTHER BARRIERS?
Finally, White students made up about 19 percent of eighth-grade enrollments in Large City Schools in 2019, compared with 55 percent of students in All Other Schools. The proportion of White students in both settings declined between 2009 and 2019.
Exhibit 3. Percentages of NAEP Eighth-grade Mathematics Sample by Race/Ethnicity and Type of School (Large City and All Others), 2009 to 2019.
% BLACK % HISPANIC % WHITELarge City Schools2009 26% 42% 22%2011 25% 44% 21%2013 25% 43% 21%2015 25% 44% 21%2017 21% 45% 21%2019 24% 45% 19%All Others2009 14% 17% 63%2011 14% 19% 60%2013 13% 20% 59%2015 13% 21% 58%2017 12% 21% 58%2019 12% 22% 55%Source: NAEP Data Explorer (NDE) based on NAEP reported demographics for mathematics.
At the eighth-grade level, the data also indicated that the portion of students who were FRPL-eligible in 2019 was slightly lower than that at the fourth-grade level in the same year in both Large City Schools and All Others. (Exhibit 4.) About 66 percent of eighth-graders in Large City Schools were FRPL eligible in 2019, as were 43 percent in All Other Schools. In other words, eighth-grade students in Large City Schools were about 53 percent more likely in 2019 to be poor than students in All Other Schools.
In addition, the eighth-grade data indicate that the percentages of ELL students in Large City Schools varied from 11 percent to 13 percent between 2009 and 2019. In All Other Schools, the percentages of ELLs ranged from four percent to six percent over the same period.
The percentage of eighth-grade IEP students in Large City Schools ranged from 11 percent to 13 percent between 2009 and 2019. (Exhibit 4.) The enrollments in All Other Schools among IEP eighth-graders ranged from 10 percent to 13 percent over the same period.

13COUNCIL OF THE GREAT CITY SCHOOLS
Exhibit 4. Percentages of NAEP Eighth-grade Mathematics Sample by FRPL-status, Language-status, and IEP Status and Type of School (Large City and All Others), 2009 to 2019.
% FRPL % ELL % IEPLarge City Schools2009 66% 12% 11%2011 69% 11% 11%2013 69% 11% 12%2015 71% 12% 13%2017 65% 12% 13%2019 66% 13% 13%All Others2009 39% 5% 10%2011 44% 5% 10%2013 46% 4% 12%2015 48% 5% 12%2017 42% 5% 12%2019 43% 6% 13%Source: NAEP Data Explorer (NDE) based on NAEP reported demographics for mathematics.
Finally, we examined data on the education levels of parents of students in Large City Schools and All Other Schools. (Exhibit 5.) The data on this NAEP background variable were available only on eighth-graders, not fourth-graders. The results of the analysis showed that the percent of Large City School students’ parents who did not finish high school was about 10 percent in 2019, compared to approximately six percent among parents with students in All Other Schools. At the other end of the education scale, about 43 percent of Large City School students’ parents were college graduates in 2019, compared with 57 percent among parents with students in All Other Schools. In both settings, there were declines in the percentages of students’ parents who did not finish high school and increases in the percentages of students’ parents who were college graduates.

14 MIRRORS OR WINDOWS: HOW WELL DO LARGE CITY PUBLIC SCHOOLS OVERCOME THE EFFECTS OF POVERTY AND OTHER BARRIERS?
Exhibit 5. Percentages of NAEP Eighth-grade Mathematics Sample Whose Parents Had Differing Levels of Educational Attainment, 2009 to 2017.6
% DID NOT FINISH HIGH SCHOOL
% GRADUATED HIGH SCHOOL % GRADUATED COLLEGE
Large City Schools2009 13% 17% 35%2011 12% 17% 37%2013 11% 17% 38%2015 12% 17% 38%2017 10% 17% 42%2019 10% 16% 43%All Others2009 7% 17% 47%2011 7% 17% 49%2013 7% 16% 50%2015 7% 16% 50%2017 6% 14% 57%2019 6% 13% 57%Source: NAEP Data Explorer (NDE) based on NAEP reported demographics for mathematics.
In summary, the NAEP data indicate that the demographics of students in Large City Schools and All Other Schools were substantially different from one another. Large City Schools tended to be more predominantly Black and Hispanic than All Other Schools. In addition, Large City Schools were more likely to have higher enrollments of FRPL students and ELLs. Finally, Large City Schools tend to have larger percentages of parents who did not finish high school and lower percentages of parents who had graduated from college than All Other Schools. The percentages of IEP students were similar in both settings, although there may be differences in the types and severity of disabilities between the two types of schools that we did not analyze.
6 The variable is defined as “at least one parent.”

15COUNCIL OF THE GREAT CITY SCHOOLS
The Council of the Great City Schools initiated the Trial Urban District Assessment (TUDA) of NAEP in the fall of 2000. The initiative was piloted in 2002 in reading. And in 2003, Large City Schools participated in both reading and mathematics assessments. The voluntary effort involves the over-sampling of students in each participating district to obtain a district-level estimate of reading and mathematics performance in grades four and eight. This study therefore makes use of both general NAEP student-level data as well as district-specific TUDA student-level data.
We began by comparing NAEP scale score data from students in “Large City Schools” with those of students in All Other Schools, public and private, in the NAEP sample—a category that this report refers to as “All Others.” Comparing these NAEP scale score results without statistically controlling for background variables is the most common way that people look at these data, but it is not the only way or the best way. Comparing Large City Schools to All Other Schools or even one school district to another on scale scores indicates that one scores higher than another, but they often have vastly different demographics and quite different challenges. To sort out these distinctions and how they might mask how districts perform and whether they improve, we asked a series of research questions—
1. Are students in Large City Schools performing at the same level as, above, or below statistical expectations in reading and mathematics on NAEP in fourth- and eighth-grades, after adjusting for differences in demographic characteristics? In other words, do urban public schools overcome or mitigate—to any degree—poverty and other barriers (by exceeding expectations) or do they simply reflect those characteristics (by meeting or falling below expectations)?
2. Do Large City Schools do a better job or a worse job at mitigating poverty and other variables to any degree on achievement than All Other Schools?
3. Are Large City Schools getting better at overcoming these barriers over time (2009, 2011, 2013, 2015, 2017, and 2019)?
4. Do some urban public-school districts participating in TUDA do a better job at mitigating these barriers than other urban school districts? Who are they?
5. What are the urban school districts that seem to be overcoming or mitigating these barriers doing that other urban school districts are not doing? Are there common features of urban school districts that are not showing progress yet?
Research Questions and Summary of Methodology

16 MIRRORS OR WINDOWS: HOW WELL DO LARGE CITY PUBLIC SCHOOLS OVERCOME THE EFFECTS OF POVERTY AND OTHER BARRIERS?
To answer these questions, this study compared the performance of Large City Schools and All Others after adjusting the scale score data to account for a series of variables that the research has indicated affect student outcomes. A detailed description of the methodology and statistical analysis used in this report is found in Appendix A. The variables included—
◆ Race/ethnicity
Student race/ethnicity information is obtained from school records and classified according to six categories: White, Black, Hispanic, Asian/Pacific Islander, American Indian/Alaska Native, or unclassifiable. When school-reported information was missing, student-reported data from the Student Background Questionnaire were used to establish student race/ethnicity. Using restricted NAEP data sets, we categorized as unclassifiable students whose race/ethnicity based on school-records was unclassifiable or missing and (1) who self-reported their race/ethnicity as multicultural but not Hispanic or (2) who did not self-report race/ethnicity information.
◆ Special education status
Student has an Individualized Educational Program (IEP) for reasons other than being gifted or talented; or is a student with a Section 504 Plan.
◆ English language learner status
Student is currently classified as an English language learner. (Former ELLs were not included in this category.)
◆ Parental education
Highest level of education attained by either parent: did not complete high school, graduated high school, had some education after high school, or graduated college. This variable was only available for grade 8 students.
◆ Literacy materials
The presence of reading materials in the home is associated with both socioeconomic status and student achievement. The measure reported in 2009 was based on questions in both grade 4 and grade 8 in the Student Background Questionnaires, which asked about the availability of computers, newspapers, magazines, and more than 25 books in the home. Between 2009 and 2015, the Student Background Questionnaire changed, and a different combination of items was used to calculate a summary score of how many materials were present. In 2011, the items included the availability of computers, magazines, and more than 25 books in the home (newspapers were dropped as a survey item). In 2013, 2015, 2017, and 2019, the items included the availability of computers in the home, the availability of the internet, and more than 25 books in the home (magazines were dropped as a survey item).7 A summary score was created to indicate how many of these literacy materials were present in the home.8
7 The variable may not be comparable across years due to changes in the variables in the composite.8 This summary score has been used for reporting NAEP background variables for several years and has been shown to be associated with students’ achievement scores. (See, for example, Shaughnessy et al., 1997)
6.9

17COUNCIL OF THE GREAT CITY SCHOOLS
To answer these questions, this study compared the performance of Large City Schools and All Others after adjusting the scale score data to account for a series of variables that the research has indicated affect student outcomes. A detailed description of the methodology and statistical analysis used in this report is found in Appendix A. The variables included—
◆ Race/ethnicity
Student race/ethnicity information is obtained from school records and classified according to six categories: White, Black, Hispanic, Asian/Pacific Islander, American Indian/Alaska Native, or unclassifiable. When school-reported information was missing, student-reported data from the Student Background Questionnaire were used to establish student race/ethnicity. Using restricted NAEP data sets, we categorized as unclassifiable students whose race/ethnicity based on school-records was unclassifiable or missing and (1) who self-reported their race/ethnicity as multicultural but not Hispanic or (2) who did not self-report race/ethnicity information.
◆ Special education status
Student has an Individualized Educational Program (IEP) for reasons other than being gifted or talented; or is a student with a Section 504 Plan.
◆ English language learner status
Student is currently classified as an English language learner. (Former ELLs were not included in this category.)
◆ Parental education
Highest level of education attained by either parent: did not complete high school, graduated high school, had some education after high school, or graduated college. This variable was only available for grade 8 students.
◆ Literacy materials
The presence of reading materials in the home is associated with both socioeconomic status and student achievement. The measure reported in 2009 was based on questions in both grade 4 and grade 8 in the Student Background Questionnaires, which asked about the availability of computers, newspapers, magazines, and more than 25 books in the home. Between 2009 and 2015, the Student Background Questionnaire changed, and a different combination of items was used to calculate a summary score of how many materials were present. In 2011, the items included the availability of computers, magazines, and more than 25 books in the home (newspapers were dropped as a survey item). In 2013, 2015, 2017, and 2019, the items included the availability of computers in the home, the availability of the internet, and more than 25 books in the home (magazines were dropped as a survey item).7 A summary score was created to indicate how many of these literacy materials were present in the home.8
7 The variable may not be comparable across years due to changes in the variables in the composite.8 This summary score has been used for reporting NAEP background variables for several years and has been shown to be associated with students’ achievement scores. (See, for example, Shaughnessy et al., 1997)
6.9
◆ School free or reduced-price lunch eligibility rates
To level the influence of changing free or reduced-price lunch rates across districts, the Council research team chose to employ a school-level, rather than a student-level, school lunch indicator. Researchers did so by comparing the percentage of free or reduced-price lunch students reported in the National Center for Education Statistics Common Core of Data (CCD) files in the NAEP years prior to the Community Eligibility Program (CEP) and the NAEP reported free or reduced-price lunch percentages. When the values were within five percentage points of each other, researchers used the NAEP results for schools as the school-level factor. However, for large discrepancies in the data in years after CEP went into effect (values well above or well below the 2012-13 school year9), the CCD school lunch rate was used for the analysis.
◆ Percentage of family incomes less than $15,000 per year by School ZIP Code
As is discussed later in this document, abject poverty or concentrated poverty has been shown to impair student academic outcomes. To further control for the influence of abject poverty across school districts, the research team incorporated the percentage of families making less than $15,000 per year in a school’s physical zip code as a school-level poverty factor. The zip code data were taken from the U. S. Census Bureau's American Community Survey rolling five-year average for each of the NAEP assessment years.
Using scores adjusted by these variables, this study then compared actual NAEP performance levels for students in Large City Schools and individual TUDA districts in 2009, 2011, 2013, 2015, 2017, and 2019 to predicted NAEP reading and mathematics performance (after controlling for the background variables outlined above) in grades four and eight. The difference between the actual and the predicted NAEP scores in this report is called the “district effect.” Comparisons were also made to students in All Other Schools. The analysis allowed the Council to determine whether students in Large City Schools performed better than expected statistically and to compare that performance with students in All Other Schools. In addition, we determined whether Large City Schools and All Other Schools were getting better over time at mitigating poverty and other variables that typically suppress performance.
9 The 2012-13 school year was the year before CEP took effect in many school districts.

18 MIRRORS OR WINDOWS: HOW WELL DO LARGE CITY PUBLIC SCHOOLS OVERCOME THE EFFECTS OF POVERTY AND OTHER BARRIERS?
The sections below compares unadjusted NAEP scale scores of students in Large City Schools and students in All Other Schools in reading and mathematics in fourth- and eighth-grades. Overall performance and trends on scale scores are compared. The analysis begins with a look at trends on scale scores since 2003 for Large City Schools and All Others. The two categories are mutually exclusive, i.e., All Others do not include Large City Schools.
(a) Trends on Scale Scores: Large City Schools vs. All Others
Looking at the unadjusted scale score data, results on the assessment for Large City Schools show two things. First, Large City Schools scored below All Other Schools every year between 2003 and 2019. And two, Large City Schools improved their performance faster than All Others, narrowing the gaps between the nation’s urban schools and everyone else by between one-third and nearly one-half, depending on grade and subject. (See Exhibits 6-9.)
Exhibit 6. Average Scale Scores on NAEP in Fourth-grade Mathematics, 2003-2019.
12.4
6.9
12.4
6.9
Analysis of NAEP Data on Large City Schools and All Other Schools

19COUNCIL OF THE GREAT CITY SCHOOLS
Exhibit 7. Average Scale Scores on NAEP in Eighth-grade Mathematics, 2003-2019.
Exhibit 8. Average Scale Scores on NAEP Fourth-grade Reading, 2003-2019.
17.4
9.3
15.7
10.6
12.4
6.9
12.4
6.9

20 MIRRORS OR WINDOWS: HOW WELL DO LARGE CITY PUBLIC SCHOOLS OVERCOME THE EFFECTS OF POVERTY AND OTHER BARRIERS?
Exhibit 9. Average Scale Scores on NAEP Eighth-grade Reading, 2003-2019.
Specifically, the analysis of unadjusted scale score data show that Large City Schools generally scored below All Other Schools by 12.4 to 17.4 scale score points in 2003. In 2009, Large City Schools scored between 9.8 and 13.4 scale score points below All Others Schools. By 2019, Large City Schools scored between 6.9 and 10.6 scale score points behind All Others—depending on grade and subject. In other words, the Large City Schools reduced the gap with All Other Schools by between 46.6 percent and 32.5 percent between 2003 and 2019, depending on grade and subject. In general, there was a larger reduction in gaps between Large City Schools and All Other Schools in mathematics than in reading.
(b) Adjusted Scale Scores and Trends: Large City Schools vs. All Other Schools
This section examines how Large City Schools performed compared to statistical expectations (after adjusting for relevant background variables). The analysis in this section also compares the adjusted scores of Large City Schools and All Other Schools. Finally, we analyzed the performance of each group over time to see whether Large City Schools and others were getting better at mitigating poverty and other factors that typically suppress performance. This section of the report is meant to answer the first, second, and third research questions, i.e., “Are Large City Schools performing at the same level as, above, or below statistical expectations in reading and mathematics on NAEP in fourth and eighth-grades, after adjusting for differences in demographic characteristics?” “Do Large City Schools do a better job at mitigating the effects of poverty and other variables on achievement than other schools?” And “Are Large City Schools getting better at overcoming these effects over time?”
16.5
10.0
12.4
6.9

21COUNCIL OF THE GREAT CITY SCHOOLS
Results of the data analyses are shown in Exhibits 10 through 13. They show several things. One, in 2019, the “district effect”—i.e., the difference between the scale score and the adjusted score—was larger in Large City Schools than statistical expectations in all four grade/subject combinations—fourth-grade reading, eighth-grade reading, fourth-grade mathematics, and eighth-grade mathematics. In addition, the district effect in Large City Schools was larger than statistical expectations in every year between 2009 and 2019 in all four tested grades and subjects, except eighth-grade reading in 2011 and 2013. The data also show that in 2019 All Other Schools had an overall result that was above statistical expectations in all grades and subjects except eighth-grade reading.
Exhibit 10. Trends in District Effects† on NAEP Fourth-grade Mathematics by School Type, 2009 to 2019.#
† District effect is the difference between the actual district mean and the expected district mean.* District effect is significantly different from zero at p < .05.# Includes district-authorized charters, charters authorized by others, and independent charters.
Year2009 2011 2013 2015 2017 2019
0.0
0.5
1.0
1.5
2.0
2.5
3.0
3.5
4.0
Dist
rict Effe
ct
Jurisdic�onLarge City SchoolsAll Other Schools
2009 2011 2013 2015 2017 2019
1.24*3.12*
1.14*1.35*
0.90*2.98*
1.15*4.04*3.05*3.24*
-0.05-0.19

22 MIRRORS OR WINDOWS: HOW WELL DO LARGE CITY PUBLIC SCHOOLS OVERCOME THE EFFECTS OF POVERTY AND OTHER BARRIERS?
Exhibit 11. Trends in District Effects† on NAEP Eighth-grade Mathematics by School Type, 2009 to 2019.#
† District effect is the difference between the actual district mean and the expected district mean.* District effect is significantly different from zero at p < .05.# Includes district-authorized charters, charters authorized by others, and independent charters.
Exhibit 12. Trends in District Effects† on NAEP Fourth-grade Reading by School Type, 2009 to 2019.#
† District effect is the difference between the actual district mean and the expected district mean.* District effect is significantly different from zero at p < .05.# Includes district-authorized charters, charters authorized by others, and independent charters.
Year2009 2011 2013 2015 2017 2019
0.0
0.5
1.0
1.5
2.0
2.5
3.0
3.5
4.0
4.5
Dist
rict Effe
ct
Jurisdic�onLarge City SchoolsAll Other Schools
2009 2011 2013 2015 2017 2019
1.24*4.41*
1.69*3.60*
1.23*3.15*
1.08*2.60*2.65*3.09*
-0.070.15
Year2009 2011 2013 2015 2017 2019
0.0
0.5
1.0
1.5
2.0
2.5
3.0
Dist
rict Effe
ct
Jurisdic�onLarge City SchoolsAll Other Schools
2009 2011 2013 2015 2017 2019
0.86*1.51*
0.64*1.91*
0.74*1.95*
0.63*3.31*2.78*2.82*
-0.25-0.19

23COUNCIL OF THE GREAT CITY SCHOOLS
Exhibit 13. Trends in District Effects† on NAEP Eighth-grade Reading by School Type, 2009 to 2019.#
† District effect is the difference between the actual district mean and the expected district mean.* District effect is significantly different from zero at p < .05.# Includes district-authorized charters, charters authorized by others, and independent charters.
Second, the data in Exhibit 14 show the differences in aggregate district effects between Large City Schools and All Others by year, grade, and subject. The results of the analysis show that Large City Schools had larger aggregate district effects than All Other Schools in all four grade/subject combinations in every year between 2009 and 2019, except fourth-grade math in 2017, fourth-grade reading in 2019, and eighth-grade reading in 2017. In other words, the narrowing gap in actual scale score points between the two groups that we saw in Exhibits 6, 7, 8, and 9 is the byproduct of the fact that Large City Schools are producing an “effect” that is larger than All Others.
Year2009 2011 2013 2015 2017 2019
-0.6-0.4-0.20.00.20.40.60.81.01.21.41.6
Dist
rict Effe
ct
Jurisdic�onLarge City SchoolsAll Other Schools
2009 2011 2013 2015 2017 20191.62*1.27*1.25*
-0.55*1.09*
0.290.43-0.050.54
-0.390.89
-0.10

24 MIRRORS OR WINDOWS: HOW WELL DO LARGE CITY PUBLIC SCHOOLS OVERCOME THE EFFECTS OF POVERTY AND OTHER BARRIERS?
Exhibit 14. Differences between Large City Schools and All Other Schools by Year.
YEAR ESTIMATE SE df p
Math Grade 42009 3.44 0.41 53.89 0.000*2011 3.11 0.41 29.07 0.000*2013 2.89 0.49 35.46 0.000*2015 2.08 0.38 56.98 0.000*2017 0.21 0.50 32.60 0.6722019 1.88 0.51 36.76 0.001*
Math Grade 82009 2.93 0.58 40.96 0.000*2011 2.72 0.56 25.84 0.000*2013 1.52 0.48 35.37 0.003*2015 1.92 0.66 49.17 0.005*2017 1.91 0.49 55.73 0.000*2019 3.17 0.68 29.78 0.000*
Reading Grade 42009 3.01 0.56 14.96 0.000*2011 3.03 0.51 30.87 0.000*2013 2.67 0.55 32.34 0.000*2015 1.20 0.50 31.21 0.023*2017 1.27 0.57 35.70 0.034*2019 0.65 0.52 35.90 0.222
Reading Grade 82009 1.20 0.42 36.14 0.007*2011 1.28 0.47 44.04 0.009*2013 1.09 0.48 39.20 0.028*2015 1.30 0.54 29.62 0.022*2017 0.84 0.48 47.08 0.0862019 1.33 0.71 33.60 0.019*
Third, the data show that district effects in Large City Schools did not change significantly between 2009 and 2019 in reading or mathematics in either grade. On the other hand, All Other Schools showed significant gains in their effects between 2009 and 2019 in all four grade-subject combinations, except eighth-grade reading, yet remained significantly below Large City School effects in 2019 in all grades and subjects except fourth-grade reading where there was no difference between Large City Schools and All Others. In other words, despite increases in the effects of All Other Schools over the ten years, Large City Schools had a district effect in 2019 in fourth-grade reading that was 1.8 times greater than All Other Schools; 5.6 times greater in eighth-grade reading; 2.5 times greater in fourth-grade mathematics; and 3.6 times greater in

25COUNCIL OF THE GREAT CITY SCHOOLS
eighth-grade mathematics. The statistical analysis of ten-year trends and differences between Large City Schools and All Others is shown in Exhibit 15.
Exhibit 15. Trends among Large City Schools and All Other Schools and Differences between the Two Groups, 2009 to 2019.
VARIABLE ESTIMATE SE df p
Math Grade 4Large City Schools -0.121 0.568 70.26 0.831All Other Schools 1.433 0.276 122.41 0.000*Gap Between Large City and All Other Schools -1.554 0.659 77.26 0.021*
Math Grade 8Large City Schools 1.327 0.844 54.85 0.122All Other Schools 1.090 0.285 127.65 0.000*Gap Between Large City and All Other Schools 0.237 0.897 64.41 0.793
Reading Grade 4Large City Schools -1.313 0.684 29.56 0.065All Other Schools 1.050 0.317 113.26 0.001*Gap Between Large City and All Other Schools -2.363 0.761 40.00 0.004*
Reading Grade 8Large City Schools 0.530 0.748 41.28 0.483All Other Schools 0.395 0.294 122.31 0.181Gap Between Large City and All Other Schools 0.134 0.823 54.58 0.871
(c) City-by-City Results: Actual vs. Expected (Adjusted) Mean NAEP Performance
In this section we look at results city-by-city. Here, we are asking the fourth research question: “Do some urban public-school districts mitigate the effects of poverty and other barriers better than other urban school districts?” “Who are they?” And “Are some cities getting better over time?”
Exhibits 16 and 17 show the actual performance, adjusted or statistically expected results, and district effects in fourth-grade mathematics for individual TUDA districts in 2009 through 2019. Again, the district effect is the difference between the actual performance and the statistically expected performance. A positive number suggests that the entity is scoring higher than one would expect statistically given its demographic characteristics; a negative number suggests that the entity is scoring lower than one would expect statistically given its demographic characteristics. Zero is the point at which an entity scores what one would expect statistically.10
10 Note that changes in demographics in any individual city is reflected in the changing expected mean values shown in Exhibits 16, 19, 22, and 25. See, for example, Cleveland, District of Columbia, and Detroit.

26 MIRRORS OR WINDOWS: HOW WELL DO LARGE CITY PUBLIC SCHOOLS OVERCOME THE EFFECTS OF POVERTY AND OTHER BARRIERS?
Note that Albuquerque, Dallas, and Hillsborough County began participating in TUDA in 2011 and trends are reported on them for only five assessment cycles. Duval County began participating in 2015 and Milwaukee did not participate in 2015 but rejoined in 2017. Clark County, Denver, Fort Worth, Guilford County, and Shelby County began participating in 2017 and only have calculations across two testing cycles.
The exhibits show that individual cities had considerable variation in their results in 2019. For instance, cities ranged in their district effects in fourth-grade mathematics from +14.90 in Miami-Dade County to -9.23 in Detroit. Overall, 17 of 27 cities (Atlanta, Austin, Boston, Charlotte-Mecklenburg, Chicago, Cleveland, Dallas, Denver, the District of Columbia, Duval County, Fort Worth, Guilford County, Hillsborough County, Houston, Miami-Dade County, San Diego, and Shelby County) posted statistically significant positive district effects in 2019, while six had statistically significant negative district effects. Exhibit 18 ranks the cities by their 2019 scale scores, 2019 district effects, and 2009-2019 trends in district effects.
Exhibits 19 and 20 show data on individual cities in eighth-grade mathematics. Cities varied from +17.63 in Boston to -10.86 in Fresno in 2019. Some 15 of 26 cities11 (Atlanta, Austin, Boston, Charlotte-Mecklenburg, Chicago, Cleveland, Dallas, the District of Columbia, Fort Worth, Guilford County, Hillsborough County, Houston, Miami-Dade County, New York City, and Shelby County) had statistically significant positive district effects in 2019, while six had statistically significant negative district effects. Exhibit 21 ranks the cities by their 2019 scale scores, 2019 district effects, and 2009-2019 trends in district effects.
In grade-four reading (Exhibits 22 and 23), individual district effects ranged from +18.97 in Denver to -11.19 in Detroit in 2019. Overall, 15 of 27 cities (Atlanta, Austin, Boston, Charlotte-Mecklenburg, Chicago, Clark County, Denver, the District of Columbia, Duval County, Fort Worth, Guilford County, Hillsborough County, Miami-Dade County, New York City, and San Diego) had statistically significant positive district effects in 2019, while six had statistically significant negative district effects. Exhibit 24 ranks the cities by their 2019 scale scores, 2019, district effects, and 2009-2019 district effects.
In eighth-grade reading (Exhibits 25 and 26), individual cities varied from +11.36 in Boston to -6.50 in Fresno in 2019. Overall, nine of 26 cities (Atlanta, Boston, Chicago, Cleveland, Dallas, Duval County, Hillsborough County, Miami-Dade County, and New York City) had statistically significant positive district effects in 2019, while five had statistically significant negative district effects. Exhibit 27 ranks the cities by their 2019 scale scores, 2019 district effects, and 2009-2019 district effects.
11 No student questionnaire (SQ) data were collected on eighth graders in Denver, so it was not possible to calculate adjusted NAEP scores at this grade level.

27COUNCIL OF THE GREAT CITY SCHOOLS
Exhibit 16. Actual NAEP Fourth-grade Mathematics Scale Scores, Expected Means, and District Effects in TUDA Districts, 2009 to 2019.
Jurisdic�on 2009 2011 2013 2015 2017 2019
AlbuquerqueActual MeanExpected MeanDistrict Effect
AtlantaActual MeanExpected MeanDistrict Effect
Aus�nActual MeanExpected MeanDistrict Effect
Bal�moreActual MeanExpected MeanDistrict Effect
BostonActual MeanExpected MeanDistrict Effect
Charlo�eActual MeanExpected MeanDistrict Effect
ChicagoActual MeanExpected MeanDistrict Effect
Clark County (NV)Actual MeanExpected MeanDistrict Effect
ClevelandActual MeanExpected MeanDistrict Effect
DallasActual MeanExpected MeanDistrict Effect
DenverActual MeanExpected MeanDistrict Effect
DetroitActual MeanExpected MeanDistrict Effect
District of Columbia(DCPS)
Actual MeanExpected MeanDistrict Effect
Duval County (FL)Actual MeanExpected MeanDistrict Effect
Fort Worth (TX)Actual MeanExpected MeanDistrict Effect
FresnoActual MeanExpected MeanDistrict Effect
Guilford County (NC)Actual MeanExpected MeanDistrict Effect
Hillsborough County(FL)
Actual MeanExpected MeanDistrict Effect
HoustonActual MeanExpected MeanDistrict Effect
Jefferson County (KY)Actual MeanExpected MeanDistrict Effect
Los AngelesActual MeanExpected MeanDistrict Effect
MiamiActual MeanExpected MeanDistrict Effect
MilwaukeeActual MeanExpected MeanDistrict Effect
New York CityActual MeanExpected MeanDistrict Effect
PhiladelphiaActual MeanExpected MeanDistrict Effect
San DiegoActual MeanExpected MeanDistrict Effect
Shelby County (TN)Actual MeanExpected MeanDistrict Effect
230.38232.60-2.22*
230.58233.26-2.68*
234.67232.632.04*
230.02230.84-0.81
236.26234.65
1.61231.56226.445.12*
231.14227.024.12*
233.10227.076.03*
227.75226.111.64*
225.35223.122.23*
228.09226.97
1.12242.74232.929.82*
243.32232.1111.21*
246.14231.9014.24*
244.97233.0611.91*
244.99231.1213.87*
240.46229.0611.40*
216.47221.31-4.84*
215.36220.58-5.22*
214.91222.15-7.24*
222.87220.941.93*
225.51222.313.19*
222.33220.72
1.62233.76223.6410.13*
233.33223.819.52*
235.53226.339.20*
236.87224.7112.17*
237.61222.8214.79*
236.03223.8912.14*
246.26237.358.91*
243.87236.747.13*
247.82235.9611.86*
247.35238.079.28*
246.97237.089.89*
244.37235.608.77*
232.51227.764.75*
231.81227.654.16*
231.92228.183.75*
230.50228.252.25*
222.90224.97-2.07*
221.06223.29-2.23*
230.13233.67-3.53*
234.58233.58
1.00217.70214.752.95*
215.31217.23-1.92*
213.64217.19-3.55*
214.37215.17-0.80
219.15217.22
1.93
216.07216.43-0.36
234.90222.3912.51*
233.77220.3013.47*
237.93221.9116.02*
234.22220.3113.91*
232.83219.2713.56*
234.74220.6914.05*
228.76217.1611.60*
205.44214.67-9.23*
199.89215.67-15.78*
204.64216.84-12.20*
204.25216.71-12.46*
203.57218.41-14.84*
199.76217.62-17.86*
235.30227.827.49*
230.80227.982.82*
232.24229.193.06*
228.61226.931.68*
221.82226.86-5.04*
220.23224.23-4.00*
244.15233.3710.78*
247.50235.5012.00*
242.80236.236.57*
233.02222.6010.42*
230.47222.887.60*
223.99227.06-3.08*
221.42226.66-5.24*
217.68226.71-9.03*
219.69226.83-7.15*
217.85225.60-7.75*
219.17225.24-6.07*
236.22232.733.49*
240.09234.305.79*
242.23234.367.87*
244.64236.108.54*
243.61235.498.12*
242.80235.926.88*
243.32235.098.23*
235.33226.049.29*
235.25225.569.69*
238.71225.4813.23*
235.90224.9910.91*
237.04224.7012.34*
235.79222.3813.41*
235.75233.572.18*
232.36233.96-1.61
233.31234.28-0.97
233.70235.11-1.41
235.24236.13-0.89
232.43234.18-1.75
223.63230.86-7.22*
223.14230.11-6.97*
224.19229.94-5.75*
223.26226.70-3.44*
228.46230.16-1.70
221.71223.63-1.91
245.82230.9214.90*
244.99232.6712.32*
242.10231.7210.38*
237.40229.947.47*
235.29229.106.19*
236.34229.337.00*
215.30222.27-6.97*
215.88222.92-7.04*
221.45225.39-3.94*
219.70223.76-4.07*
220.21223.52-3.30*
235.84232.183.66*
234.32227.716.61*
237.47225.9911.48*
230.82230.54
0.28
229.22230.32-1.10
231.05229.44
1.61217.17224.15-6.97*
214.33222.67-8.35*
217.45225.01-7.55*
225.31223.341.97*
223.38224.73-1.35
221.92221.35
0.57240.23237.582.64*
237.51235.032.47*
240.88236.044.84*
238.94233.964.98*
236.48233.223.26*
232.76233.87-1.11
228.49225.562.94*
223.71224.08-0.37

28 MIRRORS OR WINDOWS: HOW WELL DO LARGE CITY PUBLIC SCHOOLS OVERCOME THE EFFECTS OF POVERTY AND OTHER BARRIERS?
Exhibit 17. Trends in District Effects in Fourth-grade Mathematics by City, 2009 to 2019.

29COUNCIL OF THE GREAT CITY SCHOOLS
The following exhibit compares how the districts ranked with each other when looking at 2019 NAEP scale scores versus the “effects” that each district produced. The table also shows Large City School district effects in the aggregate and districts that produced an “effect” that was larger than All Others, and it ranks changes in district effects between 2009 and 2019.
Exhibit 18. Ranking of TUDA Districts on Fourth-grade Mathematics Scale Scores, 2019 District Effects, and Trends on District Effects.
SCALE SCORE 2019 DISTRICT EFFECTS 2019 CHANGE IN DISTRICT EFFECTS, 2009-2019#
Charlotte-Mecklenburg (246) Miami-Dade County (14.90)* District of Columbia (11.5)+
Miami-Dade County (246) Denver (14.05)* Detroit (8.6)+
Duval County (244) Dallas (12.51)* Miami-Dade County (7.9)+
Austin (243) Duval County (10.78)* Chicago (7.0)+
Hillsborough County (242) Fort Worth (10.42)* Cleveland (6.5)+
All Others (242) Boston (10.13)* Fresno (3.0)San Diego (240) Austin (9.82)* Atlanta (2.9)+
Guilford County (236) Houston (9.29)* All Others (1.4)+
Clark County (235) Charlotte-Mecklenburg (8.91)* Charlotte-Mecklenburg (0.1) Dallas (235) Hillsborough County (7.87)* Jefferson County (0.1)Denver (235) District of Columbia (7.49)* Large City (-0.1) District of Columbia (235) Atlanta (5.12)* San Diego (-0.6)Houston (235) Chicago (4.75)* Austin (-1.6)Large City (235) Guilford County (3.49)* Boston (-2.0)Boston (234) Large City (3.12)* Milwaukee (-3.7)+
Fort Worth (233) Cleveland (2.95)* Houston (-4.1)+
Atlanta (232) Shelby County (2.94)* Los Angeles (-5.3)+
Chicago (232) San Diego (2.64)* Baltimore (-6.5)+
Jefferson County (232) All Others (1.24)* Philadelphia (-7.5)+
New York City (231) Clark County (1.00) New York City (-11.2)+
Albuquerque (230) New York City (0.28)Shelby County (228) Albuquerque (-0.81)Fresno (224) Jefferson County (-1.61)Los Angeles (224) Fresno (-3.08)*Cleveland (218) Baltimore (-4.84)*Philadelphia (217) Philadelphia (-6.97)*Baltimore (216) Milwaukee (-6.97)*Milwaukee (215) Los Angeles (-7.22)*Detroit (205) Detroit (-9.23)*#Only 18 urban school districts participated in TUDA in 2009.*District effect is significantly different from zero.+Difference in district effect between 2009 and 2019 is significant.

30 MIRRORS OR WINDOWS: HOW WELL DO LARGE CITY PUBLIC SCHOOLS OVERCOME THE EFFECTS OF POVERTY AND OTHER BARRIERS?
Exhibit 19. Actual NAEP Eighth-grade Mathematics Scale Scores, Expected Means, and District Effects in TUDA Districts, 2009 to 2019.Jurisdic�on 2009 2011 2013 2015 2017 2019
AlbuquerqueActual MeanExpected MeanDistrict Effect
AtlantaActual MeanExpected MeanDistrict Effect
Aus�nActual MeanExpected MeanDistrict Effect
Bal�moreActual MeanExpected MeanDistrict Effect
BostonActual MeanExpected MeanDistrict Effect
Charlo�eActual MeanExpected MeanDistrict Effect
ChicagoActual MeanExpected MeanDistrict Effect
Clark County (NV)Actual MeanExpected MeanDistrict Effect
ClevelandActual MeanExpected MeanDistrict Effect
DallasActual MeanExpected MeanDistrict Effect
DetroitActual MeanExpected MeanDistrict Effect
District of Columbia(DCPS)
Actual MeanExpected MeanDistrict Effect
Duval County (FL)Actual MeanExpected MeanDistrict Effect
Fort Worth (TX)Actual MeanExpected MeanDistrict Effect
FresnoActual MeanExpected MeanDistrict Effect
Guilford County (NC)Actual MeanExpected MeanDistrict Effect
Hillsborough County(FL)
Actual MeanExpected MeanDistrict Effect
HoustonActual MeanExpected MeanDistrict Effect
Jefferson County (KY)Actual MeanExpected MeanDistrict Effect
Los AngelesActual MeanExpected MeanDistrict Effect
MiamiActual MeanExpected MeanDistrict Effect
MilwaukeeActual MeanExpected MeanDistrict Effect
New York CityActual MeanExpected MeanDistrict Effect
PhiladelphiaActual MeanExpected MeanDistrict Effect
San DiegoActual MeanExpected MeanDistrict Effect
Shelby County (TN)Actual MeanExpected MeanDistrict Effect
264.90268.59-3.68*
267.87270.43-2.57*
270.85272.26-1.41
272.39272.95-0.56
273.17273.85-0.69
268.38262.755.63*
265.15262.023.12*
266.59263.263.32*
267.19262.954.24*
267.11263.433.68*
260.06258.40
1.67282.60273.808.80*
283.34273.979.37*
284.34274.469.88*
285.00274.6110.39*
285.91273.0012.90*
287.55272.6014.95*
254.13256.47-2.34
255.84256.76-0.92
256.07257.20-1.13
260.72258.85
1.87
262.29262.41-0.12
257.64259.63-1.99
279.35261.7217.63*
280.38262.4917.89*
282.46263.6618.80*
283.76263.1120.65*
284.72266.5118.22*
280.86263.5317.33*
288.31277.8210.50*
287.78276.7411.04*
286.57277.559.02*
289.43279.2610.17*
285.52277.837.69*
282.07275.586.49*
275.59264.1911.40*
275.88266.049.84*
275.32265.349.97*
269.29266.962.33*
270.69265.125.57*
264.17261.522.65*
271.67273.11-1.44
272.82273.86-1.05
253.36249.463.91*
257.62249.458.17*
254.62251.253.37*
256.05251.554.50*
253.10252.01
1.09
255.51253.30
2.20264.46252.5911.87*
268.25253.3814.87*
271.20258.8612.34*
274.84262.1912.65*
273.94260.8613.09*
243.94248.62-4.68*
245.58249.87-4.28*
244.69252.63-7.94*
240.00253.45-13.44*
247.31257.43-10.13*
238.95253.75-14.81*
268.91264.814.10*
257.22263.67-6.45*
251.91259.76-7.84*
263.39263.63-0.24
260.84262.35-1.52
260.76262.53-1.77
275.62272.962.67*
274.33271.98
2.35
274.90275.61-0.71
264.85259.775.08*
268.47260.837.64*
253.88264.74-10.86*
254.95266.58-11.63*
257.32267.76-10.43*
260.05269.78-9.73*
256.62265.99-9.37*
258.76263.83-5.07*
280.35274.875.49*
277.01273.973.04*
276.70272.833.87*
277.35274.982.37*
284.07277.646.43*
282.24277.035.21*
276.04273.68
2.36274.11262.1012.01*
273.49264.189.30*
276.63266.3810.25*
280.70267.1513.56*
279.54266.9812.56*
276.89263.6213.28*
270.95274.90-3.95*
271.92274.99-3.07*
273.57276.73-3.16*
274.46277.38-2.92*
271.33275.27-3.94*
273.62273.74-0.12
260.99268.38-7.39*
266.99269.90-2.91*
264.01269.18-5.16*
264.90272.02-7.12*
261.24266.67-5.43*
258.77262.92-4.16*
276.40269.756.65*
274.03269.694.34*
274.74271.972.78*
272.90269.922.98*
273.98272.21
1.77
271.85271.05
0.79252.74257.67-4.93*
254.40259.09-4.68*
254.60259.98-5.39*
252.51258.82-6.31*
257.62259.81-2.19
273.32267.835.49*
275.35271.024.32*
276.67270.975.71*
274.11269.834.28*
272.75267.545.21*
275.32268.317.01*
256.42261.09-4.67*
267.03262.564.47*
264.84259.914.93*
260.78261.39-0.60
267.50264.27
3.22
265.59263.17
2.42283.50280.522.98*
277.54280.25-2.71*
282.78280.92
1.86
281.26279.53
1.73
278.73277.75
0.98
280.38277.99
2.39265.35261.673.68*
256.98261.56-4.58*

31COUNCIL OF THE GREAT CITY SCHOOLS
Exhibit 20. Trends in District Effects in Eighth-grade Mathematics by City, 2009 to 2019.
Albuquerque
Atlanta
Aus�n
Bal�more
Boston
Charlo�e
Chicago
Clark County (NV)
Cleveland
Dallas
Detroit
District of Columbia(DCPS)
Duval County (FL)
Fort Worth (TX)
Fresno
Guilford County (NC)
Hillsborough County (FL)
Houston
Jefferson County (KY)
Los Angeles
Miami
Milwaukee
New York City
Philadelphia
San Diego
Shelby County (TN)
2011
2015
2019
2011
2015
2019
2011
2015
2019
2011
2015
2019
2011
2015
2019
2011
2015
2019
2011
2015
2019
2011
2015
2019
2011
2015
2019
2011
2015
2019
2011
2015
2019
2011
2015
2019
2011
2015
2019
2011
2015
2019
2011
2015
2019
2011
2015
2019
2011
2015
2019
2011
2015
2019
2011
2015
2019
2011
2015
2019
2011
2015
2019
2011
2015
2019
2011
2015
2019
2011
2015
2019
2011
2015
2019
2011
2015
2019
-16
-15
-14
-13
-12
-11
-10 -9 -8 -7 -6 -5 -4 -3 -2 -1 0 1 2 3 4 5 6 7 8 9 10 11 12 13 14 15 16 17 18 19 20 21 22

32 MIRRORS OR WINDOWS: HOW WELL DO LARGE CITY PUBLIC SCHOOLS OVERCOME THE EFFECTS OF POVERTY AND OTHER BARRIERS?
The following exhibit compares how the districts ranked with each other when looking at 2019 NAEP scale scores versus the “effects” that each district produced. The table also shows Large City School district effects and districts that produced an “effect” that was larger than All Others, and it ranks changes in district effects between 2009 and 2019.
Exhibit 21. Ranking of TUDA Districts on Eighth-grade Mathematics Scale Scores, 2019 District Effects, and Trends on District Effects.
SCALE SCORE 2019 DISTRICT EFFECTS 2019 CHANGE IN DISTRICT EFFECTS, 2009-2019#
Charlotte (288) Boston (17.63)* District of Columbia (11.9)+
All Others (284) Houston (12.01)* Detroit (10.1)+
San Diego (283) Dallas (11.87)* Chicago (8.8)+
Austin (282) Chicago (11.40)* Atlanta (4.0)+
Guilford County (280) Charlotte (10.50)* Charlotte-Mecklenburg (4.0)+
Boston (279) Austin (8.80)* Jefferson County (3.8)+
Hillsborough County (276) Miami-Dade County (6.65)* Miami-Dade County (3.7)+
Miami-Dade County (276) Atlanta (5.63)* Milwaukee (1.4)Chicago (275) Guilford County (5.49)* Large City (1.3)Denver (275) New York City (5.49)* All Others (1.1)+
Duval County (274) Fort Worth (5.08)* Boston (0.3)Houston (274) Large City (4.41)* Baltimore (-0.3)Large City (274) District of Columbia (4.10)* Cleveland (-0.6)Jefferson County (273) Cleveland (3.91)* San Diego (-0.5)New York City (273) Hillsborough County (3.87)* Houston (-1.3)Clark County (272) Shelby County (3.68)* New York City (-1.5)District of Columbia (269) Duval County (2.35) Los Angeles (-3.2)+
Atlanta (268) San Diego (1.86) Fresno (-5.8)+
Albuquerque (267) All Others (1.24)* Austin (-6.1)+
Fort Worth (265) Jefferson County (-0.12) Philadelphia (-9.6)+
Shelby County (265) Clark County (-1.44)Dallas (264) Baltimore (-2.34)Los Angeles (261) Albuquerque (-3.68)*Philadelphia (256) Philadelphia (-4.67)*Baltimore (254) Detroit (-4.68)*Fresno (254) Milwaukee (-4.93)*Cleveland (253) Los Angeles (-7.39)*Milwaukee (252) Fresno (-10.86)*Detroit (244)#Only 18 urban school districts participated in TUDA in 2009.*District effect is significantly different from zero.+Difference in district effect between 2009 and 2019 is significant.

33COUNCIL OF THE GREAT CITY SCHOOLS
Exhibit 22. Actual NAEP Fourth-grade Reading Scale Scores, Expected Means, and District Effects in TUDA Districts, 2009 to 2019.
Jurisdic�on 2009 2011 2013 2015 2017 2019
AlbuquerqueActual MeanExpected MeanDistrict Effect
AtlantaActual MeanExpected MeanDistrict Effect
Aus�nActual MeanExpected MeanDistrict Effect
Bal�moreActual MeanExpected MeanDistrict Effect
BostonActual MeanExpected MeanDistrict Effect
Charlo�eActual MeanExpected MeanDistrict Effect
ChicagoActual MeanExpected MeanDistrict Effect
Clark County (NV)Actual MeanExpected MeanDistrict Effect
ClevelandActual MeanExpected MeanDistrict Effect
DallasActual MeanExpected MeanDistrict Effect
DenverActual MeanExpected MeanDistrict Effect
DetroitActual MeanExpected MeanDistrict Effect
District of Columbia(DCPS)
Actual MeanExpected MeanDistrict Effect
Duval County (FL)Actual MeanExpected MeanDistrict Effect
Fort Worth (TX)Actual MeanExpected MeanDistrict Effect
FresnoActual MeanExpected MeanDistrict Effect
Guilford County (NC)Actual MeanExpected MeanDistrict Effect
Hillsborough County(FL)
Actual MeanExpected MeanDistrict Effect
HoustonActual MeanExpected MeanDistrict Effect
Jefferson County (KY)Actual MeanExpected MeanDistrict Effect
Los AngelesActual MeanExpected MeanDistrict Effect
MiamiActual MeanExpected MeanDistrict Effect
MilwaukeeActual MeanExpected MeanDistrict Effect
New York CityActual MeanExpected MeanDistrict Effect
PhiladelphiaActual MeanExpected MeanDistrict Effect
San DiegoActual MeanExpected MeanDistrict Effect
Shelby County (TN)Actual MeanExpected MeanDistrict Effect
206.64212.22-5.58*
206.88213.22-6.34*
206.39209.44-3.04*
209.45213.82-4.37*
207.62209.18-1.56
213.60206.387.22*
213.96210.413.56*
214.28207.936.36*
211.27207.663.61*
209.16204.744.42*
212.18210.03
2.14216.56211.095.47*
216.74211.315.43*
220.02210.479.55*
220.81210.1610.65*
222.74212.7010.04*
220.35210.979.39*
192.54199.78-7.24*
197.37203.67-6.30*
199.07204.21-5.14*
204.26205.29-1.03
200.25203.52-3.27
202.07202.33-0.25
213.81201.2212.60*
217.15202.9414.21*
219.46204.6414.83*
214.40199.1215.28*
216.64199.3617.28*
214.72201.9612.76*
224.57217.377.20*
224.89219.765.13*
225.58218.137.45*
226.44218.208.25*
223.78217.356.43*
223.60215.747.85*
208.45205.742.71*
211.26208.133.12*
213.09208.964.13*
206.15205.44
0.72
202.69201.85
0.84
201.60201.86-0.26
216.27212.453.83*
213.38214.65-1.27
189.52193.47-3.95*
191.98194.41-2.43*
193.79198.57-4.78*
196.03192.69
3.34
196.41195.74
0.67
196.81196.87-0.06
204.03199.884.16*
204.65195.469.19*
203.66196.806.86*
202.71199.17
3.54
201.10201.09
0.00216.87197.8918.97*
213.93195.2018.73*
182.58193.77-11.19*
181.52196.31-14.79*
186.45197.53-11.08*
189.71195.15-5.44*
191.37197.61-6.24*
187.27198.57-11.30*
214.43206.817.62*
213.00210.072.93*
213.91211.332.58*
201.02205.49-4.47*
203.42207.43-4.01*
205.73205.84-0.11
221.92214.047.88*
225.62218.796.83*
225.27219.166.11*
204.04199.124.91*
205.91201.624.29*
202.96207.36-4.39*
198.95205.56-6.61*
195.85202.96-7.10*
194.39202.13-7.74*
197.32202.00-4.69*
204.13205.52-1.39
218.23212.066.17*
221.88216.715.17*
223.95213.8710.07*
227.23218.428.81*
229.65216.7312.92*
227.86214.5613.30*
230.96214.0016.96*
209.55204.275.28*
207.83201.376.46*
213.04203.619.43*
211.39202.528.87*
204.13203.20
0.93
205.31204.66
0.65220.88217.293.59*
221.95216.695.26*
220.94216.754.19*
222.79218.084.71*
218.91215.613.30*
213.70214.59-0.89
204.91209.85-4.94*
207.50210.86-3.36*
204.43208.92-4.49*
200.60202.86-2.26*
204.85206.54-1.70
197.31198.99-1.68
224.78210.5014.28*
228.92214.9913.93*
226.41213.4512.96*
223.11208.0215.09*
221.16208.0113.15*
221.21209.9111.30*
189.64200.53-10.89*
195.23203.75-8.51*
198.71202.32-3.61*
195.66201.10-5.44*
196.74202.93-6.18*
212.04208.843.20*
214.38211.402.98*
214.01208.855.15*
216.27208.707.57*
216.21204.7511.45*
216.81204.3012.51*
196.89202.91-6.02*
197.33204.94-7.61*
200.53206.45-5.92*
195.03201.41-6.39*
199.93202.14-2.21
198.75201.54-2.78
222.57215.906.66*
221.69214.447.25*
215.91212.343.57*
217.77213.094.68*
215.41211.004.41*
213.22210.81
2.41202.34206.93-4.59*
205.37206.08-0.71

34 MIRRORS OR WINDOWS: HOW WELL DO LARGE CITY PUBLIC SCHOOLS OVERCOME THE EFFECTS OF POVERTY AND OTHER BARRIERS?
Exhibit 23. Trends in District Effects in Fourth-grade Reading by City, 2009 to 2019.
Albuquerque
Atlanta
Aus�n
Bal�more
Boston
Charlo�e
Chicago
Clark County (NV)
Cleveland
Dallas
Denver
Detroit
District of Columbia(DCPS)
Duval County (FL)
Fort Worth (TX)
Fresno
Guilford County (NC)
Hillsborough County(FL)
Houston
Jefferson County (KY)
Los Angeles
Miami
Milwaukee
New York City
Philadelphia
San Diego
Shelby County (TN)
2011
2015
2019
2011
2015
2019
2011
2015
2019
2011
2015
2019
2011
2015
2019
2011
2015
2019
2011
2015
2019
2011
2015
2019
2011
2015
2019
2011
2015
2019
2011
2015
2019
2011
2015
2019
2011
2015
2019
2011
2015
2019
2011
2015
2019
2011
2015
2019
2011
2015
2019
2011
2015
2019
2011
2015
2019
2011
2015
2019
2011
2015
2019
2011
2015
2019
2011
2015
2019
2011
2015
2019
2011
2015
2019
2011
2015
2019
2011
2015
2019
-16
-15
-14
-13
-12
-11
-10 -9 -8 -7 -6 -5 -4 -3 -2 -1 0 1 2 3 4 5 6 7 8 9 10 11 12 13 14 15 16 17 18 19 20

35COUNCIL OF THE GREAT CITY SCHOOLS
The following exhibit compares how the districts ranked with each other when looking at 2019 NAEP scale scores versus the “effects” that each district produced. The table also shows Large City School district effects in the aggregate and districts that produced an “effect” that was larger than All Others, and it ranks changes in district effects between 2009 and 2019.
Exhibit 24. Ranking of TUDA Districts on Fourth-grade Reading Scale Scores, 2019 District Effects, and Trends on District Effects.
SCALE SCORE 2019 DISTRICT EFFECTS 2019 CHANGE IN DISTRICT EFFECTS, 2009-2019#
Charlotte (225) Denver (18.97)* District of Columbia (11.6)+
Miami-Dade County (225) Miami-Dade County (14.28)* Cleveland (8.1)+
Hillsborough County (224) Boston (12.60)* San Diego (4.3)San Diego (223) Hillsborough County (10.07)* Fresno (3.3)Duval County (222) Duval County (7.88)* Chicago (3.0)All Others (222) District of Columbia (7.62)* Miami-Dade County (3.0)+
Guilford County (218) Atlanta (7.22)* Atlanta (2.8)Austin (217) Charlotte (7.20)* All Others (1.1)+
Denver (217) San Diego (6.66)* Philadelphia (0.4)Clark County (216) Guilford County (6.17)* Detroit (0.1)Atlanta (214) Austin (5.47)* Boston (-0.2)Boston (214) Fort Worth (4.91)* Charlotte-Mecklenburg (-0.7)District of Columbia (214) Clark County (3.83)* Large City (-1.3)Jefferson County (214) Dallas (3.54) Los Angeles (-3.3)+
New York City (212) Cleveland (3.34) Austin (-3.9)Large City (212) New York City (3.20)* Jefferson County (-4.2)+
Albuquerque (208) Chicago (2.71)* Milwaukee (-4.7)+
Chicago (208) Large City (1.51)* Baltimore (-7.0)+
Los Angeles (205) Houston (0.93) Houston (-7.9)++
Shelby County (205) All Others (0.86)* New York City (-9.3)+
Fort Worth (204) Shelby County (-0.71)Fresno (204) Jefferson County (-0.89)Houston (204) Fresno (-1.39)Dallas (203) Albuquerque (-1.56)Philadelphia (197) Los Angeles (-4.94)*Cleveland (196) Philadelphia (-6.02)*Baltimore (193) Baltimore (-7.24)*Milwaukee (190) Milwaukee (-10.89)*Detroit (183) Detroit (-11.19)*#Only 18 urban school districts participated in TUDA in 2009.*District effect is significantly different from zero.+Difference in district effect between 2009 and 2019 is significant.

36 MIRRORS OR WINDOWS: HOW WELL DO LARGE CITY PUBLIC SCHOOLS OVERCOME THE EFFECTS OF POVERTY AND OTHER BARRIERS?
Exhibit 25. Actual NAEP Eighth-grade Reading Scale Scores, Expected Means, and District Effects in TUDA Districts, 2009 to 2019.Jurisdic�on 2009 2011 2013 2015 2017 2019
AlbuquerqueActual MeanExpected MeanDistrict Effect
AtlantaActual MeanExpected MeanDistrict Effect
Aus�nActual MeanExpected MeanDistrict Effect
Bal�moreActual MeanExpected MeanDistrict Effect
BostonActual MeanExpected MeanDistrict Effect
Charlo�eActual MeanExpected MeanDistrict Effect
ChicagoActual MeanExpected MeanDistrict Effect
Clark County (NV)Actual MeanExpected MeanDistrict Effect
ClevelandActual MeanExpected MeanDistrict Effect
DallasActual MeanExpected MeanDistrict Effect
DetroitActual MeanExpected MeanDistrict Effect
District of Columbia(DCPS)
Actual MeanExpected MeanDistrict Effect
Duval County (FL)Actual MeanExpected MeanDistrict Effect
Fort Worth (TX)Actual MeanExpected MeanDistrict Effect
FresnoActual MeanExpected MeanDistrict Effect
Guilford County (NC)Actual MeanExpected MeanDistrict Effect
Hillsborough County(FL)
Actual MeanExpected MeanDistrict Effect
HoustonActual MeanExpected MeanDistrict Effect
Jefferson County (KY)Actual MeanExpected MeanDistrict Effect
Los AngelesActual MeanExpected MeanDistrict Effect
MiamiActual MeanExpected MeanDistrict Effect
MilwaukeeActual MeanExpected MeanDistrict Effect
New York CityActual MeanExpected MeanDistrict Effect
PhiladelphiaActual MeanExpected MeanDistrict Effect
San DiegoActual MeanExpected MeanDistrict Effect
Shelby County (TN)Actual MeanExpected MeanDistrict Effect
247.78253.10-5.32*
253.67256.93-3.26*
251.66257.85-6.19*
252.69257.55-4.86*
255.41256.54-1.12
255.38248.966.41*
254.87250.114.76*
253.54249.444.10*
250.34245.514.83*
254.29251.34
2.94
252.87250.58
2.29262.97258.654.32*
262.14258.763.38*
261.72258.822.89*
260.71256.973.74*
261.63254.926.71*
257.86256.31
1.55242.73247.29-4.57*
241.90242.56-0.65
244.27246.37-2.10
252.52250.57
1.96
247.35249.68-2.33
245.90245.77
0.13257.50246.1311.36*
261.87249.3212.55*
258.71249.828.89*
257.22248.039.19*
256.23249.047.19*
258.46248.659.81*
266.99263.433.56*
264.87260.444.43*
259.55257.092.45*
261.84259.71
2.13
260.64262.31-1.66
263.86261.77
2.09252.75248.534.22*
258.93253.875.06*
257.15250.506.65*
253.75251.472.28*
253.03248.324.71*
249.62245.843.78*
256.23256.20
0.03
258.54258.41
0.14242.84236.426.42*
242.66239.303.37*
237.76239.56-1.80
240.79239.80
0.99
239.26239.10
0.15
239.93239.01
0.92242.07236.455.62*
246.47238.827.65*
250.30243.646.65*
251.67246.395.29*
247.54245.102.44*
231.79235.77-3.98*
235.85240.19-4.34*
237.79241.52-3.73*
239.61242.77-3.16*
237.62242.22-4.61*
233.32242.27-8.95*
246.73251.90-5.16*
245.83248.75-2.92*
245.55248.26-2.71*
239.21247.00-7.79*
241.76247.47-5.71*
251.34249.72
1.62258.14255.632.52*
263.29260.712.58*
264.39262.88
1.51242.77244.65-1.88
248.59247.82
0.77242.71249.22-6.50*
244.60253.37-8.76*
242.51252.37-9.86*
245.40252.61-7.21*
238.32247.90-9.58*
240.11244.79-4.68
258.28257.51
0.78
259.89260.58-0.69
260.64255.525.12*
265.16261.124.04*
261.54258.283.26*
267.50262.614.89*
264.30258.875.43*
252.81249.902.92*
252.21247.694.53*
248.78246.49
2.29
249.60251.49-1.89
252.02251.60
0.42
252.50251.76
0.74257.96257.21
0.75
260.94262.11-1.17
261.83260.53
1.30
260.69262.35-1.67
259.94261.31-1.37
258.63259.69-1.06
248.45252.38-3.93*
254.78256.92-2.14*
251.28253.43-2.15*
250.18254.76-4.58*
246.87249.26-2.39*
244.51244.09
0.43261.96255.266.70*
261.26256.634.63*
265.22257.837.39*
259.16256.852.31*
260.09255.045.06*
260.81253.946.87*
242.74246.26-3.52*
239.30243.88-4.58*
240.70242.76-2.06
245.04246.71-1.67
242.73244.52-1.80
255.38251.523.86*
259.24256.742.49*
258.61255.183.43*
256.78253.273.51*
255.07250.484.59*
253.74251.54
2.20243.13246.12-2.99*
249.37249.82-0.45
248.65250.38-1.73
248.72248.27
0.45
247.46246.66
0.80
247.82245.36
2.46265.95263.37
2.58
265.43264.04
1.39
262.29262.00
0.29
259.97262.04-2.07
256.76257.74-0.98
254.89255.81-0.91
248.81246.87
1.93
247.92250.52-2.59

37COUNCIL OF THE GREAT CITY SCHOOLS
Exhibit 26. Trends in District Effects in Eighth-grade Reading by City, 2009 to 2019.

38 MIRRORS OR WINDOWS: HOW WELL DO LARGE CITY PUBLIC SCHOOLS OVERCOME THE EFFECTS OF POVERTY AND OTHER BARRIERS?
The following exhibit compares how the districts ranked with each other when looking at 2019 NAEP scale scores versus the “effects” that each district produced. The table also shows Large City School district effects and districts that produced an “effect” that was larger than All Others, and it ranks changes in district effects between 2009 and 2019.
Exhibit 27. Ranking of TUDA Districts on Eighth-grade Reading Scale Scores, 2019 District Effects, and Trends on District Effects.
SCALE SCORE 2019 DISTRICT EFFECTS 2019 CHANGE IN DISTRICT EFFECTS, 2009-2019#
San Diego (266) Boston (11.36)* District of Columbia (7.3)+
All Others (265) Miami-Dade County (6.70)* Detroit (5.0)+
Miami-Dade County (262) Cleveland (6.42)* San Diego (3.5)Charlotte (261) Atlanta (6.41)* Cleveland (3.0)Hillsborough County (261) Dallas (5.62)* Jefferson County (1.8)Duval County (258) Hillsborough (5.12)* New York City (1.7)Guilford County (258) Chicago (4.22)* Atlanta (1.6)Jefferson County (258) New York City (3.86)* Boston (1.6)Austin (257) San Diego (2.58) Large City (0.5)Boston (257) Duval County (2.52)* Chicago (0.4)Denver (257) Houston (2.29) All Others (0.4)Clark County (256) Charlotte (2.13) Miami-Dade County (-0.2) Atlanta (255) Shelby County (1.93) Milwaukee (-0.3)Large City (255) District of Columbia (1.62) Charlotte-Mecklenburg (-0.3)New York City (254) Large City (1.62)* Baltimore (-0.8)Chicago (253) Austin (1.55) Fresno (-1.8)District of Columbia (251) Guilford County (0.78) Houston (-2.2)Albuquerque (249) Jefferson County (0.75) Los Angeles (-4.4)+
Houston (249) All Others (0.29) Austin (-5.2)+
Shelby County (249) Clark County (0.03) Philadelphia (-5.4)+ Los Angeles (248) Baltimore (-0.65)Fort Worth (243) Fort Worth (-1.88)Philadelphia (243) Milwaukee (-2.06)Cleveland (242) Philadelphia (-2.99)*Dallas (242) Los Angeles (-3.93)*Fresno (242) Detroit (-3.98)*Baltimore (241) Albuquerque (-5.32)*Milwaukee (240) Fresno (-6.50)*Detroit (232)#Only 18 urban school districts participated in TUDA in 2009.*District effect is significantly different from zero.+Difference in district effect between 2009 and 2019 is significant.

39COUNCIL OF THE GREAT CITY SCHOOLS
(d) City-by-City Trends
The data in the previous exhibits were also meant to answer the question about whether Large City Schools were getting better over time at overcoming or mitigating the effects of poverty, language, and other demographic variables.
In grade-four mathematics, eighteen of the 27 districts have trend lines that extend from 2009 to 2019, and six of these districts show significantly larger district effects in 2019 than they did in 2009: the District of Columbia, Detroit, Miami-Dade County, Chicago, Cleveland, and Atlanta (Exhibit 18). Three districts were notable for having gone from below statistical expectations in 2009 (i.e., the zero line) to above statistical expectations in 2019: Chicago, Cleveland, and the District of Columbia.
In grade-eight mathematics, eighteen of the 27 districts have trend lines that extend from 2009 to 2019, and seven of these districts show significantly larger district effects in 2019 than they did in 2009: the District of Columbia, Detroit, Chicago, Atlanta, Charlotte-Mecklenburg, Jefferson County, and Miami-Dade County (Exhibit 21). Notably, the District of Columbia went from below statistical expectations in 2009 (i.e., the zero line) to above statistical expectations in 2019.
In grade-four reading, eighteen of the 27 districts have trend lines that extend from 2009 to 2019, and three of these districts show significantly larger district effects in 2019 than they did in 2009: the District of Columbia, Cleveland, and Miami-Dade County (Exhibit 24). Notably, the District of Columbia went from below statistical expectations in 2009 (i.e., the zero line) to above statistical expectations in 2019.
Finally, in grade-eight reading, eighteen of the 27 districts have trend lines that extend from 2009 to 2019, and two of these districts show significantly larger district effects in 2019 than they did in 2009: the District of Columbia and Detroit. No district moved from significantly below zero to significantly above zero during the ten-year period in eighth-grade reading.
Overall, there were notable trends. Several districts posted significantly larger district effects in all four grade/subject combinations in 2019: Boston, Miami-Dade County, Hillsborough County, Atlanta, and Chicago. Several others had significant district effects in three of four grade/subject combinations: Dallas, Cleveland, New York City, Duval County, Fort Worth, Charlotte-Mecklenburg, the District of Columbia, Austin, and Guilford County. In addition, between 2009 and 2019, districts that showed significantly larger effects over the period in at least two grade/subject combinations included the District of Columbia, Detroit, Miami-Dade County, Chicago, Cleveland, and Atlanta. The District of Columbia posted the largest increases of any other TUDA district in all four grade/subject combinations, including moving from below statistical expectations to above statistical expectations in three of four grade/subject combinations. (See Exhibit 28.)

40 MIRRORS OR WINDOWS: HOW WELL DO LARGE CITY PUBLIC SCHOOLS OVERCOME THE EFFECTS OF POVERTY AND OTHER BARRIERS?
Exhibit 28. Districts with Larger District Effects in Multiple Grade/Subject Combinations in 2019 and Districts with At Least Two Significantly Larger Trends between 2009 and 2019.
SIGNIFICANTLY LARGER DISTRICT EFFECTS IN ALL FOUR GRADE/
SUBJECT COMBINATIONS IN 2019
SIGNIFICANTLY LARGER DISTRICT EFFECTS IN THREE GRADE/SUBJECT
COMBINATIONS IN 2019
SIGNIFICANTLY LARGER DISTRICT EFFECTS IN AT LEAST TWO GRADE/
SUBJECT COMBINATIONS FROM 2009 TO 2019
Boston Dallas District of ColumbiaMiami-Dade County Cleveland DetroitHillsborough County New York City Miami-Dade CountyAtlanta Duval County ChicagoChicago Fort Worth Cleveland
Charlotte-Mecklenburg AtlantaDistrict of ColumbiaAustinGuilford County

41COUNCIL OF THE GREAT CITY SCHOOLS
This section looks at three mitigating circumstances for the results we have described in the previous sections: the effects of abject or concentrated poverty, the influence of race/ethnicity, and the possible consequences of college and career-readiness standards on Large City Schools results.
(a) Influence of Abject and Concentrated Poverty
An initial review of results after adjusting for relevant background variables indicated that they may not fully control for poverty. The question emerged about whether the free or reduced-price lunch-eligibility measure used by NAEP sufficiently differentiated poverty levels or took adequate account of deep or abject poverty. The National School Lunch Act in 1946 created the modern school lunch program though the U.S. Department of Agriculture, and about 7.1 million children were participating in it by the end of its first year, 1946-47. In 2012, more than 31.6 million children were participating in the program.
The program provides free meals to eligible children in households with income at or below 130 percent of federal poverty guidelines, and reduced-price meals to eligible children in households with income above 130 percent but at or below 185 percent of poverty. Unfortunately, as the number of participating students rose and the income categories remained the same, the lunch-eligibility data became less and less able to differentiate the very poor from the poor and near-poor.
The distinction between levels of poverty becomes important, however, as we look at which districts are most able to overcome or mitigate the effects of poverty and other barriers—and conversely, which ones have a more difficult challenge. Exhibit 29 shows the difference in abject poverty across districts.
Using free and reduced-priced lunch as a proxy for poverty has been an acceptable and frequently used measure in many research studies, but it has flaws. In fact, the measure has become increasingly problematic because of the new Community Eligibility Provision (CEP). The CEP is a meal service option for schools and school districts in low-income areas. A key provision of The Healthy, Hunger Free Kids Act (HHFKA, Public Law 111-296, December 13, 2010), CEP allows the highest poverty schools to serve breakfast and lunch at no cost to all enrolled students without the burden of collecting household applications. Instead, schools that adopt CEP are reimbursed using a formula (1.6 times direct certification) based on the percentage of students participating in other means-tested programs, such as the Supplemental Nutrition Assistance Program (SNAP) and Temporary Assistance for Needy Families (TANF).
Mitigating Circumstances

42 MIRRORS OR WINDOWS: HOW WELL DO LARGE CITY PUBLIC SCHOOLS OVERCOME THE EFFECTS OF POVERTY AND OTHER BARRIERS?
As a result, a school that may have 85 percent of its students eligible for free and reduced-priced lunch will serve 100 percent of students. Obviously, the change has been important for ensuring that students have adequate nutrition, but the new provision has been problematic for researchers trying to measure poverty or use it in their analyses. The changes, for instance, have affected the ability to maintain trend lines in poverty levels and obtain accurate counts of students in poverty. Researchers have tried to use a combination of direct certification, census poverty data using geocodes, imputed variables, and prior information to determine a best metric, but the attempts have not always been fully successful.
Finally, poverty thresholds in the federal free or reduced-price lunch data do not vary by geography. They also do not account for students who are at or below the 100 percent poverty threshold. And poverty rates are compounded as the costs of living vary across cities (e.g., New York City vs. Cleveland).
For these reasons, we use Census income data as a proxy for school-level income. The table below (Exhibit 29) shows income levels in TUDA districts according to bands of income below $50,000 annually, using Census income data for 2019. For the purposes of this analysis, abject poverty is defined as annual income below $15,000. Among TUDA districts, abject poverty ranges from 7.9 percent in Charlotte-Mecklenburg to 25.3 percent in the Cleveland Metropolitan School District.
Exhibit 29. Percentage of Households by Income Level in TUDA Districts, 2019.
LESS THAN $10,000
$10,000 TO $14,999
$15,000 TO $24,999
$25,000 TO $34,999
$35,000 TO $49,999
TOTAL PERCENT
OF FAMILIES12
Cleveland Metropolitan School District
15.3% 10.0% 15.2% 12.6% 12.8% 65.9%
Detroit City School District 16.9% 7.5% 13.0% 13.5% 14.9% 65.8%Milwaukee School District 9.6% 6.3% 13.6% 10.5% 15.9% 55.9%Fresno Unified School District 10.4% 6.8% 11.9% 13.0% 13.1% 55.2%Shelby County School District 9.3% 7.1% 10.8% 11.4% 14.8% 53.4%Philadelphia City School District 12.2% 6.6% 9.7% 9.9% 13.3% 51.7%Baltimore City Public Schools 12.30 5.4% 8.6% 10.6% 13.1% 50.0%Guilford County Schools 7.4% 4.6% 9.6% 9.8% 14.8% 46.2%Fort Worth Independent School District
8.5% 4.3% 8.8% 11.0% 13.5% 46.1%
Miami-Dade County School District 8.0% 5.3% 9.8% 10.3% 12.2% 45.6%Houston Independent School District
8.2% 4.6% 10.2% 9.6% 12.5% 45.1%
Dallas Independent School District 8.6% 4.0% 9.0% 9.0% 14.4% 45.0%Albuquerque Public Schools 7.9% 5.0% 9.3% 9.5% 12.6% 44.3%Jefferson County School District 6.4% 4.1% 9.3% 9.7% 13.3% 42.8%Duval County School District 6.8% 3.8% 8.8% 9.5% 13.8% 42.7%
12 No statistical adjustments were made for family size.
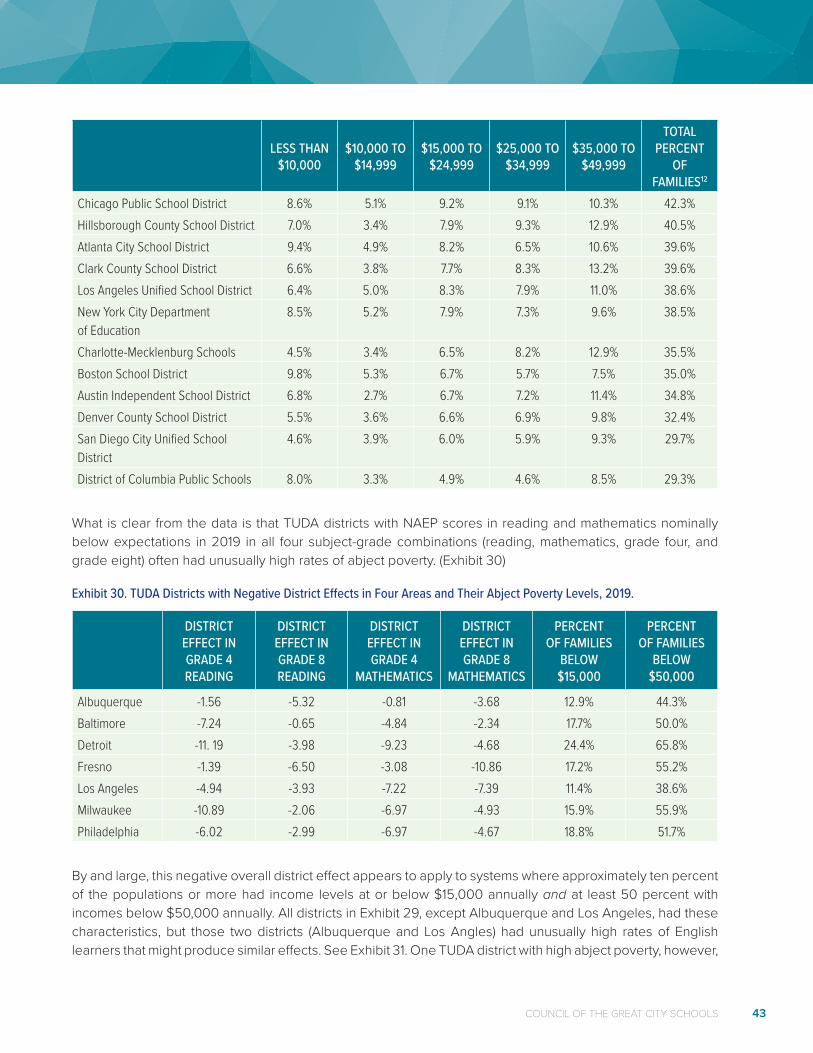
43COUNCIL OF THE GREAT CITY SCHOOLS
LESS THAN $10,000
$10,000 TO $14,999
$15,000 TO $24,999
$25,000 TO $34,999
$35,000 TO $49,999
TOTAL PERCENT
OF FAMILIES12
Chicago Public School District 8.6% 5.1% 9.2% 9.1% 10.3% 42.3%Hillsborough County School District 7.0% 3.4% 7.9% 9.3% 12.9% 40.5%Atlanta City School District 9.4% 4.9% 8.2% 6.5% 10.6% 39.6%Clark County School District 6.6% 3.8% 7.7% 8.3% 13.2% 39.6%Los Angeles Unified School District 6.4% 5.0% 8.3% 7.9% 11.0% 38.6%New York City Department of Education
8.5% 5.2% 7.9% 7.3% 9.6% 38.5%
Charlotte-Mecklenburg Schools 4.5% 3.4% 6.5% 8.2% 12.9% 35.5%Boston School District 9.8% 5.3% 6.7% 5.7% 7.5% 35.0%Austin Independent School District 6.8% 2.7% 6.7% 7.2% 11.4% 34.8%Denver County School District 5.5% 3.6% 6.6% 6.9% 9.8% 32.4%San Diego City Unified School District
4.6% 3.9% 6.0% 5.9% 9.3% 29.7%
District of Columbia Public Schools 8.0% 3.3% 4.9% 4.6% 8.5% 29.3%
What is clear from the data is that TUDA districts with NAEP scores in reading and mathematics nominally below expectations in 2019 in all four subject-grade combinations (reading, mathematics, grade four, and grade eight) often had unusually high rates of abject poverty. (Exhibit 30)
Exhibit 30. TUDA Districts with Negative District Effects in Four Areas and Their Abject Poverty Levels, 2019.
DISTRICT EFFECT IN GRADE 4 READING
DISTRICT EFFECT IN GRADE 8 READING
DISTRICT EFFECT IN GRADE 4
MATHEMATICS
DISTRICT EFFECT IN GRADE 8
MATHEMATICS
PERCENT OF FAMILIES
BELOW $15,000
PERCENT OF FAMILIES
BELOW $50,000
Albuquerque -1.56 -5.32 -0.81 -3.68 12.9% 44.3%Baltimore -7.24 -0.65 -4.84 -2.34 17.7% 50.0%Detroit -11. 19 -3.98 -9.23 -4.68 24.4% 65.8%Fresno -1.39 -6.50 -3.08 -10.86 17.2% 55.2%Los Angeles -4.94 -3.93 -7.22 -7.39 11.4% 38.6%Milwaukee -10.89 -2.06 -6.97 -4.93 15.9% 55.9%Philadelphia -6.02 -2.99 -6.97 -4.67 18.8% 51.7%
By and large, this negative overall district effect appears to apply to systems where approximately ten percent of the populations or more had income levels at or below $15,000 annually and at least 50 percent with incomes below $50,000 annually. All districts in Exhibit 29, except Albuquerque and Los Angeles, had these characteristics, but those two districts (Albuquerque and Los Angles) had unusually high rates of English learners that might produce similar effects. See Exhibit 31. One TUDA district with high abject poverty, however,

44 MIRRORS OR WINDOWS: HOW WELL DO LARGE CITY PUBLIC SCHOOLS OVERCOME THE EFFECTS OF POVERTY AND OTHER BARRIERS?
showed positive district effects in 2019 in three grade-subject combinations (fourth grade reading and eighth grade reading and mathematics)—Cleveland. Interestingly, Cleveland also went from below the zero line to above it in at least one area between 2009 and 2019—fourth-grade mathematics.
(b) Historical and Racial Context
In addition to issues of abject poverty, issues of race/ethnicity, the historical legacy of discrimination, and disproportionate urban disinvestments may also inform the student performance levels presented here. Several cities in the TUDA sample have a history where Black communities were subject to sustained legal isolation, oppression, and a lack of investment that left many of those communities without the social and economic capital they needed to support educational progress. This historical pattern can be found in Baltimore, Cleveland, Detroit, Milwaukee, Philadelphia, and many other urban centers.
The segregation or “redlining” of many Black communities and their institutions in these cities over considerable time made it increasingly difficult for individuals of color to buy homes, borrow against the value of their homes, or start businesses and improve their properties (see Eisenhaur, 2001 or Sugrue, 2005, for example). The result was that owner occupancy was reduced, property values were lowered, housing quality slipped, and racial segregation increased. Many of these communities also saw the exit of grocery stores, gas stations, movie theaters, and banks that further isolated the communities, lowered the quality of life, and left these communities without the wherewithal to compete with other better endowed locations.
A recent analysis by the Washington Post13 demonstrated that, in general, median Black household wealth (i.e., income, home value, investments, property, and other assets) as a percent of median White household wealth was no higher in 2016 (8.7 percent) than it was in 1968 (9.4 percent). The authors found that the typical White household headed by someone with only a high school diploma had almost 10 times the wealth of a Black family with the same education. In terms of income alone, the data showed that median annual Black income (adjusted for inflation) had dropped to $41,361 in 2018, a level below their median income in 2000 and only 56.6 percent of the median White income, which has risen since 2000. In addition, overall employment rates were lower than those among Whites, as were liquid assets. These patterns are particularly stark in several of the TUDA cities, like Baltimore, Detroit, and Philadelphia, where academic performance is below statistical expectations.
This situation has taken a toll on schools in communities and cities where Blacks live in large numbers. The reduction in property values alone reduced the financial investment in schools, which is often reliant on this critical revenue source. In addition, the disinvestment was evident in state funding of school districts that were predominantly African American, like Philadelphia. Increased jobless rates and lower income levels also meant that families were often unable to provide the educational tools and activities that many other families would have taken for granted. Violence resulting from these conditions may have made learning climates suboptimal as well.
The names of neighborhoods affected by these conditions from city-to-city differed, but the dynamics were similar. Whether it was the Fairfield neighborhood in Baltimore; Forest Park in Detroit; Triangle North in Milwaukee; or Strawberry Mansion in Philadelphia, the systematic deprivation of resources and investment in these and other neighborhoods left schools and other institutions that residents relied on unable to adequately serve and support them.
13 Long, Heather and Andrew Van Dam, 2021. “The black-white economic divide is as wide as it was in 1968.” Washington Post, June 4, 2020.

45COUNCIL OF THE GREAT CITY SCHOOLS
In this context, the inability of school districts in these communities to make academic gains is hardly surprising. School districts sharing this history may simply need more time, greater reinvestments, and the right strategies before academic improvements can take root. School districts, like Cleveland and Shelby County (Memphis), which have demographic characteristics like those with consistently negative district effects, have been pursuing their reform efforts for an extended period and have seen gains. This suggests that improvements are possible once the right supports, investments, and strategies are put into place and sustained. But it may take longer than just a few years to address the cumulative effects of centuries of oppression, disinvestment, and disenfranchisement.
Our analysis also indicates that concentrated numbers and percentages of English learners may have similarly outsized effects on district performance, as is likely in Los Angeles, Albuquerque, and Fresno. (See Exhibit 31.) These city school districts have student ELL rates over 15 percent. Still, districts like Boston (29.2 percent), Chicago (18.2 percent), Dallas (40.7 percent), and Denver (27.4 percent) have similar rates of ELLs but have shown significant positive district effects and improvements. In each case, however, these districts have pursued reforms over an extended period. It may simply be the case that districts that have not shown as much headway need more time and the right mix of investments and strategies.
Other factors, of course, may be at work in these school districts, but it is important to remember the context in which they have operated over many years.
Exhibit 31. TUDA Districts with Negative District Effects in Four Areas and Their Percentage of Black Students and ELLs, 2019.
DISTRICT EFFECT IN GRADE 4 READING
DISTRICT EFFECT IN GRADE 8 READING
DISTRICT EFFECT IN GRADE 4
MATHEMATICS
DISTRICT EFFECT IN GRADE 8
MATHEMATICS
PERCENT OF DISTRICT STUDENTS WHO WERE
BLACK
PERCENT OF DISTRICT STUDENTS WHO WERE
ENGLISH LEARNERS
Albuquerque -1.56 -5.32 -0.81 -3.68 2.52% 16.98%Baltimore -7.24 -0.65 -4.84 -2.34 78.57% 6.81%Detroit -11.19 -3.98 -9.23 -4.68 82.04% 12.41%Fresno -1.39 -6.50 -3.08 -10.86 8.20% 18.84%Los Angeles -4.94 -3.93 -7.22 -7.39 8.37% 20.56%Milwaukee -10.89 -2.06 -6.97 -4.93 51.50% 11.95%Philadelphia -6.02 -2.99 -6.97 -4.67 49.24% 11.70%
(c) Effects of College- and Career-Ready Standards
One of the recurring questions that some observers have asked involves the consequences of college and career-ready standards on NAEP results. This question has emerged because of the apparent slow-down in NAEP gains over the last several years. To answer this question, the National Center for Educational Statistics conducted an analysis of differences in mathematics content assessed on NAEP and the content of state
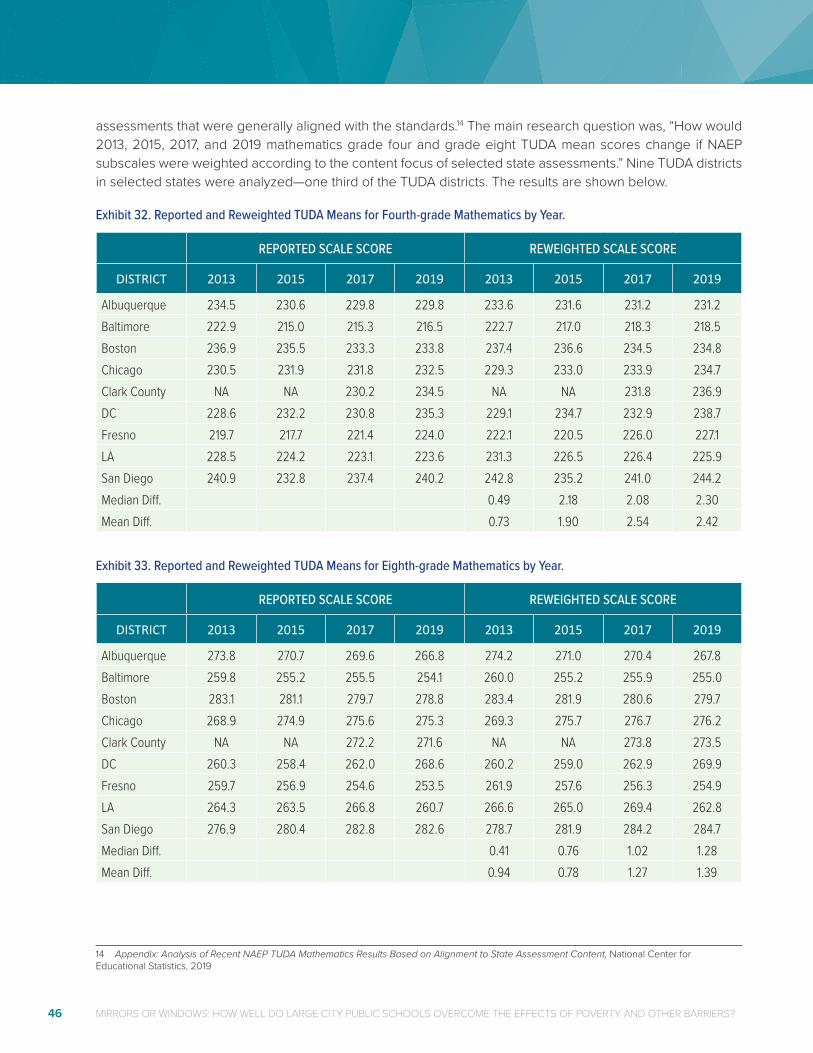
46 MIRRORS OR WINDOWS: HOW WELL DO LARGE CITY PUBLIC SCHOOLS OVERCOME THE EFFECTS OF POVERTY AND OTHER BARRIERS?
assessments that were generally aligned with the standards.14 The main research question was, “How would 2013, 2015, 2017, and 2019 mathematics grade four and grade eight TUDA mean scores change if NAEP subscales were weighted according to the content focus of selected state assessments.” Nine TUDA districts in selected states were analyzed—one third of the TUDA districts. The results are shown below.
Exhibit 32. Reported and Reweighted TUDA Means for Fourth-grade Mathematics by Year.
REPORTED SCALE SCORE REWEIGHTED SCALE SCORE
DISTRICT 2013 2015 2017 2019 2013 2015 2017 2019
Albuquerque 234.5 230.6 229.8 229.8 233.6 231.6 231.2 231.2Baltimore 222.9 215.0 215.3 216.5 222.7 217.0 218.3 218.5Boston 236.9 235.5 233.3 233.8 237.4 236.6 234.5 234.8Chicago 230.5 231.9 231.8 232.5 229.3 233.0 233.9 234.7Clark County NA NA 230.2 234.5 NA NA 231.8 236.9DC 228.6 232.2 230.8 235.3 229.1 234.7 232.9 238.7Fresno 219.7 217.7 221.4 224.0 222.1 220.5 226.0 227.1LA 228.5 224.2 223.1 223.6 231.3 226.5 226.4 225.9San Diego 240.9 232.8 237.4 240.2 242.8 235.2 241.0 244.2Median Diff. 0.49 2.18 2.08 2.30Mean Diff. 0.73 1.90 2.54 2.42
Exhibit 33. Reported and Reweighted TUDA Means for Eighth-grade Mathematics by Year.
REPORTED SCALE SCORE REWEIGHTED SCALE SCORE
DISTRICT 2013 2015 2017 2019 2013 2015 2017 2019
Albuquerque 273.8 270.7 269.6 266.8 274.2 271.0 270.4 267.8Baltimore 259.8 255.2 255.5 254.1 260.0 255.2 255.9 255.0Boston 283.1 281.1 279.7 278.8 283.4 281.9 280.6 279.7Chicago 268.9 274.9 275.6 275.3 269.3 275.7 276.7 276.2Clark County NA NA 272.2 271.6 NA NA 273.8 273.5DC 260.3 258.4 262.0 268.6 260.2 259.0 262.9 269.9Fresno 259.7 256.9 254.6 253.5 261.9 257.6 256.3 254.9LA 264.3 263.5 266.8 260.7 266.6 265.0 269.4 262.8San Diego 276.9 280.4 282.8 282.6 278.7 281.9 284.2 284.7Median Diff. 0.41 0.76 1.02 1.28Mean Diff. 0.94 0.78 1.27 1.39
14 Appendix: Analysis of Recent NAEP TUDA Mathematics Results Based on Alignment to State Assessment Content, National Center for Educational Statistics, 2019
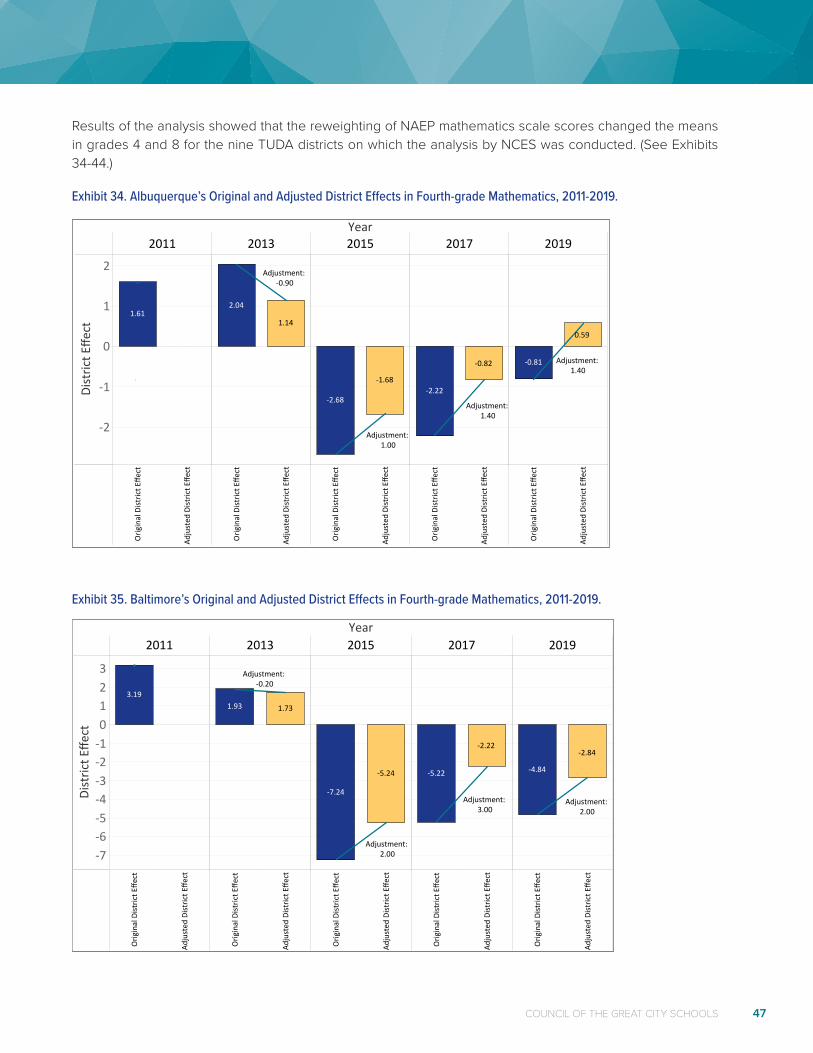
47COUNCIL OF THE GREAT CITY SCHOOLS
Results of the analysis showed that the reweighting of NAEP mathematics scale scores changed the means in grades 4 and 8 for the nine TUDA districts on which the analysis by NCES was conducted. (See Exhibits 34-44.)
Exhibit 34. Albuquerque’s Original and Adjusted District Effects in Fourth-grade Mathematics, 2011-2019.
Exhibit 35. Baltimore’s Original and Adjusted District Effects in Fourth-grade Mathematics, 2011-2019.
Year2011 2013 2015 2017 2019
Orig
inal
Dist
rict Effe
ct
Adju
sted
Dist
rict Effe
ct
Orig
inal
Dist
rict Effe
ct
Adju
sted
Dist
rict Effe
ct
Orig
inal
Dist
rict Effe
ct
Adju
sted
Dist
rict Effe
ct
Orig
inal
Dist
rict Effe
ct
Adju
sted
Dist
rict Effe
ct
Orig
inal
Dist
rict Effe
ct
Adju
sted
Dist
rict Effe
ct
-2
-1
0
1
2
Dist
rict Effe
ct
1.61
Adjustment:
1.14
2.04
Adjustment: -0.90
-1.68
-2.68
Adjustment: 1.00
-0.82
-2.22
Adjustment: 1.40
0.59
-0.81 Adjustment: 1.40
Year2011 2013 2015 2017 2019
Orig
inal
Dist
rict Effe
ct
Adju
sted
Dist
rict Effe
ct
Orig
inal
Dist
rict Effe
ct
Adju
sted
Dist
rict Effe
ct
Orig
inal
Dist
rict Effe
ct
Adju
sted
Dist
rict Effe
ct
Orig
inal
Dist
rict Effe
ct
Adju
sted
Dist
rict Effe
ct
Orig
inal
Dist
rict Effe
ct
Adju
sted
Dist
rict Effe
ct
-7-6-5-4-3-2-10123
Dist
rict Effe
ct
3.19
Adjustment:
1.731.93
Adjustment: -0.20
-5.24
-7.24
Adjustment: 2.00
-2.22
-5.22
Adjustment: 3.00
-2.84
-4.84
Adjustment: 2.00

48 MIRRORS OR WINDOWS: HOW WELL DO LARGE CITY PUBLIC SCHOOLS OVERCOME THE EFFECTS OF POVERTY AND OTHER BARRIERS?
Exhibit 36. Boston’s Original and Adjusted District Effects in Fourth-grade Mathematics, 2011-2019.
Exhibit 37. Chicago’s Original and Adjusted District Effects in Fourth-grade Mathematics, 2011-2019.
Year2011 2013 2015 2017 2019
Orig
inal
Dist
rict Effe
ct
Adju
sted
Dist
rict Effe
ct
Orig
inal
Dist
rict Effe
ct
Adju
sted
Dist
rict Effe
ct
Orig
inal
Dist
rict Effe
ct
Adju
sted
Dist
rict Effe
ct
Orig
inal
Dist
rict Effe
ct
Adju
sted
Dist
rict Effe
ct
Orig
inal
Dist
rict Effe
ct
Adju
sted
Dist
rict Effe
ct
02
4
6
8
10
12
14
Dist
rict Effe
ct
14.79Adjustment:
12.6712.17
Adjustment: 0.50
10.309.20
Adjustment: 1.10
10.729.52
Adjustment: 1.20
11.1310.13
Adjustment: 1.00
Year2011 2013 2015 2017 2019
Orig
inal
Dist
rict Effe
ct
Adju
sted
Dist
rict Effe
ct
Orig
inal
Dist
rict Effe
ct
Adju
sted
Dist
rict Effe
ct
Orig
inal
Dist
rict Effe
ct
Adju
sted
Dist
rict Effe
ct
Orig
inal
Dist
rict Effe
ct
Adju
sted
Dist
rict Effe
ct
Orig
inal
Dist
rict Effe
ct
Adju
sted
Dist
rict Effe
ct
-2-101234567
Dist
rict Effe
ct
-2.07
Adjustment:
1.052.25
Adjustment: -1.20
4.853.75
Adjustment: 1.10
6.26
4.16
Adjustment: 2.10
6.95
4.75
Adjustment: 2.20

49COUNCIL OF THE GREAT CITY SCHOOLS
Exhibit 38. Clark County’s Original and Adjusted District Effects in Fourth-grade Mathematics, 2017-2019.
Exhibit 39. District of Columbia’s Original and Adjusted District Effects in Fourth-grade Mathematics, 2011-2019.
Year2017 2019
Orig
inal
Dist
rict Effe
ct
Adju
sted
Dist
rict Effe
ct
Orig
inal
Dist
rict Effe
ct
Adju
sted
Dist
rict Effe
ct
-3
-2
-1
0
1
2
Dist
rict Effe
ct
-1.93
-3.53
Adjustment: 1.60
1.881.00
Adjustment: 0.88
Year2011 2013 2015 2017 2019
Orig
inal
Dist
rict Effe
ct
Adju
sted
Dist
rict Effe
ct
Orig
inal
Dist
rict Effe
ct
Adju
sted
Dist
rict Effe
ct
Orig
inal
Dist
rict Effe
ct
Adju
sted
Dist
rict Effe
ct
Orig
inal
Dist
rict Effe
ct
Adju
sted
Dist
rict Effe
ct
Orig
inal
Dist
rict Effe
ct
Adju
sted
Dist
rict Effe
ct
-4
-2
0
2
4
6
8
10
Dist
rict Effe
ct
-5.04
Adjustment:
2.181.68
Adjustment: 0.50 5.56
3.06
Adjustment: 2.50
4.922.82
Adjustment: 2.10
10.89
7.49
Adjustment: 3.40

50 MIRRORS OR WINDOWS: HOW WELL DO LARGE CITY PUBLIC SCHOOLS OVERCOME THE EFFECTS OF POVERTY AND OTHER BARRIERS?
Exhibit 40. Fresno’s Original and Adjusted District Effects in Fourth-grade Mathematics, 2011-2019.
Exhibit 41. Los Angeles’ Original and Adjusted District Effects in Fourth-grade Mathematics, 2011-2019.
Year2011 2013 2015 2017 2019
Orig
inal
Dist
rict Effe
ct
Adju
sted
Dist
rict Effe
ct
Orig
inal
Dist
rict Effe
ct
Adju
sted
Dist
rict Effe
ct
Orig
inal
Dist
rict Effe
ct
Adju
sted
Dist
rict Effe
ct
Orig
inal
Dist
rict Effe
ct
Adju
sted
Dist
rict Effe
ct
Orig
inal
Dist
rict Effe
ct
Adju
sted
Dist
rict Effe
ct
-9-8-7-6-5-4-3-2-10
Dist
rict Effe
ct
-7.75
Adjustment:
-4.75
-7.15
Adjustment: 2.40
-6.23
-9.03
Adjustment: 2.80
-0.64
-5.24Adjustment:
4.60
0.02
-3.08 Adjustment: 3.10
Year2011 2013 2015 2017 2019
Orig
inal
Dist
rict Effe
ct
Adju
sted
Dist
rict Effe
ct
Orig
inal
Dist
rict Effe
ct
Adju
sted
Dist
rict Effe
ct
Orig
inal
Dist
rict Effe
ct
Adju
sted
Dist
rict Effe
ct
Orig
inal
Dist
rict Effe
ct
Adju
sted
Dist
rict Effe
ct
Orig
inal
Dist
rict Effe
ct
Adju
sted
Dist
rict Effe
ct
-7
-6
-5
-4
-3
-2
-1
0
1
Dist
rict Effe
ct -3.44
Adjustment:
1.10
-1.70 Adjustment: 2.80
-3.45
-5.75
Adjustment: 2.30
-3.67
-6.97
Adjustment: 3.30
-4.92
-7.22
Adjustment: 2.30

51COUNCIL OF THE GREAT CITY SCHOOLS
Exhibit 42. San Diego’s Original and Adjusted District Effects in Fourth-grade Mathematics, 2011-2019.
The combination of the aggregate district effects and the mean adjustments to the effects also allows one to see a clearer trend line in the mathematics performance of Large City Schools. Using these adjustments, Large City Schools saw their overall district effects on fourth-grade mathematics improve from 2009 through 2015 before dipping in 2017 and then rising again to a new high in 2019.
Exhibit 43. Combined Large City District Effects in Fourth-grade Mathematics and Average Adjustments to Scale Scores, 2009-2019.
Year2011 2013 2015 2017 2019
Orig
inal
Dist
rict Effe
ct
Adju
sted
Dist
rict Effe
ct
Orig
inal
Dist
rict Effe
ct
Adju
sted
Dist
rict Effe
ct
Orig
inal
Dist
rict Effe
ct
Adju
sted
Dist
rict Effe
ct
Orig
inal
Dist
rict Effe
ct
Adju
sted
Dist
rict Effe
ct
Orig
inal
Dist
rict Effe
ct
Adju
sted
Dist
rict Effe
ct
-1
0
1
2
3
4
5
67
Dist
rict Effe
ct
4.98
Adjustment:
6.74
4.84
Adjustment: 1.90
1.29
-1.11
Adjustment: 2.40
6.07
2.47
Adjustment: 3.60
4.74
2.64
Adjustment: 2.10
Year2009 2011 2013 2015 2017 2019
Orig
inal
Dist
rict Effe
ct
Adju
sted
Dist
rict Effe
ct
Orig
inal
Dist
rict Effe
ct
Adju
sted
Dist
rict Effe
ct
Orig
inal
Dist
rict Effe
ct
Adju
sted
Dist
rict Effe
ct
Orig
inal
Dist
rict Effe
ct
Adju
sted
Dist
rict Effe
ct
Orig
inal
Dist
rict Effe
ct
Adju
sted
Dist
rict Effe
ct
Orig
inal
Dist
rict Effe
ct
Adju
sted
Dist
rict Effe
ct
0
1
2
3
4
5
Dist
rict Effe
ct
3.24
Adjustment:
3.05
Adjustment:
4.774.04
Adjustment: 0.73
4.88
2.98
Adjustment: 1.90
3.89
1.35
Adjustment: 2.54 5.54
3.12
Adjustment: 2.42

52 MIRRORS OR WINDOWS: HOW WELL DO LARGE CITY PUBLIC SCHOOLS OVERCOME THE EFFECTS OF POVERTY AND OTHER BARRIERS?
At the eighth-grade level, the trend line in mathematics improved between 2009 and 2019 once one considered adjustments to the scale scores.
Exhibit 44. Combined Large City District Effects in Eighth-grade Mathematics and Average Adjustments to Scale Scores, 2009-2019.
Year2009 2011 2013 2015 2017 2019
Orig
inal
Dist
rict Effe
ct
Adju
sted
Dist
rict Effe
ct
Orig
inal
Dist
rict Effe
ct
Adju
sted
Dist
rict Effe
ct
Orig
inal
Dist
rict Effe
ct
Adju
sted
Dist
rict Effe
ct
Orig
inal
Dist
rict Effe
ct
Adju
sted
Dist
rict Effe
ct
Orig
inal
Dist
rict Effe
ct
Adju
sted
Dist
rict Effe
ct
Orig
inal
Dist
rict Effe
ct
Adju
sted
Dist
rict Effe
ct
0
1
2
3
4
5
6
Dist
rict Effe
ct
3.09
Adjustment:
2.65
Adjustment:
3.54
2.60
Adjustment: 0.94
3.933.15
Adjustment: 0.78
4.87
3.60
Adjustment: 1.27
5.80
4.41
Adjustment: 1.39

53COUNCIL OF THE GREAT CITY SCHOOLS
Our next step was to go beyond identifying districts making outsized academic progress on NAEP to the how. How were some of these districts mitigating barriers and improving student achievement, and how can we apply these lessons more broadly? Are there approaches or strategies these districts were using that could inform the work of other major urban school systems?
To answer these questions, the Council embarked on a qualitative research effort to better understand the practices that might have driven the higher levels of performance and student growth observed in our statistical analysis. Between May 2018 and February 2019, the project team visited six districts: Boston Public Schools, Chicago Public Schools, the Dallas Independent School District, the District of Columbia Public Schools, Miami-Dade County Public Schools, and the San Diego Unified School District. Each of the districts were chosen for slightly different reasons, but all of them demonstrated results that were above expectations or results that showed substantial improvement between 2009 and 2019. Specifically—
◆ Boston demonstrated consistent results in fourth- and eighth-grade reading and mathematics that were well above statistical expectations in all areas in 2019. In addition, the district was above statistical expectations in every grade, subject, and year between 2009 and 2019.
◆ Chicago also showed reading and mathematics results in fourth- and eighth-grades that were above statistical expectations in 2019. Moreover, Chicago was one of only a handful of districts that showed gains in district effects in at least two grade/subject combinations, and it was one of the few districts showing gains between 2009 and 2019 that went from below expectations to above in at least one area.
◆ Dallas showed reading and mathematics results that were above statistical expectations in three of four grade/subject combinations, and it produced a district effect that was well-above its scale scores in all grades and subjects.
◆ The District of Columbia had a district effect in 2019 that was above statistical expectations in three of four grade/subject combinations. Moreover, the district improved its overall district effect by more than any other district in all four subject-grade combinations during the ten-year period. In addition, it went from below expectations to above expectations between 2009 and 2019 in three out of four grade-subject combinations--the only city to do so.
Case Studies: How Districts Improved

54 MIRRORS OR WINDOWS: HOW WELL DO LARGE CITY PUBLIC SCHOOLS OVERCOME THE EFFECTS OF POVERTY AND OTHER BARRIERS?
◆ Miami-Dade County also showed results that were above expectations in fourth- and eighth-grade reading and mathematics in 2019 and in most years over the ten-year period. Moreover, the district demonstrated some of the largest overall gains in both subjects and grades over the study period.
◆ San Diego posted results that were above statistical expectations in two of four grade/subject combinations in 2019: fourth-grade mathematics and fourth-grade reading.
Other districts could have been chosen as well. For instance, Denver could have been studied because of its overall positive district effects in grade-four reading and mathematics. Unfortunately, it only had results over two testing cycles and we could not calculate a district effect in eighth grade because no student questionnaire (SQ) data were collected. Cleveland or Atlanta might have been chosen as well because of their overall improvements over the last several years. And the Council team was convinced that Detroit was a district to watch over the next several years because of the substantial gains they were making.
In addition, the team conducted multiple visits to two ‘counterfactual’ districts. The Council selected these districts to study based on their chronically low achievement and stalled progress. During the review, the Council team noted several clear contrasts between these districts and the other six districts that helped put an even finer point on the patterns and practices we were observing. These contrasts were both striking and potentially informative for other districts seeking to address instructional challenges and make systemic improvements in teaching and learning.
After selecting these school districts, the Council’s academic and research staff conducted site visits to each city. During each visit, the project team interviewed the superintendent, school board members, chief academic officer, director of research and assessment, director of professional development, and head of district turnaround efforts, as well as focus groups of varying sizes of curriculum staff and content area experts, instructional coaches or other school support staff, principal supervisors, principals, teachers, parents, and community members. We reviewed organizational charts, strategic plans, professional development plans, and sample curriculum documents. In some districts, we also visited schools and debriefed school and district leaders following our walk-throughs. Finally, the Council team analyzed an extensive array of data on each district, in addition to the data shown in the previous sections, to better understand the nature and extent of district performance and improvement.
Readers should keep in mind that district case study information is accurate as of the time of our site visits. District programs, strategies, and priorities may have evolved or radically changed since we visited. Districts have also had to substantially change their instructional programming and operations with the onset of the COVID-19 pandemic.
While the six case study districts had very different contexts and histories of reform, there were several common features, themes, and practices that appeared to be connected to the progress seen in student performance on NAEP across these cities. These shared factors included—

55COUNCIL OF THE GREAT CITY SCHOOLS
Strong and Stable Leadership Focused on Instruction
The relative stability of leadership was cited as a key factor in the progress made by several of the site-visit districts. At a time of increasing leadership turnover in districts throughout the country, the relatively long tenures of superintendents in districts such as Miami, where Alberto Carvalho has been superintendent since 2008, and San Diego, where Cindy Marten served as superintendent from 2013 until her appointment as Deputy Secretary of Education in 2021, has enabled these districts to pursue a consistent and sustained reform agenda over the years.
In Dallas, Superintendent Michael Hinojosa’s first term spanned six years, from 2005 to 2011. Coming on the heels of a string of relatively short-lived leaders, this period was referred to by staff as a time of “instructional healing” in which the district was able to refocus its attention on teaching and learning and find the momentum necessary to drive instructional reform. When Hinojosa then returned to Dallas as superintendent in 2015, his historical knowledge of the district enabled him to quickly regain this momentum and continue moving the work forward. Staff in the district now commonly refer to his first and second terms as “Hinojosa 1.0” and “Hinojosa 2.0.”
We also observed that the impact of strong, longstanding leaders can affect a district for years. In Boston, staff still cite the impact of Tom Payzant’s 11 years as superintendent, and the culture of shared accountability that was built during that time and during the subsequent tenure of Carol Johnson. Kaya Henderson also served five years as chancellor of the District of Columbia Public Schools and as deputy chancellor before that.
Moreover, many of the districts benefitted from the stability of their curriculum and instruction leaders. The tenures of Janice Jackson, chief academic officer and then CEO of the Chicago Public Schools; Brian Pick, chief academic officer in the D.C. Public Schools (DCPS); Marie Izquierdo, long-time chief academic officer of the Miami-Dade County Public Schools; Ivonne Durant, chief academic officer in Dallas; and Linda Davenport, mathematics director of the Boston Public Schools serve as examples. The longevity of their instructional leadership teams has allowed these districts to maintain a consistent instructional approach and to build on their approaches over time even when there were transitions in the superintendents of those districts.
It is important to note, however, that it is not simply the stability of leadership that has yielded academic improvements in these cities, because one can find TUDA districts in our analysis where superintendent tenures were relatively long (i.e., over three years) and student achievement did not improve. Based on the interviews, leaders in districts that did improve, on the other hand, brought strength, primacy, and focus to their instructional programming for a sustained period and allocated the time and resources necessary to improve it.
In fact, districts like DCPS, Chicago, and Boston showed us that progress can be maintained and even accelerated despite leadership churn if a district sustains its focus on instruction and retains its broad instructional strategy.15 In DC, which had five chancellors over about 12 years, there was both consistency and intentionality in the sequencing of reforms. Starting with Michelle Rhee in 2007, the focus of the district’s reform efforts initially was on human capital, accountability, and building an effective teacher corps. This helped to create an overall environment where there was a perceived “brain gain”—talented people coming into the district because they saw an opportunity to turn around a once-failing system. Rhee’s deputy and
15 This same lesson was learned several years ago in the Charlotte-Mecklenburg public schools, which had several superintendents but who all sustained the same overall academic theories of action.

56 MIRRORS OR WINDOWS: HOW WELL DO LARGE CITY PUBLIC SCHOOLS OVERCOME THE EFFECTS OF POVERTY AND OTHER BARRIERS?
then successor Kaya Henderson expanded on this teacher-centered reform agenda. The district had reached a point where it had weeded out many of its weakest teachers and staff, so the next step was to further enhance the capacity of the remaining personnel by equipping them with the necessary curricular resources, guidance, and professional learning. Over the Henderson years, this focus expanded with school-based structures, new materials, and the content expertise necessary to help teachers effectively implement the district’s curricular resources. In other words, while the work evolved, each subsequent leader approached the district’s past efforts and successes as an important foundation for their work, all the while remaining focused on what was needed to further improve instruction. Chicago offers another similar story of a district that sustained and advanced its reforms across multiple superintendents.
This idea of strong leadership being defined by a focus on instruction prompted another big-picture observation. In some districts, the board of education was a full partner with the administration in improving district instruction, effectively supporting and monitoring district efforts to boost student achievement, while in other places school boards appeared to add little value. Where they were partners in the work, the board and the superintendent were largely on the same page about the district’s instructional vision and theory of action and provided effective oversight and accountability for meeting the system’s academic goals. In other cases, school boards were too focused on their own internal divisions and agendas to accelerate (or even impact) the administration’s work to boost student outcomes. In these instances, the boards can take credit for hiring effective CEO’s, but can take little credit for the academic gains that those superintendents and their staff attained.
Similarly, there were districts showing positive effects that were under the aegis of their mayors and others that were not. The data show that what city and district leaders did to improve the overall quality of instruction made a greater difference than the governance structure of the school systems per se.
Finally, in each of the districts we visited, strong, instruction-focused leadership was nurtured not only at the central office, but throughout the organization with the empowerment and support of principals and principal supervisors. In fact, several of the case-study districts reported that their instructional visions and theories of action were built, in part, around school leaders as the levers of change. As conduits between the district and schools, principal supervisors, and principals—in particular—were increasingly seen as critical to ensuring the success of this approach.
For example, when asked about factors driving district progress in Chicago, staff that were interviewed cited the fact that there was “genuine principal leadership” in the district. But the district took a more strategic approach than just deploying strong school leaders and hoping for district transformation. Principals were empowered to make decisions that were right for their communities—a situation that has been in place in Chicago since the late 1980s—but the district ensured via its new network structure and Network Chiefs that principals were sufficiently supported, coached, and held accountable for academic results. In other words, Chicago used its network structure and principal supervisors to realign its organizational structure around the instructional focus it wanted to achieve systemwide.
Area Superintendents in San Diego also described a strong, hands-on relationship with principals, meeting with them regularly throughout the year to review school-wide progress and help determine goals. In our interviews with the district leadership team, they told us that they believed it was the support and oversight structure of the school system that allowed for their site-based approach to the work (a dynamic that does not necessarily work in other districts). “We don’t need top-down assessment to know if we are making progress

57COUNCIL OF THE GREAT CITY SCHOOLS
because we have such a strong connection to schools through the Area Superintendents,” one leader explained.
Importantly, to ensure that principal supervisors are equipped to effectively advance school leadership and capacity in this way, their roles have been explicitly and intentionally redefined around instruction. Where in past years principal supervisors oversaw a host of administrative and operational issues, these districts (and others across the country) have taken multiple steps (including narrowing spans of control, rewriting supervisor job descriptions, reallocating operational responsibilities to other staff or offices, and providing professional development in coaching) that fundamentally refocused their work with schools and principals around bolstering instructional effectiveness. In addition to Chicago and San Diego, Dallas, Miami, and the District of Columbia all did this to one extent or another.
High Standards and Common Instructional Guidance and Support
It also appeared from our site visits that academic standards and high quality curriculum played an important role in the improvement of some of the districts we examined. For instance, leadership of the Chicago and the District of Columbia public schools used the onset of college- and career-readiness standards in 2010 to rethink and refocus their entire academic program. This was also at least partially the case with the Miami-Dade County schools.
The data suggest that there was also a distinctive “state effect” in places like Massachusetts, Florida, Texas, and North Carolina. Boston was a clear beneficiary of the state’s historically high standards in addition to its own local efforts. This also appears to be the case in Miami, Hillsborough County, and Duval County. On the other hand, Dallas and other Texas cities did not adopt the academic standards that other states were putting into place, but they did make it clear what they wanted taught across their systems in ways that helped boost their overall academic performance.
This practice of better articulating what districts expected from their instructional programs was at the heart of their standards-based or curriculum reforms. Each of the districts we visited clearly communicated their instructional expectations at each grade level, including what high quality instruction and student work should look like. This was true regardless of whether they formally adopted the new college and career-ready standards or used a common district curriculum; all of them clarified their instructional expectations. For example, while San Diego did not have a traditional district curriculum, they did require each school to have a “Guaranteed Viable Curriculum”16 that met the district’s requirements. They also laid out for schools the ‘critical concepts’ they expected to be covered at each grade level, and the district worked with schools to develop units of study to ensure that this common understanding was employed in every classroom.
In another case, Miami-Dade County Public Schools provided teachers with detailed, standards-aligned pacing guides embedded with links to relevant instructional materials and resources. “What our children are going to learn is non-negotiable,” explained an instructional leader in the district. But while the content was determined by the district, the “how” was left up to the classroom teacher, with more detail provided for those teachers who needed it. The district also provided a curated set of options in terms of instructional materials. This not only helped ensure the use of high quality, vetted materials, it also allowed the district to better
16 This concept was popularized by Robert Marzano in his book, “What Works in Schools” and refers to the pacing of how a curriculum is applied so that students can learn it. (Curriculum+opportunity-to-learn+time=A Guaranteed Viable Curriculum.)

58 MIRRORS OR WINDOWS: HOW WELL DO LARGE CITY PUBLIC SCHOOLS OVERCOME THE EFFECTS OF POVERTY AND OTHER BARRIERS?
support schools in using these materials. As one district staff member pointed out, “We can’t support at scale if there is a cornucopia of materials.”
Similarly, to drive instructional coherence and consistency in Dallas, the central office released instructional units every six weeks called Six Weeks at a Glance (SWAG). In addition to clearly laying out instructional expectations across core subjects over a six-week period, they were released six weeks in advance to allow teachers plenty of lead time to prepare. These units were accompanied by professional development sessions to provide teachers with a chance to dive into an upcoming unit, experience a modeled strategy, collaborate, and plan (although this professional learning was on a voluntary basis). Teachers also explored the SWAG and worked through each unit in their professional learning communities and had access to on-site coaching support and an online bank of videos of teachers using the lessons in classrooms.
Moreover, the district carefully monitored implementation through school and classroom visits, during which they looked at whether a teacher was following the scope and sequence, what texts they had selected, and what strategies they were using with students. Since all district curriculum guidance and resources were online, lead staff members also had access to analytics that told them who was using the materials, what they were using, and which resources were used the most. The district also fielded a user survey with every unit they published and used the results and feedback they received to further refine their guidance and support.
In DCPS, this unifying vision for instructional quality was referred to as “instructional oneness.” The district provided principals with a clear picture—and even exemplars—of what high quality instruction should look like in the classroom. Teachers reported getting more guidance than ever before. The teachers the Council team interviewed explained that in the past there had been a revolving door of textbooks and initiatives, with very little support or direction from the central office. Now, with the advent of IMPACT (the accountability system), LEAP (the district’s teacher leadership development initiative), and resources such as an instructional video bank, they felt they better understood the district’s expectations and how to meet them.
In fact, at the time of our visit DC was in the process of moving even closer toward a centralized or normalized definition of its expectations for curriculum and instruction. In addition to a district curriculum, there was at least one required unit of study in each content area per quarter and exemplars in each content area. As one instructional leader explained, while there was a shared district curriculum before, it looked drastically different from classroom to classroom and school to school. The district was therefore addressing this unevenness by ramping up the amount and content-specificity of its support for teachers.
Chicago was also moving toward a universal district curriculum, although schools were able to opt out and use their own if they could show that it met standards and was producing results. Like some of the other districts, Chicago provided schools with a curated set of instructional materials to choose from, and the guidance they needed in selecting appropriate grade-level materials. The district also created a “Knowledge Center”—an online clearinghouse with thousands of resources created by framework specialists. Unlike other online databases we have encountered, the district vetted the materials that were posted to the Knowledge Center, ensuring that they were high quality and aligned to district standards.
This centralization of instructional expectations, resources, and guidance was described in more than one district as “autonomy with guardrails” rather than “one size fits all” and appeared to be based on the general acknowledgement that while pure site-based autonomy may work for some high performing districts with high capacity and experienced principals, it does not work for all districts and schools—and it does not always work everywhere or every time that systemic academic improvement was needed. This means that there

59COUNCIL OF THE GREAT CITY SCHOOLS
needed to be greater definition, specificity, and support, as well as a norming of standards and instructional practices across all schools in a district to ensure higher quality and greater equity across a very mobile student body. At the same time, many districts grant increased autonomy to principals based on performance. Dallas, for example, defined their instructional approach as “managed instruction with earned empowerment.” Chicago’s approach was similar.
Moreover, although it is referred to here as “centralization,” this standardization of instructional expectations is often described by central office staff as the district becoming more service oriented, and it has by and large led to greater support for schools in these districts. In Chicago, for example, staff reported that “Supporting schools is our charge. Strategic planning revolves around the question, ‘How is our work going to impact students/teachers?’” Another district leader pointed out that “the district’s focus on what goes on in the classroom shouldn’t be underestimated. Staffing, assignment, structure—ultimately what matters is what goes on in the classroom.” The bottom line, in other words, was that empowerment without support, resources, and clear communication of district expectations will not drive growth on its own.
In fact, in San Diego, this service orientation led the superintendent to dismantle the two-sided structure of the system—operations vs. academics—in favor of a design that put principals at the center of the work. The message this structure was designed to convey was that everyone’s chief responsibility was to support schools, principals, and teachers.
Teacher/Leader Quality
The strength of teachers and principals was another defining feature across the six districts, and the result of intentional district human capital strategies on the part of district leaders to boost the capacity of schools to make instructional improvements. In Boston, for example, relatively high teacher pay likely contributed to both the high quality of teachers and low teacher turnover. In addition, the policy of mutual consent hiring (phased in around 2010) allowed school leaders more choices in selecting teachers, and it is credited with creating better matches between teachers and schools. In DCPS, as discussed previously, the first phase of the district’s recent reform efforts was largely a human capital strategy, whereby weak teachers were removed and effective or potentially effective teachers were identified using the district’s new evaluation system, IMPACT. The district subsequently transitioned into leadership development, although they acknowledged that this was an area they wished they had addressed earlier in the reform process.
The Chicago Public Schools, on the other hand, made the pivot toward a leadership development focus much earlier on in their reform efforts, putting them ahead of the curve. One of the most important changes they made was to introduce a layer of screening in addition to state certification to determine suitable principal candidates, who were then selected by parents and communities. This screening process has evolved over time, but it has remained a rigorous undertaking that required candidates to present a portfolio of work, complete a written exam, and participate in a set of interviews where they are asked to respond to various scenarios and leadership challenges. According to district staff, this process has successfully raised the quality of the candidate pool, and it has enabled the district to imbed district-defined expectations, competencies, and beliefs about what makes a strong school leader into the selection process.
Similarly, in its human capital work Miami-Dade County first focused on strengthening its principal ranks and finding school leaders that reflected the district’s priorities. The district also placed a special focus on the staffing and leadership of fragile schools. In the early phases of their reform work, the district identified effective teachers using a value-added measure charting progress over three to five years, and then recruited

60 MIRRORS OR WINDOWS: HOW WELL DO LARGE CITY PUBLIC SCHOOLS OVERCOME THE EFFECTS OF POVERTY AND OTHER BARRIERS?
these teachers to work at struggling schools. They also moved other teachers out of these high-needs sites, at times using involuntary transfers.
Dallas’s pay-for-performance model—the Teacher Excellence Initiative—also focused on identifying the most effective teachers and paying them significantly more to work in high-need schools—specifically, the district’s Accelerating Campus Excellence (ACE) schools. Moreover, the district mounted a systemwide effort to identify and deploy bilingual teachers as it built out its dual language model across the district.
In addition to these strategies aimed at recruiting, retaining, and effectively deploying high quality teachers and principals, many of the districts we visited focused on the development of teachers and future leaders. DCPS, for example, partnered with outside organizations such as Relay Graduate School to support teacher candidate residencies in district schools, while Chicago established the Chicago Leadership Collaborative (CLC), a partnership between the district and leading principal development programs to create a pipeline of highly qualified leaders to meet the district’s needs. Other districts, such as San Diego, also offered mentors to new principals, as well as providing teachers and vice principals with opportunities for growth and leadership roles at the school level.
In fact, Chicago’s early focus on growing the leadership capacity of school and network leaders has endowed them with a deep leadership “bench”— as evidenced by the fact that the district’s current CEO, CAO, and many other chief positions have been filled internally with instructional staff who have risen through the ranks and now bring a wealth of expertise and experience at multiple organizational levels to their roles as district leaders.
Professional Development and Other Capacity Building Measures
In addition to more standardized curricular guidance and human capital strategies, the six study districts employed a variety of other strategies aimed at school-based capacity building. This can be seen, for example, in the reorientation of the role of principal supervisors (as discussed earlier in this section), as well as the widespread use of teacher leaders, school-based instructional leadership teams, building and network-level instructional coaches, and professional learning communities (PLCs) in most of the districts we visited.
School-based support structures such as instructional leadership teams and PLCs exist in many districts around the country. However, it was the level of intentionality and focus that really set the study districts apart. In Chicago, teachers described a transition during which they began getting clearer signals from the central office that school-level instructional leadership team meetings mattered, and schools became more accountable for selection, capacity building, and support of their teacher leaders. Chicago also employed PLCs and professional learning summits modeled after their common core implementation strategy of providing training and then employing teacher leaders to bring that training back to their buildings, providing site-based professional development tied to both school-level strategic plans and district strategic goals.
Miami-Dade County, meanwhile, hosted annual Synergy Summer Institutes, week-long professional development courses attended by teams of school staff. The institute was designed to provide these school leadership teams with the opportunity to study data together, reflect on current practices, identify the essential practices that should be sustained or enhanced during the upcoming school year, and take part in strategic planning to ensure continuous improvement at their school sites.

61COUNCIL OF THE GREAT CITY SCHOOLS
San Diego and Dallas had the most well-articulated PLCs we saw, which were closely monitored and supported by the district. In San Diego, PLCs appeared to have affected the whole culture of the school system and were cited by district and school staff alike as perhaps the most important factor driving the district’s progress. As in Chicago, the evolution of PLCs was the result of intentional guidance and messaging from the central office. One principal, for example, described for the Council team the evolution of PLCs at her site from conversations about evaluation to sessions that were now devoted to collaborative problem-solving, providing her with an invaluable opportunity to work and learn alongside her teachers. According to district and school leaders, this structure helped the district drill down on Tier 1 instruction and its effectiveness.
Of course, just having PLCs in place is not enough to achieve instructional growth. Without clear guidance on what the district’s expectations are for the time spent in PLCs and training on how to effectively lead collaborative, content-driven work sessions, PLCs in other systems often amount to glorified staff meetings rather than meaningful opportunities to improve teachers’ instructional practice and build capacity at the school level.
Another unique and even somewhat counterintuitive strategy that served to build school capacity in San Diego was the district’s requirement that schools develop their own formative assessments. In past years when there was a district-mandated interim assessment, staff found that teachers would give it but not necessarily use the data. So, while this process took up a lot of schools’ time to develop, they acknowledged that the process built not only expertise, but ownership of formative assessment data where it was needed most. Of course, there were numerous guardrails in place. Area superintendents, for example, met with principals quarterly to review school-wide progress and help determine goals, and teachers received support in developing formative assessments through school-based instructional leadership team meetings, PLCs, and meetings with school and area leadership. The downside was that the district did not have the benefit of aggregate assessment results over the course of the school year, but leadership concluded that its regular school and classroom monitoring gave them the information they needed.
In DCPS, LEAP (LEarning together to Advance our Practice) was another prime example of a district strategy for building school-based capacity. Through a weekly cycle of professional development in small, site-based, content-specific professional learning communities (LEAP Teams) led by content experts (LEAP Leaders), the district developed on-the-ground expertise in teaching the DCPS Common Core-aligned curriculum.
In Dallas, meanwhile, principals and teachers cited the tremendous value of school-based support staff and structures such as Campus Instructional Coaches and Campus Instructional Leadership Teams (CILT) made up of principals, assistant principals, and core teachers. Yet, while coaches and school-based instructional leadership teams were certainly not unique to this district, it was the level of support and structure that sets this district apart. The CILT teams in Dallas received intensive, content-specific training with the academic department six times throughout the year to ensure that they were prepared to lead the learning at their respective campuses, while a corps of Instructional Lead Coaches served as the “coaches of coaches,” providing ongoing professional development and support for the campus-based coaches to ensure that the support that they, in turn, provided to teachers was consistent and aligned to the district’s vision and standards for high-quality instruction.
Ultimately, the success of these capacity-building efforts was grounded in a common vision for instructional excellence, a clear set of expectations of what students should know and at what level of depth, and implementation that created ownership and buy-in among principals and teachers.

62 MIRRORS OR WINDOWS: HOW WELL DO LARGE CITY PUBLIC SCHOOLS OVERCOME THE EFFECTS OF POVERTY AND OTHER BARRIERS?
Acting at Scale
Another similarity we observed across the case study districts was a shared belief that systemwide results could only come from systemwide change. Rollouts of reform initiatives, curricular materials, and programming (including implementation of college- and career-readiness standards) were therefore undertaken at scale in many – if not all— of these districts.
In Miami-Dade County, for instance, Superintendent Alberto Carvalho explained that he does not believe in pilots. His strategy for districtwide reform instead involved spending a lot of time planning, but then acting at scale to remove all vestiges of past practice. “If you want improvement at scale, act at scale (with deep planning),” he told the Council team. “The only way to overcome the gravitational pull of the status quo is to execute forcefully.”
Of course, acting at scale took on many different dimensions across districts. In Miami-Dade County, they phased in instructional reforms and new academic standards by grade level, but leaders did so at scale across all schools. In Chicago, the rollout of the district’s new literacy program was executed across the board, while in mathematics they adopted a grade six through eight “bridge.”
Importantly, the Council team concluded after visiting each of these districts that it was not only the scale of the work that ultimately determined their success, but the level of coherence and support for these rollouts that made the biggest impact. In this way, instructional reform initiatives or new curricula adopted districtwide benefitted from the shared focus and effort of staff working together toward common goals and expectations. This unifying instructional vision was critical in places like DCPS as they rolled out districtwide initiatives from the Cornerstone Units to LEAP. Similarly, in Boston the rollout of a new concept-rich core mathematics program in 2000 was undergirded by a unifying instructional philosophy and sustained support, professional development, and oversight for implementation over several years. In contrast, as noted in the 2011 Council report, Pieces of the Puzzle, the district’s reading reforms did not benefit from the unanimity of approach observable in the district’s (later) work in mathematics.
“The district’s literacy program, which was built around a Reading and Writing Workshop (RWW) model during the study period, appeared to be less well- defined and less focused than the district’s math reforms. In addition, the study team noted from interviews with teachers and district leaders that philosophical differences at the central office level over approaches to literacy instruction contributed to a lack of coherence in reading instruction districtwide…For example, while the district used its Reading First grants to adopt a common reading program for 34 of its schools—Harcourt’s Trophies— most Boston schools had their choice of reading programs, and some opted out of using any specific published series. These differences led to a greater unevenness in reading program implementation than in math, according to interviewees who were asked directly about why math gains outstripped reading progress.”17
17 Pieces of the Puzzle: Factors in the Improvement of Urban School Districts on the National Assessment of Educational Progress. Council of the Great City School, 2011

63COUNCIL OF THE GREAT CITY SCHOOLS
Accountability and Collaboration
In a point related to teacher and leader quality, the rollout of accountability systems was cited as a key lever for change across the six study districts. As mentioned previously, the IMPACT system in DCPS was the centerpiece of the district’s human capital strategy for building a stronger teacher corps. In addition to helping identify effective and ineffective teachers, this practice of holding everyone—including principals, assistant principals, instructional coaches, etc.—accountable for student growth reportedly helped to focus everyone on the primary goal of supporting instruction and to building an overall culture of responsibility. The program was not necessarily popular, but we think it was central to the district’s ability to boost student outcomes.
In Dallas, which was a pioneer in the use of value-added data, growth in the use of classroom and school effectiveness indices played an important role in driving shared accountability for student results. Like IMPACT, these measures were controversial at first as they provided a quantitative measure of teacher effectiveness based on student achievement data. However, over time they became more accepted since they compared students in each classroom to other similar kids in the district. The classroom and school effectiveness indices are now used in the district’s evaluation instruments for teachers and principals, as well as in the district’s pay-for-performance initiative (TEI, or the Teacher Excellence Initiative).
Similarly, the school accountability system in Chicago was often the first factor cited by school leaders and staff in the district’s progress. Interviewees reported that the evaluation tools for both teachers and principals took a deep look at what was happening in classrooms and measured success in terms of student growth. These evaluation tools in turn helped to norm the work of teachers and to create high standards and clear expectations for instruction across schools. In fact, everyone in the district was evaluated in some way on student growth, and this helped build a sense of direction and shared responsibility for student progress.
Interestingly, this culture of accountability that has been built across districts has come hand in hand with increased collaboration. Leaders and staff in several of the sites the Council team visited discussed an intentional shift from competition to teamwork—a shift that could be seen in everything from how principal supervisors worked together with the curriculum department and other central office departments to the practice of connecting principals and teachers across schools. In Chicago, for example, staff reported that collegiality, in general across the organization, has improved drastically—despite several teacher strikes and tense relations with the union. The district saw the vertical and horizontal exchange of information increase dramatically, and it saw a shift toward more inclusive, cross-functional strategic planning. Staff at both the central office and school levels reported that “everyone is accessible—everyone returns calls.”
This service orientation has in turn nurtured an environment of sharing lessons learned and resources across schools. The network chiefs (Chicago’s principal supervisors) saw it as part of their job to create opportunities for collaboration and to promote cross-pollination between schools and networks. The Council team heard the same thing in Washington, DC, where instructional superintendents saw the systemic sharing of lessons learned and effective practices as a key part of their role, describing themselves as “facilitators of the learning principals do with one another.”
In fact, the Council team observed that the role of principal supervisors—discussed earlier in this section—was a key mechanism by which many districts helped further accountability, communication, and collaboration districtwide. Despite differences in organizational structure from district to district, principal supervisors served as a conduit between the central office and schools, allowing districts to communicate district

64 MIRRORS OR WINDOWS: HOW WELL DO LARGE CITY PUBLIC SCHOOLS OVERCOME THE EFFECTS OF POVERTY AND OTHER BARRIERS?
standards, instructional expectations, and priorities while helping to identify which school sites required additional support and what opportunities existed for greater collaboration and sharing of effective practices.
In all, accountability was being redefined in these districts away from the more mechanistic, administrative accountability that one saw under the No Child Left Behind Act towards one that was oriented around a shared culture of responsibility for improving student outcomes.
Challenges as Opportunities
One interesting characteristic that we observed across many of the districts was the resilience and resourcefulness each district demonstrated in the face of change, challenge, or adversity. In Miami-Dade County, for example, the economic crisis of 2008-09 was credited by district leaders as having “opened the door” to a wave of instructional and operational reforms, including greater centralization of curricular guidance and resources to save on costs and support schools in the most effective and efficient manner.
This ability to respond constructively to new circumstances could perhaps be seen most clearly in the districts’ responses to the adoption of new, rigorous academic standards in states across the country. Districts such as Boston, Chicago, Miami, and Washington D.C., for example, were among the earliest adopters of the Common Core State Standards or similar state-specific college- and career-readiness standards. San Diego even petitioned for a waiver from the California Standards Test (CST) so they could phase in the common-core-aligned SBAC (Smarter Balanced Assessment Consortium) ahead of other districts in the state.
Instructional leaders and staff at each site talked about seizing the opportunity provided by the standards to advance instructional coherence across the system. While some of these districts were already well underway in their instructional improvement efforts, the introduction of the common core or other college- and career-readiness standards helped these districts connect the work of supporting higher-quality instruction to assessment and evaluation. Interviewees also cited the value of the shared work and learning that came as staff unpacked and implemented the instructional shifts that the standards prescribed. In fact, the process of adopting districtwide standards was commonly described as having helped “even out” the support provided to teachers and principals across networks, as everyone worked to get onto the “same page” in terms of both common core content and pedagogy.
In each school district we visited, the successful implementation of college- and career-readiness standards was dependent on communication and close collaboration between the school management structure, the curriculum staff, and leaders at the central office. These districts worked cross-functionally to support implementation through multi-pronged strategies involving professional development, curriculum guidance and materials, instructional reviews, data reporting, and teacher and principal evaluation. Of course, standards alignment has not always led to student gains in other districts, and in one district leader’s opinion this was because there was often not enough investment of time, effort, and resources in the implementation process. Progress, in other words, was not a function of declared alignment to rigorous standards, but of alignment in practice, which required sustained monitoring and support to ensure that instructional changes made at the systems level reached all classrooms.
65COUNCIL OF THE GREAT CITY SCHOOLS
Support for Struggling Schools and Students
Some districts may have seen gains in part because of an explicit emphasis on support for struggling students, English learners, students living in poverty, and students with disabilities. In Chicago, the district’s implementation of multi-tiered systems of support (MTSS) and its efforts to support the examination of student-level data and the use of these data to inform strategies were likely factors in their progress on NAEP. In Miami, principals reported becoming more deliberate in their approach to reaching struggling students, as well as the increased use of disaggregated data and the development of strategies, interventions, and support based on understanding how different students learn.
The San Diego Unified School District had developed a particularly robust focus on individual students and the examination of student work. This was the result of a districtwide effort undertaken several years ago to study the experiences of struggling students at their schools and to identify what it revealed in terms of instructional and support needs. A significant part of the time teachers and administrators spent conducting school and classroom walk-throughs and in professional learning communities was spent discussing individual students, looking at student work, and using these data to design lesson plans around the specific needs of the lowest performing students in each classroom for every lesson.
As compared to this somewhat common focus on struggling students, the Council team found that districts varied much more in their approach to struggling schools and school turnaround efforts. DCPS, for example, did not articulate a clear school turnaround strategy, instead focusing its efforts on programming and instruction systemwide—along with an effort targeted specifically on Black male students.
In contrast, Dallas, a district in this study with some of the highest concentration of students in extreme poverty, had a particularly strong focus on resource allocation based on equity. The district used an “intensity of poverty” index based on census block data to identify schools with particularly high needs, looking not only at poverty but generational poverty. A common sentiment echoed in interviews with staff was that “schools that need more should get more—in time, treasure, talent,” and this could be seen in the district’s emphasis on ensuring that struggling schools serving high numbers of poor students, Black students, and English learners received increased levels of campus-based support, additional resources, and effective teachers and principals.
A primary example of this resource allocation strategy in Dallas was the district’s Accelerating Campus Excellence (ACE) initiative. The ACE initiative targeted the district’s historically failing schools—i.e., those with five years or more of not meeting state accountability requirements—and provided them with intensive additional resources that included strategic staffing (paying the most effective teachers to work at these schools via the district’s pay-for-performance model, TEI); prescriptive, data-driven instructional practices; increased monitoring and feedback; schoolwide systems for Social Emotional Learning; extended learning time; and investments in school and classroom upgrades.
In addition to this school-based strategy, Dallas also had a robust effort to improve the academic performance of its Black students, particularly its male students. The effort encompassed a combination of early childhood participation, staff diversification, strategic partnerships, single-gender schools, an African American studies program, mentoring, and enhanced instruction, along with other initiatives. In fact, the Dallas superintendent was held explicitly accountable on his annual evaluation for progress with these students. The district also has a parallel effort focused on Mexican-American students.

66 MIRRORS OR WINDOWS: HOW WELL DO LARGE CITY PUBLIC SCHOOLS OVERCOME THE EFFECTS OF POVERTY AND OTHER BARRIERS?
In San Diego, meanwhile, the district identifies its highest needs schools as “focus schools.” Oversight for these schools was distributed evenly—each area superintendent had six focus schools. Although district staff reported that focus schools had the same level of autonomy as other sites, they also reported spending more time at these schools, conducting more classroom walkthroughs, and working intensely with them in developing and sustaining their ‘Guaranteed Viable Curriculum’ and ensuring that the district’s ‘critical concepts’ were covered at each grade level.
Miami also cited its focus on “fragile” schools—and the alignment of resources to meet student needs at these sites—as one of the main pillars of its district improvement strategy. In addition to deploying the most effective teachers and leaders to these schools, the district directed greater support and resources to these sites.
Moreover, Miami employed the unique strategy of pairing its support for struggling schools with its school choice initiative. Roughly 72 percent of Miami-Dade County students were involved in a choice program of some sort, and students had over 1,000 choice options. Their approach, as described to the Council team, was to support struggling schools by increasing student engagement using niche programming. In other words, these schools and programs were designed specifically to appeal to parents, students, and communities, and district staff referred to this strategy as “demand-driven reform and innovation.”
Like Miami-Dade County, Dallas also used choice schools and programs to meet the needs of struggling schools, as well as to incentivize parents to remain in the district. There were waiting lists at each of the district’s 25 P-TECH (Pathways to Technology Early College High School) and ECHS (Early College/Collegiate High Schools) campuses, and the district offered a range of other choice options, including over 50 two-way dual language schools and over 30 magnet school programs.
Finally, Miami also focused efforts on its Black male students in a way that was like both Dallas and the District of Columbia.
Community Investment and Engagement
Another notable feature of many of the school districts we visited was the active engagement and investment of community organizations, educational groups, foundations, businesses, and local colleges and universities—particularly in Boston, Chicago, and Miami.
Boston Public Schools, in particular, benefitted from having a high concentration of educational institutions located in and near the city. School and district staff alike cited investments made in after-school and summer enrichment opportunities for area students as an important factor in students’ progress and sustained achievement. One district leader estimated that about 80 percent of Boston students had benefitted from some sort of outside investment. This high concentration of colleges and universities also meant a plethora of training programs and residencies for teacher candidates.
In Chicago there were similar investments in after-school activities and programs for kids. In addition, the school district’s relationship with the University of Chicago Consortium on School Research ensured that district staff and leadership had access to a wealth of data on Chicago schools, and was cited as a key factor in helping the district sustain its commitment to its new accountability system, which was initially met with both internal and external resistance.

67COUNCIL OF THE GREAT CITY SCHOOLS
Miami also had an impressive array of community partners that the system relied on to provide support. The district arranged for hundreds of organizations and companies to provide summer intern opportunities for students, including offerings ranging from the American Dental Center to the Miami Arts & Academics Youth Summer Camp. The Miami-Dade County Public Schools also had a vast array of other community partners like the First National Bank of South Miami, American Airlines, and the Mexican American Council to provide support services.
While these partnerships and investments were critical sources of support and resources for city schoolchildren, what was equally important was that these districts were intentional about the investments made in—and on behalf of—their schools. Programs were vetted to ensure that they were consistent with district objectives and approaches, and staff dedicated time and focus to coordinating and connecting these investments so that schools were not overwhelmed with redundant programming or mixed messaging on district instructional priorities.
Counterfactual Districts
The Council research team used two additional school districts to serve as counterfactuals to the case studies above.
The first counterfactual district does not participate in TUDA, but the Council was able to convert state assessment results into NAEP metrics and it conducted a site visit to the district at roughly the same time when the team was conducting other site visits for this study. It should be noted that the purpose of the Council’s multiple visits to this district—to provide technical assistance—was different from the research-driven visits made to Miami, Chicago, Boston, Washington D.C., San Diego, and Dallas, but the visits yielded the kinds of information we needed to contrast it with the other cities. Since that time, the school district hired a new superintendent and implemented many of the Council’s recommendations to improve its programming and school supports. Nonetheless, during the study period, the team noted several clear contrasts—most notably in the areas of capacity building, instructional focus, and accountability—between this district, which had low and largely stagnant student achievement in recent years, and those of districts that had seen growth.
The second counterfactual district does participate in TUDA and is a far larger urban school system than the first counterfactual school system. The information gathered on this district also came from site visits designed primarily to provide technical assistance to the district.
Instructional Focus
Unlike the clear instructional vision and strategic, sequenced reforms we observed in the case study districts, the counterfactual districts lacked a coherent strategy or working theory of action for improving student achievement districtwide or for moving failing schools out of that status. Although the first district had a document that it considered to be a strategic plan, the Council team saw little evidence that it substantially drove the work of the district. During the initial visit to the district, staff members that the team interviewed could not describe what the district’s strategy was for improving academic performance.
Perhaps because of this imprecise instructional vision the district lacked the focus the other districts demonstrated on developing strong Tier 1 programming. Instead, the district was focused disproportionately on interventions with its lowest 25 percent of students. These interventions were ill-defined and differentially

68 MIRRORS OR WINDOWS: HOW WELL DO LARGE CITY PUBLIC SCHOOLS OVERCOME THE EFFECTS OF POVERTY AND OTHER BARRIERS?
applied from school to school and from area to area within the district, and they were not evaluated for effectiveness. This strategy appeared to be done to garner extra state accountability points, but in doing so the district was missing an important segment of students—those between the lowest 25 percent and proficiency—and so even as an intervention strategy it was failing to move schools out of “failing” status. Moreover, it was undermining support for effective Tier 1 instruction to boost student achievement overall.
The district did employ learning walks, as we saw in other districts, but these appeared to be focused more on observing student engagement, classroom climate, and procedures than on the content and rigor of instruction. This contributed to the district’s inability to monitor and improve the quality of instruction. In addition, the results of the walk-throughs did not appear to be used beyond the school to inform broader patterns of systemic needs or to improve districtwide strategies. In other words, the Council team saw no evidence that walk-through data were aggregated across schools, feeder patterns, or regions to inform broader systemwide improvements in curriculum, interventions, or professional development. The lack of district coherence was further evidenced by the fact that district network leaders each had a different set of strategies and plans for improving student achievement based only on their individual areas of expertise or experience. There also did not appear to be any districtwide resources or exemplars to guide instructional administrators and teachers about the level of rigor and student work expected in specific grade levels and content areas.
The second counterfactual district had similar issues. Here, the district had a curriculum that was largely grounded in multiple textbooks that the system had purchased but that were inconsistently aligned with the state’s standards. The curriculum itself contained pacing guides, instructional units, and lesson plans, but they differed from text to text, meaning that what students studied depended on which texts their schools had selected. At the same time, the platform on which the curriculum sat had supplemental materials but no explanations about what gaps in the curriculum they were meant to fill or how they could best be used.
Moreover, the research team found few interventions in the second counterfactual district for students who might be falling behind. Because there was little guidance on when the few interventions should be used, under what conditions, or for how long, teachers sometimes simply used intervention materials as core instructional tools.
Finally, like the first counterfactual district, the second one lacked a clear set of instructional expectations or theory of action about how it expected to raise student performance. Instead, the task of improving student achievement was largely left to the district’s networks to grapple with.
Capacity Building
Perhaps the most conspicuous difference between the counterfactual districts and the case study districts we visited was in capacity building. Whereas other districts invested time, energy, and focus on human capital strategies aimed at building up the quality of teachers and leaders, the first counterfactual district made several decisions that ended up diluting the quality of their people, creating inconsistencies in the district’s instructional expectations, and limiting their capacity as a school system to support schools. For example, several years ago the school district’s leadership decided to dismantle the school system’s curriculum department in favor of outsourcing key instructional functions, like the development of curriculum materials, guidance, and some local testing activities. This not only left them beholden to outside vendors and responsible for an annual subscription fee for access to their own instructional materials, but it also deprived

69COUNCIL OF THE GREAT CITY SCHOOLS
staff of the critical learning and capacity-building process of developing curriculum and providing instructional support and guidance to their own schools.
The district was working to re-establish its curriculum office when the Council team arrived, but the impact of this past decision was still evident. In our work with districts over the years we have observed that the strength of district staff and instructional leadership is critical to a school system’s ability to adapt to challenges and move the system forward academically. So, while none of the districts we visited were immune to controversy or leadership turnover, this district was less equipped than other districts to weather the various upheavals it was facing.
Moreover, despite this history and severe funding shortages, the first counterfactual district continued to rely heavily on outside vendors to provide materials and support services. While all the districts we visited worked with outside vendors in some capacity, leadership and staff in the other case study districts explicitly cited a move away from “buying stuff to fix our problems,” focusing their efforts and scarce funding instead on building internal capacity and investing in people. In the first counterfactual district, however, the team ultimately concluded that the district’s unusually high rates of teacher and staff turnover were likely due to the general lack of support for teachers, which is typically the reason why teachers leave. Moreover, while most of the other districts were intentional in their efforts to recruit and hire high quality teachers and leaders, this district lacked any sort of teacher or leader pipeline program and the human resources department had delegated its primary function— identifying and hiring qualified teachers—to principals.
Teachers in the second counterfactual district generally gave their professional development high marks, but they agreed that they received little of it. Most teachers in this second counterfactual district told the research team that professional development was not differentiated by teacher experience, expertise, or results with students; and most indicated that they received little district professional development on the curriculum. In addition, the second counterfactual district had a large number of instructional coaches, but they were not strategically deployed, and their PLCs lacked the strength, longevity, or focus seen in some of the case study districts.
Accountability
A third main area of contrast between the counterfactual districts and the other six study districts involved accountability. Staff in each of the other districts spoke at length about a cultural shift toward shared accountability—a shift often founded on quantitative measures of student growth that held staff responsible for student progress—not just teachers. At the time of the Council’s visit to the first counterfactual district, however, the district lacked any mechanism for holding personnel responsible for improving student academic outcomes. The personnel evaluation instrument that the district used was endorsed by the State Department of Education as the framework for teacher and administrator evaluations. Principals, for example, were evaluated on five domains and 19 total elements. Each of these domains and elements included examples of evidence that could be used to demonstrate where principals were on a four-point evaluation scale, but none of the examples included actual student outcomes. The district’s teacher evaluation systems also did not include concrete measures of student outcomes or progress. And the district’s procedure for evaluating central office administrative staff also graded performance across a series of domains and elements—none of which involved measures of districtwide student outcomes or their improvement.

70 MIRRORS OR WINDOWS: HOW WELL DO LARGE CITY PUBLIC SCHOOLS OVERCOME THE EFFECTS OF POVERTY AND OTHER BARRIERS?
This lack of accountability also marked this district’s relationship with its partners and vendors. Vendor accountability for results in the first counterfactual district was nearly non-existent. In contrast, staff in Miami-Dade County, for example, looked at return-on-investment for all supplemental materials purchased and implemented by the district, a process called student impact meetings. Moreover, a set of district-developed ‘Essential Questions’ were sent to all vendors, who were required to show usage data and data on how they met the promises and objectives they set out to accomplish. If they did not meet these criteria, the district did not renew their annual contracts.
The second counterfactual district also lacked any defined system of accountability. This was apparent in not only staff evaluation procedures but in how the school board monitored student performance systemwide.

71COUNCIL OF THE GREAT CITY SCHOOLS
The ability of the nation’s large urban school districts to overcome or mitigate poverty, discrimination, language barriers, and other challenges is critical in the struggle to guarantee all students access to educational and social opportunity. It is therefore important, as urban educators, to examine the extent to which urban public schools are “beating the odds”—prevailing over these inequities to raise student achievement, rather than simply reflecting or perpetuating the opportunity gaps that exist across the country.
It was clear from our analysis that Large City Schools were, in fact, doing a better job at producing mathematics and reading outcomes on NAEP—i.e., adding value to the education of its students—than schools generally. Some big city school systems were more successful in this than others, but urban public schools in general were producing results that were greater than statistical expectations.
Of course, not every urban school district that is beating the odds has followed the same path. We observed different theories of action, varying approaches, and seemingly contrasting programming. These districts also presented us with a wide array of different political, historical, and organizational contexts.
The findings from this report suggest several conclusions. One, any analysis of NAEP—or other student achievement results—that does not take into consideration the effects of poverty, race/ethnicity, ELL status, disability status, literacy materials in the home, and family education levels is likely to produce incomplete results and an only partial understanding of student attainment. The background variables used in this student-level analysis provide substantial context to NAEP results.
Two, the data suggest that even when these variables are considered, there are effects that we cannot measure that may be just as important. For example, while we can disaggregate achievement data by race/ethnicity, variables such as the historic and racial context of communities and cities are not as measurable, but they are surely just as important. Moreover, efforts to account for poverty using student-level free or reduced-price lunch may fall short of capturing the full impact of abject or concentrated poverty on academic outcomes. In addition, the free or reduced-price lunch data reported by various outlets is becoming substantially unstable and unusable. Researchers should be very careful in using those data without first questioning their stability over time. Furthermore, it was clear from this analysis that districts with large percentages of students living in households with annual incomes below $15,000 and $50,000 face a more difficult set of challenges than other urban school systems in producing a “value-added” effect that is higher than statistical expectations.
Discussion and Conclusions

72 MIRRORS OR WINDOWS: HOW WELL DO LARGE CITY PUBLIC SCHOOLS OVERCOME THE EFFECTS OF POVERTY AND OTHER BARRIERS?
Three, several TUDA districts demonstrated consistently that they were mitigating the effects of identified student background characteristics on NAEP results, and they were producing scores that were higher than statistical expectations. There were also districts that were showing significant progress.
Four, the data indicate that Large City Schools—in the aggregate—were producing results on NAEP that exceeded statistical expectations. Moreover, the data indicated that Large City Schools were producing results that generally exceeded statistical expectations of All Other Schools.
Five, the data did not show that Large City Schools, in general, were getting better at mitigating background variables over time. However, some urban school systems did show such improvement. Moreover, this finding must be qualified because of the analysis done by NCES showing the effects of misaligned NAEP mathematics assessments and state tests that had incorporated college and career-readiness standards. If the NCES adjustments were taken into account, then the Large City Schools might have shown significantly larger district effects in mathematics in 2019 than in 2009. Additional analysis is required on this question.
It is worth taking a step back here to acknowledge the significance of these overall findings. In designing this study, we wanted to put the changes in urban school performance in context, because we were unclear about how the results urban schools were producing compared to other schools across the country when their context was also considered. Does this differing context mean that urban public schools had higher scores than the average school across the nation? No. The typical school across the nation had higher NAEP scores than do Large City Schools. But the results do suggest that Large City Schools may be doing a better job of mitigating the influence of poverty, language, discrimination, disability, and differences in family education than the average school does. Put another way, urban public schools appeared to produce greater instructional torque than does the typical school. We suspect that this may be because these districts have been working to improve their academic performance for some time in ways that the average school and school system has not. Not only have urban schools been the target or focus of much of the nation’s efforts to reform schools in recent history, but these districts often took the lead on such issues as academic standards, accountability, curriculum reform, turn-around schools, and many other initiatives that have helped the districts improve.
We should be clear that none of the improving districts we have described in this report have reached the promised land. Their reforms are a work in progress. While there were some key similarities among the districts we studied, there was no single, shared strategy or formula that can be definitively tied to their gains. If there was a “secret sauce,” it was that these districts used varying theories of action, strategies, and programs to do one fundamental thing: improve the quality of instruction in their classrooms. This central endeavor was often aided by stable leadership, clear curricular expectations, aligned organizational structures, well-defined and shared accountability systems, and capacity-building mechanisms. But each of these components were employed in the service of improving instruction—something we do not always see in other districts.
This central finding echoes the results of two previous studies conducted by the Council on why and how some urban school systems improve faster than others.18 This new study asks a more complicated set of questions than do those earlier studies, but the results were remarkably consistent. Large City Schools have
18 Foundations for Success: Case Studies of How Urban School Systems Improve Student Achievement. New York: MDRC for the Council of the Great City Schools, September 2002. Pieces of the Puzzle: Factors in the improvement of Urban School Districts on the National Assessment of Education Progress. Washington, DC: Council of the Great City Schools, Fall 2011.

73COUNCIL OF THE GREAT CITY SCHOOLS
not overcome or mitigated the barriers before them entirely, otherwise results would be even higher, but the data in this study suggest that Large City Schools may be doing a better job of allaying the effects of poverty and potentially offering students a way out of that status than most schools. Still, there is more work to do to increase the size of those district effects and to understand how it is done.
Knowing why and how these urban school districts produce the results they do is important not only because the answers tell us whether our schools are effective to some degree in overcoming inequities and building and sustaining the nation’s middle class, but because the results point to strategies that might be useful as we rethink public education in the wake of the global pandemic. There are likely to be any number of proposals for reinventing and reimagining public education, so it is important to know what is driving improvement, so we do not focus on the wrong things. This should help us ask more critical questions and to sort out what might be retained or enhanced to improve overall achievement and strengthen equity.
One only needs to look at the NAEP data to see that over the last two decades Large City Schools have narrowed the achievement gap with the nation at large. What is new here—what this study shines a light on— is that urban public schools seem to be doing a better job than other schools of dampening the effects of poverty, English language proficiency, and other factors that often limit student outcomes. There is a great deal of work to be done. But as we enter the next phase of public-school reform and improvement, we clearly have much to learn from the urban public schools that are opening the windows of opportunity rather than simply mirroring the inequities that students too often face.

74 MIRRORS OR WINDOWS: HOW WELL DO LARGE CITY PUBLIC SCHOOLS OVERCOME THE EFFECTS OF POVERTY AND OTHER BARRIERS?
In 2010, the Council of the Great City Schools along with the American Institutes for Research analyzed the results of the National Assessment of Educational Progress (NAEP) in a way that had not been done previously (Dogan, et al., 2011). The two prominent research questions of that study were:
1. How did urban districts participating in the Trial Urban District Assessment (TUDA) in 2009 compare to other districts when one controlled for relevant background variables?
2. How did urban districts participating in the Trial Urban District Assessment (TUDA) in 2009 perform, compared to their statistically expected performance based on relevant background variables?
To answer these questions, the study compared the performance of each district against other districts after adjusting for specified student background characteristics, i.e., race/ethnicity, special education status, English language learner status, eligibility for free- or reduced-price lunch under the National School Lunch Program, the highest level of education attained by either parent, and information on the availability of written materials and computers in a student’s home. The analysis employed a methodology used elsewhere in the literature (e.g., Braun, Jenkins, and Grigg, 2006). A regression analysis was conducted to estimate the “expected” performance of an urban district against a national sample of other public-school students controlling for variations in these demographic characteristics. Next, each district’s actual performance was compared to the expected performance for that district. The difference between the two (actual vs. expected) was called a “district effect.” Positive values indicated that the district was performing better than expected statistically and negative values indicated that the district was performing below what was expected statistically.
A similar methodology using NAEP restricted-use data from 2009, 2011, 2013, 2015, 2017, and 2019 was used in this report. Comparable student background variables were used to calculate “adjusted” NAEP scale scores in TUDA districts using Hierarchal Linear Modeling (HLM) analysis and make comparisons between actual and statistically expected scores. This study compared the performance of each district against other districts after adjusting for specified student background characteristics, i.e., race/ethnicity, special education status, English language learner status, the highest level of education attained by either parent, and information on the availability of written materials and computers in a student’s home. However, to control for poverty, school-level free or reduced-price lunch rates and the percentage of households with annual income of $15,000 or below in the school’s zip code were included the HLM analysis.
APPENDIX A
Detailed Methodology

75COUNCIL OF THE GREAT CITY SCHOOLS
In 2010, Congress, as part of the Healthy, Hunger-Free Kids Act, authorized the Community Eligibility Provision (CEP) to allow schools and local educational agencies (LEAs) in low-income areas to provide free breakfast and lunch to all students. The CEP program was available to a small group of states in July 2014 and nationwide in 2014 (School Year 2014-15). Table 1 shows that TUDA districts began to apply different methodology for identifying and reporting free or reduced-price lunch eligibility for students in 2015. As a result, the research team noted that different decisions regarding school lunch eligibility for students inhibited the comparability of calculated expected scores for districts across years. Further, the team found that using the traditional NAEP free or reduced-price lunch indicator in 2013, 2015, 2017, and 2019 significantly influenced the direction and magnitude of school district adjusted scores. Consequently, the research team applied two school-level variables to the analysis and removed the traditional student-level free or reduced-price lunch variable from the analysis. The variables included:
Level 1 – Student-Level Variables
◆ Race/ethnicity
In the NAEP files, student race/ethnicity information is obtained from school records and classified according to six categories: White, Black, Hispanic, Asian/Pacific Islander, American Indian/Alaska Native, or unclassifiable. When school-reported information was missing, student-reported data from the Student Background Questionnaire were used to establish student race/ethnicity. Using restricted NAEP data sets, we categorized as unclassifiable students whose race/ethnicity based on school-records was unclassifiable or missing and those (1) who self-reported their race/ethnicity as multicultural but not Hispanic or (2) who did not self-report race/ethnicity information.
◆ Special education status
Student has an Individualized Educational Program (IEP), for reasons other than being gifted or talented; or is a student with a Section 504 Plan.
◆ English language learner status
Student is currently classified as an English language learner. (Former ELLs were not included in this category.)
◆ Parental education
Highest level of education attained by either parent: did not complete high school, graduated high school, had some education after high school, or graduated college. This indicator is only available for grade 8 students.

76 MIRRORS OR WINDOWS: HOW WELL DO LARGE CITY PUBLIC SCHOOLS OVERCOME THE EFFECTS OF POVERTY AND OTHER BARRIERS?
◆ Literacy materials
The presence of reading materials in the home is associated with both socioeconomic status and student achievement. The measure reported in 2009 was based on questions in both grade 4 and grade 8 in the Student Background Questionnaires, which asked about the availability of computers, newspapers, magazines, and more than 25 books in the home. Between 2009 and 2015, the Student Background Questionnaire changed and a different combination of items was used to calculate a summary score of how many materials were present. In 2011, the items included the availability of computers, magazines, and more than 25 books in the home (newspapers were dropped as a survey item). In 2013, 2015, 2017, and 2019, the items included the availability of computers in the home, the availability of the internet, and more than 25 books in the home (magazines were dropped as a survey item). 19 A summary score was created to indicate how many of these types of literacy materials were present in the home.20
Level 2 – School-Level Variables
◆ School free or reduced-price lunch eligibility rates
To level the influence of changing free or reduced-price lunch rates across districts, the research team chose to employ a school-level, rather than a student-level, school lunch indicator. Researchers did so by comparing the percentage of free or reduced-price lunch students reported in the National Center for Education Statistics Common Core of Data (CCD) files in the NAEP years prior to the CEP program and the NAEP reported free or reduced-price lunch percentages. When the values were within five percentage points of each other, researchers used the NAEP results for schools as the school-level factor. However, for large discrepancies in the data (values well above or well below the 2012-13 school year), the CCD school lunch rate was used for the analysis. CCD data were used to augment discrepancies in NAEP data caused by the Community Eligibility Program.
◆ Percentage of family incomes less than $15,000 per year by School ZIP Code
As is discussed later in this document, abject poverty or concentrated poverty has been shown to impair student academic outcomes. To further control for the influence of abject poverty across school districts, the research team incorporated the percentage of families making less than $15,000 per year in a school’s physical zip code as a school-level poverty factor. The zip code data were taken from the U. S. Census Bureau American Community Survey rolling five-year average for each of the NAEP assessment years.
19 The variable may not be comparable across years due to changes in the variables in the composite.20 This summary score has been used for reporting NAEP background variables for several years and has been shown to be associated with students’ achievement scores. (See, for example, Shaughnessy et al.,1997)

77COUNCIL OF THE GREAT CITY SCHOOLS
Exhibit A-1. Free or Reduced-Price Lunch Methodology Used by TUDA Districts, 2015, 2017, 2019.
TUDA DISTRICT NAEP 2015 NAEP 2017 NAEP 2019
Albuquerque CEP-ALL CEP-ALL CEP-ALLAtlanta Direct-Only CEP-ALL CEP-ALLClark County CEP-ALL CEP-ALL CEP-ALLCleveland CEP-ALL CEP-ALL CEP-ALLDC CEP-ALL CEP-ALL CEP-ALLAustin Direct-Plus Direct-Plus Direct-PlusCharlotte CEP-ALL CEP-Direct Direct-PlusChicago Direct-Plus Direct-Plus Direct-PlusDallas Direct-Plus Direct-Plus Direct-PlusDenver N/A Direct-Plus Direct-PlusDetroit Direct-Plus Direct-Plus Direct-PlusFort Worth N/A Direct-Plus Direct-PlusFresno Direct-Plus Direct-Plus Direct-PlusGuilford County N/A CEP-Direct Direct-PlusHouston Direct-Plus Direct-Plus Direct-PlusJefferson County Direct-Plus Direct-Plus Direct-PlusLos Angeles Direct-Plus Direct-Plus Direct-PlusMilwaukee N/A Direct-Plus Direct-PlusNew York City Direct-Plus Direct-Plus Direct-PlusPhiladelphia CEP-Direct Direct-Plus Direct-PlusSan Diego Direct-Plus Direct-Plus Direct-PlusBaltimore N/A Direct-Only Direct-Only Duval County Direct-Only Direct-Only Direct-OnlyHillsborough County Direct-Only Direct-Only Direct-OnlyMiami-Dade County Direct-Only Direct-Only Direct-OnlyShelby County N/A Direct-Only Direct-Only (CEP & Non-CEP
schools)Boston CEP-ALL Direct-Only Direct-Only (CEP & Non-CEP
schools)Source: National Center for Education Statistics, National Assessment of Educational Progress, 2019.

78 MIRRORS OR WINDOWS: HOW WELL DO LARGE CITY PUBLIC SCHOOLS OVERCOME THE EFFECTS OF POVERTY AND OTHER BARRIERS?
The reader should note that information on race/ethnicity, school lunch, and ELL and disability status come from the school and are available for all students. However, data on background characteristics for students who did not participate in NAEP are not available, i.e., excluded students or students who are not tested do not complete the Background Questionnaire. Therefore, data on reading materials in the home and parent education are only available for the tested sample. Consequently, the calculation of adjusted scores controlling for background characteristics was conducted on the reported sample only.
The Council used an HLM analysis to estimate the performance of a district had its student and school demographic profile been the same as the average profile of all districts or jurisdictions in the nation using the NAEP restricted data set for each of the study years. The methodology to estimate the adjusted mean scores is based on a two-level, students and schools, HLM model. In the mixed effects model:
Let yijv be plausible value21 v of student j in district (or school type) i, and
Xijk be the demographic characteristic k of student j in district (or school type) i.
Assume the mean plausible value for student j in district i, yij• , can be expressed as a function of an overall mean achievement μ , a differential effect αi associated with district (or school type) i, and differential effects bk associate with characteristic k of student j in district or school type i:
yij• = μ + αi + Σβ kXijk + eij , [1]
where μ is the overall mean,
αi is the district (or school type) i effect, and
β k is the effect of demographic characteristic k of student j in district (or school type) i.
Letting the subscript • indicate average, then the average scale score in district (or school type) i is expressed as
yi•• = μ + αi + Σβk Xi•k e'i , [2]
Subtracting [2] from [1] we can estimate the effect [3]
Ζij = yij• – yi•• = Σβk[Xijk – Xi•k] + e'i 'j [3]
and obtain estimates of βk directly, without any contamination from αi because αi has been subtracted out before the analysis. With the estimates β̂k, we compute the average effect of the demographic characteristics of student j in district (or school type) i.
ŷij• = Σβ̂k[Xijk – X••k] [4]
where X••k is the overall mean of X••k.
The adjusted score, y'ijv is estimated by subtracting ŷij• from each yijv :
y'i jv = yijv – ŷij• [5]
21 Plausible values are imputed values that resemble individual test scores and have approximately the same distribution as the latent trait being measured. Plausible values were developed as a computational approximation to obtain consistent estimates of population characteristics in assessment situations where individuals are administered too few items to allow precise estimates of their ability. Plausible values represent random draws from an empirically derived distribution of proficiency values that are conditional on the observed values of the assessment items and the background variables. The random draws from the distribution represent values from the distribution of scale scores for all students in the population with similar characteristics and identical response patterns. These random draws or imputations are representative of the score distribution in the population of people who share the background characteristics of the individual with whom the plausible value is associated in the data.

79COUNCIL OF THE GREAT CITY SCHOOLS
The adjusted score, y'i•• is the critical statistic for the analysis. It is an estimator for μ + αi, and we can estimate its standard error by the usual NAEP procedures. Note that μ + αi is the overall mean plus the effect of district (or school type) i. It is what the mean of district (or school type) i would be if the mean of all demographics in district (or school type) i were the same as the overall mean.
The hierarchical model used in the current study calculates this statistic by applying two Level 2 random factors and four mixed Level 1 factors. In the HLM model, rather than treating each student as varying from the overall mean plausible value, we estimate the mean of all student means for each school, noted below as γ00. The full HLM model is represented by:
yij = β0j + β1jX1j + ... + β2jX2j + eij
β0j = γ00 + γ01(SCHOOLLNj) + γ02(LESS15Kj) + u0j
β1j = γ10 + γ11(SCHOOLLNj) + γ12(LESS15Kj) + u1j
β2j = γ20 + γ12(SCHOOLLNj) + γ22(LESS15Kj) + u2j
Where SCHOOLLN is the school free or reduced-price lunch rate and LESS15K is the percentage of families in the school zip code with a household income less than $15,000 per year.
For this study, the mixed.sdf function in the Edsurvey package for R was used to conduct the HLM analysis. In 2009 and 2011, five plausible values were used for the subject composite scale. In all subsequent years, all 20 plausible values were used in the analysis. The analysis utilized a weighted mixed HLM model with the original student weights (origwt) and school weights (schwt). Nguyen and Kelly (2018) and Lee et al. (2021) provide detailed vignettes on the procedures utilized in this analysis.
Next, the expected performance of each district and school type—based on the selected student background characteristics—was computed. Each district’s actual performance was then compared to the expected performance for that district or comparison group. The difference between the two was called a “district effect” or group effect. Significant positive effects indicated that a district or group was performing better than expected statistically, and significant negative effects indicated that the district or group was performing worse than expected statistically.22 The actual model for the analysis is:
Level-1 Model
MRPCM1ij = β0j + β1j*(LITERACYij) + β2j*(IEPNOTij) + β3j*(LEPNOTij) + β4j*(SRACEAAij) + β5j*(SRACEHij) + β6j*(SRACEASPij) + β7j*(SRACEAIij) + β8j*(SRACEMRij) + eij
Level-2 Model
β0j = γ00 + γ01*(SCHOOLLNj) + γ02*(LESS15Kj) + u0j
22 Data on predictor variables is available for downloading on request.

80 MIRRORS OR WINDOWS: HOW WELL DO LARGE CITY PUBLIC SCHOOLS OVERCOME THE EFFECTS OF POVERTY AND OTHER BARRIERS?
Limitations of this and similar analysis
Several limitations in the current study—and other similar studies—should be mentioned. First, both the adjusted and expected performance numbers are estimates based on variables that research indicates affect student achievement. Some of these variables are beyond the control of educators and policymakers even though they affect performance. Still, the purpose of this study was to determine the extent to which Large City Schools were overcoming their effects.
Second, there may be other variables related to achievement that were not controlled for in this analysis. Some of these variables are not measured in NAEP, and possibly some are not measurable at all. A district effect is the product of our best estimate of whether a district or school type (Large City versus All Others) was performing differently than expected given its student profile on a limited number of variables measured in NAEP. We did not look at other background variables like spending levels in part because previous studies have not shown them to be as powerful in predicting performance as the ones we did choose. Still, there is room for additional analyses on such variables.
Third, comparing school types at any grade level ignores the fact that students may enter the formal educational process at very different achievement levels. Consequently, attempts to control for differences using various student characteristics or attempts to match students based on background variables will not always account for other differences that affect student achievement. For example, parents who enroll their children in Large City Schools or All Other Schools may have very different parenting practices. Research (e.g., Wilder, 2014; Jeynes, 2012; Hill & Tyson, 2009; Patall, Cooper, & Robinson, 2008; Senechal & Young, 2008; Jeynes, 2007; Erion, 2006; Jeynes, 2005; Jeynes, 2003; Fan & Chen, 2001) indicates that differences in parental involvement and expectations have a significant impact on student achievement, yet many studies, including this one, do not adequately account for these differences except to the extent that we look at parental education levels and literacy materials in the home.
Fourth, this study was not able to parse the differences between charter schools that were authorized by school districts, those that were authorized by other entities, and those that were entirely independent. NAEP does not code charter schools in a way that would allow analyses of this type.
Fifth, this analysis does not control for differences in such in-school variables as teacher experience or school size. Other studies have shown that these variables show little impact on difference between school types (see, e.g., Braun, Jenkins, & Grigg, 2006), although these variables may have effects in other types of analyses.
Finally, differences in concentrations of poverty are likely to affect comparisons as well. (See, for example, Orfield & Lee, 2005 for a discussion of concentrated poverty). This study attempts to explain some of this effect by looking at income levels within jurisdictions with Census data, but additional analyses are needed.

81COUNCIL OF THE GREAT CITY SCHOOLS
Braun, H., Jenkins, F., & Grigg, W. (2006). Comparing Private Schools and Public Schools Using Hierarchical Linear Modeling (NCES Publication No. 2006-461). Washington, DC: National Center for Education Sta-tistics. https://eric.ed.gov/?id=ED492570
Coleman, J. S., Campbell, E. Q., Hobson, C. J., McPartland, J., Mood, A. M., Weinfeld, F. D., & York, R. L. (1966). Equality of Educational Opportunity. Washington: U.S. Department of Health, Education, and Welfare, Office of Education.
Dogan, E., & Bandeira de Mello, V. (2011). Addendum to pieces of the puzzle recent performance trends in urban districts: A closer look at 2009 NAEP TUDA results. Washington: Council of the Great City Schools. https://www.cgcs.org/cms/lib/DC00001581/Centricity/domain/35/publication%20docs/Pieces%20of%20the%20Puzzle_Addendum.pdf
Eisenhaur, E. (2001). In poor health: Supermarket redlining and urban nutrition. GeoJournal 53, 125-133. https://doi.org/10.1023/A:1015772503007
Erion, J. (2006). Parent Tutoring: A Meta-Analysis. Education and Treatment of Children, 29(1), 79-106. https://www.jstor.org/stable/42899871
Fan, X., & Chen, M. (2001). Parental involvement and students’ academic achievement: A meta-analysis. Educational Psychology Review, 13(1), 1-22. https://doi.org/10.1023/A:1009048817385
Harris, S. J. (1978, August 3). Thoughts at large (Column). Lakeland Ledger, 7D. Retrieved from the Google News Archive: https://news.google.com/newspapers?nid=1346&dat=19780803&id=0JFNAAAAIBAJ&s-jid=CfsDAAAAIBAJ&pg=4250,903932&hl=en
Hill, N. E., & Tyson, D. F. (2009). Parental involvement in middle school: A meta-analytic assessment of the strategies that promote achievement. Developmental Psychology, 45(3), 740–763. https://doi.org/10.1037/a0015362
Jeynes, W. (2003). A meta-analysis: the effects of parental involvement on minority children’s academic achievement. Education & Urban Society, 35(2), 202-218. https://doi.org/10.1177/0013124502239392
Jeynes, W. (2005). A meta-analysis of the relation of parental involvement to urban elementary school student academic achievement. Urban Education, 40(3), 237-269. https://doi.org/10.1177/0042085905274540
APPENDIX B
Bibliography

82 MIRRORS OR WINDOWS: HOW WELL DO LARGE CITY PUBLIC SCHOOLS OVERCOME THE EFFECTS OF POVERTY AND OTHER BARRIERS?
Jeynes, W. (2007). The relationship between parental involvement and urban secondary school student academic achievement: A meta-analysis. Urban Education, 42(1), 82-110. https://doi.org/10.1177/00420 85906293818
Jeynes, W. (2012). A meta-analysis of the efficacy of different types of parental involvement programs for ur-ban students. Urban Education, 47(4), 706-742. https://doi.org/10.1177/0042085912445643
Lee, M., Bailey, P., Emad, A., Zang, T., Nguyen, T., & Yu, J. (2021). An illustration of analyzing NAEP primer using EdSurvey to analyze NCES data. Washington, DC: American Institutes of Research. Retrieved from https://www.air.org/sites/default/files/EdSurvey-Mixed_Models.pdf
Mann, H. (1848). Twelfth Annual Report to the Secretary of the Massachusetts State Board of Education. https://genius.com/Horace-mann-twelfth-annual-report-to-the-secretary-of-the-massachusetts-state-board-of-education-1848-annotated
Nguyen, T., & Kelley, C. (2018). Methods used for estimating mixed-effects models in EdSurvey. Washington, DC: American Institutes for Research. Retrieved from https://www.google.com/=t&rct=j&q=&esrc=s&-source=web&cd=&cad=rja&uact=8&ved=2ahUKEwjjrbTYz8bwAhXVQc0KHdSBBkQQFjAAegQIAxA-D&url=https%3A%2F%2Fwww.air.org%2Fsites%2Fdefault%2Ffiles%2FEdSurvey-Mixed_Models.pdf&us-g=AOvVaw1CjuzuaekW2NyuZJAnAQVT
Orfield, G., & Lee, C. (2005). Why segregation matters: Poverty and educational inequality (ED489186). ERIC. http://files.eric.ed.gov/fulltext/ED489186.pdf
Patall, E. A., Cooper, H., & Robinson, J. C. (2008). The effects of choice on intrinsic motivation and related outcomes: A meta-analysis of research findings. Psychological Bulletin, 134(2), 270–300. https://doi.org/10.1037/0033-2909.134.2.270
Reardon, S. F. (2016). School segregation and racial academic achievement gaps. The Russell Sage Founda-tion Journal of the Social Sciences, 2(5), 34-57. https://doi.org/10.7758/RSF.2016.2.5.03
Sénéchal, M., & Young, L. (2008). The effect of family literacy interventions on children’s acquisition of reading from kindergarten to grade 3: A meta-analytic review. Review of Educational Research, 78(4), 880-907. https://doi.org/10.3102/0034654308320319
Shaughnessy, C.A., Nelson, J.E., & Norris, N.A. (1997). NAEP 1996 mathematics cross-state data compendium for the grade 4 and grade 8 assessment (NCES Publication No. 98-481). Washington, DC: National Center for Education Statistics. https://nces.ed.gov/pubsearch/pubsinfo.asp?pubid=98481
Sugrue, T. J. (2005). The origins of the urban crisis: Race and inequality in postwar Detroit. Princeton Univer-sity Press.
Wilder, S. (2014). Effects of parental involvement on academic achievement: a meta-synthesis. Educational Review, 66(3), 377-397. https://doi.org/10.1080/00131911.2013.780009
Council Member Districts
Albuquerque, Anchorage, Arlington (Texas), Atlanta, Aurora (Colorado), Austin, Baltimore, Birmingham, Boston, Bridgeport, Broward County (Ft. Lauderdale), Buffalo, Charleston County, Charlotte-Mecklenburg, Chicago, Cincinnati, Clark County (Las Vegas), Cleveland, Columbus, Dallas, Dayton, Denver, Des Moines, Detroit, Duval County (Jacksonville), East Baton Rouge, El Paso, Fort Worth, Fresno, Guilford County (Greensboro, N.C.), Hawaii, Hillsborough County (Tampa), Houston, Indianapolis, Jackson, Jefferson County (Louisville), Kansas City, Long Beach, Los Angeles, Manchester, Miami-Dade County, Milwaukee, Minneapolis, Nashville, New Orleans, New York City, Newark, Norfolk, Oakland, Oklahoma City, Omaha, Orange County (Orlando), Palm Beach County, Philadelphia, Pinellas County, Pittsburgh, Portland, Providence, Puerto Rico, Richmond, Rochester, Sacramento, San Antonio, San Diego, San Francisco, Santa Ana, Seattle, Shelby County, St. Louis, St. Paul, Stockton, Toledo, Toronto, Tulsa, Washington, D.C., Washoe, and Wichita

1331 Pennsylvania Ave. N.W.Suite 1100NWashington, D.C. 20004