mission innovation beyond 2020 › wp-content › uploads › 2019 › ...2 mission innovation...
TRANSCRIPT

MISSION INNOVATION BEYOND 2020
Challenges and opportunities
A paper by the MI Secretariat on the clean energy innovation landscape for input into discussions about the role and priorities of Mission Innovation beyond 2020

2
Mission Innovation Beyond 2020: Challenges & Opportunities
Executive Summary
Mission Innovation (MI) is the leading intergovernmental platform aiming to dramatically accelerate clean energy innovation. It was launched by world leaders at COP21 in November 2015 with members (responsible for >80% clean energy R&D investment) pledging to seek to double their own clean energy innovation spend over five years. To help inform options for MI beyond 2020, this paper summarises recent developments, challenges and trends in the clean energy landscape based on expert interviews and desk-based research.
Section 1 Key Trends Affecting Clean Energy Innovation p3
Summarises insights gathered through expert interviews – including trends that will affect clean energy innovation over the coming decade and priorities and recommendations for future global collaboration.
Section 2 Energy Innovation Landscape p4-6
Profiles the energy innovation landscape, including the various “supply-push” and “demand-pull” mechanisms for accelerating systemic transitions.
Key message: Given that new innovations have long incubation times, the literature indicates that timelines can be shortened by a system-wide approach to innovation that includes developing a clear and long-term vision, increasing skills, strengthening networks, investing in demonstrations, nurturing markets and building user acceptance.
Section 3 Public and Private Sector Investment p7-10
Provides an overview of public and private sector investment trends and priorities in clean energy Innovation.
Key message: Public and private investments in clean energy innovation are increasing slowly, to ~$23 bn by the public sector and $50-55 bn private sector investment in 2018. However, they are still a small share of total R&D budgets and public investment in energy innovation is half the level as a share of GDP that it was in the late-1970s.
Section 4 Energy Innovation Needs p11-15
Summarises key trends affecting innovation needs, priorities in different sectors and considerations for the future.
Key message: Trends of rising energy access, electrification, digitalisation and net-zero targets in some countries are
shifting innovation priorities, with major challenges including providing grid flexibility, integrating and adapting technologies, reducing energy demand and demonstrating and scaling solutions for harder-to-abate sectors.
Section 5 Global Collaboration p16-18
Assesses the benefits and barriers of international collaboration and priorities for the future.
Key message: Coordinated experimentation can reduce costs and risks, increase confidence amongst innovators and investors and build larger market niches, but priorities need to be aligned, trust established, and mechanisms need to be efficient to achieve impact.
Acknowledgements We would like to thank the MI Secretariat team who conducted interviews, surveys, the literature review and who drafted this paper: Jennie Dodson (UK), Helen Fairclough (UK), Jia Zhang (China), James Wood (UK), Stephanie Klak (Canada), Tomas Baeza (Chile), Irmgard Herold (Austria), Aliki Georgakaki (EC) and Jean-Pierre Rodrigue (Canada).
Thank you to expert contributors, members and our collaborating organisations for providing input and reviewing this paper including the MI Innovation Challenges leads, the IEA, IRENA, Global Covenant of Mayors, World Economic Forum, University of East Anglia and the Rocky Mountain Institute.
This paper does not necessarily reflect the views or position of Mission Innovation members or other organisations, either
individually or collectively.

3
Mission Innovation Beyond 2020: Challenges & Opportunities
Key Trends
Level of consensus on key priorities A lack of consensus and mixed policy signals (domestically and internationally) is creating uncertainty for stakeholders, including investors. Given the urgency to deliver affordable and sustainable energy solutions, experts noted that collaborative efforts could adopt a mission-oriented approach in order to tackle key challenges. Experts recognised, however, that the appetite for proactive industrial policies varies between countries.
Polarisation of public and political opinion: As awareness around climate risks grows, increasing interest in clean energy from the public and investors will drive demand for low-carbon solutions. However, the inertia and enormity of the energy system, resistance from incumbents, and the potential for citizen resistance during rapid transitions could polarise demands and create tensions. Governments need to strike a balance between the need for urgent action, maintaining public support and avoiding lock-in to inefficient pathways.
Technology trends Improving power system flexibility: Falling costs and increasing uptake of renewables (e.g. solar and wind), resulting in greater decentralisation of energy supply and increasing electrification, requires innovative solutions that improve flexibility and manage energy supply and demand (e.g. digitalisation, batteries, longer term energy storage).
Harder-to-abate sectors: experts indicated that innovation in harder-to-abate sectors that are difficult to electrify e.g. steel, aviation, agriculture, cement and shipping
will be central areas of focus in the future.
Immediate cost reductions and infrastructure needs (e.g. electric vehicle charging, CO2 storage) must be balanced with investing in radical innovations to reduce future demand and enable energy access to all (e.g. ultra-high-efficiency PV, energy-as-a-service, chemical energy carriers, Virtual Reality as an alternative to
travel, direct air capture).
Moving from technology to whole-system innovation: As the energy system becomes more integrated innovation policy needs to broaden from technology
R&D to systemic innovation that includes innovation in policy, business models, market design, financing and social science and connecting to deployment.
Innovation system capacity: Effective national systems of innovation (NSI) are essential to enable countries to absorb, adapt, distribute, diffuse and deploy and maintain clean energy technologies. NSIs include education and skills, RD&D funding and enabling policy.
Access to innovations: Rising energy demand in developing countries could lead to an uptick in fossil fuel use, unless there is support for access to new technologies and investment in local RD&D to develop appropriate innovations.
Availability of finance: More financing
is required at all stages of technology maturity, but this needs to be combined with financial innovation to manage risks and streamline the investment process e.g. standardised processes leading to lower financing costs for large businesses to adopt new technology and for governments to procure more efficiently.
Overview Whilst the global community has delivered significant successes in driving cost reductions in key technologies such as wind and
solar photovoltaics over the past decade, the rate of progress in innovation is still insufficient to deliver affordable and widely
available solutions across all sectors of the economy to meet energy access, climate change and energy security goals. To
inform discussions about the future of Mission Innovation, this section summarises key trends and future priorities for global
collaboration over the coming decade, based on expert interviews with senior MI officials and stakeholders.
“The creation of radically new,
transformational solutions combined
with speeding up the cost reductions of
available technologies, and ensuring
access to technologies in emerging and
developing countries that will be major
deployers, will all be fundamental pillars
of the clean energy transition.”
Section 1: Key Trends Affecting Clean Energy Innovation
“The more that the commitment to act is
global, the more likely we are to see
rapid movement towards innovation
across the world, including global clean
energy collaboration.”
Recommendations for future global clean energy collaboration Bold vision – set a clear and ambitious global vision recognising the speed and scale of transition required. This could include an action plan for 2030 with targets & milestones that groups of governments and businesses commit to supporting over the next decade.
Focus on sectors – focus innovation efforts around themes and sectors rather than specific technologies, for example, electrification, urbanisation or hard-to-abate sectors.
Embed collaboration with the private sector – design collaborations from their inception with the private sector, for instance through the development of joint technology roadmaps, sectoral coalitions or public-private deals.
Systemic innovation – enhance efforts beyond technology innovation including sharing best practice in innovation policies, behavioural sciences, strengthening capability, business model innovation and market creation to nurture new innovations.
Strengthen involvement of developing countries - as major deployers of low-carbon energy, greater involvement of developing countries will improve the development of appropriate technologies, stimulate markets and improve take-up of innovations.
Enhance international collaboration funding – increase availability of funding for cross-border collaborative innovation, for instance through national commitments or a multi-national fund.
Political leadership - re-engage global political leadership to reaffirm their commitment to innovation and enhance resource for central coordination.

4
Mission Innovation Beyond 2020: Challenges & Opportunities
The Energy Innovation Ecosystem
Innovation is a complex, uncertain, dynamic series of interconnected processes (Box 1).1 Clean energy innovation to deliver energy access, climate change and energy security goals, will require a socio-technical transition, which may result in a realignment of technologies, behaviours, businesses, markets, rules and infrastructures. Current thinking has moved beyond a “linear” model of innovation through research, development, demonstration and deployment (RDD&D). Instead a systems approach proposes that complex and ongoing interactions driven by “supply-push” and “demand-pull” activities shaped by actors and institutions at multiple levels results in the transition to new technologies occurring over four broad phases: invention, breakthrough, diffusion
and reconfiguration (Figure 2a). 2,3 Research and innovation occurs throughout these stages as innovations reach different levels of maturity with multiple feedback loops and dead-ends as it goes through cycles of ‘learning-by-searching’ and ‘learning-by-doing.1
Loose structures in niches enable experimentation and radical innovation in the invention phase resulting in multiple solutions. Landscape changes such as new regulations or customer demands can challenge the existing regime, alongside new networks, cultures and user practices enabling innovations to breakthrough, coalescing around a dominant design as it diffuses, resulting in reconfiguration of the regime and landscape as it matures.
There are three potential strategies for opening up existing systems to change:4
Demand driven: Changing the structure of incentives, such as through taxes or banning something, can cause shifts in market forces that drive demand for innovation. This can require big policy shifts and can result in windfall profits and losses for small groups as well as other unintended consequences.
Planned: The creation and pathway to a new system is planned, similar to the approach for planning a large infrastructure works. This can result in picking the least optimum ‘winners’ and requires the ability to control complex dynamics within societies and technology systems.
Goal orientated: Co-evolve both supply-push and demand-pull pressures to modulate system dynamics towards
Box 1: Types of innovation Source: Freeman and Perez (1988), Ryan (2004) Incremental innovations: Innovations that occur continuously, that are not the result of deliberate R&D, but are a result of “learning-by-doing” and “learning- by-using”.
Radical innovations Discontinuous events, usually as a result of deliberate R&D in an enterprise or university. They lead to growth of new markets and investments, but are relatively small in aggregate economic impact.
Changes of technology systems: far reaching changes in technology, affecting several branches of the economy, as well as giving rise to entirely new sectors. They are based on a combination of radical and incremental innovations affecting more than one or a few firms.
Changes in “techno-economic paradigm (“technological revolutions”): major influence on the behaviour of the entire economy created through many clusters of radical and incremental innovations, not only creating a new range of products, services, systems and industries, but also affecting almost all other branches of the economy.
Figure 2a: Description of socio-technological transitions based on Schot and Geels (2008)
Key messages • Innovation is the result of a complex system (rather than linear chain)
affected by both “supply-push” and “demand-pull” activities, with innovation policies needing to extend from earlier stage research & development through to nurturing markets.
• New innovations historically take decades to reach significant market shares. Energy has had some of the longest incubation times due to low levels of private R&D, long asset lifetimes and lack of a ‘premium’ product.
• Actions that can shorten innovation lifetimes include: a clear and long-term vision, coordinating experimentation, investing in demonstrations, strengthening networks and building cultures.
Section 2: Energy Innovation Landscape

5
Mission Innovation Beyond 2020: Challenges & Opportunities
desired end goals. This approach is particularly dependent on the nurturing of niches, whether for new technologies or social behaviours, which are then able to penetrate the dominant regime.5
Speed of transitions New innovations typical take several decades to reach significant market shares following invention.6 Energy generation technologies have had some of the slowest rates e.g. 37 years for solar PV compared to 5 years for the compact fluorescent light bulb and the LCD TV.6 The formative period of technology development is important. Substitutability reduces the formative phase length as new institutions or infrastructures are not needed.7 Formative phases can be compressed through aggressive innovation efforts, such as during WWII, which combined strong technology push and demand-pull, price insensitivity and sharing of intellectual property (Figure 2b).7
A major challenge for the energy system is the need for transitions in some of the least innovative sectors of the economy. Private sector R&D intensity for the power sector and energy-intensive industries is around 0.5-1% of turnover, or 3% for industrial engineering companies, compared to 10-15% for highly innovative sectors such as pharmaceuticals and biotechnology.1 The expensive and risky development stages, the long lifetimes of assets and lack of a ‘premium’ market reduce the “demand-pull” incentives for the private sector to support radical innovation and scale-up.
Current evidence therefore suggests that clean energy transitions require synergistic policies from earlier stage innovation development (“supply-push”) all the way through to market creation (“demand-
pull”) with potential policy tools ranging from R&D funding, to building new institutions and trialling new technologies and business models at scale (Table 2a). Indeed, levels of innovation have been found to be strongly correlated to both levels of public R&D investments and market creation.8
Interestingly, although international collaboration typically focuses on supply-side activities (e.g. public R&D funding), some evidence from the solar PV sector suggests that these are mainly effective at fostering innovation within national borders, whilst demand-pull policies increase innovation across borders, and therefore there is a need for international coordination to address spillover issues.9
Mechanisms for accelerating
system transitions The choice for policy makers is therefore not one of choosing between R&D or deployment, but how to create the synergy of incentives that will nurture the niches and pathways leading towards desired goals as rapidly as possible.6
Articulating a clear vision: Long-term visions or ‘missions’, can galvanise innovation across different sectors and actors. The mission-oriented approach proposes that public investment must be proactive and bold, creating direction, and involving public investment throughout the entire innovation system, (i.e. invention, breakthrough and diffusion).10 This approach requires long-term commitment from both public and private
actors to stimulate knowledge accumulation, experimentation and long-term investments.11
Demonstrating high capital cost technologies: At the demonstration stage, investors typically face high capital risks, and the level of investment required through government support is at its highest (although a lower share overall).12 Public support is likely to be critical for demonstration and infrastructure in technologies such as CCUS, hydrogen, EV charging and direct-air capture.11
Nurturing niches: Governments and institutions can nurture initial market niches where innovations can develop to drive down initial costs and improve performance while being initially sheltered from market forces and hostile incumbent actors. For instance, government procurement, public-private partnerships and feed-in tariffs in numerous countries have been crucial to help support renewable energy technologies in early or pre-commercial stages.11
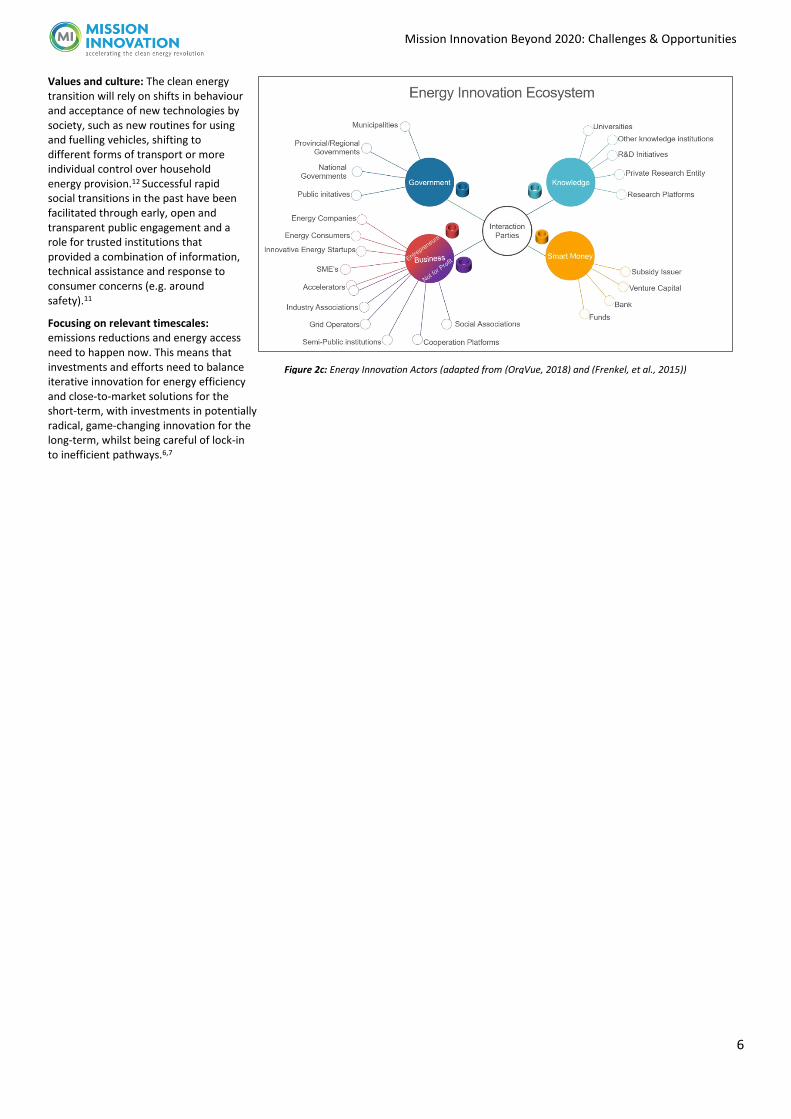
Strengthening networks: The presence of nodes both nationally and internationally that facilitate and strengthen interactions (e.g. cooperative RD&D projects, mobility schemes) between different actors (government, finance, knowledge or business) enables new ideas to be tested and transferred to new markets or areas of application faster by coordinating knowledge flows and strengthening relationships (Figure 2c).12,13,14,15
Enhancing expectations: The uncertain nature of innovation means that expectations of future markets, technologies and policies can have a crucial influence on decisions, whether by policymakers or investors, about which innovations to invest in and develop.16 Expectations are often shared amongst people in the same industries or technology areas, potentially resulting in self-fulling trajectories of technological development.17
“The main system functions that
triggered the positive build-up of the
Japanese PV innovation system were
guidance of research, as policies were
based on a shared vision, and policies
were for the long-term, thereby
providing certainty and support to
entrepreneurs to set up projects and
invest in PV technology.” Twomey (2014)
Figure 2b: Historical timelines and formative stages of innovation of energy technologies. Adapted from Bento (2016)
Table 2a: Types of innovation policy instruments. Source: Edler (2017)
Enhance innovation supply Enhance supply & demand Enhance innovation demand
Direct Investment in R&D
Fiscal incentives for R&D
Training & skills
Cluster Policy
Innovation network policies
Policies to support collaboration
Pre-commercial procurement
Innovation inducement prizes
Standards
Regulation
Technology foresight
Private demand for innovation
Public procurement policies
Behavioural insights
6
Mission Innovation Beyond 2020: Challenges & Opportunities
Values and culture: The clean energy transition will rely on shifts in behaviour and acceptance of new technologies by society, such as new routines for using and fuelling vehicles, shifting to different forms of transport or more individual control over household energy provision.12 Successful rapid social transitions in the past have been facilitated through early, open and transparent public engagement and a role for trusted institutions that provided a combination of information, technical assistance and response to consumer concerns (e.g. around safety).11
Focusing on relevant timescales: emissions reductions and energy access need to happen now. This means that investments and efforts need to balance iterative innovation for energy efficiency and close-to-market solutions for the short-term, with investments in potentially radical, game-changing innovation for the long-term, whilst being careful of lock-in to inefficient pathways.6,7
Figure 2c: Energy Innovation Actors (adapted from (OrgVue, 2018) and (Frenkel, et al., 2015))

7
Mission Innovation Beyond 2020: Challenges & Opportunities
Why invest in innovation?
Public funding for research, development and demonstration (RD&D) is important in most sectors. As outlined in Section 2, this is particularly true of the energy sector where high capital requirements, the need for a wide portfolio of technologies, regulatory uncertainties and economies of scale, all make the contribution of the public sector essential in the innovation process.18 Table 3a outlines a number of public and private investment mechanisms.12
Historically, the public sector has provided crucial support for basic and applied research, as well as early-stage high-risk finance to innovative companies. This de-risks and fosters innovation, helping to “crowd-in” other sources of funds.19
As sectors mature and consolidate, innovation activity increasingly focuses on incremental improvements around a dominant design, such as manufacturing processes and increasing scale of production, with increasing shares of private sector investment.20 This typically attracts funding from a different type of investor than at earlier technology maturity levels (e.g. direct funding from large companies or utilities instead of Venture Capital for start-ups).20
The public sector also assists as technologies mature by the direct creation of markets, through procurement and bold demand policies that have enabled new technologies to diffuse.21 Upscaling of economically viable robust solutions is a significant challenge and hence governments have an important role to play during this transition as these solutions struggle to reach scale and descend on the learning cost curve.22
Public Sector Investment Trends Two defining characteristics of public sector energy RD&D investments are: (a)
its comparably small magnitude - the highest share of energy spending in global government RD&D investment was 5% in the 1980s, and (b) its “boom and bust” profile - as seen in its rise following the oil crises of the 1970s, and its subsequent collapse, with corresponding impacts on knowledge depreciation, and gradual recovery after the year 2000 (Figure 3a).
Total investments are currently rising, with estimates showing total public energy RD&D spending growing by 5% in 2018 reaching a total of ~$28 bn (PPP) globally, with $23 bn of that in low carbon energy.23 The increase was mostly additional funding for low-carbon energy technologies.24
Table 3a – Range of investment mechanisms from the public and private sector. Source: IEA
- Technology Innovation to Accelerate Energy Transitions 2019
Instrument Description Purpose 100% Grants Funding awarded to researchers in
public or private institutions for projects selected by government agencies.
Address private underfunding of research and direct efforts towards government priorities.
Co-funded grants
Funding for private research projects is contingent on use of own funds by the company, ranging from 5% to over 50% of costs.
Compared with 100% grants, co-funding reduces the risk of “crowding out” and uses public funds more efficiently.
Research by state-owned enterprises
Governments can use their ownership rights to direct the level and type of research undertaken.
Support national champions that are committed to preserving the returns to RD&D within the country. Direct corporate strategy towards national interests.
Public research labs
Government can employ researchers as civil servants and establish long-term research programmes.
Provides funding and job stability for researchers working on strategic topics free from commercial pressures.
VC and seed funding
Capital, usually equity, is provided to new small enterprises in the expectation that a small proportion of the investments can be sold for a substantial profit several years later.
Government VC funds create a market for risky, commercially oriented innovation and can give a social direction to capital market-based technology selection.
Loans and loan guarantees
Public loans can bridge funding gaps for companies on the verge of profitability, enabling them to construct demonstration plants or first-of-a-kind facilities.
Public lenders can be more tolerant of risk in the pursuit of public goods, lending at lower than market rates.
Tax incentives
Lower tax rates or rebates for R&D expenditures; tax allowances; payroll tax deductions; tax refunds for not-yet profitable start-ups.
Encourage firms to undertake more RD&D in all sectors, raising skills and keeping local firms competitive.
Targeted tax incentives
Favourable tax treatment for a specific sector or type of R&D.
Stimulate more activity in a part of the innovation chain or strategically shape a sector.
Prizes Funding awarded to winners of competitions to meet a specific technology performance target or outperform rivals.
Use the prize money (or other reward) to stimulate innovation and help policy makers of technology status at reduced public cost.
Key messages • Global public sector spending on clean energy innovation is rising, by 5% in 2018
to ~$23 bn annually. However, as a share of GDP energy RD&D investment has halved since the late-1970s and is lower than in some other sectors, e.g. health.
• Global private sector funding in clean energy RD&D was estimated at $50-55 bn in 2018.
• Further robust assessment would be beneficial of the level of RD&D investment needed. However, higher investment alone is not enough; improving market conditions and providing policy support is vital to improve the impact of investments.
Section 3: Public and Private Sector Investment
Summary Investment in clean energy is essential to accelerate innovation by de-risking early stage technologies and stimulating private sector interest.
Section 3 provides an overview of public and private sector investment trends in clean energy, challenges in fostering investment and key priorities for the future.

8
Mission Innovation Beyond 2020: Challenges & Opportunities
However, as a share of GDP public energy RD&D funding has fallen significantly since the late-1970s (Figure 3b) 25. Norway invested 0.1% of GDP in energy RD&D in 2017, the highest level amongst IEA members, with other leading countries including Finland, Switzerland and Hungary.26 In terms of absolute spending, the United States, China, Japan, France and Germany account for ~70% of all global clean energy RD&D.26
In contrast to the fluctuating trend of investment for energy, overall RD&D budgets in the OECD have consistently risen since the 1980s (Figure 3a). Throughout this period, spending on health RD&D has typically been 2 to 3 times higher than that on energy (see right axis of Figure 3a).27
Public Sector Investment Areas Since 1980, 42% of the cumulative energy RD&D budget has been allocated to nuclear technologies. $254 bn has been invested in nuclear over that time, three times the investment on the second largest area, energy efficiency (Figure 3c).24 Nuclear and fossil fuels dominated investments until 2000, with RD&D becoming progressively more diverse since then. Investment in nuclear fell to 22% in 2018 (the first year it has not received the largest proportion).24
Budgets for energy efficiency and renewables grew significantly during the 1990s and 2000s, while RD&D budgets on fossil fuels, (which peaked in the 1980s and early 1990s), have declined since 2013. Since then the share of expenditure on energy efficiency has remained level, while the share of renewables declined and funding for cross-cutting technologies has doubled over the last 10 years.
Private Sector Investment Trends Monitoring private R&D investment is challenging due to the lack of robust public data and distinction in data classifications between low-carbon or conventional energy activities. The focus of analysis is therefore on broad trends (Figure 3d).
These show that private sector investments in clean energy R&D reached between EUR46-50 bn in 2018 ($50-55 bn), with levels remaining stable or increasing slightly over the past five years.26,28 This suggests that around 6-8.5% of total global business R&D expenditure is going into clean energy, compared to 11% dedicated to information and communication, and almost 10% to the development of pharmaceuticals.29
Major listed companies and their subsidiaries account for 60-70% of all activity and investments, although they only make up 20-25% of the number of actors. VC investment is small at just over 7%.30 VC funding differs across regions, with investment levels lower in Europe than in the US; however, specialised cleantech VC funds are frequently present in countries with high innovation activity (e.g. Germany, the UK). Increasingly, new clean energy technology development comes from actors outside the 'energy sector’ e.g. ICT26 ,31 and involves intangible assets or incremental non-energy specific innovation at low costs.
Private Sector Investment Areas Between 2010 and 2015, the majority of
private R&D investment was directed to improvements in energy efficiency in industrial processes, followed by renewables, consumer technologies and e-mobility (including battery technology).32 In Europe, Asia and the Pacific, private R&D investment is more evenly distributed across thematic areas and has remained relatively stable over time.32 The rest of the world has seen an increasing focus on energy efficiency in industry and consumer technologies.33
Private sector actors The type of financial actors investing in clean energy innovation differs across technologies and the type of finance may
Figure 3a: trends in public sector energy RD&D since 1982 in IEA member countries compared with total public RD&D expenditure from the OECD and on health R&D expenditure from the OECD STAN database.
0
10
20
30
40
50
60
70
0
200
400
600
800
1000
1200
1400
19
82
19
84
19
86
19
88
19
90
19
92
19
94
19
96
19
98
20
00
20
02
20
04
20
06
20
08
20
10
20
12
20
14
20
16
20
18
Tota
l pu
bli
c en
ergy
/he
alt
h R
D&
D
(bil
lio
n U
SD)
Tota
l pu
bli
c R
D&
D s
pen
d (
bil
lio
n U
SD)
OECD public R&D spend compared with IEA figures on public RD&D spend on energy and health
(billion USD)
Total R&D - axis 1 Energy R&D - axis 2 Health R&D - axis 2
Figure 3b: Total public energy RD&D budgets as a percentage of GDP by country for 1980 and 2017 (selected MI members). Source IEA Data Services.
Figure 3c - IEA members cumulative public energy
RD&D investments from 1980 to present by
technology. Source: IEA Data Services

9
Mission Innovation Beyond 2020: Challenges & Opportunities
influence the direction of technology development.
An EU study of innovative, investment-ready energy projects (Table 3b) found that the most suitable investors are corporate investors (such as utilities, oil and gas companies and manufacturing conglomerates) and venture capital funds
who have sufficient risk appetite and capital. 34,35,
Angel investors and family offices also play a role but there is less transparent data on their activities. Crowdfunding can play a minor role, although it may be hindered by legal frameworks. Accelerators, incubators, growth and expansion capital funds, commercial banks and institutional investors are generally not a good match, due to a mismatch with their requirements in terms of the maturity of the venture and the amount of capital that is required.
Major reasons why private sector stakeholders do not invest in clean energy innovation vary but include those described below and in Figure 3e.34,36,37,38,39,40
High investment volume (capital-intensity) and long pay-back time: Energy technology innovations often require a long development period, and even longer before a positive cash flow can be realised. Entrepreneurs (optimistically) expect an average of four years to reach positive cash flows, which would be considered long for investors, such as VC funds, aiming for an exit in five to seven years.34
Preference for incremental innovation: Faced with long timeframes, uncertainty and competition from other regions and sectors, energy companies prefer to focus on incremental innovations in their core competence and outsource R&D activities involving more risk.41
'Transactional' issues can also play a major role in a lack of financing, such as a lack of financial and market understanding by innovators, an underdeveloped business plan, or a lack of technical knowledge on the part of the investor. Additionally, networks may not be sufficiently developed to foster investment.
Future levels of public and private
R&D investment There is little firm evidence about the future levels of clean energy RD&D investment needed. Determining this is complex, given the number of different
potential development pathways, the multi-purpose nature of technologies and the lack of clarity on which features of the energy system to preserve and why.42 As such these estimations are indicative rather than highly accurate.
The total investment for the clean energy
transition across all sectors, is estimated in the order of $3.5 tn per year to 2050 (deployment funding).43,44 Current (including planned) investments range from $1.8-2.6 tn annually.
The only global estimates for levels of public sector RD&D investment needed in
Figure 3d – Estimates of global private sector investment on low-carbon energy R&D UNEP/Bloomberg NEF consider a subset of technologies and companies (lower estimate); JRC (f) and IEA include over 2500 parent companies and subsidiaries; JRC (p) use patents as a proxy to account for all companies filing for patents in the sector (larger dataset but time lag).
Table 3b – Investment preferences per investor type (Source: European Commission (2018) Building the
investment community for innovative energy technology projects ).
Level of match / suitability:
Investor type Typical maturity of venture Typical amount per transaction
Own resources, family & friends TRL <7 €20 – 100K
Accelerators & incubators TRL < 7 €10 – 150K
Angel investors TRL 7-9 €50K – 1M
Crowdfunding All stages €20K – 5M
Venture capital fund TRL 7-9 €300K – 5M
Family offices All stages €500K – 10M
Growth/expansion capital fund Commercial €5M – 100M
Corporate investor TRL 7-9 €20m - €100M
Commercial bank Commercial €20m - €100M
Institutional investor Commercial > €25M
Figure 3e:- Reasons for not investing in EU clean energy innovation. Green: Intrinsic issue; Orange: Transactional issue. (Source: European Commission (2018) Building the investment community for innovative energy technology projects ).

10
Mission Innovation Beyond 2020: Challenges & Opportunities
clean energy suggest $100 bn annually (or ~0.1% global GDP), similar to the levels spent on clean energy deployment subsidies and to investment as a share of GDP in the late-1970s.45,46,47,48 In Europe, leading up to 2030, a minimum of EUR 20 bn needs to be invested in clean energy RD&D activities, although this only assesses areas of ‘high importance’ and therefore cannot be compared to current investments (see Figure 3f).41
If these funding gaps are at all indicative of what is needed, cumulative annual public and private RD&D investment may need to increase by 2-5 times annually. Further robust assessment would be beneficial of the level of RD&D investment needed compared to subsidy levels and total investments in deployment.
Fostering Investment and Increasing its Impact
Supporting the clean energy transition cannot be addressed by increased RD&D investment alone.22 Increasing the impact of current investments and fostering a market that is self-sustaining is necessary for the long-term success of the clean energy transition.
1) Monitoring and evaluation: More attention should be paid to monitoring and verifying that investments have the desired impact and to ensuring that RD&D budgets are impact driven.22 This will increase the incentives for investors (both public and private) to continue supporting RD&D.
2) Market creation for innovative, close-to-market energy technologies, to reduce uncertainty over market uptake and produce a profitable business case.36,39 Tools like price signals (such as carbon and fossil fuel prices38), and policy signals such as long-term targets and incentives.49 Having a stable support framework of incentives could provide certainty for investments in innovation.
3) Designing policy support measures that take into account the type of financing that 'prefers' to invest in each technological area36 and maintaining the incentives for RD&D, along with market development, to avoid technology lock-in.50
4) Coordination and building capability in different types of financing36 by providing assistance to both investors and innovators on how to identify and navigate funding opportunities. An example of this would be
comprehensive mapping and guidance on available instruments, information and matchmaking events.
5) A healthy innovation-ecosystem: Businesses tend to outsource or separate R&D activities to reduce risk. Having the capacity to absorb and support these activities outside the company environment would ensure an outlet for private R&D funds. This ensures that lack of skills and resources do not become a bottleneck in private sector innovation.34
Figure 3f: Investments needs in Europe up to 2030 in R&I activities of high importance to the clean energy transition, as identified in the EU Strategic Energy Technology Plan

11
Mission Innovation Beyond 2020: Challenges & Opportunities
Trends influencing innovation
Varied pathways: To limit global warming to well below 2˚C and as close as possible to 1.5˚C, the recent IPCC report recommended that the world should reach net-zero CO2 emissions by mid-century.51
There is not one pathway to achieve this. Four illustrative models demonstrate the trade-offs (Figure 4a). In the P1 scenario, rapid reductions in energy demand through social, business and technological innovations enable rapid decarbonisation of the energy supply. The P4 scenario is a resource and energy-intensive scenario with later emissions reductions mainly achieved through carbon dioxide removal (CDR) technologies. Historical comparisons suggest that these technologies will face barriers to move through a rapid formative stage due to the new infrastructure, institutional structures and business models required, so there are significant risks associated with relying on them.7
Rising energy demand: 550 million people have gained access to electricity since 2011; however, in 2017, approximately 13% of the world’s population (992 million people) still did not have access to electricity,52 whilst 2.8 bn people were living with no access to clean forms of energy for cooking.52 Current policies could lead to energy demand rising by 40% by 2050,44 with 90% of the future growth in energy demand predicted to come from developing and newly industrialised countries.53 For instance, energy demand for space cooling could more than triple by 2050 without significant energy efficiency measures – consuming as much electricity as all of China and India today.54
Increasing electrification: Solar photovoltaic (PV) module prices have fallen by around 80% since the end of 2009, while wind turbine prices have fallen
by 30–40%, driven by a virtuous cycle of falling costs, technological improvements and deployment.55,56 Direct low-carbon electrification could occur for heating, transport and industry, potentially resulting in electricity capacity needing to increase by 2 to 6 times, with electricity potentially providing 40-75% share of final energy demand by 2050.57,58
Digitalisation and decentralisation: The integration of large amounts of variable renewable energy is driving innovation to provide flexibility, as well as an assessment of the security implications of an increasingly decentralised energy system.57 Emerging solutions include intelligently-connected networks, use of electric vehicle (EV) batteries for storage, behaviour change and smart controls to provide dynamic pricing, supply and demand-shifting, and expansion of mini-grids. Digitalisation also enables better optimisation of energy use in buildings and predictive maintenance of equipment.
Whole economy transitions: An increasing number of countries, regions and
companies are setting net-zero greenhouse gas targets,59 which will require innovative social and technological solutions across the whole economy to both reduce demand and mitigate emissions. Delivering these targets will require rapid cost-reductions and scale-up of technologies for all sectors (i.e. beyond power), with the International Energy Agency estimating that only 7 out of 39 of clean energy technologies are being deployed fast enough to meet their ‘well below’ 2 ᵒC scenario.60. As full decarbonisation is difficult in some sectors (e.g. cement, agriculture) carbon dioxide removal (CDR) from the atmosphere is also likely to be needed through afforestation or technical options such as mineralisation or BioEnergy with Carbon Capture and Storage (BECCS).
Key messages • Solutions needed to deliver affordable clean energy in all sectors are under
development, but many of them are not market ready or have not been demonstrated at scale.
• A system-wide approach to innovation is needed that includes behavioural sciences, financial innovation, energy efficiency, demonstrating technologies at scale, nurturing markets, technology integration and radical service models that reduce demand.
• Future programmes should consider whether to have a greater focus on innovation that responds to the trends of rising energy access, electrification, digitalisation and net-zero targets.
Overview To mitigate climate change, deliver energy access for all and provide a secure energy system over the next two to three decades will require a profound transformation. This section examines some of the key innovation needs described in the literature that could be vital over the next decade to deliver these interconnected goals.
Figure 4a: Model pathways to achieve net-zero emissions by the middle of the century They vary in level of technological innovation, projected energy demand, use of BioEnergy Carbon Capture & Storage (BECCS) and Agriculture, Forestry and Other Land Use (AFOLU). Source: IPCC (2018)
Section 4: Energy Innovation Needs

12
Mission Innovation Beyond 2020: Challenges & Opportunities
Innovation needs
Industry: Heavy industry currently accounts for around 18% of global CO2 emissions and 25% of energy demand.58 As globally competitive industries, they are unlikely to be transformed solely through a single government’s policies and therefore international coordination will be needed to develop, demonstrate and create markets for low-carbon solutions.9,12
The greatest innovation challenges are in cement, steel and chemicals that either require high-temperature heat and/or where the fundamental chemical processes involved release CO2
and where direct electrification using low-carbon electricity cannot eliminate emissions.58
Innovation priorities include the use of hydrogen as a reducing agent in the production of steel and chemicals; using alternative, lower-carbon binding materials in cement; sustainable biomass for plastic and chemicals production and carbon capture, utilisation and storage (CCUS).* 12, 58
In the longer-term, more radical innovations such as entirely new cement chemistries, 3D printing to reduce shipping needs and novel building materials could lead to greater improvements.
Transport: clean energy solutions for
transport are likely to involve: 58
• Batteries
• Hydrogen-based fuels (hydrogen, ammonia, synfuels) produced via electrolysis using low-carbon electricity or via steam methane reforming or methane pyrolysis with CCUS
• Bio- or synthetic fuels
• Modal shifting and reducing demand
Electric engines using batteries or fuel cells are more efficient at converting stored energy to kinetic energy. They also reduce local air pollution and noise and are therefore considered more likely to dominate transport in the future.58 Whether batteries or hydrogen fuel-cells dominate will depend on rates of cost reductions and performance improvements, transport distance and which refuelling infrastructure dominates.
The cost of lithium-ion battery packs for EVs has reduced by 85% from 2010-2018, reaching an average of $176/kWh.61
* Note: Utilisation of CO2 will need to be in
products with a long lifetime or a closed reuse
However, the current weight to power ratio of batteries, ranges and recharge times are reducing their uptake in heavy-duty transport sectors, such as shipping, aviation and trucks. Innovation in alternative battery chemistries to improve cost, density and efficiency, alongside more sustainable manufacturing techniques will be needed.12 Catenary overhead wiring or electrified roads could further extend the range of battery EVs for freight.58
Shipping is likely to favour direct drop-in alternatives for existing engines, with hydrogen (e.g. stored in liquid organic hydrogen carriers) and ammonia likely to dominate in the long-term.58
Pathways for clean fuels for aviation are particularly challenging. Long-distance aviation is likely to rely on bio or synthetic jetfuels.58 Biofuels could also play a minor role in shipping and trucking. Currently only biodiesel and bioethanol production are commercialised, and there are limits on the availability of sustainable feedstocks. Scaling up production of advanced low-carbon fuels needs innovation in cellulosic ethanol and biomass-to-liquid (BtL), power-to-fuels (via H2 + CO2) as well as direct production of liquid fuels and hydrogen from sunlight.58
Buildings: Globally, buildings account for almost a third of final energy consumption, with space heating and cooling, and the provision of hot water, accounting for approximately half of this consumption.62 Demand for space cooling is expected to increase 3x by 2050 in
cycle such as in concrete, aggregates and carbon fibre to ensure that it doesn’t contribute to emissions.
emerging and developing economies.62
The nature of innovation and RD&D varies significantly depending on climate, the type of building, the local energy system, and the access to technology and building materials and whether the need is for new build or building retrofit. There are four major areas of innovation – 1. Building Performance, 2. Advanced Building Technologies, 3. Systems and Integration, and 4. Cross Cutting.
Innovation in Building Performance involves thermal comfort, minimising demand and benchmarking. Construction materials are important from operational and embodied perspectives.
Advanced Building Technologies include building integrated renewable and secondary energy sinks and /or sources, energy transformation systems e.g. heat pumps, fuel cells, and energy storage for balancing demand.63
Systems and Integration are essential to exploit the wider potential for clean buildings. This will involve flexibility, AI based control to enable buildings to be ‘smarter’ and benefit from predictive maintenance and optimisation, and to link responsively with the whole energy system.
Cross cutting innovation will aid deployment and will include identifying and mapping performance, new road maps, development of business models, policy investigations, knowledge and skills
Figure 4b: Innovation needs to achieve a high-level of penetration of variable renewable energy. Source: IRENA (2019)

13
Mission Innovation Beyond 2020: Challenges & Opportunities
transfer, and communications.64
Power: Innovation to integrate higher-levels of variable renewable energy (VRE) in the power sector is a priority.
Solutions need to facilitate flexibility and balancing in a decentralised multi-vector power grid. This will require software and digital products to manage demand-response and energy supply. Underlying this will be the need for more and better data, that is reliable and secure and understanding or influencing user behaviour.65 Digital products could have a significant impact on the energy system as they can rapidly diffuse due to their shorter innovation cycles, lower capital costs and potential for rapid prototyping.12
To create viable solutions, systemic innovation is needed that goes beyond technology to include innovation in business models and markets. Thirty emerging innovations have been identified that could facilitate greater use of solar and wind energy (Figure 4b).66
A related major need is innovation to produce a broader range of energy storage solutions, particularly to balance demand over longer time periods (i.e. weeks to months). This includes batteries, but also phase-change materials, thermal storage, pumped hydro, and conversion to storable fuels such as hydrogen or ammonia. The scale-up of renewable mini-grids in geographies where grid access is not available will require tailored energy storage solutions that can enable greater electricity supply for economic activities and cooking.67
Whilst the costs of solar and wind energy
have fallen significantly, further investments will be needed, depending on the policies and priorities for low-carbon power supply in different countries.66 These include:
• floating offshore wind to reach wind resources in deeper waters
• ongoing and radical improvements to solar energy, including higher-efficiency materials, floating PV, integration in buildings and vehicles, recyclability and resource use
• ocean and geothermal energy for specific applications
• modular nuclear reactors which may be able to provide other energy services that solve challenging emissions problems, such as process heat and hydrogen production68
Energy demand: Improving energy intensity by almost 3% per year could maintain energy demand at approximately
current levels through to 2050 (against 40% increase in business-as-usual scenarios)44 and in harder-to-abate sectors alone could halve the cost of decarbonisation.58 Innovation needs include more energy efficient equipment, shifting towards circular economy design, reducing material requirements through improved product design, innovation in service models (e.g. providing thermal comfort as a service in homes) and behavioural shifts (e.g. switching to car-sharing or public transport). Demand-side innovations have been shown to provide high social returns on investment and would reduce the investments needed in new power generation and the likelihood that unsustainable use of biomass or very high amounts of CCUS will be required in the future.69, 70 However, at present innovation investments and systems typically privilege energy-supply technologies over innovation to reduce demand.71 Initiatives, such as the Global Cooling Prize or Japan’s Toprunner Programme,72, 73 demonstrate how innovation can both improve and redesign existing products to reduce future demand.
Priorities for the next decade This paper provides a high-level summary of innovation needs in different sectors. Across these, several topics emerge as priorities, with different types of innovation required over the next decade depending on maturity (Table 5a, further
detail in Annex 1).
More in-depth analysis is needed on where focused international effort has the greatest potential to deliver affordable clean energy over the next decade and what the targets should be.
There are a number of other topics that have not traditionally fallen within the framework of global clean energy innovation collaboration but could play a major role in delivering the low-carbon transition in the coming decades.
Carbon dioxide removal: Carbon removal technologies such as bioenergy carbon capture and storage (BECCS), direct-air capture, increased use of timber and mineralisation may be necessary to reach net-zero or negative emissions across economies. Currently there are no dedicated research, development and deployment (RD&D) programs and only a handful of pilot-scale facilities are currently operating.74 However, the potential scale, cost and uncertain impacts means there are varied opinions on the extent to which this should be a priority for R&D investment, partially depending on predictions of cost reductions and deployment pathways of mitigation technologies.75,76,77
Social acceptance & behavioural changes: the rate and cost of the clean energy transition will depend on social acceptance and shifts in public, business, institutional and financial behaviour.44,51
Table 4a: Summary of priority innovation topics for the next decade
Early-stage R&D Cost reductions and demonstrations
Systemic innovation
Collaborative R&D programmes bringing together the best researchers and innovators to deliver radical innovations that will be essential for clean energy beyond 2030.
• advanced energy materials with improved performance for batteries, solar conversion and buildings
• converting sunlight to liquid fuels and hydrogen
• carbon dioxide removal (CDR) technologies
Collaborative demonstrations of capital-intensive technologies and/or procurement agreements to rapidly reduce costs and nurture niches for solutions likely to underpin clean energy transition in industry and heavy-transport and to enable high penetration of renewables:
• hydrogen
• advanced biofuels
• energy storage
• carbon capture, utilisation and storage (CCUS)
Innovation in the integration and operation of the energy system such as:
• better data to manage multi-vector energy system
• building optimisation
• behavioural science on use of energy and demand shifting
Innovation in services to reduce demand (e.g. energy as a service)
Innovative finance models that enable emerging technologies to access funding such as or peer-to-peer lending.

14
Mission Innovation Beyond 2020: Challenges & Opportunities
For instance, consumers frequently do not buy energy-efficient products – despite the lower lifetime costs, other people’s behaviour has a major impact on our energy choices and whether energy demand is freely available or optimised can make a huge difference to costs (e.g. in one study cost of charging EVs was 70% lower if demand was constrained to off-peak). 78,79 This suggests that behavioural and social sciences should play an incresing role in the design, testing and use of innovations.
Agriculture: feeding the world and forestry were responsible for 24% of global greenhouse emissions in 2010.80 Technical challenges include net-zero ammonia production, reducing methane emissions from ruminants, energy-efficient cold chains to reduce food spoilage and low-cost alternative sources of protein.81 These could be essential priorities for a future innovation programme.

15
Mission Innovation Beyond 2020: Challenges & Opportunities
Annex Section 4: Examples of technology innovation needs
The listed technologies have high potential in terms of emission reduction and describe necessary innovations to be expected
in near, intermediate and longer term. Market viability, compatibility with other elements of the energy system and
consumer value is also taken into account. Assuming all RD&D activities are implemented concurrently, initial
commercialisation is targeted in the specified timeframe.
Technology Near Term (2025) Intermediate Term (2035) Longer Term (2050)
Energy storage / batteries
• System designs to improve cost/ performance/weight of batteries
• Increased power and energy density, high cycle life
• Deployment of High-Power EV Charging Stations
• Next generation power electronics
• Physical and cybersecurity
• Hybrid energy storage systems
• Emergence of new battery chemistries
• Wireless charging
• Battery or fuel cells for short distance aviation and shipping
• Longer-term storage – including thermal storage, capacitors, compressed air, fuel pumps, flywheels, molten salt, pumped hydro and power-to-x
• Seasonal, environmentally friendly, high-density low-cost thermal energy storage
Hydrogen • Improved plant efficiencies and asset life
• Solid oxide fuel cells and electrolysis cells to reach industrial scale
• Progress on hydrogen capable pipeline materials and operating pressures, reduction of storage tanks costs
• Higher efficiency compression technologies
• H2 fuelling demonstrations,
• Hydrogen capable heat appliances e.g. boilers
• High-efficiency electrolysis (targeting capex $250/kw)
• Improved cost/performance of low- or zero-carbon H2 production pathways
• Progress of chemical looping, methane cracking, biomass gasification, solar fuels
• System design for H2 distribution infrastructure for integrated transportation and industry applications
• Hydrogen in Steel and chemical production
• Hydrogen and ammonia in shipping
• Utilisation approaches for high energy intensity manufacturing
Alternative Fuels
• Improved cellulosic conversion technology
• High-efficiency bioelectricity generation
• Biomass in iron and steel industry
• Biokerosene or alternative biojet fuels
• Increasing sustainable feedstock supply
• Improved biochemical, electrochemical and thermo-chemical conversion pathways of biomass
• Synthetic fuels (H2 + CO2) – Power-to-gas / Power-to-Liquids
• Algae harvesting
• Affordable low-carbon drop-in fuels
• Sunlight-to-fuels
Electrification • Interoperability standards
• Common modelling framework
• Non-traditional contingency planning
• Cybersecurity, assure system trust
• Integrated grid architecture across voltage-levels
• Innovative control approaches, technologies to visualize data and enable faster controls
• Automated and distributed decision-making
• Material innovations including wide bandgap semiconductors
• Internet of Things (IoT)
• DC grids
• Non-synchronized grids
• Electric cement kilns and electric furnaces
Materials • Chemical recycling of plastics
• Using timber or pozzolan based concrete to substitute for Portland cement;
• Phase-change material for thermal storage
• High-value bioproducts and input to chemicals
• Lightweight, strong materials with low-cost manufacturing
• Improved sorbents and solvents for direct air capture of CO2
• Low-carbon cement and concrete chemistries
• Novel biomaterials for construction
Smart cities • Thin insulating materials for deep retrofit
• Flexible power management systems
• Improved sensors and controls
• Thermal storage
• Technology-enabled urban planning and design
• Hybrid heat pumps
• High efficiency electric heating systems (heat pumps)
• Tunable PV systems (e.g. PV windows)
• Wireless sensors and controls
Carbon Management
• Second generation CCUS pilot plants
• CCUS retrofit demonstration
• Improved post-combustion capture
• CO2 storage infrastructure
• Demonstration of sequestration in alternative geologic media
• Testing of large-scale biological sequestration
• Direct air capture demonstration
• Industrial CCUS applications (e.g. cement, steel)
• Natural gas CCS, methane cracking
• Fuel cell carbon capture
• Sub-surface CO2 management at gigaton scale
• Demonstration of large-scale (gigaton) biological sequestration
• Efficient, low-cost, large-scale CO2 removal (e.g. direct air capture)
Sources: Breakthrough Energy - http://www.b-t.energy/landscape/; IEA innovation gaps analysis- https://www.iea.org/topics/innovation/innovationgaps/;,
IRENA. 2019. Innovation landscape for a renewable-powered future; Energy Transitions Commission. 2018. Mission Possible: Reaching net-zero carbon
emissions from harder-to-abate sectors by mid-century. and several technology roadmaps

16
Mission Innovation Beyond 2020: Challenges & Opportunities
Why collaborate on clean energy?
As societies and economies become more interdependent in an innovation-driven global economy, international collaboration consisting of joint efforts between public or private organisations in different countries can increasingly bring efficiency benefits and maximise the impact of R&D investment.82
There is little robust evidence on the economic benefits or levels of clean energy innovation collaboration. One study in 2015 estimated that international collaboration through to 2025 could reduce the costs of the clean energy transition by $550 bn.53 However, the desire to collaborate does appear to be increasing, with varying incentives for different types of organisations (Table 5a). Mission Innovation has tracked an additional $1.3 bn allocated for 59 new international collaborations between MI members since 2015.83
Benefits of collaboration Accelerating knowledge diffusion: Clean energy innovation needs diverse technical expertise and skills to identify the technologies and pathways that most effectively meet goals in different contexts. The cross-border sharing of academic, industry, and government expertise and experience increases the diffusion of knowledge and increases technical and institutional capacity so facilitating an increased rate of innovation.53
Support decision making through identification of gaps:53 Knowledge sharing between nations greatly aids in the understanding of the landscape of current investments, the challenges they address and the gaps they leave. This fosters an understanding of global priorities,84
improves market and investment analysis, and helps to align strategies, funding flows and policy aid whilst reducing duplication of efforts.
Reducing risks and sharing costs: Clean energy technologies typically have high
capital costs and require significant technical, time and monetary resources to scale up to a demonstrable or commercial stage – they are high risk investments. Collaboration can increase learning rates, spread costs and increase potential for value capture, lowering uncertainty and
Key messages • Collaboration appears to be increasing but is hindered by
transaction costs, IP conflicts, lack of pooled funding and perceptions of competitiveness.
• There has been a shift towards non-binding, voluntary and short-term collaborative structures which enables flexibility but can hinder long-term and multilateral RD&D.
• Designing collaborative initiatives and activities well requires aligning incentives of partners, building trust and creating structures for impact.
Overview International collaboration in research, development and demonstration (RD&D), plays an important role in identifying common priorities, challenges and innovation gaps, bringing teams together to work on common problems, sharing best practice and risks and creating larger markets giving companies the confidence they need to invest. This section summarises the literature on the challenges, benefits and learnings of global collaboration.
Table 5a: Barriers and Incentives by type of stakeholder
Entity Incentives Barriers Government • Acquiring valuable know-how
from partners
• Economic growth
• Sharing the cost of demonstrations and subsidies
• Desire for domestic ownership of most of the value
• Budgetary process to approve funding R&D abroad
• Regulatory and policy differences
Technology Developers
• More opportunities for fundraising during high-risk early R&D stages
• Ability to speak directly with technology end-users
• Access to markets
• IP leakage and loss of control
• Potential loss of first mover competitive advantage
Technology Users
• Ability to liaise with technology developers to tailor R&D process to actual needs
• Sharing the cost of supporting technology development
• Potential loss of first mover competitive advantage
• Potential reduction of market share
• Risk of investing in innovation
External Funders
• Spreading costs
• Spreading risk
• Sharing the returns with other partners
• Loss of overall strategic control
Figure 5a - Growing complexity of interactions and integration of activities from networking to collaboration (Russell & Smorodinskaya, 2018). Includes indicative trends showing how the level of integration varies by partnership type -a voluntary multi-lateral initiative could also result in high integration, but requires a greater degree of planning, resource investment and strategic alignment
Section 5: Global Collaboration

17
Mission Innovation Beyond 2020: Challenges & Opportunities
reducing risk.53
Stimulate private interest through larger and more certain markets: 53, 85 Through joint targets, bulk procurement, reverse auctioning, dynamic standard setting and international harmonisation, collaboration can provide predictable and long-term signals, helping to stimulate firm interest and market growth by making clean energy investments lower risk and easier to analyse and assess.
Types of Collaboration Collaborative models for energy innovation can be categorised on three fronts (Figure 5a, Annex Section 5):
1. Strength of the commitment; is it a voluntary or binding arrangement.
2. Breadth of the agreement; does it cover a single technology area, or also focus on areas such as regulation, policy creation.
3. Range of actors involved; do they vary geographically, involve the private sector.85
Different collaborative structures have varying merits and limitations. There has been a shift towards voluntary engagements since the 2000s, with governments and stakeholders favouring more numerous, flexible and shorter-term initiatives.85 The choice of which type to “use” is contingent upon the particular needs of the collaborators, their institutional setting and broader political and strategic objectives. See Annex 1 for further detail.
For instance, a binding bilateral framework between two countries with synergistic technology development needs and capacities, using a highly specified work plan to coordinate parties, with impact focused goals can reduce costs and risks for both countries. Whereas a voluntary multilateral, allows the pooling of more diverse know-how and expertise, potentially leveraging economies of scale.82
Barriers to global collaboration Collaboration remains a difficult endeavour. To be effective, collaborative initiatives need to align the incentives of all participants and stakeholders (Table 5a), although within a complex area such as energy this can be challenging within a single government, let alone internationally.53 Barriers include:
Intellectual Property:53 IP is a vital tool for technology developers to capture the value from their investments. Collaborations increase the complexity of
distribution of IP between participants, and power disparity can lead to IP loss. IP discussions must be a core part of collaboration design from the beginning.
Lack of Pooled Funding: Despite the opportunity to de-risk RD&D investments by sharing costs, pooling of resources is rare at a government level likely due to the perceived loss of control of funds.53 While binding terms outlining the use of money can alleviate concerns, this adds bureaucracy and can reduce the responsiveness of the partnership.
Legal, Policy and Technical Differences: there is an increasing interest in innovation in non-technical areas, such as regulatory systems, financial tools and market development. However, collaboration can be difficult in these areas due to varying regulatory systems from nation to nation. Fundamental differences in context can greatly reduce the impact and value of collaborative projects overall, or can lead to differences in value gained by partners.
Transaction Costs: Bureaucracy and relationship management can become exponentially more onerous as the number and size of organisations partnering increases. Mitigating transaction costs requires robust and proactive coordination amongst partners, which itself requires administrative resource and time.
Lack of Flexibility:53 The public sector can feature rigid funding cycles and commitments to long-term strategies. These features reduce the ability of government partners to rapidly adapt to changing circumstances potentially leading to missed collaboration opportunities, or delays in implementing projects.
Competition or Collaboration: In global-traded sectors, competition between nations is inevitable. This can lead to perceived competing national interests,53 which can hamper cooperation, as parties reduce their knowledge sharing, are resistant to fund partnerships and deprioritise international activities.
Institutional capacity: some countries may lack the resources to develop and manage multiple separate bilateral collaborations. They may therefore prefer multilateral frameworks (e.g. Eureka, MI Innovation Challenges, IEA TCPs) as mechanisms to collaborate.
Future Collaboration “The fundamental question is not whether to collaborate internationally, but rather how best to do it and with whom”85
Future effort should focus on the mechanisms of collaboration, and how these reduce barriers to collaboration.
(1) Public-Private Collaboration85
Policy makers must tap into the private sector’s investments and capabilities. There are challenges in doing so, often due to cultural differences or diverging interests.
(2) Streamline and design initiatives for impact84
Hundreds of collaborative initiatives already exist and yet the mechanisms are not widely used, and their activities are not necessarily leading to sufficient investment and impact. Streamlining the landscape could reduce capacity constraints, whilst designing partnerships more effectively promotes impact (Box 2).53, 85
(3) Monitoring & assessing impact
Building monitoring and evaluation of impact into collaborative initiatives enables learning for continual improvement, evidence to attract further collaborators and demonstrate value to funders and an opportunity to share learning.12,53,85
.
Box 2: Lessons for global collaboration
Aligning Incentives – Understanding the needs and constraints of each partner is essential to identify participants with aligned interests promoting long term cooperation and increasing the likelihood of impact.
Collaboration Model – Non-binding agreements are the dominant collaboration model due to their flexibility, speed and lower commitment. However, binding frameworks offer stability and can be useful for long-term R&D programmes, where risks and costs must be managed and shared.
Co-ordination of Initiatives - Complementary initiatives can explore co-location for conferences and meetings to develop synergies and economies of scale effects and minimise unnecessary duplication of effort.

18
Mission Innovation Beyond 2020: Challenges & Opportunities
Annex Section 5: Collaboration Models
Types Characteristics Examples Purpose
Bin
din
g
Mu
lti-
Late
ral
Similar to traditional legal contracts, a binding agreement sets out a clear a framework for all members to abide by, most
often by prescribing targets to be met by a defined date. These agreements also lay out the
responsibilities for each actor in the collaboration, providing a framework for all future work.
This provides a stable foundation, allowing members to engage in long term planning and
coordination. Legal assurances also enables parties to engage in a higher degree of integration, as issues in areas such as IP, security and shared funding can be tightly
defined and controlled. Monitoring of collaboration impact is also a key part of agreements, ensuring that
impact is specific and measurable, with all parties
mutually responsible monitoring themselves and their partners.
The United Nations Framework
Convention on Climate Change
(UNFCCC)
An international agreement aimed at fostering collaboration between
all countries in the world to stabilize greenhouse gas
concentrations in the atmosphere at a level that would prevent
dangerous interference with the climate system.
Responsibility – A pre-defined work plan ensures all parties “pull their weight”, avoiding the free-rider problem. This clarity in organisational structure also makes communication and operation simpler and clearer for members. Funding – The certainty of a fixed contract makes binding agreements much safer investments, as members can more reliably predict future actions and impact, building a stronger business case and de-risking through defined division of cost. Longevity – These traditionally result in longer running programmes52, as their higher upfront cost incentivises members to extract maximum value from the partnership. Greater accountability and monitoring also means initiative impact and thus value is better monitored.
Bila
tera
l/R
egi
on
al
EU-India Co-Funding Mechanism for Research and
Innovation Cooperation
A co-funding mechanism set up by the between the Government of
India and the European Commission to support joint
projects between European and Indian universities, research institutions and companies.
European Research Area Net (ERA-NET)
Coordinates the research efforts of EU Member States and selected
global partners. It utilises ’joint programming’, addressing research challenges which cannot be tackled
effectively by national research programmes operating in isolation.
Types Characteristics Examples Purpose
Vo
lun
tary
Mu
lti-
Late
ral
This type of collaboration usually takes the form of a non-binding
symbolic or indicative agreement between parties, with broadly
specified aims and targets. This flexible approach to collaboration
aims is often followed through into initiative functioning, with parties
having the flexibility to pursue targets without a defined
methodology Plans are developed incrementally, building
collaboration functions as the partnership develops. This lack of
formality is used to allow adjustment of the collaborations
aims to better suit changing circumstances, as well as to attract a broader range of members. It is particularly suited to multi-lateral efforts where conflicting strategic
objectives could prevent the formation of a binding agreement.
Mission Innovation (MI)
A global initiative working to reinvigorate and accelerate global clean energy innovation through
eight ‘Innovation Challenges’ -creating multiple programmes that tackle key clean energy technology
areas.
Flexibility –Members can pick and choose areas of the collaboration which best suit its strategic aims, and the initiative is more agile, able to adjust its aims to maximise impact. Speed – Parties can act faster, most importantly in the beginning of the collaboration, with no formal contract having to be designed. By reducing bureaucracy, changes can be enacted faster and more efficiently. Attracting Members – The flexible commitment to this programme lowers the barrier to entry for members, supporting the rapid development of a network of collaborators. This can be vital for clean energy, where building a global consensus is vital for achieving climate goals.
Clean Energy Ministerial (CEM)
The CEM is an international forum focusing on clean energy
technology deployment, policy and best practice regulation.
Bila
tera
l/R
egi
on
al
U.S.- China Clean Energy Research
Center (CERC)
This R&D consortium brings together governments, to develop
a long-term platform for sustainable U.S.-China joint R&D, with a focus on reducing energy use in buildings, capturing and storing emissions and to design
cleaner vehicles.

19
Mission Innovation Beyond 2020: Challenges & Opportunities
References 1 Grubb, M et al. 2017. On order and complexity in innovations systems: Conceptual frameworks for policy mixes in sustainability transitions. Energy Research & Social Science. 33(1), 21-34. [16 October 2019]. Available from: https://www.sciencedirect.com/science/article/pii/S2214629617302827
2 Schumpeter, J.A (1934). The Theory of Economic Development. Cambridge MA: Harvard University Press. [16 October 2019]. Available from: https://papers.ssrn.com/sol3/papers.cfm?abstract_id=1496199
3 Fri, R.W. 2003. The Role of Knowledge: Technological Innovation in the Energy System. Energy Journal. 24(4), 51-74. [16 October 2019]. Available from: https://www.jstor.org/stable/41323012
4 Kemp, R.P.M et al. 2001. Constructing Transition Paths Through the Management of Niches. Path Dependence and Creation. 1(1), 269-299. [23 October 2019]. Available from: https://research.utwente.nl/en/publications/constructing-transition-paths-through-the-management-of-niches
5 Geels, F.W. 2002. Technological transitions as evolutionary reconfiguration processes: a multi-level perspective and a case-study. Research Policy. 31(8-9), 1257-1274. [16 October 2019]. Available from: https://www.sciencedirect.com/science/article/abs/pii/S0048733302000628
6 Gross, R et al. 2018. How long does innovation and commercialisation in the energy sectors take? Historical case studies of the timescale from invention to widespread commercialisation in energy supply and end use technology. Energy Policy. 123(1), 682-699. [16 October 2019]. Available from: https://www.sciencedirect.com/science/article/pii/S0301421518305901
7 Bento, N & Wilson, C. 2016. Measuring the duration of formative phases for energy technologies. Environmental Innovation and Societal Transitions. 21(1), 95-112. [16 October 2019]. Available from: https://www.sciencedirect.com/science/article/pii/S2210422416300284
8 Bettencourt, L.M.A. 2013. Determinants of the Pace of Global Innovation in Energy Technologies. PLOS|One. [16 October 2019]. Available from: https://journals.plos.org/plosone/article?id=10.1371/journal.pone.0067864
9 Peters, M et al. 2012. The impact of technology-push and demand-pull policies on technical change - Does the locus of policies matter?. Research Policy. 41(8), 1296-1308. [16 October 2019]. Available from: https://www.sciencedirect.com/science/article/abs/pii/S0048733312000376
10 Mazzucato, M. 2018. Mission-oriented innovation policies: challenges and opportunities. Industrial and Corporate Change. 27(5), 803-815. [16 October 2019]. Available from: https://academic.oup.com/icc/article/27/5/803/5127692
11 Vivid Economics. 2019. Accelerating innovation towards net zero emissions. [16 October 2019]. Available from: https://www.vivideconomics.com/casestudy/accelerating-innovation-towards-net-zero-emissions/
12 IEA. 2019. Technology Innovation to Accelerate Energy Transitions. [Online]. [16 October 2019]. Available from: https://webstore.iea.org/technology-innovation-to-accelerate-energy-transitions
13 Russell, M.G & Smorodinskaya, N.V. 2018. Leveraging complexity for ecosystemic innovation. Technological Forecasting and Social Change. 136(1), 114-131. [16 October 2019]. Available from: https://www.sciencedirect.com/science/article/pii/S0040162517316475
14 Frenkel, A et al. 2015. Demand-Driven Innovation: An Integrative Systems-Based Review of the Literature. International Journal of Innovation and Technology Management. 12(2) [16 October 2019]. Available from: https://www.worldscientific.com/doi/abs/10.1142/S021987701550008X
15 Scaringella, L & Radziwon, A. 2018. Innovation, entrepreneurial, knowledge, and business ecosystems: Old wine in new bottles?. Technological Forecasting and Social Change. 136(1), 59-87. [16 October 2019]. Available from: https://www.sciencedirect.com/science/article/pii/S0040162517312660
16 Twomey, P. & Gaziulusoy, I. 2014. Review of System Innovation and Transitions Theories Concepts and frameworks for understanding and enabling transitions to a low-carbon built environment. Research Gate. [16 October 2019]. Available from: https://www.researchgate.net/publication/306119135_Review_of_System_Innovation_and_Transitions_Theories_Concepts_and_frameworks_for_understanding_and_enabling_transitions_to_a_low_carbon_built_environment
17 Dosi, G. (1982), Technological Paradigms and Technological Trajectories: A suggested interpretation of the determinants and directions of technical change, Research Policy, 11(3):147–162. [26 October 2019] Available from: https://www.sciencedirect.com/science/article/abs/pii/0048733382900166
18 European Commission. 2017. Monitoring R&I in Low-Carbon Energy Technologies. [16 October 2019]. Available from: https://ec.europa.eu/jrc/en/publication/eur-scientific-and-technical-research-
reports/monitoring-ri-low-carbon-energy-technologies
19 Mazzucato, M & Semieniuk, G. 2017. Public financing of innovation: new questions. Oxford Review of Economic Policy, Volume 33, Number 1, 2017, pp. 24–48. [27 October 2019]. Available from: https://discovery.ucl.ac.uk/id/eprint/1553082/1/Mazzucato_grw036.pdf
20 UNEP. 2019. Global Trends in Renewable Energy Investment 2019. [16 October 2019]. Available from: https://wedocs.unep.org/handle/20.500.11822/29752
21 Mazzucato, M & Semieniuk, G. 2016. From market fixing to market-creating: a new framework for innovation policy. Industry and Innovation. 23(2), 140-156. [16 October 2019]. Available from: https://www.tandfonline.com/doi/full/10.1080/13662716.2016.1146124
22 Gielen, D et al. 2019. The role of renewable energy in the global energy transformation. Energy Strategy Reviews. 24(1), 38-50. [16 October 2019]. Available from: https://www.sciencedirect.com/science/article/pii/S2211467X19300082
23 IEA. 2019. Energy Technology RD&D Budgets 2019: Overview. [16 October 2019]. Available from: https://webstore.iea.org/energy-technology-rdd-budgets-2019-overview
24 IEA. 2019. Energy Technology RD&D. [16 October 2019]. Available from: https://www.iea.org/statistics/rdd/
25 IEA. 2019. Innovation. [16 October 2019]. Available from: https://www.iea.org/topics/innovation/
26 IEA. 2019. World Energy Investment 2019. [16 October 2019]. Available from: https://www.iea.org/wei2019/rdd/
27 OECD. 2019. Gross domestic spending on R&D. [16 October 2019]. Available from: https://data.oecd.org/rd/gross-domestic-spending-on-r-d.htm
28 European Commission: SETIS. 2018. SETIS Research & Innovation data. [16 October 2019]. Available from: https://setis.ec.europa.eu/publications/setis-research-innovation-data/RI-action-dashboard
29 OECD.Stat. 2019. Business enterprise R&D expenditure by industry and by type of cost. [16 October 2019]. Available from: https://stats.oecd.org/Index.aspx?DataSetCode=BERD_COST
30 Internal analysis by the European
Commission’s Joint Research Centre
31 European Commission: SETIS. 2019. The future of road transport. [16 October 2019]. Available from: https://setis.ec.europa.eu/publications/relevant-reports/future-of-road-transport

20
Mission Innovation Beyond 2020: Challenges & Opportunities
32 JRC(p) patent-based estimates. For more details on the caveats such as time-lag, propensity to patent, patent trends, see https://www.iea.org/wei2019/rdd/.
33 China Power. 2019. Are patents indicative of Chinese innovation?. [16 October 2019]. Available from: https://chinapower.csis.org/patents/
34 European Commission. 2018. Building the investment community for innovative energy technology projects. [16 October 2019]. Available from: https://ec.europa.eu/energy/en/studies/building-investment-community-innovative-energy-technology-projects
35 The projects included in the study, mainly consist of TRL 7, 8 and 9 – i.e. mature enough to attract private financing.
36 Mazzucato, M & Semieniuk, G. 2018. Financing renewable energy: Who is financing what and why it matters. Technological Forecasting and Social Change. 127(1), 8-22. [16 October 2019]. Available from: https://www.sciencedirect.com/science/article/pii/S0040162517306820
37 IEA. 2018. Commentary: IEA steps up its work on energy innovation as money flows into new energy tech companies. [16 October 2019]. Available from: https://www.iea.org/newsroom/news/2018/september/commentary-iea-steps-up-its-work-on-energy-innovation-as-money-flows-into-new-en.html
38 Climate-KIC. 2017. Sustaining Investment in Climate Innovation. [16 October 2019]. Available from: https://www.climate-kic.org/insights/sustaining-investment-in-climate-innovation/
39 World Economic Forum. 2016. Why aren't we investing enough in low-carbon technologies?. [16 October 2019]. Available from: https://www.weforum.org/agenda/2016/10/how-to-reverse-the-dangerous-decline-in-low-carbon-innovation/
40 Bruegel. 2009. Cold start for the green innovation machine. [16 October 2019]. Available from: http://bruegel.org/wp-content/uploads/imported/publications/pc_climateparvcs_231109.pdf
41 Publications Office of the European Union. 2018. SET Plan delivering results. [16 October 2019]. Available from: https://op.europa.eu/en/publication-detail/-/publication/a3b22c5b-ed41-11e8-b690-01aa75ed71a1/
42 Markard, J. 2018. The next phase of the energy transition and its implications for research and policy. Nature Energy. 3(1), 628-633. [16 October 2019]. Available from: https://www.nature.com/articles/s41560-018-0171-7
43 IRENA. 2017. Perspectives for the energy transition: Investment needs for a low-carbon energy system. [16 October 2019]. Available from:
https://www.irena.org/publications/2017/Mar/Perspectives-for-the-energy-transition-Investment-needs-for-a-low-carbon-energy-system
44 IRENA. 2018. Global Energy Transition: A Roadmap to 2050. [16 October 2019]. Available from: https://www.irena.org/publications/2018/Apr/Global-Energy-Transition-A-Roadmap-to-2050
45 Global Commission on the Economy and Climate. 2014. Better Growth, Better Climate. [16 October 2019]. Available from: https://newclimateeconomy.report/2016/misc/downloads/
46 World Economic Forum. 2018. Accelerating Sustainable Energy Innovation. [16 October 2019]. Available from: https://www.weforum.org/whitepapers/accelerating-sustainable-energy-innovation
47 Let's Fund. 2019. Let's Fund: Clean Energy Innovation Policy. [16 October 2019]. Available from: https://lets-fund.org/clean-energy/
48 King et al. 2015. A Global Apollo Programme to Combat Climate Change. [27 October 2019]. Available from: https://cep.lse.ac.uk/pubs/download/special/Global_Apollo_Programme_Report.pdf
49 Sterlacchini, A. 2012. Energy R&D in private and state-owned utilities: An analysis of the major world electric companies. Energy Policy. 41(1), 494-506. [16 October 2019]. Available from: https://www.sciencedirect.com/science/article/pii/S0301421511008871
50 Hoppmann, J, et al. 2013. The two faces of market support - How deployment policies affect technological exploration and exploitation in the solar photovoltaic industry. Research Policy. 42(4), 989-1003. [16 October 2019]. Available from: https://www.sciencedirect.com/science/article/abs/pii/S0048733313000073
51 IPCC. 2018. Global Warming of 1.5ºC: Summary for Policymakers. [16 October 2019]. Available from: https://www.ipcc.ch/sr15/chapter/spm/
52 IEA. 2017. World Energy Outlook 2017. [16 October 2019]. Available from: https://www.iea.org/weo2017/
53 Carbon Trust. 2015. United Innovations: Cost-competitive clean energy through global collaboration. [16 October 2019]. Available from: https://www.carbontrust.com/resources/reports/technology/united-innovations-cost-competitive-clean-energy/
54 IEA. 2018. The Future of Cooling. [16 October 2019]. Available from: https://www.iea.org/futureofcooling/
55 IRENA. 2019. Costs. [16 October 2019]. Available from: https://www.irena.org/costs
56 Energy Transitions Commission. 2019. Better Energy, Greater Prosperity. [16 October 2019]. Available from: http://www.energy-
transitions.org/better-energy-greater-prosperity
57 IRENA. 2019. Solutions to integrate high shares of variable renewable energy. [16 October 2019]. Available from: https://www.irena.org/publications/2019/Jun/Solutions-to-integrate-high-shares-of-variable-renewable-energy
58 Energy Transitions Commission. 2018. Mission Possible: Reaching net-zero carbon emissions from harder-to-abate sectors by mid-century. [16 October 2019]. Available from: http://www.energy-transitions.org/mission-possible
59 ECIU. 2019. Net zero: why?. [16 October 2019]. Available from: https://eciu.net/briefings/net-zero/net-zero-why
60 IEA. 2019. Tracking Clean Energy Progress. [16 October 2019]. Available from: https://www.iea.org/tcep/
61 Bloomberg NEF. 2019. A Behind the Scenes Take on Lithium-ion Battery Prices. [16 October 2019]. Available from: https://about.bnef.com/blog/behind-scenes-take-lithium-ion-battery-prices/
62 Mission Innovation. 2019. IC7: Affordable Heating and Cooling of Buildings. [16 October 2019]. Available from: http://www.mission-innovation.net/our-work/innovation-challenges/affordable-heating-and-cooling-of-buildings/
63 IEA. 2019a, Innovation gaps: https://www.iea.org/topics/innovation/innovationgaps/
64 Kesidou, S & Sorrell, S. 2018. Low-carbon innovation in non-domestic buildings: The importance of supply chain integration. Energy Research & Social Science, 45, 195-213. Available from: https://www.sciencedirect.com/science/article/pii/S221462961830759X
65 Energy Data Taskforce. 2019. A Strategy for a
Modern Digitalised Energy System. [27 October 2019]. Available from: https://es.catapult.org.uk/news/energy-data-taskforce-report/
66 IRENA. 2019. Innovation landscape for a renewable-powered future. [28 October 2019]. Available from: https://www.irena.org/publications/2019/Feb/Innovation-landscape-for-a-renewable-powered-future
67 https://www.worldbank.org/en/news/press-release/2019/05/28/new-international-partnership-established-to-increase-the-use-of-energy-storage-in-developing-countries
68 ITIF. 2019. The Global Energy Innovation Index. [16 October 2019]. Available from: https://itif.org/publications/2019/08/26/global-energy-innovation-index-national-contributions-global-clean-energy

21
Mission Innovation Beyond 2020: Challenges & Opportunities
69 Wilson, C et al. 2012. Marginalization of end-use technologies in energy innovation for climate protection. Nature Climate Change, 2, 780–788 [30 October 2019]. Available from: https://www.nature.com/articles/nclimate1576
70 Material Economics. 2018. The Circular Economy - a Powerful Force for Climate Mitigation. [16 October 2019]. Available from: https://materialeconomics.com/publications/the-circular-economy-a-powerful-force-for-climate-mitigation-1
71 Wilson, C et al. 2012. Marginalization of end-use technologies in energy innovation for climate protection. Nature Climate Change, 2, 780–788 [30 October 2019]. Available from: https://www.nature.com/articles/nclimate1576
72 Global Cooling Prize. 2019. Homepage. [28 October 2019]. Available from: https://globalcoolingprize.org/
73 METI. 2015. Toprunner Programme: Developing the World’s Best energy Efficiency Improvements and More. [27 October 2019]. Available from:
https://www.enecho.meti.go.jp/category/saving_and_new/saving/data/toprunner2015e.pdf
74 Innovation for Cool Earth Forum. 2018. ICEF 2018 Roadmap: Direct air Capture of Carbon Dioxide. [27 October 2019] Available from: https://www.icef-forum.org/pdf2018/roadmap/ICEF2018_DAC_Roadmap_20181210.pdf
75 Nature. 2018. Why current negative-emissions strategies remain 'magical thinking'. [28 October 2019]. Available from: https://www.nature.com/articles/d41586-018-02184-x
76 The National Academies of Science, Engineering Medicine. 2019. Negative Emissions Technologies and Reliable Sequestration: A Research Agenda [27 October 2019] Available from: https://www.nap.edu/catalog/25259/negative-emissions-technologies-and-reliable-sequestration-a-research-agenda
77 Energy Futures Initiative. 2019. Clearing the Air: A Federal RD&D Initiative and Management Plan for Carbon Dioxide Removal Technologies [27 October 2019]. Available from: https://energyfuturesinitiative.org/
78 Brosch et al. 2016. Editorial: Behavioral Insights for a Sustainable Energy Transition. Front. Energy Res. [27 October 2019]. Available from: https://doi.org/10.3389/fenrg.2016.00015
79 UK Power Networks. 2018. Black Cab Green: London's Electric Black Cab and Private Hire Future. [28 October 2019]. Available from: https://innovation.ukpowernetworks.co.uk/projects/black-cab-green/
80 IPCC. 2014. AR5 Synthesis Report: Climate Change 2014. [28 October 2019]. Available from: https://www.ipcc.ch/report/ar5/syr/
81 Breakthrough Energy. 2018. The Landscape of Innovation. [28 October 2019]. Available from: http://www.b-t.energy/landscape/
82 Mission Innovation. 2019. Collaborative Models for International Co-operation in Clean-Energy Research and Innovation. [16 October 2019]. Available from: http://mission-innovation.net/resources/publications/
83 Mission Innovation. 2019. The Story So Far: Impact Review. [26 October 2019]. Available from: http://mission-innovation.net/wp-content/uploads/2019/05/MI-Impact-Review-May-2019.pdf
84 IRENA. 2018. Innovation Priorities to Transform the Energy System: An overview for policy makers. [16 October 2019]. Available from: https://www.irena.org/publications/2018/May/Innovation-priorities-to-transform-the-energy-system.
85 IEA. 2019. Energy Technology Innovation Partnerships. [16 October 2019]. Available from: https://www.iea.org/publications/reports/energytechnologyinnovationpartnerships/