mississippi’s business - mississippi public universities · index shows the u.s. manufacturing...
TRANSCRIPT

Volume 70 - Number 9October 2012
ECONOMY AT A GLANCETh e Mississippi Index of Coincident and Leading Indicators both rose for the month of August, reversing a four month declining trend. Th is reversal off ers hope that the third quarter will have been an improvement over the sec-ond. But even if this is the case, growth remains modest. Employment is perhaps the weakest link in the economy with employment falling for four consecutive months and reaching the lowest level since 1996. Mississippi has not experienced a gain in employment on an annual basis since 2007. Th e increase in the leading index was strong and broadly supported by seven of the eight components. Th is suggests that while the State may have slipped into a recession in the early summer months, it was short-lived and relatively mild. Next month’s data should confi rm if this is, in fact, the case.
Th e National economy continues to grow at a snail’s pace. Employment gains are weak relative to the fi rst quarter, but slightly better than in the second. Business investment is weakening as are exports. Th ese two sectors have helped fuel the recovery, and their current weakness is dampening overall growth. Th e two brightest spots in the economy remain housing and light vehicle sales. By most any measure the housing sector is improving, although from a low base. Vehicle sales have remained strong in 2012 relative to the previous few years. Beside the global headwinds of Europe and China, the economy faces the uncertainty surrounding the fi scal cliff . Th is series of tax increases and budget cuts will not likely materialize, but a long-term solution is probably months away. As a result growth will be dampened in early 2013, regardless of the November election results.
Mississippi’s BusinessMonitoring Th e State’s Economy
A Publication of the University Research Center, Mississippi Institutions of Higher Learning
State Economist Darrin Webb • 3825 Ridgewood Road, Jackson, MS 39211 • [email protected] • www.mississippi.edu/urc/economics.html
80.0
85.0
90.0
95.0
100.0
8/11
9/11
10/1
1
11/1
1
12/1
1
1/12
2/12
3/12
4/12
5/12
6/12
7/12
8/12
Index of Leading Indicators
MS LI US LI
Th e Mississippi Coincident Index is constructed by the Federal Reserve Bank of Philadelphia and re-indexed to 2004. Th e Index is based on changes in nonfarm em-ployment, the unemployment rate, average manufacturing workweek length and wage and salary disbursements. Th e Mississippi Leading Index is constructed by the Mississippi University Research Center. Th e U.S. Indices are both from the Conference Board. All series are indexed to a base year of 2004.
IN THIS ISSUE:Economy at a Glance ..................................................................................................................................................................................... 1Index of Leading Indicators for August 2012 ............................................................................................................................................ 2Index of Coincident Indicators for August 2012 ....................................................................................................................................... 4National Trends .............................................................................................................................................................................................. 5Mississippi Income Growth .......................................................................................................................................................................... 7Mississippi Employment Trends ................................................................................................................................................................. 9
99.0
100.0
101.0
102.0
103.0
104.0
105.0
8/11
9/11
10/1
1
11/1
1
12/1
1
1/12
2/12
3/12
4/12
5/12
6/12
7/12
8/12
Index of Coincident Indicators
MS LI US LI

The Mississippi Index of Leading Economic Indicators rose sharply in August to 98.5. Th e
unexpected gain follows four months of decline. All but one component showed improvement in August. Relative to the level six-months prior, the index was up an annualized 2.0 percent. Th e revised six-month growth rate for July was a -1.1 percent. Th e reversal is surprising. One month does not make a trend but the evidence suggests that the third quarter will prove to have been improved over the second. Th e components of the Leading Index will be discussed in order of their contributions to the July decline.
Aft er a steep decline in July, infl ation adjusted Missis-sippi income tax withholdings1 rose 3.5 percent in Au-gust relative to July. Th e series had fallen in three of the previous four months and the August gain recaptured all of the lost ground. Large swings in this series can occur for a variety of reasons which have nothing to do with economic conditions. We use a three month aver-age to mitigate this volatility. It will be interest to see if the strong growth observed in September is sustained.
Th e Institute for Supply Management Index of U.S. Manufacturing Activity rose to 51.5 in September. Th e index shows the U.S. manufacturing industry is once again expanding. Th e industry has been contracted for the previous three month, according to the index. An index above 50 indicates expansion. While the index is above 50, it remains weak. Th e ISM Nonmanufactur-ing Index rose to 55.1, which is the strongest showing since March 2012 for this series.
Th e U.S. Retail Sales rose 0.9 percent in August. Th is marked the second consecutive gain aft er three months of decline. Much of the gain was due to gas sales that were driven by rising prices. Excluding gasoline sta-tions, retail sales were a much more modest 0.3 per-cent. In a separate but related report, light vehicle sales continue at a strong pace. In September, sales were an annualized 14.9 million units sold, the strongest month of sales since March 2008.
Th e U.S. Index of Consumer Expectations1 rose 2.9 percent in August. Improved conditions in housing and better job numbers have helped expectations.
The Mississippi Manufacturing Employment In-tensity Index, rose 1.0 percent in August, reversing the declining trend of the previous two months Th e increase recaptured much, but not all of the ground lost in the previous two months. Th e index is comprised of employment and hours worked. Th e August gain was characterized by a modest dip in employment but a gain in average workweek length.
Mississippi’s initial unemployment claims fell 5.2 per-cent in August relative to July. Th e series is 13 percent below the year ago level. Initial claims have generally moved downward since the recovery began, but moved upward during the summer months.
Th e value of Mississippi residential building permits1 rose 2.1 percent in August. Th is was the seventh con-secutive gain for this series. Across the U.S. the housing sector is showing improvement. Positive trends are evi-dent in every measure: permits, starts, price and builder confi dence all show improvement. While we remain at a very low level historically, the bottom appears to be in the rearview mirror. Pent-up demand is expected to fuel growth in the industry over the next few years.
Th e Mississippi Diesel Fuel Consumption Index1 was the only component contributing negatively to the August index. Although the decline for August was a modest 0.9 percent, it shows continued deterioration in this series. Th e index has declined in six of the last seven months and is at its lowest level since October 2009.
LEADING AND COINCIDENT INDICATORS, AUGUST 2012
0.0%1.0%2.0%3.0%4.0%5.0%6.0%7.0%8.0%
88.0
90.0
92.0
94.0
96.0
98.0
100.0
Line
Gra
ph: %
Cha
nge
Ove
r Ye
ar A
go
Bar
Gra
ph:
Inde
x
Mississippi Index of Leading Indicators
1. Three Month Moving Average
2 Mississippi’s Business October 2012

3 Mississippi’s Business October 2012
-20%
-15%
-10%
-5%
0%
5%
10,000
10,500
11,000
11,500
12,000
12,500
13,000
13,500
Line
Gra
ph: %
Cha
nge
Ove
r Yea
r Ago
Bar G
raph
: #
of C
laim
s
MS Initial Unemployment Claims
-4%
-2%
0%
2%
4%
6%
8%
96
98
100
102
104
106
108
Line
Gra
ph: %
Cha
nge
Ove
r Yea
r Ago
Bar G
raph
: M
illio
ns o
f 200
4 $
MS Income Tax WithholdingsThree Month Moving Average
-30%-20%-10%0%10%20%30%40%50%
30
35
40
45
50
55
60
Line
Gra
ph: %
Cha
nge
Ove
r Yea
r Ago
Bar G
raph
: M
illio
ns o
f 198
2-19
84 $
MS Value Of Residential Building PermitsThree Month Moving Average
-10
-8
-6
-4
-2
0
47484950515253545556
Line
Gra
ph: C
hang
e O
ver Y
ear A
go
Bar G
raph
: In
dex
ISM Index of U.S. Manufacturing Activity
-2%-1%0%1%2%3%4%5%6%
73.0
74.0
75.0
76.0
77.0
78.0
79.0
Line
Gra
ph: C
hang
e O
ver Y
ear A
go
Bar G
raph
: In
dex
MS MFG Employment Intensity Index
-30%
-20%
-10%
0%
10%
20%
30%
40%
0.010.020.030.040.050.060.070.080.0
Line
Gra
ph: C
hang
e O
ver Y
ear A
go
Bar G
raph
: In
dex
199
6=10
0
U.S. Consumer Expectations IndexThree Month Moving Average
-10%
-5%
0%
5%
10%
80.0
85.0
90.0
95.0
100.0
105.0
110.0
115.0
Line
Gra
ph:%
Cha
nge
Ove
r Yea
r Ago
Bar G
raph
: In
dex
MS Diesel Fuel Consumption IndexThree Month Moving Average
0%1%2%3%4%5%6%7%8%9%
375,000
380,000
385,000
390,000
395,000
400,000
405,000
410,000
Line
Gra
ph: %
Cha
nge
Ove
r Yea
r Ago
Bar G
raph
: M
illio
ns o
f $
U.S. Retail Sales
LEADING ECONOMIC INDICATORS
Source: Mississippi Department of Employment Security
Source: Bureau of the Census
Source: URC using data from Bureau of Labor Statistics
Source: URC using Data from Mississippi Department of Revenue Source: Bureau of the Census
Source: University Of Michigan
Source: Institute For Supply Management
Source: Mississippi Department of Revenue

4 Mississippi’s Business October 2012
The Mississippi Index of Coincident Indicators was 101.9 in August, up a slight 0.1 percent from
the July index. Th e gain followed a four month decline and supports the idea that the economy improved in the third quarter relative to the second. Th is conclusion is also supported by the August gains in the Mississippi Leading Index. Previously we have said the State slipped into recession. If the index continues to expand, that re-cession will have proven short-lived and relatively mild.
As a reminder, we are using as the threshold for recession a three-month decline in the index with a cumulative decline of 0.5 percent. A decline of this magnitude is rare in the State’s history and is suggestive of a serious decline in the State’s economy. Th e graph to the right shows the historical index with the State recessions identifi ed.
Th e fi gure below shows a comparison of the July index to the pre-recession peak for the 12 Southeastern States and the Nation. States that reach 100 percent of peak have fully recovered from the “Great Recession”. Missis-sippi was at 95.1 percent of the peak. Arkansas, Georgia Kentucky, Louisiana, Oklahoma, Tennessee and Texas are ahead of Mississippi. As noted in previous issues, Mississippi’s relative fl at performance in 2011 and the declining pattern observed in 2012 has enabled other states to move ahead.
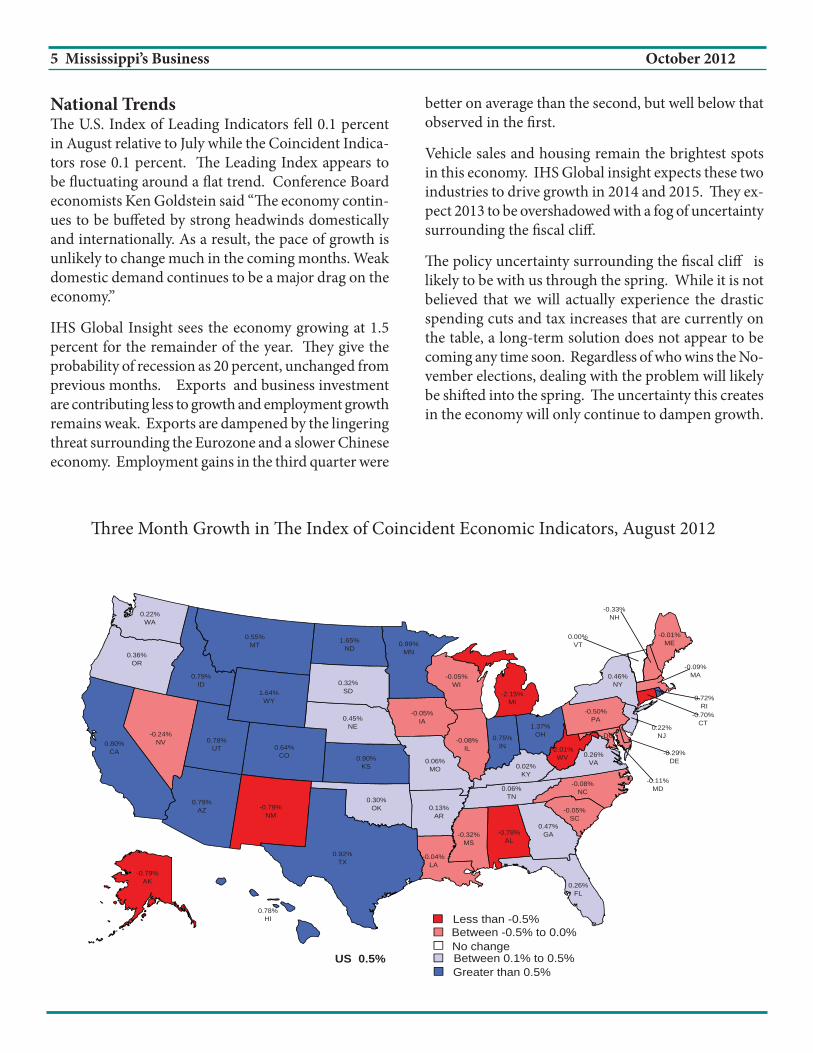
Th e Map on page 5 shows the August index for each
0.0%
0.2%
0.4%
0.6%
0.8%
1.0%
101.0101.2101.4101.6101.8102.0102.2102.4102.6
Line
Gra
ph: %
Cha
nge
Ove
r Ye
ar A
go
Bar
Gra
ph:
Inde
x
Mississippi Index of Coincident Indicators
90.3%
95.3%
88.6%
95.2%96.8%
99.8%
95.1%94.1%
100.0%
92.4%
98.5%
103.7%
101.2%
80%
85%
90%
95%
100%
105%
AL AR FL GA KY LA MS NC OK SC TN TX US
Coincident Index: August 2012 Percentage of Pre-recession Peak
40.0
50.0
60.0
70.0
80.0
90.0
100.0
110.0
120.0
Jan-
80Ja
n-81
Jan-
82Ja
n-83
Jan-
84Ja
n-85
Jan-
86Ja
n-87
Jan-
88Ja
n-89
Jan-
90Ja
n-91
Jan-
92Ja
n-93
Jan-
94Ja
n-95
Jan-
96Ja
n-97
Jan-
98Ja
n-99
Jan-
00Ja
n-01
Jan-
02Ja
n-03
Jan-
04Ja
n-05
Jan-
06Ja
n-07
Jan-
08Ja
n-09
Jan-
10Ja
n-11
Jan-
12
Mississippi Coincident Index
state compared to the level three months prior. Missis-sippi fell 0.3 percent while the Nation as a whole gained at a 0.5 percent rate.
5 Mississippi’s Business October 2012
DC
-2.15%MI
-2.01%WV
-0.79%AK
-0.79%NM
-0.78%AL
-0.70%CT
-0.50%PA
-0.33%NH
-0.32%MS
-0.29%DE
-0.24%NV
-0.11%MD
-0.09%MA
-0.08%NC
-0.08%IL
-0.05%SC
-0.05%WI
-0.05%IA
-0.04%LA
-0.01%ME
0.00%VT
0.02%KY
0.06%TN
0.06%MO
0.13%AR
0.22%WA
0.22%NJ
0.26%FL
0.26%VA
0.30%OK
0.32%SD
0.36%OR
0.45%NE
0.46%NY
0.47%GA
0.55%MT
0.64%CO
0.72%RI
0.75%IN
0.78%UT
0.78%HI
0.79%ID
0.79%AZ
0.80%CA
0.90%KS
0.92%TX
0.99%MN
1.37%OH
1.64%WY
1.65%ND
Less than -0.5%Between -0.5% to 0.0%No changeBetween 0.1% to 0.5%Greater than 0.5%
US 0.5%
Th ree Month Growth in Th e Index of Coincident Economic Indicators, August 2012
National Trends Th e U.S. Index of Leading Indicators fell 0.1 percent in August relative to July while the Coincident Indica-tors rose 0.1 percent. Th e Leading Index appears to be fl uctuating around a fl at trend. Conference Board economists Ken Goldstein said “Th e economy contin-ues to be buff eted by strong headwinds domestically and internationally. As a result, the pace of growth is unlikely to change much in the coming months. Weak domestic demand continues to be a major drag on the economy.”
IHS Global Insight sees the economy growing at 1.5 percent for the remainder of the year. Th ey give the probability of recession as 20 percent, unchanged from previous months. Exports and business investment are contributing less to growth and employment growth remains weak. Exports are dampened by the lingering threat surrounding the Eurozone and a slower Chinese economy. Employment gains in the third quarter were
better on average than the second, but well below that observed in the fi rst.
Vehicle sales and housing remain the brightest spots in this economy. IHS Global insight expects these two industries to drive growth in 2014 and 2015. Th ey ex-pect 2013 to be overshadowed with a fog of uncertainty surrounding the fi scal cliff .
Th e policy uncertainty surrounding the fi scal cliff is likely to be with us through the spring. While it is not believed that we will actually experience the drastic spending cuts and tax increases that are currently on the table, a long-term solution does not appear to be coming any time soon. Regardless of who wins the No-vember elections, dealing with the problem will likely be shift ed into the spring. Th e uncertainty this creates in the economy will only continue to dampen growth.

6 Mississippi’s Business October 2012
-30%
-25%
-20%
-15%
-10%
-5%
0%
5%
80
90
100
110
120
130
140
150
Line
Gra
ph: C
hang
e O
ver Y
ear A
go
Bar G
raph
: Th
ousa
nds
MS Continued Unemployment Claims
-20%
-15%
-10%
-5%
0%
5%
10%
0.0
2.0
4.0
6.0
8.0
10.0
12.0
Line
Gra
ph: C
hang
e O
ver Y
ear A
go
Bar G
raph
: Ra
te
MS Unemployment Rate
0%
2%
4%
6%
8%
10%
12%
490.0500.0510.0520.0530.0540.0550.0560.0570.0
Line
Gra
ph: C
hang
e O
ver Y
ear A
go
Bar G
raph
: 20
04 D
olla
rs
Real Average MFG Weekly Earnings in MS
-20%
-10%
0%
10%
20%
30%
40%
0.0
50.0
100.0
150.0
200.0
250.0
Line
Gra
ph: C
hang
e O
ver Y
ear A
go
Bar G
raph
: M
illio
ns o
f Do
llars
MS Gaming Revenue
Coast River Growth of Total
3.8% 3.9%3.5% 3.4%
3.0% 2.9% 2.9%2.7%
2.3%
1.7% 1.7%1.4%
1.7%
0.0%0.5%1.0%1.5%2.0%2.5%3.0%3.5%4.0%4.5%
Inflation: Price Growth over Prior Year
-10%-8%-6%-4%-2%0%2%4%6%
49.050.051.052.053.054.055.056.057.058.0
Line
Gra
ph: C
hang
e O
ver Y
ear A
go
Bar G
raph
: Ra
te
ISM Index of Nonmanufacturing Activity
-2%-1%0%1%2%3%4%5%6%
84.0
86.0
88.0
90.0
92.0
94.0
96.0
Line
Gra
ph: C
hang
e O
ver Y
ear A
go
Bar G
raph
: In
dex
U.S. Business Optimism Index
12.4
13.113.3
13.5 13.613.9
14.414.1 14.1 13.9
14.314.0
14.514.9
0%
5%
10%
15%
20%
25%
11.011.512.012.513.013.514.014.515.015.5
Line
Gra
ph: C
hang
e O
ver Y
ear A
go
Bar G
raph
: M
illio
ns o
f Uni
ts
U.S. Light Vehicle Sales
MISCELLANEOUS ECONOMIC INDICATORS
Source: Mississippi Department of Employment Security; Seasonally Adjusted
Source: U.S. Bureau of Labor Statistics; Nonseasonally Adjusted
Source: U.S. Bureau of Labor Statistics
Source: National Federation of Independent Businesses Source: Bureau of Economic Analysis; Seasonally Adjusted Annual Rate
Source: Institute For Supply Management
Source: MS Department of Revenue; Nonseasonally Adjusted
Source: U.S. Bureau of Labor Statistics; Seasonally Adjusted

MISSISSIPPI INCOME GROWTH
7 Mississippi’s Business October 2012
Recently released data from the Bureau of Economic Analysis
(BEA)shows Mississippi had the 6th largest gain in total personal income for the second quarter relative to the fi rst (see fi gure to the right). Th e State’s real income rose an annualized 1.0 percent for the quarter, compared to the U.S. average of 0.8 percent.
Th e latest release also included an astounding upward revision to the first quarter growth. Previously, the BEA showed Mississippi’s in-come fell 1.1 percent in the fi rst quarter. The revised data shows the State with 0.4 percent gain for the quarter.
The second quarter growth is surprisingly strong given our own view that the State probably fell into recession during that period. Gains in farm proprietor’s income ac-counted for over 20.0 percent of the total increase. Without this source of income, Mississippi would be ranked 29th instead of 6th in in-come growth. It is remarkable that a source which represents only 1.0 percent of the total income, could account for over 20.0 percent of the increase. Farm income was the fastest growing source of income for the quarter.
Wage and salary disbursements, which is that portion of income most closely associated with pay-checks, rose 2.0 percent in Missis-sippi. Th is compares to 2.5 percent Nationally and 2.6 percent among the Southeast States. Mississippi ranked 36th among the fi ft y states.
1.88%1.77%
1.15%1.11%
1.04%1.01%1.00%0.99%
0.97%0.96%
0.93%0.92%0.91%0.90%0.90%
0.88%0.88%0.87%0.87%0.86%0.85%0.84%
0.82%0.81%0.81%0.80%0.79%0.78%0.77%0.77%0.76%0.75%0.75%
0.73%0.71%0.71%0.69%0.69%0.69%0.69%0.69%0.67%
0.65%0.63%0.62%
0.57%0.56%
0.53%0.50%
0.43%0.22%
0.00% 0.50% 1.00% 1.50% 2.00%
North DakotaSouth Dakota
ArizonaHawaiiFlorida
MississippiOklahoma
ArkansasMassachusetts
New YorkIndiana
CaliforniaUtah
NevadaDistrict of Columbia
MissouriLouisiana
South CarolinaMichigan
VirginiaNew Hampshire
WashingtonTennessee
OregonIowa
North CarolinaRhode Island
ColoradoOhio
KansasVermontNebraskaKentucky
MinnesotaConnecticut
MarylandAlaskaMaine
WisconsinPennsylvania
TexasWest Virginia
GeorgiaAlabama
IllinoisNew Jersey
DelawareMontana
IdahoWyoming
New Mexico
Real Total Personal Income Annualized Growth in 2nd Quarter Over the 1st
U.S. AVERAGE 0.82%
Furthermore, Mississippi’s second quarter growth was noticeably slower than the 3.9 percent ob-served in the fi rst quarter.
For the fi rst half of 2012, incomes grew 0.3 percent above the year ago level. Incomes grew 0.9 per-cent in calender year 2011, and
1.6 percent in 2010. Mississippi income growth in 2012, was less than half the 0.7 percent rate ob-served Nationally. Th e southeast region grew 0.6 percent. Income growth for 2012 is historically low Nationally and regionally.

8 Mississippi’s Business October 2012
SELECTED ECONOMIC INDICATORS
August July AugustIndicator 2012 2012 2011 Last Month Last Year
US Index of Coincident Indicators 104.7 104.6 102.2 0.1% 2.4%
MS Index of Coincident Indicators 101.9 101.8 101.4 0.1% 0.5%
US Index of Leading Indicators 95.7 95.8 93.7 0.1% 2.1%
MS Index of Leading Indicators 98.5 96.7 92.1 1.9% 6.9%
MS Initial Unemployment Claims 11,496 12,125 13,217 5.2% 13.0%
MS Value Of Res. Building Permits 56.6 55.4 41.4 2.1% 36.9%
MS Income TaxWithholdings 106.26 102.71 100.97 3.5% 5.2%
MSMFG Emp. Intensity Index 77.8 77.1 75.0 1.0% 3.8%
MS Diesel Fuel Consumption Index 92.3 93.1 100.6 0.9% 8.2%
US Index of Consumer Expectations 68.1 66.2 50.9 2.9% 33.6%
US ISM Index of MFG Activity 51.5 49.6 50.6 3.8% 1.8%
US Retail Sales 406,748 403,176 388,595 0.9% 4.7%
US Consumer Price Index 122.0 121.3 119.9 0.6% 1.7%
MS Unemployment Rate 9.1% 9.2% 10.9% 0.1% 1.8%
MS Continued Unemp. Claims 105,947 133,934 124,879 20.9% 15.2%
US Mortgage Rates 3.6% 3.5% 4.3% 0.1% 0.6%
MS Avg. Hourly Wage for MFG 53.70 52.60 53.30 2.1% 0.8%
MS Avg. Wkly Earnings for MFG 565.1 548.6 525.5 3.0% 7.5%
Gaming Revenue 178.4 204.5 184.7 12.8% 3.4%Coast Counties 86.3 105.4 90.9 18.1% 5.0%River Counties 92.1 99.1 93.8 7.0% 1.9%
Business Optimism Index 92.9 91.2 88.1 1.9% 5.4%
Change from
ComponentsoftheMSIndexofLeadingIndicators
Econom
icIndices
MiscellaneousIndicators

9 Mississippi’s Business October 2012
MISSISSIPPI EMPLOYMENT BY SECTOR
Source: U.S. Bureau of Labor Statitiscs
RelativeShare of August July AugustTotal* 2012 2012 2011 Level % Level %
Total Nonfarm 100.0% 1,081,500 1,083,300 1,085,700 (1,800) 0.2% (4,200) 0.4%Mining and Logging 0.9% 9,300 9,200 9,100 100 1.1% 200 2.2%Construction 4.3% 44,700 43,500 48,800 1,200 2.8% (4,100) 8.4%Manufacturing 12.4% 136,400 136,700 132,500 (300) 0.2% 3,900 2.9%Trade, Transportation & Utlities 19.6% 212,700 213,600 213,000 (900) 0.4% (300) 0.1%Retail Trade 12.1% 129,700 130,800 131,900 (1,100) 0.8% (2,200) 1.7%
Information 1.1% 11,721 11,848 11,818 (127) 1.1% (97) 0.8%Financial Activities 4.1% 44,113 44,038 45,014 75 0.2% (901) 2.0%Services 35.0% 380,000 381,700 379,800 (1,700) 0.4% 200 0.1%Professional and Business Services 8.5% 90,700 92,300 92,500 (1,600) 1.7% (1,800) 1.9%Education and Health Services 12.6% 136,900 136,500 135,700 400 0.3% 1,200 0.9%Leisure and Hospitality 10.7% 118,500 118,100 117,100 400 0.3% 1,400 1.2%Other Services 3.2% 33,900 34,800 34,500 (900) 2.6% (600) 1.7%
Government 22.6% 242,600 242,800 245,700 (200) 0.1% (3,100) 1.3%
Change fromPrior Month
Change fromPrior Year
Sector
Mississippi Employment TrendsMississippi continued to lose em-ployment in August. Th e August decline of 1,800 jobs marks the fourth consecutive monthly de-cline. Employment has been below the year ago for six consecutive months.
Through August, 2012 employ-ment was 0.2 percent below the same period in 2011. Mississippi has not gained in employment, on an annual basis, since 2007.
For August, the largest declines were in professional and business services and retail trade. Gains were observed in education and health services as well as leisure and hospitality.
Perhaps most notable is the 1,200 jobs gained in construction. Th is sector has experienced tremen-
dous declines in the past few years and remains at an historical low. With a strengthening housing sector and low interest rates, perhaps this sector will see gains in the future.
Th e Figure below shows the historical trend in employment. Th e anemic recovery is obvious. Th e State has essentially bumped along a fl at trend until 2012 when the meager gains observed since the beginning of the recovery have eroded. Th e State’s employment level in August was the lowest since February 1996. Th e data are subject to revisions, but it seems unlikely this overall trend will change substantially with revised data.
800
850
900
950
1,000
1,050
1,100
1,150
1,200
Jan-
90Ja
n-91
Jan-
92Ja
n-93
Jan-
94Ja
n-95
Jan-
96Ja
n-97
Jan-
98Ja
n-99
Jan-
00Ja
n-01
Jan-
02Ja
n-03
Jan-
04Ja
n-05
Jan-
06Ja
n-07
Jan-
08Ja
n-09
Jan-
10Ja
n-11
Jan-
12
Thou
sand
s
MS Nonfarm Employment

10 Mississippi’s Business October 2012
-1.0%
-0.5%
0.0%
0.5%
1.0%
1.5%
1,070
1,075
1,080
1,085
1,090
1,095
1,100
8/1
09
/10
10
/10
11
/10
12
/10
1/1
12
/11
3/1
14
/11
5/1
16
/11
7/1
18
/11
9/1
11
0/1
11
1/1
11
2/1
11
/12
2/1
23
/12
4/1
25
/12
6/1
27
/12
8/1
2
Th
ou
san
ds
Nonfarm Employment
-4.0%
-3.0%
-2.0%
-1.0%
0.0%
1.0%
2.0%
3.0%
4.0%
130
131
132
133
134
135
136
137
138
8/1
09
/10
10
/10
11
/10
12
/10
1/1
12
/11
3/1
14
/11
5/1
16
/11
7/1
18
/11
9/1
11
0/1
11
1/1
11
2/1
11
/12
2/1
23
/12
4/1
25
/12
6/1
27
/12
8/1
2
Th
ou
san
ds
Manufacturing
-2.5%
-2.0%
-1.5%
-1.0%
-0.5%
0.0%
0.5%
1.0%
1.5%
2.0%
43.443.643.844.044.244.444.644.845.045.245.445.6
8/1
09
/10
10
/10
11
/10
12
/10
1/1
12
/11
3/1
14
/11
5/1
16
/11
7/1
18
/11
9/1
11
0/1
11
1/1
11
2/1
11
/12
2/1
23
/12
4/1
25
/12
6/1
27
/12
8/1
2
Th
ou
san
ds
Financial Activities
-3.0%
-2.5%
-2.0%
-1.5%
-1.0%
-0.5%
0.0%
0.5%
1.0%
1.5%
113
114
115
116
117
118
119
120
121
8/1
09
/10
10
/10
11
/10
12
/10
1/1
12
/11
3/1
14
/11
5/1
16
/11
7/1
18
/11
9/1
11
0/1
11
1/1
11
2/1
11
/12
2/1
23
/12
4/1
25
/12
6/1
27
/12
8/1
2
Th
ou
san
ds
Leisure and Hospitality Services
0.0%
2.0%
4.0%
6.0%
8.0%
10.0%
12.0%
6.0
6.5
7.0
7.5
8.0
8.5
9.0
9.5
10.0
8/1
09
/10
10
/10
11
/10
12
/10
1/1
12
/11
3/1
14
/11
5/1
16
/11
7/1
18
/11
9/1
11
0/1
11
1/1
11
2/1
11
/12
2/1
23
/12
4/1
25
/12
6/1
27
/12
8/1
2
Th
ou
san
ds
Natural Resources
-2.0%
-1.5%
-1.0%
-0.5%
0.0%
0.5%
1.0%
1.5%
2.0%
210
211
212
213
214
215
216
8/1
09
/10
10
/10
11
/10
12
/10
1/1
12
/11
3/1
14
/11
5/1
16
/11
7/1
18
/11
9/1
11
0/1
11
1/1
11
2/1
11
/12
2/1
23
/12
4/1
25
/12
6/1
27
/12
8/1
2
Th
ou
san
ds
Trade, Transportation and Utilities
-4.0%
-2.0%
0.0%
2.0%
4.0%
6.0%
8.0%
10.0%
12.0%
88
89
90
91
92
93
94
95
96
8/1
09
/10
10
/10
11
/10
12
/10
1/1
12
/11
3/1
14
/11
5/1
16
/11
7/1
18
/11
9/1
11
0/1
11
1/1
11
2/1
11
/12
2/1
23
/12
4/1
25
/12
6/1
27
/12
8/1
2
Th
ou
san
ds
Professional and Business Services
-4.0%
-3.0%
-2.0%
-1.0%
0.0%
1.0%
2.0%
3.0%
4.0%
33.0
33.5
34.0
34.5
35.0
35.5
8/1
09
/10
10
/10
11
/10
12
/10
1/1
12
/11
3/1
14
/11
5/1
16
/11
7/1
18
/11
9/1
11
0/1
11
1/1
11
2/1
11
/12
2/1
23
/12
4/1
25
/12
6/1
27
/12
8/1
2
Th
ou
san
ds
Other Services
-12.0%
-10.0%
-8.0%
-6.0%
-4.0%
-2.0%
0.0%
2.0%
4.0%
6.0%
30
35
40
45
50
55
8/1
09
/10
10
/10
11
/10
12
/10
1/1
12
/11
3/1
14
/11
5/1
16
/11
7/1
18
/11
9/1
11
0/1
11
1/1
11
2/1
11
/12
2/1
23
/12
4/1
25
/12
6/1
27
/12
8/1
2
Th
ou
san
ds
Construction
-8.0%
-6.0%
-4.0%
-2.0%
0.0%
2.0%
4.0%
10.811.011.211.411.611.812.012.212.412.612.813.0
8/1
09
/10
10
/10
11
/10
12
/10
1/1
12
/11
3/1
14
/11
5/1
16
/11
7/1
18
/11
9/1
11
0/1
11
1/1
11
2/1
11
/12
2/1
23
/12
4/1
25
/12
6/1
27
/12
8/1
2
Th
ou
san
ds
Information
0.0%
0.5%
1.0%
1.5%
2.0%
2.5%
3.0%
3.5%
4.0%
129
130
131
132
133
134
135
136
137
138
139
8/1
09
/10
10
/10
11
/10
12
/10
1/1
12
/11
3/1
14
/11
5/1
16
/11
7/1
18
/11
9/1
11
0/1
11
1/1
11
2/1
11
/12
2/1
23
/12
4/1
25
/12
6/1
27
/12
8/1
2
Th
ou
san
ds
Education and Health Services
-3.5%-3.0%-2.5%-2.0%-1.5%-1.0%-0.5%0.0%0.5%1.0%1.5%
239240241242243244245246247248249
8/1
09
/10
10
/10
11
/10
12
/10
1/1
12
/11
3/1
14
/11
5/1
16
/11
7/1
18
/11
9/1
11
0/1
11
1/1
11
2/1
11
/12
2/1
23
/12
4/1
25
/12
6/1
27
/12
8/1
2
Th
ou
san
ds
Government
MISSISSIPPI EMPLOYMENT TRENDS
Left Axis: Bar Graphs - Employment Levels. Right Axis: Line graphs - Annual Growth. Source: U.S. Bureau of Labor Statistics.