mn mortgage foreclosure prevention association july 10, 2007 prentiss cox associate professor of...
TRANSCRIPT
MN Mortgage Foreclosure Prevention Association
July 10, 2007
Prentiss Cox
Associate Professor of Clinical Law
University of Minnesota Law School

Foreclosure and Subprime Lending1. Foreclosure Rates2. Causes and Concerns
A. Mortgage PracticesB. Subprime LendingC. Alt-A LendingD. Non-Owner-Occupied Lending
3. ConsequencesA. IndividualsB. Communities
1. Geographic Concentration2. Foreclosure and Vacancy
C. Financial Markets

1. Foreclosure Rates
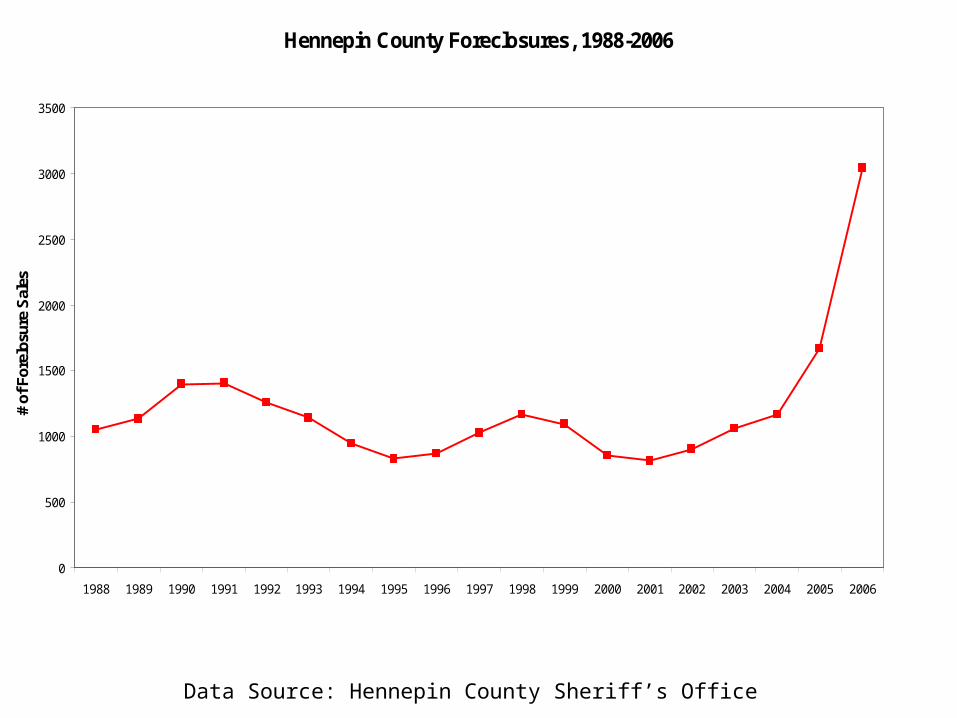
Data Source: Hennepin County Sheriff’s Office
Hennepin County Foreclosures, 1988-2006
0
500
1000
1500
2000
2500
3000
3500
1988 1989 1990 1991 1992 1993 1994 1995 1996 1997 1998 1999 2000 2001 2002 2003 2004 2005 2006
# of
For
elos
ure
Sal
es

Data Source: Hennepin County Sheriff’s Office2007 is estimate based on Jan-Jun data
Number of Hennepin County Sheriff Foreclosure Sales
0
1000
2000
3000
4000
5000
6000
7000
1988 1989 1990 1991 1992 1993 1994 1995 1996 1997 1998 1999 2000 2001 2002 2003 2004 2005 2006 2007e

Metro Area Foreclosure Sales
0
2000
4000
6000
8000
10000
12000
14000
2001 2002 2003 2004 2005 2006 2007(est)
Data Source: St. Paul Pioneer Press

Foreclosure Sales
0
1000
2000
3000
4000
5000
6000
2000 2001 2002 2003 2004 2005 2006 2007(est)
(2007 Est. Based on Jan-May)
Hennepin
Ramsey
Dakota
Scott
Washington
Anoka
Carver
Source: Saint Paul Pioneer Press

Data Source: Special Report of U S Senate Joint Economic Committee; First American Loan Performance
Percent of Subprime Loans Delinquent >60 Days
05
101520
Metropolitan Area
Per
cent
Del
inqu
ent >
60
Day
s
"Feb 2007"
"Feb 2006"
"Feb 2005"

2. Causes and Concerns
A. Mortgage Practices Are Driving ForeclosuresB. Subprime Lending
1. Relation between foreclosure and subprime 2. Growth in subprime lending3. Housing price boom delayed, magnified problem 4. Specific unfair subprime lending practices have
grown and are related to foreclosure5. Acceleration of Most Risky Practices6. Non-Owner-Occupied Subprime Lending7. Myth of Subprime Promoting Home Ownership
C. Alt-A Lending

Hennepin County Foreclosures and Unemployment, 1988-2006
0
500
1000
1500
2000
2500
3000
3500
1988 1989 1990 1991 1992 1993 1994 1995 1996 1997 1998 1999 2000 2001 2002 2003 2004 2005 2006
# o
f F
ore
clo
su
re S
ale
s
0
2
4
6
8
10
12
Un
em
plo
ym
en
t R
ate
Foreclosure Sales
Annual Average Unemployment(Hennepin Co.)
Data Sources: Data from Hennepin County Sheriff’s Office, US Bureau of Labor Statistics and Minnesota Department of Employment and Economic Development.
Chart by Institute on Race and Poverty, U of Minnesota Law School

Hennepin County Foreclosures and U.S. Interest Rates, 1988-2006
0
500
1000
1500
2000
2500
3000
3500
1988 1989 1990 1991 1992 1993 1994 1995 1996 1997 1998 1999 2000 2001 2002 2003 2004 2005 2006
# o
f F
ore
clo
sure
Sal
es
0
2
4
6
8
10
12
14
16
18
20
U.S
. In
tere
st R
ate
s
Foreclosure Sales
Short Term Rates (1yr Treasury)
Long Term Rates (Conventional Mortgages)
Data Sources: Data from Hennepin County Sheriff’s Office and Federal Reserve BoardChart by Institute on Race and Poverty, U of Minnesota Law School
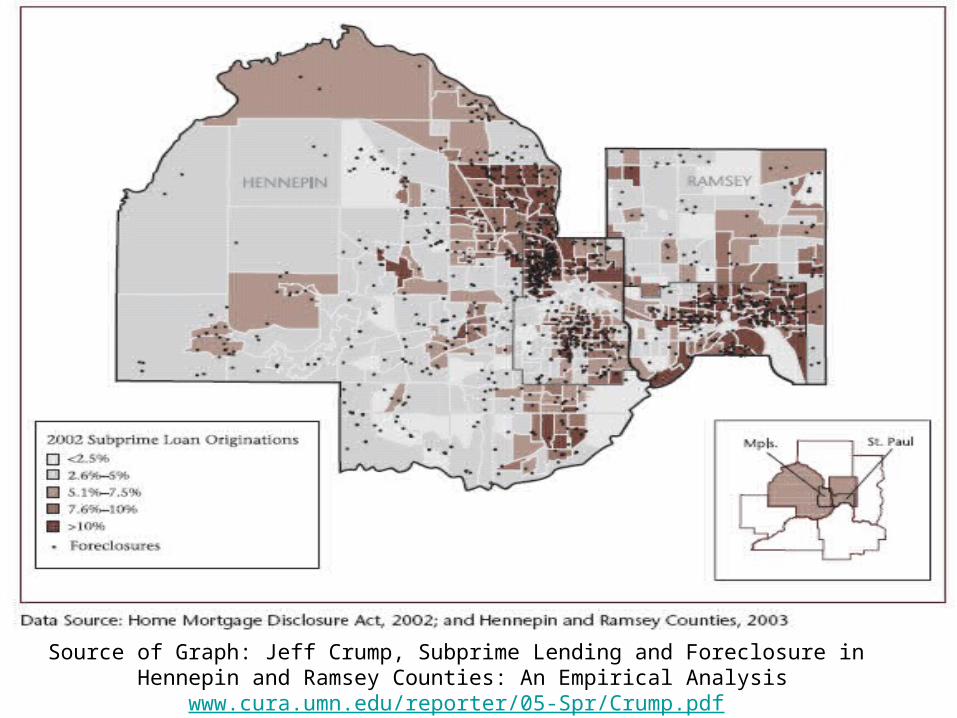
Source of Graph: Jeff Crump, Subprime Lending and Foreclosure in Hennepin and
Ramsey Counties: An Empirical Analysiswww.cura.umn.edu/reporter/05-Spr/Crump.pdf

Source: Center for Responsible Lending
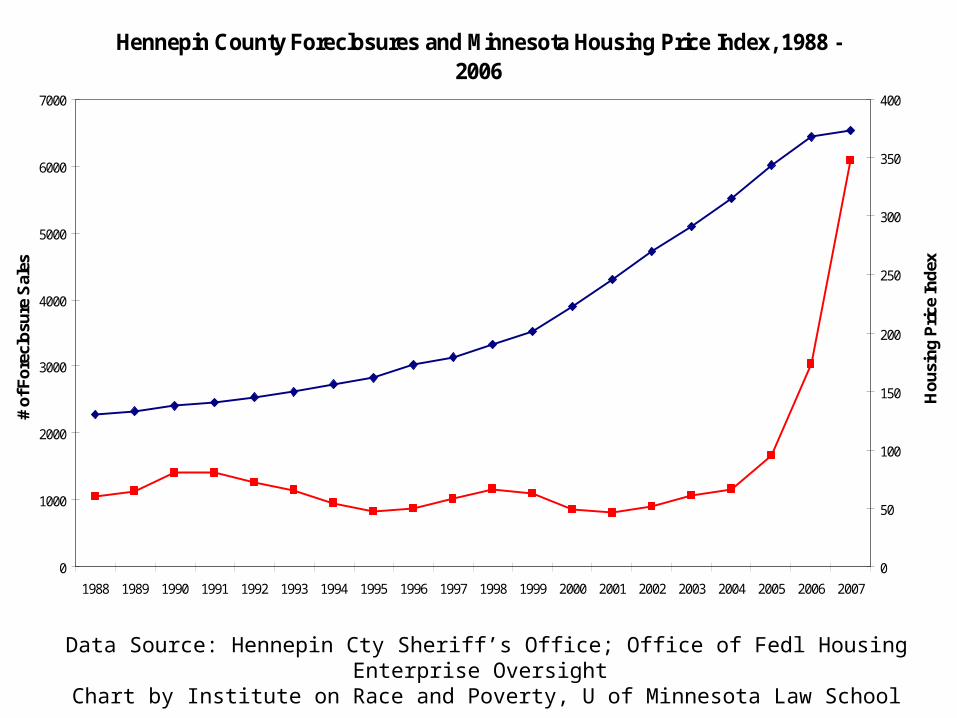
Data Source: Hennepin Cty Sheriff’s Office; Office of Fedl Housing Enterprise Oversight
Chart by Institute on Race and Poverty, U of Minnesota Law School
Hennepin County Foreclosures and Minnesota Housing Price Index, 1988 - 2006
0
1000
2000
3000
4000
5000
6000
7000
1988 1989 1990 1991 1992 1993 1994 1995 1996 1997 1998 1999 2000 2001 2002 2003 2004 2005 2006 2007
# o
f Fo
recl
osu
re S
ales
0
50
100
150
200
250
300
350
400
Ho
usi
ng
Pri
ce In
dex

Source: Center for Responsible Lending
Housing Appreciation and Foreclosure Rate

Deceptive, Imprudent and Unfair Lending
• Above Market Costs– Yield Spread Premiums– High Fees By Originator– Rates in Excess of Risk
• Deceptive Monthly Payment Quotes– PI (apples) and PITI (oranges)– escrow
issues– Dischargeable debt versus debt secured by
home

• Inflated Appraisals
• Stated Income (and Low- Document) Loans
• Adjustable Rate Products Predominate– 2/28 Loans (often with prepay penalty)– Teaser Rates– Interest only and negative amortization
• Prepayment Penalties

Source: Center for Responsible Lending

Percent Increase in Foreclosure Risk with Certain Loan Features Source: Center for Responsible Lending

Source: Center for Responsible Lending

City of St. Paul Single Family Residential Homes in Foreclosure by Type of PossessionFor Period Jan 2005-September 2006
Data Source: Saint Paul Council Research Center
66%
24%
10%
Homestead Non-Homestead Rental Registered

Source: Center for Responsible Lending

‘Alternatives’ Go MainstreamIndustry origination market share by product type
*First quarter only. Source: Amer. Banker and Inside Mortgage Finance
2006*
Conforming34.3%
Home equity12.2%
Alt-A14.2%
Subprime21.6%
Jumbo & Other17.6%
2003Jumbo &
Other23%
Subprime8%
Home equity
5%
Alt-A2%
Conforming62%

Generic Option ARM Payment Shock Example
Flat Interest Rate Environment, Originated on 1/1/05
0
500
1000
1500
2000
2500
3000
3500
1 5 9 13 17 21 25 29 33 37 41 45 49 53 57 61 65 69
38.64% payment shock after year 5($830 increase)
7.5%7.5%
7.5%
Assumptions: Constant use of minimum payment option, $500,000 loan, 1% start rate, fully indexed accrual rate with 3.00 % margin, no changes in interest rates (rate as of 1/1/05).
Source: Conference of State Bank Supervisors
7.5%


Detour to Securitization Issues?
The Soup of Seconds• Res Mtg Backed
Securities (RMBS)• Special Purpose Vehicles
(2 levels)• Investment Bank Carves
Into Tranches With Cascading Risk
• Collaterized Debt Obligations (CDOs)
• Role of MERS
What it Means For FPC• Where’s my Tranche?• Who services the loan?• What are the limits on
loan servicing? Amer. Securitization Forum
• Problem of Assignee Liability.

3. Consequences of Foreclosure
A. Individuals/Families
B. Communities1.Geographic Concentration
2. Foreclosure and Vacancy
C. Broader Market

Homes Currently in Foreclosure As Of December 2006 in North MinneapolisSource: Community Planning and Economic Development, City of Minneapolis

Source: Saint Paul Council Research Center

Source: Saint Paul Council Research Center

Source: Saint Paul Council Research Center
0
100
200
300
400
500
600
700
800
900
Quarter
Num
ber
of V
acan
cies
Category 3
Category 2
Category 1

Source: Saint Paul Council Research Center: Citywide Outcomes, 1995-2006
Rehabbed&Occupied53%
Razed13%
Unknown14%
Open20%