mobile phones, financial inclusion, and growth
TRANSCRIPT

Recommended Citation
Andrianaivo, M., & Kpodar, K. (2012). Mobile Phones, Financial Inclusion, and Growth. Review
of Economics and Institutions, 3(2), Article 4. doi: 10.5202/rei.v3i2.75. Retrieved from
http://www.rei.unipg.it/rei/article/view/75
Copyright © 2012 University of Perugia Electronic Press. All rights reserved
Review of ECONOMICS
and
INSTITUTIONS
Review of Economics and Institutions
www.rei.unipg.it
ISSN 2038-1379 DOI 10.5202/rei.v3i2.75
Vol. 3 – No. 2, Spring 2012 – Article 4
Mobile Phones, Financial Inclusion, and
Growth
Mihasonirina Andrianaivo Kangni Kpodar France Telecom-Orange
Group
International Monetary Fund, Centre for Studies and Research on International
Development
Abstract: This paper assesses the impact of mobile phone rollout on economic growth in a sample of African countries from 1988 to 2007. Further, in light of the large financial infrastructure gap in African countries, we investigate whether mobile phone development fosters economic growth through better financial inclusion. In estimating the impact of mobile phone development on growth, we use mobile penetration rate as well as the cost of mobile local calls to capture mobile phone diffusion, while financial inclusion is measured by the number of deposits or loans per head. Using the System Generalized Method of Moments (GMM) estimator to address endogeneity issues, the results confirm that mobile phone development contributes significantly to economic growth in African countries. Part of the positive effect of mobile phone penetration on growth comes from greater financial inclusion. JEL classification: O30; O40; G20 Keywords: ICT, mobile financial services, economic growth, Africa
The authors would like to thank Francesco Venturini and an anonymous referee for useful comments and suggestions. The usual disclaimer applies.
Corresponding author. International Monetary Fund, 1900 Pennsylvania Ave NW - Washington, DC, 20431. (Phone +1 202 623-6062, Fax +1 202 589-6062. Email: [email protected]).
REVIEW OF ECONOMICS AND INSTITUTIONS, Vol. 3, Issue 2 - Spring 2012, Article 4
1 Introduction
In recent years, mobile phone diffusion has increased rapidly in Africancountries in line with similar patterns in other regions of the developingworld. It is estimated that 28.5 percent of the population owns a mobilephone in African countries in 2007, compared to 46 percent in East Asiaand 66 percent in Latin America.1 However, the number of mobile tele-phone subscribers in percent of total population has increased much fasterin African countries, at a rate of 45 percent a year on average during 2002-2007, compared to around 30 percent a year in East Asia and Latin Americancountries.
Meanwhile, Africa remains challenged by a financial infrastructure gap.Financial exclusion is widespread, and the coverage of bank branches andautomated teller machines (ATMs) is low.2 According to FinMark (2009),most of the population in African countries is using informal finance or isfinancially excluded (for instance, 88 percent of the population in Mozam-bique and 41 percent in Botswana in 2009). However, the Global System forMobile Communications Association (GSMA)3 estimates that there will be1.7 billion unbanked customers with mobile phones by 2012. As a result,mobile phone diffusion has been seen as a powerful tool to overcome thefinancial infrastructure gap. Branchless banking services, such as mobile fi-nancial services, are becoming increasingly popular in a number of Africancountries. In this regard, it is worth investigating the benefits mobile phonedevelopment can bring to economic growth, in particular through promot-ing financial inclusion.
This paper specifically analyzes the impact of mobile phone penetrationon economic growth rates in Africa, and adds to the model an indicator offinancial inclusion to assess whether mobile phone penetration influencesgrowth by improving financial inclusion. The paper also assesses the linkbetween mobile phone development and financial inclusion. Finally, thepaper investigates how the interaction among mobile phone penetration,financial inclusion, and growth is at play in countries where mobile financialservices take hold.
Recent literature on mobile phones in developing countries has beenreviewed by Donner (2008). Jensen (2007) finds microeconomic evidenceof positive economic impacts of mobile telephony. By providing informa-tion, mobile phones reduce price volatility and increase responsiveness offishing businesses. Other studies focus on the microeconomic impacts ofmobile phones on small and medium-size enterprises (SMEs) (Chowdhury,
1 The figures are population-weighted averages.2 In African countries, there were on average 6 bank branches and 11 ATMs per thousand
km2 in 2007.3 GSMA is the association representing the interests of the worldwide mobile communica-
tions industry.
Copyright c© 2012 University of Perugia Electronic Press. All rights reserved 2

Andrianaivo, Kpodar: Mobile Phones, Financial Inclusion, and Growth
2006, and Donner, 2006), and some look at the impact of mobile phoneson institutions and social domains (such as civil society organizations andlibraries). Among the very few macroeconomic studies, Sridhar and Srid-har (2004) and Waverman, Meschi, and Fuss (2005) find that mobile phonedevelopment spurs growth. But, studies on Africa are lacking and to ourknowledge, the channel of financial inclusion is yet to be analyzed.
This paper contributes to the existing literature in several ways. First,it lays down clearly the channels through which mobile phone diffusionspurs growth, with an emphasis on the financial inclusion channel. Second,it focuses on 44 African countries during 1988-2007 and includes in a stan-dard growth model variables pertaining to mobile phone development suchas penetration rates and the price of a three-minute mobile telephone localcall. Third, we also use specific indicators of financial inclusion, includ-ing the number of deposits or loans per head taking into account varioustypes of financial intermediaries, ranging from formal commercial banksto microfinance institutions, cooperatives and specialized state institutions.Fourth, with regard to the methodology, we undertake robust estimationsto address reverse causality from growth to mobile phone diffusion, andany endogeneity issues between the control variables and economic growthby using the System Generalized Method of Moment (GMM) estimator. Fi-nally, we present a financial inclusion model to assess the impact of mobilephone diffusion.
In line with the findings in the literature, we find that mobile phone pen-etration contributes to economic growth in Africa. In addition, as in Rollerand Waverman (2001) and Waverman et al. (2005), our results suggest thatmobile phones and fixed lines are substitutes and that the effect of mobilephone development on growth is higher in lower-income countries. A partof the growth effect of mobile phone penetration comes from improved fi-nancial inclusion. Moreover, the correlation between financial inclusion andgrowth becomes stronger as mobile phone technology spreads, especially incountries where mobile financial services are available.
The rest of the paper is organized as follows. Section II reviews the ar-guments supporting an economic impact of mobile phone development oneconomic growth, and how the former could also stimulate financial inclu-sion. It also summarizes the findings of empirical studies on mobile phonedevelopment and economic growth. Section III presents the data, the modeland the methodology. Section IV follows with a discussion of the results,and the last section concludes with some policy recommendations.
http://www.rei.unipg.it/rei/article/view/75 3
REVIEW OF ECONOMICS AND INSTITUTIONS, Vol. 3, Issue 2 - Spring 2012, Article 4
2 Literature Review
2.1 Mobile Phone Development and Growth
Early studies looked at the impact of Information and CommunicationTechnologies (ICT) on economic growth, with a focus on ICT equipmentsuch as the radio, television, and fixed telephone.4 The role of mobile phonewas overlooked as mobile phone development was still in its infancy. Study-ing the economic impact of mobile phone development has only gained in-terest since the dramatic surge in mobile phone adoption from the end of1990s. Nevertheless, the arguments developed earlier to support a posi-tive impact of ICT development on economic growth remain relevant for amore recent technology like mobile telephony. Therefore, this section willdiscuss in a broader context the implications of ICT development for eco-nomic growth, while focusing on the aspects that touch upon the mobiletechnology.
As pointed out by Tcheng, Huet, Viennois, and Romdhane (2007), ICTdevelopment is increasingly considered as an engine for growth, rather thana consequence of it. Three characteristics of ICT explain this view: (i) ICTare omnipresent in most business sectors, (ii) ICT improve continuouslyand therefore reduce costs for the users, and (iii) ICT contribute to inno-vation and to the development of new products and processes. Buildingon the literature, we identify the main channels through which ICT, includ-ing mobile phones, can contribute to economic growth. Indeed, ICT spurseconomic growth because they contribute directly and indirectly to outputgrowth and employment creation, stimulate capital accumulation, improvefirm productivity, generate network and economic externalities, favor bettermarket functioning, reduce transaction costs, and more importantly encour-age deeper financial inclusion. Also, ICT development can trigger socialand economic development, even though some opportunity costs shouldbe acknowledged. We discuss these channels separately in the followingparagraphs, although some of them are closely interlinked.
2.1.1 Contribution to Output and Employment Growth
By supplying telecommunication services, mobile phone companies con-tribute directly to output growth and employment creation (Lewin and Swe-et, 2005). Growth in the mobile telephony sector also has, without doubt, apositive ripple effect in the output growth and employment in the support-ing sectors, notably manufacturers, administrators, network builders, sys-
4 Grace, Kenny, and Qiang (2003) define ICT as tools that facilitate the production, trans-mission, and processing of information. ICT consist of traditional technologies such asradios modern communication tools and data delivery systems, and new technologieslike telephones, computers, and the Internet.
Copyright c© 2012 University of Perugia Electronic Press. All rights reserved 4
Andrianaivo, Kpodar: Mobile Phones, Financial Inclusion, and Growth
tem managers, providers for mobile content and service applications, andretailing networks.
The impact of mobile phone development on employment creation inAfrican countries has been highlighted by Tcheng et al. (2007). The authorsnote that because prepaid services dominate in African countries, sellingthe prepaid cards requires an effective retailing network of wholesalers, in-dividual agents, and even informal sellers, thereby creating business oppor-tunities for people who would have been unemployed otherwise.
2.1.2 Capital Accumulation
ICT development spurs capital accumulation as the ICT sector itself iscapital intensive, and the diffusion of ICT in other sectors goes along withinvestment in ICT equipments. For instance, deploying a mobile telephonenetwork requires sizeable investment in IT hardware, communications equip-ment and software. Nevertheless, the impact of ICT investment on growthis not straightforward, as it entails two opposite effects. While ICT invest-ment raises capital accumulation, and hence growth, it also accelerates cap-ital depreciation because of the shift of investment composition towardsshort-lived and high depreciation assets -due to falling prices and ageing-such as ICT equipment (Colecchia and Schreyer, 2001). The net impact islikely to be positive. Using a growth accounting framework, Jorgenson andVu (2005) find that the contribution of productivity to world growth laggedbehind that of capital and labor during 1989-2003. The bulk of the increasein capital input after 1995 resulted from the spike in information and tech-nology (IT) investment, propelled by declining prices of IT equipments, es-pecially in advanced economies. Similarly, Venturini (2009) finds that ICTcapital stimulates GDP growth with a magnitude greater than its incomeshare. Haacker (2010) note that even though low- and middle-income coun-tries do not benefit directly from the production of ICT equipment as theyare often imported, the benefit of capital deepening arising from fallingprices of ICT equipment can be large in those countries, even though it re-mains lower than that in high-income countries.
ICT development can also contribute to capital accumulation throughpromoting foreign direct investments (FDI) and by easing financing of pub-lic infrastructure projects. Besides new FDI in telecommunication services,ICT development can help other sectors attract FDI as foreign companies,which invest mostly in export-oriented sectors, are more likely to set up incountries where telecommunication infrastructure is well developed. Onthe other hand, in many African countries, mobile phone operators con-tribute significantly to government revenue through profit and income taxes,value added tax (VAT) and social security contributions. The sale of licensescan also bring sizeable resources to governments, which can be used to fi-nance critical infrastructure projects that would be beneficial to economicgrowth.
http://www.rei.unipg.it/rei/article/view/75 5
REVIEW OF ECONOMICS AND INSTITUTIONS, Vol. 3, Issue 2 - Spring 2012, Article 4
2.1.3 Productivity Gains
ICT improve firms’ productivity by allowing firms to adopt flexible struc-tures and locations. The increased geographic dispersion is a source of pro-ductivity gains as it also allows firms to exploit comparative advantagesand save on production costs. Further productivity gains also come frombetter management, through enhanced intrafirm communication, and in-creased flexibility, owing to the removal of physical constraints on organiza-tional communication (Grace et al., 2003). Small businesses can also increasetheir productivity with ICT. Voice applications reduce unproductive travel-ing time and improve logistics, leading to faster and more efficient decisionmaking. They also empower small and medium-size enterprises, paintersand plumbers for example, through increased flexibility (Lewin and Sweet,2005). Donner and Escobari (2010) analyze the findings of 14 studies ofthe use of mobile telephony by micro and small enterprises (MSEs), andconcludes that mobile use encourages MSEs’ productivity by streamliningsales, marketing and procurement processes, although the benefits accruedmostly to existing MSEs rather than to new businesses.
2.1.4 Network and Economic Externalities
Early studies show evidence of growth effects of ICT, especially for tele-phone services and the Internet, through network externalities. As under-lined by Grace, Kenny, and Qiang (2003), the value of a telephone line in-creases exponentially with the number of users connected to the system dueto network effects. Once a threshold of users is reached, an explosive growthis recorded. Roller and Waverman (2001) estimate that ICT affect economicgrowth only when the penetration rate reaches 40 lines per 100 inhabitants.This explains why only developed economies were believed to benefit fromICT development because they were able to mobilize the resources requiredto reach a “critical mass of telecommunication infrastructure” that can fullyexploit network externalities.
Nevertheless, subsequent studies show that, in fact, the positive impactof ICT can be large in developing countries because ICT compare to utilitiessuch as water, electricity, and transportation. Waverman et al. (2005) explainthat telecommunication networks are part of social overhead capital (SOC),as are expenditure on education, health services, and roads.5 As a result, theeconomic and social return of ICT development is larger than the privatereturn of the network provider.
5 SOC are capital goods available to anyone (social), not linked to any particular part ofproduction (overhead), and broadly available, implying that they are usually providedby governments.
Copyright c© 2012 University of Perugia Electronic Press. All rights reserved 6
Andrianaivo, Kpodar: Mobile Phones, Financial Inclusion, and Growth
2.1.5 Market Efficiency and Transaction Costs
An important benefit mobile phone development can bring to develop-ing countries is a reduction in transaction costs. Norton (1992) highlightsthat the lack of readily available information in developing countries iscostly, thereby making information markets relatively inefficient comparedto those in developed countries. By reducing the cost of retrieving infor-mation, mobile phones improve information flows, increase arbitrage abil-ities, and facilitate price discovery. They allow better functioning marketsand regulation of supply and demand. Moreover, good telecommunicationnetworks substitute for costly physical transport and therefore widen net-works of buyers and suppliers, and markets. Aker and Mbiti (2010) notesthat while mobile phones require an initial fixed cost, the variable costs as-sociated with their use are significantly lower than equivalent travel andother opportunity costs.6
2.1.6 Financial Inclusion
Mobile phone adoption has experienced a strong growth in African coun-tries, reaching 28.5 mobile phones per 100 inhabitants in 2007, from a lowlevel of 4.5 mobiles phones per 100 inhabitants in 2002. In contrast, finan-cial exclusion still remains high in Africa. With the formal financial systemsdominated by banks, a large share of the population lacks access to formalsavings and credit opportunities as they do not have adequate collateralagainst which they can borrow.
Information asymmetry is severe, thereby increasing the cost to screenborrowers before making a loan and then to monitor them once they obtainit. The high unit cost of loans makes unprofitable for conventional banks toextend loans to small borrowers. This is worsened by the coverage of bankbranches and ATMs in Africa, which is the lowest in the world.7 Nonethe-less, data show that despite a low number of deposits per head in Africancountries, the average size of deposits relative to GDP per capita is high;this suggests that the propensity to save is actually high, but probably con-strained by lack of access to financial services or suitable financial instru-ments.8
African countries are facing a situation whereby the coverage of mobilecellular is getting closer to that of high-income countries, but bank pene-tration and financial inclusion are lagging behind that of the same group
6 For instance in Niger, mobile phones reduce search costs by 50 percent as compared withpersonal travel (Aker and Mbiti, 2010).
7 African countries have on average 6 bank branches and 11 ATMs per thousand km2 in2007, about 3 times lower than countries in East Asia and Latin America.
8 For instance in Africa, the number of deposit account per adult was 0.2 with an averagedeposit account value of 4 percent of income per capita in 2007, compared to 0.5 depositaccount per adult and an average deposit account value of 0.4 percent of income per capitain East Asia.
http://www.rei.unipg.it/rei/article/view/75 7

REVIEW OF ECONOMICS AND INSTITUTIONS, Vol. 3, Issue 2 - Spring 2012, Article 4
of countries.9 The use of this fast growing technology as an opportunity tomake up for the large financial infrastructure gap has led to the deploymentof several mobile financial service schemes in Africa since the success of M-PESA services in Kenya. It is expected that these innovations in financialservices and mobile phone services can potentially drive financial inclusionand growth, notably because mobile phones improve information flows andhelp provide cost-effective financial services for previously unbanked cus-tomers.
Mobile phone diffusion reduces transaction costs, especially the costsof running physical bank branches, thereby encouraging the emergence ofbranchless banking services.10 The resulting increased access to financialservices for underserved people helps narrow the financial infrastructuregap in developing economies, where the costs of distance and time are veryhigh for formal banking services. Moreover, mobile phone diffusion easesinformation flows, and the data collected on depositors can be used to ana-lyze credit worthiness more efficiently, improve credit monitoring and facil-itate deposit taking. Also, by reducing communication costs, mobile phonedevelopment increases arbitrage opportunities and make financial marketsmore efficient, which in turn lower capital costs (Leff, 1984). Therefore mo-bile phone diffusion improves access to credit and deposit facilities, allowmore efficient allocation of credit, facilitate financial transfers, and boost fi-nancial inclusion. Levine (2003) points out that access to external capital isone channel through which financial development matters for growth be-cause it allows financially constrained firms to expand.
According to the GSMA and Mobile Money for the Unbanked (MMU)deployment tracker, three African countries were operating mobile finan-cial services as of end-2007-M-PESA in Kenya, WIZZIT and MTN MobileMoney in South Africa, and CELPAY in Zambia. This number has increasedto 30 in 2011.11 Currently, the most common mobile financial services in-clude domestic money transfers, air time top ups, and bill payments; butthere is also a strong desire for savings (Rasmussen, 2010). In addition,international money transfer and loan repayments via mobile phones arebecoming widely used. Although prospects for further development of mo-bile financial services remain strong, they rely on the long-term strategies
9 About 80 percent of the population in African countries is covered by mobile cellularnetworks compared to 99 percent in the OECD countries.
10 Rasmussen (2010) suggests that branchless banking is about 26 percent cheaper thanconventional banking.
11 27 African countries launched financial services via mobile phones between 2008 and2011-Benin, Botswana, Burkina Faso, Burundi, Cameroon, Democratic Republic of Congo,Cote d’Ivoire, Djibouti, Egypt, Ghana, Guinea Bissau, Liberia, Madagascar, Malawi, Mali,Morocco, Mozambique, Namibia, Niger, Rwanda, Swaziland, Senegal, Sierra Leone, So-malia, Tanzania, Uganda, and Zimbabwe. Competitive schemes have also started inKenya with ZAP and YUCASH; in South Africa with Community Banking, Mopay, andSend Money from FNB; and in Zambia with Mobile Transactions.
Copyright c© 2012 University of Perugia Electronic Press. All rights reserved 8

Andrianaivo, Kpodar: Mobile Phones, Financial Inclusion, and Growth
of stakeholders and on appropriate design of services that respond to cus-tomers’ needs. The other important factor is the ability of governments tofoster innovation and channel payments (Rasmussen, 2010). These schemesare becoming more sophisticated as promising partnerships between mobiletelephone companies and microfinance institutions, as well as adequate reg-ulation strengthen mobile financial services. This would widen the range offinancial services available via mobile phones, which could include micro-savings, micro-loans as well as micro insurance services.
2.1.7 Beyond Growth: Impact on Economic and Social Development
Mobile phone diffusion facilitates rural development. Voice applica-tions allow dispersed families to stay in touch, reducing vulnerability andisolation; improve the bargaining power of farmers; eliminate the middle-man; and enable the development of nonagricultural economic activitieslike ecolodges or women-owned microbusinesses. Mobile phones can alsoimprove households’ risk-sharing and allow them to respond better to shocksas information flows within networks is facilitated (Jack and Suri, 2011;Aker and Mbiti, 2010). An increasing number of development projects inthe health, education and agricultural sectors are taking advantage of thelarge diffusion of mobile phones. Aker and Mbiti (2010) underline thatin some African countries mobile phones are used to expand the reach ofhealth services, monitor disease outbreaks, facilitate access to agriculturalmarket information, and promote literacy for adults.
2.1.8 Opportunity Costs
Despite its several benefits, mobile phone diffusion involves some op-portunity costs. Heeks (1999) points out the negative effects which mightarise because of the opportunity costs of investments and expenses in ICTrather than in education and health. Studies show that the share of house-hold income devoted to mobiles services in developing countries is rising,even though it is already higher than that of developed countries.12 Thiscould reduce households’ budgets for food, health, and education. Further-more, as noted by Grace et al. (2003), some developing countries mightfall into a poverty trap if ICT threshold effects are at play. As a result, in-vestment in ICT might not yield tangible economic benefits, when thesescarce resources could be used for alternative investment opportunities withhigher growth returns.
12 Tcheng et al. (2007) mention that in some African countries such as Namibia, Ethiopia,and Zambia, households spend up to 10 percent of their monthly income on telephoneexpenses, whereas the average is 3 percent in developed countries.
http://www.rei.unipg.it/rei/article/view/75 9
REVIEW OF ECONOMICS AND INSTITUTIONS, Vol. 3, Issue 2 - Spring 2012, Article 4
2.2 Empirical Studies
Two main findings emerge from macroeconomic studies on mobile phonedevelopment and economic growth: (i) mobile phone diffusion contributessignificantly to economic growth, notably through network effects; (ii) mo-bile phones and fixed lines appear substitutes rather than complements indeveloping countries. Sridhar and Sridhar (2004) use Roller and Waver-man’s (2001) framework by estimating a system of equations that endoge-nizes economic growth and telecom penetration, while extending the anal-ysis to mobile phones. Using a sample of 63 developing countries with dataduring 1990-2001, the authors find that the elasticity of aggregate nationaloutput with respect to main telephone lines is smaller than that of mobiles,and that cellular services contribute significantly to national output. Waver-man et al. (2005) reach similar conclusions on a sample of 92 countries withdata between 1980 and 2003. Moreover, the authors find that mobile phonesand fixed lines are substitutes in developing countries, but in developedcountries they are complements. Kathuria, Uppal, and Mamta (2009) showthat Indian states with higher mobile penetration rates can be expected togrowth faster, and that there is a critical mass, at a penetration rate of 25percent, beyond which the impact of mobile phones on growth is amplifiedby network effects.
Lee, Levendis, and Gutierrez (2009) are among the rare studies that havefocused on the effects of mobile phones on economic growth in sub-SaharanAfrica. Their findings are not different from that of previous studies. Mo-bile phones expansion spurs growth in sub-Saharan Africa, with a strongerimpact when fixed line penetration is low. However, their study, like previ-ous ones, faces some limitations. The authors do not test for the price effectof telecommunications on growth. Indeed, telecommunications infrastruc-ture could exist but a high access price for consumers could dampen its usedespite the high propensity to spend on this technology. In addition, thefinancial inclusion channel is not explored. Further, their results may bebiased because the System GMM estimator is not appropriate for annualdata if the variables are not stationary. Our paper attempts to address theseshortcomings.
Microeconomic studies also offer some insights into the impact of mobilephones on households and firms. Jensen (2007) asserts that the availabilityof mobile phones enhances market functioning thereby improving welfare.The author finds that the use of mobile phones by fishermen and whole-salers reduced price dispersion and waste, and increased fishermen’s prof-its and consumer welfare in Kerala, a state in India. Along the same line,Aker (2010) find that mobile phones reduce price dispersion by 10 percentacross grain markets in Niger. On the other hand, Muto and Yamano (2009)find that in Uganda, mobile phone coverage expansion improves marketparticipations of producers of more perishable goods. On financial inclu-
Copyright c© 2012 University of Perugia Electronic Press. All rights reserved 10

Andrianaivo, Kpodar: Mobile Phones, Financial Inclusion, and Growth
Table 1 - Summary Statistics, 1988-2007
Observations Average
Standard deviation
Minimum Maximum
Real GDP growth 190 4.3 4.2 -4.9 40.9
Primary school enrollment rates 190 89.7 28.5 26.9 181.2
Government consumption in percent of GDP 190 14.7 5.4 2.6 35.0
Inflation rate 190 10.3 13.4 -5.9 83.6
Institutions 190 0.268 0.152 0.143 1.000
Fixed telephone lines per head 189 0.028 0.049 0.0 0.286
Mobile telephone subscribers per head 190 0.063 0.136 0.0 0.792
Price of 3-minute mobile local call (US dollar) 170 0.498 0.476 0.0 1.853
GDP per head (current US dollar) 190 1,207 1,816 97 14,320
Number of deposits per head 190 0.064 0.129 0.0 0.739
Number of loans per head 190 0.011 0.024 0.0 0.125
Private credit to GDP 185 0.170 0.151 0.020 0.712
sion, Mbiti and Weil (2011) find that the rapid diffusion of M-Pesa has tangi-ble economic impact, including promoting banking penetration, increasingtransfers and reducing the prices of competing money transfer services.
3 Data and Empirical Strategy
The data consists of a panel of 44 African countries. Appendix 1 showsthe countries included in the sample, with data from 1988 through 2007.Deployment of mobile phones really began in the 1990s, thus dictating ourstudy period. Because this study focuses on long-term growth, and to avoidstationary issues associated with annual data, the variables are averagedover four years. The sample period is therefore divided into five sub-periodsas follows: 1988-1991, 1992-1995, 1996-1999, 2000-2003, and 2004-2007.
On average, African economies grew by 4.3 percent during the periodconsidered, while average mobile phone penetration stood at 6.3 percent,more than twice the penetration rate of fixed lines (Table 1). The numberof deposits per 100 inhabitants was 6.3, compared with 1.1 for the numberof loans per 100 inhabitants, suggesting that access to credit was more con-strained that that to deposit. This weak financial inclusion level reflected ashallow financial depth in African countries, with the average private creditratio being 17 percent of GDP during the study period.
Figure 1 suggests that higher mobile phone penetration rate is associatedwith higher real GDP per capita and higher access to loans and deposits inAfrican countries. Although this tends to support our main hypotheses,a more rigorous framework is needed to test these hypotheses in order toaddress omitted variable bias and reverse causality issues that affect simplebivariate relationships.
We use a standard endogenous growth model to examine the relation-ship between mobile phone development and economic growth. The equa-
http://www.rei.unipg.it/rei/article/view/75 11

REVIEW OF ECONOMICS AND INSTITUTIONS, Vol. 3, Issue 2 - Spring 2012, Article 4
Figure 1 - Mobile Penetration, GDP per capita, and Financial Inclusion
Sources: Beck, Demirguc-Kunt, and Martinez Peria (2007), International Telecommunication Union, FinMark(2009), and authors’ calculations.
Copyright c© 2012 University of Perugia Electronic Press. All rights reserved 12

Andrianaivo, Kpodar: Mobile Phones, Financial Inclusion, and Growth
tion is as follows:13
yi,t − yi,t−1 = αyi,t−1 + βMobi,t + ΓXi,t + ηi + εi,t
where the variable yi,t is the logarithm of real per capita GDP, Mobi,t is thelevel of mobile phone development, Xi,t a set of growth determinants (in-cluding primary school enrollment rate, inflation, government consump-tion, and institutional development), ηi is an unobserved country-specificeffect, εi,t is the error term, and i and t represent country and time periodrespectively.14
Appendix 2 provides the variable definitions and sources. Data are ob-tained mainly from the International Financial Statistics, the Word Develop-ment Indicators, the Financial Structure Database, the International TelecomUnion Database, Beck et al. (2007) and the Consultative Group to Assist thePoor (CGAP, 2009).
The covariates may not be strictly exogenous. They can be predeter-mined (correlated with past observation-specific disturbances) or endoge-nous (correlated with past and current observation-specific disturbances).Blundell and Bond (1998) (henceforth BB) develop a System GMM estima-tor to address issues associated with predetermined and endogenous vari-ables. We choose the BB estimator because it performs better than Arellanoand Bond’s estimator when the autoregressive coefficient is relatively high,and the number of periods is small.15
Moreover, the validity of the internal instruments used must be checkedto make sure the results are valid. As noted by Roodman (2009) the useof System GMM estimators must be done with great caution, and severalchecks must be done before relying on the estimation results, especiallywhen T is small and the number of internally determined instruments ishigh. Because too many instruments can overfit instrumented variables-failing to remove their endogenous components and biasing the coefficientestimates (Roodman, 2009) - we keep the number of instruments to the min-imum.16 For the lagged real GDP per capita, we use as instruments the firstdifference lagged one period for the equations in levels assuming that it is
13 As in the literature on finance and growth, the growth equation above could be rewrittenas follows:
yi,t = λyi,t−1 + βMobi,t + ΓXi,t + ηi + εi,t
with α = λ− 1.14 The logarithm of one plus the inflation rate is taken to avoid placing a heavy weight on a
small number of high inflation observations.15 Blundell and Bond (1998) estimation requires that the series are mean stationary
(yi,1, yi,2, ...yi,T ), that is, they have a constant mean ηi1−α for each country i.
16The validity of the BB estimators is checked by using the p-values of a Hansen-Sargan testof overidentifying restrictions. It tests for joint validity of the full instrument by checkingwhether the instruments, as a group, appear exogenous. We also check the p-values ofthe Arellano-Bond test for AR(1) and AR(2) serial correlation of the residuals. In mostregressions, the results of the Hansen and AR tests support the use of the BB estimator.
http://www.rei.unipg.it/rei/article/view/75 13
REVIEW OF ECONOMICS AND INSTITUTIONS, Vol. 3, Issue 2 - Spring 2012, Article 4
predetermined. For the equations in first difference, we use the first laggedvalue. For the other variables, which are assumed endogenous, we use thesecond lagged value as instruments. We adopted the two-step System GMMwith Windmeijer (2005) small sample robust correction.
To test whether financial inclusion is one of the channels through whichmobile phone development stimulates growth, we add to the growth modela variable of financial inclusion-captured by either the number of depositsor the number of loans per head-to check how the coefficient on mobilephone development moves. If this coefficient weakens, we can concludethat part of the beneficial impact of mobile phone development on growth ischanneled through financial inclusion. This will be supplemented by a sep-arate model explaining financial inclusion by mobile phone developmentand a number of control variables.
We strengthen the analysis by including in the growth model an inter-action term between mobile penetration and financial inclusion. We assesswhether, by improving financial inclusion, mobile penetration is at the sametime reinforcing its own impact on economic growth. Similarly, this allowsus to test whether the impact of financial inclusion on growth is strength-ened by better mobile phone diffusion. We also refine the analysis by isolat-ing the impact of mobile phone development on growth through financialinclusion in countries that have implemented financial services on mobilephones.
4 Results
4.1 Mobile Phone Development and Growth
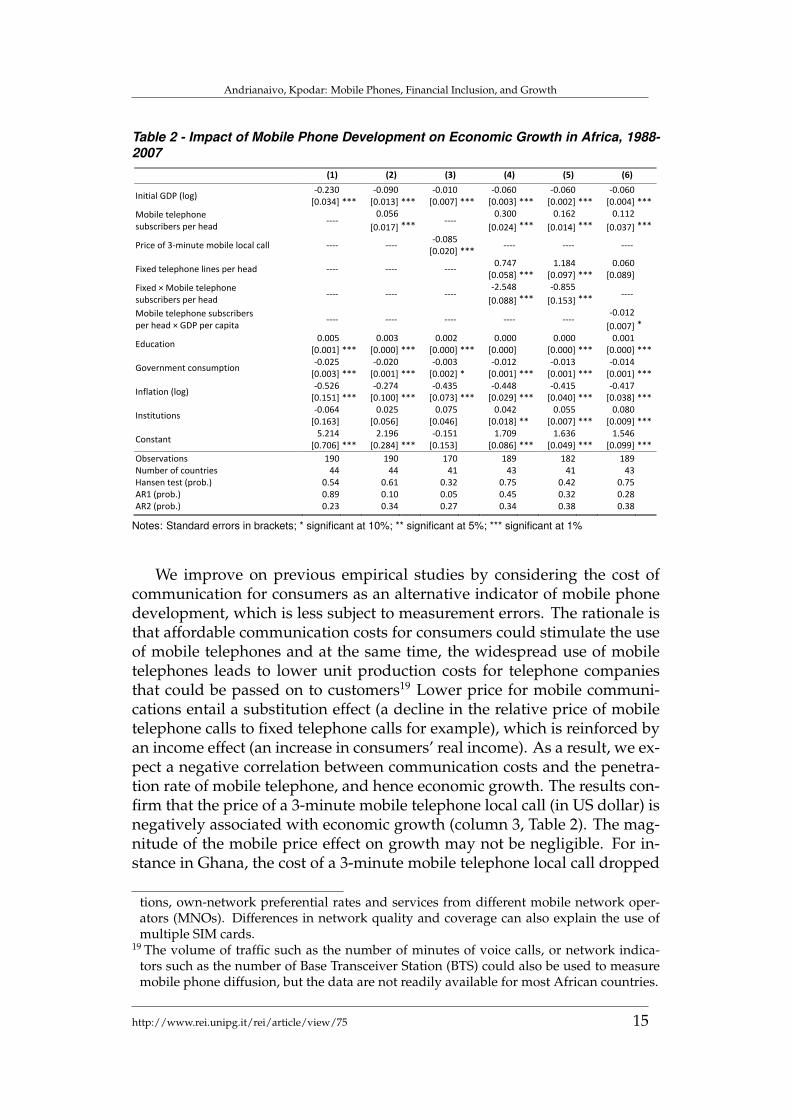
Table 2 summarizes the results of the impact of mobile phone develop-ment on economic growth. Mobile penetration rate (the number of mobiletelephone subscribers divided by total population) which measures mobilephone development is found to have a significant and positive impact oneconomic growth in Africa, consistent with the findings of Roller and Wa-verman (2001) and Lee et al. (2009).17 This result suggests that an additional10 percentage point increase in the mobile penetration rate is associatedwith a 0.6 percentage point increase in real GDP growth (column 2, Table2).
Measuring mobile phone penetration is difficult, especially in Africancountries as data are scarce. Also, with the use of multiple SIM cards beingcommon in Africa, the number of mobile telephone subscribers might over-estimate the actual number of mobile customers. Inactive SIM cards can alsoweaken the accuracy of this indicator.18
17 We obtained similar results with the growth rate of mobile telephone penetration.18 Customers use multiple SIM cards to take advantage of temporary attractive promo-
Copyright c© 2012 University of Perugia Electronic Press. All rights reserved 14
Andrianaivo, Kpodar: Mobile Phones, Financial Inclusion, and Growth
Table 2 - Impact of Mobile Phone Development on Economic Growth in Africa, 1988-2007
(1) (2) (3) (4) (5) (6)
Initial GDP (log) -0.230 -0.090 -0.010 -0.060 -0.060 -0.060
[0.034] *** [0.013] *** [0.007] *** [0.003] *** [0.002] *** [0.004] ***
Mobile telephone subscribers per head
---- 0.056
---- 0.300 0.162 0.112
[0.017] *** [0.024] *** [0.014] *** [0.037] ***
Price of 3-minute mobile local call ---- ---- -0.085
---- ---- ---- [0.020] ***
Fixed telephone lines per head ---- ---- ---- 0.747 1.184 0.060
[0.058] *** [0.097] *** [0.089]
Fixed × Mobile telephone subscribers per head
---- ---- ---- -2.548 -0.855
---- [0.088] *** [0.153] ***
Mobile telephone subscribers per head × GDP per capita
---- ---- ---- ---- ---- -0.012
[0.007] *
Education 0.005 0.003 0.002 0.000 0.000 0.001
[0.001] *** [0.000] *** [0.000] *** [0.000] [0.000] *** [0.000] ***
Government consumption -0.025 -0.020 -0.003 -0.012 -0.013 -0.014
[0.003] *** [0.001] *** [0.002] * [0.001] *** [0.001] *** [0.001] ***
Inflation (log) -0.526 -0.274 -0.435 -0.448 -0.415 -0.417
[0.151] *** [0.100] *** [0.073] *** [0.029] *** [0.040] *** [0.038] ***
Institutions -0.064 0.025 0.075 0.042 0.055 0.080
[0.163] [0.056] [0.046] [0.018] ** [0.007] *** [0.009] ***
Constant 5.214 2.196 -0.151 1.709 1.636 1.546
[0.706] *** [0.284] *** [0.153] [0.086] *** [0.049] *** [0.099] ***
Observations 190 190 170 189 182 189 Number of countries 44 44 41 43 41 43 Hansen test (prob.) 0.54 0.61 0.32 0.75 0.42 0.75 AR1 (prob.) 0.89 0.10 0.05 0.45 0.32 0.28 AR2 (prob.) 0.23 0.34 0.27 0.34 0.38 0.38
Notes: Standard errors in brackets; * significant at 10%; ** significant at 5%; *** significant at 1%
We improve on previous empirical studies by considering the cost ofcommunication for consumers as an alternative indicator of mobile phonedevelopment, which is less subject to measurement errors. The rationale isthat affordable communication costs for consumers could stimulate the useof mobile telephones and at the same time, the widespread use of mobiletelephones leads to lower unit production costs for telephone companiesthat could be passed on to customers19 Lower price for mobile communi-cations entail a substitution effect (a decline in the relative price of mobiletelephone calls to fixed telephone calls for example), which is reinforced byan income effect (an increase in consumers’ real income). As a result, we ex-pect a negative correlation between communication costs and the penetra-tion rate of mobile telephone, and hence economic growth. The results con-firm that the price of a 3-minute mobile telephone local call (in US dollar) isnegatively associated with economic growth (column 3, Table 2). The mag-nitude of the mobile price effect on growth may not be negligible. For in-stance in Ghana, the cost of a 3-minute mobile telephone local call dropped
tions, own-network preferential rates and services from different mobile network oper-ators (MNOs). Differences in network quality and coverage can also explain the use ofmultiple SIM cards.
19 The volume of traffic such as the number of minutes of voice calls, or network indica-tors such as the number of Base Transceiver Station (BTS) could also be used to measuremobile phone diffusion, but the data are not readily available for most African countries.
http://www.rei.unipg.it/rei/article/view/75 15

REVIEW OF ECONOMICS AND INSTITUTIONS, Vol. 3, Issue 2 - Spring 2012, Article 4
dramatically, by 62 percent, from USD 1.18 in 1999 to USD 0.46 in 2006; thiswould yield a 6 percent increase in real income over eight years.20 Egyptand Mozambique experienced a drop in mobile communication cost by asimilar magnitude during the same period.
Given the widespread use of the mobile penetration rate in the literature,we keep it in the subsequent regressions, bearing in mind its shortcomings.As expected, the coefficient on the interaction term between the penetrationrate of mobile and fixed telephones is negative and significant (column 4,Table 2), suggesting mobile telephones are substitutes for fixed telephonesin Africa.21 If the fixed line penetration rate moves from the bottom to thetop quartile (0.35 percent to 2.8 percent), the growth impact of a 10 per-centage point increase in the mobile penetration rate would drop from 2.9to 2.2 percentage points. The latter figure is close to the marginal impactat the average fixed line penetration rate, reflecting a skewed distribution.Surprisingly, the marginal impact turns negative for fixed line penetrationrates above 12 percent. This concerns about 5 percent of observations oronly 2 (Mauritius and Seychelles) out of 43 countries in the sample-whenconsidering the average fixed line penetration rate in 1988-2007 (see Figure2). Perhaps the marginal impact does not drop as fast as implied by the dataas this result might be driven by influential observations (countries with arelatively high fixed penetration rate). Also, in small and densely populatedcountries, it might be possible that the benefit from mobile phone develop-ment is smaller, and offset by the substitution away from fixed networks, inparticular when new growth engines for fixed networks such as broadbandinternet and data transport services to businesses are lacking.22 ExcludingMauritius and Seychelles from the sample confirms that the marginal im-pact of mobile phone development on growth drops with increasing fixedline penetration, but at a slower pace (column 5, Table 2).
The marginal impact of the fixed penetration rate on economic growthappears stronger than that of the mobile penetration rate, which contrastswith previous findings (see Sridhar and Sridhar, 2004, on a sample of de-veloping economies, and Waverman et al. 2005). This suggests that there is
20 This impact is smaller when controlling for the price effect of fixed telephone (see Andri-anaivo and Kpodar, 2011) as declining price of mobile phone call has also led to a fall inthe price of fixed telephone call.
21 The substitution effect shown in African countries is not surprising given the shortage offixed telephone lines. In this case, the substitution effect results from the lack of extensivewired infrastructure and cost factors (smaller fixed costs for infrastructure and availabil-ity of cheap handsets), rather than from a change in the demand for telecommunicationservices. Also, market structure had played a critical role. In contrast to the fixed linemarket which is often dominated by state-owned monopolies, the mobile phone marketis generally open to the private sector and more competitive, leading to a sharp drop inmobile phone call charges.
22 However, the negative impact on growth should not be large. In the robustness analy-sis, we also checked the baseline results for sensitivity to the exclusion of Mauritius andSeychelles.
Copyright c© 2012 University of Perugia Electronic Press. All rights reserved 16

Andrianaivo, Kpodar: Mobile Phones, Financial Inclusion, and Growth
Figure 2 - Marginal Impact of Mobile Phone Diffusion on Growth, 1988-2007*
ZARTCDTCDTCDTCDTCDNERNERNERNERNERRWARWARWARWAUGAUGAUGAUGAUGACAFCAFCAFBDIBDIBDIBDIBDIMLIMLIMLIMLIMLIMDGMDGMDGMDGMDGTZATZATZATZAMOZMOZMOZMOZMOZBFABFABFABFABFAETHETHETHETHETHMWIMWIMWIMWIMWICMRCMRCMRCMRCMRAGOCOGCOGCOGCOGCOGBENBENBENBENGNBGNBGNBGNBGNBMRTMRTMRTMRTMRTTGOTGOTGOTGOTGOZMBZMBZMBGHAGHAGHAGHAGHAKENKENKENKENKENSDNSDNSDNSDNGNQGNQGNQGNQGNQCIVCIVCIVCIVCIVLSOLSOLSOLSOLSOSENSENSENSENSENGMBGMBGMBGMBGMB
GABGABGABGABGABSWZSWZSWZSWZSWZ
MARMARMARMARMAR
DZADZADZADZADZABWABWABWABWABWANAMNAM
EGYEGYEGYEGYEGYTUNTUNTUNTUNTUN
CPVCPVCPVCPVCPVLBY
ZAFZAFZAFZAFZAF
MUSMUSMUSMUSMUS
SYCSYC
-.2
-.1
0.1
.2.3
Ma
rgin
al im
pact
0 .05 .1 .15 .2Fixed line penetration rate
* Source: Authors’ calculations
room to improve further the contribution of mobile phone development toeconomic growth in Africa.23
Further, we introduce in the model an interaction term between mobilepenetration rate and GDP per capita and find that the marginal impact ofmobile phone development drops with increasing level of income per capita(column 6, Table 2), reflecting probably diminishing growth returns to mo-bile telephone development. This is consistent with the findings of Waver-man et al. (2005) that show a stronger impact of mobile telephones in lowerincome countries.
Turning to the control variables, we find that as shown by past studies,high government consumption and macroeconomic instability captured byhigh inflation rates dampen economic growth in African countries. Whilehuman capital accumulation appears to favor growth, the legal environ-ment only come out significant in two out of five specifications, proba-bly because the civil and political liberty indexes may not capture well thestrength of the law in African economies.24 There is also evidence of growth
23It is worth noting that the prospects for increasing the penetration rate of fixed telephonesappear more limited than for mobile telephones, even in Africa, underlining the impor-tance of mobile telephone development as a source of growth.
24 Using an alternative indicator of legal environment such as the rule of law gives a betterresult, but unfortunately reduces the sample size by a quarter-the reason we did not retain
http://www.rei.unipg.it/rei/article/view/75 17
REVIEW OF ECONOMICS AND INSTITUTIONS, Vol. 3, Issue 2 - Spring 2012, Article 4
convergence among African countries as countries with lower initial incometend to grow faster than others with similar macroeconomic conditions,level of human capital, and institutions.
Table 3 - Robustness Tests, 1988-2007 (1) (2) (3) (4) (5) (6)
Initial GDP (log) -0.040 -0.060 -0.140 -0.020 -0.020 -0.070
[0.005] *** [0.020] *** [0.012] *** [0.006] *** [0.005] *** [0.011] ***
Mobile telephone subscribers per head
0.071 0.078 0.226 0.104 0.104 ----
[0.010] *** [0.032] *** [0.006] *** [0.019] *** [0.018] ***
Mobile telephone subscribers per head (t-1)
---- ---- ---- ---- ---- 0.103
[0.056] *
Mobile telephone subscribers per head × Africa
---- ---- ---- ---- -0.034
---- [0.032]
Education 0.002 0.002 0.001 0.002 0.001 0.004
[0.000] *** [0.001] *** [0.000] *** [0.001] ** [0.000] *** [0.001] ***
Government consumption -0.012 -0.024 -0.015 -0.017 -0.017 -0.020
[0.001] *** [0.005] *** [0.001] *** [0.003] *** [0.002] *** [0.001] ***
Inflation (log) -0.394 -0.514 -0.725 -0.278 -0.369 -0.188
[0.021] *** [0.130] *** [0.056] *** [0.106] *** [0.075] *** [0.089] ***
Institutions 0.082 -0.003 -0.089 0.006 0.045 -0.044
[0.016] *** [0.102] [0.081] [0.043] [0.029] [0.061]
Constant 0.992 1.647 3.404 0.660 0.633 1.652
[0.112] *** [0.438] *** [0.273] *** [0.137] *** [0.111] *** [0.258] ***
Observations 205 150 157 451 451 154 Number of countries 43 42 36 114 114 43 Hansen test (prob.) 0.93 0.21 0.53 0.03 0.06 0.68 AR1 (prob.) 0.22 0.20 0.87 0.16 0.17 0.07 AR2 (prob.) 0.96 0.17 0.24 0.92 0.92 0.27
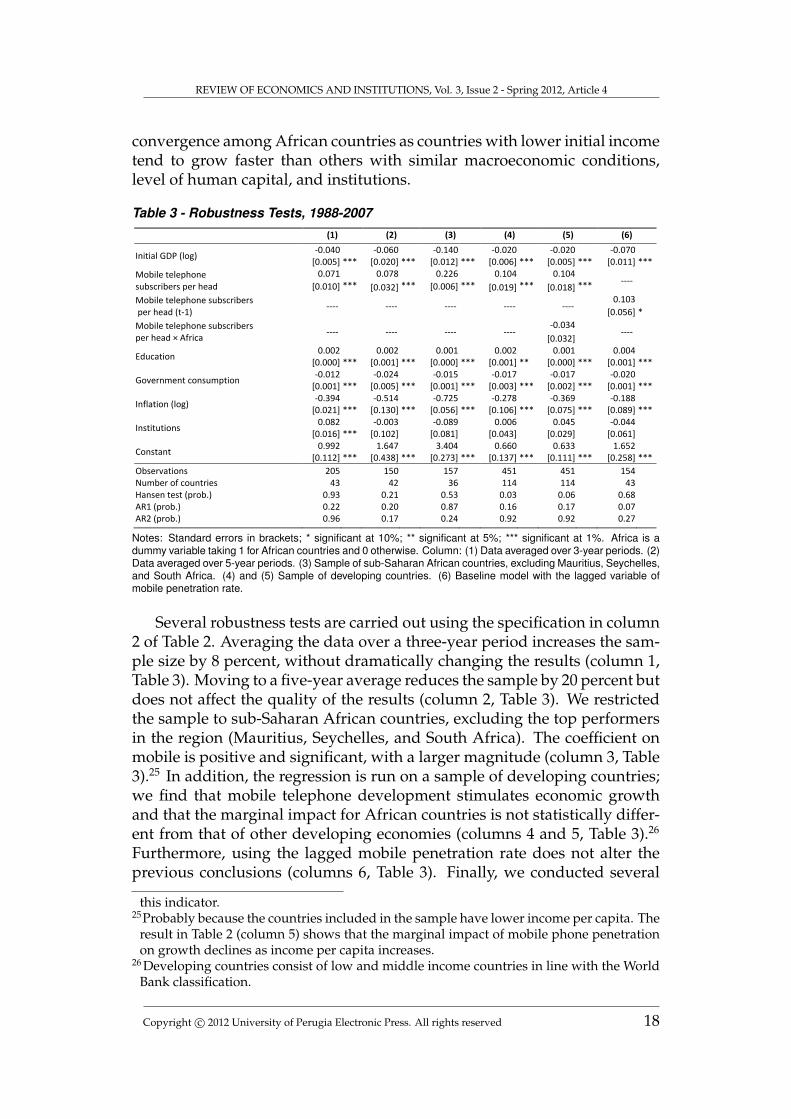
Notes: Standard errors in brackets; * significant at 10%; ** significant at 5%; *** significant at 1%. Africa is adummy variable taking 1 for African countries and 0 otherwise. Column: (1) Data averaged over 3-year periods. (2)Data averaged over 5-year periods. (3) Sample of sub-Saharan African countries, excluding Mauritius, Seychelles,and South Africa. (4) and (5) Sample of developing countries. (6) Baseline model with the lagged variable ofmobile penetration rate.
Several robustness tests are carried out using the specification in column2 of Table 2. Averaging the data over a three-year period increases the sam-ple size by 8 percent, without dramatically changing the results (column 1,Table 3). Moving to a five-year average reduces the sample by 20 percent butdoes not affect the quality of the results (column 2, Table 3). We restrictedthe sample to sub-Saharan African countries, excluding the top performersin the region (Mauritius, Seychelles, and South Africa). The coefficient onmobile is positive and significant, with a larger magnitude (column 3, Table3).25 In addition, the regression is run on a sample of developing countries;we find that mobile telephone development stimulates economic growthand that the marginal impact for African countries is not statistically differ-ent from that of other developing economies (columns 4 and 5, Table 3).26
Furthermore, using the lagged mobile penetration rate does not alter theprevious conclusions (columns 6, Table 3). Finally, we conducted several
this indicator.25Probably because the countries included in the sample have lower income per capita. The
result in Table 2 (column 5) shows that the marginal impact of mobile phone penetrationon growth declines as income per capita increases.
26 Developing countries consist of low and middle income countries in line with the WorldBank classification.
Copyright c© 2012 University of Perugia Electronic Press. All rights reserved 18

Andrianaivo, Kpodar: Mobile Phones, Financial Inclusion, and Growth
stability tests for the coefficient on mobile phone development and find twomain results: (i) the marginal impact is heterogeneous across the sample,suggesting the growth benefits from mobile phone development may not beimmediate and may depend on country-specific factors that should be ac-counted for; (i) the marginal impact tends to decline with increasing mobilepenetration rates, reflecting a lack of network effects in African countries.27
4.2 Accounting for Financial Inclusion
In this section, we investigate whether mobile phone development stim-ulates growth by fostering financial inclusion and whether the interactionbetween mobile phone and financial inclusion facilitates economic growth.Before turning to the regressions, it is worth noting the challenge of measur-ing financial inclusion in the sense of greater access of households to finan-cial services. Very few measures of financial inclusion exist, and those thatdo lack time dimension and are available for only a limited number of coun-tries. We retained two relevant indicators for our study. The first is the num-ber of deposits per head-including deposits at commercial banks, coopera-tives, microfinance institutions, and specialized state financial institutions-and the second is the number of loans per head-also including loans grantedby the previously mentioned financial institutions. Because of limited dataon the number of deposits and loans per head (the data are available for2003 and 2007), we assume the average level holds throughout the period.28
This prevents us from using the lagged variable to address the endogeneityof financial inclusion; however, the robustness analysis would show that thequality of the results is not affected.
In columns 2 and 4 of Table 4, the coefficient on the number of depositsper head and that on the number of loans per head are positive and sig-nificant, implying that greater financial inclusion is associated with higher
27 More details can be found in Andrianaivo and Kpodar (2011).28Given that financial development and financial inclusion are closely related phenomenon,
we used the tests of equality of mean and variance of the private credit ratio for the twoperiods (2003-2007 and 1988-2007) to assess the validity of our assumption. The corre-lation coefficient between the private credit ratio and the number of deposits per headwas 0.43 in 2003 and 0.74 in 2007. With the number of loans per head, the correlationcoefficient was 0.43 in 2003 and 0.80 in 2007. The results presented in Table 5 reject thenull hypothesis of equal mean, with the average private credit ratio being 17 percent in1988-2007, and 18 percent in 2003-2007. Therefore, using the financial inclusion indica-tors measured in 2003-2007 for the period 1988-2007 will tend to overestimate the truelevel of financial inclusion. This would not lead to biased coefficient estimates unless the“measurement error” is correlated with country characteristics. The test of equal varianceand the Spearman’s rank tend not to support this hypothesis as they fail to reject the nullhypothesis of equal distribution, suggesting that financial development grew on averageuniformly during the two periods. The implication for the financial inclusion indicators isthat their coefficients are less likely to be biased since the System GMM estimator wouldrely on cross-country variations for the purpose of identification.
http://www.rei.unipg.it/rei/article/view/75 19

REVIEW OF ECONOMICS AND INSTITUTIONS, Vol. 3, Issue 2 - Spring 2012, Article 4
Table 4 - Mobile Penetration, Financial Inclusion, and Economic Growth in Africa,1988-2007
(1) (2) (3) (4) (5) (6) (7) (8)
Initial GDP (log) -0.110 -0.150 -0.070 -0.160 -0.110 -0.080 -0.120 -0.060
[0.009] *** [0.015] *** [0.007] *** [0.013] *** [0.009] *** [0.011] *** [0.014] *** [0.005] ***
Mobile telephone subscribers per head 0.075 0.042 -0.014 0.043 0.005 -0.043 -0.009 -0.040
[0.016] *** [0.009] *** [0.015] [0.011] *** [0.024] [0.037] [0.033] [0.030]
Number of deposits per head ---- 0.658 0.087
---- ---- 0.060
---- ---- [0.154] *** [0.005] *** [0.017] ***
Mobile × Number of deposits per head ---- ---- 0.103
---- ---- 0.120
---- ---- [0.034] *** [0.072] *
Mobile × Number of deposits per head × Mobfi ---- ---- ---- ---- ---- 2.199
---- ---- [0.238] ***
Number of loans per head ---- ---- ---- 3.540 0.919
---- 1.059
---- [0.870] *** [0.043] *** [0.091] ***
Mobile × Number of loans per head ---- ---- ---- ---- 1.756
---- 0.727
---- [0.311] *** [0.328] **
Mobile × Number of loans per head × Mobfi ---- ---- ---- ---- ---- ---- 8.832
---- [0.815] ***
Private Credit/GDP ---- ---- ---- ---- ---- ---- ---- 0.139
[0.049] ***
Mobile × Private Credit/GDP ---- ---- ---- ---- ---- ---- ---- 0.132
[0.058] **
Mobile × Private Credit/GDP × Mobfi ---- ---- ---- ---- ---- ---- ---- 0.335
[0.145] **
Mobfi ---- ---- ---- ---- ---- -0.065 -0.116 -0.072
[0.021] *** [0.021] *** [0.070]
Education 0.004 0.004 0.003 0.005 0.004 0.003 0.004 0.002
[0.000] *** [0.001] *** [0.000] *** [0.001] *** [0.000] *** [0.000] *** [0.000] *** [0.000] ***
Government consumption -0.020 -0.030 -0.015 -0.028 -0.022 -0.017 -0.022 -0.012
[0.001] *** [0.001] *** [0.001] *** [0.001] *** [0.001] *** [0.001] *** [0.001] *** [0.001] ***
Inflation (log) -0.293 -0.195 -0.360 -0.120 -0.194 -0.377 -0.206 -0.308
[0.107] *** [0.159] [0.052] *** [0.148] [0.066] ** [0.069] *** [0.085] ** [0.029] ***
Constant 2.518 3.481 1.534 3.635 2.575 1.895 2.817 1.369
[0.218] *** [0.374] *** [0.160] *** [0.316] *** [0.207] *** [0.241] *** [0.297] *** [0.103] ***
Observations 190 190 190 190 190 190 190 184 Number of countries 44 44 44 44 44 44 44 42 Hansen test (prob.) 0.60 0.59 0.59 0.66 0.44 0.57 0.71 0.64 AR1 (prob.) 0.16 0.03 0.38 0.03 0.06 0.34 0.05 0.43 AR2 (prob.) 0.32 0.20 0.40 0.25 0.32 0.32 0.27 0.42
Notes: Standard errors in brackets; * significant at 10%; ** significant at 5%; *** significant at 1% Mobfi is a dummy variable taking 1 for countries where financial services on mobile telephones are available, and 0 otherwise
Notes: Standard errors in brackets; * significant at 10%; ** significant at 5%; *** significant at 1% . Mobfi is adummy variable taking 1 for countries where financial services on mobile telephones are available, and 0 other-wise.
Table 5 - Comparing the Level and Distribution of the Private Credit Ratio during1988-2007 and 2003-2007
1988-2007 2003-2007
Private credit to GDP Average 0.17 0.18
Standard deviation 0.15 0.17
Test of equality of means (prob.) 0.05 Test of equality of variance (prob.) 0.13 Spearman’s rank test (prob.) 0.00 rho statistic 0.91
economic growth in African economies. Interestingly, the coefficient on themobile penetration rates drops when controlling for financial inclusion, sug-gesting that some of the positive impact of mobile phone development ongrowth is channeled through financial inclusion. Further, the penetrationof mobile telephones reinforces the correlation between financial inclusionand growth as shown by the positive and significant coefficient on the inter-action term between the mobile penetration rate and the number of deposits
Copyright c© 2012 University of Perugia Electronic Press. All rights reserved 20
Andrianaivo, Kpodar: Mobile Phones, Financial Inclusion, and Growth
per head (column 3, Table 4). The same result holds for the interaction termbetween the mobile penetration rate and the number of loans per head (col-umn 5, Table 4). These results confirm that mobile telephone penetrationmay foster economic growth not only by facilitating financial inclusion, butalso by strengthening the link between financial inclusion and growth.
To refine our analysis, we considered that financial services on mobilesremain underdeveloped in African countries and are available only in a fewcountries. During the period covered by our study, three countries wereoperating mobile financial services: Zambia since 2001, South Africa since2004, and Kenya since 2007. We constructed a dummy variable (namedMobfi), taking the value of 1 from the year mobile financial services be-come available in a country and 0 otherwise. Crossing this dummy variablewith the interaction term between financial inclusion and mobile penetra-tion shows that in countries where mobile financial services exist, the corre-lation between financial inclusion and growth is stronger than in countrieswhere these services are yet to be deployed (columns 6 and 7, Table 4).
As a robustness test, we checked for the potential influence of outliersby removing from the sample observations with a residual term larger than(i) two standard deviations, (ii) one standard deviation, and (iii) one-halfstandard deviation of the dependent variable. Rerunning the regressionswithout these potential outliers does not affect the quality of the results. Inaddition, the results are confirmed when using the private credit ratio, anindicator of financial development, which is closely correlated to financialinclusion. Unlike the financial inclusion indicators, the private credit ra-tio varies across time and countries and its lagged values can be used toaddress endogeneity issues. The conclusions remained, nevertheless, un-changed. While financial development appears positively correlated withgrowth (consistent with the findings of Levine, Loayza, and Beck, 2000),the interaction term between financial development and mobile penetrationis also positive and significant, suggesting that financially well-developedcountries tend to grow faster when mobile penetration is high (column 8,Table 4). This effect appears stronger in countries where mobile financialservices are available.
4.3 Assessing the Effect of Mobile Phone Penetration on Fi-nancial Inclusion
We found in Table 4 that the effect of mobile penetration on growthweakened once financial inclusion was controlled for, suggesting that thelatter could be one of the channels through which mobile penetration pos-itively influences growth. However, this conclusion was based solely onthe change in the coefficient on mobile phone penetration, without properlymodeling financial inclusion. Building on Kendall, Mylenko, and Ponce(2010), we estimate the effect of mobile phone development on financial in-
http://www.rei.unipg.it/rei/article/view/75 21

REVIEW OF ECONOMICS AND INSTITUTIONS, Vol. 3, Issue 2 - Spring 2012, Article 4
clusion, while controlling for a range of factors including income levels andpopulation density. Our model is as follows:
FIi,t = γ0 + γ1yi,t + γ2Densi,t + γ3Mobi,t +n∑
k=1
Xki,t + δi + εi,t
where FI the dependent variable, stands for financial inclusion, measuredby the number of deposits and loans per head; Mob our variable of interest,denotes the mobile phone penetration rate; y and Dens the main controlvariables, represent, respectively, the level of GDP per head and populationdensity; X is a set of other control variables, including banks’ overhead costto account for the efficiency of financial intermediaries, a variable capturingthe quality of the legal environment, and the number of bank branches perkm2 to capture the geographical coverage of bank branches.29 30 Finally,δaccounts for country-specific effects and εis the error term.
In contrast to Kendall et al. (2010), we use a panel regression becausedata on the indicators of financial inclusion are available for 2003 and 2007.The data on the explanatory variables are averaged over two periods of fouryears each: 2000–2003 and 2004–2007. Given the limited time dimensionof the data, we choose to run the model with the random effect estimator,though this estimator relies on the strong assumption of exogenous country-specific effects. However, the probability of the Hausman test is higher than0.10, suggesting that use of a random-effect model is appropriate.
The results presented in Table 6 suggest that mobile phone developmentis positively correlated to financial inclusion. This holds even after control-ling for GDP per head and population density, as well as for the cost offinancial intermediation, the legal environment and the geographical cover-age of bank branches.31 Similarly, by using household survey data, Beck etal. (2010) find that the ownership of a cell phone increases the likelihood ofusing financial services in Kenya.
Interestingly, a better coverage of bank branches and good institutionsenhance financial inclusion. While higher GDP per head, bank efficiencyand population density are positively associated with access to deposits, theresults are less clear for access to loans. For instance, population density hassurprisingly a negative sign, when branch density is included in the model.One explanation could be found in the ways financial institutions handlerisk diversification. Formal financial institutions such as commercial banks29 Kendall et. al (2010) did not include banking sector efficiency in their model, but we
believe that it is a relevant explanatory variable for financial inclusion as the high cost ofsmall loans and deposits is often viewed as one of the main reasons of a high degree offinancial exclusion.
30 For consistency purposes, the indicator of the quality of institutions is the same as in thegrowth model. Kendall et al. (2010) use indicators of contract enforcement, creditor rightprotection and creditor information.
31 We also tested the effect of inflation and banking concentration on financial inclusion asin Kendall, Mylenko, and Ponce (2010), but none was significant.
Copyright c© 2012 University of Perugia Electronic Press. All rights reserved 22

Andrianaivo, Kpodar: Mobile Phones, Financial Inclusion, and Growth
Table 6 - Mobile Phone Development and Financial Inclusion, 2000-2007
Number of deposits per head Number of loans per head
(1) (2) (3) (4)
Mobile telephone subscribers per head 0.382 0.101 0.211 0.071
[0.161] ** [0.036] *** [0.084] ** [0.011] ***
GDP per head(log) 0.132 0.093 0.015 -0.001
[0.047] *** [0.032] *** [0.016] [0.010]
Population density (log) 0.098 0.065 0.007 -0.023
[0.035] *** [0.030] ** [0.010] [0.010] **
Banks’ overhead cost (percent of assets) ---- -1.405
---- 0.227
[0.682] ** [0.202]
Institutions ---- 0.95
---- 0.279
[0.142] *** [0.073] ***
Number of bank branches per km2 ---- 0.005
---- 0.002
[0.001] *** [0.000] ***
Constant -1.008 -0.802 -0.104 0.034
[0.347] *** [0.227] *** [0.111] [0.070]
Observations 49 39 46 36 Number of countries 36 31 34 29 R2 (between) 0.47 0.68 0.37 0.55 Hausman test (prob) 0.69 0.34 0.99 0.57
Note: Standard errors in brackets; * significant at 10%; ** significant at 5%; *** significant at 1%
are less likely to lend to customers that are geographically concentrated soas to limit collective risk. But less formal financial institutions such as mi-crofinance institutions tend to have geographically concentrated customersto ease group lending. As our indicators of financial inclusion possibly un-derestimate the access to less formal financial services, the negative sign ofpopulation density might be driven by the risk diversification strategy ofcommercial banks.
Further research could improve the financial inclusion model presentedabove by expanding the sample as additional data on the indicators of finan-cial inclusion become available, and addressing potential reverse causalityfrom financial inclusion to income per capita. Also, data permitting, boththe financial inclusion and growth models could be jointly estimated.
5 Conclusion
This paper investigates the impact of mobile telephone development oneconomic growth, considering a sample of African countries during 1988–20-07. Using a standard growth model and the System GMM estimator to ad-dress endogeneity issues, the results of the estimations reveal that mobiletelephone development (captured by the mobile telephone penetration rateand the price of telephone calls) contribute to economic growth in Africa.In addition, financial inclusion, measured by the number of deposits andloans per head, appears to be one of the channels of transmission from mo-bile phone development to growth, while being itself independently corre-lated with economic growth. Furthermore, the interaction between mobilephone penetration and financial inclusion is found positive and significant
http://www.rei.unipg.it/rei/article/view/75 23

REVIEW OF ECONOMICS AND INSTITUTIONS, Vol. 3, Issue 2 - Spring 2012, Article 4
in the growth regression. Although the rollout of mobile banking is still atits early stage, the results show that in countries where such financial ser-vices are available, the correlation among financial inclusion, mobile phonediffusion, and growth is stronger.
The findings of this paper underline the importance of mobile phonerollout for African countries. Policies in African countries should encour-age domestic and foreign investment in mobile phone development, andmore generally in the ICT sector. Moreover, driving down the cost of com-munications is critical to stimulating the diffusion of mobile phones andspurring growth. Increased competition in the telecommunication industrycould be one of the options. The experience of OECD countries suggeststhat prices have declined, and technological diffusion and introduction ofnew services have been rapid following the liberalization of the ICT sec-tor (OECD, 2003). Also, in an attempt to mobilize revenue, governments inmany African countries find it attractive to increase tax on mobile commu-nications as this tax is easy to administer and has a large base. Because thiswill lead to higher communication costs, the benefit from increased govern-ment revenue should be weighed against the risk of lower growth.
Mobile phone diffusion has the potential to boost financial inclusion byeasing the provision of cost-effective financial services to the poor and thenonpoor, given the low coverage of banks in African countries. Policies topromote greater interaction between the ICT and financial sectors while ad-dressing the challenges posed by mobile banking (security concerns, com-pliance with AML/CFT32 rules, and so forth) could improve the develop-ment of mobile banking. Experiences in Kenya, Zambia, and South Africahave demonstrated that mobile financial services can help reduce the finan-cial infrastructure gap and the lack of access to financial services in Africa.
32 AML = Anti-Money Laundering; CFT = Combating the Financing of Terrorism.
Copyright c© 2012 University of Perugia Electronic Press. All rights reserved 24

Andrianaivo, Kpodar: Mobile Phones, Financial Inclusion, and Growth
References
Aker, J. (2010). Information from Markets Near and Far: Mobile Phonesand Agricultural Markets in Niger. American Economic Journal: Applied Eco-nomics, 2(3), 46–59. doi: http://dx.doi.org/10.1257/app.2.3.46
Aker, J., & Mbiti, I. (2010). Mobile Phones and Economic Develop-ment in Africa. The Journal of Economic Perspectives, 24(3), 207-232. doi:http://dx.doi.org/10.1257/jep.24.3.207
Andrianaivo, M., & Kpodar, K. (2011). ICT, Financial Inclusion,and Growth Evidence from African Countries. (IMF Working Pa-pers No. 11/73). Washington, D.C.: International MonetaryFund. Retrieved from International Monetary Fund website:http://www.imf.org/external/pubs/ft/wp/2011/wp1173.pdf
Beck, T., Demirguc-Kunt, A., & Martinez Peria, M. (2007).Reaching Out: Access to and Use of Banking Services AcrossCountries. Journal of Financial Economics, 85(1), 234–266. doi:http://dx.doi.org/10.1016/j.jfineco.2006.07.002
Beck, T., Cull, R., Fuchs, M., Getenga, J., Gatere, P, Randa, J., &Trandafir, M. (2010). Banking Sector Stability, Efficiency, and Outreachin Kenya. (Policy Research Working Paper Series No. 5442). Washing-ton: World Bank. Retrieved from World Bank website: http://www-wds.worldbank.org/servlet/WDSContentServer/WDSP/IB/2010/10/06/000158349 20101006154729/Rendered/PDF/WPS5442.pdf
Blundell, R., & Bond, S. (1998). Initial Conditions and Moment Restrictionsin Dynamic Panel Data Models. Journal of Econometrics, 87(1), 115–143. doi:http://dx.doi.org/10.1016/S0304-4076(98)00009-8
Chowdhury, S. (2006). Investments in ICT-Capital and EconomicPerformance of Small and Medium Scale Enterprises in EastAfrica. Journal of International Development, 18(4), 533–552. doi:http://dx.doi.org/10.1002/jid.1250
Colecchia, A., & Schreyer, P. (2001). ICT Investment and Economic Growthin the 1990s: Is the United States a Unique Case? A ComparativeStudy of Nine OECD Countries. (OECD Science, Technology and In-dustry Working Papers, No. 2001/07). Paris: OECD Publishing. doi:http://dx.doi.org/10.1787/078325004705
Consultative Group to Assist the Poor. (2009). Financial Access 2009-Measuring Access to Financial Services around the World. Technical Report.Washington, DC: Consultative Group to Assist the Poor/The World Bank.
http://www.rei.unipg.it/rei/article/view/75 25

REVIEW OF ECONOMICS AND INSTITUTIONS, Vol. 3, Issue 2 - Spring 2012, Article 4
Retrieved from CGAP website: http://www.cgap.org/gm/document-1.9.38735/FA2009.pdf
Donner, J. (2006). The Use of Mobile Phones by Microentrepreneursin Kigali, Rwanda: Changes to Social and Business Networks. In-formation Technologies and International Development, 3(2), 3–19. doi:http://dx.doi.org/10.1162/itid.2007.3.2.3
Donner, J. (2008). Research Approaches to Mobile Use in the DevelopingWorld: a Review of the Literature. The Information Society, 24(3), 140–159.doi: http://dx.doi.org/10.1080/01972240802019970
Donner, J., & Escobari, M. (2010). A Review of Evidence on Mobile Use byMicro and Small Enterprises in Developing Countries. Journal of Interna-tional Development, 22(5), 641–58. doi: http://dx.doi.org/10.1002/jid.1717
FinMark Trust. (2009). FinScope South Africa 2009. Johannesburg: FinScope.
Global System for Mobile Communications Association (GSMA). (2008).Understanding Financial Regulation and How it Works. Technical Report. Lon-don: GSMA.
Grace, J., Kenny, C., & Qiang, Z. (2003). Information and Communication Tech-nologies and Broad Based Development: a Partial Review of the Evidence. WorldBank Working Paper, Technical Report 12. Washington: World Bank.
Haacker, M. (2010). ICT Equipment Investment and Growth in Low- and Lower-Middle-Income Countries. (IMF Working Paper No. 10/66). Washington: In-ternational Monetary Fund. Retrieved from International Monetary Fundwebsite: http://www.imf.org/external/pubs/ft/wp/2010/wp1066.pdf
Hardy, A. (1980). The Role of the Telephone in EconomicDevelopment. Telecommunications Policy, 4(4), 278–286. doi:http://dx.doi.org/10.1016/0308-5961(80)90044-0
Heeks, R. (1999). Information and Communication Technologies, Poverty and De-velopment. (Development Informatics Working Paper Series, No.5/1999).Manchester: Institute for Development Policy and Management. Re-trieved from Institute for Development Policy and Management website:http://unpan1.un.org/intradoc/groups/public/documents/nispacee/unpan015539.pdf
Jack, W., & Suri, T. (2011). Mobile Money: the Economics of M-Pesa. (WorkingPaper No. 16721). Retrieved from National Bureau of Economic Researchwebsite: http://www.nber.org/papers/w16721.
Jensen, R. (2007). The Digital Provide: Information (Technology),Market Performance, and Welfare in the South Indian Fisheries
Copyright c© 2012 University of Perugia Electronic Press. All rights reserved 26

Andrianaivo, Kpodar: Mobile Phones, Financial Inclusion, and Growth
Sector. The Quarterly Journal of Economics, 122(3), 879–924. doi:http://dx.doi.org/10.1162/qjec.122.3.879
Jorgenson, D., & Vu, K. (2005). Information Technology and the WorldEconomy. The Scandinavian Journal of Economics, 107(4), 631–650. doi:http://dx.doi.org/10.1111/j.1467-9442.2005.00430.x
Kathuria, R., Uppal, M., & Mamta. (2009). An Econometric Anal-ysis of the Impact of Mobile. The Vodafone Policy Paper Series, 9,5–20. Vodafone Group Plc. This paper can be seen online athttp://www.vodafone.com/publicpolicyseries
Kendall, J., Mylenko, N., Ponce, A. 2010. Measuring Financial Access aroundthe World. (Policy Research Working Paper, No. 5253). Washington: theWorld Bank.
Leff, N. (1984). Social Benefit-Cost Analysis and Telecommunications In-vestment in Developing Countries. Information Economics and Policy, 1(3),217-227. doi: http://dx.doi.org/10.1016/0167-6245(84)90003-9
Lee, S., Levendis, J., & Gutierrez, L. (2009). Telecommunications andEconomic Growth: an Empirical Analysis of sub-Saharan Africa. (Doc-umentos de trabajo No. 005512). Bogota: Universidad del Rosario-Facultad de Economia. Retrieved from Universidad del Rosario websitehttp://www.urosario.edu.co/urosario files/fe/fe76de8a-3f23-445f-b6f8-390f1dcf8f32.pdf
Levine, R., Loayza, N., & Beck, T. (2000). Financial Intermediation andGrowth: Causality and Causes. Journal of Monetary Economics, 46, 31–77.doi: http://dx.doi.org/10.1016/S0304-3932(00)00017-9
Levine, R. (2003). More on Finance and Growth: More Finance, MoreGrowth? Federal Reserve Bank of St. Louis Review, 85(4), 31–46.http://research.stlouisfed.org/publications/review/03/07/Levine.pdf
Lewin, D., & Sweet, S. (2005). The Economic Impact of Mo-bile Services in Latin America. Technical Report. London: Re-port for the GSMA, GSM Latin America, and AHCIET.http://www.kiwanja.net/database/document/report economic impactlatin america.pdf
Mbiti, I., & Weil, D. (2011). Mobile Banking: The Impact of M-Pesa in Kenya.(Working Papers No. 17129). Retrieved from National Bureau of EconomicResearch website: http://www.nber.org/papers/w17129.pdf
Muto, M., & Yamano, T. (2009). The Impact of Mobile PhoneCoverage Expansion on Market Participation: Panel Data Evi-dence from Uganda. World Development, 37(12), 1887–1896. doi:http://dx.doi.org/10.1016/j.worlddev.2009.05.004
http://www.rei.unipg.it/rei/article/view/75 27

REVIEW OF ECONOMICS AND INSTITUTIONS, Vol. 3, Issue 2 - Spring 2012, Article 4
Norton, S. (1992). Transaction Costs, Telecommunications, and the Microe-conomics of Macroeconomic Growth. Economic Development and CulturalChange, 41(1), 175–196. doi: http://dx.doi.org/10.1086/452002
OECD (2003). ICT and Economic Growth: Evidence from OECD Countries, In-dustries and Firms. Paris: Organization for Economic Co-operation and De-velopment.
Rand, J., & Tarp, F. (2002). Business Cycles in Developing Coun-tries: Are They Different? World Development, 30(12), 2071–2088. doi:http://dx.doi.org/10.1016/S0305-750X(02)00124-9
Rasmussen, S. (2010). Mobile Banking in 2020. Washington: ConsultativeGroup to Assist the Poor.
Roller, L., & Waverman, L. (2001). Telecommunications Infrastructure andEconomic Development: A Simultaneous Approach. American EconomicReview, 91(4), 909–923. doi: http://dx.doi.org/10.1257/aer.91.4.909
Roodman, D. (2009). A Note on the Theme of Too Many Instru-ments. Oxford Bulletin of Economics and Statistics, 71(1), 135–158. doi:http://dx.doi.org/10.1111/j.1468-0084.2008.00542.x
Sridhar, K., & Sridhar, V. (2004). Telecommunications Infrastructure and Eco-nomic Growth: Evidence from Developing Countries. (Working Paper No.04/14). New Delhi: National Institute of Public Finance and Policy. Re-trieved from National Institute of Public Finance and Policy website:http://www.nipfp.org.in/working paper/wp04 nipfp 014.pdf
Tarazi, M., & Breloff, P. (2010). Nonbank E-Money Issuers: RegulatoryApproaches to Protecting Customer Funds. Technical Report 63. Wash-ington, DC: Consultative Group to Assist the Poor/The World Bank.Retrieved from CGAP website: http://www.cgap.org/gm/document-1.9.45715/FN 63 Rev.pdf
Tcheng, H., Huet, J., Viennois, I, & Romdhane, M. (2007). Telecoms and De-velopment in Africa: the Chicken or the Egg? Convergence Letter No 8.
Venturini, F. (2009). The Long-Run Impact of ICT. Empirical Economics, 37(3),497–515. doi: http://dx.doi.org/10.1007/s00181-008-0243-9
Waverman, L., Meschi, M., & Fuss, M. (2005). The Impact of Telecoms onEconomic Growth in Developing Countries. The Vodafone Policy Paper Se-ries, 2, 10–23. doi: http://dx.doi.org/10.1016/j.jeconom.2004.02.005
Windmeijer, F. (2005). A Finite Sample Correction for the Variance of LinearEfficient Two-Step GMM Estimators. Journal of Econometrics, 126 (1), 25–51.
Copyright c© 2012 University of Perugia Electronic Press. All rights reserved 28

Andrianaivo, Kpodar: Mobile Phones, Financial Inclusion, and Growth
Appendix 1
Table A1 - Sample Countries
Algeria Libya Angola Madagascar Benin Malawi Botswana Mali Burkina Faso Mauritania Burundi Mauritius Cameroon Morocco Cape Verde Mozambique Central African Republic Namibia Chad Niger Congo Rwanda Congo (Democratic Republic of the) Senegal Cote d'Ivoire Seychelles Egypt Sierra Leone Equatorial Guinea South Africa Ethiopia Sudan Gabon Swaziland The Gambia Tanzania Ghana Togo Guinea-Bissau Tunisia Kenya Uganda Lesotho Zambia
http://www.rei.unipg.it/rei/article/view/75 29

REVIEW OF ECONOMICS AND INSTITUTIONS, Vol. 3, Issue 2 - Spring 2012, Article 4
Appendix 2
Table A2 - Variable Definitions and Sources
Variables Definitions Sources
Real GDP growth Annual change in real GDP
Word Development Indicators and International Financial Statistics
Log of real (nominal) GDP Logarithm of real (nominal) GDP
Primary school enrollment rates
Ratio of total enrollment in primary schools to the population of the age group that officially corresponds to that level of education
Government consumption in percent of GDP
Government current expenditure as a share of GDP
Inflation rate Annual change in Consumer Price Index
GDP per capita (current US dollar) Nominal GDP divided by total population
Population density Midyear population divided by a country's total area in square kilometers
Institutions Inverse of the average value of political right index and civil liberty index
Freedom House
Fixed telephone lines per head The ratio of fixed-line subscribers to total population
International Telecommunication Union
Mobile telephone subscribers per head Mobile telephone subscribers divided by total population
Price of 3-minute mobile local call Mobile cellular - price of 3-minute local call (peak - US$)
Private credit/GDP Private credit by deposit money banks as share of GDP
Financial Structure Database (World Bank)
Banks' overhead cost Accounting value of banks' operating costs as a share of its total assets
Number of deposits per head
Number of deposits by commercial banks, cooperatives, specialized state financial institutions, and microfinance institutions divided by total adult population
CGAP (2009); Beck, Demirgüç-Kunt, and Martinez Peria (2007)
Number of loans per head
Number of loans by commercial banks, cooperatives, specialized state financial institutions, and microfinance institutions divided by total adult population
Number of bank branches per km2 Number of bank branches divided by a country's total area in square kilometers
Copyright c© 2012 University of Perugia Electronic Press. All rights reserved 30