mobility in the gauteng city-region
TRANSCRIPT

Mobility in the Gauteng City-Region
Edited by Chris Wray and Graeme GotzChapter contributions by Christo Venter, Willem Badenhorst,
Guy Trangoš and Christina Culwick

Published by the Gauteng City-Region Observatory (GCRO), a partnership of the University of Johannesburg, the
University of the Witwatersrand, Johannesburg, and the Gauteng Provincial Government.
Mobility in the Gauteng City-Region
July 2014
ISBN 978-0-602-620105-2
Edited by:
Chris Wray and Graeme Gotz
Chapter contributions:
Graeme Gotz and Chris WrayChristo Venter and Willem BadenhorstGuy TrangošChristina Culwick
Other contributions:
Background report commissioned from University of Johannesburg staff and students and contracted specialists: Tracey McKay, Zach Simpson, Kerry Chipp, Naeem Patel, Alutious Sithole and Ruan van den Berg
Photographic images by Potsiso Phasha, Christina Culwick, ITL Communication & Design and various contributors to a photographic competition run by the Gauteng City-Region Observatory (GCRO) in 2013 (credits given with images)
The image on page 104 is the copyright of Media Club South Africa and Gautrain; it may not be used for any promotional, advertising or merchandising use, and may not be materially altered, nor may its editorial integrity be compromised.
Copyright © Gauteng City-Region Observatory (GCRO)
Design and layout: www.itldesign.co.za
Cover image: easterly view of the new rea vaya Bus rapid transit route along Kingsway avenue in JohannesBurg, linKing the university of JohannesBurg and the university of the witwatersrand

Contents
anthony gotz
Chapter 1 Introduction: A new ‘golden era’ for transport planning? 1
Chapter 2 2011 GCRO Quality of Life Survey: Analysis of transport data 15
Chapter 3 Constructing a Quality of Transport Index: Gauteng’s priority townships 59
Chapter 4 New spaces of transport in the Gauteng City-Region: A Gautrain analysis 85
Chapter 5 Transitions to non-motorised transport in Gauteng 131
Chapter 6 A photo essay: Non-motorised transport – forging connections across space and society 153
References 170
Tables 172
Figures 172
original photo: theo Khuvutlu

CHAPTER 1 IntroductIon: A new ‘Golden erA’ for trAnsport plAnnInG?
1
Introduction: A new ‘golden era’ for transport planning?graeme gotz and Chris wray
A key factor in understanding a functional city-region is the daily flows of people between its constituent parts. The Organisation for Economic Co-operation and Development (OECD), for example, regards the commuter field as a key criterion for defining the extent of a metro-region (OECD, 2011). Traffic flow is also an important urban efficiency concern, as congestion impacts the costs of doing business, which in turn affects regional competitiveness. Congestion is furthermore a key social issue, as long commutes on poorly maintained transit infrastructure affect the quality of life of residents. Transport affordability and access are critical development concerns: high day-to-day costs of travel, the unavailability of public transport in many peripheral areas, and poor home-to-work connections because of badly defined routes and weak intermodal integration all impact severely on the poor, especially in a sprawling city-region where poverty and spatial dislocation are often synonymous. In addition, transport can be a major driver of environmental problems such as air pollution and climate change if road-based modes lead to high carbon emissions. Alternatively, transport can lead to greater urban sustainability if, for example, a city’s metabolic rate of liquid fuel consumption can be reduced though measures that reduce car-based travel. Lastly, transport infrastructure, especially that developed for public transport, can have important symbolic and cultural effects, either working productively to bring people together in shared public space, or negatively to further entrench societal divisions.
For all of these reasons it is important to delineate the existing flows of traffic across the Gauteng City-Region (GCR); to understand the challenges of transport efficiency, access and affordability; and to gauge the impact of key transport interventions like the Gautrain Rapid Rail Link, the Gauteng Freeway Improvement Programme and associated e-tolling, and municipal Bus Rapid Transit (BRT) infrastructure.
This report on Mobility in the Gauteng City-Region has been written in a remarkable moment in the history of transport development in Gauteng. On the one hand the region appears to be in a new ‘golden era’ of transit infrastructure design and investment, as well as long-term planning for ever-growing commuter transport needs. On the other hand, the transport difficulties faced by the GCR’s fast-growing population, as well as the many spatial, social, economic and environmental challenges that flow from the region-wide architecture of this population’s daily commuting, appear to be growing ever more acute.
Mobility in the GautenG city-ReGion
2
1.1 A new ‘golden era’ for transport planning?
At various points in its history the GCR’s urban form has been substantially shaped by large transport infrastructure investments. T. J. Fair and E. W. Mallows (1959) note how the intersection of three railway lines from the coast in the mid to late-1890s gave prominence to Germiston, and provided a ‘broad framework’ for the region’s future settlement pattern: “The polynuclear structure, the east-west mining axis and the north-south communications axis had emerged. The sum of these factors had produced the now clearly-defined cruciform nature of the structure built around these two dominant axes” (Fair and Mallows, 1959, p.130). Alan Mabin (2013, p.29) traces how in the late 1960s and 70s a decade of road-infrastructure focused highway planning led to “the demarcation of a veritable spaghetti of proposed freeway routes.” This intermetropolitan road network cemented the conception of a functional region, and shifted the region’s centres of gravity, providing structuring elements that by-passed some older centres while favouring development along key corridors in the north (Mabin, 2013).
In the mid to late-2000s, after decades of underinvestment, the GCR appeared to enter a new, dramatically more energetic era of transit planning and road and public-transport infrastructure development. A host of recent major projects and innovative plans testify to this new ‘golden era’ of transport planning:
• The Gautrain Rapid Rail Link. Led by the Gauteng Provincial Government (GPG), with a capital cost to date of some R25 billion, the Gautrain fast-rail network is one South Africa’s largest transport infrastructure investments. Eighty kilometres of track, 15km of it underground, and ten stations now knit together the city-region’s key urban centres. The O.R. Tambo International Airport to Sandton link in the system was opened just before the 2010 FIFA World Cup. The final leg of this phase, to Johannesburg’s Park Station, was launched in mid-2012. A further set of links that will connect the eastern parts of Pretoria, portions of the West Rand and Soweto are now being planned.
• BRT. Various BRT systems – such as that illustrated on the front cover of this report – are being planned and implemented in Gauteng’s metropolitan municipalities: Ekurhuleni, Johannesburg and Tshwane. They are jointly funded by local and national government. The City of Johannesburg has implemented the first of these systems, the so-called Rea Vaya BRT. Construction started in 2007 and phase 1A – connecting Soweto and the Johannesburg inner city – was completed in 2009. Phase 1B was finalised in early 2014. It also connects the Johannesburg inner city to Soweto but runs to the north past the University of the Witwatersrand (Wits) and the University of Johannesburg (UJ). Construction on phase 1C, which will link Alexandra and Sandton to the existing network, was launched in April 2014.
• Implementation of a Tshwane BRT system, to be named A Re Yeng, is also at an advanced stage. Construction started in April 2013, and a first seven kilometre leg will be completed in 2014. The first A Re Yeng bus was unveiled to the public in April 2014.
• Passenger Rail Agency of South Africa (PRASA) rail modernisation. PRASA is undertaking a complete overhaul of its commuter rail systems in Gauteng, following many years of underinvestment. Indicatively, the last new trains procured for the South African passenger rail network were bought in the mid-1980s, and 98% of the current rolling stock is older than that (PRASA, 2012). In Gauteng, the modernisation programme will focus on the key Mabopane-Pretoria-Germiston-Johannesburg-Soweto corridor. It will see a combination of new rolling stock, the upgrading of track and signalling infrastructure and the redevelopment of stations. The delivery of the first of some 1 200 new train sets (with approximately 7 000 cars) is expected in 2015. These trains are to be procured over a 20-year period. A consortium, majority owned by Alstrom, will eventually produce the fleet locally in a new plant in Ekurhuleni. PRASA has also commissioned Siemens to
upgrade the signalling system, with a R1 billion first phase set to be completed in 2016. Seventy-three stations in Gauteng will eventually be upgraded, with a number (such as Vereeniging, Germiston, Krugersdorp and Pretoria) identified for short-term investment.
• Gauteng Freeway Improvement Project. Led by the South African National Roads Agency (SANRAL), the Gauteng Freeway Improvement Project is a multi-billion rand upgrade of Gauteng’s freeways. Initiated in 2007, the project has involved the widening of a number of highways and the redevelopment of key interchanges, which have historically been the cause of bottlenecks in traffic flow. Future phases of the project envisage further redevelopment and the construction of new freeway links. While it has already had a significant positive impact on congestion on the region’s highway network, the project has not been without controversy because of the associated electronic or ‘open-road’ tolling, meant to recoup the costs of the new infrastructure. The introduction of e-tolls has been marked by public protests and payment avoidance by many users. It might also be critiqued for being internally contradictory, encouraging, at the same time, more car-based travel through its improved road infrastructure as well as a shift to public transport through the taxing of road users.
• Municipal Integrated Transport Plans (ITPs). Matching the large-scale infrastructure projects underway there has been a series of new generation transport plans developed in both local and provincial spheres of government. A number of municipal ITPs, as required by law, were formulated for the period 2003-2008, but these are now well out of date. However, Gauteng’s metropolitan municipalities are in the process of formulating updated ITPs, informed by a recent round of household travel surveys in each metro.
• Long-term integrated transport planning. One of the main initiatives of the GPG over the last five years has been the development of 25-year Integrated Transport Master

CHAPTER 1 IntroductIon: A new ‘Golden erA’ for trAnsport plAnnInG?
3
Plan (ITMP25). The IMTP25 vision is for “an integrated and efficient transport system in Gauteng that promotes sustainable economic growth, skills development and job creation, fosters quality of life, socially includes all communities and preserves the environment” (GDRT, 2013a, p.3). The plan provides a framework – although not an infallible blueprint, given low levels of intergovernmental coordination – to assist all three spheres of government to deliver a world class and sustainable transport system that prioritises public transport.
The ITMP25 presents a paradigm shift in spatial and transport planning. It serves as a point of departure from apartheid spatial planning, land use and mobility, and ushers in an integrated and equitable transport value chain. It is underpinned by founding principles such as economic beneficiation; doing things in a ’smart’ and sustainable manner; and integrating transport networks, modes and services. ismael vadi, gauteng member of the executive council (meC) for roads and transport (gdrt, 2013a, p.x)
The ITMP25 sets out eight long-term interventions (summarised in Table 1.1). Very significantly, the first two interventions – subsidised housing provision in core areas and land use densification – are not transport interventions in and of themselves. Rather, they are proposals for an urban form that both supports and is supported by viable public transport networks. This is a noticeable shift from the private car focused freeway planning of the 1960s and 1970s.
Integrated transport options
Land Use Development
1 subsidised housing provision within urban core areas
2 land use densification in support of public transport
Strategic Public Transport Network
3 reinforcing passenger rail network as the backbone of the system
4 extending the integrated rapid and road-based public transport networks
Freight Transport
5 strengthening freight hubs
Road Transport
6 travel demand management
7 mainstreaming non-motorised transport
8 Continued provincial wide mobility
table 1.1: gauteng 25-year integrated transport interventions (source: gdrt, 2013a, p.x)

Mobility in the GautenG city-ReGion
4
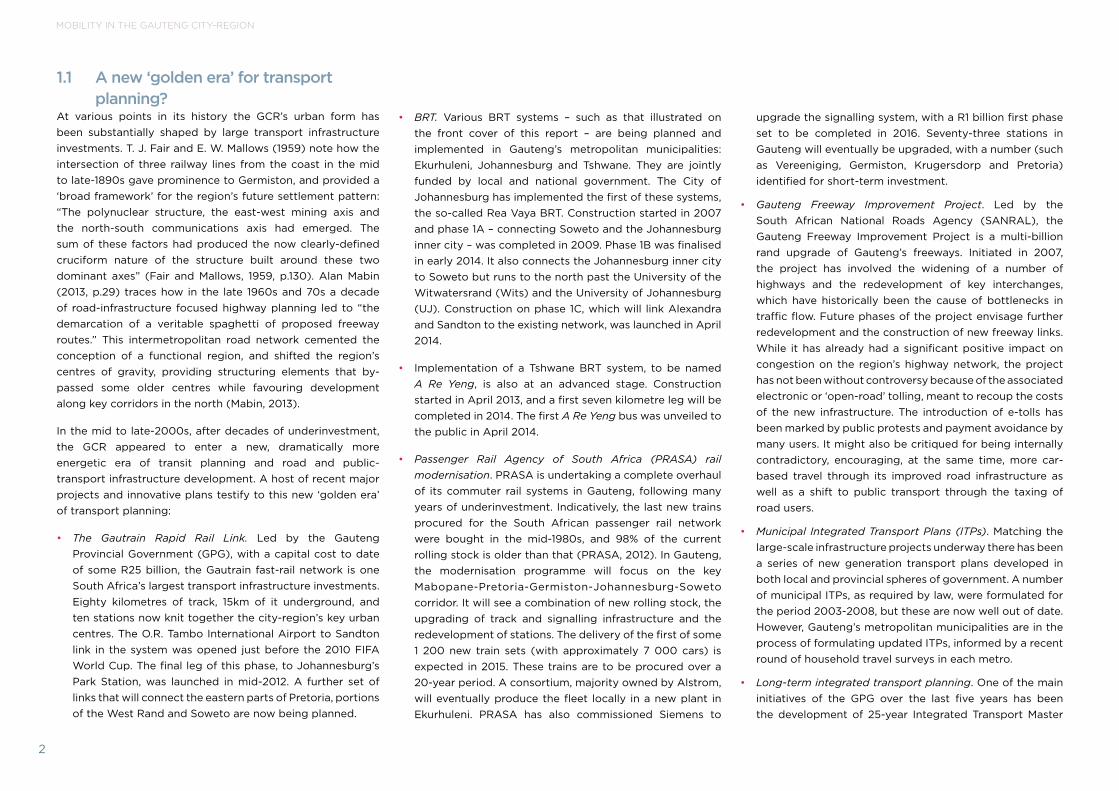
Rail is regarded as the backbone of an integrated public transportation system, with key focus areas being strategic modal transfer nodes and interchanges and priority public transport corridors (see Figure 1.1 and Figure 1.2). Mainstreaming non-motorised transport (NMT) is also identified as one of the main interventions.
• Short to medium-term key interventions. Within the ambit of the overarching ITMP25 planning process, GPG has devised an interim implementation plan to move on a number of interventions it regards as critical. This Five-Year Gauteng Transport Implementation Plan (GTIP5), approved in 2012, identifies 13 urgent short-term initiatives (summarised in Table 1.2) that are currently in the process of being implemented by the Gauteng Department of Roads and Transport (GDRT). Examples include the release for public comment of a draft policy, Promoting Sustainable (Green) Transport in Gauteng, and the launch of a GoGauteng mobile application to help commuters access scheduling information for a number of public transport services, both in April 2014.
Initiatives and key focus areas
1. transport authority for gauteng
1.1 provincial-wide public transport information Centre
1.2 “one province one ticket”
2. integration with the Commuter rail Corridor modernisation project of prasa (passenger rail agency of south africa)
3. restructured subsidised road-based public transport
4. transformation of the taxi industry
5. greener public transport vehicles technologies
6. travel demand management, less Congestion and shorter travel times
7. access to major freight nodes
8. international and City airports
9. pedestrian paths and Cycle ways
10. Continued provincial wide mobility
11. effective management of existing transport infrastructure
12. regulation and enforcement
13. accessible transport
table 1.2: imtp5 key short-term initiatives (source: gdrt, 2013a, p.xiii)

CHAPTER 1 IntroductIon: A new ‘Golden erA’ for trAnsport plAnnInG?
5
• A Gauteng Transport Commission, en route to a Transport Authority. A crucial factor for the successful delivery of an integrated and efficient transport system is a set of institutional arrangements that ensure Gauteng-wide coordinated planning. The IMTP25 proposes the establishment of a Gauteng Transport Commission to advise on how to deal with the immediate transport issues in the province. This has been established and has begun its work, hosting a Cycling Indaba to promote NMT at the end of March 2014. It is envisaged that the commission will eventually evolve into a fully-fledged unitary Transport Authority for the GCR. This reflects a welcome city-regional approach to transport planning and is in line with the recommendations of the OECD Territorial Review of the GCR for a metropolitan transport authority to improve transport coordination and create a single ticketing system (OECD, 2011).
• Integrated transport modelling. GDRT has identified the need for integrated land use and transportation planning and integrated planning tools to inform robust decision-making. A recent report on modelling urban spatial change highlighted the fragmented approach to transport modelling within Gauteng (Wray et al., 2013). Traditionally, GDRT has commissioned provincial transport modelling
from transport consultants. There has also been a varied response to transport modelling at a local government level with a combination of outsourced and internal models and a range of proprietary software. The result has been a disjointed approach, limited modelling capacity and skills development within government, and a mismatch of macro and micro-scale modelling (CSIR, 2012).
In 2012, terms of reference were issued by GDRT for the establishment of the Gauteng Integrated Transport Modelling Centre (GITMC). Its aim is to create a fully operational modelling centre, co-owned, co-funded and co-staffed by a range of provincial and municipal departments. It will provide high-end planning and modelling skills for a variety of macro and micro-modelling support services to role-players across the province (CSIR, 2012). The Council for Scientific and Industrial Research (CSIR), in conjunction with the University of Pretoria, have been appointed to set up the GITMC as a multi-year project. The centre will initially build on the data and models generated by the CSIR UrbanSim and MATSim software urban simulation project. It will formulate urban growth scenarios at a local and provincial level taking into account current and planned transport infrastructure initiatives. The centre is planned to be fully operational by 2014.
It is widely argued that if policies towards spatial planning, infrastructure, and service delivery are devolved to the city-region level and coordinated across relevant local authority
jurisdictions, they may improve the efficiency of labour and housing markets, streamline transport systems, and
generate economic spin-offs through increased productivity, knowledge spill overs, and innovation.
(turok, 2009, p.846)
Mobility in the GautenG city-ReGion
6
figure 1.2: itmp25 proposed railway network (source: gdrt, 2013a, p.42)figure 1.1: itmp25 proposed public transport network (source: gdrt, 2013a, p.39)
CHAPTER 1 IntroductIon: A new ‘Golden erA’ for trAnsport plAnnInG?
7
1.2 Key transport challengesWhile the current investments in transport infrastructure and the energy being put into new plans are both significant, the test of this ‘golden era’ of planning and development will be whether it makes a real and substantial impact on the GCR’s many transport, and associated social, economic and environmental challenges. The challenges are deep and structural, and in some important respects there is evidence of them intensifying.
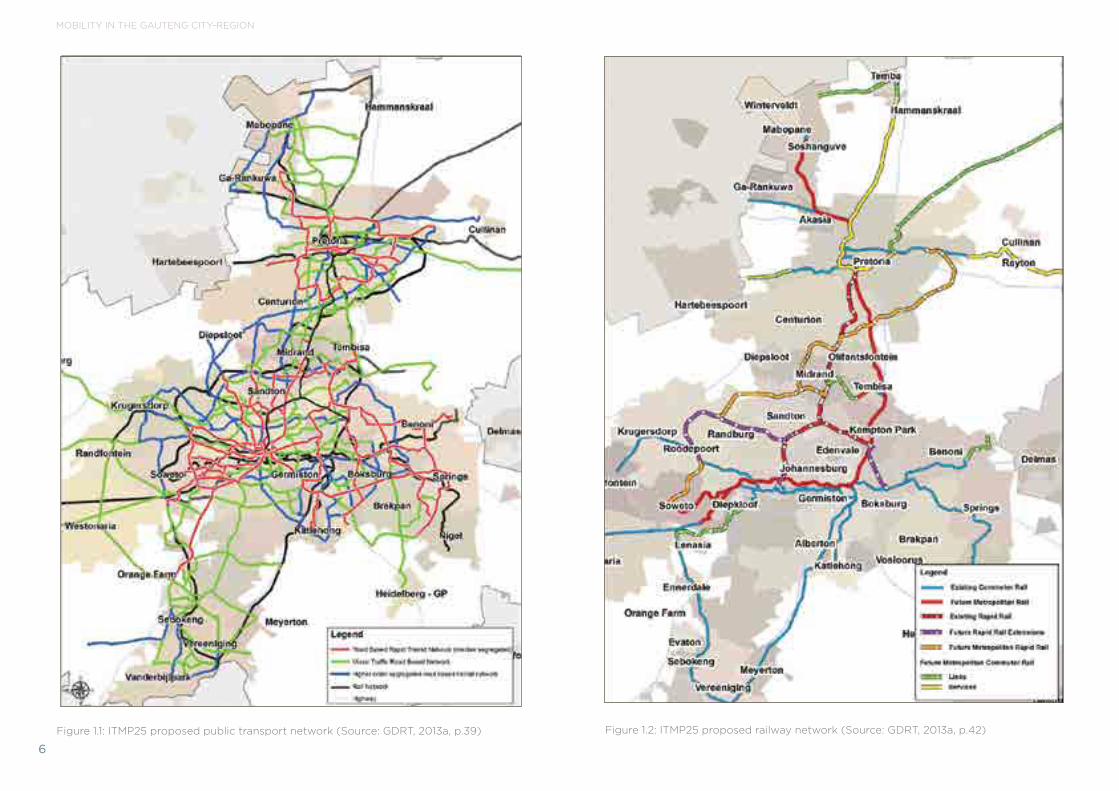
• Modal shifts to less sustainable modes of transport. The transport system designed in the 1960s and 1970s – based on the assumption that road-based transport will be the dominant form of commuting – is no longer optimal. However, over the decades it has facilitated a major shift in the dominant modes of transport in Gauteng. Interestingly, as shown in Table 1.3, the available survey evidence does not indicate a large proportional shift to private vehicles, even though the number of cars on the GCR’s roads has increased dramatically. In the 1970s half of all home-to-work trips were made by private cars. The proportion has dropped slightly to just above 40%. The more dramatic shift has been out of the conventional publicly owned and managed pubic transport systems – bus and rail – and into the privately owned form of public transport offered by minibus taxis (see Table 1.3). The main reason for this shift has been the continued deterioration in the quality and reliability of metropolitan commuter rail and bus services (GDRT, 2013a). While the Gautrain and BRT infrastructure investments aim to arrest this drift and provide more public transport choice, they will for the foreseeable future only address the needs of a limited social and demographic market, and will not do much to address the needs of poor and peripherally located households.
Walk Rail Taxi Bus Private
1975 pretoria-witwatersrand-vereeniging (pwv) transportation survey 7% 20% 3% 22% 49%
1999/2003 1998/99 tshwane survey and 2002/03 gauteng transport survey for the gts 2000 survey 9% 6% 31% 6% 48%
2003 national household travel survey 11% 9% 31% 6% 42%
2009 gCro’s Quality of life (Qol) survey (gauteng results only) 10% 4% 41% 4% 41%
2011 gCro’s Qol survey 6% 5% 42% 3% 43%
2013 national household travel survey 13% 7% 30% 5% 44%
table 1.3: modal split in mode of transport to work, 19751, 1999/20032, 20033, 20094, 20115 and 20136 (note: the surveys are not strictly comparable because of different samples and ways of asking questions; the results should be taken as indicative of broad patterns only)
1 PWV Transportation Survey, 1975. This was based on 10 080 households surveyed in the Pretoria area and a further 5 500 in the rest of the PWV area (Gauteng Department of Public Transport, Roads and Works, 2006).
2 The GTS 2000 data is based on two large transport surveys, a 7 569 sample Household Survey in and around Tshwane in 1998/99, combined with a 15 375 sample survey in the remainder of Gauteng in 2002/03.
3 This survey was conducted across the country in 2003. Of a national sample of 45 346 completed household surveys, 7 906 were enumerated in Gauteng (National Department of Transport, 2007).
4 Own workings from GCRO’s 2009 QoL Survey. These figures reflect respondents from Gauteng only. Only cases of respondents who travelled to work were selected, giving a working sample of 2 334 within the total Gauteng sample of 5 822.
5 Own workings from GCRO’s 2011 QoL Survey. Only cases of respondents who travelled to work were selected giving a working sample of 5 957 within a total Gauteng sample of 16 729 respondents.
6 This survey was conducted in 2013, with results released in March 2014. Gauteng saw a sample of 10 683 dwelling units (StatsSA, 2014).

Mobility in the GautenG city-ReGion
8
• Ongoing sprawl and relatively low density development. The transport mode being used will reflect the choices of commuters over the quality of the services being offered, their affordability, and of course the ability of the networked services on offer to take them to their preferred destination. A very important consideration is overall access to a particular mode, usually established by means of data on how far a commuter needs to walk to the nearest service point, whether it be a bus stop, train station, or a taxi rank. It is conceivable that the infiltration of more agile minibus taxi networks into previously unserviced areas may be reducing average travel times for many residents. But the latest data from the National Household Travel Survey 2013 points to a worrying trend of greater walking times to public transport. In 2003, 11.3% of Gauteng home-to-work commuters walked more than 15 minutes to a public transport stop at the start of their journey. In 2013 this had increased to 17%. This suggests that even while public transport services are being improved, accessibility is declining (StatsSA, 2014).
A key reason for this is the ongoing spatial distortions in the GCR’s settlement patterns. Massive Reconstruction and Development Programme (RDP) housing developments on the fringes of the city-region have not coincided with the provision of public transport in these areas, leading to inaccessible and poor access/poor mobility townships (see chapters 2 and 3 of this report). In addition, a swathe of gated communities has redefined residential landscapes in Gauteng over the last decade. Densities in these estates are too low to support a viable public transport network,
but too high for the road network to cope given the inevitable generation of car-based trips. Current land use patterns and resulting traffic congestion are antithetical to sustainable long-term economic growth and development in Gauteng, and it is this that key interventions in the ITMP25 aim to correct (Van der Merwe, 2013).
• Affordability. According to the OECD, commuting in GCR cities ranks as the least affordable in Africa, with 21% of monthly income spent on transport (OECD, 2011) – this prior to the introduction of e-tolling on upgraded highways. Latest evidence from the National Household Travel Survey released in March 2014 indicates that train commuters spent an average of R466 per month on this mode of transport; bus commuters spent R580 per month and taxi commuters R625 per month. By contrast, car drivers spent R1 727 per month. The survey also finds that 44% of Gauteng households had monthly household expenditures of less R1 800 (StatsSA, 2014). Indicatively this suggests that public transport costs were upwards of 26% of monthly household expenditures for nearly half of Gauteng households.
• Still inadequate resources for transport infrastructure. The roll out of the Gautrain system and the municipal BRT initiatives by the metropolitan municipalities of Ekurhuleni, Johannesburg and Tshwane testify to the financial commitment of local, provincial and national government to invest significantly in new transport infrastructure in Gauteng. Transport Minister Dipuo Peters recently reported that more than R5 billion would be spent in 13 South African cities on planning, building and operating integrated
public transport networks in the 2013/2014 financial year (Venter, 2013a). However, while current funding allocated to transport infrastructure and operations has grown rapidly over the last decade, it is still far from sufficient. Inadequate funding is one of the key challenges identified in the ITMP25. According to the project manager of the ITMP25 process, Jack van der Merwe, transport budgets ideally need to be doubled in the short term and increased to four times the current level over 25 years (Van der Merwe, 2013).
• Poor intergovernmental coordination. Another constraint is the fact that the existing transport systems in the GCR are not well integrated, with overlapping roles of national, provincial and local transport departments and a lack of co-ordination between municipalities, leading to a fragmented approach to transport planning (OECD, 2011). A recent example of the lack of co-ordination between the transport departments within the GCR is a series of household travel surveys conducted in the three metropolitan municipalities in Gauteng. Each of the metros has run separate transport surveys to assist with formulating revised their ITPs. While some effort was made to standardise questionnaires and sample frames between the municipalities, each municipality by and large took its own approach in relation to sampling and the definition of destination points, which means there are likely to be limitations on data integration and aggregation. This has consequences for Gauteng-wide modelling required by GDRT and limits the analysis of the immense traffic flow between the metros as highlighted in Figure 1.4.

CHAPTER 1 IntroductIon: A new ‘Golden erA’ for trAnsport plAnnInG?
9
figure 1.3: major transport infrastructure in the gCr (source: gauteng department of roads and transport)

Mobility in the GautenG city-ReGion
10
• Insufficient GCR-wide planning. Transport planning also needs to take note of the wider GCR connections and daily external flow of both people and goods into and out of Gauteng. For example, the Moloto corridor connects a swathe of semi-urban settlements situated in the Thembisile and J.R. Moroka local municipalities in Mpumalanga on the north-eastern border of Gauteng. This corridor provides a vital connection for these settlements
to the Gauteng economy through subsidised bus transport routes, which have historically ferried thousands of workers into central Pretoria on a long-distance daily commute. According to the National Minister of Transport, Dipuo Peters, “Commuters spend long hours in transit, with some, in extreme cases, spending up to seven hours per day on buses” (Venter, 2013a, p.1).
figure 1.4: transport flows into and within the three gauteng metros according to 2011 Qol survey data
CHAPTER 1 IntroductIon: A new ‘Golden erA’ for trAnsport plAnnInG?
11
1.3 Overview of this reportThis report is framed in the context of this remarkable moment, which sees enormous energy and resources being put into new and forward-thinking transport plans, as well as large-scale and often region-wide transit infrastructure, but also intensifying challenges. It is not within the scope of a report such as this to review every strategic intervention, nor critically assess every challenge. However, a wide-ranging analysis of the current ‘state of mobility’ in the GCR, and the impact of key infrastructures – or the consequences of their absence – is warranted.
This report collects a number of papers written as part of a multi-year GCRO project on mobility in the GCR. The aim of the project was to: i) better understand the historical and current transport trends, based primarily on an analysis the GCRO’s own datasets, in particular the transport questions in a bi-annual QoL Survey; and ii) gauge the impact of key transport infrastructure interventions and the effects of a lack of infrastructure in some areas.
In 2011 GCRO appointed UJ’s Department of Civil Engineering Science and Department of Geography, Environmental Management and Energy Studies, to carry out transport research in the GCR using the 2009 QoL Survey and previous transport surveys such as the GTS 2000 and the 2003 National Household Travel Survey. Key snippets from the UJ research (McKay and Simpson et al., 2013) appear in this report as extracts and boxes, providing an insightful historical perspective on transport challenges in the region.
In 2012 Professor Christo Venter from the University of Pretoria was commissioned to develop a report for GDRT analysing data from the transport sections of the 2011 QoL Survey. This
analysis is presented here as Chapter 2. The chapter examines transport patterns (including mode use, trip purposes, travel distances and speeds); satisfaction and perceived problems with transport; and the spatial variation of these patterns across the province. Data across municipalities and different types of urban settlement typologies are compared in order to identify underlying spatial factors affecting travel patterns. The chapter concludes by reflecting on the implications of the findings for transport planning and spatial development policy in Gauteng.
This initial broad analysis of the 2011 QoL transport data is further extended in Chapter 3, where Christo Venter develops a ‘Quality of Transport’ (QoT) Index. The intention of the index is to provide a single measure reflecting residents’ everyday lived experiences of the quality of their transport in 20 ‘priority townships’ identified by the GPG. The construction of the index is driven by the understanding that transport access and connectivity issues are key to the quality of life enjoyed by residents in specific areas. Transport realities vary considerably across the city-region and the QoT Index gives a useful single measure of this variation.
In Chapter 4, GCRO researcher Guy Trangoš provides a multi-scalar analysis of four Gautrain stations, interrogating the quality of the public realm created by the stations’ designs and their integration into the immediate surrounding precincts. The analysis is underpinned by a brief review of the historical context of transport planning and the development of spatial policies by local government in response to the implementation of the Gautrain infrastructure. Recommendations for similar projects in the future are offered in the closing section –
valuable research to be considered by authorities should the proposed extensions to the Gautrain go ahead.
An often ignored but, from a sustainability perspective, an increasingly important aspect of transport is NMT. This report concludes with two NMT chapters by GCRO researcher Christina Culwick. Chapter 5 explores the state of NMT in the GCR. It reviews the current policy environment supporting NMT; provides a demographic profile of typical NMT ‘users’, focusing on the poor who use NMT out of necessity rather than choice; and assesses current NMT infrastructure projects. In its conclusion the chapter highlights the transitions needed to facilitate greater uptake and a modal shift towards NMT as a legitimate component of an integrated transport system.
The challenges and potential opportunities for the future of NMT in the city-region are visually portrayed in the form of a photo essay in Chapter 6, the final chapter of this report.
Within the frame of the enormous scale of transport planning and infrastructure development underway, as well as the GCR’s many deep and enduring transport challenges, it is hoped that this report will make a contribution to understanding past and current trends, the impact of and (missed) opportunities in key infrastructure investments, and some of the key current priorities that need more attention in this new ‘golden age’ of transport planning.
Not all transport dreams can be fulfilled:
priorities are key. (npC, 2011, p.163)

Mobility in the GautenG city-ReGion
12
Beyond ‘predict and provide’? insights from a comparison of historical surveys
in an earlier phase of its ‘mobility in the gCr’ project, gCro commissioned a group of academics from uJ to analyse historical transport surveys, and to compare results from these with data from the gCro’s 2009 Qol survey. the academics, from uJ’s department of Civil engineering science and department of geography, environmental management and energy studies, worked with contracted experts and graduate students to assemble and interrogate the historical data, inter alia from the pwv transportation study of 1975. ultimately, the analysis concluded that the historical surveys were too different in scope and sampling methods for meaningful comparisons to be made with the more recent 2009 survey. nevertheless, the report – Mobility in context: overview and analysis of transportation data for Gauteng (1975-2009) – offered some important insights. these include:
The old political regime (and, in some instances, the post-apartheid regime as well) adopted the ‘predict and provide’ method by which important decisions regarding the design and upgrade of transportation networks were made. However, the ‘predict and provide’ method relies heavily on the collection of reliable transportation data. One means of collecting such data is through the use of transport surveys. These surveys are then used to predict the challenges facing the transport sector so as to guide the development of solutions to these challenges. …
Overall, the ‘predict and provide’ method has resulted in government simply providing more road infrastructure, with a specific focus on private vehicles and, as of late, trucking. The Gauteng Freeway Improvement Project is a recent example of this. It is crucial to start to question if this is an effective solution to the challenges facing commuters (Rodrigue, Comtois and Slack, 2006). It is argued here that, in order to successfully manage a region’s transport system, greater focus should be placed on implementing strategies that will limit growth in the number of motor vehicles on the road. … One strategy that can address this challenge is increasing the usage of public transport and another is re-thinking the urban planning models that have been in use. (mcKay and simpson et al., 2013, p.1)

13graeme gotz

Mobility in the GautenG city-ReGion
original photo: hao-ting wong

Chapter 2 2011 gcro quality of life survey: analysis of transport data
15
2011 GCRO Quality of Life Survey: Analysis of transport dataChristo venter and willem Badenhorst
2.1 IntroductionThe Gauteng City-Region Observatory (GCRO) has commissioned two Quality of Life (QoL) Surveys, in 2009 and 2011, which measured the socio-economic circumstances, perceptions of service delivery, values, psycho-social attitudes, and other characteristics of residents in the Gauteng City-Region (GCR). The two surveys asked respondents a series of questions about their trip-making behaviour and their perceptions of transportation in the city-region. The 2011 survey covered 16 729 sample points, with Global Positioning System (GPS) points at respondents’ houses and trip destination points captured from a suburb-level list. This chapter provides an analysis of the 2011 QoL Survey, with the main aim of providing an up-to-date picture of travel patterns and opinions regarding transport and mobility in the province. Apart from standard tabulations of travel patterns and opinions across user groups and municipalities, we undertake a more in-depth exploration of the realities of access and mobility across different types of settlements in Gauteng.
2.2 Key findingsThis section provides an overview of key transport-related findings for Gauteng from the 2011 QoL Survey, comparing the findings across municipalities wherever appropriate. All analysis is based on the weighted dataset and is thus representative of the surveyed population (18 years and older) at provincial and municipal level.
Sections 2.2.1 - 2.2.5 refer to a single trip described by each respondent in the survey. Respondents were asked about “the trip that you make MOST often, that involves using transport (taxis or cars or trains and so on).” No information was gathered about the relative frequency of the trip (i.e. how often it is made), so aggregate statistics calculated on this sample of trips do not reflect the population of all trips in the province. However, the data are useful for comparing across subgroups of trips in the sample, such as trips by mode or trip purpose.

Mobility in the GautenG city-ReGion
16
2.2.1 main trip purposeFirstly, only about half of the trips people regard as their most frequent trips are to work, followed by shopping (21% of trips) and looking for work (12% of trips). The conventional focus of transport planning, which is very oriented towards the trip to work, misses major components of daily mobility. Secondly, about 12% of the sample identified the trip to look for work as their most frequent trip. Travel to look for work is of major importance to a sizable number of people, yet has received little attention in policy or planning.
The figures above differ slightly from the main trip purposes identified by the National Household Travel Survey (NHTS) for Gauteng in 2003 (Table 2.1). In this survey respondents were asked to identify the purpose of all trips made by all household members on a particular day, thus more accurately reflecting the true distribution of trip purposes. In particular, the GCRO QoL data undercount school travel, as it only relates to the most frequent trip of the respondent, who by definition in this survey was a household member 18 years and older, and not necessarily those of children in the household (refer to section 2.2.6 for more on school travel).
2.2.2 mode used for main trip purposeRespondents were asked which modes they used while making the most frequent trip. Figure 2.2 shows the mode used over the longest distance of that trip – referred to as the main mode from here onwards.7
9% other
48% work
12% look for work
6% education
21% shop
2% serve children
2% social/leisure
figure 2.1: trip pupose of most frequent trip
7 Note that the figures do not necessarily correlate to the overall percentage of people using a particular mode.

Chapter 2 2011 gcro quality of life survey: analysis of transport data
17
Cars and taxis8 dominate across all trip purposes. For getting to work, cars and taxis are equally important. Taxis are a very important mode for work-seekers, with almost three out of four work-seekers depending on a taxi. Taxis are also used for a variety of other purposes such as education and shopping/leisure trips. Buses and trains play a minor role across all trip purposes.
A relatively small share of most frequent trips are made by only walking. However, it is likely that the importance of walking is underrepresented here as it does not reflect the walking component to and from public transport. Furthermore, many respondents might not have thought of walking as ‘transport’ and therefore not reported walking trips even if they were the most frequent.
Trip purpose % of household members naming purpose
work 39.3%
education 29.9%
shopping 44.1%
visiting 33.9%
table 2.1: trip purposes of all household members, nhts 2003 (source: dot, 2005)
figure 2.2: main mode used for most frequent trip
all trips
other
shopping/leisure
education
look for work
work
8 33 50 3 5
9 33 50 2 3
9 28 57 2 3
13 32 44 5 6
6 9 73 2 9
6 42 42 3 5
0 10 20 30 40 50 60 70 80 90 100
percentage
walk Bicycle Car/motorbike taxi Bus/Brt train other
8 Taxis refer to minibus taxis.

Mobility in the GautenG city-ReGion
18
To identify the incidence of multimodal trips, i.e. trips that make use of more than one mode, we examined the combinations of modes reported. Only 3.4% of respondents make use of both public transport and cars on their most frequent trip, probably reflecting the role of public transport as a ‘mode of captivity’ that is abandoned altogether as soon as a car is bought. Among multimodal trips from one public transport mode to another, taxi-and-train is the most common combination (10.6% of trips). Transferring between other combinations of modes is rare.
Combination of modes % of respondentsWalk only 10.2%
Car only (driver or passenger) 29.7%
Public transport only 56.7%
taxi only 42.0%
Bus only 1.9%
train only 2.5%
taxi and bus 0.6%
taxi and train 10.6%
Bus and train 0.1%
Car and public transport 3.4%
table 2.2: mode combinations (excluding ‘other’)
To examine the distribution of public transport use across income groups, Figure 2.3 plots the answer to the question “Do you ever use public transport?” by monthly household income. It is clear that public transport use is very skewed towards lower income respondents, with 70% or more of people with household incomes below R6 400 per month using public transport. Above this income threshold of R6 400, public transport use drops off significantly to 60%, and then further to below 40% in the next bracket. The threshold of R6 400 evidently corresponds to the income level at which car ownership starts to become feasible, causing a shift away from public transport use.
Two other observations are significant. Firstly, about 30% of people reporting no income do not use public transport at all, suggesting a tendency to walk or to curtail travel if public transport is unaffordable. Secondly, even in the highest income brackets, between 10% and 20% of people still use public transport, although this may not be daily, and might refer to Gautrain use. The implication is, however, that a willingness to use public transport exists among a portion of even the very affluent.
figure 2.3: public transport use by monthly household income
use public transport does not use public transport
100
80
60
40
20
0
no
inco
me
r1
- r
40
0
r4
01
- r
80
0
r8
01
- r
1 6
00
r1
60
1 -
r3
20
0
r3
20
1 -
r6
40
0
r6
40
1 -
r12
80
0
r12
80
1 -
r25
60
0
r25
60
1 -
r51
20
0
r51
20
1 -
r10
2 4
00
r10
2 4
01
- r
204
80
0
r20
4 8
01
or
mo
re
res
po
nse
no
t g
iven
per
cen
tag
e 71
29
83
17
86
14
81
19
82
18
76
24
58
42
34
66
21
79
13
87
22
78
16
84
65
35

Chapter 2 2011 gcro quality of life survey: analysis of transport data
19
2.2.3 trip purpose and mode use by sexFigure 2.4 examines differences in trip purposes (of the most frequent trip) between men and women in the sample. It shows that men tend to make more work trips (56% vs. 41% of trips), while women make significantly more trips to do shopping (27% vs. 14%), taking children to school (3% vs. 1%), and other (10% vs. 8%). This suggests that women in South African cities still tend to undertake more household-related travel, while men do more work travel. Women and men have similar proportions of travel looking for work, perhaps pointing to the mounting pressures women face to find employment as either the primary breadwinner or secondary worker in the family.
figure 2.4: trip purpose of most frequent trip, by sex
8% other
56% work
13% look for work
6% education
14% shop
1% serve children
2% social/leisure
10% other
41% work
11% look for work6% education
27% shop
3% serve children
2% social/leisure
male female
Mobility in the GautenG city-ReGion
20
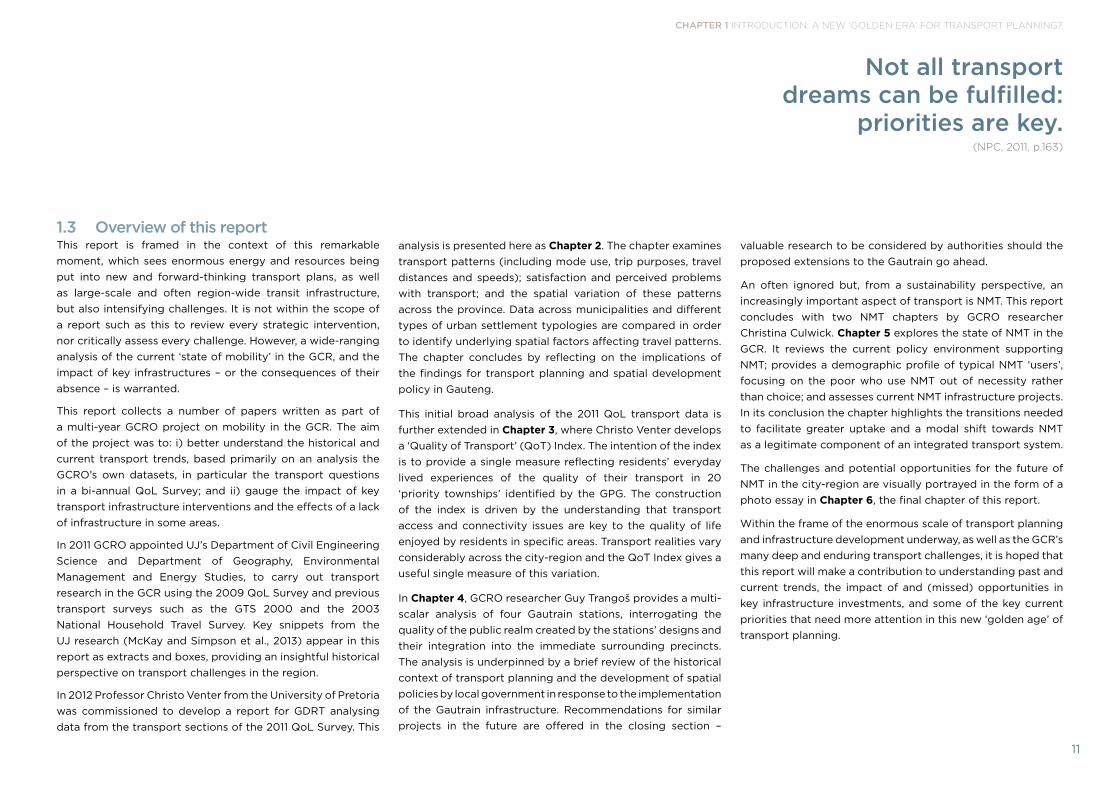
These differences in trip purposes between men and women also lead to differences in mode use. Figure 2.5 shows that women tend to use taxis more frequently for work, looking for work and shopping/leisure trips, as compared to men. Coupled with the higher incidence of shopping/leisure travel among women, this means that women make significantly more trips by taxi than men. Men tend to have a higher use of cars across all trip purposes. The implication is that any transport policies or interventions that affect the quality or cost of public transport services – especially taxis – have significant gender implications.
2.2.4 mode to work, by municipalityLooking at the main mode for work trips by municipality (Figure 2.6) it is clear that mode use varies across different parts of the province. Cars are more important in the higher-income municipalities of Midvaal, Tshwane, Johannesburg and Mogale City, while taxis dominate elsewhere. Train use closely follows the availability of the Metrorail network in
various parts of the province.
figure 2.5: main mode used for most frequent trip, by sex
percentage
walk Bicycle Car/motorbike taxi Bus/Brt train other
all trips (f)
all trips (m)
shopping/leisure (f)
shopping/leisure (m)
look for work (f)
look for work (m)
work (f)
work (m)
0 10 20 30 40 50 60 70 80 90 100
6 10 69 12
6 8 77 7
10 31 53 3
9 27 59
7 30
8 37 46 6
54 4
6 38 47 5
7 46 38 5

Chapter 2 2011 gcro quality of life survey: analysis of transport data
21
figure 2.6: main mode used for work trips, by municipality
2.2.5 average travel timeRespondents were asked to estimate how long it took them to reach their destination during the trip they undertook most frequently. Figure 2.7 and Figure 2.8 show the average travel time for the three main trip purposes by municipality.
Reported travel times vary slightly across the metropolitan municipalities. Travellers in Tshwane travel longest to get to work, but shortest to shopping places. Johannesburg residents take the longest to travel to shopping destinations. Overall, though, the similarities in travel times are striking.
Non-metro areas differ more significantly. West Rand residents (including Westonaria, Mogale, Merafong, and Randfontein) have shorter travel times to work/job search destinations, but longer shopping destination travel times, as compared to residents of Sedibeng District (Midvaal, Emfuleni and Lesedi). However, we would caution against drawing solid conclusions from this travel time data, as there is reason to doubt the accuracy of the travel times reported by respondents in this format (principally because the question wording did not follow standard practice in travel survey methodology, and the sample sizes for specific trip purposes in some municipalities are too small to support strong analysis).
gauteng (n=5 955)
westonaria (n=95)
tshwane (n=1 399)
randfontein (n=76)
mogale (n=216)
midvaal (n=49)
meratong (n=143)
lesedi (n=44)
Johannesburg (n=2 217)
emfuleni (n=450)
ekurhuleni (n=1 265)
0 10 20 30 40 50 60 70 80 90 100
percentage
walk Bicycle Car/motorbike taxi Bus/Brt train other
42 42
29 51
46 40
47 41
44 44
59 29
36 39
34 57
42 42
37 50
41 42

Mobility in the GautenG city-ReGion
22
figure 2.7: average travel time (minutes) for the three main trip purposes in metros figure 2.8: average travel time (minutes) for the three main trip purposes in district municipalities
work look for work shopping
ekhurhuleni Johannesburg tshwane
60
50
40
30
20
10
0
min
ute
s
43 4446
49 47 46 47
4042
average travel time (minutes)average travel time (minutes)
work look for work shopping
west rand district sedibeng
60
50
40
30
20
10
0
42
4745
52
34
44
min
ute
s
Chapter 2 2011 gcro quality of life survey: analysis of transport data
23
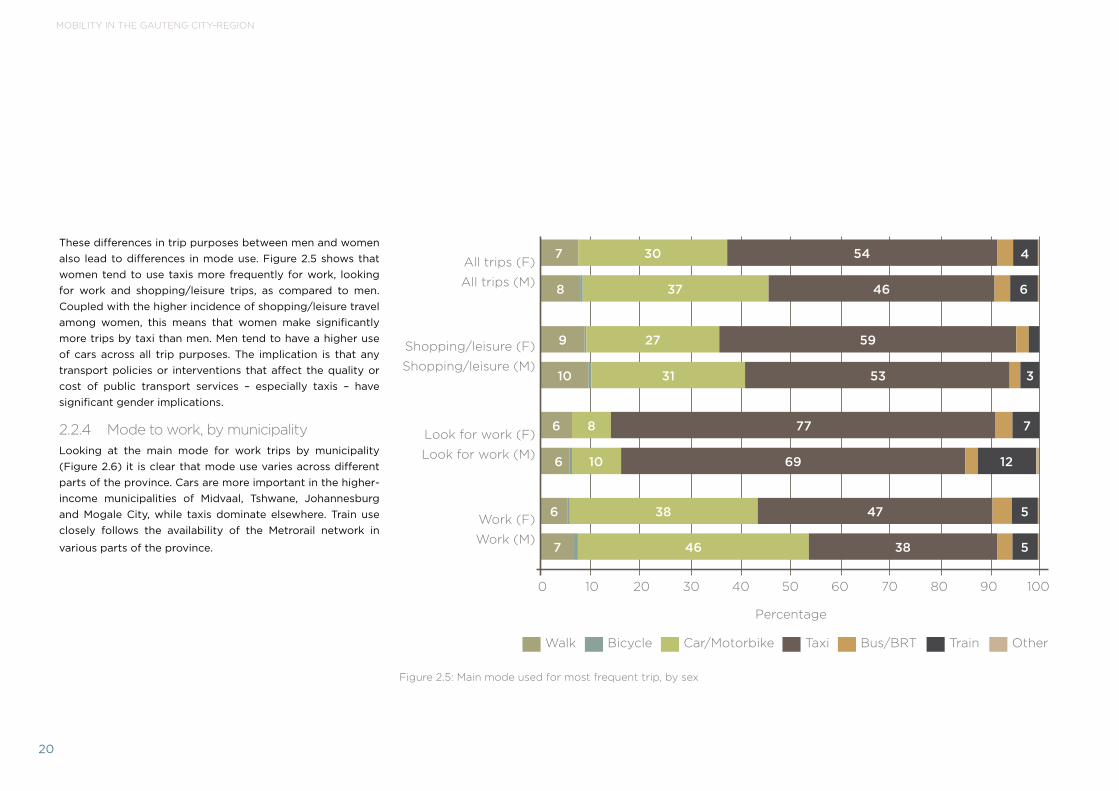
2.2.6 school travelThe survey asked respondents specific questions about the travel conditions of school-attending children in the household (alternating between the eldest and the youngest child). In total, 37% of respondents reported that their households had one or more children in school, making school transport an important issue in the province.
About half of trips to school are made on foot, and Figure 2.9 shows that a smaller proportion of trips are made by car, taxi and school bus. However, public transport also plays an important role in providing children with access to education in Gauteng: about a quarter of school children in the sample use taxis, buses or trains. School buses transport about 8% of school children to school. Only 2% of children use bicycles.
figure 2.9: main mode for trips to school
1% train
51% walk
2% Bicycle
19% Car/motorbike
15% taxi
8% school bus
3% other bus1% other

Mobility in the GautenG city-ReGion
24
Figure 2.10 plots the distribution of the time between when children leave home, and the start of school (here called ‘time to school bell’), for users of different modes. The evidence indicates that transport conditions require many children to leave home very early to get to school, although we cannot be sure, on the basis of the way the question was asked, that children did not arrive at school in good time well ahead of the start of classes. Approximately 42% of children travelling by bus have to leave more than an hour before the school bell. This is slightly less for those travelling by taxi (39%), while 29% of those travelling by car spent more than an hour on the road. Being driven to school by a parent evidently still requires many children to leave very early. Children who walk to school are, interestingly, best off: only 14% leave home more than an hour before the bell.
figure 2.10: time between leaving home and school bell, for all school trips
Bus time to school bell
50
40
30
20
10
0<15 min
15-30 min
31-45 min
46-60 min
>60 min
per
cen
tag
e
50
40
30
20
10
0
walk time to school bell
<15 min
15-30 min
31-45 min
46-60 min
>60 min
per
cen
tag
e
taxi time to school bell
50
40
30
20
10
0<15 min
15-30 min
31-45 min
46-60 min
>60 min
per
cen
tag
e
50
40
30
20
10
0
Car time to school bell
<15 min
15-30 min
31-45 min
46-60 min
>60 min
per
cen
tag
e

Chapter 2 2011 gcro quality of life survey: analysis of transport data
25
2.2.7 access to public transportThe QoL Survey measured access to public transport by asking respondents to estimate the walking time from their house to the nearest taxi stop, bus stop or train station. The results show that public transport access in Gauteng is reasonably good (see Figure 2.11). Overall, almost three-quarters of households live within a ten minute walk of a public transport service, and 95% live within a 30 minute walk (about two kilometres).
These figures correspond well with the NHTS findings from 2003, which indicated that 91.8% of Gauteng households live within a 30 minute walk from public transport. Gauteng outperformed other provinces on this measure. However, public transport access is somewhat uneven across the province. Access is better in metropolitan municipalities than in district municipality areas, with Lesedi, Midvaal and Mogale City performing worst. In Midvaal, for example, 47% of households live further than 10 minutes from public transport.
The number of respondents who could not answer this question reflects people who either have no knowledge of public transport, or have no public transport within a walkable distance from their home. This percentage ranged between 10% of respondents (in Lesedi) and 24% (in Midvaal), with an average of 13% for Gauteng. Figure 2.11 excludes these figures.
figure 2.11: walking time to nearest public transport, by municipality
100
80
60
40
20
0
eku
rhu
len
i
em
fule
ni
Joh
ann
esb
urg
les
edi
mer
afo
ng
mid
vaal
mo
gal
e
ran
dfo
nte
in
tshw
ane
wes
ton
aria
gau
ten
g
per
cen
tag
e
75
21
4
66
30
4
75
20
5
63
26
12
68
26
5
53
37
11
62
30
8
74
21
5
70
25
5
64
30
6
72
23
5
within 10 minutes 11-30 minutes more than 30 minutes

Mobility in the GautenG city-ReGion
26
2.2.8 household expenditure on transportRespondents were asked to estimate the total amount their households spend on transport each month. Recent research on expenditure questions in travel surveys suggests that responses to such questions frequently have large measurement errors (Behrens and Venter, 2006). Nevertheless, even if the absolute numbers are questionable, they might give useful insight when compared across subgroups of the sample.
Figure 2.12 shows the percentage of households spending more than specified amounts on transport monthly. Car users spend more on transport than public transport users, which is to be expected although car costs are usually greatly underestimated by respondents with cars. Interestingly, residents of metropolitan areas spend about R200 more on transport per month than residents of non-metro municipalities. This could reflect either more trips being made, or longer distances travelled in metro areas as compared to non-metro areas.
However, the higher costs of car use are offset by income differences. Car users have much higher incomes than public transport users – about 40% of metro car users spend more than 10% of their (approximate) median incomes on transport. This rises to 55% for non-metro car users, and almost 80% for public transport users.
figure 2.12: percentage of households spending more than specified amounts on transport per month
public transport users (metro) public transport users (non-metro)Car users (metro)Car users (non-metro)
10% of median income
r200 r400 r600 r800 r1000 r1500
100
80
60
40
20
0
per
cen
tag
e
Chapter 2 2011 gcro quality of life survey: analysis of transport data
27
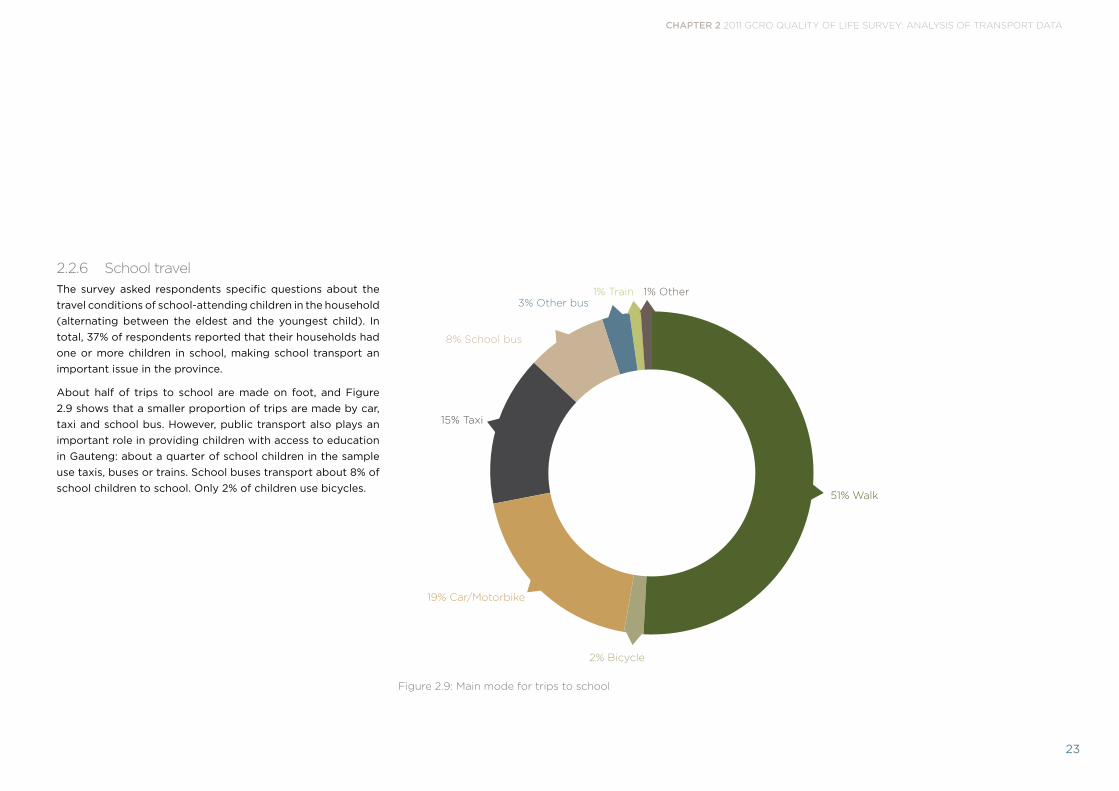
2.2.9 satisfaction with transportTo gauge people’s general satisfaction with transport, respondents were asked to rate their satisfaction on a five-point Likert scale (from very satisfied to very dissatisfied) with the type of transport they most frequently use. Results are shown in the figures below (see Figure 2.13, Figure 2.14 and Figure 2.15).
In general, satisfaction with transport is highest in Midvaal, Merafong, Lesedi and Randfontein municipalities, and lowest in Ekurhuleni, Johannesburg and Mogale City. These figures do not correlate well with other more objective measures of transport service quality mentioned before, such as public transport coverage and travel times, although it needs to be borne in mind that the graph (Figure 2.13) does not distinguish between public and private modes. Expectations might also be different in metropolitan and non-metro areas. Overall, however, people seem relatively satisfied with the transport they use. On average, 75% of respondents described themselves as either satisfied or very satisfied with their transport.
Satisfaction does not vary much by sex, as indicated in Figure 2.14.
figure 2.13: satisfaction with transport, by municipality
figure 2.14: satisfaction with transport, by sex
female
male
0 10 20 30 40 50 60 70 80 90 100
percentage
very satisfied satisfied neither dissatisfied very dissatisfied
15 60 11 11 4
17 59 9 11 4
westonaria
tshwane
randfontein
mogale
midvaal
meratong
lesedi
Johannesburg
emfuleni
ekurhuleni
0 10 20 30 40 50 60 70 80 90 100
percentage
very satisfied satisfied neither dissatisfied very dissatisfied
33 48 9 9
17 65 8 7
21 62 8 8
18 60 6 14
31 55 6 6
20 66 6 7
32 50 8 3
14 61 10 11
26 49 11 11
13 54 12 16

Mobility in the GautenG city-ReGion
28
figure 2.15: satisfaction with transport, by mode (note: *sample<30)
Satisfaction with transport varies markedly, however, depending on the mode people use (Figure 2.15). Car users are the most satisfied with their transport, and more so if the respondent is a driver (92% are satisfied) rather than a passenger (88%) or lift club member (82%). Motorbike users (86% satisfied) are also satisfied with transport conditions. Evidently the freedom and flexibility offered by a private car counts for much in people’s subjective perception – the very thing that is difficult to offer with public transport options.
Ignoring the modes with very small sample sizes, most dissatisfied are train users (57% satisfied), walkers (66% satisfied), and taxi users (67% satisfied). Only 20% of taxi users said they were dissatisfied or very dissatisfied with their mode.
2.2.10 main problems with public transportPublic transport users were asked for the main problems they experience on a regular basis. Table 2.3 shows the results by municipality, and Table 2.4 by mode. Both tables, and those that follow below, show the ‘degree of severity’ with a colour scale, with low percentages in green and high percentages in red. Problems differ somewhat depending on where people live. Residents of the metros were more concerned with the high cost of transport, rude drivers/passengers and unreliable service. In non-metro areas, problems with unroadworthy vehicles, reckless driving and rudeness dominate. These
satisfied neutral dissatisfied
other
other bus
school bus*
Brt/rea vaya bus*
gauteng*
train
taxi
Car passenger, lift club
Car as passenger
Car as driver
motorbike
Bicycle
walk
0 10 20 30 40 50 60 70 80 90 100
percentage
79 13 8
78 5 17
93 7
58 21 21
68 31
57 15 27
67 12 20
82 7 11
88 8 5
92 4 3
86 8 6
85 11 3
66 14 21

Chapter 2 2011 gcro quality of life survey: analysis of transport data
29
trends are consistent with higher use of taxis in non-metro areas. Interestingly, most people do not consider crime and security on public transport as a major problem.
Table 2.4 further explains some of the key public transport issues faced by commuters in Gauteng. Expensive fares are considered the most important problem by taxi users. Among bus and train users the problem is not cost, but reliability. These findings are consistent with the state of operations in these industries: bus and train fares are kept low by state subsidies, but taxi fares are not. Given that the taxi is the key provider of mobility for 42% of workers, 73% of work seekers, and 50% of all trips in Gauteng (Figure 2.2), affordability of taxis is clearly an issue to address. It is also important to ensure that future upgrading of the public transport system –
UnreliabilityUnroadworthy
vehiclesCrime/
securityReckless
driving
Rude drivers and/or
passengersLack of
comfort Expensive
Insufficient service at
night
Insufficient service on weekend
Long walk to nearest stop/
stationLong wait at stop/station
METRO
ekurhuleni 13% 14% 3% 12% 11% 6% 15% 1% 1% 3% 4%
Johannesburg 13% 11% 3% 12% 14% 9% 14% 2% 1% 2% 4%
tshwane 16% 9% 3% 14% 12% 9% 16% 2% 1% 3% 4%
NON-METRO
emfuleni 12% 14% 3% 15% 15% 9% 13% 2% 0% 1% 5%
lesedi 10% 5% 3% 18% 12% 14% 14% 3% 1% 2% 8%
merafong 13% 22% 3% 9% 6% 7% 12% 3% 0% 5% 7%
midvaal 9% 13% 0% 11% 4% 4% 12% 3% 3% 5% 21%
mogale 11% 11% 3% 11% 12% 8% 9% 4% 2% 4% 10%
randfontein 12% 14% 3% 12% 9% 9% 9% 3% 1% 3% 9%
westonaria 13% 11% 3% 13% 13% 7% 10% 6% 1% 3% 8%
for instance by replacing taxi routes with higher-capacity bus or Bus Rapid Transit (BRT) services – does not result in fare hikes for passengers (including those who remain taxi users), many of whom are vulnerable.
Affordability is also a key concern among people walking, suggesting that many non-motorised transport users do so not by choice, but because they cannot afford to travel by any other means.
In order to establish the problems that non-users might have, non-public transport users were asked to indicate their main reason for not using public transport. The data are summarised in Table 2.5, grouped by income level, and clustered into similar types of problems. The reasons for not using public
transport are different for different groups. Among the lowest income group, cost is the most significant barrier for 27% of respondents. Not having access to public transport nearby is also a significant problem among low-income groups. From about R6 400 upwards, having access to a car (and its amenities, including flexibility and reliability) is the most common reason given for not using public transport. Concern with crime and security is a minor reason, except among the highest income category where 17% of non-public transport users identified crime as their primary concern. Thus, negative perceptions around the crime and security risk on public transport appear to be more of a problem among non-public transport users than among users.
table 2.3: Biggest problem with public transport reported by users, by municipality

Mobility in the GautenG city-ReGion
30
Unreliability
Unroadworthy vehicles
Crime/security
Reckless driving
Rude drivers and/or
passengersLack of
comfort ExpensiveInsufficient
service at night
Insufficient service on weekend
Long walk to nearest stop/
stationLong wait at stop/station
walk 11% 15% 2% 11% 8% 8% 16% 1% 1% 3% 4%
Car 17% 12% 4% 14% 12% 9% 8% 2% 1% 2% 5%
taxi 10% 13% 3% 13% 13% 8% 17% 2% 1% 2% 5%
train 18% 9% 6% 8% 8% 11% 11% 4% 1% 3% 8%
Bus 20% 9% 3% 11% 10% 7% 12% 2% 2% 3% 4%
other 15% 16% 8% 10% 6% 10% 6% 2% 2% 3% 6%
table 2.4: Biggest problem with public transport reported by users, by mode of transport they used for the longest part of their most frequent trip
Public transport access problems
Public transport
costPublic transport safety problems
Non-motorised transport
(NMT) user
Public transport non-user Car preference/utility Other
mo
nth
ly h
ou
seh
old
in
com
e
No
pub
lic t
rans
por
t se
rvic
es in
my
area
It t
akes
too
long
to
wal
k to
nea
rest
sto
p/s
tati
on
The
wai
t fo
r p
ublic
tr
ansp
ort
is t
oo lo
ng
I can
’t aff
ord
pub
lic
tran
spor
t
I wor
ry a
bou
t cr
ime/
safe
ty
I wor
ry a
bou
t ro
ad/r
ail
acci
den
ts
I wal
k/cy
cle
I don
’t w
ant
to u
se
pub
lic t
rans
por
t
I can
aff
ord
a c
ar
I get
to
wor
k/sc
hool
on
tim
e w
ith
my
car
I can
tak
e un
pla
nned
tr
ips
I dro
p o
ff fr
iend
s/fa
mily
on
my
way
– b
ette
r th
an
ever
yone
usi
ng p
ublic
tr
ansp
ort
I am
a m
emb
er o
f a li
ft
club
/pas
seng
er
Oth
er
zero to r400 14% 4% 7% 27% 5% 2% 6% 14% 5% 1% 2% 0% 2% 11%
r401- r3 200 15% 12% 6% 10% 4% 3% 6% 13% 8% 2% 5% 1% 1% 16%
r3 200-r12 800 14% 7% 3% 4% 5% 3% 2% 16% 18% 9% 10% 1% 0% 7%
r12 801-r102 400 8% 4% 3% 1% 5% 2% 1% 20% 28% 14% 12% 1% 0% 2%
r102 400 + 4% 8% 2% 0% 17% 3% 0% 10% 18% 4% 19% 4% 0% 10%
response not given 8% 6% 5% 2% 6% 1% 3% 23% 12% 6% 11% 1% 0% 15%
all 10% 6% 5% 5% 6% 2% 3% 19% 15% 7% 10% 1% 1% 11%
table 2.5: reasons for not using public transport, grouped by type of problem and income

Chapter 2 2011 gcro quality of life survey: analysis of transport data
31
Figure 2.16 shows the desire line plots for Gauteng. On the basis of this we can observe the following:
• In terms of transport demand, Gauteng functions to some extent as a city-region, with connectivity between all parts of the province. In terms of the major linkages, two clusters stand out: Tshwane, and Johannesburg/Ekurhuleni. Table 2.6 below shows the percentage of most frequent trips between municipalities. About 3% of Johannesburg residents make their most frequent trip to Tshwane, and 8% to Ekurhuleni. From Tshwane, about 6% go to Johannesburg. Almost 20% of trips from Ekurhuleni
go to Johannesburg.
• Johannesburg clearly remains the heart of the province in terms of providing access to jobs and services to people across a large part of Gauteng. Johannesburg is a very strong attractor not only to residents from nearby Soweto and (the not so nearby) Orange Farm, but also areas across Ekurhuleni. In fact, in terms of movement linkages Ekurhuleni is virtually indistinguishable from Johannesburg. This is a strong indicator that integrated planning of mobility networks and land use development is needed between Gauteng municipalities in general, and
especially between Johannesburg and Ekurhuleni.
• Within-municipality linkages are far stronger than those between cities. For instance, the desire lines between Tshwane and Johannesburg are weak compared to shorter distance desire lines. In Johannesburg 84% of most frequent trips stay within the city; in Ekurhuleni this percentage is 75%, and in Tshwane 90% (Table 2.6). Among district municipalities, travel to other areas is more common – Emfuleni, Midvaal, Randfontein, and Mogale City are closely integrated with Johannesburg, while there are also strong movements between Westonaria and Randfontein local municipalities. This finding is associated with the type of trips mapped here – not simply work trips (which would tend to show stronger long-distance linkages), but all trip purposes. Clearly local mobility is important and not just peak-period work travel that tends to happen over longer distances.
• Figure 2.16 further suggests that strong linkages also exist between ‘townships’ and their proximate urban centres (e.g. between Soshanguve/Mabopane and the Pretoria Central Business District (CBD); Soweto and the Johannesburg CBD; Ekangala and Bronkhorstspruit; Katlehong/Vosloorus and Germiston; and Orange Farm and Vereeniging). This suggests that the historic social and economic linkages between townships and their nearest urban centre are still strong.
2.3 Mapping of movement patternsThis section maps the key movements in Gauteng at a provincial level to provide a visual representation of functional linkages between different parts of the city-region. It is based on the most frequent trip identified by each respondent, weighted for socio-demographic variables to reflect the population at provincial and local municipality level.
As in section 2.2, however, trip frequency is not reflected, so the number of trips in the graphs does not necessarily correspond to daily or hourly flows. The figures rather reflect the strength of connectivity between origins and destinations – both for economic and social purposes – taking all trip purposes into account, and from the point of view of the user rather than transport conditions on the transport network. It therefore has a different interpretation from the typical peak period volume plot on the network that is more reflective of economic-only linkages (being mainly composed of work trips).
Origins and destinations were aggregated from the suburb-level up to larger geographic units to improve clarity. As the 2011 QoL Survey did not survey households outside of Gauteng, the maps are restricted to origins and destinations within the provincial boundaries. The maps are plotted against a spatial layer (termed “urban classification”) that will be described in the next section.

Mobility in the GautenG city-ReGion
32
metropolitan higher order roads play, to a large extent, different roles in terms of the modes and users served. The national network seems to be more important for car travel, while provincial/metropolitan higher order roads play an important role in linking communities who use public-transport to access opportunities. These roads include the R80 (connecting Soshanguve to Pretoria); several roads connecting the Mamelodi and Atteridgeville areas respectively to the Pretoria CBD; the R511 (connecting Diepsloot to Johannesburg); the various roads connecting Soweto with the Johannesburg CBD; and the R553 stretching between Vereeniging and Johannesburg.
Destination of most frequent trip
Johannesburg tshwane ekurhuleni emfuleni lesedi merafong midvaal mogale City randfontein westonaria outside gauteng
ho
me
mu
niC
ipa
lit
y
Johannesburg 84.3% 2.9% 8.1% 1.8% 0.0% 0.1% 0.0% 1.7% 0.3% 0.1% 0.7%
tshwane 6.2% 90.0% 2.0% 0.5% 0.0% 0.1% 0.0% 0.1% 0.2% 0.1% 0.9%
ekurhuleni 19.9% 3.0% 75.2% 0.8% 0.2% 0.0% 0.3% 0.1% 0.1% 0.1% 0.4%
emfuleni 10.3% 1.2% 2.7% 82.8% 0.1% 0.0% 2.1% 0.1% 0.2% 0.1% 0.4%
lesedi 4.2% 1.2% 17.8% 1.8% 73.8% 0.3% 0.0% 0.3% 0.3% 0.0% 0.3%
merafong 5.6% 2.9% 0.3% 1.3% 0.0% 86.6% 0.0% 0.5% 1.9% 0.2% 0.8%
midvaal 8.1% 0.2% 10.2% 27.9% 1.9% 0.7% 49.8% 0.4% 0.5% 0.4% 0.0%
mogale City 27.9% 2.3% 2.3% 1.2% 0.0% 0.3% 0.0% 57.5% 7.5% 0.7% 0.3%
randfontein 18.8% 1.3% 1.9% 0.7% 0.0% 0.9% 0.5% 8.0% 61.9% 5.6% 0.2%
westonaria 6.5% 1.2% 1.4% 1.1% 0.2% 4.3% 0.0% 4.3% 15.1% 65.1% 0.7%
table 2.6: percentage of most frequent trips between origin and destination municipalities
Figure 2.17 - Figure 2.20 depict the most frequent trips allocated to the major road network (rather than as a desire line plot), to give a sense of the importance of various parts of the existing road network. Note, once again, that the thickness of lines on the network does not correspond exactly to the conventional hourly traffic volume plots that are obtained from transport models or traffic counts.
Based on these plots the following observations are made:
• The importance of the national (freeway) road network for intra-provincial mobility is clear. However, it appears that the national urban freeways and the provincial/
Figure 2.19 and Figure 2.20 (taxi and bus modes respectively) indicate that these roads primarily serve a public transport connectivity role.
• These patterns suggest that provincial and metropolitan roads are key assets to mobility in Gauteng and their maintenance and upgrading should be a key priority. Taking into account that they indicate desired rather than actual routes between origin and destinations, the plots might also help inform the alignment of priority routes for public transport, for instance BRT trunk or feeder services.

Chapter 2 2011 gcro quality of life survey: analysis of transport data
33
figure 2.16: desire lines of most frequent trips, gauteng figure 2.17: most frequent trips (car and road-based public transport) assigned to major road network

Mobility in the GautenG city-ReGion
34
figure 2.18: most frequent trips (car only) assigned to major road network figure 2.19: most frequent trips (minibus taxi only) assigned to major road network

Chapter 2 2011 gcro quality of life survey: analysis of transport data
35
figure 2.20: most frequent trips (bus only) assigned to major road network figure 2.21: distribution of urban settlement types across study area

Mobility in the GautenG city-ReGion
36
2.4 Analysis by settlement typeThis section analyses some of the key mobility responses from the survey with reference to a newly created ‘urban settlement typology’. We differentiate settlements in Gauteng according to the general locational, housing, and neighbourhood characteristics of the area, and examine how the mobility and access realities differ according to the type of settlement a household lives in. The typology transcends administrative (e.g. municipal) boundaries, attempting to capture the underlying spatial characteristics of an area. The analysis helps to establish how the market dynamics and actions of government that produce specific settlement forms affect the day-to-day mobility and access outcomes faced by households in Gauteng.
2.4.1 urban settlement typologyDrawing on recent work on settlement typologies and housing in South Africa9, we divided the GCR into eight settlement types at the suburb level. The underlying hypothesis was that the quality of access and mobility enjoyed by a household or individual varies systematically with the spatial, historical or socio-economic characteristics of the settlement they live in. As with all typologies, we attempted to limit the (large) amount of variation across different settlements (and indeed within them), by grouping suburbs together using a small number of key variables thought to reflect these underlying differences.
The eight settlement types include:
• Urban core: Core areas of traditional CBDs of Gauteng’s cities, with high densities, mixed land uses, and high accessibility due to a convergence of public transport and road links in the CBDs. These include the Pretoria and Johannesburg CBDs, as well as the old town centres of the East and West Rand and Vereeniging.
• Old suburban: Traditional suburban developments, established before 1995, and characterised by relatively good road network coverage, low to medium densities, and typically located just outside the urban core areas. The age of settlement is used as a proxy for the well-established and well-serviced nature of the area.
9 The concept of the settlement typology used here, although adapted and customised for the current study, draws heavily on the work done by Catherine Cross and colleagues at the Human Sciences Research Council (HSRC) as part of the Department of Science and Technology-funded Integrated Planning, Development and Modelling (IPDM) Project jointly undertaken with the Council for Scientific and Industrial Research (CSIR) and the University of Pretoria (UP) between 2009 and 2012. For a recent review see Cross et al. (2013).

Chapter 2 2011 gcro quality of life survey: analysis of transport data
37
• New suburban: Suburbs founded after around 1995, typically located further away from the CBDs and closer to the outer fringe of the urban area. These areas typify more commute-oriented, sprawling types of development, and include many gated communities as well as low to medium density cluster housing areas. These areas might have less well-developed road networks and local amenities than older suburbs.
• Formal townships: Formal dwellings located within traditional black townships or homeland areas of the city-region, within proclaimed urban areas, but excluding Reconstruction and Development Planning (RDP) housing. These areas have varying infrastructure quality, density and amenities, but are generally planned settlements.
• Informal inner: Informal housing (including shacks and backyard dwellings) located within the traditional boundary of the built-up areas of Gauteng. These include shacks on unused or public land close to the urban core, or within traditional black townships.
• Informal outer: Informal housing located outside of the traditional boundary of the built-up areas of Gauteng. This includes shacks in new township developments, between RDP housing units (or in their backyards) and in newer peripheral informal settlements.
• Formal RDP: RDP houses or subsequent subsidised housing programmes delivered over the last 18 years. These tend to be located on the edges of traditional townships.
• Formal peripheral: Settlements on smallholdings, agricultural communities and other low-density parts of the city-region.
Readily available Geographic Information Systems (GIS) data were used to allocate suburbs to these eight classes, and to allocate individual households from the 2011 QoL Survey sample within the suburbs (for instance to differentiate between households living in formal RDP houses and households living in informal housing within those same RDP areas). A brief description of the data rules and layers used for this allocation is described below:
• Urban core: A selection of older CBDs from the Gauteng Spatial Development Framework’s (GSDF’s) major nodes data.
• Old suburban: Extracted from the residential records of the 1996 CSIR/Satellite Applications Centre (SAC) land cover.
• New suburban: Extracted from the residential records of the 2011 CSIR/SAC land cover that did not appear in the 1996 layer. These areas were thus developed between 1996 and 2011.
• Formal townships: based on the 20 Townships Programme data layer from the Gauteng Department of Economic Development, and areas classified in the 1996 CSIR/SAC land cover as townships.
• Formal RDP: All households in the QoL dataset indicating their dwelling as a RDP house.
• Informal inner: All households in the QoL dataset indicating their dwelling as informal, within the urban core, old and new suburbs, and formal township suburbs as defined above.
• Informal outer: All households in the QoL dataset indicating their dwelling as informal and not included in ‘informal inner’.
• Smallholdings: Extracted from the 2009 South African National Biodiversity Institute (SANBI) land cover.
• Agricultural hinterland: Remaining extent of the province.
The spatial distribution of the settlement types across Gauteng is shown in Figure 2.21, with Table 2.7 indicating the number of survey responses allocated to each settlement type. Most numerous is ‘formal township’, containing almost 40% of the sample, followed by ‘old suburban’ areas with 28%. Informal dwellings are distributed almost equally between inner and outer areas of the province, but also appear in urban core settlements.

Mobility in the GautenG city-ReGion
solomon legodi
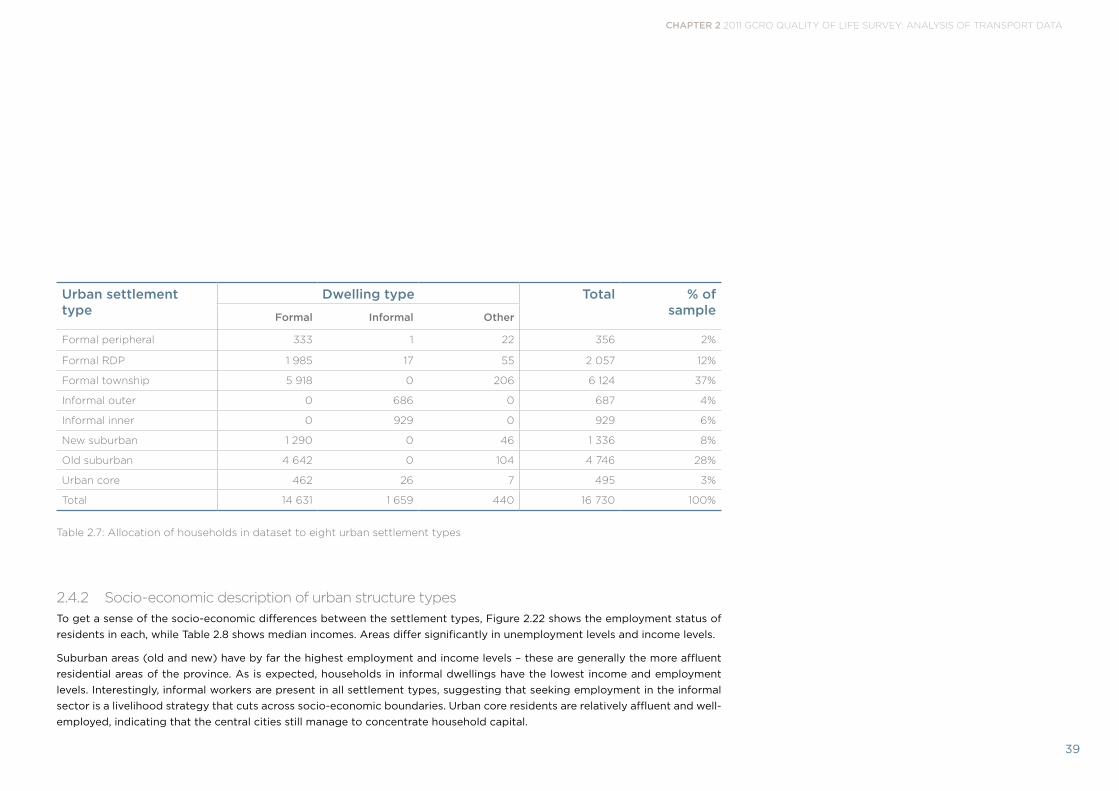
Chapter 2 2011 gcro quality of life survey: analysis of transport data
39
Urban settlement type
Dwelling type Total % of sampleFormal Informal Other
formal peripheral 333 1 22 356 2%
formal rdp 1 985 17 55 2 057 12%
formal township 5 918 0 206 6 124 37%
informal outer 0 686 0 687 4%
informal inner 0 929 0 929 6%
new suburban 1 290 0 46 1 336 8%
old suburban 4 642 0 104 4 746 28%
urban core 462 26 7 495 3%
total 14 631 1 659 440 16 730 100%
table 2.7: allocation of households in dataset to eight urban settlement types
2.4.2 socio-economic description of urban structure typesTo get a sense of the socio-economic differences between the settlement types, Figure 2.22 shows the employment status of residents in each, while Table 2.8 shows median incomes. Areas differ significantly in unemployment levels and income levels.
Suburban areas (old and new) have by far the highest employment and income levels – these are generally the more affluent residential areas of the province. As is expected, households in informal dwellings have the lowest income and employment levels. Interestingly, informal workers are present in all settlement types, suggesting that seeking employment in the informal sector is a livelihood strategy that cuts across socio-economic boundaries. Urban core residents are relatively affluent and well-employed, indicating that the central cities still manage to concentrate household capital.
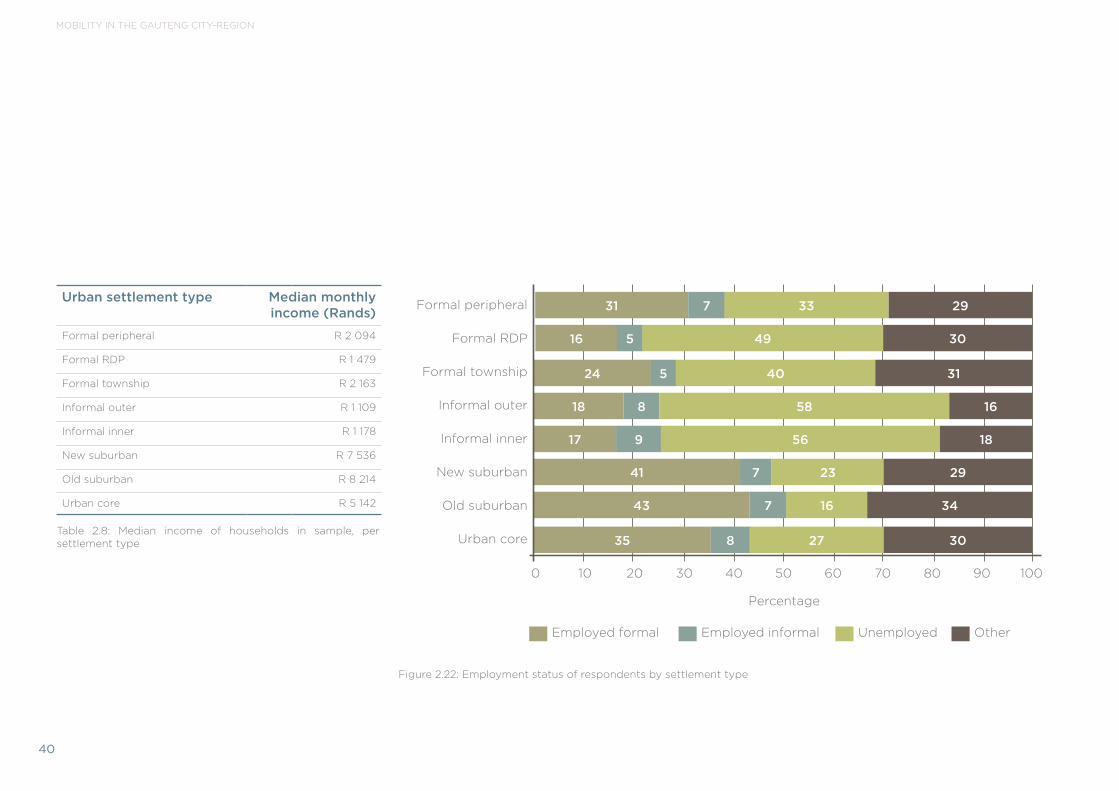
Mobility in the GautenG city-ReGion
40
Urban settlement type Median monthly income (Rands)
formal peripheral r 2 094
formal rdp r 1 479
formal township r 2 163
informal outer r 1 109
informal inner r 1 178
new suburban r 7 536
old suburban r 8 214
urban core r 5 142
table 2.8: median income of households in sample, per settlement type
figure 2.22: employment status of respondents by settlement type
formal peripheral
formal rdp
formal township
informal outer
informal inner
new suburban
old suburban
urban core
2931 7 33
0 10 20 30 40 50 60 70 80 90 100
percentage
employed formal employed informal unemployed other
16 5 49 30
24 5 40 31
18 8 58 16
17 9 56 18
41 7 23 29
43 7 16 34
35 8 27 30

Chapter 2 2011 gcro quality of life survey: analysis of transport data
41
Urban settlement type Race
African Asian/Indian Coloured White
formal peripheral 81% 3% 3% 14%
formal rdp 97% 1% 1% 0%
formal township 93% 2% 3% 2%
informal outer 98% 1% 0% 0%
informal inner 97% 1% 1% 1%
new suburban 56% 5% 7% 32%
old suburban 47% 6% 5% 41%
urban core 79% 3% 2% 16%
table 2.9: race distribution of sample, by settlement type
When disaggregated by race, the figures indicate an interesting diversity in many settlement types. Suburban areas consist almost equally of African and other race groups (Table 2.9). This might be due to a combination of factors, including increasing integration of older ‘white’ suburbs, demographic turnover in others and the development of new suburban areas (or outward growth of existing ones) that attract medium-income households from across the race spectrum. The latter point is supported by the fact that the percentage of Africans is higher in newer suburban than in old suburban areas.

Mobility in the GautenG city-ReGion
42
Table 2.10 shows the migration status of the sample. The function of the urban core as a reception area for migrants from outside the province is clear: only 38% of residents were born in Gauteng, and about half moved to Gauteng within the last 15 years. Similarly, informal settlements regardless of their location on the inner-outer continuum are preferred locations for migrants, thus playing a key role in urbanisation within Gauteng. Figure 2.23 confirms this, with regards to the time a resident has been living in their present dwelling.
In summary, then, it appears that migrants who gain access to the city centres tend to have higher-income and lower levels of unemployment, while those who are less well-off are located in more distant informal settlements. Location close to economic opportunities offered by the traditional CBD and surrounds is associated with better economic well-being. This indicates that traditional role of the CBD as providing access to economic opportunity is still strong. However, the causality is not clear: more central locations might enable people to gain better employment and earn higher incomes; but more central locations might also command higher entry prices (in terms of housing cost or other social capital-related costs) and thus keep lower-income migrants out in the first place.
figure 2.23: time of tenure at present address, per settlement type
formal peripheral
formal rdp
formal township
informal outer
informal inner
new suburban
old suburban
urban core
0 10 20 30 40 50 60 70 80 90 100
percentage
less than 2 years 2-15 years more than 15 years always lived in this dwelling
305 26 39
6 43 16 35
5 20 27 48
8 41 12 39
10 38 18 34
8 46 16 30
8 41 17 34
24 36 11 29

Chapter 2 2011 gcro quality of life survey: analysis of transport data
43
Urban settlement type Born in Gauteng Moved to Gauteng… more than 15 years ago … within last 15 years
formal peripheral 63% 14% 22%
formal rdp 63% 15% 21%
formal township 72% 13% 15%
informal outer 39% 18% 42%
informal inner 38% 19% 42%
new suburban 57% 16% 27%
old suburban 61% 14% 25%
urban core 38% 10% 52%
table 2.10: migration status of sample, by settlement type
Suburban settlements have a higher than expected amount of residents from outside Gauteng (about 40%); approximately half of residents moved into their houses within the last 15 years. This suggests that Gauteng’s suburbs have experienced their fair share of turnover. The formal township areas have been the most stable – a full three-quarters of township dwellers have lived there all their lives or for more than 15 years. This might be an indication of stable long-term communities, or of less than optimal housing markets that limit opportunities for housing ownership turnover.
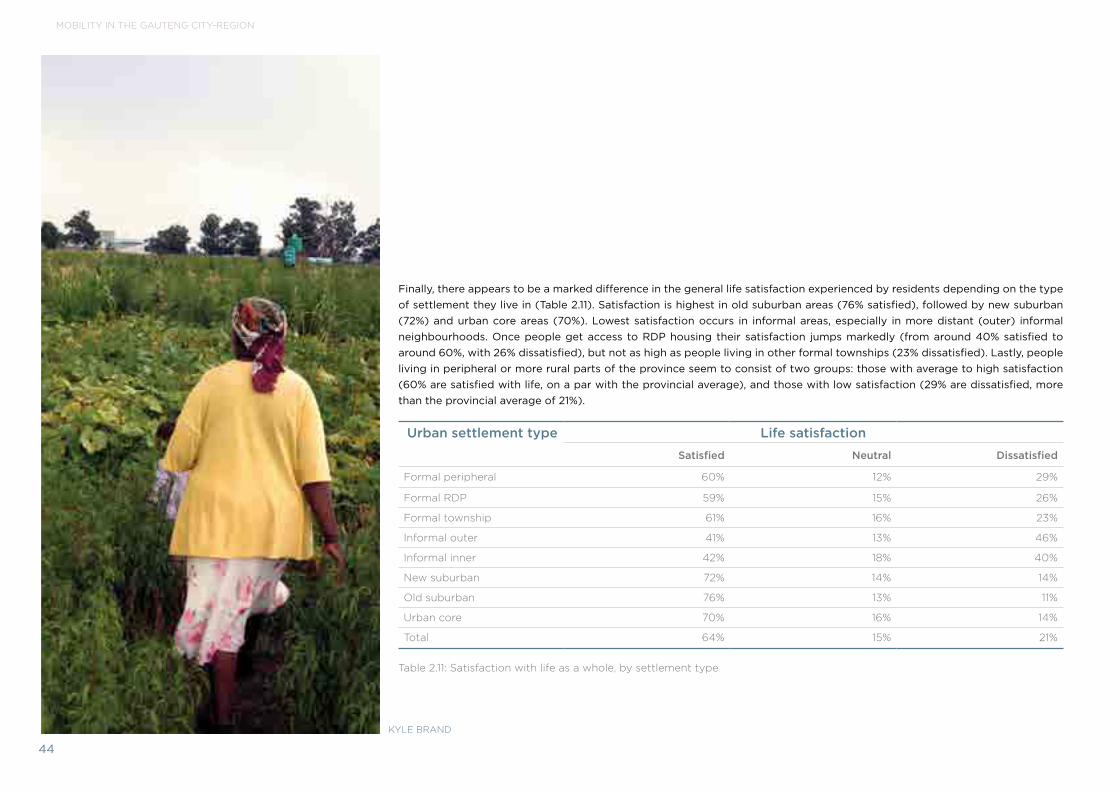
Mobility in the GautenG city-ReGion
44
Finally, there appears to be a marked difference in the general life satisfaction experienced by residents depending on the type of settlement they live in (Table 2.11). Satisfaction is highest in old suburban areas (76% satisfied), followed by new suburban (72%) and urban core areas (70%). Lowest satisfaction occurs in informal areas, especially in more distant (outer) informal neighbourhoods. Once people get access to RDP housing their satisfaction jumps markedly (from around 40% satisfied to around 60%, with 26% dissatisfied), but not as high as people living in other formal townships (23% dissatisfied). Lastly, people living in peripheral or more rural parts of the province seem to consist of two groups: those with average to high satisfaction (60% are satisfied with life, on a par with the provincial average), and those with low satisfaction (29% are dissatisfied, more than the provincial average of 21%).
Urban settlement type Life satisfaction
Satisfied Neutral Dissatisfied
formal peripheral 60% 12% 29%
formal rdp 59% 15% 26%
formal township 61% 16% 23%
informal outer 41% 13% 46%
informal inner 42% 18% 40%
new suburban 72% 14% 14%
old suburban 76% 13% 11%
urban core 70% 16% 14%
total 64% 15% 21%
table 2.11: satisfaction with life as a whole, by settlement type
Kyle Brand

Chapter 2 2011 gcro quality of life survey: analysis of transport data
45
2.4.3 transport patterns by urban settlement typeThis section examines relationships between the settlement types and the mobility-related responses in the survey.
On average, about 23% of respondents reported not making any trips in response to the survey request to identify their most frequent trip. This is a proxy figure for immobility, i.e. an inability or lack of desire to travel. Even though experience indicates that this figure cannot necessarily be interpreted as the absolute number of people who are ‘stranded’ owing to an absence of affordable transport options, it gives an indication of the relative levels of travel activity participation across settlement types, which is broadly correlated to welfare.
Table 2.12 shows that immobility (as defined above) varies significantly across settlement types, and is clearly related to distance from the core areas of the province. Immobility in the CBD areas is only 14%, rising as settlements are further removed from the CBD, until it reaches 30% in peripheral areas. Clearly centrality of location correlates with higher transport options (including more public transport options converging on central cities), which in turn promotes more trip making.
Urban settlement type “I never make any trips” (% of respondents per settlement type)
formal peripheral 30%
formal rdp 28%
formal township 26%
informal outer 25%
informal inner 26%
new suburban 17%
old suburban 19%
urban core 14%
table 2.12: extent of immobility in sample, by urban settlement type

Mobility in the GautenG city-ReGion
46
Figure 2.24 shows that mode use varies across these settlement types. As one would expect given the differences in incomes, car use is highest in old and new suburbs (between 57% and 63% of trips), but also significant in urban core areas (25% of trips) and peripheral areas (30%). Walking as a main mode is important in urban core areas – again illustrating the benefit of central location in terms of being able to avoid more costly transport options – and also in inner informal areas. Here inner informal areas differ from outer areas. Outer informal areas are not within walking distance of destinations, and here only 5% of most frequent trips are on foot, which is remarkable given that this includes not only work but also daily shopping and other trips. Taxis play a larger role in outer than in inner areas. Clearly outer informal areas have a quadruple disadvantage: they are located further away from work opportunities; they have a shortage of other amenities nearby; an absence of bus and rail routes force higher reliance on taxis (which tend to be more expensive); and these fares consume a higher proportion of residents’ incomes, which are lower than elsewhere.
figure 2.24: main mode used for most frequent trip, by settlement type
formal peripheral
formal rdp
formal township
informal outer
informal inner
new suburban
old suburban
urban core
10 30 54
0 10 20 30 40 50 60 70 80 90 100
percentage
3
7 8 73 7
8 17 65 6
5 5 78 7
15 4 65 11
8 57 27 4
6 63 24 2
18 25 50 3
walk Car taxi Bus train other

Chapter 2 2011 gcro quality of life survey: analysis of transport data
47
It appears that some inner informal settlements are well located, such that users can walk to destinations (which could be in nearby formal settlements), or use inexpensive trains. Train use is highest in inner informal areas.
Do people in different settlement types face longer travel distances and times? Table 2.13 tabulates the travel times reported by respondents for their most frequent trips. It shows, remarkably, that no great variation exists between the eight settlement types – average travel times vary between 41.9 minutes in old suburban neighbourhoods and 47.5 minutes in adjacent urban core areas. The percentage of trips taking longer than one hour is highest in township (15%), RDP (15%), and peripheral areas (16%).
Questions exist about the accuracy of the self-reported travel time data (see section 2.2.5 above). If the data is correct, it could indicate that residents of suburban locations are most ‘time-advantaged’, and that travel times generally increase with distance from the CBD. Two exceptions to the pattern are urban core locations, which have longer travel times (likely due to the higher incidence of people walking), and outer informal areas (which have shorter than expected travel times, for unknown reasons).
Urban settlement type Mean travel time of most frequent trip (mins)
% of trips <20mins % of trips >60mins
formal peripheral 46.9 22% 16%
formal rdp 46.5 28% 15%
formal township 46.3 27% 15%
informal outer 42.4 25% 11%
informal inner 46.2 26% 14%
new suburban 42.7 30% 12%
old suburban 41.9 32% 12%
urban core 47.5 31% 13%
table 2.13: travel time of frequent trip, by settlement type
The next two tables help to shed further light. Table 2.14 tabulates average estimated trip distances for the most frequent trip10. It shows that, across all trip purposes, trip distances increase as settlements are located further away from the CBD. This is consistent with classical land use-transport theory which assumes that all trips are centred on the CBD. While all destinations are clearly not in the CBD any longer, it does suggest that the CBD and its surrounds still play a very important role as the location of many urban activities.
10 As trip distances were not reported in the survey, we estimated trip distances from the shortest-distance route by road between the origin and destination of each trip, according to the suburb reported for each. This measure is more likely to be accurate than travel times, as origins and destinations were generally accurately reported. Estimated distances and reported travel times were then used to estimate travel speeds.
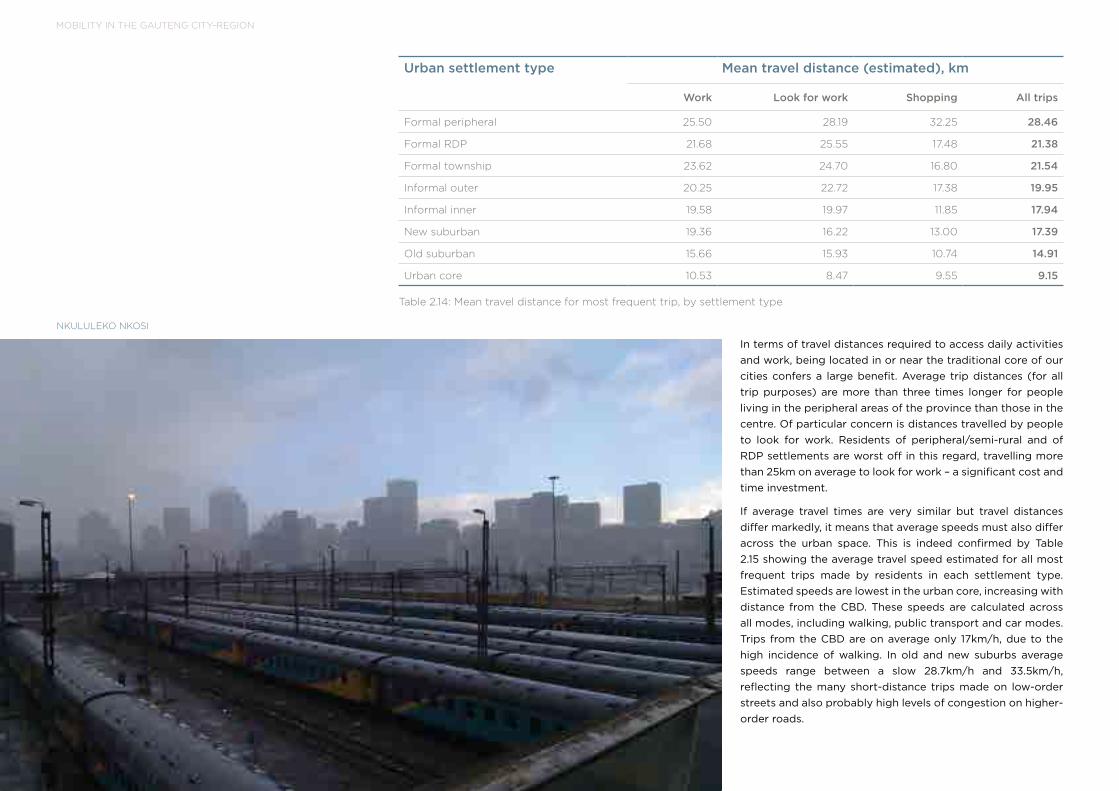
Mobility in the GautenG city-ReGion
48
In terms of travel distances required to access daily activities and work, being located in or near the traditional core of our cities confers a large benefit. Average trip distances (for all trip purposes) are more than three times longer for people living in the peripheral areas of the province than those in the centre. Of particular concern is distances travelled by people to look for work. Residents of peripheral/semi-rural and of RDP settlements are worst off in this regard, travelling more than 25km on average to look for work – a significant cost and time investment.
If average travel times are very similar but travel distances differ markedly, it means that average speeds must also differ across the urban space. This is indeed confirmed by Table 2.15 showing the average travel speed estimated for all most frequent trips made by residents in each settlement type. Estimated speeds are lowest in the urban core, increasing with distance from the CBD. These speeds are calculated across all modes, including walking, public transport and car modes. Trips from the CBD are on average only 17km/h, due to the high incidence of walking. In old and new suburbs average speeds range between a slow 28.7km/h and 33.5km/h, reflecting the many short-distance trips made on low-order streets and also probably high levels of congestion on higher-order roads.
Urban settlement type Mean travel distance (estimated), km
Work Look for work Shopping All trips
formal peripheral 25.50 28.19 32.25 28.46
formal rdp 21.68 25.55 17.48 21.38
formal township 23.62 24.70 16.80 21.54
informal outer 20.25 22.72 17.38 19.95
informal inner 19.58 19.97 11.85 17.94
new suburban 19.36 16.22 13.00 17.39
old suburban 15.66 15.93 10.74 14.91
urban core 10.53 8.47 9.55 9.15
table 2.14: mean travel distance for most frequent trip, by settlement type
nKululeKo nKosi

Chapter 2 2011 gcro quality of life survey: analysis of transport data
49
Urban settlement type
Mean travel speed, all modes (estimated), km/h
formal peripheral 49.9
formal rdp 36.9
formal township 37.6
informal outer 37.5
informal inner 31.1
new suburban 33.5
old suburban 28.7
urban core 17.3
table 2.15: mean travel speed of most frequent trips across all modes, by settlement type
Main mode used Mean travel speed (estimated), km/h
walk 10.4
Bicycle 28.5
motorbike 29.2
Car as driver 34.6
Car as passenger 33.3
Car as passenger through a lift club 27.2
taxi 36.2
train 40.8
gautrain 53.3
Brt/rea vaya bus 41.9
school bus 30.3
other bus 34.5
other type 34.4
table 2.16: average door-to-door travel speed (estimated), by main mode used
Urban settlement type Mean monthly household transport
costformal peripheral r313
formal rdp r192
formal township r294
informal outer r150
informal inner r153
new suburban r549
old suburban r564
urban core r429
table 2.17: mean monthly household expenditure on transport, by settlement type
Average speeds vary largely predictably between individual modes (Table 2.16). Frequent trips, of which the greatest part of the journey is done on foot, have an average speed of 10.4km/h (greater than walking speed as faster modes may be used on other segments of the trip). At the other end of the scale, public transport modes specifically designed for speed improvements seem to deliver: note the relatively high door-to-door speeds of the Gautrain (53.3km/h) and BRT (41.9km/h).
The average estimated speed for car trips varies between 27.2km/h and 34.6km/h, lower than for taxi trips (36.2km/h) and rapid bus trips (41.9km/h). This result seems counterintuitive, but might give an indication of the extent to which congestion has eroded the speed advantage of the car over other modes in Gauteng. However, given the accuracy problems with reported travel times in the data, further work would be needed to confirm this finding.
Table 2.17 summarises the average monthly expenditure on transport, by settlement type. Transport costs are heavily influenced by the types of modes used. Suburban households spend by far the most on transport (more than R500 per month), closely followed by urban core households (about R430). Evidently the shorter distances travelled by residents of these areas do not translate into low transport costs, as most trips are made by the relatively expensive car mode. Households in informal settlements spend about R150 per month on transport, in both inner and outer locations. The amounts are slightly higher in RDP settlements (R192) and almost double in formal townships (R294).

Mobility in the GautenG city-ReGion
50
Urban settlement type Satisfaction with transportSatisfied Neutral Dissatisfied
formal peripheral 75% 5% 21%
formal rdp 67% 13% 20%
formal township 70% 12% 18%
informal outer 70% 9% 20%
informal inner 58% 14% 28%
new suburban 81% 9% 9%
old suburban 85% 7% 9%
urban core 81% 11% 8%
table 2.18: satisfaction with transport, by settlement type
Are residents of these different types of settlements satisfied with transport? Table 2.18 shows the result to this question in the survey. Following the same patterns as with general ‘life satisfaction’ (see Table 2.11), residents are most satisfied in suburban and central core locations, with as much as 85% of people responding positively. Dissatisfaction is highest in informal settlements, and more so in inner than in outer areas. In peripheral areas there is once again evidence of two groups, those who are very satisfied and those who are very dissatisfied with transport conditions.
Looking at differences in the types of problems experienced by public transport users in the different areas (Table 2.19), it is clear that affordability is the most common problem in all areas with heavy public transport use. This includes township, informal and especially peripheral areas, where long travel distances help to raise travel costs. Reckless and rude drivers are considered more of a problem in urban core areas, perhaps corresponding to more aggressive driving styles under crowded CBD traffic conditions. Residents in suburban locations complain more about the unreliability and discomfort of public transport services, suggesting that the market for public transport in these areas has different service quality concerns than elsewhere.

Chapter 2 2011 gcro quality of life survey: analysis of transport data
51
Single biggest problem with public transport
Urban structure type Unreliability
Unroadworthy vehicles Crime/security
Reckless driving
Rude drivers and/or
passengersLack of
comfort Expense
Insufficient service at
night
Insufficient service on
weekend
Long walk to nearest stop/
stationLong wait at stop/station Other
formal peripheral 16% 9% 2% 13% 6% 6% 22% 2% 2% 4% 13% 7%
formal rdp 12% 14% 2% 11% 13% 7% 16% 1% 1% 3% 4% 16%
formal township 13% 12% 3% 13% 14% 9% 14% 2% 1% 2% 4% 15%
informal outer 12% 15% 2% 10% 11% 7% 18% 2% 1% 4% 5% 13%
informal inner 14% 14% 4% 12% 8% 8% 17% 2% 0% 3% 4% 14%
new suburban 10% 12% 3% 13% 12% 11% 13% 2% 1% 2% 5% 15%
old suburban 16% 11% 4% 12% 11% 7% 11% 3% 1% 3% 6% 16%
urban core 10% 9% 2% 14% 18% 10% 17% 1% 0% 2% 3% 14%
table 2.19: problems with public transport, by settlement type

Mobility in the GautenG city-ReGion
52
2.5 ConclusionsKey conclusions and policy/planning implications from this analysis of the transport-related questions in the 2011 GCRO QoL Survey, include the following:
• Varying realities require varying approaches: Satisfaction with life in general, and with transport in particular, is relatively high across most areas of Gauteng. Overall, about three out of every four residents are satisfied with transport. However, depending on where a person lives in Gauteng, and especially what kinds of travel modes they have access to, their experience of access to the space economy, social amenities and travel conditions is likely to vary widely. For instance, satisfaction among car drivers in suburban locations is as high as 90%, whereas among residents of informal settlements satisfaction drops to between 60% and 70%, although this depends strongly on where the settlement is located. The implication is that the starting point for transport planning in the province should be to understand the variations in needs and experiences at a fine scale, rather than trying to determine a one-size-fits-all solution. A wide variety of responses and solutions are needed.
• Benefits of metropolitan locations: Being located in one of the main metropolitan areas is associated with a marked improvement in travel conditions, mobility, access to services and livelihood indicators such as employment and income. This explains the attraction of Gauteng’s cities to the poor as a way of trying to access the economy and to effect anti-poverty strategies such as migration or
levi o’regan

Chapter 2 2011 gcro quality of life survey: analysis of transport data
53
urbanisation. It is clear that these strategies are particularly directed at certain parts of the cities – notably the urban core/CBD areas and informal settlements – that act as entry points for new migrants.
This raises the question of the role that is to be played by Gauteng’s non-metro areas. Many of the district municipalities have lower public transport access and mobility (notably Midvaal, Lesedi, Mogale City, and Westonaria local municipalities), and lower levels of satisfaction with transport conditions (especially in relation to the vehicle quality and driver behaviour of the minibus-taxi mode). These problems of non-urban areas are worth responding to in their own right. But such improvements might also enhance the attractiveness of Gauteng’s non-metro hinterland as a migration destination, putting additional pressure on other services and environmental resources. Some rural-oriented transport interventions that are currently on the cards, such as the mooted rail service along the Moloto Corridor to the north-east of Tshwane, might very well have significant social/migration implications by virtue of the enhanced access they would offer to the urban economy.
The overall implication here is that transport planning needs to be closely tied not only to spatial, housing, and economic planning for the province, but also to a spatial-demographic vision for migration and the urban-rural balance in Gauteng.
• Benefits of centrality within the city: Being located in or close to the traditional CBDs of Johannesburg, Pretoria and (to a lesser extent) the town centres of the East and West Rand confers significant advantage to residents in terms of proximity to work and other opportunities. Advantages of the central location appear to be two-fold: it enables people to walk to many opportunities, thereby avoiding the expense of paying for transport; and it also offers good access to public transport as most taxi, bus and train routes converge on CBDs.
This is so despite the strong trends of suburbanisation and decentralisation seen over the past few decades. This finding supports recent government efforts to upgrade CBDs and promote the delivery of social housing and other appropriate and affordable shelter on well-located land. The data support an acceleration of such a coordinated housing-transport strategy in areas with already-high accessibility.
• RDP and informal settlements: As a counterpoint to the above, residents of new RDP-type settlements and informal settlements (either within existing formal townships, or in exclusively informal areas) face much lower access and more onerous and costly mobility conditions. These areas record high levels of immobility (the so-called ‘stranded’, either by lack of affordable options or by choice), high levels of dissatisfaction with transport, frequent captivity to the taxi mode (which might lead to high costs) and long travel distances due largely to their peripheral locations.
The shortage of local amenities often leads to minimal opportunities for walking, necessitating long and costly public transport trips to access jobs and services.
It is important that a menu of appropriate land use-transport responses (and not only transport responses) is developed for the situation in RDP and informal settlements. This menu includes for instance: improved public transport linkages into a wider multimodal public transport network; incentivising the provision of local commercial opportunities within walking distance (including shopping and business); and promoting appropriate residential densities at locations close to nodal points. At the same time, the impacts of such efforts on land values and access to affordable housing must be borne in mind, given the role that informal settlements play as an entry point and first foothold for the poor.
• Affordability of taxis: The single most problematic aspect of day-to-day mobility for public transport users in Gauteng is the high cost of travel. This is especially so for the taxi mode (rather than bus or rail), which is also by a large margin the most important public transport mode in the province. Given the large share of poor households’ income being spent on transport, lowering taxi fares might be a key anti-poverty strategy to consider. Lowering fares is difficult to achieve sustainably, but it could involve providing operating subsidies to taxis as a part of the deployment of selected Integrated Rapid Public Transport (IRPT) systems, especially if savings are achieved in other

Mobility in the GautenG city-ReGion
54
using public transport have less to do with speed than with other perceived benefits of the car – flexibility, security, reliability. This might inform strategies to provide attractive alternatives to the car. It suggests that even modest speed improvements to public transport, coupled with increasing service quality aspects, might have the greatest chances of success. Of course, the challenge is that these intangibles are the hardest to deliver with a public transport offering. But there is a strong argument for attention to be paid to things like information, service quality, reliability and safety. Crime and safety on public transport is not a significant concern for users or non-users, except among the highest-income car users.
• Regional linkages and secondary roads are important: Urban freeways and higher order roads play an important role in linking parts of the province together. Some parts of the province – notably Johannesburg and Ekurhuleni – are in fact so closely linked in terms of daily mobility patterns as to be virtually indistinguishable, with about one in five regular trips from Ekurhuleni ending up in Johannesburg. At the same time, Ekurhuleni is the metro with the highest level of dissatisfaction with transport. These factors indicate the need for a high level of coordinated planning and investment between the metropolitan municipalities, and possibly for a stronger role for a provincial-level body to coordinate and enforce joint action.
The data also showed that the secondary road network, consisting of a mix of local and provincial roads, plays a
crucial role in road-based public transport. It follows that the preservation and improvement of this asset should be a priority.
• The importance of local transport: The data suggest that local, short distance transport plays a very important role in people’s daily lives. In Johannesburg, 84% of frequent trips stay within the metro, while in Tshwane this figure is 90%. The work trip is important for providing access to economic opportunity, but non-work travel, occurring to a variety of locations at a variety of times, have often not been given sufficient consideration in transport planning and provision. Many non-work travel patterns are dispersed in nature and tend to be suited better to more flexible modes such as walking and taxis (and cars for those who can afford them), rather than fixed-route bus and rail services. There is also a gender equity dimension here: women tend to make more of the short distance, non-work trips. Both women and children will benefit more from enhancements to the local transport environment. The implication is that transport and land use planning should be strongly focused at the local level – looking at things like local amenities, sidewalks and street crossings for safe walking, and accessibility to shopping and services for a variety of modes. Planning should therefore aim to strengthen and enhance local responses, for instance through devising strategies for human capital development, especially in under resourced district and local municipalities.
parts of the network. There is a further challenge here in that addressing many of the service quality concerns users have about taxis, such as unroadworthy vehicles and rude and dangerous driving, might have the effect of raising taxi costs and fares. Possibly the only way of securing improved service quality at a reasonable cost to the consumer would be to transform the entire operating model of the industry into a more cost-efficient, corporatised form.
From the point of view of low-income commuters it might be more important to lower costs than to speed up public transport, given the fact that travel times are more or less independent of travel modes in Gauteng. This suggests that government interventions such as BRT systems should be thought through carefully to avoid situations where higher speeds come at the cost of higher fares to vulnerable users over the long-term, perhaps due to insufficient demand on certain corridors. This includes the impact on parts of the taxi network that are not incorporated into BRT systems, where reduced demand could eventually result in higher fares being charged. The transitional effects during the implementation of IRPT systems therefore need consideration.
• Market for alternative modes among car users: This is not to say that there are not segments of the market that are willing and able to pay a premium for faster public transport services – even among the highest income category at least 10% of people occasionally use public transport. However, the reasons car users give for not

55Christina CulwiCK

Mobility in the GautenG city-ReGion
56
White Coloured Asian Black (African)sample size (households) 10 713 455 579 4 336
average income per year per household r8 650 r4 230 r5 795 r2 110
average number of cars per household 1.42 0.54 1.01 0.17
Cars per 1 000 population 425 96 179 31
average number of people per household 3.37 5.66 5.65 5.31
average number of workers per household 1.39 1.72 1.79 1.82
average number of person trips per household per day:
home-based-work 2.32 2.79 2.72 3.26
all trip purposes 7.47 3.27 3.92 3.97
average number of person trips per person per day 2.22 0.84 1.00 0.78
distribution of person trips:
home-based-work 31% 86% 69% 83%
home-based-non-work 55% 7% 18% 6%
non-home-based 14% 7% 13% 11%
modal split for home-based-work trips:
private 76% 52% 75% 8%
public 17% 44% 20% 84%
other 7% 4% 5% 8%
in march 1973 the executive Committee of the then transvaal provincial administration (tpa) commissioned a consortium to plan a network of highways and major roads for the fast growing pretoria-witwatersrand-vereeniging (pwv) area. interim proposals for the network were investigated, proposed and approved over 1974/5, but at the same time a major transportation study – based on transport surveys and modelling – was initiated. the study was designed and started in august 1975 and finalised in 1979, with five volumes of reports published. what came to be known as the 1975 pwv transportation study was based on extensive home interview surveys:
• a 1974 pretoria survey of some 6 800 white households, 3 000 black/african households (in mamelodi, atteridgeville, garankuwa and mabopane), 140 coloured households (eersterus) and 140 asian households (laudium);
• a further 4 000 surveys of white households in other parts of the pwv (Johannesburg (1 000), east rand (2 000), west rand (500) and the vaal triangle (500); some 1 000 black/african households (soweto, tembisa, sebokeng); 250 coloured households (eldorado park) and 250 asian households (lenasia). (transvaal provincial administration roads department, 1980, pp.i-v)
Key results from the household surveys are summarised in the table below. it presents a remarkable picture of high apartheid reflected in key transportation statistics.

57anthony gotz

Mobility in the GautenG city-ReGion
original photo: daniel magidi

Chapter 3 CONSTRUCTING A QUALITY OF TRANSPORT INDEX: GAUTENG’S PRIORITY TOwNShIPS
59
3.1 IntroductionThis chapter develops and applies a ‘Quality of Transport’ (QoT) Index for Gauteng. The idea of constructing a QoT Index is driven by the understanding that transport, access and mobility issues are key to the quality of life enjoyed by a resident of a particular area. The analysis in Chapter 2 showed that transport realities vary considerably across areas and persons. It is, therefore, useful to develop a single measure that captures the main aspects of this variation and analyses its implications for spatial, settlement, and transport planning.
A QoT Index is considered useful for a number of reasons:
1. It provides a conceptual basis for thinking about, and analysing, mobility-related issues as they affect quality of life.
2. It provides clarity, at a high level, as to how transport quality varies spatially across areas of the province, and what, if any, geographic pattern this follows.
3. It enables distinction between areas with similar problems, and (perhaps more importantly) between areas with different characteristics, to inform policy formulation.
4. It focuses attention on the experience of the user as a perspective informing debate and policy formulation.
5. It provides a consistent and objective means for tracking changes in transport, access, mobility, and user impacts over time.
It is acknowledged that construction of a single index is by definition a reductionist exercise, and cannot take the place of rigorous and detailed analysis. But it is intended to complement and support on-going policy analysis, policy formulation and planning. The index is calculated for the priority townships identified by the Gauteng Provincial Government (GPG).
Constructing a Quality of Transport Index: Gauteng’s priority townshipsChristo venter and willem Badenhorst

Mobility in the GautenG city-ReGion
60
3.2 Defining priority townships for the QoT Index
In this chapter we construct a QoT Index from the 2011 Gauteng City-Region Observatory (GCRO) Quality of Life (QoL) Survey and apply it to areas defined in the GPG’s Prioritised Townships Programme (PTP). As part of the original 2011 QoL Survey tender specification, GCRO requested oversampling in the specified priority townships to ensure comparable analysis across these areas, which means that sample sizes for these areas are generally large enough to support localised findings.
The PTP was conceptualised and launched in 2006 by the GPG and prioritises the re-engineering and renewal of socio-economic infrastructure in a number of previously marginalised townships (Mokone, pers. comm., 2013).
The principal goal of PTP is to improve and restore socio-economic infrastructure, increase knowledge, skills and expertise of community members. It also prioritises increased participation of community members in economic opportunities presented by infrastructure development. The programme aims to contribute to improve the lives of township residents. The Gauteng Provincial Government implements the PTP programme in 26 impoverished townships and 50 poorest wards in the province with the goal of bringing about better living conditions. (mokone, pers. comm., 2013)
The PTP originally started with a list of 20 townships, but has seen a number of additions over the years with various lists published. The latest list of priority townships was obtained from Mokete Mokone, a consultant working for Feedback Research and Analytics appointed to do an evaluation framework with indicators for the PTP (Mokone, pers. comm., 2013). The list was refined in two respects. Firstly, Soweto contained a disproportionally large sample from the 2011 QoL Survey, so was split into two sub-areas to see if any insight might be obtained around differences within the township. A boundary running along Elias Motsoaledi Road (M77) was used to divide the area between Soweto (East) and Soweto (West), on the presumption that suburbs to the East of the boundary are located closer to Johannesburg, and might have better access and mobility characteristics than areas to the West. Secondly, the township named ‘Nkangala’ was omitted (it could not be confirmed that this referred to Ekangala in the north-eastern corner of the province). The final set of 27 priority townships is depicted in Figure 3.1.

Chapter 3 CONSTRUCTING A QUALITY OF TRANSPORT INDEX: GAUTENG’S PRIORITY TOwNShIPS
61
figure 3.1: the 27 priority townships

Mobility in the GautenG city-ReGion
62
3.3 Construction of a QoT Index The intention of a QoT Index is to provide a single measure reflecting the lived experience of residents in a particular area with respect to the quality of everyday travel opportunities and conditions. This experience is shaped by a number of dimensions:
1. Travel conditions within the immediate vicinity: Research has shown that the local travel conditions within a settlement shape the quality of life, first and foremost, by determining the feasibility of walking to everyday activities. Walking is a key livelihood strategy for low-income households, as it avoids the expense of making a motorised trip for activities like shopping and school attendance. The quality of the walking environment is determined by a combination of spatial and infrastructure factors: spatially, the availability of social services within walking distance of the home is important; and the existence and state of repair of paved roads, sidewalks, safe road crossings and street lighting are also key.
2. Wider-scale accessibility afforded by the transport system to participate in urban activities: In terms of gaining access to wider urban opportunities such as jobs, services and social networks outside the immediate neighbourhood, a particular residential area may be more or less suitable depending on three factors: (i) the location of the area; (ii) the spatial distribution of relevant activities across the urban space relative to the residential area; and (iii) the quality and cost of connectivity provided by the transport network.
3. Quality of transport services: Apart from the time and cost involved in using a particular transport service, service quality factors such as safety from crime, safety from road accidents, comfort in the vehicle and reliability affect the subjective quality of transport experienced by the user.
4. Personal characteristics and constraints: Different persons have different needs and preferences relating to the access and mobility they ‘consume’. Personal characteristics like age, gender, income, and disability status could affect the type of trips that people want to make, as well as minimum standards they require from a service. The perceived quality of transport will thus vary across people within the same household and neighbourhood. It is desirable to calculate a QoT Index at the individual level, reflecting some amount of subjective perception, from where it can be aggregated up to the neighbourhood level or higher.
Christina CulwiCK

Chapter 3 CONSTRUCTING A QUALITY OF TRANSPORT INDEX: GAUTENG’S PRIORITY TOwNShIPS
63
There are three ways to measure aspects of transport quality:
• By objective spatial measures, such as the existence and quality of paved, all-weather roads in settlements, or average distances to facilities such as the nearest hospital. Such measures are most accurate, provided that adequate and updated data are available in Geographic Information Systems (GIS) databases and infrastructure asset registers;
• By measurement of notionally objective quantities, but provided by respondents in a survey, such as actual travel time and travel cost. There is thus a measure of subjectivity involved, and as such data are subject to recall, sampling and measurement errors;
• By subjective measures meant to capture respondents’ perceptions or satisfaction with specific issues, for instance using Likert scales.
The GCRO’s QoL Surveys provide potential data on the second and third data types. It should be noted that similar data are also available from other periodically released social surveys, although with variations in wording and geographic representivity. As far as possible the GCRO’s 2011 QoL data are utilised.
We also consider it important to add data from the objective spatial category, as it provides important additional dimensions (e.g. related to accessibility to job opportunities) that cannot be captured with more subjective survey data.
Data inputs that were used in this analysis are classified according to four categories:
1. Within-settlement transport conditions
2. Area-wide accessibility levels
3. Mobility expenditure
4. Person-specific transport satisfaction
3.3.1 within-settlement transport conditionsFour indicators were selected to represent aspects of the travel environment within the settlement.
Access to social services within walking distance of the home
Two indicators were used to reflect the availability of destinations within walking distance of homes in the area, namely:
• % of dwellings that are further than 5km from a primary healthcare facility
• % of population aged 0-18 that is further than 3km from a public school
Data for these indicators were obtained from GCRO’s 50 Priority Wards Project GIS database, calculated at the ward level. Data sources include Eskom and Lightstone for dwelling and population data, and the Gauteng Departments of Health and Education for amenity location data.
Walk time to closest taxi service
This indicator reflects the proximity of taxi transport to the home. Taxis are used both for within-settlement transport and for longer-distance transport. Shorter walking times to taxi routes indicate both a more prolific supply of public transport in an area, and better location of public transport routes relative to households.
Data for this indicator came from the 2011 QoL Survey question that asked respondents to estimate the walking time to the nearest public transport from their home. Since taxi coverage is generally much better in township areas than bus or rail services, and taxis are the most commonly used form of public transport, the assumption is made that this question will give a fair indication of taxi accessibility.
Satisfaction with road quality
The quality of roads around a person’s home affects the difficulty of getting around, especially under wet conditions, when unpaved roads become difficult to use. Unpaved or insufficiently maintained roads also raise travel costs (e.g. vehicle maintenance), and reduce the likelihood that public transport vehicles like minibus-taxis will operate routes close to the home. Lastly, dust and noise have a direct impact on environmental quality.
The QoL Survey asked respondents to rate their satisfaction with the roads they use every day. There is reason to think that the quality of roads in the immediate vicinity of respondents’ dwellings features strongest in their minds when answering this question. For instance, among the residents of the 27 priority townships, 64% of people who responded ‘satisfied’ or ‘very satisfied’ to this question live in formal dwellings, versus 28% in informal dwellings. Both sets face largely the same roads in the larger area, but different roads in their immediate vicinity.
The indicator was used in the form “% of households feeling dissatisfied or very dissatisfied” with roads in the area.
The four indicators were combined into a single Within-settlement Index (SETINDEX). Weights were determined through a principal component analysis, with the objective of weighting the indicators in such a way that the combined index maximises the differences between priority townships – in other words to maximise its ability to discriminate between areas with different internal access characteristics.

Mobility in the GautenG city-ReGion
64
3.3.2 area-wide accessibility levelsArea-wide accessibility was measured using a standard gravity-type accessibility indicator, with the following form:
We measure “difficult to reach” in terms of travel time by two modes:
• Travel time by rail: The total time it takes to walk to the nearest rail station, take a train to the station closest to the job destination, and walk the final distance to the job. Data on actual rail services were used in the estimation.
• Travel time by taxi: The total time it takes to walk to the nearest taxi route or rank, take a taxi to the area of the job destination, and walk the final distance to the job. Since no up-to-date data are available on taxi routes in Gauteng, we used the higher order road network as an approximation of taxi routes, in effect assuming that taxis would primarily follow major roads when selecting routes. This would generally result in underestimation of taxi travel times, but there is no reason to think that the error is larger in some township areas than in others, so the effect on the ultimate QoT Index would likely be minimal.
This resulted in two access indices: ACCINDEX-RAIL and ACCINDEX-TAXI. The importance of this distinction between taxi and rail is based on the observation that these modes play different roles in shaping the access an individual enjoys to the space economy. Taxis provide a base network of accessibility, serving all township areas and therefore playing a large role
in shaping the spatial distribution of access. Rail, by contrast, does not serve all townships, but is important as it provides for lower-cost accessibility to selected destinations. This potential cost advantage is seen as a benefit of living in areas with rail access. Clearly, areas without rail service would score very badly on this indicator as very long walk times would be measured.
For the final QoT Index the two modal indices are combined, equally weighted, into a single composite accessibility index (ACCINDEX). Areas with both good taxi and rail accessibility would score highly on this measure.
The exponential factor used in the Access Index calculation is standard for this type of measure. The function parameter (-0.01) provides a suitable penalty to less accessible locations. To give an idea, jobs that are 30 minutes travel time away are discounted (i.e. ‘made less attractive’) by 25%; jobs that are 60 minutes by 45%; and jobs that are 120 minutes away by 70%.
Jobs data were obtained from the transport model in the Gauteng Transport Study, which has recently been updated. The access indices were calculated for each respondent in the QoL dataset, thus taking their actual home location into account.
Where AIi = Access Index for origin area itij = Travel time (in minutes) between origin i and
destination area jAj = Number of job opportunities in destination zone j
The indicator, in essence, takes each origin zone in turn, and counts the aggregate number of job opportunities in the entire Gauteng that can be accessed from that origin using the existing transport system. However, each job opportunity is discounted by a factor exp(-0.01*tij), that reflects how difficult it is to reach from the origin. Therefore, an origin area that is located close to large employment areas will score higher on the index than an area more isolated from job locations.
Note that this index measures the opportunity afforded by living in a particular location. It is not driven by the actual locations of jobs selected by residents.
AIi = exp (-0.01 tij) Ajall j

Chapter 3 CONSTRUCTING A QUALITY OF TRANSPORT INDEX: GAUTENG’S PRIORITY TOwNShIPS
65
3.3.3 mobility expenditureThe amount of individual and household resources actually spent on travel is an indication of the costliness of accessing opportunities. It is a consumption measure, and therefore reflects the outcome of complex processes of individual behaviour, capability and preference; of the opportunities enjoyed by living in a particular location; and of the allocation of tasks and resources across members of a household as they interact with the spatial economy.
This implies that any measure of the amount of resources spent on travel should be interpreted with care. High travel costs, for example, might be indicative of a highly mobile and active lifestyle, as much as of a disadvantaged location with poor transport options. There is no one-way correlation between mobility expenditure and quality of life.
On the question of how to measure mobility expenditure, we take the view that both monetary and time expenditure should be taken into account. The reason is that time and money are often traded off. Travellers might choose to use less expensive travel modes (such as rail services) in order to save money, but incur longer travel times (slower travel and/or longer walks to/from the public transport). This was confirmed by the existence of a significant negative correlation (p<0.05) between the travel time for the most frequent trip and the percentage of household income spent on public transport use in the QoL dataset. We furthermore acknowledge that, like money, time is a scarce resource that households can choose
to allocate to other activities, and therefore long travel times might indicate relative disadvantage.
To help us understand the role of mobility expenditure in shaping quality of transport, it is helpful to think of how mobility interacts with access (Figure 3.2).
figure 3.2: mobility versus access interactions
MO
BIL
ITY
+
–
ACCESS
+
–
Low accesshigh expensedisadvantaged location, users forced to incur high travel cost to interact.
Low accesslow expensedisadvantaged, travel so costly that users suppress travel.
High accesshigh expense
advantaged, use good location to travel more and further.
High accesslow expense
advantaged, good location is used to reduce travel.

Mobility in the GautenG city-ReGion
66
Areas with both high access levels and high mobility expenditures are relatively advantaged. In this case high travel times and costs can perhaps be interpreted as a choice, and associated with higher satisfaction levels. Some individuals in high-access locations would choose to use their good location to reduce their travel burden, for instance by walking to opportunities close by. They would also be considered relatively advantaged.
Low access levels, on the other hand, can result in either high or low mobility expenditures. If high, it means residents still travel, and thus participate in the economy, but are forced to bear high travel burdens in doing so. Worst off would be residents in low access-low expense areas: isolation might force them to stay at home, and simply not participate in the space economy.
For the purpose of this exercise, we classify priority townships according to this four-quadrant view in order to explore the interaction between accessibility and mobility. We make the case that, since most households in townships fall in the disadvantaged areas of the scale, mobility expenditure has a one-way influence on quality of transport, i.e. higher mobility expenditures correlate with lower quality of transport. However, this is only a first stab at a complex phenomenon that needs further exploration.
A Mobility Expenditure Index (EXPEND) is defined by counting the proportion of individuals in the sample, in each priority township, who reported either:
1. Excessive travel times for their most frequent trip, or
2. Excessively high travel costs, calculated as the percentage of household income spent on public transport by the entire household.
By using either long travel times or high costs to identify households with excessive mobility expenditures, the trade-off between time and cost is accounted for. By expressing travel costs as a percentage of household income, the differing financial means of various households are taken into account.
Excessive in each case is taken as the 75th percentile value, namely a travel time of 52 minutes (one-way) or more, and a percentage of household income spent on public transport of more than 50%. The travel time criterion corresponds approximately to the national benchmark of 60 minutes maximum travel time specified in the White Paper on National Transport Policy (DoT, 1996). The 50% cost criterion far exceeds the typical benchmark of about 10% of income, but this benchmark has been questioned as being inappropriate. Without better information the 75th percentile should serve to discriminate between low and high cost situations.
3.3.4 satisfaction with transportA single question in the QoL Survey asked respondents to rate their satisfaction with the type of transport they took for the longest part of their most frequent trip. While this is an imperfect indication of their satisfaction with transport overall, it is useful as an indication at least of their satisfaction with the transport that affects their lives most significantly. This is entirely subjective, and thus allows for variations in expectations and experiences across the population.
The index (DISSAT) is constructed from the percentage of respondents who felt either dissatisfied or very dissatisfied with their experience of transport.
3.3.5 overall Qot indexSince the various indices described above are calculated using different variables, their scales vary. To allow them to be compared directly, the indices are standardised against the average value for each index across all townships. The average is calculated from the weighted survey data so it accounts for differential sampling rates in different areas.
The standardised index is then expressed as a percentage above or below the average, for instance:
• an index value of 0.00 is identical to the average for the province;
• an index value of 0.50 is 50% higher than the average, and
• an index value of -1.00 is 100% lower than the average.
The four indices were then combined into a single QoT Index. The weighting of each index was calculated using a principal component analysis, with the objective of ensuring that the combined index maximises the differences between priority townships. The weights were as follows:
SETINDEX: +0.382
ACCINDEX: +0.911
EXPEND: -0.539
DISSAT: -0.362
The negative value indicates that expenditure and dissatisfaction contribute negatively to quality of transport, with higher values of the index reducing the overall quality measure. The final QoT Index was once again standardised against the provincial average to allow easy interpretation.

Chapter 3 CONSTRUCTING A QUALITY OF TRANSPORT INDEX: GAUTENG’S PRIORITY TOwNShIPS
67
3.4 Results3.4.1 within-settlement transport conditionsTable 3.1 shows the component indicators and final standardised index for each township. In this table and also those below results are colour coded on a scale, with green being the best and red the worst. Two areas stand out as having poor local access to facilities, namely Refilwe and Hammanskraal. Most other townships have relatively good access to schools and primary healthcare, reflecting perhaps the attention that has been paid to social service in formalised townships in the recent past.
Taxi access is also reasonably good in all areas, with most areas on average between 11 and 14 minutes away from the nearest taxi. This corresponds to what is known about the demand responsiveness and good penetration of minibus taxi operators in formal areas.
Dissatisfaction with local road conditions varies more markedly across townships. Worst performing are Hammanskraal, Winterveldt, Khutsong, Bophelong, and Sharpeville, all of whom have more than half of respondents reporting dissatisfaction.
There appears to be no strong correlation between local access to services, access to taxi, and dissatisfaction with road conditions, suggesting that no single township has been entirely neglected in terms of local transport conditions. Nevertheless, the overall index indicates that Refilwe and Hammanskraal are most disadvantaged, driven perhaps by the semi-rural and low-density nature of these areas.
Priority township
% >5km primary
health% >3km
public schoolWalk time to
taxiDissatisfied with roads
SetindexMean Mean Mean % Dissatisfied
atteridgeville/saulsville 1.57 8.10 14.77 36% -0.48
Boipatong 0.05 0.00 12.73 31% 0.59
Bophelong 3.55 1.46 14.88 57% -0.12
daveyton 0.74 0.99 12.77 34% 0.41
garankuwa 0.00 0.00 14.45 35% 0.54
hammanskraal 22.52 8.43 11.53 87% -2.81
Kagiso 0.00 0.00 13.43 19% 0.58
Katlehong 0.00 0.00 12.74 27% 0.6
Khutsong 2.52 1.40 16.07 64% -0.01
Kwatsaduza 0.41 0.21 13.13 38% 0.5
mabopane 0.00 2.75 13.47 48% 0.27
mamelodi 2.97 0.95 14.37 35% 0.17
mohlakeng 0.05 0.05 12.14 40% 0.61
munsieville 0.31 2.62 15.58 13% 0.2
orlando 0.00 0.00 13.21 15% 0.59
ratanda 9.95 7.31 13.86 34% -1.23
rathibiseng 2.66 2.41 14.08 30% -0.03
refilwe 26.43 16.85 14.25 47% -4.34
sebokeng 0.00 0.00 14.05 48% 0.55
sharpeville 0.00 0.00 11.99 55% 0.62
soshanguve 0.53 0.99 13.71 39% 0.38
soweto (east) 0.00 0.27 12.40 25% 0.58
soweto (west) 0.00 2.35 13.75 39% 0.32
tembisa 1.15 0.64 14.37 30% 0.35
wattville 0.40 0.00 11.00 21% 0.61
winterveldt 1.65 2.99 14.82 62% -0.03
zola 0.00 0.00 13.48 16% 0.58
table 3.1: within-settlement indices

Mobility in the GautenG city-ReGion
68
figure 3.3: within-settlement transport index

Chapter 3 CONSTRUCTING A QUALITY OF TRANSPORT INDEX: GAUTENG’S PRIORITY TOwNShIPS
69
3.4.2 area-wide accessibility levelsOf interest is firstly the combination of taxi and rail access enjoyed by each locality. Figure 3.4 plots the standardised taxi and rail access indices, reflecting both the availability or public transport and the relative proximity of each township to jobs.
figure 3.4 standardised taxi and rail access indices
ACCESS INDEX: TAXI TO ALL JOBS
AC
CE
SS
IND
EX
: RA
IL T
O A
LL J
OB
S
0.4
0.2
0.0
-0.2
-0.4
-0.6
-0.8
-1.0
-1.2
garankuwa
Bophelong
Khutsong
refilwe
hammanskraalrathibisengratanda
mobopane
mamelodi
zola
orlandotembisa
wattville
daveyton atteridgeville
Kwatsaduzamohlakeng
munsieville
Kagiso
soweto (east)
Katlehong
soweto (west)
sebokengsoshanguve
sharpevilleBoipatong
winterveldt
-0.8 -0.6 -0.4 -0.2 0.0 0.2 0.4 0.6

Mobility in the GautenG city-ReGion
70
Only a few townships enjoy superior rail access: the eastern parts of Soweto and Orlando, Wattville, Tembisa and Katlehong. These areas are much advantaged, relatively speaking, by the combination of having a good location close to the core of employment in the province, and good access to train services. On top of that, they also enjoy good taxi accessibility.
The western part of Soweto performs somewhat worse, brought about by its lower proximity to the Johannesburg Central Business District (CBD). Some areas have poor rail access but a good taxi service, notably Atteridgeville/Saulsville, Daveyton, Munsieville, and Kagiso. Some townships, such as Mamelodi and Atteridgeville/Saulsville, have rail access and reasonable proximity to job opportunities, but
receive lower scores on the ACCINDEX-RAIL indicators than expected. The reason for this might lie in the poor location of the railway line on the boundary of the township, requiring potential rail commuters to undertake long walks or internal taxi feeder trips to get to the station, both of which reduce rail accessibility.
Townships in the lower left of the graph are relatively poorest off in terms of access. This is clearly driven by a combination of generally peripheral location, no access to rail and mislocation relative to job pools. Worst off are areas like Garankuwa, Rethabiseng, Bophelong and Ratanda. These are townships where issues of public transport access and/or proximate location of new employment would have to be addressed if the quality of life is to be improved.
miChael CrouCh

Chapter 3 CONSTRUCTING A QUALITY OF TRANSPORT INDEX: GAUTENG’S PRIORITY TOwNShIPS
71
figure 3.5: area-wide accessibility index

Mobility in the GautenG city-ReGion
72
3.4.3 mobility expenditureFigure 3.6 shows the results of the Mobility Expenditure Index, plotted against the overall Accessibility Index (rail and taxi). It appears that only a few townships are in the relatively advantaged position of being in the High Access/Low Expense quadrant, namely Soweto East, Orlando, and Wattville. Residents of these areas use their good location to reduce their travel times or costs. These areas are well served by rail, which, as can be seen here, results in real savings in transport expenditure to households.
figure 3.6 standardised mobility expenditure index versus overall accessibility index
Two areas have good access but high expenditure, namely Tembisa and Katlehong. This could either mean that workers use their good location as a springboard to find better jobs over a larger area, or that the apparently good connectivity by public transport – especially by rail – is not in practice as advantageous as it seems. Further examination of these cases might be useful.
Rethabiseng and Garankuwa stand out as Low Access/High Expense cases – many households in these locations bear extraordinarily high transport burdens to get to and from work. Winterveldt stands out as the worst in the Low Access/Low Expense quadrant, suggesting that people here suffer restricted mobility due to the cost of travelling from this isolated location.
-2 -1.5 -1 -0.5 0.0 0.5 1.0
ACCESS INDEX (TAXI & RAIL)
TRA
NS
PO
RT
EX
PE
ND
ITU
RE
IND
EX0.7
0.6
0.5
-0.4
-0.3
-0.2
-0.1
0.0
--0.1
-0.2
-0.3
-0.4
garankuwa
Bophelong
Khutsong
refilwe
hammanskraal
rathibiseng
ratanda
mobopanemamelodi
zola
orlando
tembisa
wattville
daveyton
atteridgeville
Kwatsaduza
mohlakeng
munsievillesoweto (east)
Katlehong
soweto (west)sebokeng
soshanguvesharpeville
Boipatong
winterveldt
Kagiso
Low accesshigh expense
Low accesslow expense
High accesshigh expense
High accesslow expense

Chapter 3 CONSTRUCTING A QUALITY OF TRANSPORT INDEX: GAUTENG’S PRIORITY TOwNShIPS
73
figure 3.7: mobility expenditure index
-2 -1.5 -1 -0.5 0.0 0.5 1.0

Mobility in the GautenG city-ReGion
74
scale above. These include, for instance, Ratanda, Khutsong, Rethabiseng and Mabopane.
The implication is that the dissatisfaction indicator captures other aspects of transport quality not represented by the rest of the indicators, such as service quality aspects (e.g. safety and comfort). Chapter 2 explored relationships between dissatisfaction levels and mode usage, and identified transport problems in more detail. Further analysis might help to better understand the causes of dissatisfaction.
In terms of its inclusion in the QoT Index, the dissatisfaction indicator is useful precisely because it is uncorrelated with other components of the Index.
Priority townshipPercentage dissatisfied
with transportatteridgeville/saulsville 16%
Boipatong 15%
Bophelong 11%
daveyton 24%
garankuwa 18%
hammanskraal 23%
Kagiso 21%
Katlehong 24%
Khutsong 10%
Kwatsaduza 24%
mabopane 13%
mamelodi 18%
mohlakeng 17%
munsieville 37%
orlando 24%
ratanda 6%
rathibiseng 11%
refilwe 23%
sebokeng 12%
sharpeville 17%
soshanguve 13%
soweto (east) 17%
soweto (west) 18%
tembisa 26%
wattville 21%
winterveldt 17%
zola 13%
table 3.2: satisfaction with transport
3.4.4 satisfaction with transportThe results of this indicator (Table 3.2) show that dissatisfaction is highest in Munsieville (37% of respondents were dissatisfied with the public transport they used). However, the reliability of this result is unclear as the sample size in Munsieville was only 21.
Dissatisfaction levels are around 24% in some large townships like Daveyton, Hammanskraal, Katlehong, Kwatsaduza, Orlando and Tembisa. It is unlikely that dissatisfaction is caused by a single factor – these townships cover a range of locations and accessibility levels, some with rail and some without, with varying population characteristics. Other townships recorded low dissatisfaction levels, despite low accessibility and being classified broadly as disadvantaged on the access-mobility
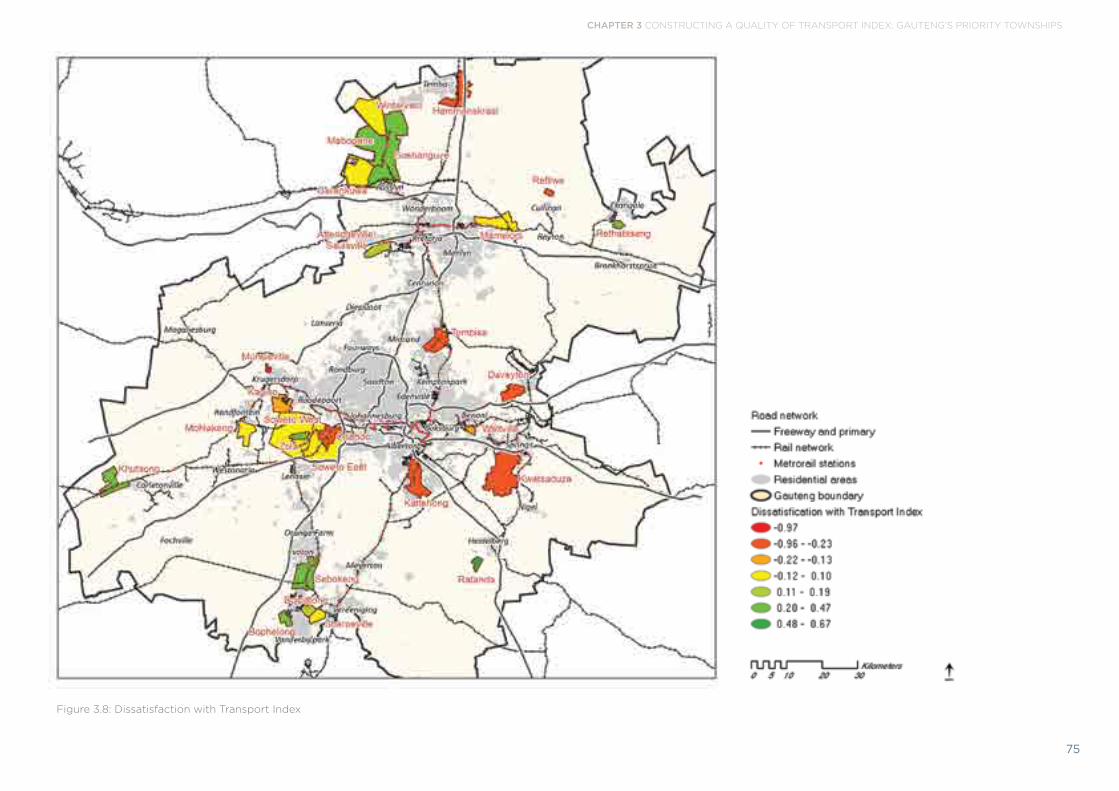
Chapter 3 CONSTRUCTING A QUALITY OF TRANSPORT INDEX: GAUTENG’S PRIORITY TOwNShIPS
75
figure 3.8: dissatisfaction with transport index
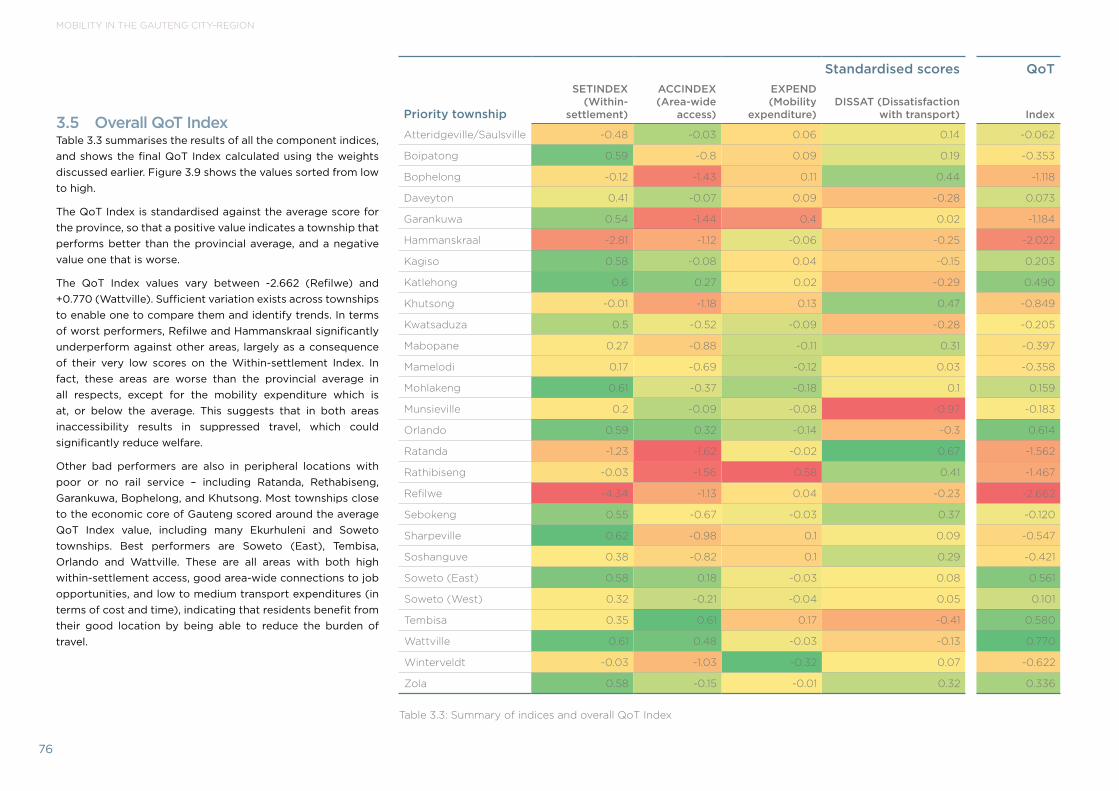
Mobility in the GautenG city-ReGion
76
3.5 Overall QoT IndexTable 3.3 summarises the results of all the component indices, and shows the final QoT Index calculated using the weights discussed earlier. Figure 3.9 shows the values sorted from low to high.
The QoT Index is standardised against the average score for the province, so that a positive value indicates a township that performs better than the provincial average, and a negative value one that is worse.
The QoT Index values vary between -2.662 (Refilwe) and +0.770 (Wattville). Sufficient variation exists across townships to enable one to compare them and identify trends. In terms of worst performers, Refilwe and Hammanskraal significantly underperform against other areas, largely as a consequence of their very low scores on the Within-settlement Index. In fact, these areas are worse than the provincial average in all respects, except for the mobility expenditure which is at, or below the average. This suggests that in both areas inaccessibility results in suppressed travel, which could significantly reduce welfare.
Other bad performers are also in peripheral locations with poor or no rail service – including Ratanda, Rethabiseng, Garankuwa, Bophelong, and Khutsong. Most townships close to the economic core of Gauteng scored around the average QoT Index value, including many Ekurhuleni and Soweto townships. Best performers are Soweto (East), Tembisa, Orlando and Wattville. These are all areas with both high within-settlement access, good area-wide connections to job opportunities, and low to medium transport expenditures (in terms of cost and time), indicating that residents benefit from their good location by being able to reduce the burden of travel.
Standardised scores QoT
Priority township
SETINDEX (Within-
settlement)
ACCINDEX (Area-wide
access)
EXPEND (Mobility
expenditure)DISSAT (Dissatisfaction
with transport) Index
atteridgeville/saulsville -0.48 -0.03 0.06 0.14 -0.062
Boipatong 0.59 -0.8 0.09 0.19 -0.353
Bophelong -0.12 -1.43 0.11 0.44 -1.118
daveyton 0.41 -0.07 0.09 -0.28 0.073
garankuwa 0.54 -1.44 0.4 0.02 -1.184
hammanskraal -2.81 -1.12 -0.06 -0.25 -2.022
Kagiso 0.58 -0.08 0.04 -0.15 0.203
Katlehong 0.6 0.27 0.02 -0.29 0.490
Khutsong -0.01 -1.18 0.13 0.47 -0.849
Kwatsaduza 0.5 -0.52 -0.09 -0.28 -0.205
mabopane 0.27 -0.88 -0.11 0.31 -0.397
mamelodi 0.17 -0.69 -0.12 0.03 -0.358
mohlakeng 0.61 -0.37 -0.18 0.1 0.159
munsieville 0.2 -0.09 -0.08 -0.97 -0.183
orlando 0.59 0.32 -0.14 -0.3 0.614
ratanda -1.23 -1.62 -0.02 0.67 -1.562
rathibiseng -0.03 -1.56 0.58 0.41 -1.467
refilwe -4.34 -1.13 0.04 -0.23 -2.662
sebokeng 0.55 -0.67 -0.03 0.37 -0.120
sharpeville 0.62 -0.98 0.1 0.09 -0.547
soshanguve 0.38 -0.82 0.1 0.29 -0.421
soweto (east) 0.58 0.18 -0.03 0.08 0.561
soweto (west) 0.32 -0.21 -0.04 0.05 0.101
tembisa 0.35 0.61 0.17 -0.41 0.580
wattville 0.61 0.48 -0.03 -0.13 0.770
winterveldt -0.03 -1.03 -0.32 0.07 -0.622
zola 0.58 -0.15 -0.01 0.32 0.336
table 3.3: summary of indices and overall Qot index

Chapter 3 CONSTRUCTING A QUALITY OF TRANSPORT INDEX: GAUTENG’S PRIORITY TOwNShIPS
77
figure 3.9: overall Qot index values (higher is better)
-3.0 -2.5 -2.0 -1.5 -1.0 -0.5 0.0 0.5 1.0
winterveldt
Khutsong
refilwe
hammanskraal
ratanda
rathibiseng
garankuwa
Bophelong
sharpeville
Kwatsaduza
Boipatong
soshanguve
mabopane
mamelodi
munsieville
sebokeng
daveyton
soweto (west)
soweto (east)
Katlehong
mohlakeng
Kagiso
zola
tambisa
orlando
atteridgeville/saulsville
wattville
wiKus Jordaan

Mobility in the GautenG city-ReGion
78
figure 3.10: overall Qot index

Chapter 3 CONSTRUCTING A QUALITY OF TRANSPORT INDEX: GAUTENG’S PRIORITY TOwNShIPS
79
3.5.1 ClusteringA final analysis was undertaken to see if the QoT index can help to cluster priority townships into groups that are largely similar across all their indices. A two-step clustering methodology was applied, producing four distinct clusters that are statistically distinct from each other. The results are show in Table 3.4.
Cluster 1 contains the two worst townships, Refilwe and Hammanskraal. Cluster 2 consists largely of townships with poor area-wide access and relatively high levels of transport expenditure, such as Rethabiseng, Garankuwa and Bophelong. These are thus termed ‘poor access, poor mobility townships’. The average QoT Index score for this group is -1.10.
Cluster 3 comprises the rest of the townships with below-average (negative) QoT scores. These are areas with medium within-settlement and area-wide access levels, and better than average mobility expenditures. The final cluster contains the remaining townships, with high access levels and better than average QoT Index scores. Interestingly, dissatisfaction levels tend to be somewhat higher in this high-performing group than in others.
Setindex Accindex Expend Dissat Cluster
refilwe -4.34 -1.13 0.04 -0.23 Cluster 1: inaccessible townships (avg Qot = -2.34)hammanskraal -2.81 -1.12 -0.06 -0.25
ratanda -1.23 -1.62 -0.02 0.67
Cluster 2: poor access, poor mobility townships (avg Qot = -1.10)
rathibiseng -0.03 -1.56 0.58 0.41
garankuwa 0.54 -1.44 0.4 0.02
Bophelong -0.12 -1.43 0.11 0.44
Khutsong -0.01 -1.18 0.13 0.47
soshanguve 0.38 -0.82 0.1 0.29
winterveldt -0.03 -1.03 -0.32 0.07
Cluster 3: medium access, mobility advantaged townships (avg Qot = -0.35)
sharpeville 0.62 -0.98 0.1 0.09
mabopane 0.27 -0.88 -0.11 0.31
Boipatong 0.59 -0.8 0.09 0.19
mamelodi 0.17 -0.69 -0.12 0.03
sebokeng 0.55 -0.67 -0.03 0.37
Kwatsaduza 0.5 -0.52 -0.09 -0.28
munsieville 0.2 -0.09 -0.08 -0.97
mohlakeng 0.61 -0.37 -0.18 0.1
Cluster 4: high access, mobility advantaged townships (avg Qot = +0.35)
soweto (west) 0.32 -0.21 -0.04 0.05
zola 0.58 -0.15 -0.01 0.32
Kagiso 0.58 -0.08 0.04 -0.15
daveyton 0.41 -0.07 0.09 -0.28
atteridgeville/saulsville -0.48 -0.03 0.06 0.14
soweto (east) 0.58 0.18 -0.03 0.08
Katlehong 0.6 0.27 0.02 -0.29
orlando 0.59 0.32 -0.14 -0.3
wattville 0.61 0.48 -0.03 -0.13
tembisa 0.35 0.61 0.17 -0.41
table 3.4: Clustering of townships according to results on Qot index

Mobility in the GautenG city-ReGion
80
figure 3.11: overall quality of transport – clusters

Chapter 3 CONSTRUCTING A QUALITY OF TRANSPORT INDEX: GAUTENG’S PRIORITY TOwNShIPS
81
3.6 Conclusions The development and preliminary application of a QoT Index was described. The intention was to explore, first, whether a single index that made use of the data collected in the GCRO’s 2011 QoL Survey, supplemented by additional spatial data, could be specified, and second whether such an index could provide a useful way of analysing transport conditions in different areas of Gauteng, discriminating between areas with different problems. The index was applied to 27 priority townships identified by the GPG in its PTP.
The QoT Index seems able to achieve these objectives. It is designed to reflect transport and mobility issues that are relevant to residents in lower income areas, and places greater emphasis on the quality of public transport services than private transport such as cars. The index draws on recent research on mobility, access and livelihoods in low-income urban and rural neighbourhoods. It incorporates, in a statistically rigorous way, aspects of:
• local (within-settlement) transport conditions
• the proximate location of health and education facilities relative to housing
• road conditions within settlements
• user satisfaction with public transport
• the proximate location of townships relative to job opportunities in the wider area
• the connectivity of passenger rail and minibus-taxi networks between residential areas and job locations
• travel speeds and delays; and
• the affordability of public transport relative to incomes.
In theory, the index reflects the impact of conditions across a wide range of spatial development/housing/transport sectors at an aggregate level and may be useful in monitoring interventions and policies in these fields.
The QoT Index allowed us to classify townships into four broad categories:
• ‘Inaccessible townships’ (including Refilwe and Hammanskraal) which have poor within-settlement access as well as poor area-wide access to jobs, leading to some amount of suppressed travel among residents, which could significantly reduce welfare.
• ‘Poor access, poor mobility’ townships with poor area-wide access and relatively high levels of transport expenditure, such as Rethabiseng, Garankuwa and Bophelong. These have below average transport quality, but not as severe as the first group.
• ‘Medium access, mobility advantaged’ townships have somewhat peripheral locations, but enjoy good enough transport connections that most residents can access jobs without undue burdens. These include Mabopane, Sharpeville, Mamelodi and Sebokeng.
• ‘High access, mobility advantaged’ townships are located closest to the cores of job opportunities in Gauteng, and benefit from historic investment in rail services, and local transport and social services infrastructure. These areas include various parts of Soweto, Tembisa, Atteridgeville and some Ekurhuleni townships.
The intention of this work was not to generate policy suggestions on how to improve transport quality in priority townships. More detailed work is needed (and is indeed on-going) for this to happen. Nevertheless, the results suggest some potential policy directions.
While it would be very difficult to significantly improve area-wide access conditions in poorly located and ‘isolated’ areas, local interventions such as social service amenities and selected road upgrading in settlements would help to promote local access. The extension of rail services adds significantly to area-wide accessibility and should be pursued in areas where it is economically and technically feasible. In some cases existing rail infrastructure might be revived to achieve this (such as in Rethabiseng and Khutsong).
Lastly, it seems promising to incorporate the index (or a revised and improved version of it) in on-going monitoring and assessment work that the GPG is doing, whether linked to the PTP or not. It could help track changes over time. It might also be useful to calculate the index for other parts of Gauteng, as the picture presented for the 27 priority townships is certainly not representative of all low-income areas. It would also be instructive to compare the index for smaller geographical units, such as Reconstruction and Development (RDP) settlements versus informal settlements versus formal housing areas within the townships already studied, or for non-traditional residential areas such as CBDs that are competing with townships as destinations for low-income migrants. The feasibility of doing this depends on the existence of large enough sample sizes to produce representative results.

Mobility in the GautenG city-ReGion
82
the household surveys for the 1975 pwv transportation study asked respondents for the starting time of all their trips. the results for white and black respondents in the 1974 pretoria survey are compared in the figures here. they show the percentage of total trips by trip starting times (in half hour increments throughout the day) for four kinds of trips: home-based-work (i.e. trips starting at home and ending at a work destination); home-based-education; home-based-other; and non-home-based (i.e. trips not originating or terminating at home). the afternoon period shows the return journey for each of the trip types for trips starting in pretoria. three clear points emerge from the graphs:
1. the trip making patterns of white and black/african pretoria residents in the mid-1970s was very different in that a large proportion of the trips made by white residents were for education or other purposes (more than half of the trips starting 7:00-7:30 were for education), whereas african residents made virtually no non-work trips.
2. the proportion of trip starting times for whites peaked at 7:00-7:30 in the morning, and for africans a full hour earlier at 6:00-6:30. in the words of the report:
“The morning peak period for blacks is significantly longer than for whites, which reflects the longer travel times. The black peak period stretches from 04h00 to 08h00, reaching a peak at 06h00, while the white peak period stretches from 06h00 to 08h00, reaching a peak at 07h00” (transvaal provincial administration roads department, 1980, p.84).
3 the graphs show the trips starting in pretoria in the morning and starting in pretoria in the afternoon, but the data for the afternoon trips are not only for pretoria residents; it is derived from surveys run in other parts of the region for residents of other areas that travelled home from pretoria. so the graphs reveal not only a pattern of shorter and later-starting trips for white pretoria residents, but also of a larger proportion of african residents travelling into pretoria from other areas and out again in the afternoon, and consequently a pattern of much longer cross-region trips.
in all three respects the graphs show the spatial and socio-economic geography of apartheid: an african population whose daily life in the region was reduced to the jobs they had under the pass system, forced by poor transport connections to start their working day much earlier than white residents, and having to travel long distances across the region to their destinations.
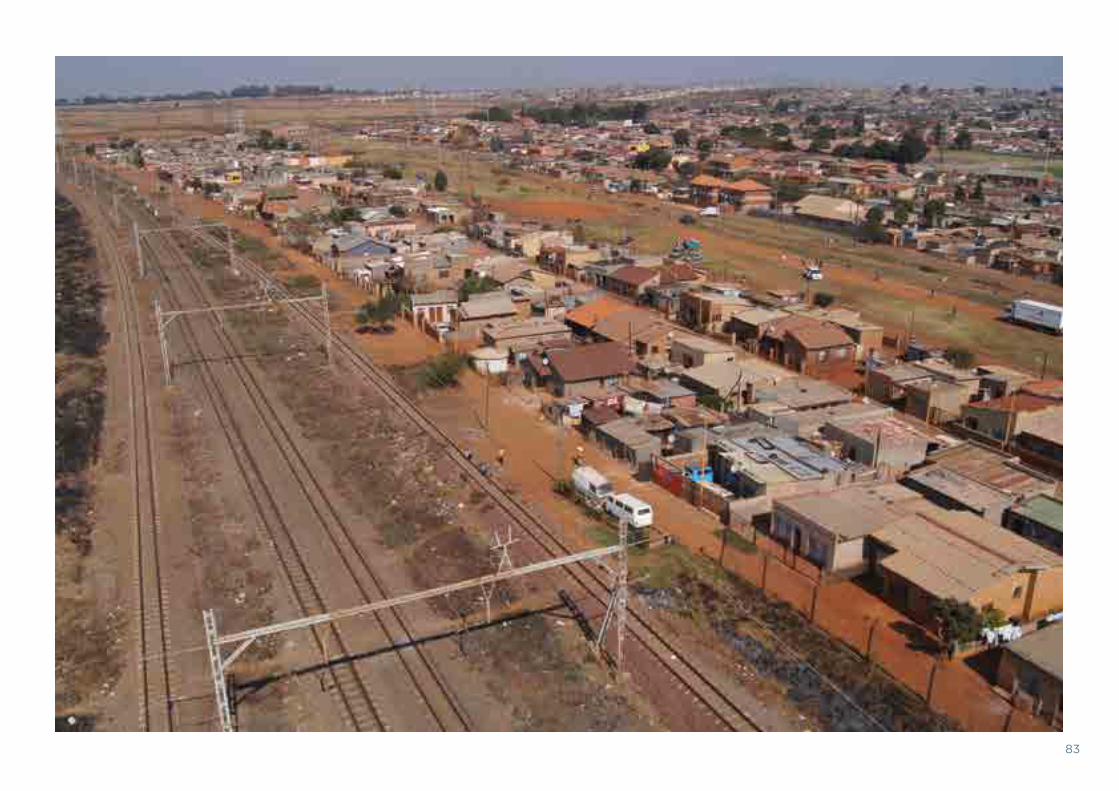
83

Mobility in the GautenG city-ReGion
original photo: guy trangoš

Chapter 4 NEW SPACES OF TRANSPORT IN THE GAUTENG CITY-REGION: A GAUTRAIN ANAlYSIS
85
4.1 IntroductionArchitecture forms the backdrop to daily urban life, and influences the quality of urban experience. Public buildings and spaces are integral to the daily functioning of a city as the public relies on their efficient design and functioning. It follows that it is worth interrogating whether the architecture of key public buildings and spaces, especially those used by millions of people, has a positive or negative impact on the urbanism of a city or region. This work does so through an analysis of the stations and immediately adjacent station-precincts developed as part of the Gautrain Rapid Rail System.
The Gautrain is a rapid rail link that runs across the decentralised and sprawling Gauteng City-Region (GCR), connecting the scattered urban centres of Johannesburg, Pretoria and Ekurhuleni into a highly accessible network, the likes of which the region has never seen before. The Gautrain is the biggest Public-Private Partnership in Africa (CoJ, 2008). The private partner, the Bombela Concession Company (Bombela), holds a 20-year concession to design, build, part finance and operate the Gautrain (Gautrain, 2013a). The Gauteng Provincial Government (GPG) serves as the public partner to whom management of the system will transfer upon expiry of Bombela’s concession. Opened in its final form in 2012, the project cost an estimated R25.4 billion (Venter, 2011) and has already sparked new private property investment, which will have a lasting effect on the future urban form of the GCR.
A network of viaducts, underground tunnels and over 80km of railway track make up the engineering infrastructure of the Gautrain project. The primary north-south spine connects Hatfield, the Pretoria Railway Station and Centurion in Tshwane, to Midrand, Marlboro, Sandton, Rosebank, and Park Station in Johannesburg. A secondary east-west link connects O.R. Tambo International Airport and Rhodesfield stations in Ekurhuleni with Marlboro and Sandton in Johannesburg (Figure 4.1). The system’s initial success is highlighted by the fact that its millionth passenger was celebrated after only a hundred days of operation (Gautrain, 2010).
The development of the Gautrain network has seen the construction of ten new station buildings. Stations are the urban interface of the network and function as new nodal nuclei. They situate the largely invisible network in urban space, enable pedestrians and motorists to transition with ease from the city onto the train, and facilitate the public pooling of pedestrians who wait for commuters, meet at the station, or simply watch the passing traffic. Stations are traditionally centres of urban vitality in themselves, but rely largely on greater spatial infrastructure such as public squares, parks, and plazas to function optimally. These facilitate an ease of movement into and out of stations, and support pedestrian activities such as providing public ablutions, opportunities for nourishment and areas for respite.
Stations such as those developed for the Gautrain also ought to function as public spaces, facilitating public interactions, both in and of themselves and in their connection with their surrounding neighbourhood. Whether they do in fact do so is a vital question in the South African context.
New spaces of transport in the Gauteng City-Region: A Gautrain analysisguy trangoš

Mobility in the GautenG city-ReGion
86
figure 4.1: gautrain route 0 5km 10km N
Pretoria
Centurion
Park
Rosebank
Sandton
Marlboro
OR Tambo
Midrand
Hatfield
Rhodesfield

Chapter 4 NEW SPACES OF TRANSPORT IN THE GAUTENG CITY-REGION: A GAUTRAIN ANAlYSIS
87
South Africa’s apartheid spatial legacy remains entrenched in the GCR today and mobility across the region remains divided sharply along income lines. Edward Soja describes Johannesburg, which here can stand as a proxy for the city-region, as a “polarised city of fortressed urban extremes” (2010, p.40). The socio-economic polarities of the city-region are diverse and extreme. Deep inequality, conservatism, and traditionalism exist despite a celebrated constitution which affords significant and far-reaching rights and freedoms to all. A city of wealth, opportunity and excellent infrastructure exists in the same geographic area as a second disconnected, dislocated and disadvantaged city. In this dual city the extremes seldom overlap, and opportunities for interaction across the divide are limited by increasing privatisation in the form of gated estates, private schools, private hospitals, office parks, and shopping malls (Figure 4.2).
Apartheid segregated public spaces, and the post-apartheid project in the GCR, while successful in providing better amenities to underserviced areas, has not enabled any wide scale mixing of socio-economic groups in public parks
and squares, nor on public transport. The South African National Planning Commission (NPC), in the introduction to its 2030 National Development Plan, envisions a country “[…] where opportunity is determined not by birth, but by ability, education and hard work” (NPC, 2011, p.14). Central to ensuring that residents have access to opportunity is the provision of quality public transport. As a result, the Gauteng Department of Roads and Transport (GDRT) has identified reliable and efficient public transport as an essential ingredient of improving the quality of residents’ lives (GDRT, 2013a).
Within this, well designed and considered public space – important for the optimal functioning of public transport – has the ability to undermine unequal spatial and social structures, trigger new public urban cultures, and facilitate a socio-economic blurring. A significant dual opportunity therefore existed in the construction of the Gautrain, both to connect urban nuclei, and also to ensure that the stations, as the key points of connection, embed themselves in the space and culture of these urban centres, igniting a network of vibrant, democratic, inclusionary and truly public urban nodes.
The city is not confined to the spatial scale of the building, or indeed even that of the
city itself, but encompasses the whole, mulitscalar landscape produced by human activity: from the corporeal to the global,
the worldly to the intimate. (Borden et al., 2002, p.5)

Mobility in the GautenG city-ReGion
88
This chapter considers whether this dual opportunity has been realised in the design of how the Gautrain stations link to their immediately surrounding urban space.
It is important to define the scale of analysis that gives a specific focus to this research. While the Gautrain transport network operates at a city-region scale, the concern in this chapter is not with how the system works as a region-wide connector between places. Rather, it is the local pedestrian scale of the public realm immediately adjacent to the stations and the neighbourhood scale of the station precincts that are interrogated (Figure 4.3).
At the local pedestrian scale the interface between the Gautrain station and the commuter is crucial. Here it is important to interrogate intimate scale spatial gestures, relationships and tensions established between the station buildings and the public spaces surrounding them.
An analysis of the neighbourhood scale of Gautrain stations contextualises urban interventions such as new sidewalks, and bus and parking infrastructure in relation to their environments. For example, questions of pedestrian access such as pedestrian connectivity, an enhanced pedestrian environment, the provision of signage and maps, feeder services, and vehicular pick-up points in relation to the wider urban environment are key. Conceptualised primarily through Urban Design Frameworks (UDFs), the neighbourhood scale of the station allows an understanding of the physical, but also social and economic rootedness of Gautrain infrastructure in different urban contexts.
figure 4.2: view of northern Johannesburg’s highly secured, car-centric landscape (above). entrances into the nelson mandela square multi-storey parking lot in sandton, Johannesburg, which pedestrians are forced to cross for lack of better pedestrian infrastructure (below). (source: guy trangoš)

Chapter 4 NEW SPACES OF TRANSPORT IN THE GAUTENG CITY-REGION: A GAUTRAIN ANAlYSIS
89
figure 4.3: two scales of analysis around the station, the local pedestrian scale, and the wider neighbourhood scale
Four Gautrain stations in Johannesburg are analysed in this chapter. Each offers a different socio-economic and urban context within the same policy environment. The four stations are Sandton – at the heart of the GCR’s financial centre; Rosebank – a leafy commercial and retail node; Marlboro – a precinct on the edge of dense and underdeveloped Alexandra; and Park Station – in the heart of Johannesburg’s historical inner city and adjacent to the city’s primary train station. The different stations demonstrate a diversity of urban conditions and underscore the importance of a nuanced approach to urban and architectural design on an infrastructure project of this scale.
This chapter is divided into a number of research undertakings. Firstly, a brief historical overview of the city-region’s transport legacy provides a context in which to better understand decisions relating to the implementation of the Gautrain. Following this, the City of Johannesburg’s general spatial and Transit Oriented Development (TOD) Policy is analysed to determine the guidance it gives to development around stations, and whether this is likely to positively catalyse dense, mixed-use, and pedestrian oriented urban nodes. Next, a review of the spatial decisions made by the architects, urban designers, and engineers in each of the four Gautrain stations in turn gives an overarching view of the quality of the urban environment created by the transport intervention in relation to its various urban contexts. Finally, the chapter offers a number of policy recommendations in order to bolster an argument for greater involvement by built-environment design professions in future large-scale and regional public transport projects.
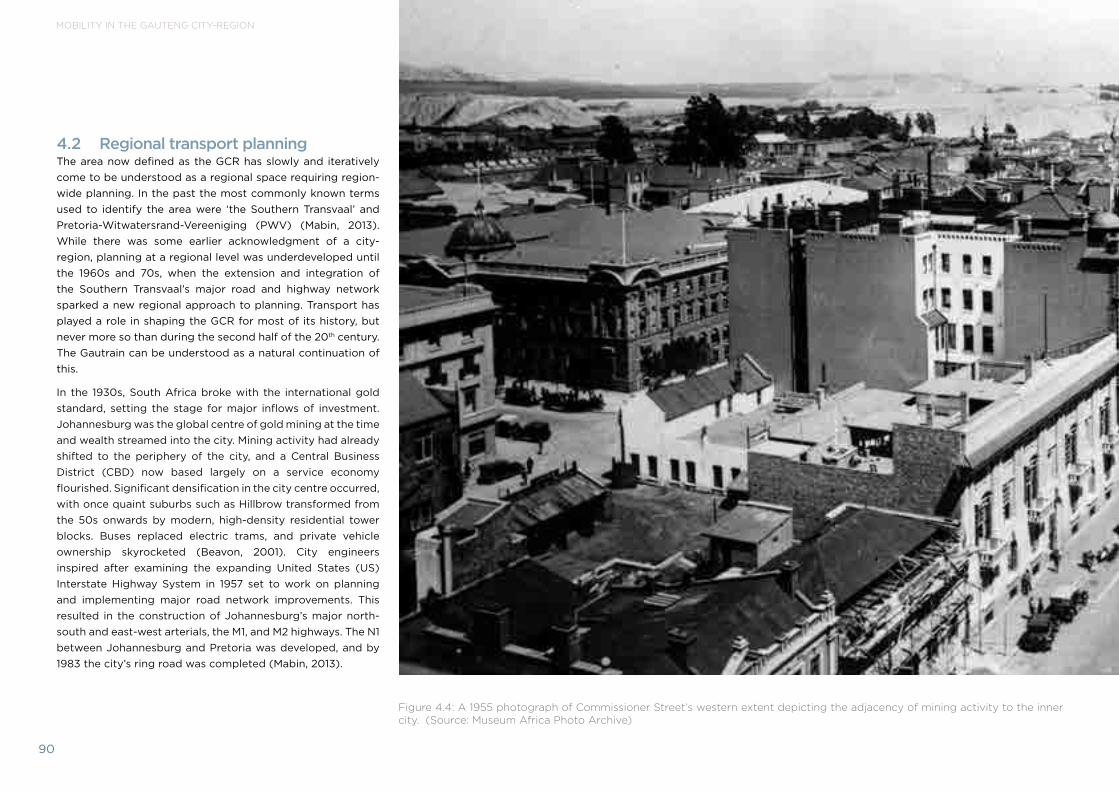
Mobility in the GautenG city-ReGion
90
4.2 Regional transport planningThe area now defined as the GCR has slowly and iteratively come to be understood as a regional space requiring region-wide planning. In the past the most commonly known terms used to identify the area were ‘the Southern Transvaal’ and Pretoria-Witwatersrand-Vereeniging (PWV) (Mabin, 2013). While there was some earlier acknowledgment of a city-region, planning at a regional level was underdeveloped until the 1960s and 70s, when the extension and integration of the Southern Transvaal’s major road and highway network sparked a new regional approach to planning. Transport has played a role in shaping the GCR for most of its history, but never more so than during the second half of the 20th century. The Gautrain can be understood as a natural continuation of this.
In the 1930s, South Africa broke with the international gold standard, setting the stage for major inflows of investment. Johannesburg was the global centre of gold mining at the time and wealth streamed into the city. Mining activity had already shifted to the periphery of the city, and a Central Business District (CBD) now based largely on a service economy flourished. Significant densification in the city centre occurred, with once quaint suburbs such as Hillbrow transformed from the 50s onwards by modern, high-density residential tower blocks. Buses replaced electric trams, and private vehicle ownership skyrocketed (Beavon, 2001). City engineers inspired after examining the expanding United States (US) Interstate Highway System in 1957 set to work on planning and implementing major road network improvements. This resulted in the construction of Johannesburg’s major north-south and east-west arterials, the M1, and M2 highways. The N1 between Johannesburg and Pretoria was developed, and by 1983 the city’s ring road was completed (Mabin, 2013).
figure 4.4: a 1955 photograph of Commissioner street’s western extent depicting the adjacency of mining activity to the inner city. (source: museum africa photo archive)

Chapter 4 NEW SPACES OF TRANSPORT IN THE GAUTENG CITY-REGION: A GAUTRAIN ANAlYSIS
91
Mobility in the GautenG city-ReGion
92
While transport engineers imagined new opportunities for an expanded regional network during the 1960s, apartheid was in full force and national government continued to fine-tune their divisionary policies. Fearing a rapid increase in South Africa’s black urban population, ‘separate development’ in cities was accelerated. A cornerstone of apartheid planning was the promotion and enforcement (for residents who were not white) of wide scale decentralisation and decongestion. This inexorably led to a sprawling, spatially dislocated and ghettoised region.
At the same time, the business community came together to plan future scenarios for the Southern Transvaal based on the final depletion of gold. Their call, through a new planning vehicle – the Southern Transvaal Regional Development Association (STRADA) – was for centralisation and development in Southern Transvaal in order to facilitate increased investment (Mabin, 2013). Mabin (2013) infers that STRADA’s greatest legacy was perhaps the mobilisation of public sentiment around the importance of planning a new freeway network that connected the region, opposing the mere intra-city links being planned or developed at the time.
In the late 1970s, city engineer E. J. Hall presented an address to the Johannesburg City Council arguing the need for an underground railway network in the city (Malcomess and Kreutzfeldt, 2013). This was perhaps the first glimpse of a rapid rail network plan, but not a regional Gautrain. It is unlikely that
the Johannesburg underground would have extended beyond the city’s municipal borders, or be considered viable beyond Johannesburg’s dense inner city.
From 1976 through the 80s, South Africa fell into a period of political strife as local and international movements actively challenged apartheid policies. South Africa slipped deeper into sanctions and significant international disinvestment occurred. As a result, infrastructure development slowed towards the mid-80s. The dissolution of apartheid in the late 1980s and early 1990s saw the conceptualisation of an inclusive PWV region. However, while the voices of more actors and organisations were heard, as Mabin (2013) notes, transport planning still followed outdated plans developed in the 70s.
In the early 1990s, the so-called PWV Consortium undertook the important Vectura Public Transport Study (Van der Merwe et al., 2001). The report flagged the route between Johannesburg and Pretoria as one of the ten most important provincial transport corridors in the PWV and emphasised the need for a public transport corridor (GDTPW, 2000). Specifically, the Vectura report added that, “the potential exists to align a future light rail system so that it links existing activity nodes at both ends (Johannesburg and Pretoria) and in between, notably the Midrand and Verwoerdburg central areas” (Mabin, 2013, p.48).
By the mid-90s, the N1 freeway between Johannesburg and Pretoria, and the corridor connecting Johannesburg to the international airport, were the fastest developing areas in South Africa (Mabin, 2013, p.48). In 1994, the PWV region became Gauteng Province. The province’s first Premier visited Germany and a rail link between Johannesburg and Pretoria was earmarked as a potential opportunity for collaboration (Mabin, 2013, p.49).
During February 2000, after a pre-feasibility and feasibility study found rapid rail transport financially workable, Gauteng Premier and Gautrain flag bearer, Mbhazima Shilowa announced plans to construct the Gautrain. The project was earmarked as one of ten Blue IQ Spatial Development Initiatives (GDTPW, 2000, p.1). The key aim of the project was to alleviate traffic congestion on the N1 freeway between Johannesburg and Pretoria by providing a fast and reliable alternative, while promoting economic growth in the province. Increased traffic congestion ensured amplified public acceptance of the rapid rail link between Gauteng’s two major urban centres and the international airport.
Construction began in 2006 and by 2010, just ahead of the FIFA World Cup in South Africa, the Sandton to airport link of the network opened. The following year the entire system became operational and Park Station opened in 2012.
Chapter 4 NEW SPACES OF TRANSPORT IN THE GAUTENG CITY-REGION: A GAUTRAIN ANAlYSIS
93
4.3 Spatial policy around the implementation of the Gautrain The formation of policy around the Gautrain has been a complex undertaking. While the Gauteng Province and the concessionaire retain an operational-level oversight, the three municipalities affected by the project have each had to develop their own spatial guidelines, TOD policies, local urban design, and spatial development frameworks. Kamini Pillay, Director of Development Planning at the City of Johannesburg, notes that with sudden movement around the implementation of the Gautrain in 2007, the City of Johannesburg had to swiftly develop these guidelines and policies to lead the development of the station precincts or lose out on the opportunity (Pillay, pers. comm., 2013).
A review of the policy documents developed by the City of Johannesburg includes: (i) Johannesburg Gautrain Functional Area Guidelines; (ii) City of Johannesburg Station UDFs; and (iii) City of Johannesburg TOD Policy. While this is not an exhaustive review of every policy document influencing the planning and construction of the Gautrain project’s Johannesburg stations, these documents do provide an insight to the key spatial principles developed by the city.
4.3.1 Johannesburg gautrain functional area guidelines 2003The Johannesburg Gautrain Functional Area Guidelines were developed by the Gautrain Land Use Planning Committee in 2003. The committee, comprised of planning officials from the three affected municipalities and the Gautrain project team, developed planning recommendations for each station precinct.
The report introduces the Gautrain planning philosophy as ensuring that “the spatial development for the Gautrain centres around the exigency of seeking a new urban form that can and will support the proposed rail system” (Gautrain Land Use Planning Committee, 2003, p.2). Each station was described as requiring a “unique solution to advance future development” (Gautrain Land Use Planning Committee, 2003, p.2).
Key principles informing the development of the proposed stations call for residential densities around stations to be high enough to attain acceptable ridership levels, failing which a feeder system (Gautrain buses) would be necessary. They also note the promotion of ease of access as a key component for a zone of 500m around the stations in order to prioritise pedestrian movement. The principles also highlight – in the interests of achieving trip generation throughout the day – the importance of creating a diversity of land uses surrounding the station, including residential, retail, and office developments at medium to high densities (Gautrain Land Use Planning Committee, 2003). All opportunities identified by the report attempt to generate or promote ridership. These include the creation of greater densities, the promotion of mixed land uses, and the establishment of a new urban form. However, at no point is the physical design of the stations themselves or the public spaces surrounding the stations listed as an opportunity to create ridership, boost development, or positively reshape the city’s urban form.

Mobility in the GautenG city-ReGion
94
4.3.2 City of Johannesburg station urban design frameworks, 2008
A review of the UDFs developed for the four case-study station precincts was undertaken in order to distil their key principles and approaches. While these documents are analysed in detail later on in this chapter, the principles guiding the UDFs offer insight into Gautrain planning from the perspective of the City of Johannesburg.
The Sandton, Rosebank and Marlboro UDFs were developed by almost identical consultant teams. A different consulting team developed the Park Station UDF. Thus, the same UDF principles were applied to Sandton, Rosebank and Marlboro stations despite all three being distinctly different urban environments (Akanya Development Solutions et al., 2008a; Akanya Development Solutions et al., 2008b). The principles outlined for Sandton, Rosebank, and Marlboro promote:
• Compact, pedestrian-friendly neighbourhoods. Routes should be convenient, comfortable, direct, and safe, both to and from all transit stations in order to promote the use of public transport and encourage walking and cycling.
• Distinctive and attractive communities built around the location of the station. The stations should create unique environments, which provide a community portal to vibrant mixed-use areas and activities. They should use existing features in the area, such as vegetation, to maintain a local character.
• Transit supportive land uses. Supportive land uses should be located close to the node to support socio-economic growth.
• Mixed-use activities along the street and through the height of a building, combined with a city-wide transport network that emphasises local pedestrian movement. This should deliver increased services and employment opportunities and offer more choices for housing within walking distance of the node. Retail activities placed alongside these areas promote further ground-floor activity and enhance the image of the neighbourhood.
• Increased densification and a range of housing options. This will increase transit patronage within walking distance of the station and cater for people of different income levels and different life stages, while maintaining a high quality of design.
• Reduced dependency on private cars and managed parking. Provide a variety of well managed, integrated transport choices including parking, bus, taxi, car, rail, bicycles, and pedestrian facilities.
• Adequate service provision and management.
• Engagement and communication. (Akanya Development Solutions et al., 2008a, p.87; Akanya Development Solutions et al., 2008b, p.85; Akanya Development Solutions and Karabo Consulting, 2008, p.67)
The Park Station UDF’s consulting team chose to define their UDF structuring principles as objectives (Osmond Lange Architects and Planners et al., 2008). These include:
• To increase capacity (for long distance buses and taxis)
• To improve efficiency of intermodal interchange
• To improve accessibility to the area by both pedestrians and motorists
• To improve legibility within the area
• To improve safety and security in the area
• To make special places and experiences
• To promote social integration and inclusion
• To create jobs and economic opportunities in the area
• To upgrade existing and provide new social amenities
• To conserve and develop the heritage of the area
• To develop public open space in the area
• To balance the interests of land uses and users
• To provide housing of different types and tenures (Osmond Lange Architects and Planners et al., 2008)
Chapter 4 NEW SPACES OF TRANSPORT IN THE GAUTENG CITY-REGION: A GAUTRAIN ANAlYSIS
95
All four UDF documents realise a complex analysis and urban design strategy for each node in addition to the introductory principles. However, the scale of analysis in all four documents negates the possibility of developing a spatial relationship between Gautrain stations and their surrounding context. A multiscalar analysis looking at the local pedestrian and neighbourhood scales of the station infrastructure – relating to building heights, land use, ease of accessibility and the proportions of a station and surrounding buildings to open space – would have usefully shaped the quality of interface and public space required. Without guidelines specific to each urban context, these relationships risk being left open to broad interpretation by property developers, architects and engineers.
4.3.3 City of Johannesburg transport oriented development (tod) policy 2009
The formal announcement of the Gautrain project in 2007, as well as the design of the City of Johannesburg’s Rea Vaya Bus Rapid Transit (BRT) in advance of the FIFA World Cup 2010, stimulated the development of a TOD Policy for the City of Johannesburg. The aim of this policy was to “develop more detailed frameworks to guide the integration of station precincts with the surrounding urban fabric” (CoJ, 2009, p.2). In a sense the document works to develop approaches to what Marcel Smets defines as ‘the intermediate scale’, where
consensus is forged between different interest groups in order to achieve a “collective project with public spaces that will also provide economic benefit” (Kagner, 2013).
The report uses California’s definition to outline TOD as “a moderate to higher density development, located within an easy walk of a transit stop, generally with a mix of residential, employment and shopping opportunities, designed for pedestrians, without excluding the auto” (CoJ, 2009, p.2). After outlining the importance of TOD in Johannesburg and establishing a policy requirement, the report defines the importance of creating ‘transit centred communities.’ Extracts from the section include the following:
• “The design and position of the station should foster the creation of an activity centre that surrounds the station on all sides,
• The design of the station should be of high quality and reflect the character of the surrounding community,
• Engaging public spaces, attractive street furniture, and public art should be included,
• Pedestrian connections should be promoted through the creation of compact blocks; pleasant walkways and comfortable, well-marked and active street frontages” (CoJ, 2009, p.6).
In addition, the policy recommends making retail development market-driven and not transit-driven; it makes an appeal for mixed-use development and places an emphasis on the need for housing around transit hubs; and it outlines a requirement to engage corporate attention.
Of the list of TOD Standards in the TOD Policy, the ‘Standards for Public Space’ section is most relevant to station design. It notes that “a percentage of land in the station precinct area needs to be put aside for public open space and future community facilities when the development reaches its full potential” (CoJ, 2009, p.12). The document concludes with a series of mechanisms to enable TOD.

Mobility in the GautenG city-ReGion
96
4.4 The importance of public spaceThe strategic objectives of the Gautrain project include changing Gauteng’s sprawling urban landscape by promoting high-density TOD, encouraging the use of public transport, facilitating socio-economic development and reducing congestion on the Gauteng road network (Joubert, pers. comm., 2013). The provision of public space is central to achieving these strategic objectives as it serves as the central nexus of TOD, and assists in socio-economic development through facilitating different types of business, sports and culture.
Public space is defined by Raoul Bunschoten (2002, p.5) as an “instrument for change in society.” Lindsay Bremner (2010, p.256) describes Johannesburg’s existing ‘public spaces’ as, “…theatres of consumption and display...[which]...serve for many as their only experience of some form of public life.”
Public plazas, pavements, and parks serve to democratise urban space and society by creating opportunities for different social and economic groups to interact. The central role of built-environment design professions in ensuring public space is both open and democratic underscores the importance of design in shaping the urban public realm. Understanding how the public use public space while enabling flexible and enticing open spaces is central to the work of Jan Gehl Architects.
Jan Gehl (2011) has classified activities in public space into necessary, optional and social activities. He defines ‘necessary activities’ as those that individuals have to complete during their day (e.g. going to work, delivering post) and ‘optional activities’ as those exercised by individuals, time and place permitting (e.g. eating lunch, reading the newspaper, sitting in the sun). By comparing these activities to the quality of physical environment in which they happen, Gehl naturally concludes that necessary activities take place in good environments marginally more than in poor quality environments, while optional activities overwhelmingly take place in good environments rather than poor quality environments. The resulting social activities, which are an interaction of both necessary and optional activities, favour good quality physical environments over poor alternatives. Through his research, Gehl presents the diversity of public spaces available to designers, and highlights the importance of creating different spaces suited to different users within the same urban environment. The need to ensure a well functioning quality public realm is clear, but what does a good public realm look like and what is the role of architecture in shaping it?
William H. Whyte (1980) developed an understanding of successful and unsuccessful public spaces in New York during the 1970s. His research combined a candid analysis of human interaction and body language in relation to the ebbs and flow of specific public spaces. Surprisingly, his main conclusion was that the adequate provision of considered and flexible seating in public spaces radically improved these spaces. This emphasizes the role of design in creating successful public spaces. Bunschoten (2002, p.6) states that “...public spaces need room – fields to play and act in, and objects to play with, identify with, and react against. This is architecture. The rest is city life.” It is through the manipulation of these fields (the hard and soft public space landscapes), and the careful design and provision of urban artefacts (the seating, planting, artworks, follies and quirks of the public realm) that vibrant public space emerges.

Chapter 4 NEW SPACES OF TRANSPORT IN THE GAUTENG CITY-REGION: A GAUTRAIN ANAlYSIS
97
figure 4.5: the pedestrianisation of times square, Jan gehl architects (source: henderson, n.d.)

Mobility in the GautenG city-ReGion
98
Architecture directly affects public space. Forty describes the relationship between public space and public architecture as often being governed by the purposes of the owner, with the user’s experience being subservient to the prescribed means with which the owner has deemed the public spaces are used (Forty, 2002, p.208). He describes the democratic nature of London’s Royal Festival Hall as being created through the blurring of ownership:
Whoever you are, once you enter through the original main entrance at ground level, and stand with the space unfolding in front of you...the same experience occurs for everyone else who enters the building, and so the result is the sense of an equal right to the possession of the building, and an absence of any commanding authority. (forty, 2002, p.208)
Forty’s notion of ‘equal social worth’ within public space speaks to the importance of its design, and the integral role it plays in creating spaces of democracy and equality, where all users feel a sense of ownership and a natural right to participate.
The flexibility, uncertainty and temporality of space alluded to by Forty is absent in the Gautrain project. Rigid security and control are reflected in the austere architectural language of the stations and the harsh public spaces beyond, even though pedestrian or, more specifically, commuter mobility is central to the spatial strategy and success of the Gautrain network.
figure 4.6: rules for commuting on the gautrain (source: gautrain, 2013b)

Chapter 4 NEW SPACES OF TRANSPORT IN THE GAUTENG CITY-REGION: A GAUTRAIN ANAlYSIS
99
4.5 The architecture and public space strategies of the Gautrain
The architecture of the stations and the public realms they adjoin does not facilitate connectivity – “the ease of moving between origins and destination within the existing street and sidewalk-pathway structure” (Saelens et al., 2003, p.82). Mobility combined with connectivity does not imply an obstacle free pedestrian thoroughfare, but a multidimensional, multiscalar, underdetermined and flexible public realm that would benefit both pedestrians and Gautrain commuters.
Central to the Gautrain’s spatial design strategy is the development of a conceptual approach based somewhat obscurely around paths connecting ‘typical African rural communities’. Specifically, the strategy describes that “The idea was to compare the stations to nodes along a path that will connect the municipalities of Gauteng together” (Gautrain, 2013c). The analogy continues as it describes the architectural strategy of the stations being drawn from the idea of a ‘tree,’ which “symbolises protection and an anchor for community” (Gautrain, 2013c). More specifically, the tree was interpreted literally as the structural branches in the station architecture, complemented by the roofing structure’s ‘waves’ that are said to represent acacia canopies. Colour and texture, “celebrating the wealth of natural materials available in South Africa” were used in “visible but inaccessible areas” (Gautrain, 2013c). It was also noted that the architecture of the stations should “provide a maintenance-friendly, durable, neutral backdrop so that signage is clearly legible” (Gautrain, 2013c).
Each station was also assigned a theme according to a specific, and at times arbitrary, attribute. These range from the predictable Retail (Rosebank), Commerce (Sandton) and Industry (Rhodesfield) to the obscure Tribute to the Nation (O.R Tambo International Airport), and Gateway to Gauteng (Midrand) (Gautrain, 2013d). Each theme is expressed in the architecture of the station, for example, parts of Rosebank Station are decorated with colourful tiles representing a “multinational shopping and entertainment environment” (Gautrain, 2013d). The use of quotes from building professional Tobie Lochner, who has “a passion for architecture and design”, on the Gautrain’s webpage outlining the station themes, reveals the negligible role of architects as spatial visionaries on what is largely viewed by Gautrain as an engineering project (Gautrain, 2013d).
The resultant spatial expression of the Gautrain stations is a-contextual and singular. Flat metaphors result in a significant disjuncture between stations and their adjacent public space. This highlights the extent to which the urban design and architecture professions were used to embellish infrastructure as opposed to creating inclusive, vibrant and public interchanges rooted in their African, and more importantly, different urban contexts.
The tension between engineering project and architectural project could have been mitigated through the recognition
of the value and role of architecture and urban design in the project. Architects, urban planners, and urban designers could have guided a station and public realm design process rooted in African and Johannesburg (as well as other city) place making.
The Gautrain project presented an important opportunity to reshape Gauteng’s urban centres through capturing the innovative spirit of the infrastructure in its architecture and public spaces. Architect, urban planner and Vlaams Boumeester Marcel Smets, describes the need for designers to “...not create objects that serve as machines in the park, but rather create an infrastructure that makes the park whole” (Kagner, 2013). The resultant planning of the Gautrain project resulted in fragmented machines littered in incoherent space. Stations emerge in urban centres with a smattering of trees, concrete benches and inappropriate lighting, which are lost and unrelated in urban space, disconnected from the surrounding city.
As Cervero (1998, p.408) describes, “Rail stops and the civic spaces that surround them are often town gathering spots. They are places where people congregate during national holidays, community celebrations, and public protests...through conscious design, transit is both physically and symbolically at the community’s core.” The Gautrain in its present form does not achieve these ideals, and while the network is relatively new, it has not yet been able to provoke a public commuter culture.
Rail stops and the civic spaces that surround them are often town gathering spots. They are places where people
congregate during national holidays, community celebrations, and public protests...through conscious design, transit is both
physically and symbolically at the community’s core.(Cervero, 1998, p.408)

Mobility in the GautenG city-ReGion
100
4.6 Interrogating station designIn a few cases the embedding of strategic transport infrastructure in the urban centres of a fragmented GCR with a legacy of public transport under provision has catalysed private development. Of course, it is not possible to explore the long-term effects on the built environment or urbanism in the station precincts because the system has only recently been completed. However, the preliminary evidence suggests that the development sparked by the public transport project has not stimulated a new public culture, nor has it spatially reoriented the city-region’s streets into pedestrian friendly environments. Instead, the majority of these developments could be described as Transit Adjacent Developments (TADs), where an overprovision of parking and an absence of good sidewalk connections render them unfriendly to the pedestrian or commuter (Cervero, 2007). A spatial analysis of the designs in and around four stations in Johannesburg suggests that part of the reason for this is an inappropriately similar, only slightly modified, design strategy applied to each, despite the range of urban contexts.
4.6.1 sandtonSituated in the financial heart of the GCR at the intersection of Rivonia Road and West Street in Johannesburg’s most prominent decentralised urban node, the Sandton Gautrain station had the second highest ridership after the O.R. Tambo International Airport link in March 2013, according to the most up to date source of ridership statistics available for this research (Gautrain, 2013e).
The Sandton area has experienced fast-paced development over the past 30 years (Akanya Development Solutions et al., 2008b), much of which has followed the relocation of the Johannesburg Stock Exchange from the inner-city to its present site near the Sandton City shopping complex and Nelson Mandela Square. Large vehicle oriented corporate headquarters, which are relatively low-rise and expand over entire urban blocks, dominate Sandton’s built form, with the exception of a few new tall buildings. The development of the Gautrain station within easy walking distance of the area’s two malls and major corporate headquarters has injected the elusive middle-class pedestrian into a node that chronically underprovides for the needs of anyone needing or wanting to walk.
The station’s eastern edge and entrance connects to a public forecourt. Across the road, almost every site opposite the Gautrain has either been developed rapidly into modern office blocks or bought for redevelopment. The feasibility of these new buildings is premised on reducing commuter times for employees, and increasing connections to Pretoria, the inner city, and O.R. Tambo International Airport.

Chapter 4 NEW SPACES OF TRANSPORT IN THE GAUTENG CITY-REGION: A GAUTRAIN ANAlYSIS
101
figure 4.7: sandton station and surrounds: 1. sandton Convention Centre, 2. nelson mandela square, 3. sandton City shopping Centre, 4. phase 2 of the development adjacent to the gautrain, 5. alexander forbes, 6. gautrain radisson Blu hotel

Mobility in the GautenG city-ReGion
102
Sandton UDF
The UDF developed for Sandton emphasises the importance of Sandton becoming a “magnet of activity to the area as a whole” (Akanya Development Solutions et al., 2008b, p.20). Importantly, and unlike other Gautrain stations, the Sandton Station was planned as part of a larger development to the west of the current station. The first completed phase included the construction of a new podium level that mediates the slope between the Gautrain station and Nelson Mandela Square slightly above it. The basic premise of the podium is to enable free movement through Nelson Mandela Square terminating at the station. The podium conceals three levels of parking, an underground taxi rank, and the Gautrain bus station. The second phase, which remains unbuilt, will see the construction of a mixed-use development on the podium, and a connection between the podium and Nelson Mandela Square formalised.
figure 4.8: sandton station podium phasing (above), sandton development areas (below). (source: akanya development solutions et al., 2008b, p.27 (above); akanya development solutions et al., 2008b, p.105 (below))

Chapter 4 NEW SPACES OF TRANSPORT IN THE GAUTENG CITY-REGION: A GAUTRAIN ANAlYSIS
103
Conceptualised at the centre of a TOD node, the Gautrain station should be providing easy pedestrian links to taxi infrastructure, the BRT network, the Metro Bus and parking facilities. The delayed implementation of the BRT, and Sandton’s large, impermeable and in most instances fenced urban blocks, remain as barriers to the development of an integrated and viable pedestrian network.
As part of the process of developing the Sandton UDF, the urban block sizes and the connectivity of the street grid were analysed using a Space Syntax approach (Figure 4.9). Space Syntax is a computer-based modelling tool conceived by Bill Hillier and originally developed as a means to assist architects to evaluate the social effects of their designs. The approach analyses urban block sizes and highlights the connectivity or accessibility of roads and access ways. For Sandton, the results showed that while roads near to the Gautrain station offer increased connectivity, many shorter roads do not, as they are either parking lot entrances or cul-de-sacs.
figure 4.9: sandton and rosebank pedestrian space syntax analysis. (source: akanya development solutions et al., 2008b, p.27)
Sandton
Rosebank

Mobility in the GautenG city-ReGion
media CluB south afriCa and gautrain

Chapter 4 NEW SPACES OF TRANSPORT IN THE GAUTENG CITY-REGION: A GAUTRAIN ANAlYSIS
105
Importantly, the Sandton UDF recommends creating increased pedestrian accessibility in Sandton’s large urban blocks, combined with increased visual permeability, active street fronts, and increased building density. An average building height of 40 storeys is recommended at the centre of Sandton, which will decrease outwards concentrically (Akanya Development Solutions et al., 2008b). Similarly, land-use follows the planned density pattern with high intensity mixed-use at the centre, reducing to low and medium intensity mixed-use and high density residential at the edge of the node.
Specific urban form guidelines define nine proposed management districts in the UDF. The guidelines outline approaches to mediate building-street relationships, ensure active street edges, and define landscaping approaches, as well as non-motorised transit (NMT) infrastructure, such as paved sidewalks and bicycle lanes. Specific sites flagged for important interventions are mainly located at key intersections.
The nuanced approach to reshaping Sandton’s urban form is laudable. However, the highly centralised urban structure presented has factored out the indeterminate or unpredictable. Little elaboration has gone into the specific planning for public green space and open squares. Similarly, there is no explicit definition or consideration of the form and quality of the public space adjacent to the Gautrain station. A detailed and pragmatic programme for implementing pedestrian infrastructure improvements would have better enabled these changes to take place. As a result, new buildings opposite the Sandton Station have not assisted in improving the pedestrian realm. Instead, they continue to enforce clear distinctions between themselves and the street. These include retaining fencing around properties, not facilitating passive surveillance of the street, not providing considered pedestrian street furniture, not creating truly public green space or public plazas, and not necessarily defining the block edge.
There is no explicit definition or consideration of the form and
quality of the public space adjacent to the Gautrain station.
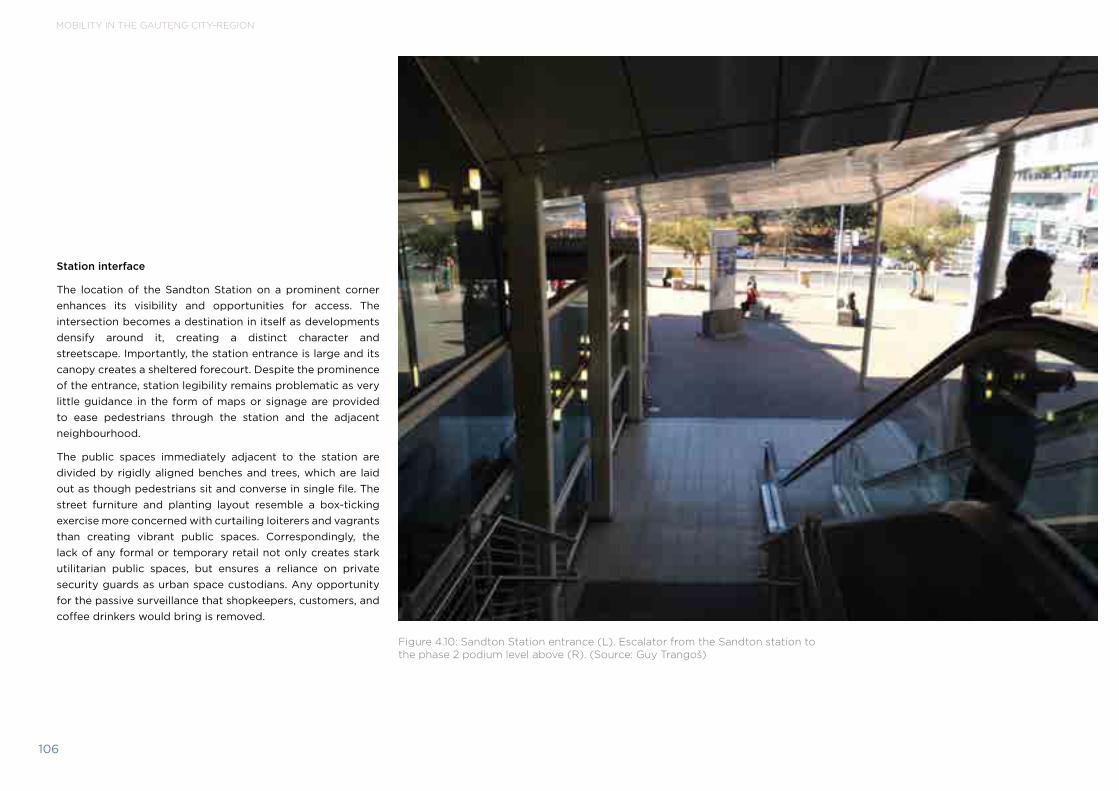
Mobility in the GautenG city-ReGion
106
Station interface
The location of the Sandton Station on a prominent corner enhances its visibility and opportunities for access. The intersection becomes a destination in itself as developments densify around it, creating a distinct character and streetscape. Importantly, the station entrance is large and its canopy creates a sheltered forecourt. Despite the prominence of the entrance, station legibility remains problematic as very little guidance in the form of maps or signage are provided to ease pedestrians through the station and the adjacent neighbourhood.
The public spaces immediately adjacent to the station are divided by rigidly aligned benches and trees, which are laid out as though pedestrians sit and converse in single file. The street furniture and planting layout resemble a box-ticking exercise more concerned with curtailing loiterers and vagrants than creating vibrant public spaces. Correspondingly, the lack of any formal or temporary retail not only creates stark utilitarian public spaces, but ensures a reliance on private security guards as urban space custodians. Any opportunity for the passive surveillance that shopkeepers, customers, and coffee drinkers would bring is removed.
figure 4.10: sandton station entrance (l). escalator from the sandton station to the phase 2 podium level above (r). (source: guy trangoš)

Chapter 4 NEW SPACES OF TRANSPORT IN THE GAUTENG CITY-REGION: A GAUTRAIN ANAlYSIS
107

Mobility in the GautenG city-ReGion
108
A challenge facing the current station design is the slow development of the second phase and specifically the podium level to which the station connects. Once complete, the connection will provide direct access for pedestrians via a new square to Nelson Mandela Square, a major regional retail anchor. While promising, this might unfortunately also have the result of channelling pedestrians through commercialised space, reducing their dependence on the street and undermining new attempts to alter Sandton’s vehicular dependency.
The Sandton Station has facilitated the most rapid urban change of all Gautrain stations. Development has been stimulated adjacent to the station but also further away. The proximity of Rosebank Station to Sandton has prompted development along Rivonia/Oxford Road, which connects the two nodes. Despite the fact that 170 000m2 of new commercial development is either under construction or in planning phases, commercial property vacancies are at 8.7% in Sandton and Rosebank near Gautrain nodes compared to an 11% average across South Africa (Muller, 2013).
While the Sandton Station has clearly catalysed development, the design of its public spaces might serve to inhibit future growth, should they not be physically able to accommodate a diversity of pedestrians and commuters. With the provision of commercially oriented public space in the form of the second phase’s new square to the west of the station, it would be appropriate for smaller, temporary retail outlets to liven the public spaces outside the Gautrain station and in the new square itself. A smaller scale of retailer would allow for greater street-side interaction and monitoring, while creating
figure 4.11: rosebank shopping precinct (l), gautrain precinct (r). (source: ghoor, 2013, pp.18, 20)

Chapter 4 NEW SPACES OF TRANSPORT IN THE GAUTENG CITY-REGION: A GAUTRAIN ANAlYSIS
109
economic opportunity for smaller operators. Similarly, the design and location of urban furniture such as lighting, seating and planting should allow pedestrians to stop, relax, converse and easily pass through without feeling obliged to engage economically. These shifts will allow the Gautrain station at Sandton to function as a vibrant urban hub that begins to generate its own ridership through increasing the pedestrian experience and creating a vibrant public space that becomes a destination in itself.
4.6.2 rosebankRosebank is both a leafy residential area and an important retail and commercial node in Johannesburg’s northern suburbs. A number of shopping malls make up Rosebank’s centre. They follow a historical pattern of arcades and courtyard oriented shopping formats. While many have been replaced by more traditional, internalised mall typologies, the malls in Rosebank still maintain a greater degree of pedestrian and street connectivity than almost any other similar node in Johannesburg. Public access ways and a street level connection between malls have resulted in some vibrant street environments. The proximity of medium density apartment and office blocks enhances the viability of public space in central Rosebank (Property 24, 2012).
The underground Rosebank Station is built along Oxford Road. Access is provided by above ground structures in a manner reminiscent of the Paris Metro or New York Subway. The station infrastructure came with the widening of Oxford Road and the upgrading of pedestrian infrastructure. The adjacent stretch of Oxford Road was anticipated to host a northern link of the BRT network but this has been postponed until demand warrants it.

Mobility in the GautenG city-ReGion
110
Significant development has followed the construction of the Gautrain station, although not at the same scale as has been seen in Sandton. Currently, the majority of development has occurred to the west of Oxford Road, with no development occurring to the east. This is in part due to the amount of land owned by Kingsmead College to the east of Oxford Road, and the area’s suburban character.
Rosebank UDF
The UDF introduces Rosebank as a cosmopolitan suburb, which has always attracted investment, but warns that the area’s growth and management has to be controlled (Akanya Development Solutions et al., 2008a). A Space Syntax and block size analysis depicts Rosebank’s commercial node around the Gautrain station as being largely permeable and accessible (Figure 4.9). Urban blocks carved up by pedestrian
access ways offer some form of pedestrian thoroughfare. However, beyond the pedestrian scale of the Gautrain station precinct, poor local access is enforced by road closures, limited pedestrian infrastructure, and wide and busy roads. These serve to restrict the integration of the surrounding suburban fabric into the central node (Akanya Development Solutions et al., 2008a).
After further analysis – including a study of existing traffic patterns and volumes, land use, heritage sites, and service infrastructure – the UDF recommends a number of strategies guided by TOD principles. These include the construction of high-density, mixed-use, and high-rise developments within close proximity of Rosebank’s residences, shops, open spaces, and employment opportunities. Low to medium intensity mixed-use development is recommended for the northern strip of Oxford Road.
Beyond the pedestrian scale of the Gautrain station precinct, poor local access
is enforced by road closures, limited pedestrian infrastructure, and wide and busy roads. These serve to restrict the
integration of the surrounding suburban fabric into the central node.
(akanya development solutions et al., 2008a)

Chapter 4 NEW SPACES OF TRANSPORT IN THE GAUTENG CITY-REGION: A GAUTRAIN ANAlYSIS
111
figure 4.12: rosebank station and surrounds: 1. avusa offices, 2. the zone shopping Centre 2010 extension, 3. the zone shopping Centre, 4. Kingsmead College, 5. the mall of rosebank, 6. standard Bank

Mobility in the GautenG city-ReGion
112
The recommendations made by the UDF have already been undermined by the recent development of a new Standard Bank head office to the south of the station. Through negotiations with the City of Johannesburg, the bank has included a large outdoor park in its development of the block. While this goes some way to creating an important public space in Rosebank, it maintains an urban design language of exclusivity by distinguishing itself from the street through hard landscaping barriers and planting. The new square also disrupts any opportunity for an active and vibrant edge at this important corner diagonally opposite the Gautrain parking lot.
Station interface
Despite being located in Johannesburg’s most pedestrian oriented commercial node outside of the inner city, the Gautrain station does not enhance the experience of pedestrians and commuters. This is due to four reasons: (i) the location of the station entrances; (ii) the architectural language of the station entrances; (iii) the quality of the public spaces created; and (iv) the nature of wider linkages into the neighbourhood.
The pedestrian extension of Tyrwhitt Avenue between Cradock Avenue and Oxford Road is a bustling corridor lined with shops and restaurants. This major pedestrian arterial
connects two malls, and a string of apartments and hotels with Oxford Road. Instead of either allowing a clear line of sight along the pedestrianised thoroughfare across Oxford Road or providing a large station entrance at the terminus of the pedestrianised road, the first Gautrain station entrance turns its back on the thoroughfare and presents a small lift and a large ventilation structure to the public. The actual entrance is located around the corner, further down Oxford Road with no relationship to any important pedestrian access way. A second station entrance is located further south of the first, also along Oxford Road, at a decidedly ambiguous distance, almost too
figure 4.13: rosebank pedestrian environment. (source: ghoor, 2013, p.16)

Chapter 4 NEW SPACES OF TRANSPORT IN THE GAUTENG CITY-REGION: A GAUTRAIN ANAlYSIS
113
close to warrant its separate construction. In no way do the station entrances respond to the natural pedestrian activity of Rosebank. Instead, they serve to frustrate pedestrian mobility around them.
The architectural language of the Rosebank Station is stark and awkward. Instead of allowing Oxford Road to function as a vibrant corridor, the station buildings create a solid impermeable wall along their length making the road difficult to cross and visibility across the road impossible. This has consequences for perceptions of commuter and pedestrian
safety by impeding passive surveillance from other pedestrians and motorists. The blank street facade of the station buildings reduces the motorist’s experience of Rosebank to that of a tunnel or freeway without much opportunity presented for views beyond the road itself. The undulating roof surface of the station buildings does not relate to surrounding buildings or provide spatial differentiation, delineating entrance thresholds or protecting significant outdoor space from the elements. Similarly, the harsh concrete facade of the Gautrain parking lot does not allow for any retail activity, creating a sidewalk that feels inherently unsafe. Similarly, it
in no way responds to the scale of the street or pedestrian and feels intimidating and overpowering. There were numerous architectural opportunities inherent in the design of a major underground station in Rosebank, but principles such as contextual relevance, ease of accessibility and visual permeability have eluded it.
The Rosebank Station’s final challenge is the improvement of the pedestrian network that radiates outwards from the station itself. Successive curbs impede crossing the road with luggage. There is insufficient lighting, and sterile pavement

Mobility in the GautenG city-ReGion
114
paving patterns hamper the pedestrian experience. Walking towards the station entrances either from the parking lot or from the Gautrain bus stop involves lifting bags over curbs and waiting at successive traffic lights – all over reasonably long distances. The integration of the pedestrian network into the existing Rosebank urban fabric has not occurred seamlessly, with sidewalks rapidly deteriorating or disappearing as they move into the surrounding neighbourhood. Access to the Gautrain stations and the experience of all users, whether they are commuters or not, is impaired.
4.6.3 marlboroMarlboro Station is situated to the east of Sandton, adjacent to the N3 freeway, Marlboro South and Alexandra. This station services both the north-south and east-west routes and its construction was premised on catalysing the development of a vibrant mixed-use node.
Alexandra and the neighbouring industrial and residential belt of Marlboro South both stand to benefit from any development or investment sparked by the Gautrain station’s construction. While both areas are located adjacent to Sandton and have direct access to both the N3 and M1 freeways, the high-speed connectivity of the Gautrain offers greater regional connections in and out of the Marlboro area (Figure 4.14). Commercial and industrial investment here could provide significant economic opportunity to residents. To date, very little development of any kind has occurred near the Marlboro station.
Marlboro UDF
The Marlboro Station UDF focuses on the need to catalyse development in Frankenwald, Alexandra, Modderfontein Farm and the Linbro and Modderfontein Agricultural Holdings (Akanya Development Solutions and Karabo Consulting, 2008). The proximity of the station to greenfield sites earmarked for development, as well as the N3 freeway, present an opportunity for the development of a well-located and well-connected mixed-use node. Furthermore, the UDF states that “it is...important that the station building is easily accessible by vehicles, cyclists and/or pedestrians in order for it to realise its true potential” (Akanya Development Solutions and Karabo Consulting, 2008, p.25). Also noted are the significant physical and socio-economic divides between the north and south of the larger development site and neighbourhood. The new Gautrain rail reserve undoubtedly exacerbates this. As a result, the UDF emphasises the importance of bridging this divide.
Noting the legacy of social inequality that plagues both nearby Alexandra and Marlboro South, the UDF highlights the importance of new development that is able to boost and promote investment while preserving the area’s social and community character (Akanya Development Solutions and Karabo Consulting, 2008).
The UDF contains an important warning regarding future development that does not serve to integrate the station with the surrounding area: “Integration is...much more than merely providing pedestrian gates at the right positions in the fence
surrounding a building located in the middle of a parking area. Should the issue of integration not be sufficiently addressed (on both the larger scale of urban structuring, as well as the very detailed scale of building design) the Gautrain station will remain an expensive, yet isolated monument to local engineering excellence” (Akanya Development Solutions and Karabo Consulting, 2008, p.65).

Chapter 4 NEW SPACES OF TRANSPORT IN THE GAUTENG CITY-REGION: A GAUTRAIN ANAlYSIS
115
figure 4.14: marlboro station and surrounds: 1. frankenwald greenfield site, 2. alexandra far east Bank, 3. n3 freeway

Mobility in the GautenG city-ReGion
116
figure 4.15: marlboro station precinct. (source: makhubu, 2013, p.13)
Unlike other stations analysed, the Marlboro Station UDF explicitly outlines the need to create an iconic station building surrounded by public space. The station’s peri-urban, sprawling and low-rise context necessitates the station building being designed as a landmark structure. Central to the UDF’s recommendations in this regard are two public reception areas or public squares to the north and south of the railway line. Notably it states that these spaces should be human scaled and include the integration of public art by local Alexandra artists as a way of connecting the station to the surrounding community (Akanya Development Solutions and Karabo Consulting, 2008). The planned inclusion of an iconic pedestrian bridge that traverses the railway would also better link Alexandra in the south to any new development in the north.
The development vision in the UDF is filled out with detailed NMT plans, presented together with important architectural street sections, urban linkage diagrams, strategies for green open space, and plans for the construction of a north-south boulevard connecting developments along the N3 freeway.
To date none of these recommendations have been realised, and the station building unfortunately does not adhere to any of the principles presented in this framework. The lack of investment and development in the station precinct combined with the construction of an isolated and fenced off station underscore its current white elephant status.
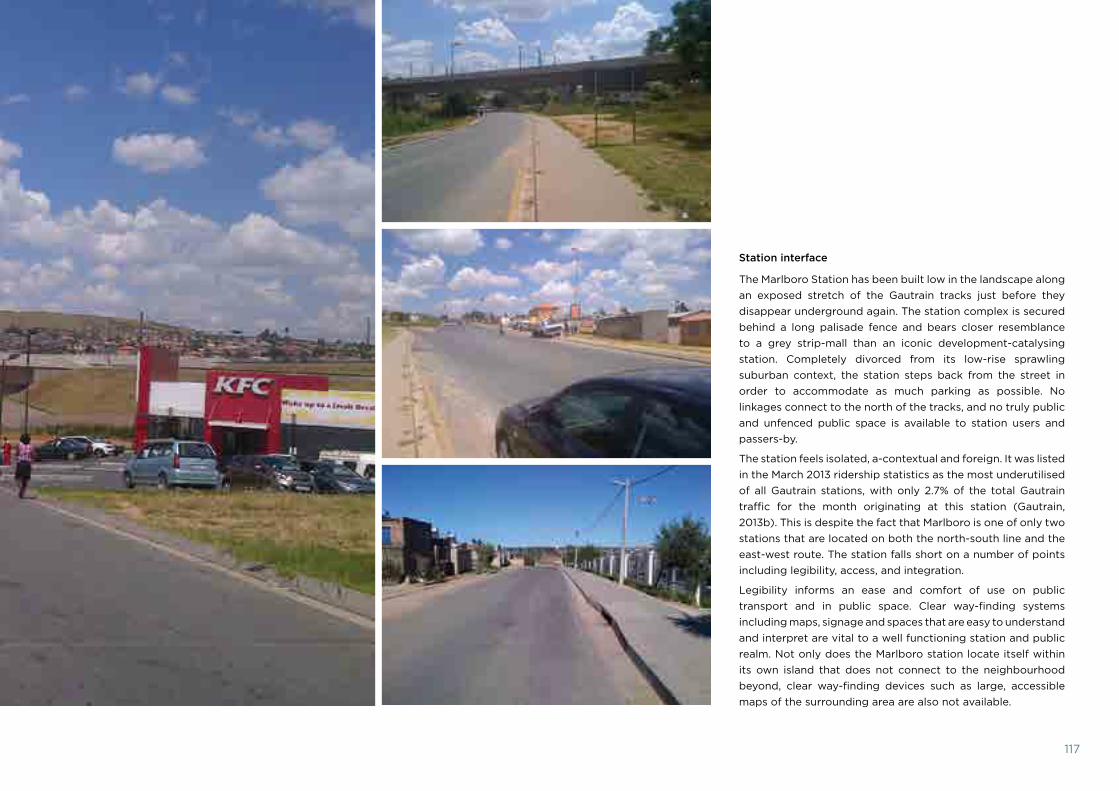
117
Station interface
The Marlboro Station has been built low in the landscape along an exposed stretch of the Gautrain tracks just before they disappear underground again. The station complex is secured behind a long palisade fence and bears closer resemblance to a grey strip-mall than an iconic development-catalysing station. Completely divorced from its low-rise sprawling suburban context, the station steps back from the street in order to accommodate as much parking as possible. No linkages connect to the north of the tracks, and no truly public and unfenced public space is available to station users and passers-by.
The station feels isolated, a-contextual and foreign. It was listed in the March 2013 ridership statistics as the most underutilised of all Gautrain stations, with only 2.7% of the total Gautrain traffic for the month originating at this station (Gautrain, 2013b). This is despite the fact that Marlboro is one of only two stations that are located on both the north-south line and the east-west route. The station falls short on a number of points including legibility, access, and integration.
Legibility informs an ease and comfort of use on public transport and in public space. Clear way-finding systems including maps, signage and spaces that are easy to understand and interpret are vital to a well functioning station and public realm. Not only does the Marlboro station locate itself within its own island that does not connect to the neighbourhood beyond, clear way-finding devices such as large, accessible maps of the surrounding area are also not available.

Mobility in the GautenG city-ReGion
118
The station’s perimeter palisade fence is not unique to Marlboro, and is found at other above ground stations, such as Midrand and Rhodesfield. While securing the private vehicles of commuters, the fence completely isolates the public station as though it were a private office block or residence. The public is immediately marginalised, and only those entering with official purpose are allowed in. As such, the public has not been gifted a new community asset but rather an intimidating and highly controlled embassy of middle-class suburbia.
The integration of the station building into the surrounding neighbourhood could have occurred through the creation of open, public space directly adjacent to the street. An iconic
figure 4.16: marlboro station pedestrian environment. (source: makhubu, 2013, p.13)
station building could then hold its public forecourt, creating an energised public square that functions as an extension of the street. The station would be active with users, traders, and passers-by, with security maintained through tickets controlling platform access and the passive surveillance of regular users. An inversion of the site’s relationship to the street, in particular by placing the station building against the street and parking along the railway line, would present an improved future scenario. The development of properties along the streets leading to the station would support a civic spine and boulevard. When combined with public utilities such as post offices and banks, the station precinct’s constant activity would sharply contrast the current scenario.
4.6.4 park stationPark Station is the final stop on the Gautrain’s north-south line, and is located in Johannesburg’s historic inner city adjacent to its main train station. Located in the centre of an underperforming urban development area, the site is possibly the most complex urban environment of those discussed. Importantly, it borders the suburb of Hillbrow to its east, where overcrowding at high densities and severe socio-economic challenges present a stark urban reality. This Gautrain station thus has an important role to play in promoting development, social upliftment, and improving access to the GCR’s primary urban node.

Chapter 4 NEW SPACES OF TRANSPORT IN THE GAUTENG CITY-REGION: A GAUTRAIN ANAlYSIS
119
Prospects for developing a vibrant TOD node in an already residentially dense part of the city with major transport infrastructure are significant. Increased property refurbishment and the conversion of offices into residential buildings by various housing companies, universities, and private investors have changed the commercial nature of the precinct, making TOD even more viable. The precinct plays host to a BRT station and the major train station terminal. However, a significant challenge in implementing TOD here is the connection between different public transport modes through the provision of quality public space.
figure 4.17: park station and surrounds: 1. Brt station, 2. rotunda bus terminus, 3. park station, 4. Bridge shopping Centre, 5. metro mall taxi rank, 6. hillbrow Clinic, 7. Joubert park
The Park Station is situated at a significant point in Johannesburg. Its proximity to large financial institutions, provincial and local government offices and education institutions has resulted in it being utilised as a major daily commuter point into and out of the city. Private corporate buses shuttle employees from the station to work and back on a regular basis through the day. Ridership statistics for March 2013 demonstrate that Park Station had a total of 143 012 commuters, second only to Sandton’s 221 652 (Gautrain, 2013b).
While the Park Station has not yet catalysed the development of properties adjacent to the station, the demographic injection that the station has provided into the heart of the city is intriguing. Middle class residents and tourists who previously would have avoided the inner city due to its perception as a high crime area now wait in line for their corporate busses or sightseeing tours. While this intermingling is enticing and demonstrates the power of public transport and public space to enable social mixing, their interaction with the city is fleeting and highly limited. Opening up the Gautrain to the city through improved pedestrian and TOD infrastructure could have far-reaching impact in recentralising development in the inner city.

Mobility in the GautenG city-ReGion
120
Park Station UDF
Describing the Park Station precinct as the “largest such facility in sub-Saharan Africa” the UDF identifies the area’s many challenges as being largely related to insufficient transport planning (Osmond Lange Architects and Planners et al., 2008, p.3). Importantly, the precinct hosts a variety of transport modes, including local and long distance rail, buses, minibus taxis, BRT, the Gautrain and privately owned vehicles. A status quo analysis locates the precinct at the centre of other precincts, each defined by different land uses. These include areas of high-density residential to the east; business to the north-west and south-east; general and governmental functions to the south; and industrial to the far south. The precinct also neighbours a number of buildings identified as being in a ‘bad’ condition by the City of Johannesburg (Osmond Lange Architects and Planners et al., 2008). Recommendations specifically highlight the need to involve minibus taxi operators in any plans and for developers to be cognisant of the lasting negative effects that significant change in the precinct could have on existing dependencies, such as informal traders.
A desktop study of the UDFs that affect the Park Station precinct include, among others: Newtown North; Braamfontein; Greater Joubert Park; the Hillbrow Health Precinct; the Retail Improvement District; the International Transit and Shopping Centre Facility; and the Greater Ellis Park Development. Many of these connect to each other or overlap near Park Station and the Gautrain, creating a large TOD precinct that serves to knit and unite different urban areas. Plans to do this effectively include the renovation of existing buildings, the upgrading of existing public space and pedestrian infrastructure, and the expansion of the city over the railway lines to create more space for development and public space. All of these rely on the Gautrain station as “the influx of office-users and tourists into the area will be fertile ground for the establishment of coffee-shops and restaurants focussed on a proposed ‘Gautrain Square’ and the Northern Entrance to Park Station” (Osmond Lange Architects and Planners et al., 2008, p.48).
The importance of the public realm is defined as facilitating the “...socio-spatial transformation of Johannesburg from an apartheid city to a healthy equitable city, and is key to the creation of memorable places and experiences” (Osmond Lange Architects and Planners et al., 2008, p.49). The UDF lists a number of recommendations, which inform the creation of successful public space. Good design and regular maintenance are listed alongside the need for traffic calming measures, a mix of hard and green surfaces, the considered positioning of pedestrian furniture, and a requirement for spaces to be defined by buildings with active street fronts. In addition, 13 public space opportunities and upgrades were identified in the wider precinct.
The ambitious plans outlined in the UDF, developed before the construction of the Gautrain, do not bare much similarity with the final built project. In particular, the successful development of a TOD at the scale proposed by the UDF hinges on formalised pedestrian links between transport facilities interspersed with public spaces and mixed-use development. Links from the Gautrain to the Joubert Park taxi rank, the Metro Mall taxi rank, the Rotunda bus terminal, and the adjacent BRT station are essential. Yet today they exist as crumbling pavements with very little in the form of public space, pedestrian infrastructure and adequate lighting or planting. A recently upgraded connection between the Gautrain station and the Park Station conventional rail terminal has enhanced the pedestrian interface between the two.
figure 4.18: park station pedestrian environment. (source: malan, 2013, pp.12, 15)

Chapter 4 NEW SPACES OF TRANSPORT IN THE GAUTENG CITY-REGION: A GAUTRAIN ANAlYSIS
121
Station interface
The Gautrain station runs underground to the north of the Park Station terminal building. Users are able to access the station via the multi-storey parking lot to the north of Wolmarans Street and through an entrance closer to Park Station on the south of the busy street. The Park Station UDF states that the ground floor street interface with the street should be active with shops and services. This would be in keeping with the majority of other city buildings that have ground floors active with retail and office space above. Instead, however, these recommendations were not designed into the final built product, and the sidewalk has become purely utilitarian. The result demonstrates the significant disconnect between the Park Station UDF, Gautrain project planning and the needs of the city.
Similarly, the treatment of the Gautrain station entrances does not create prominent public transport landmarks. Repetitive acacia tree-inspired columns combined with the brown mosaic tile and exposed grey concrete do not capture the vibrancy of the city or the significant historical impact of the new station. Instead, they celebrate the banal infrastructure of the station itself. While great engineering works often display their ingenuity with grace and elegance, Park Station remains a replica of other Gautrain stations and does not in any way respond to its important context.
The station directly challenges the prevalence of informal traders throughout the inner city by not allowing trade near the station, thus worsening perceptions of the Gautrain by people who rely on the informal market. The Gautrain cannot continue to be perceived as public transport for the wealthy and steps to accommodate a variety of users in a range of different ways are imperative.
The Park Station precinct is largely a project under construction. As different UDFs are realised and developers invest in specific projects, the nature of the precinct will change dramatically. The current public spaces of the station underprovides for the requirements of TOD. As a result, improved pedestrian infrastructure combined with spaces for waiting, rest and retail would dramatically improve its effectiveness. Similarly, links between the Rea Vaya (BRT) and Gautrain need to be improved. Developing adequate pedestrian infrastructure and improving the relationship of station buildings and the public will result in an efficient and energised urban heart.

Mobility in the GautenG city-ReGion
122
4.7 Current challenges facing the Gautrain The future alteration and adaptation of Gautrain stations into successful public assets hosting active public spaces depends entirely on the smooth and profitable running of the entire Gautrain network. There are, however, a few challenges facing the day-to-day operations of the Gautrain system.
A passenger arriving at O.R. Tambo International Airport on a 4am flight from the Middle East would be greeted by the closed doors of the Gautrain station. Similarly, many commuters without a car or airport transfer cannot get to the airport from Johannesburg or Pretoria to take a late evening flight. The Gautrain’s 5:30am to 8:30pm operating hours are a barrier to creating a connected, 24-hour GCR. Confined operating hours directly affect the viability and vibrancy of public spaces and urban nodes, as commuters have to seek alternative transport should they wish to travel earlier or later. The chief executive officer (CEO) of the Gautrain Management Agency (GMA), Jack van der Merwe, has proclaimed that an extension of operating times is a ‘done deal,’ and that it is merely a matter of time and cost (Venter, 2012).
Beyond operating times, the Gautrain is not yet able to generate its own profit. Media reports state that from June 2012 to March 2013 provincial government has paid a total of R832.4 million in subsidies to the Gautrain in order to keep it running (Venter, 2013b). This is in keeping with a patronage agreement developed as part of the initial public-private partnership that ensured the GMA would cover the costs of the system and make a reasonable profit. As passenger numbers increase the ridership guarantee amount naturally decreases. Ridership on the Gautrain has already increased by 16 000 average day trips between April 2012 and March 2013 (Venter, 2013b). A 50:50 profit share between the GMA and provincial government would initiate once ticket takings alone are able to subsidise the GMA’s expenses. Van der Merwe expects this milestone to be reached in a couple of years. While increased passenger numbers are important to maintain the operation of the Gautrain, they also activate and legitimise its public spaces. Conversely, the role of design in facilitating an increase in ridership on the Gautrain is an important consideration. More people are attracted to active public spaces, bustling with economic activity, cultural expression and urban complexity (Whyte, 1980). Should the design of the public spaces around Gautrain stations better accommodate the public, ridership will increase.
The expansion of the Gautrain has been a topic of contention since the announcement of the original route. The sentiment that the network ignored large parts of Gauteng with significant residential populations still pervades (Shamase, 2012). In May 2013 the GMA commissioned cost-benefit studies to investigate the financial feasibility of four Gautrain extensions (Venter, 2013c). Potential future routes discussed in the media, but not directly acknowledged by the GMA, include a circular line from O.R. Tambo International Airport to Park Station, connecting Boksburg, Germiston and Soweto. A link from Centurion to Hatfield has been considered, as has a new Samrand Station and a new Modderfontein Station (Van Zyl, 2012).

Chapter 4 NEW SPACES OF TRANSPORT IN THE GAUTENG CITY-REGION: A GAUTRAIN ANAlYSIS
123
figure 4.19: gautrain extension as proposed by the gauteng 25-year integrated transport master plan (itmp25)

Mobility in the GautenG city-ReGion
124
The recently launched Gauteng ITMP25 proposes the development of a central high-speed terminal, possibly at Sandton or Park Station that will allow for the integration of further planned high-speed links (GDRT, 2013a). The ITMP25 also proposes an extension from Rhodesfield to a new East Rand Mall Station and new Boksburg Station, a link from Sandton to Randburg and Honeydew is suggested, as is an extension from Park Station to Westgate on the southern edge of the inner city. A plan for expanding the Gautrain into a rapid-rail spine that connects most of Gauteng is enticing. Essential to the expansion of the network, however, would need to be a revised approach to station and public realm design, which would hopefully build on lessons learnt during the first phase.
Key external challenges facing the Gautrain come from within government itself. These include the implementation of Johannesburg’s Rea Vaya BRT second phase, and the implementation of e-tolls on the province’s national freeways.
The BRT was touted as Johannesburg’s public transport panacea in the run-up to the FIFA World Cup 2010 for which the first phase (1A) was completed. The slow implementation of phase 1B, combined with planning challenges facing phase 2 have delayed its expansion. Originally planned to travel northwards on Jan Smuts Avenue, the route was changed to Oxford Road following opposition from residents’ associations. The City of Johannesburg and the Gautrain subsequently planned for a BRT station near the site of the Rosebank Station
on Oxford Road, but following further residents’ challenges this route has now been diverted to Louis Botha Avenue. The opportunity for a multi-modal public transport interchange at Rosebank, and later in Sandton would have enhanced both Gautrain and BRT ridership through significantly improving connectivity in the GCR. Spatially, interchanges allow for bustling and economically viable public spaces as commuters move between transport modes.
Despite the relocation of the route to Louis Botha Avenue, which largely bypasses Rosebank and Sandton, Liana Strydom, Assistant Director for Strategic Spatial Planning at the City of Johannesburg, reiterates the need for a parallel BRT system running down both Louis Botha and Oxford Road in order to reach the capacity required. She states that planning in Johannesburg often involves “pulling developers and residents with you, but sometimes they need to be pushed” (pers. comm., 2013). An increase in vehicular congestion along these arterial routes might provide the necessary push factors required for property owners to support an Oxford Road extension of the BRT. The ease of mode switching not only ensures the viability of different forms of public transport, but also increases their ridership through offering attractive and flexible routes across the city-region.
An additional factor continuing to influence Gautrain ridership has been the slow implementation of the Gauteng freeway toll network. The majority of Gauteng’s major freeways, including the N1, N3, N12, and R21, have been extensively refurbished
and widened as part of the Gauteng Freeway Improvement Project. The redevelopment has been funded through the rollout of an electronic tolling network, e-tolls as they are known. The new tolling system presents an opportunity for increasing Gautrain ridership as motorists switch to public transport as an alternative to paying e-toll tariffs. The delayed switching-on of the e-toll network due to legal challenges by civil society groups, slowed the spin-off effects predicted for Gautrain ridership. These were predicted to increase by 15%-20% once e-tolling was implemented (Hedley and Smith, 2013). From the date of e-toll activation on 3 December 2013 to mid-January 2014, it is estimated that Gautrain ridership has increased by 10% (Venter, 2014).
More commuters using public transport over motor vehicles will result in a reduction of vehicle emissions and an increase in the reliability of mobility patterns. In addition, e-tolls may indirectly promote geographic centralisation as motorists, pressed by the rising expense of living on the outskirts of the city-region, opt to live closer to commercial centres. This would provoke a residential densification around mobility corridors such as Gautrain stations and BRT routes. Public spaces would become more important, and possibly more valued as residents begin living in higher densities. On the other hand, external factors such as a rapid property price increase, the inflexibility of the Gautrain to expand with demand, or the pervasive culture of private transportation could hamper the speed of change.

Chapter 4 NEW SPACES OF TRANSPORT IN THE GAUTENG CITY-REGION: A GAUTRAIN ANAlYSIS
125
4.8 Recommendations for future TODToday mobility in the GCR is at an exciting turning point. A legacy of underinvestment in public transport has ended with the implementation of BRTs in Johannesburg and Tshwane, and the construction of the Gautrain. A culture of private transport, however, still predominates, particularly among the middle classes. For public transport to revolutionise mobility in the GCR, more residents need to use it. New public transport initiatives have to be more transparent towards the public, with clearer rules, way-finding, schedules, and pricing. Similarly, station precincts cannot continue to be designed without relevance to their very specific contexts, serving to control and sanitise public space instead of creating lively new public environments. In addition, the public needs to be involved in public transport projects. These cannot be imposed or forced on communities; rather they need to be mediated and agreed upon by all affected parties.
The experience of riding the Gautrain is in line with that of other hyper-controlled and securitised public spaces in the city. This level of control emerges from the train, defines the station building and permeates surrounding urban spaces. This reduces a potentially vibrant public realm to a utilitarian access corridor that ensures ease of movement, safety, and control above all else. Many European cities are today trying to disassemble their modernist pasts of pedestrian-only skywalks, stark social housing, and sprawling undefined ‘in-between’ space. These have created largely banal urban environments enlivened only by graffiti and vagrants. The
Gautrain, however, cultivates this same legacy in a modern GCR.
Municipal TOD policies and UDF documents make important recommendations, which, if and when they are implemented, could drastically reshape the GCR’s urban environments around the Gautrain stations. At present the chasm between public spatial policy and the heavy hand of the developer, or concessionaire in this instance, is stark. The challenge is three-fold. Firstly, policy has to be pragmatic. Defining conceptual outcomes and objectives is important, but situating these in concrete examples and stipulating their benefits to the city and developers is essential. Secondly, policy implementation and management has to occur. In the case of the City of Johannesburg, the Gautrain project would not have been feasible without the city agreeing to it. This provided an advantageous position within the project, which ought to have aided the city in better negotiating their spatial requirements. Development could conceivably have been more tightly controlled though planning processes that gauged suitability and monitored implementation. Finally, improved consultation with potential developers and the Gautrain concessionaire at the project’s earliest stages, parallel to developing precinct based policy, could have facilitated outcomes beneficial to all parties and the public.
The role of the designer, architect, urban designer and planner is fundamental to the creation of successful TODs, and well-functioning, active and inclusive urban environments. While
the architectural accomplishment of the stations analysed is underwhelming, due to irrelevant conceptual metaphors, inaccessible and illegible forms, and a-contextual relationships, the fact that the public realm suffers greatest is important as it influences the experience of all city users.
The lack of successful integration between the fields of architecture and planning is evident in the Gautrain case studies presented here, because buildings and urban environments seldom relate. Similarly, the battle at play between the urban design professions and the likes of transport engineers and property developers creates a gap that better organised, and often less appropriate, professions occupy.

Mobility in the GautenG city-ReGion
126
figure 4.20: revised vision for the gautrain park station site along wolmarans street by stephen hoffe. (source: malan, 2013, p.28)

Chapter 4 NEW SPACES OF TRANSPORT IN THE GAUTENG CITY-REGION: A GAUTRAIN ANAlYSIS
127
Marcel Smets defines designers as always being in “a position of weakness, because they are not the ones deciding” (Kagner, 2013). Design professions have to remain relevant as guardians of the public realm and through advising and mediating with municipal bodies, the strong conviction of the designer can continue to shape quality urban environments.
That’s why the engineering professions are no longer able to oversee complex infrastructural projects. They are too specialised in partial aspects. If you don’t succeed in viewing the whole and taking up the role of mediators you will never succeed in generating collective agreement and hence collective improvement...As landscape architects, we understand that accessibility for some often jeopardises quality of urban space for others. So in order to be able to come to a good decision, we need politicians to realise that they cannot just leave it to engineers, and that landscape architects and urban designers are essential to attain collective feeling of improvement. Because in order to arrive to a collective agreement – you need a good project addressing all these aspects. And that is simply too complex for the engineering practice alone. (Kagner, 2013)
While an expectation exists for all city design professionals to practice ethically and to the best of their abilities, the most innovative and talented professionals are seldom commissioned out of preference for large commercial design firms. South Africa’s post-apartheid public building project has seen a number of new public buildings, parks and public spaces completed. Those that have found a place in the public
conscious, that are most memorable, and that win awards, tend to be the product of architectural competitions. These include the Constitution Court, Freedom Park and the Mapungubwe Interpretation Centre. Architecture competitions generally place design quality at the forefront of the selection process.
The Belgian Bouwmeester model has a government architect who is responsible for advising local municipalities on building and working with architects. The Bouwmeester also runs architectural competitions for municipal projects. New modes of procuring and utilising design professionals thus need to be investigated given the range of formats exercised globally.
The Gautrain has successfully connected many of the GCR’s most important commercial nodes. The engineering and infrastructural project has been a success. The Gautrain is, however, far more than merely an infrastructural project. It redefines the way movement and development occurs in the GCR. The Gautrain’s urban and architectural project embody an infrastructural approach to city making, historically cultivated in Gauteng’s cities, where the creation of a pedestrianised and public city is undermined through the designing out of opportunities for public interaction and expression. This serves to perpetuate exclusionary and privatised forms of development in the GCR’s cities, which largely negate free public access and obstruct the creation of an inclusive GCR. This has long-term consequences for the Gautrain too, as vibrant urban nodes around stations would increase ridership and support longer opening hours. This would increase profits for the concessionaire and the province, which might
in turn enable an expansion of the system. The Gautrain’s lacklustre urban project bears important consequences for municipal planning, and the implementation of proposals and recommendations which have to be carefully conceptualised, highly pragmatic and rigorously enforced. Finally, the role of design professionals as “the lobbyists for the public realm” (Kagner, 2013), needs to be strengthened and expanded through new institutions such as the City Architect.
The potential for the GCR’s urban centres to come alive with the diversity and energy of its public after decades of social division is highly appealing. Integrated public transport is the catalyst desperately required by a fragmented region. It is anticipated that billions of rands will be invested into new Gautrain stations and infrastructure over the next couple of decades. It is thus imperative that these stations contribute to creating a vibrant, public and 24-hour GCR by placing the creation of well-designed station precincts at the top of development priorities. For those stations already in operation, the responsibility now shifts to municipalities and developers to subvert the banality of these public spaces through rebuilding a public city around them.
How would design look if it were inspired by an open, processual, micro-political, interventionist, communicative and participatory approach that relates to everyday urban life? Would it be destined to be merely an element in the commodified colonization of social spaces, or could it be a strategic tool with a political and social character that can make an essential contribution to a social city. (fezer, 2010)

Mobility in the GautenG city-ReGion
128
transport mode preferences of different income groups according to the 2009 Quality of life (Qol) survey
Gauteng’s low income earners are heavily dependent on private minibus taxis, which are effectively, and by default, a type of quasi-public transport system. There are a number of reasons for this. First, is accessibility: minibus taxi drivers rely heavily on informal stops, allowing commuters to hop on and hop off, almost at will. In general, local government has been incapable of forcing drivers to adhere to formal stops, operate road worthy vehicles and obey the rules of the road (Swanepoel, 2009). Second, is adaptability: driver associations can adopt route changes or respond to new demands virtually overnight, something no rail or bus system could ever achieve. Accessibility and adaptability, therefore make the minibus taxi the mode of choice for the non car owner, and, along with brutal competition between owners (which keeps fares down) and employee (driver) exploitation (which keeps costs down) the minibus taxi industry has become a significant force to be reckoned with. The industry now dominates the commuting landscape of South Africa.
As most middle income earners shun minibus taxis, they are forced to rely on cars to such an extent that owning at least one car is viewed as an essential part of life in Gauteng. For example, in the 2009 QoL Survey results, the usage of private vehicles by middle income earners to get to work rises dramatically (from 6% to 59%) compared to car use for low income earners; the corollary of this is that public transport usage decreases (from 94% to 41%).
For the really poor, passenger rail usage is double that of urban bus usage. For middle income earners, urban bus usage is more than double that of passenger rail usage. Thus, passenger rail is only used by the desperately poor who are effectively ‘option-less’. The main reason why most shun rail is poor access to rail by suburbanites, the poor state of rail infrastructure and inadequate security. For high income earners, car usage increases further (from 59% to 83%). (mcKay and simpson et al., 2013, pp.14-16)
85% taxi
6% train
3% Bus6% Car
34% taxi
2% train
5% Bus
59% Car
83% Car
15% taxi
2% Bus
modal split - low income earners
modal split - middle income earners
modal split - high income earners

129solomon legodi

Mobility in the GautenG city-ReGion
original photo: graeme gotz

Chapter 5 TransiTions To non-moTorised TransporT in GauTenG
131
Transitions to non-motorised transport in Gauteng Christina CulwiCK
5.1 Introduction A key priority for cities around the world is planning for the growing number of urban dwellers (providing shelter, infrastructure and services), while at the same time ensuring sustainable development. Urban transport systems are a fundamental component of this multi-dimensional task.
In an urban environment, mobility is largely facilitated through road and rail networks. These networks can be likened to the arteries and veins that allow blood to flow to different parts of the body. In turn, non-motorised transport (NMT) infrastructure can be equated to the fine capillary networks that supply every cell with blood. The body relies on seamless integration between the arteries, veins and capillaries, and in the same way an integrated transport network is dependent on motorised and non-motorised forms of transport to ensure the effective movement of people within the urban system.
NMT refers to all forms of human-powered transport including walking, cycling, skateboarding and other small wheeled innovations, wheelchair transport, and animal powered travel (DoT, 2008). The largest proportion of NMT users in cities usually comprises of pedestrians and cyclists, and thus research and planning tend to focus on these two forms.
Internationally, NMT has been prioritised in urban areas as a means of achieving multiple objectives including reducing congestion, pollution and carbon emissions, and improving safety, accessibility and quality of life. The move towards NMT has been made possible through a number of policy reforms, infrastructure developments and social campaigns that
encourage a shift away from private car use towards public transport and NMT. Some of the initiatives that have seen international success are starting to be applied in the context of the Gauteng City-Region (GCR).
As with many international urban centres, South African cities depend heavily on motorised transport. The legacy of apartheid planning, together with subsequent forms of peripheral urban development, have resulted in many residents living on the urban fringe and being reliant on private cars or privately-provided public transport such as minibus taxis (Venter and Cross, 2011). Local and provincial governments in the GCR are working actively to reduce the impact of the apartheid legacy and to improve mobility through major improvements to public transport infrastructure such as the Gautrain and various Bus Rapid Transit (BRT) systems (Shapurjee and Coetzee, 2013).
The premise of this chapter is that there is still insufficient recognition, in either policy or infrastructure developments, of the importance of NMT as a feeder mode for the existing and planned public transport systems. This lack of recognition exists despite the policy commitment to improved mobility across the region and the acknowledgement of NMT as part of this improved mobility. On a daily basis, millions of people in the GCR use NMT as a primary or feeder mode of transport. In terms of the latter NMT is a critical part of the public transport system as it forms the link between public transport stops and the final destination for the majority of
users. The question is whether this is being adequately taken into account in the large improvements to public transport systems currently underway or being planned.
Recent GCRO survey results highlight that NMT remains the choice of the wealthy and the necessity of the poor. The survey reveals that many NMT users have below average quality of life compared to other transport users – a finding which challenges an emerging international argument that NMT users tend to have higher quality of life in urban contexts. This is in part due to inadequate NMT infrastructure provision for NMT and an urban spatial form designed around motorised transport modes.
This chapter starts by highlighting selected international case studies of cities that have facilitated transitions to NMT, including Copenhagen, New York City and Bogotá. The local NMT environment is then discussed through an interrogation of local policies and plans related to NMT, a review of recent statistics from the GCRO’s 2011 Quality of Life (QoL) Survey, and a brief assessment of recently developed NMT infrastructure. This chapter shows that while local policies and plans have adopted some of the strategies that have been effectively implemented internationally, the evidence from survey findings and spatial form investigations show that despite some similarities between the case studies and the GCR, this region is faced with specific and unique challenges. The approach to NMT must be sensitive to the realities of this local context.

Mobility in the GautenG city-ReGion
132
5.2 The international trend towards NMT Mohan and Tiwari (1999) argue that catering for NMT is vital in developing a sustainable transport system that provides safe, accessible and environmentally friendly mobility for all city residents. Facilitating a modal change towards NMT provides low income groups with an affordable and safe mode of transport, and high income earners with an alternative to private car usage. Some of the benefits of a modal shift to NMT include: reduction in pollution and congestion; reduction in road accidents and fatalities; improved health; and increased quality of life. Benefits such as these are in line with a range of developmental goals – including climate change mitigation and a lower metabolic rate given growing resource constraints – which are high on the agenda of many cities.
Given these objectives, there is an international trend towards making cycling and walking safer and more convenient in order to increase the number of users. Examples of how cities in developed and developing countries have facilitated this change include Copenhagen, New York City and Bogotá. These case studies highlight a number of strategies that have recently been included in local planning for NMT.
5.2.1 CopenhagenCopenhagen in Denmark is an old European city that was established long before the invention of cars, and was thus built for pedestrians and carts. By the mid-20th century, however, the demand for private cars had grown to such an extent that city planning was compelled to shift to facilitate the movement of private vehicles (Santos et al., 2010). More recently a number of factors such as high oil costs, the early environmental movement and public pressure, have caused a
reversal back towards NMT. Various strategies were adopted to facilitate this shift, including reducing the number of available parking bays, building high-quality pedestrian infrastructure, and instituting an extensive bicycle-sharing network (Santos et al., 2010).
Safety has also been prioritised, and effective linkages between public transport and the bicycle network have been created, enabling a large proportion of people to use a combination of cycling and public transport for their work commute (Mohan and Tiwari, 1999; Santos et al., 2010). These commitments have, over time, resulted in significant reductions in traffic congestion and road fatalities, and have also limited urban sprawl (Santos et al., 2010). It should be noted that the historical pedestrian-centred design of this city has made it easier to transition back to NMT than would be the case in a large sprawling city-region. Copenhagen has developed its NMT culture over time, and taken advantage of an historical urban form originally designed for walking. This is a luxury many modern cities, such as New York City, do not have.
5.2.2 new york CityNew York City (NYC) in the United States of America has recently undertaken to improve the sustainability of its transport system as part of the PlaNYC 2030 vision for the city (NYC, 2008). The plan envisions sustainable growth, climate change reduction and an improved quality of life for New York residents (NYC, 2011a). The plan commits to “improve and expand sustainable transportation infrastructure and options” by focusing on public transport, car hire and share options, as
well as NMT (NYC, 2011b, p.91). The premise behind this vision was to shift the historical focus of transport planning from providing large-scale transport infrastructure to providing wider mobility choice, thereby improving the quality of life of residents (NYC, 2008).
In order to increase bicycle use a number of approaches were followed: the adoption of the ‘complete street’ design model that ensures the safety and convenience needs of all road users; the provision of bicycle oriented infrastructure; developing a city-wide bicycle network; education; and a bike-sharing initiative (NYC, 2011b). Underpinning all of these changes was the goal of improving the safety and accessibility of city transport and reducing private car usage. The city acknowledged that in order for people to undertake a modal shift from cars to cycling or walking, the streets and paths have to be safe and appealing spaces for people. Iconic areas of the city, including Times Square and Broadway, have been closed to cars and designated as permanent pedestrian and bicycle friendly areas (Replogle and Kodransky, 2010). These interventions have resulted in a three-fold increase in the number of commuter cyclists between 2000 and 2011.
5.2.3 BogotáThe city of Bogotá in Colombia has led a transformation towards NMT and public transport over the past few decades, and today is regarded as a leader in the field despite its developing context. The need for the NMT transition arose out of high levels of congestion due to increased private car usage. The city of Bogotá instituted a number of programmes to encourage the envisioned transition, including the Cicloruta and Transmilenio systems, and Ciclovía.

Chapter 5 TransiTions To non-moTorised TransporT in GauTenG
133
The Cicloruta and Transmilenio systems are the infrastructural complement to the city’s commitment to encourage NMT and public transport usage by its inhabitants. The Cicloruta system consists of roughly 300km of bicycle paths though the city, connecting people to employment, education and recreational destinations (Cervero et al., 2009; Parra et al., 2007). The Transmilenio system comprises a network of buses with dedicated lanes to ensure rapid movement through the city even during peak traffic times. The success of this system has inspired many cities around the world, including a number in South Africa, to institute similar BRT services to reduce congestion and encourage public transport use.
The infrastructural transitions have been mirrored by social initiatives aimed at increasing physical activity and participation in public spaces within the city (Parra et al., 2007). The Ciclovía initiative, which started in 1974 as a protest against shrinking recreational areas and pollution in the city, has developed into a weekly event where up to 117km of roadways are closed to motorised traffic and function as public spaces, encouraging cyclists and communities to use and interact in the temporary public space network (Parra et al., 2007).
Bogotá’s two-pronged approach to providing new high quality infrastructure and supporting social initiatives that encourage NMT use has resulted in a highly successful city-wide transition to NMT. Since the development of the Cicloruta, it has been estimated that cycling trips have increased five-fold (Dac and Cities, 2012). Parra et al. (2007, p.344) highlight that “[Bogotá] has undergone a number of urban and social changes which have resulted in a positive effect on the recovery of public
spaces, access to recreational facilities, and promotion of non-motorized and public transportation options. These changes may have enhanced perceptions of quality of life and facilitated increased physical activity.”
5.2.4 international case study lessonsEach of the three case studies highlight that the shift away from private car usage to greater NMT and public transport usage was facilitated by a combination of dedicated policies and programmes. These either restricted the ease of using private vehicles or increased the ease and safety of NMT. The key strategies include:
• Restricting car access to certain areas (permanently or temporarily)
• Reducing parking bays
• Upgrading public transport
• Providing bicycle share schemes
• Developing high quality NMT network infrastructure
• Supporting social NMT mainstreaming activities
• Creating linkages between public transport and NMT networks
• Adopting a ‘complete street’ design model
Although each case study city adopted different approaches to address their specific needs, in all of the case studies the importance of developing high quality NMT infrastructure was emphasised. International examples such as these have influenced local policy and plans regarding NMT.
5.3 Local policy context The literature suggests that a conducive policy and institutional environment is a vital precursor to increasing NMT, and particularly bicycle usage (I-ce, 2000). The NMT policy context for the GCR is considered through a brief review of key national, provincial and local government plans meant to facilitate the uptake of NMT.
5.3.1 draft national nmt policy A draft national NMT policy identifies that NMT is a crucial part of an integrated transport system and commits to facilitate the integration of NMT into the transport systems in the country (DoT, 2008). The draft policy highlights that “[e]ncouraging an increase in levels of non-motorised activity is consistent with the development of integration, social inclusion and sustainability in transport and other areas of social activity” (DoT, 2008, p.10). The focus of the draft policy is directed towards people who have limited to or no access to public transport, such as rural, marginalised and poor communities. The policy plans to address issues of accessibility and social exclusion through improving NMT infrastructure and increasing the use of bicycles. Two primary mechanisms are identified to facilitate increased NMT usage: building safe NMT infrastructure that increases accessibility; and providing bicycles to communities through the Shova Kalula (Pedal Easy) Programme (DoT, 2008).
The draft policy proposes increasing the safety of NMT by improving infrastructure that separates motorised and non-motorised modes. This separation minimises the risk of accidents, while maintaining integration with the transport system as a whole (DoT, 2008). The policy emphasises that

Mobility in the GautenG city-ReGion
134
the historical design of transport infrastructure in South Africa has given motorists a false sense that roads are the sole domain of motorised vehicles, where pedestrians and cyclists have no place (DoT, 2008). This has resulted in motorised vehicles taking the right of way and placing more vulnerable road users at risk. Improved infrastructure should reduce the accident risk for NMT users and thus encourage greater NMT uptake.
The Shova Kalula Programme was established by the National Department of Transport (DoT) in 2001 to address the inaccessibility of rural areas. The programme is intended to be implemented by provincial departments, with the aim of providing one million low cost bicycles to people living in rural areas, particularly women and children (CoJ, 2009). By providing bicycles, the programme aims to reduce travel times and increase access to healthcare and education facilities, and encourage participation in public decision-making forums (DoT, 2008). The programme places strong emphasis on providing bicycles to schools and learners to reduce travel times to and from school.
The draft policy’s focus on rural communities provides limited direction for the role of NMT in the urban city-region. Although rural, marginalised and poor communities have the greatest need and dependence on non-motorised modes of transport, the focus on this group, with only anecdotal reference to other socio-economic groups, is likely to further entrench the perception that NMT is limited to those who cannot afford other transport modes. The policy’s focus on rural areas also means that it fails to support increased NMT in urban areas as a necessary component of the whole transport network.
The primary responsibility for implementing the Draft National NMT Policy lies with the national DoT. However, the policy places the responsibility of defining and implementing local plans on provincial departments and municipalities. The draft
national NMT Policy stipulates that NMT must be integrated into Provincial Land Transport Frameworks and Local Municipal Integrated Transport Plans. The policy highlights that sufficient capacity is necessary at the local level, in order for sound policies to incorporate current knowledge and best practices, and for the correct implementation at the local level. The policy asserts that DoT is responsible for providing this capacity within five years. However, the policy remains in draft form today. Despite this challenge the Gauteng Provincial Government (GPG) has incorporated NMT into transport plans for the province.
5.3.2 gauteng provinceThe Gauteng Department of Roads and Transport (GDRT) aims “[t]o provide an environmentally sustainable road infrastructure and integrated transport systems and services that are reliable, accessible, safe, and affordable and which promote socio-economic development in Gauteng” (GDRT, 2009, p.8). The department recently developed a 25-year Integrated Transport Master Plan (ITMP25) for Gauteng that outlines how this aim will be achieved.
The draft ITMP25 details a plan for transport in Gauteng over the next 25 years (GDRT, 2013a) and comprises eight primary interventions that are intended to reshape the province’s transport system, including ‘mainstreaming NMT’. This intervention focuses on how to accommodate and reprioritise different modes through the reorientation of street design, a strategy that has been successful in other cities – for example NYC’s adoption of a ‘complete street’ design model – in ensuring universal access through the transport network (Figure 5.1). Emphasis is placed on reprioritising road users so that pedestrians are placed at the top of the hierarchy, followed by cyclists, public transport and private vehicles respectively (Figure 5.2).

Chapter 5 TransiTions To non-moTorised TransporT in GauTenG
135
figure 5.1: Complete street design that caters for all road users. (source: gdrt, 2013a, p.94)

Mobility in the GautenG city-ReGion
136
figure 5.2: the proposed modal hierarchy for the gauteng street network. (source: gdrt, 2013a, p.62)
In addition to this specific NMT intervention, many of the other interventions in the ITMP25 highlight the need for NMT to be integrated into other plans, such as municipal public transport and land use plans. The ITMP25 identifies a list of short-term interventions that focus on key areas needing to be addressed urgently. The implementation of these interventions is detailed in the Gauteng 5-year Transport Implementation Plan (GTIP5) (GDRT, 2012).
The GTIP5 consists of 13 interventions, which include prioritising ‘pedestrian paths and cycle ways’. To provide context to these interventions, the GTIP5 discusses a number of national policies, plans and frameworks relating to and guiding transport planning and NMT in Gauteng. One of the major challenges identified in this plan is the lack of coordination across the province, as well as the limited budged provision for and prioritisation of NMT (GDRT, 2012). The components of the NMT intervention focus on addressing a number of areas that are particularly dangerous for pedestrians, building dedicated NMT walkways and bicycle lanes, and distributing bicycles through the Shova Kalula Programme (GDRT, 2012).
The GTIP5 highlights that the City of Johannesburg has taken the lead in mainstreaming NMT (GDRT, 2012). While other municipalities in the region also give attention to NMT in their transport planning, it is beyond the scope of this chapter to review them all. The City of Johannesburg’s policies and plans are therefore taken as indicative of local approaches to NMT in the GCR.
1
2
3
4
Chapter 5 TransiTions To non-moTorised TransporT in GauTenG
137
5.3.3 City of JohannesburgIn 2009, the City of Johannesburg produced a Framework for NMT to guide future policy and highlight priority areas for NMT in the city (CoJ, 2009). The recommendations from the framework have been incorporated into the draft Strategic Integrated Transport Plan Framework (SITPF) for the City of Johannesburg (CoJ, 2013). However, the recommendations from the NMT framework do not seem to have filtered into planning documents much beyond transport planning.
The main intention of the SITPF is to pave the way for the prioritisation of public transport and NMT in the transport system (CoJ, 2013). The framework provides an analysis of the status quo of transport in Johannesburg, the city’s development achievements and limitations over the previous ten years, as well as the transport vision for the future. Included in this vision is an integrated transport network where NMT is one of the preferred modes of transport in the city. Strong emphasis is placed on the role NMT will play as a feeder mode for public transport, particularly around the transport nodes and corridors (CoJ, 2013). The SITPF incorporates the principle of universal access by proposing street design that ensures the safety of people using all modes. The SITPF highlights, however, that the existing infrastructure does not meet the needs of the current users (CoJ, 2013). The planned changes in the transport system create the basis for infrastructure development.
Although the SITPF provides clear direction towards prioritising public transport and NMT in the city, it places only cursory emphasis on the impact of the city’s sprawling nature on transport. The framework alludes to the need to reduce daily travel distances, but does not adequately address the challenge that the spatial extent and form of the city does not enable an easy transition to NMT and public transport for large portions of the population. Travel choices are strongly influenced by this challenge.
The local policy context – briefly explored here with reference to key national, provincial and local government documents – highlights that public transport and NMT are becoming the primary focus of transport planning. At a national level there is limited focus on the role of NMT in urban contexts, however, the plans for Gauteng and the City of Johannesburg approach NMT as an important component of an integrated transport system. It is acknowledged across all three policy levels that NMT has not been prioritised in the past, which has resulted in it being a mode of necessity and not choice for the majority of users. The following section uses QoL Survey data to investigate who these NMT users in the GCR are.
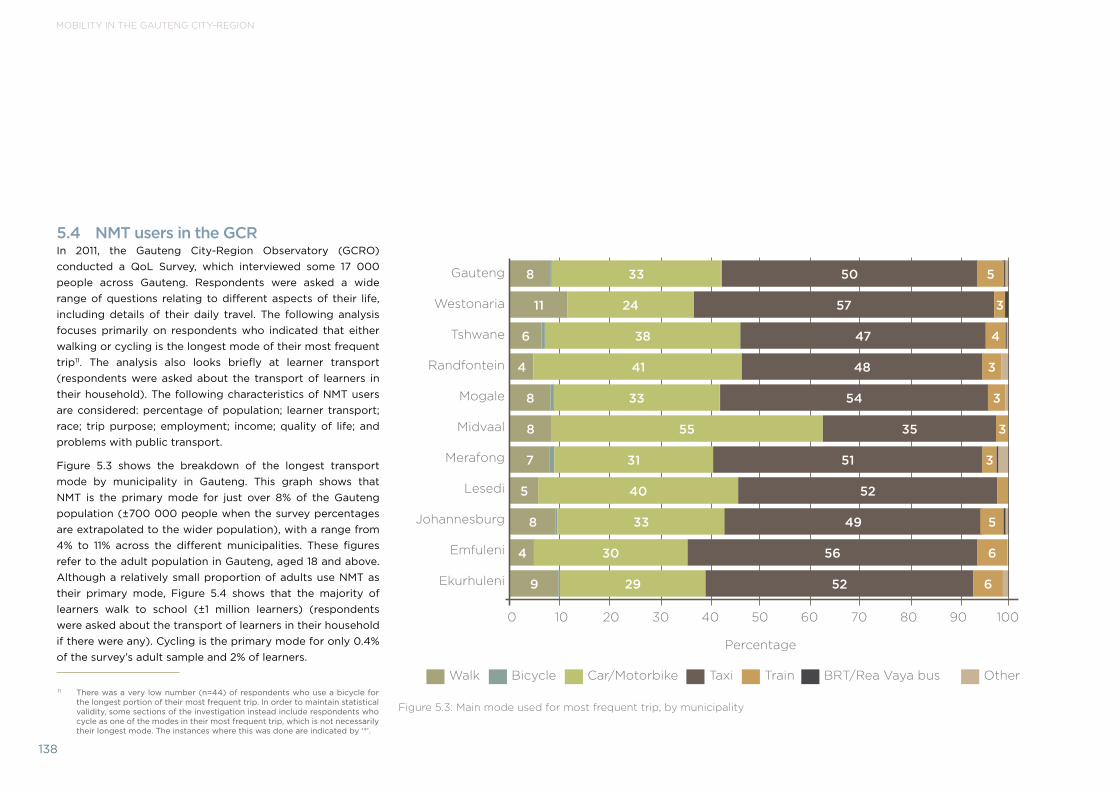
Mobility in the GautenG city-ReGion
138
5.4 NMT users in the GCRIn 2011, the Gauteng City-Region Observatory (GCRO) conducted a QoL Survey, which interviewed some 17 000 people across Gauteng. Respondents were asked a wide range of questions relating to different aspects of their life, including details of their daily travel. The following analysis focuses primarily on respondents who indicated that either walking or cycling is the longest mode of their most frequent trip11. The analysis also looks briefly at learner transport (respondents were asked about the transport of learners in their household). The following characteristics of NMT users are considered: percentage of population; learner transport; race; trip purpose; employment; income; quality of life; and problems with public transport.
Figure 5.3 shows the breakdown of the longest transport mode by municipality in Gauteng. This graph shows that NMT is the primary mode for just over 8% of the Gauteng population (±700 000 people when the survey percentages are extrapolated to the wider population), with a range from 4% to 11% across the different municipalities. These figures refer to the adult population in Gauteng, aged 18 and above. Although a relatively small proportion of adults use NMT as their primary mode, Figure 5.4 shows that the majority of learners walk to school (±1 million learners) (respondents were asked about the transport of learners in their household if there were any). Cycling is the primary mode for only 0.4% of the survey’s adult sample and 2% of learners.
figure 5.3: main mode used for most frequent trip, by municipality
11 There was a very low number (n=44) of respondents who use a bicycle for the longest portion of their most frequent trip. In order to maintain statistical validity, some sections of the investigation instead include respondents who cycle as one of the modes in their most frequent trip, which is not necessarily their longest mode. The instances where this was done are indicated by ‘*’.
walk Bicycle Car/motorbike taxi train Brt/rea vaya bus other
gauteng
westonaria
tshwane
randfontein
mogale
midvaal
merafong
lesedi
Johannesburg
emfuleni
ekurhuleni
0 10 20 30 40 50 60 70 80 90 100
percentage
11 24 57 3
6 38 47 4
4 41 48 3
8 55 35 3
7 31 51 3
405 52
8 33 49 5
338 50 5
8 33 54 3
4 30 56 6
9 29 52 6

Chapter 5 TransiTions To non-moTorised TransporT in GauTenG
139
figure 5.4: learners’ main modes of transport, by municipality
7
0 10 20 30 40 50 60 70 80 90 100
percentage
walk Bicycle Car/motorbike taxi train school bus Brt/other bus other
50 20 16 7
57 16 10 10
47 26 12 10
23 30 9 25
57 13 13 10
49 14 13 13
46 23 15 9
61 12 14 5
52 19 13 8
westonaria
tshwane
randfontein
mogale
midvaal
merafong
lesedi
Johannesburg
emfuleni
ekurhuleni
56 11 11 12
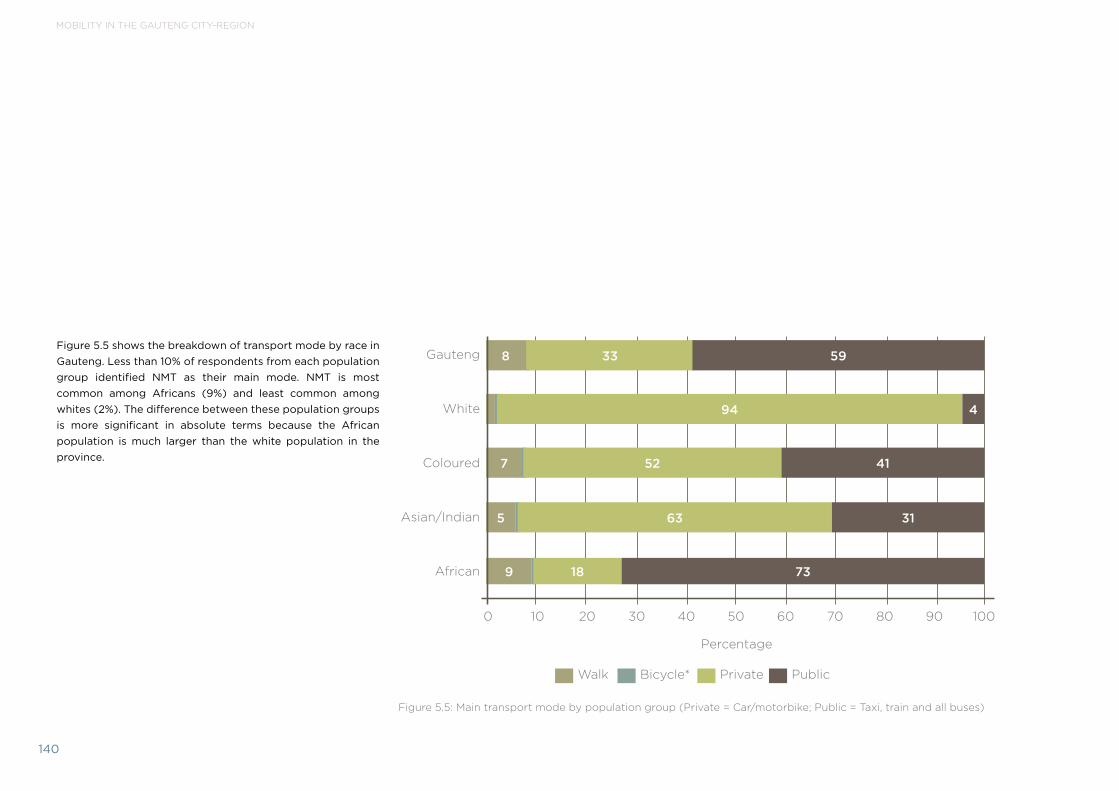
Mobility in the GautenG city-ReGion
140
Figure 5.5 shows the breakdown of transport mode by race in Gauteng. Less than 10% of respondents from each population group identified NMT as their main mode. NMT is most common among Africans (9%) and least common among whites (2%). The difference between these population groups is more significant in absolute terms because the African population is much larger than the white population in the province.
figure 5.5: main transport mode by population group (private = Car/motorbike; public = taxi, train and all buses)
walk Bicycle* private public
gauteng
white
Coloured
asian/indian
african
8 33
0 10 20 30 40 50 60 70 80 90 100
percentage
59
94 4
7 52 41
5 63 31
9 18 73

Chapter 5 TransiTions To non-moTorised TransporT in GauTenG
141
It was highlighted earlier in this chapter that NMT tends to be a mode of necessity rather than choice. This dynamic is explored in the following analysis of trip purpose; employment; income; quality of life; and problems with public transport.
Figure 5.6 shows the breakdown of transport modes by trip purpose. Across all modes, work trips constitute the largest proportion of trips made. The main purpose of walking trips is split between work trips (39%) and shopping trips (26%). The purpose of 10% of NMT trips is to get to a place of study, whereas the proportion across other modes is 6%. The graph shows that for job-seekers public transport (20%) plays an important role followed by NMT (10%). Only a small percentage of private transport trips (3%) are used to look for work.
figure 5.6: main transport mode by trip purpose (private = Car, motorbike; public = taxi, train and all buses)
work look for work study shopping Children to school leisure/entertainment other
public
private
Bicycle*
walk
46 20 6
0 10 20 30 40 50 60 70 80 90 100
percentage
24 10
61 3 6 17 4 7
50 10 9 21 7
39 10 10 26 11
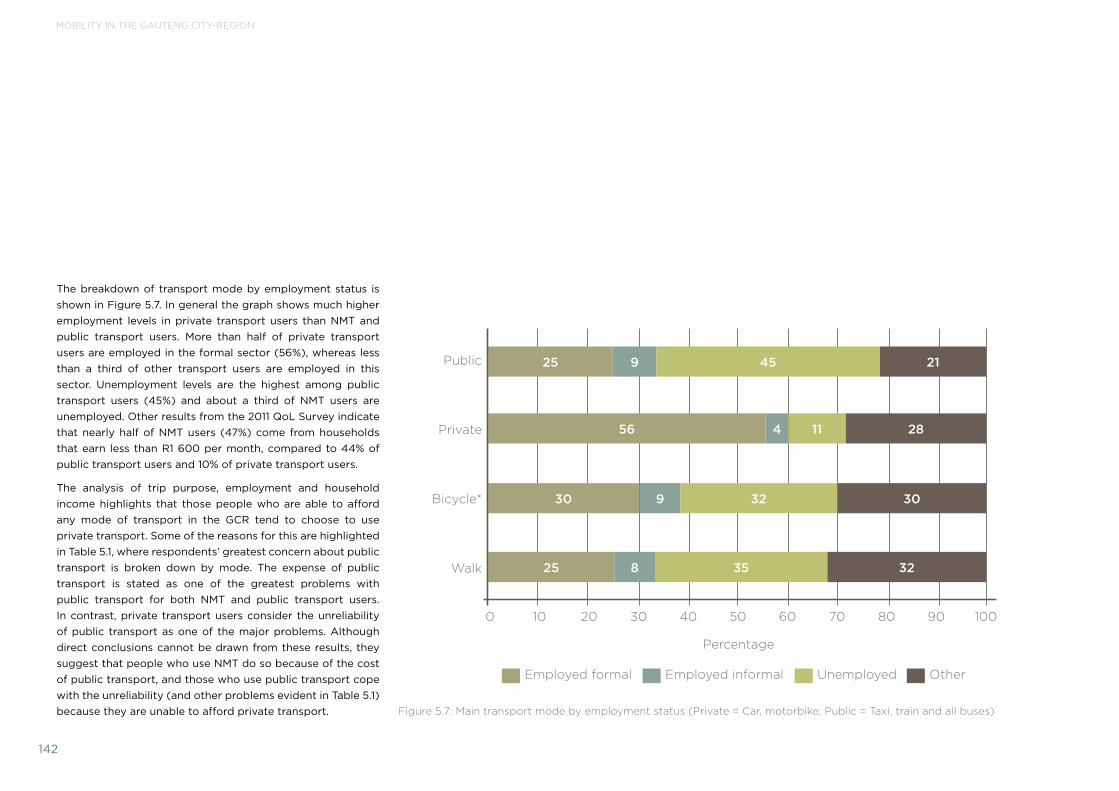
Mobility in the GautenG city-ReGion
142
The breakdown of transport mode by employment status is shown in Figure 5.7. In general the graph shows much higher employment levels in private transport users than NMT and public transport users. More than half of private transport users are employed in the formal sector (56%), whereas less than a third of other transport users are employed in this sector. Unemployment levels are the highest among public transport users (45%) and about a third of NMT users are unemployed. Other results from the 2011 QoL Survey indicate that nearly half of NMT users (47%) come from households that earn less than R1 600 per month, compared to 44% of public transport users and 10% of private transport users.
The analysis of trip purpose, employment and household income highlights that those people who are able to afford any mode of transport in the GCR tend to choose to use private transport. Some of the reasons for this are highlighted in Table 5.1, where respondents’ greatest concern about public transport is broken down by mode. The expense of public transport is stated as one of the greatest problems with public transport for both NMT and public transport users. In contrast, private transport users consider the unreliability of public transport as one of the major problems. Although direct conclusions cannot be drawn from these results, they suggest that people who use NMT do so because of the cost of public transport, and those who use public transport cope with the unreliability (and other problems evident in Table 5.1) because they are unable to afford private transport. figure 5.7: main transport mode by employment status (private = Car, motorbike; public = taxi, train and all buses)
public
private
Bicycle*
walk
25 9 45
0 10 20 30 40 50 60 70 80 90 100
percentage
21
employed formal employed informal unemployed other
56 4 11 28
30 9 32 30
25 8 35 32

Chapter 5 TransiTions To non-moTorised TransporT in GauTenG
143
Problem Walk Bicycle Private Public
unreliability 11% 10% 17% 11%
unroadworthy vehicles 15% 11% 12% 13%
Crime/security 2% 2% 4% 3%
reckless driving 11% 11% 14% 12%
rude drivers and/or passengers 8% 8% 12% 13%
lack of comfort 8% 9% 9% 8%
expense 16% 17% 8% 16%
insufficient service at night 1% 2% 2% 2%
insufficient service on weekend 1% 0% 1% 1%
long walk to nearest stop/station 3% 3% 2% 2%
long wait at stop/station 4% 7% 5% 5%
other 18% 19% 14% 14%
total 100% 100% 100% 100%
table 5.1: single biggest problem with public transport (percentage of mode)
In summary, the results from the 2011 QoL survey show that NMT is the primary transport mode for only a small proportion of the population, and cycling makes up only a very small proportion of NMT. Walking, however, provides the primary mode by which learners get to school. In general, public transport and NMT users have lower employment levels and come from households with lower income than private transport users. These factors also affect the overall quality of life of people in the GCR.
A QoL Index was developed by combining a range of questions from the 2011 QoL Survey. Figure 5.8 shows the QoL Index broken down by mode. In overall terms the majority of people in the GCR have good to high quality of life. When this is broken down according to people using different transport modes, the graph shows that people who walk as their main transport mode tend to have worse quality of life than people using all other modes, besides train users. The majority of people who cycle, however, have a good to high quality of life. People who use private transport have by far the highest quality of life of all transport users. These figures reemphasise that in the GCR private transport is the preferred mode and walking is a mode of necessity.

Mobility in the GautenG city-ReGion
144
figure 5.8: Quality of life and transport mode
5.5 NMT infrastructure in the GCRThe analysis of NMT users in Gauteng has highlighted that NMT is not a preferred mode for the majority of residents and is mostly used by those who cannot afford other transport options. The high accident risk for pedestrians is one of the contributing factors to this situation. The 2003 National Household Transport Survey (DoT, 2005) found that pedestrians make up 40% of all road fatalities in Gauteng. These high pedestrian fatality figures are in part due to alack of adequate pedestrian infrastructure. Each of the international case studies presented earlier in the chapter highlighted the importance of high quality NMT infrastructure to increase NMT use, safety and status. This section provides a brief overview of the existing NMT infrastructure in Gauteng, including some of the recent developments and on-going challenges.
The emerging emphasis on NMT in policies and plans is slowly translating into infrastructure developments in the region. A number of cycle paths have been built in the City of Tshwane and pavements have been implemented widely across the city. Bicycle stands have been installed in the Hatfield area, as well as in and around the main campus of the University of Pretoria (UP) (CoT, 2012). Tshwane’s rollout of NMT infrastructure is more evident than in many of the other local municipalities in the GCR. However, there are developments across the rest of the region. In 2011 a pedestrian and cycle path was built to provide safe NMT access in and out of Zandspruit in the City of Johannesburg. This path was funded by the Gauteng province and is used extensively by pedestrians, cyclists and other NMT users of all ages.
poor Below average good high
overall
Bus/Brt
train
taxi
Car/motorbike
Bicycle*
walk
0 10 20 30 40 50 60 70 80 90 100
percentage
15 32 47 6
9 36 54
16 44 36 4
17 37 44 3
7 28 54 12
15 31 49 5
19 36 42 3

Chapter 5 TransiTions To non-moTorised TransporT in GauTenG
145
In addition to these formal NMT paths, there are a number of recreational cycling routes within Gauteng, including along the Braamfontein Spruit in the City of Johannesburg. This trail extends for about 20kms from Emmarentia to Rivonia and is used extensively on every weekend by runners, walkers and cyclists. NMT has become an important aspect of recreational activity in the GCR.
Despite the previous examples, NMT infrastructure in the GCR tends to be isolated and lacks integration with the transport network. Throughout the region there is generally a lack of adequate and continuous NMT paths that ensure the safety of NMT users. In some areas there are no pavements and in other areas the paths are blocked by obstacles such as building rubble and planted kerb gardens. In these places pedestrians are forced to walk in the street where there is a high risk of being hit by a vehicle. Rivers and streets that do not have safe crossing points have also been highlighted as areas of high risk for pedestrians. Although a number of projects have been implemented around Gauteng to address some of the key NMT safety hotspots, these have tended to be ad hoc (GDRT, 2012). Unfortunately, even some of the new high quality NMT infrastructure leaves NMT users at risk. The NMT path in Zandspruit is such an example. The path is not well integrated with other pedestrian routes or public transport and where the path comes to an end, pedestrians are forced onto a main road where vehicles travel at high speeds. This path is indicative of a piecemeal approach to NMT that exists in the GCR.
A number of small cycle networks are currently being piloted in areas such as Soweto in Johannesburg and Atteridgeville in Tshwane. The success of these projects will influence how future projects are rolled out in other areas. The challenge here remains that because these networks do not extend across larger areas of the city region or integrate well with public transport, their effectiveness is limited. Ultimately, NMT networks in the GCR should be continuous and integrated into the transport system, and extend across municipal boundaries.
The sprawling urban extent of the GCR and the associated cost of developing the necessary infrastructure across a wide scale present both a physical and financial challenge. So far the resources that have been directed at developing an NMT network have been very limited. The challenge of allocating sufficient budget for NMT is highlighted in the ITMP25 as something that needs to be addressed (GDRT, 2013b). In dealing with this challenge, the roles of various government departments in providing NMT infrastructure also need to be defined. At present there seems to be potential misalignment between provincial and municipal NMT projects that entrench the fragmented nature of NMT infrastructure (CoJ transport official (anonymous), pers. comm., 2013).
Despite the challenges faced in implementing a good NMT network, the current public transport developments provide a key opportunity for expanding NMT infrastructure. The recent Rea Vaya BRT developments in the City of Johannesburg
have included significant improvements to paving, pedestrian paths and road crossings. Although these improvements make great strides towards integrating the NMT and public transport networks, no bicycle facilities have been catered for and passengers are not allowed to take bicycles on the buses (CoJ transport official (anonymous), pers. comm., 2014). Due to the sprawling nature of the city-region, which means that distances are generally too far to use NMT as a primary mode, the integration of NMT and public transport networks is likely to play the most important role in facilitating the uptake of NMT.

Mobility in the GautenG city-ReGion
146
figure 5.9: Bicycle racks at a newly constructed standard Bank Building, rosebank (photo taken before employees moved into the building). (source: Christina Culwick)

Chapter 5 TransiTions To non-moTorised TransporT in GauTenG
147
5.6 The role of society in shifting to NMTIn addition to government policy and infrastructure investments that encourage the uptake of NMT, the role of society cannot be underestimated. Despite the existing challenges related to NMT, there is a growing bicycle culture in Gauteng, which is evident in the deepening popularity of recreational cycling (and commuter cycling to a smaller degree). This developing culture has been assisted by organisations, campaigns and movements, which aim to increase the profile of NMT, particularly cycling, in the public, private and community sectors. These sectors play an important role in realising the visions set out in policy and changing the current social and cultural norms around transport modes.
The emphasis on motorised, and particularly private car use, has shaped public culture. Owning and driving a car is seen as a status symbol that influences people’s day-to-day transport choices. Internationally, economic development has been coupled with an increase in motorised transport and a decrease in NMT (I-ce, 2000). Venter and Cross (2011, p.104) highlight that “…peoples’ travel preferences and expectations
are affected by the extent to which they associate with the values of modern, urban society.” Private cars have become a symbol of modernity, progress and success, which has been ingrained in the social fabric of society. Cities across the world have developed to facilitate cars, and their presence has been embedded in the imagination, collective memory and culture of generations. With a growing middle class in the GCR, there is likely to be an increase in private car usage and ownership.
Current social perceptions and habits pose substantial barriers to NMT uptake in the city-region. Addressing these challenges is fundamental to the success of transitioning to NMT. Businesses play a role in encouraging behavioural changes in their employees, such as providing bicycle storage racks and incentives not to drive to work (Figure 5.9). Bylaws and other mechanisms can be developed by municipalities to incentivise businesses to adopt such strategies (Ang and Marchal, 2013).
One such mechanism that the City of Johannesburg has launched is the ‘Streets Alive’ campaign, which is similar to Bogotá’s Ciclovía. This campaign aims to temporarily convert a section of roads into public space. Although so far support has been limited, this campaign will continue in the hope of gaining public support over time. The Critical Mass movement is another initiative that works on a similar premise to the Ciclovía. On the last Friday night of every month cyclists gather to ride through the streets of the Johannesburg city centre. This movement has seen a huge growth in numbers since the first ride and currently hosts a few thousand people at each event12.
There is an opportunity to use existing social movements and initiatives to bolster enthusiasm and the perception of NMT as a viable transport option. As mentioned here already, there are a number of pro-cycling initiatives and organisations that are gaining popularity in the GCR. Cycling is growing as a recreational activity, and there is a key opportunity for this sport to be developed into more than just recreation and into a mode or culture of commuter transportation.
12 Details can be found on the Johannesburg Critical Mass website (http://jhb.criticalmass.co.za/).
Mobility in the GautenG city-ReGion
148
5.7 Transitioning to NMT in the GCRThe GPG envisions a sustainable, integrated transport system for the GCR in which NMT plays an essential role (GDRT, 2012). The emerging provincial and local policies are starting to build an enabling environment for the reprioritisation of the transport system towards NMT. The transition to NMT is, however, unlikely to follow a linear progression. Figure 5.10 emphasises the need for an integrated approach to NMT, which combines policy and planning initiatives, infrastructure development, and social shifts. The policy environment needs to provide guidance for how NMT will integrate into other transport networks, as well as the necessary motivation for budget allocations for infrastructure developments. The development of quality NMT infrastructure ought to play a vital role in facilitating safe and accessible NMT use. The international case studies highlight the importance of reprioritising transport infrastructure in changing behaviour within society and increasing NMT use.
This chapter has shown that recent policy and planning documents are following the trend of international cities in prioritising NMT and NMT users. Currently in the GCR, NMT is not a preferred mode of transport and the 2011 QoL Survey results reveal that less than 10% of the adult population in Gauteng uses it as a primary mode. This group of users is characterised by having high unemployment and low income levels, and the survey results suggest that they primarily use NMT due to its affordability. The existing NMT infrastructure environment entrenches public perceptions of NMT as a mode that is used when there are no other options.
Government is currently investing billions of rand in improving public transport infrastructure, including large scale bus and rail projects. NMT is often side-lined in these projects despite the role it plays in most public transport trips in linking public transport with the starting point and final destination. In the GCR, where people travel long distances on a daily basis, NMT has to be seen as a vital connector to public transport for millions of commuters and not merely an affordable option for those who can’t afford other modes. This transition will require commitment and bold decisions in policy and planning, as well as greater support for community-led initiatives across the GCR.

Chapter 5 TransiTions To non-moTorised TransporT in GauTenG
149
figure 5.10: the interdependence of components associated with a transition to nmt
Infrastructure development• addresses nmt safety
• Complete streets
• extended nmt network
• nmt integrated with public transport
Social shifts• increased nmt users
• Congestion and pollution reductions
• people choose to live closer to work
Policy planning• nmt integration
• Budget allocation
• enabling environment for private and social sector transitions

Mobility in the GautenG city-ReGion
150
some of the surveys behind the 1975 PWV Transportation Study asked respondents for details on the average time taken to make typical daily trips from home to work. not all the surveys did so (for example the 1974 pretoria survey did not), and for african, asian and coloured respondents in the Johannesburg, east rand, west rand and vaal triangle surveys the question was asked separately for public and private modes, making a comparison with the results for white respondents difficult. nonetheless the table gives an indication of the huge differences in average travel times for well-located white residents, compared to that for the people forced under apartheid to live in peripheral areas demarcated for other race groups.
the average travel time for white residents of Johannesburg going to work was a mere 24 minutes across all modes. it rose to 29 minutes on the west rand “due to the fact that a large percentage of workers residing in the west rand commute to Johannesburg.” But this was negligible compared to 36 minutes of travel to work by car for residents of sebokeng, and over an hour for those using public transport. residents of soweto using public transport took on average 87 minutes – just under an hour and a half – to reach work in the morning in the mid-1970s. the Study remarks: “the travel times (for non-whites) by public mode are considerably longer than those by private mode. this is largely due to long access times (most of which are by walk mode) as well as transfers” (transvaal provincial administration roads department, 1980, pp.75-76).
Sub-region Average home-based-work travel
time in minutesWhite (all modes)
Johannesburg 24
east rand 24
west rand 29
vaal triangle 18
Coloured/Asian/African (private transport)
lenasia 46
eldorado park 44
soweto 40
tembisa 37
sebokeng 36
Coloured/Asian/African (private transport)
lenasia 82
eldorado park 77
soweto 87
tembisa 65
sebokeng 61

151levi o’reagan

Mobility in the GautenG city-ReGion
original photo: zinhle masinga

Chapter 6 Photo essay
153
Seeing comes before words…It is seeing which establishes our place in the surrounding world; we explain that world with words but words can never undo the fact that we are surrounded by it. The relations between what we see and what we know is never settled. (Berger, 1972, front cover)
Mobility is concerned with how people move in and around geographic regions. Transport creates connections between people in space. Despite the technical and infrastructural focus of most mobility research and official reports, people are at the centre of transport analysis and planning.
Non-motorised transport (NMT) – referring to all forms of human-powered transport, especially walking and cycling, and animal powered travel (DoT, 2008) – is the most basic form of mobility and thus plays a crucial role in the transport system as a whole. Transportation in South Africa has in the past strongly focused on motorised forms of transport, such as private cars and public transport. NMT has at best been taken for granted, and at worst been stigmatised as modes of transport for the poor and excluded members of society.
This photo-essay captures the current context of NMT in the Gauteng City-Region (GCR), highlighting the challenges and potential opportunities for the future of NMT. All of the photographs used in this essay were taken in the city-region.
A photo essay: Non-motorised transport – forging connections across space and society Christina CulwiCK
NMT is a fundamental part of the transport system. The majority of people in the GCR walk as part of their daily travel, creating the first and final portions of all public transport journeys in the GCR. In Gauteng, 51% of learners walk to school (Figure 2.9, this report). Despite the prevalence of people engaging in NMT and the role it plays in ensuring that people get to places of work and education, there is currently little focus on ensuring that NMT is safe and accessible for all people.

Mobility in the GautenG city-ReGion
154
the last mile: marK momBerg

Chapter 6 Photo essay
155
opportunity: simphiwe mangole

Mobility in the GautenG city-ReGion
156
A tension exists between people and vehicles on the roads of the GCR. There is a subtle yet definite notion that people have no legitimate space on the road. Even on pedestrian crossings, people have to weave, dodge, and run to avoid being hit by vehicles.
The contest for legitimate space is not just evident on the tarmac. In many cases even the pavements and the infrastructure that has been designed for pedestrians do not allow people to move unobstructed. Pedestrians are forced onto the street where they are at risk from vehicles. People seem to be an afterthought in the current transport system. Walking is not considered a legitimate form of transport by all people in society including those who walk as part of their daily commute. Internationally, there are examples of these tensions being addressed through the provision of appropriate infrastructure that regulates where and how pedestrians and vehicles intersect.
oBstruCtion: potsiso phasha

Chapter 6 Photo essay
157
interseCtion: potsiso phasha

Mobility in the GautenG city-ReGion
158
zandspruit nmt path: Christina CulwiCK

Chapter 6 Photo essay
159
The limited extent of quality NMT infrastructure and the perception that NMT is not really a part of the transport system are interrelated factors that entrench the low status of NMT in the GCR. These mutually reinforcing conditions need to be challenged through a reprioritisation of an implicit transport hierarchy. This includes building quality NMT infrastructure networks that make it easy and pleasant to walk and cycle. Quality infrastructure raises the profile of NMT, establishes its legitimacy in the transport system, and increases the perception that walking and cycling are modes of preference. Ensuring the safety of people by separating their pathways from motorised vehicles is a necessary part of this infrastructure.
In the GCR, examples of such infrastructure are becoming visible. However, there is evidence even in the new infrastructure that the old perception of NMT still remains intact. The Zandspruit NMT path in north-eastern Johannesburg is a brilliant example of quality infrastructure, but at the end of this path people are forced back onto the street to compete with vehicles driving at high speeds.
the aBrupt end of the zandspruit nmt path: Christina CulwiCK

Mobility in the GautenG city-ReGion
160
a friendly greeting: pheladi Kgaladi

Chapter 6 Photo essay
161
Adequate NMT infrastructure creates more than just a transport corridor; it creates a public space that connects people and places. Pavements are public spaces where people engage face-to-face, and are confronted with each other’s humanity. On the streets, one encounters the diversity in our society, where people from all walks of life and from different parts of society converge. Face-to-face is the way people learn to see each other as people.
As a motorist, everything is experienced through the barrier of a vehicle. Interactions occur between vehicles, not people. Private vehicles create an artificial bubble of private personal space and with it the illusion that the motorist is in control, able to interact how and with whom they choose. The presence of a person in the motorist’s ‘personal space’ is often experienced as an unwelcome intrusion. The private car acts as a physical barrier to human interaction between people within as little as a metre apart.
the illusion of personal spaCe: sifiso mashwama

Mobility in the GautenG city-ReGion
162
Safe streets and walkways not only create spaces for social interaction; they provide potential for economic activity. NMT corridors have the potential to create entrepreneurial spaces – they bring people from a diversity of economic backgrounds into contact, and in turn open up economic opportunities. When markets are positioned along walkways, passers-by with disposable income may be tempted by the wares on sale at the stalls, and there is the possibility of an opportunistic sale. Traveling via private vehicle prevents people who have more disposable money from ever walking through such a market, except by deliberate intention. This limits the opportunity for wealth to filter through from higher to lower income groups and further entrenches the gap between the rich and poor.
The wealth gap is particularly evident in transport choices between the rich and poor. NMT provides a crucial means of transport for many people, particularly those who cannot afford other modes. Nevertheless, walking and cycling are not considered legitimate forms of commuting in the same way as public and private transport. This contributes to the poverty stigma associated with NMT in South Africa, since the majority of people who use NMT tend not to do so out of choice, and as soon as they can afford to use either public or private transport they will likely stop using NMT.
street marKet: tJaKa segooa

Chapter 6 Photo essay
163
informal trading: patriCK moerane

Mobility in the GautenG city-ReGion
164
transportation: itl CommuniCation & design

Chapter 6 Photo essay
165
reCreation: Kyle Brand

Mobility in the GautenG city-ReGion
166
Although NMT is not considered a legitimate form of transport, cycling and walking are highly valued recreational activities. Thousands of people choose to walk and cycle in and around the city-region for recreation, particularly for exercise. There seems to be a fundamental disconnect between walking and cycling as recreational activities, and as modes of transport. The limited NMT uptake in the city-region is clearly not because the activities in themselves are not appealing. Instead, a range of barriers (infrastructural, social, spatial) limit the number of people using NMT as a mode of transport, not least of which is the perception of NMT not being a legitimate mode within the overall transport system.
If NMT is to become a transport mode of choice these perceptions need to change. Changing habits and perceptions does not happen quickly or easily. However, a start can be made with even minor shifts in the system. There is evidence of such transitions starting to take place in the GCR. Isolated examples such as the Zandspruit NMT path and the painted bicycles on Enoch Sontonga Avenue in central Johannesburg suggest that government is starting to consider NMT within infrastructure planning.
Similarly activities, such as the Critical Mass movement, are attempting to change perceptions regarding cycling. Critical Mass consists mainly of recreational cyclists congregating on the last Friday of the month to ‘take back the streets’ of Johannesburg’s inner city. That said, the effectiveness of these events in changing perceptions is uncertain: there is a chance that they entrench the view that the streets are only safe and accessible during an event or for recreational purposes.
CritiCal mass: Christina CulwiCK
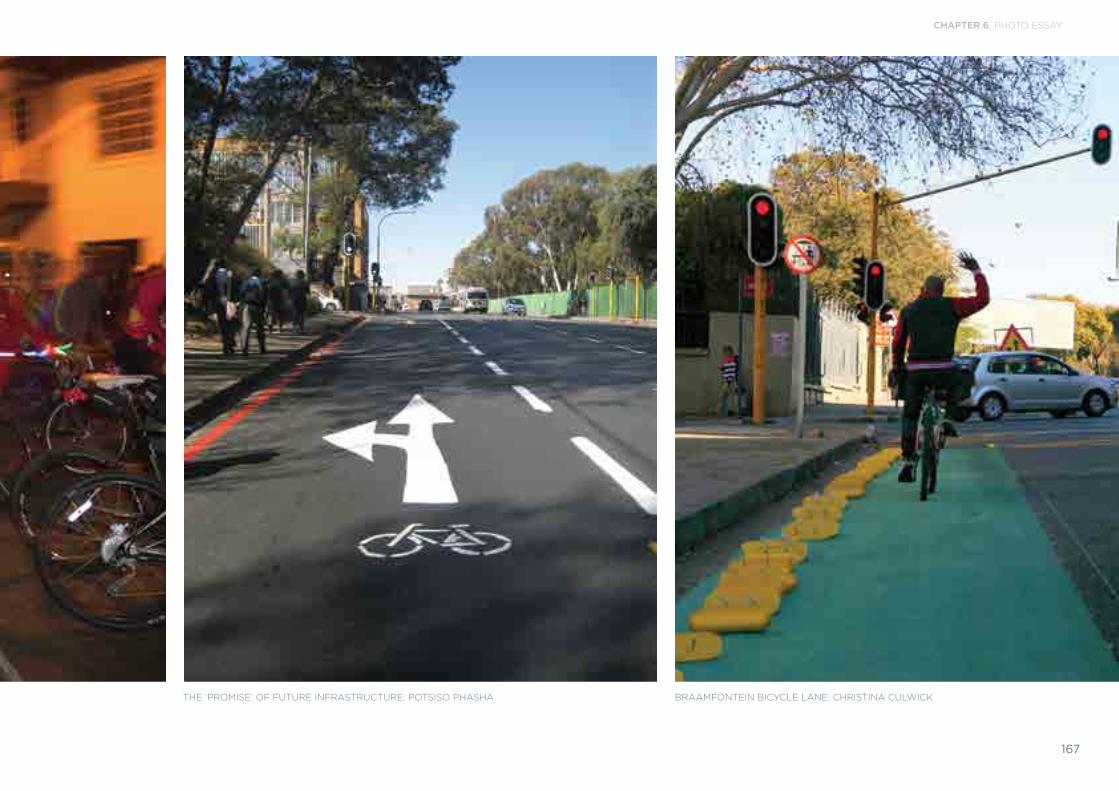
Chapter 6 Photo essay
167
the ‘promise’ of future infrastruCture: potsiso phasha Braamfontein BiCyCle lane: Christina CulwiCK

Mobility in the GautenG city-ReGion
168
nostalgia: daniel magidi
We reminisce about the safe neighbourhoods of the past where children played in the streets because the streets were safe and they were an extension of public space. They weren’t places where vehicles and people collided. Did these neighbourhoods ever actually exist, or are these ‘memories’ conjured up to reassure ourselves that things were once better than they are today? Perhaps it was naivety and ignorance. Perhaps it was true. Regardless of the truth, we yearn for safe streets. Subconsciously we yearn for change.
Such changes are proposed in Gauteng’s 25-year Integrated Transport Master Plan (ITMP25) (GDRT, 2013a). The plan is based on a modal hierarchy where pedestrians are at the top, followed by cyclists, then public transport, with private cars at the bottom of the hierarchy. NMT is planned to be integrated into all components of infrastructure development. The vision has thus been defined, and both mind-set and infrastructure changes are needed if we are to achieve this.

Chapter 6 Photo essay
169
vision: itl CommuniCation & design

Mobility in the GautenG city-ReGion
170
Akanya Development Solutions, Karabo Consulting & StudioMAS Architecture and Urban Design (2008a) Rosebank Urban Development Framework (UDF). Johannesburg: City of Johannesburg.
Akanya Development Solutions, Karabo Consulting & StudioMAS Architecture and Urban Design (2008b) Sandton Urban Development Framework (UDF). Johannesburg: City of Johannesburg.
Akanya Development Solutions & Karabo Consulting (2008) Marlboro Urban Development Framework (UDF). Johannesburg: City of Johannesburg.
Ang, G. & Marchal, V. (2013) Mobilising Private Investment in Sustainable Transport: The Case of Land-Based Passenger Transport Infrastructure. OECD Environment Working Papers, No. 56. Paris: OECD Publishing.
Beavon, K. (2001) ‘The Role of Transport in the Rise and Decline of the Johannesburg CBD, 1886-2001’, in Meeting the Transport Challenges in South Africa. Pretoria: University of Pretoria.
Behrens, R. & Venter, C. (2006) Unravelling Travel Costs: Towards Improved Data Collection and Transport Expenditure Policy Indicators. Proceedings of the 25th South African Transport Conference, Pretoria, 10-13 July.
Berger, J. (1972) Ways of Seeing. London: Penguin Books.
Borden, I., Kerr, J., Rendell, J. & Pivaro, A. (2002) ‘Things, Flows, Filters, Tactics,’ in Borden, I., Kerr, J., Rendell, J. & Pivaro, A. (eds) The Unknown City: Contesting Architecture and Social Space. Cambridge, MA: MIT.
Bremner, L. (2010) Writing the City into Being. Johannesburg: Fourthwall Books.
Bunschoten, R. (2002) ‘Public Spaces’, in Architecture & Urbanism 4. London: Black Dog Publishing.
Cervero, R. (1998) The Transit Metropolis: A Global Inquiry. Washington DC: Island Press.
Cervero, R. (2007) ‘Transit-oriented development’s ridership bonus: a product of self selection and public policies’, in Environment and Planning A. 39 (9), 2068-2085.
Cervero, R., Sarmiento, O.L., Jacoby, E., Gomex, F. & Neiman, A. (2009) ‘Influences of Built Environments on Walking and Cycling: Lessons from Bogotá’, in International Journal of Sustainable Transportation. 3 (4), 203-226.
City of Johannesburg (CoJ) (2008) Gautrain Earns International Kudos [online]. Available from: http://www.joburg.org.za/index.php?option=com_content&id=2462&Itemid=168 (Accessed 24 June 2013).
City of Johannesburg (CoJ) (2009) Transit Oriented Development (TOD) Policy for the City of Johannesburg.
City of Johannesburg (CoJ) (2013) Strategic Integrated Transport Plan Framework for the City of Johannesburg: Draft for Discussion.
City of Johannesburg (CoJ) Transport Official (2013) Personal Communication, 20 July 2013.
City of Johannesburg (CoJ) Transport Official (2014) Personal Communication, 24 January 2014.
City of Tshwane (CoT) (2012) Transport GDS Summary Overview, City of Tshwane. Available from: http://www.tshwane2055.gov.za/images/pdfs/feedback_transportation_week.pdf.
Council for Scientific & Industrial Research (CSIR) (2012) Gauteng Integrated Transport Modelling Centre: Draft Institutional Framework - 12th June 2012. Johannesburg: CSIR Built Environment.
Cross, C.,Venter, C., Kok, P., Turok, I., Mafukidze, J., Olivier, J. & Badenhorst, W. (2013) South Africa’s space economy and access to the city: HSRC’s final report for Phase 1b, IPDM. Pretoria: Human Sciences Research Council.
Dac & Cities (2012) Bogotá: More Bikes and Buses, Fewer Cars [online]. Available from: http://www.dac.dk/en/dac-cities/sustainable-cities-2/all-cases/transport/bogota-more-bikes-and-buses-fewer-cars/?bbredirect=true] (Accessed 9 September 2013).
Department of Transport (DoT) (1996) White Paper on National Transport Policy. Pretoria: South Africa.
Department of Transport (DoT) (2005) National Household Travel Survey 2003: Technical Report. Pretoria: South Africa.
Department of Transport (DoT) (2008) Draft National Non-motorised Transport Policy. Pretoria: South Africa.
Fair, T.J.D. & Mallows, E.W.N. (1959) ‘The Southern Transvaal: An Emerging Metropolitan Complex in Africa’, in The Town Planning Review. 30 (2), 125-138.
Fezer, J. (2010) Design for a Post-Neoliberal City [online]. Available from: http://www.e-flux.com/journal/design-for-a-post-neoliberal-city/ (Accessed 5 October 2013).
Forty, A. (2002) ‘The Royal Festival Hall - a “Democratic’ Space?”’, in Borden, I., Kerr, J., Rendell, J. & Pivaro, A. (eds) The Unknown City, Contesting Architecture and Social Space. Cambridge, MA: Massachusetts Institute of Technology.
Gauteng Department of Public Transport, Roads & Works (2006) Gauteng Transportation Study: GTS 2000, Summary Report, October 2006.
Gauteng Department of Roads & Transport (GDRT) (2009) Strategic Plan 2009-2014. Gauteng Provincial Government.
Gauteng Department of Roads & Transport (GDRT) (2012) Gauteng 25-year Integrated Transport Master Plan: 5-year Transport Implementation Plan. Gauteng Provincial Government.
Gauteng Department of Roads & Transport (GDRT) (2013a) Gauteng 25-year Integrated Transport Master Plan: 12 August 2013 - Draft Plan. Gauteng Provincial Government. Available from: http://www.itmp25.co.za/.
Gauteng Department of Roads & Transport (GDRT) (2013b) Gauteng 25-year Integrated Transport Master Plan: Draft Plan, Annexure G: Non-Motorised Transport. Gauteng Provincial Government. Available from: http://www.itmp25.co.za/.
Gauteng Department of Transport & Public Works (GDTPW) (2000) Gauteng SDI Rail Link Inception report. Gauteng Provincial Government.
Gautrain (2010) Gautrain Celebrates One Million Passengers [online]. Available from: http://www.gautrain.co.za/newsroom/2010/09/gautrain-celebrates-one-million-passengers/ (Accessed 24 June 2013).
Gautrain (2013a) Concessionaire [online]. Available from: http://www.gautrain.co.za/about/about-gautrain/concessionnaire/ (Accessed 24 June 2013).
Gautrain (2013b) Gautrain Website [online]. Available from: www.gautrain.co.za (Accessed 21 June 2013).
Gautrain (2013c) System Design Concept [online]. Available from: http://www.gautrain.co.za/about/services/look-feel/gautrain-station-architectural-design/ (Accessed 24 June 2013).
Gautrain (2013d) Gautrain System and Station Themes [online]. Available from: http://www.gautrain.co.za/about/route/stations/station-themes/ (Accessed 24 June 2013).
Gautrain (2013e) Gautrain Ridership Statistics March 2013. Johannesburg: Gautrain Management Agency.
Gautrain Land Use Planning Committee (2003) Johannesburg Gautrain Station Functional Area Guidelines. Johannesburg: Gautrain Management Agency.
Gehl, J. (2011) Life Between Buildings: Using Public Space. 6th edition. Washington DC: Island Press.
Ghoor, R. (2013) Gautrain: The Space of Transport Rosebank Station and Surrounds. Masters in Urban Design Research Report. Johannesburg: University of the Witwatersrand.
Hedley, N. & Smith, N. (2013) Gautrain ‘will benefit from e-tolls’ [online]. Available from: http://www.bdlive.co.za/business/transport/2013/03/15/gautrain-will-benefit-from-e-tolls (Accessed 25 June 2013).
Henderson, J. (N.D.) Wikimedia Commons [online]. Available from: http://en.wikipedia.org/wiki/Times_Square#mediaviewer/File:Tsq_green_chairs_jeh.jpg (Accessed 28 May 2014).
Interface for Cycling Expertise (I-ce) (2000) The Significance of Non-motorised Transport for Developing countries: Strategies for Policy Development. Available from: http://siteresources.worldbank.org/INTURBANTRANSPORT/Resources/non_motor_i-ce.pdf.
Joubert, H. (2013) Gautrain Transport Engineer, Personal Communication by e-mail, June 2013.
Kagner, K. (2013) Contemporary Infrastructure: An Interview With Marcel Smets [online]. Available from: http://landscapeurbanism.com/article/contemporary-infrastructure-an-interview-with-marcel-smets/ (Accessed 24 June 2013).
References

171
Mabin, A. (2013) The Map of Gauteng: Evolution of a City-region in Concept and Plan. GCRO Occasional Paper 5. Johannesburg: GCRO.
Makhubu, J. (2013) Over the Edge: Restructuring Urbanity in Polarised Contexts using the Gautrain as Catalyst. Masters in Urban Design Research Report. Johannesburg: University of the Witwatersrand.
Malan, J. (2013) Gautrain: The Space of Transport, the Case of Gautrain Park Station. Masters in Urban Design Research Report. Johannesburg: University of the Witwatersrand.
Malcomess, B. & Kreutzfeldt, D. (2013) Not No Place, Johannesburg. Fragments of Spaces and Times. Johannesburg: Fanele.
McKay, T., Simpson, Z., Chipp, K., Patel, N., Sithole, A. & Van den Berg, R. (2013) Mobility in Context: Overview and Analysis of Transportation Data for Gauteng (1975-2009), Report commissioned by the Gauteng City-Region Observatory, 2013.
Mokone, M. (2013) Associate: Research and Evaluation, Feedback Research and Analytics (commissioned by the Gauteng Provincial Government to develop an evaluation framework for the Priority Townships Programme), Personal Communication by e-mail, 31 January 2013.
Mohan, D. & Tiwari, G. (1999) ‘Sustainable Transport Systems: Linkages between Environmental Issues, Public Transport, Non-Motorised Transport and Safety’, in Economic and Political Weekly. 34 (25), 1589-96.
Muller, J. (2013) Gautrain - A Catalyst for Property Development [online]. Available from: http://www.fm.co.za/business/money/2013/03/19/gautrain---a-catalyst-for-property-development (Accessed 31 July 2013).
National Department of Transport (2007) Preliminary Results of the National Travel Survey for Gauteng, January 2007.
National Planning Commission (NPC) (2011) National Development Plan: Vision for 2030. The Presidency: South Africa.
New York City (NYC) (2008) Sustainable Streets: Strategic Plan for New York City Department of Transportation 2008 and Beyond. New York City: Department of Transport. Available from: http://www.nyc.gov/html/dot/downloads/pdf/stratplan_compplan.pdf.
New York City (NYC) (2011a) About PlaNYC [online]. Available from: http://www.nyc.gov/html/planyc2030/html/about/about.shtml (Accessed on 26 June 2013).
New York City (NYC) (2011b) Transportation, in PlaNYC. New York City: Department of Transport.
Organisation for Economic Co-operation and Development (OECD) (2011) The Gauteng City-Region, South Africa 2011. OECD Territorial Reviews, Paris: OECD Publishing. Available online from: http://dx.doi.org/10.1787/9789264122840-en.
Osmond Lange Architects and Planners, Ikemeleng Architects, Henry Paine and Barry Gould, HMJ Prins Architect & Heritage
Resources Management (2008) Greater Park Station Precinct: Urban Design & Heritage Management Framework. Johannesburg: City of Johannesburg.
Parra, D., Gomez, L., Pratt, M., Sarmiento, O.L., Mosquera, J. & Triche, E. (2007) ‘Policy and Built Environment Changes in Bogotá and their Importance in Health Promotion’, in Indoor Built Environment. 16(4), 344-348.
Pillay, K. (2013) Director in the Department of Development Planning and Urban Management (Personal Communication by interview, May 2013).
Passenger Rail Agency of South Africa (PRASA) (2012) Media Statement: Announcement of the Preferred Bidder for the Design, Manufacture and Supply of the PRASA New Rolling Stock Fleet, 5 December 2012. Available from: http://www.prasa.com/Media/Media%20statement%20on%20Fleet%20renewal%20Programme.pdf (Accessed 5 June 1013).
Property 24 (2012) Property 24 [online]. Available from: http://www.property24.com/articles/r920m-rosebank-mall-redevelopment/16170 (Accessed 2 August 2013).
Replogle, M. & Kodransky, M. (2010) ‘Urban Leaders Find Transportation Paths to Global Green Growth’, in Ebrahim N., Tan, A., Sun, G., Ely, M. & Ai, F.J. (eds) Journeys. Singapore: LTA Academy.
Rodrigue, J.P., Comtois, C. & Slack, B. (2006) The Geography of Transport Systems. London: Routledge.
Saelens, B., Sallis, J. & Frank, L. (2003) ‘Environmental Correlates of Walking and Cycling: Findings from the Transportation, Urban Design, and Planning Literatures’, in Annals of Behavioral Medicine: A Publication of the Society of Behavioral Medicine. 25 (2), 80-91.
Santos, G., Behrendt, H. & Teytelboym, A. (2010) ‘Part II: Policy Instruments for Sustainable Road Transport’, in Research in Transportation Economics. 28(1), 46-91.
Shamase, N. (2012) All Aboard the Gautrain, Comrades [online]. Available from: http://mg.co.za/article/2012-05-17-all-aboard-the-gautrain-comrades/ (Accessed 24 June 2013).
Shapurjee, Y. & Coetzee, M. (2013) ‘Policy Brief 1: The Implications of Backyard Housing for Spatial Planning Policy in Johannesburg’, in Spatial Temporal Evidence for Planning South Africa, Available from: http://stepsa.org/resources/shared-documents/policy-brief-on-backyard-housing-ys.pdf.
Soja, E. (2010) Seeking Spatial Justice. Minneapolis: University of Minnesota Press.
Statistics South Africa (StatsSA) (2014) National Household Travel Survey: February to March 2013, March 2014. Pretoria: StatsSA.
Strydom, L. (2013) Assistant Director of Development Planning and Facilitation at the City of Johannesburg, Personal Communication by interview, May 2013.
Swanepoel, I. (2009) A Proposed System-based Subsidy Approach for Integrated Public Transport Systems in South African Metropolitan Areas [online]. Available from: http://scholar.sun.ac.za/bitstream/handle/10019.1/2266/Swanepoel,%20I.pdf?sequence=1 (Accessed on 30 June 2011).
Transvaal Provincial Administration Roads Department (1980) PWV Transportation Study: Final Report, Volume 1 - Data collection and base-year data.
Turok, I. (2009) ‘Limits to the Mega-City Region: Conflicting Local and Regional Needs’, in Regional Studies. 43 (6), 845-862.
Van der Merwe, E., Negota, G., & Van Zyl, O. (2001 (2001) ‘Gautrain Rapid Rail Link - The Project Concept’, in Meeting the Transport Challenges in Southern Africa. Pretoria: University of Pretoria.
Van der Merwe J. (2013) Gauteng 25-year Integrated Transport Master Plan presentation. 9 September, Johannesburg.
Van Zyl, A. (2012) When is the Gautrain Expanding? [online]. Available from: http://www.bigendontyouthink.com/when-is-the-gautrain-expanding-2/ (Accessed 13 August 2013).
Venter, C.J. & Cross, C. (2011) Location, Mobility, and Access to Work: A Qualitative Exploration in Low-income Settlements, Proceedings of the 30th Southern African Transport conference, Pretoria, 11-14 July.
Venter, I. (2011) Countdown Begins as Gautrain Steams Towards June Deadline [online]. Available from: http://www.engineeringnews.co.za/article/countdown-begins-as-gautrain-steams-towards-june-deadline-2011-05-27 (Accessed 28 June 2013).
Venter, I. (2012) Gautrain Already Mulling Extension Plan [online]. Available from: http://www.engineeringnews.co.za/article/gautrain-2012-05-18 (Accessed 27 June 2013).
Venter, I. (2013a) R5bn-plus to be Spent on Public Transport in 13 Cities [online]. Available from: http://www.polity.org.za/ (Accessed 2 October 2013).
Venter, I. (2013b) Govt Pays R830m in Gautrain Subsidies [online]. Available from: http://www.polity.org.za/article/gautrain-2013-06-18 (Accessed 25 June 2013).
Venter, I. (2013c) Gautrain Route Extensions Under Review as Ridership Ramps Up [online]. Available from: http://www.engineeringnews.co.za/article/gautrain-2013-05-24 (Accessed 13 August 2013).
Venter, I. (2014) Gautrain Ridership Rises as e-tolls Go Live [online]. Available from: http://www.engineeringnews.co.za/article/gautrain-2014-01-17 (Accessed 27 January 2014).
Whyte, W. H. (1980) The Social Life of Small Urban Spaces. New York: Project for Public Spaces.
Wray, C., Musango, J., Damon, K. & Cheruiyot, K. (2013) Modelling Urban Spatial Change: A Review of International and South African Modelling Initiatives. GCRO Occasional Paper 6. Johannesburg: GCRO.
REFERENCES

Mobility in the GautenG city-ReGion
172
FiguresTablesFigure 1.1: ITMP25 proposed public transport network 6
Figure 1.2: ITMP25 proposed railway network 6
Figure 1.3: Major transport infrastructure in the GCR 9
Figure 1.4: Transport flows into and within the three Gauteng metros according to 2011 QoL Survey data 10
Figure 2.1: Trip pupose of most frequent trip 16
Figure 2.2: Main mode used for most frequent trip 17
Figure 2.3: Public transport use by monthly household income 18
Figure 2.4: Trip purpose of most frequent trip, by sex 19
Figure 2.5: Main mode used for most frequent trip, by sex 20
Figure 2.6: Main mode used for work trips, by municipality 21
Figure 2.7: Average travel time (minutes) for the three main trip purposes in metros 22
Figure 2.8: Average travel time (minutes) for the three main trip purposes in district municipalities 22
Figure 2.9: Main mode for trips to school 23
Figure 2.10: Time between leaving home and school bell, for all school trips 24
Figure 2.11: Walking time to nearest public transport, by municipality 25
Figure 2.12: Percentage of households spending more than specified amounts on transport per month 26
Figure 2.13: Satisfaction with transport, by municipality 27
Figure 2.14: Satisfaction with transport, by sex 27
Figure 2.15: Satisfaction with transport, by mode 28
Figure 2.16: Desire lines of most frequent trips, Gauteng 33
Figure 2.17: Most frequent trips (car and road-based public transport) assigned to major road network 33
Figure 2.18: Most frequent trips (car only) assigned to major road network 34
Figure 2.19: Most frequent trips (minibus taxi only) assigned to major road network 34
Figure 2.20: Most frequent trips (bus only) assigned to major road network 35
Figure 2.21: Distribution of urban settlement types across study area 35
Figure 2.22: Employment status of respondents by settlement type 40
Figure 2.23: Time of tenure at present address, per settlement type 42
Table 1.1: Gauteng 25-year integrated transport interventions 3
Table 1.2: IMTP5 key short-term initiatives 4
Table 1.3: Modal split in mode of transport to work, 1975, 1999/2003, 2003, 2009, 2011 and 2013 7
Table 2.1: Trip purposes of all household members, NHTS 2003 17
Table 2.2: Mode combinations (excluding ‘other’) 18
Table 2.3: Biggest problem with public transport reported by users, by municipality 29
Table 2.4: Biggest problem with public transport reported by users, by mode of transport they used for the longest part of their most frequent trip 30
Table 2.5: Reasons for not using public transport, grouped by type of problem and income 30
Table 2.6: Percentage of most frequent trips between origin and destination municipalities 32
Table 2.7: Allocation of households in dataset to eight urban settlement types 39
Table 2.8: Median income of households in sample, per settlement type 40
Table 2.9: Race distribution of sample, by settlement type 41
Table 2.10: Migration status of sample, by settlement type 43
Table 2.11: Satisfaction with life as a whole, by settlement type 44
Table 2.12: Extent of immobility in sample, by urban settlement type 45
Table 2.13: Travel time of frequent trip, by settlement type 47
Table 2.14: Mean travel distance for most frequent trip, by settlement type 48
Table 2.15: Mean travel speed of most frequent trips across all modes, by settlement type 49
Table 2.16: Average door-to-door travel speed (estimated), by main mode used 49
Table 2.17: Mean monthly household expenditure on transport, by settlement type 49
Table 2.18: Satisfaction with transport, by settlement type 50
Table 2.19: Problems with public transport, by settlement type 51
Table 3.1: Within-settlement Indices 67
Table 3.2: Satisfaction with transport 74
Table 3.3: Summary of indices and overall QoT Index 76
Table 3.4: Clustering of townships according to results on QoT Index 79
Table 5.1: Single biggest problem with public transport (Percentage of mode) 143

173
Figure 2.24: Main mode used for most frequent trip, by settlement type 46
Figure 3.1: The 27 priority townships 61
Figure 3.2: Mobility versus access interactions 65
Figure 3.3: Within-settlement Transport Index 68
Figure 3.4: Standardised Taxi and Rail Access Indices 69
Figure 3.5: Area-wide Accessibility Index 71
Figure 3.6: Standardised Mobility Expenditure Index versus Overall Accessibility Index 72
Figure 3.7: Mobility Expenditure Index 73
Figure 3.8: Dissatisfaction with Transport Index 75
Figure 3.9: Overall QoT Index values (higher is better) 77
Figure 3.10: Overall QoT Index 78
Figure 3.11: Overall quality of transport – clusters 80
Figure 4.1: Gautrain route 86
Figure 4.2: View of northern Johannesburg’s highly secured, car-centric landscape (above). Entrances into the Nelson Mandela Square multi-storey parking lot in Sandton, Johannesburg, which pedestrians are forced to cross for lack of better pedestrian infrastructure (below) 88
Figure 4.3: Two scales of analysis around the station, the local pedestrian scale, and the wider neighbourhood scale 89
Figure 4.4: A 1955 photograph of Commissioner Street’s western extent depicting the adjacency of mining activity to the inner city 90
Figure 4.5: The pedestrianisation of Times Square, Jan Gehl Architects 97
Figure 4.6: Rules for commuting on the Gautrain 98
Figure 4.7: Sandton Station and surrounds 101
Figure 4.8: Sandton Station podium phasing (above), Sandton development areas (below) 102
Figure 4.9: Sandton and Rosebank pedestrian Space Syntax analysis 103
Figure 4.10: Sandton Station entrance (L). Escalator from the Sandton Station to the phase 2 podium level above (R) 106
Figure 4.11: Rosebank shopping precinct (L), Gautrain precinct (R) 108
Figure 4.12: Rosebank Station and surrounds 111
Figure 4.13: Rosebank pedestrian environment 112
Figure 4.14: Marlboro Station and surrounds 115
Figure 4.15: Marlboro Station precinct 116
Figure 4.16: Marlboro Station pedestrian environment 118
Figure 4.17: Park Station and surrounds 119
Figure 4.18: Park Station pedestrian environment 120
Figure 4.19: Gautrain extension as proposed by the Gauteng 25-Year Integrated Transport Master Plan (ITMP25) 123
Figure 4.20: Revised vision for the Gautrain Park Station site along Wolmarans Street by Stephen Hoffe 126
Figure 5.1: Complete street design that caters for all road users 135
Figure 5.2: The proposed modal hierarchy for the Gauteng street network 136
Figure 5.3: Main mode used for most frequent trip, by municipality 138
Figure 5.4: Learners’ main modes of transport, by municipality 139
Figure 5.5: Main transport mode by population group (Private = Car/motorbike; Public = Taxi, train and all buses) 140
Figure 5.6: Main transport mode by trip purpose (Private = Car, motorbike; Public = Taxi, train and all buses) 141
Figure 5.7: Main transport mode by employment status (Private = Car, motorbike; Public = Taxi, train and all buses) 142
Figure 5.8: Quality of life and transport mode 144
Figure 5.9: Bicycle racks at a newly constructed Standard Bank Building, Rosebank (photo taken before employees moved into the building) 146
Figure 5.10: The interdependence of components associated with a transition to NMT 149
TABLES AND FIGURES

left to right: row 1: itl; wade moonsamy; itl; itl. row 2: imraan hendriCKs; itl; imraan hendriCKs; itl. row 3: itl; trevor mCgurK; itl; itl. row 4: mordeCai ndlovu; itl; mpho moKgadi; marK momBerg.


GCRO (Gauteng City-Region Observatory)
4th Floor University Corner 11 Jorissen St (Cnr Jorissen and Jan Smuts)
Braamfontein Johannesburg
Gauteng South Africa
Tel +27 11 717 7280 Email [email protected] +27 11 717 7281 Website www.gcro.ac.za