model 1 — predator—prey relationships relationship between ... · • commensalism: one...
TRANSCRIPT

Ecological RelationshipsWhat symbiotic relationships are seen in ecosystems?
Why?
All living organisms need each other in some way to survive. This can include the interactions betweenpredators and their prey, the close associations between and among living things (symbiosis), or the com-petitive relationships between and among species. All of these relationships may be equally advantageousto the parties involved, or they may be more beneficial to one organism over the other.
Model 1 — Predator—Prey Relationships
Relationship between Snowshoe Hares and Lynx180 Number of hares
Number of lynx
160
140
120
100
80
60
40
20
1845 1850 1855 1860 1865 1870 1875 1880 1885 1890 1895 1900 1905 1910 1915 1920 1925 1930 1935
Year
l. Refer to the graph in Model l.
a. What does the y axis on che left represent?
Number ofhares.
b. What does che y axis on the right represent?
Number oflynx.
c. For both y axes, what value do che numbers on the axes need to be multiplied by?
103 or 1000.
2. What was che approximate population of snowshoe hares in 1865?
155,000.
Ecological Relationships179
3. What was the approximate population of lynx in 1865?
5000.
4. When the number of snowshoe hares is high, what happens to the number of lynx? Use actual
data from the graph to support your observation.
The number of lynx is usually also high (any data points acceptable).
5. What happens to the population of lynx as the number of snowshoe hares decreases? Use actual
data from the graph to support your observation.
The population oflynx declines also (any data points acceptable).
6. Propose an explanation for the apparent cause and effect relationship between the populations of
lynx and hares.
Because a lot offood is available (snowshoe hare) more lynx are likely to survive and their population
can Increase.
7. What does this information tell you
a. about the effect of size of prey populations on the number of predators?
If a large food supply (prey) is available, then the predator population can increase.
b. about the effect of predators on the populations of their prey?
When the predator population becomes too large, they consume the food (prey) and so the overall
prey population is reduced.
8. What other factor would influence the size of the hare population in addition to the size of thepopulation of lynx?
The amount offood available to the hares.
STOP
180 POGIV' Activities for High School
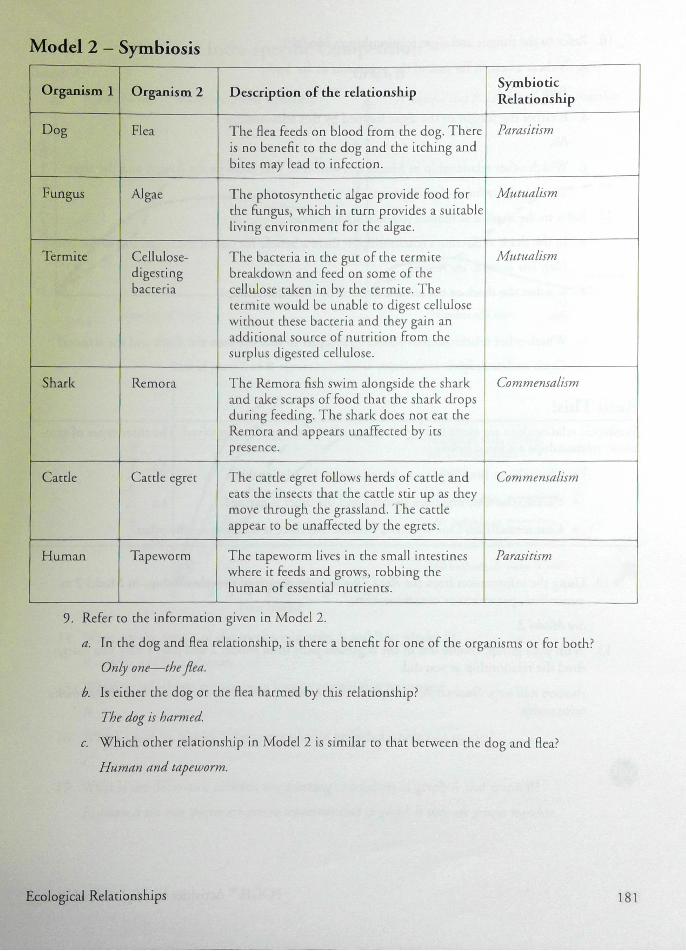
Model 2 — Symbiosis
Organism 1 Organism 2
Dog
Fungus
Termite
Shark
Caccle
Human
Flea
Algae
Cellulose-digesting
bacteria
Remora
Cattle egret
Tapeworm
Description of the relationship
The flea feeds on blood from the dog. There
is no benefit to the dog and che itching and
bites may lead to infection.
The photosynthetic algae provide food for the fungus, which in turn provides a suitable
living environment for the algae.
The bacteria in the gut of the termitebreakdown and feed on some of the
cellulose taken in by the termite. Thetermite would be unable to digest cellulosewithout these bacteria and they gain an
additional source of nutrition from thesurplus digested cellulose.
The Remora fish swim alongside the shark
and cake scraps of food that the shark drops
during feeding. The shark does not eat cheRemora and appears unaffected by itspresence.
The cattle egret follows herds of cattle and
eats the insects that the cattle stir up as they
move through the grassland. The cattleappear to be unaffected by the egrets.
The tapeworm lives in che small intestines
where it feeds and grows, robbing thehuman of essential nutrients.
9. Refer co the information given in Model 2.
Symbio ticRelationship
Parasitism
Mutualism
Mutualism
Commensalism
Commensalism
Pa rasitism
a. In the dog and flea relationship, is there a benefit for one of the organisms or for both?
Only one—theflea.
b. Is either the dog or the flea harmed by chis relationship?
The dog is harmed.
c. Which other relationship in Model 2 is similar to chat between the dog and flea?
Human and tapeworm.
Ecological Relationships 181
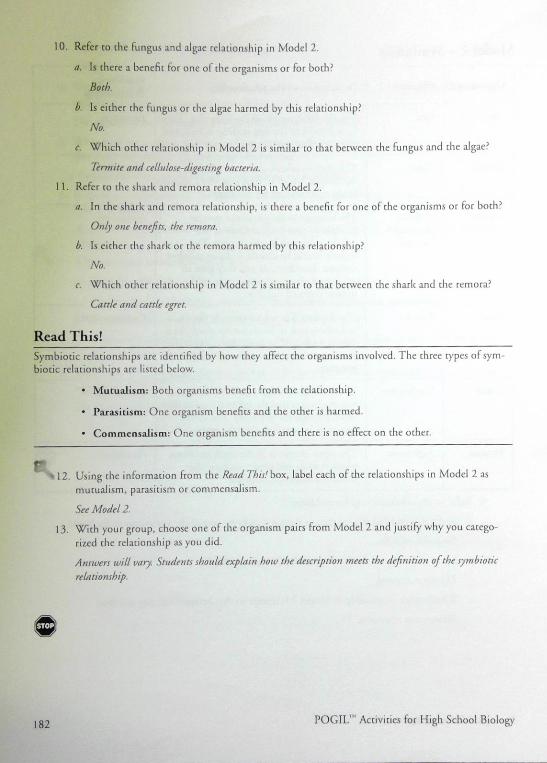
10. Refer to the fungus and algae relationship in Model 2.
a. Is there a benefit for one of the organisms or for both?
Both.
b. Is either the fungus or the algae harmed by this relationship?
No.
c. Which ocher relationship in Model 2 is similar co that between the fungus and the algae?
Termite and cellulose-digesting bacteria.
I l. Refer co the shark and remora relationship in Model 2.
a. In che shark and remora relationship, is there a benefit for one of the organisms or for both?
Only one benefits, the remora.
b. Is either the shark or the remora harmed by chis relationship?
c. Which other relationship in Model 2 is similar co that between the shark and che remora?
Cattle and cattle egret.
Read This!
Symbiotic relationships are identified by how they affect the organisms involved. The three types of sym-
biotic relationships are listed below.
Mutualism: Both organisms benefit from the relationship.
• Parasitism: One organism benefits and the ocher is harmed.
• Commensalism: One organism benefits and there is no effect on che other.
12. Using the information from che Read This! box, label each of the relationships in Model 2 as
mutualism, parasitism or commensalism.
See Model 2.
13. With your group, choose one of the organism pairs from Model 2 and justify why you catego-
rized the relationship as you did.
Answers will vary. Students sh01dd explain how the description meets the definition of the symbiotic
relationship.
STOP
182 Activities for High School BiologyPOGIIP'
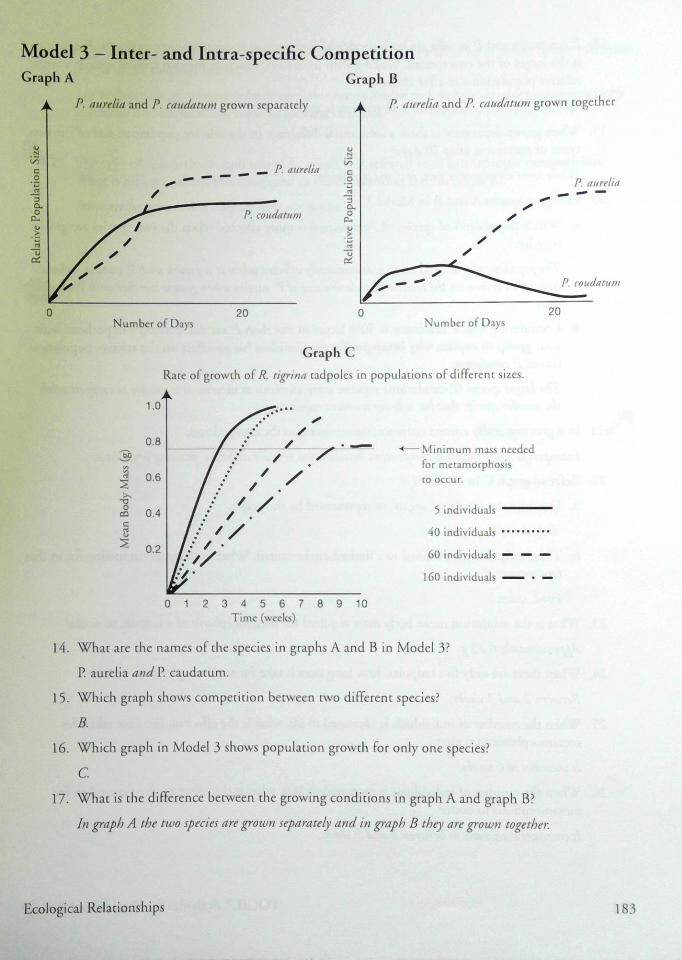
Model 3 — Inter- and Intra-specific CompetitionGraph A Graph B
P. aurelia and P. caudatum grown separately P. aurelia and P. caudatum grown together
P. aurelia c:o O P. aurelia
3
P. coudatum O
P. coudatum
20 20Number of Days Number of Days
Graph C
Rate of growth of R. tigrina tadpoles in populations of different sizes.
1.0
0.8A—Minimum mass needed
for metamorphosis0.6 to occur.
0.4 5 individuals
40 individuals
0.2 60 individuals — — —
160 individuals
01 2345678 9 10Time (weeks)
14. What are the names of che species in graphs A and B in Model 3?
P. aurelia and P. caudatum.
15. Which graph shows competition between two different species?
16. Which graph in Model 3 shows population growth for only one species?
17. What is the difference between the growing conditions in graph A and graph B?
In graph A the two species are grown separately and in graph B they are grown together.
Ecological Relationships 183
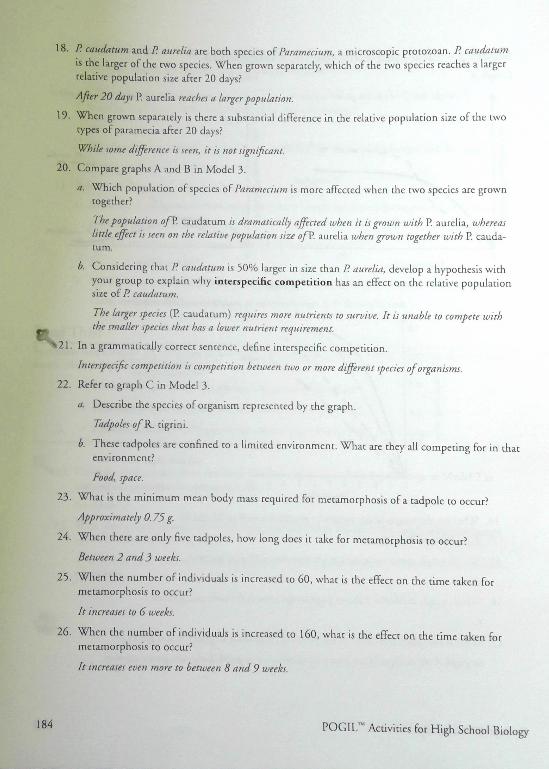
18. I? caudatum and I? aurelia are both species of Paramecium, a microscopic protozoan. P. caudatumis the larger of the two species. When grown separately, which of the two species reaches a largerrelative population size after 20 days?
After 20 days P. aurelia reaches a larger population.
19. When grown separately is there a substantial difference in the relative population size of the twotypes of paramecia after 20 days?
While some difference is seen, it is not significant.
20. Compare graphs A and B in Model 3.
a. Which population of species of Paramecium is more affected when the two species are growntogether?
The population on. caudacum is dramatically affected when it is grown with P. aurelia, zvhereaslittle effect is seen on the relative population size on. aurelia when grown together with P. cauda-cum.
b. Considering that I? caudatum is 50% larger in size than P. aurelia, develop a hypothesis withyour group to explain why interspecific competition has an effect on the relative populationsize of I? caudatum.
The larger species (P. caudacum) requires more nutrients to survive. It is unable to compete withthe smaller species that has a lower nutrient requirement.
21. In a grammatically correct sentence, define interspecific competition.
Interspecific competition is competition between two or more different species of organisms.
22. Refer to graph C in Model 3.
a. Describe the species of organism represented by the graph.
Tadpoles of R. tigrini.
b. These tadpoles are confined to a limited environment. What are they all competing for in thatenvironment?
Food, space.
23. What is che minimum mean body mass required for metamorphosis of a tadpole to occur?
Approximately 0.75 g.
24. When there are only five tadpoles, how long does it take for metamorphosis to occur?
Between 2 and 3 weeks.
25. When the number of individuals is increased to 60, what is the effect on the time taken formetamorphosis to occur?
It increases to 6 weeks.
26. When the number of individuals is increased to 160, what is the effect on the time taken formetamorphosis to occur?
It increases even more to between 8 and 9 weeks
184 POGILTM Activities for High School Biology

27. Propose an explanation for why the population size affects the number of weeks before metamor-phosis of che tadpoles occurs.
The tadpoles are all competingfor limited amounts offood so they will not be able to grow as quicklyand reach the minimum size requiredfor metamorphosis.
28. The type of competition represented by graph C is referred to as intraspecific competition.NV11at is different about chis compared to the competition seen in graph B?
Intraspecifc competition only involves one species.
STOP
Ecological Relationships 185
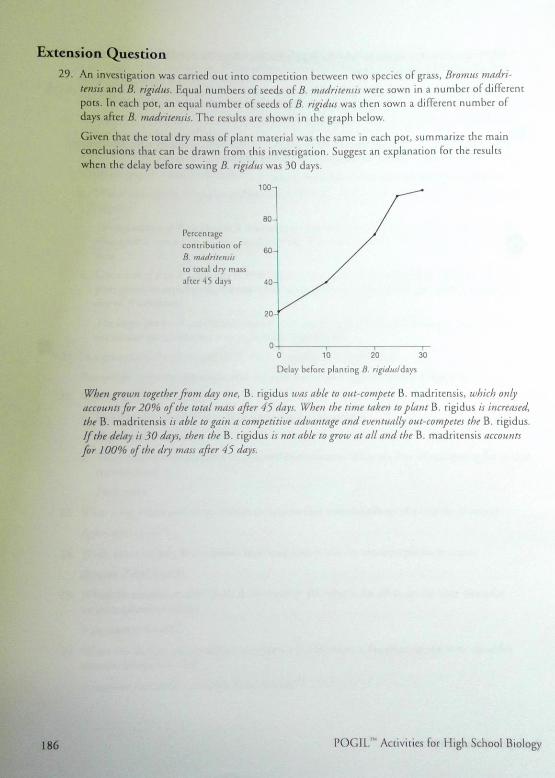
Extension Question29. An investigation was carried out into competition between two species of grass, Bromus madri-
tensis and B. rigidus. Equal numbers of seeds of B. madritensis were sown in a number of different
pots. In each pot, an equal number of seeds of B. rigidus was then sown a different number of
days after B, madritensis. The results are shown in the graph below.
Given that the total dry mass of plant material was the same in each pot, summarize the main
conclusions that can be drawn from this investigation. Suggest an explanation for the results
when the delay before sowing B. rigidus was 30 days.
Percentage
contribution ofB. madritensis
to total dry mass
after 45 days
100
80
60
20
10 20 30
Delay before planting B. rtgidus/days
When grown togetherfom day one, B. rigidus was able to out-compete B. madritensis, which only
accounts for 20 0/0 of the total mass after 45 days. When the time taken to plant B. rigidus is increased,
the B. madritensis is able to gain a competitive advantage and eventually out-competes the B. rigidus.
If the delay is 30 days, then the B. rigidus is not able to grow at all and the B. madritensis accounts
for 100 0/0 ofthe dry mass after 45 days.
186 P OGIL TN Activities for High School Biology