modeling and resonance issues of wind...
TRANSCRIPT

MODELING AND RESONANCE ISSUES OF WIND FARM INTEGRATION WITH RELATED FACTS APPLICATIONS
(Spine title: Modeling and Resonance of Wind Farm Integration with FACTS)
(Thesis format: Integrated-Article)
by
Soubhik Auddv
Graduate Program in
Engineering Science
Department of Electrical and Computer Engineering
A thesis submitted in partial fulfillment of the requirements for the degree of
Doctor of Philosophy
Faculty of Graduate Studies The University of Western Ontario
London, Ontario, Canada
© Soubhik Auddy 2007

1*1 Library and Archives Canada
Published Heritage Branch
395 Wellington Street Ottawa ON K1A0N4 Canada
Bibliotheque et Archives Canada
Direction du Patrimoine de I'edition
395, rue Wellington Ottawa ON K1A0N4 Canada
Your file Votre reference ISBN: 978-0-494-39236-2 Our file Notre reference ISBN: 978-0-494-39236-2
NOTICE: The author has granted a nonexclusive license allowing Library and Archives Canada to reproduce, publish, archive, preserve, conserve, communicate to the public by telecommunication or on the Internet, loan, distribute and sell theses worldwide, for commercial or noncommercial purposes, in microform, paper, electronic and/or any other formats.
AVIS: L'auteur a accorde une licence non exclusive permettant a la Bibliotheque et Archives Canada de reproduire, publier, archiver, sauvegarder, conserver, transmettre au public par telecommunication ou par Plntemet, prefer, distribuer et vendre des theses partout dans le monde, a des fins commerciales ou autres, sur support microforme, papier, electronique et/ou autres formats.
The author retains copyright ownership and moral rights in this thesis. Neither the thesis nor substantial extracts from it may be printed or otherwise reproduced without the author's permission.
L'auteur conserve la propriete du droit d'auteur et des droits moraux qui protege cette these. Ni la these ni des extraits substantiels de celle-ci ne doivent etre imprimes ou autrement reproduits sans son autorisation.
In compliance with the Canadian Privacy Act some supporting forms may have been removed from this thesis.
Conformement a la loi canadienne sur la protection de la vie privee, quelques formulaires secondaires ont ete enleves de cette these.
While these forms may be included in the document page count, their removal does not represent any loss of content from the thesis.
Canada
Bien que ces formulaires aient inclus dans la pagination, il n'y aura aucun contenu manquant.

THE UNIVERSITY OF WESTERN ONTARIO FACULTY OF GRADUATE STUDIES
CERTIFICATE OF EXAMINATION
Supervisor
Dr. Rajiv K. Varma
Supervisory Committee
Examiners
Dr. Tarlochan S. Sidhu
Dr. Amirnaser Yazdani
Dr. Gregory Kopp
Dr. Vijay Sood
The thesis by
Soubhik Auddy
entitled:
Modeling and Resonance Issues of Wind Farm Integration with Related FACTS Applications
is accepted in partial fulfillment of the requirements for the degree of
Doctor of Philosophy
Date Chair of the Thesis Examination Board
11
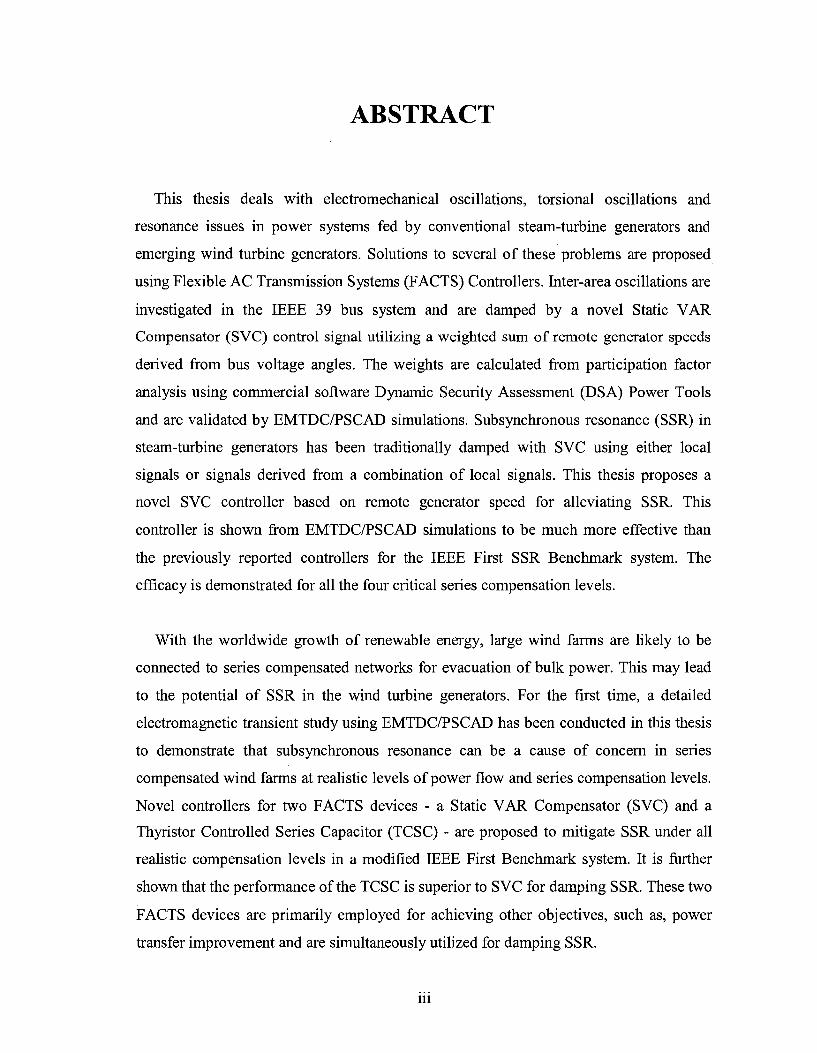
ABSTRACT
This thesis deals with electromechanical oscillations, torsional oscillations and
resonance issues in power systems fed by conventional steam-turbine generators and
emerging wind turbine generators. Solutions to several of these problems are proposed
using Flexible AC Transmission Systems (FACTS) Controllers. Inter-area oscillations are
investigated in the IEEE 39 bus system and are damped by a novel Static VAR
Compensator (SVC) control signal utilizing a weighted sum of remote generator speeds
derived from bus voltage angles. The weights are calculated from participation factor
analysis using commercial software Dynamic Security Assessment (DSA) Power Tools
and are validated by EMTDC/PSCAD simulations. Subsynchronous resonance (SSR) in
steam-turbine generators has been traditionally damped with SVC using either local
signals or signals derived from a combination of local signals. This thesis proposes a
novel SVC controller based on remote generator speed for alleviating SSR. This
controller is shown from EMTDC/PSCAD simulations to be much more effective than
the previously reported controllers for the IEEE First SSR Benchmark system. The
efficacy is demonstrated for all the four critical series compensation levels.
With the worldwide growth of renewable energy, large wind farms are likely to be
connected to series compensated networks for evacuation of bulk power. This may lead
to the potential of SSR in the wind turbine generators. For the first time, a detailed
electromagnetic transient study using EMTDC/PSCAD has been conducted in this thesis
to demonstrate that subsynchronous resonance can be a cause of concern in series
compensated wind farms at realistic levels of power flow and series compensation levels.
Novel controllers for two FACTS devices - a Static VAR Compensator (SVC) and a
Thyristor Controlled Series Capacitor (TCSC) - are proposed to mitigate SSR under all
realistic compensation levels in a modified IEEE First Benchmark system. It is further
shown that the performance of the TCSC is superior to SVC for damping SSR. These two
FACTS devices are primarily employed for achieving other objectives, such as, power
transfer improvement and are simultaneously utilized for damping SSR.
m

This thesis also examines for the first time the potential for overvoltages due to
ferroresonance and self-excitation while connecting large wind farms to EHV lines. A
detailed analysis of the factors influencing self-excitation and ferroresonance has been
performed. The impacts of different generator models on the overvoltage issues are
examined. Different measures of alleviating these overvoltages are proposed which
include line differential protection and wind turbine generator excitation system control.
This study has been conducted using EMTDC/PSCAD for an upcoming large wind farm
in Ontario.
In an effort to validate a doubly fed induction generator (DFIG) model an additional
study has been done to validate the DFIG model available in PSS/E from an extensive
field validation study of Hydro One Network Inc.
Keywords: Keywords: Power system stability, Transient stability, Inter-area
oscillations, Remote Signals, Wide Area Measurement (WAM), Subsynchronous
Resonance (SSR), Flexible AC Transmission Systems (FACTS), Static VAR
Compensator (SVC), Thyristor Controlled Series Capacitor (TCSC), Wind Farm, Wind
Energy Conversion Systems (WECS), Wind Power Systems (WPS), Wind Turbine
Generator (WTG), Self-excited induction generator (SEIG), Doubly Fed Induction
Generator (DFIG), Ferroresonance, Self-excitation.
IV

CO-AUTHORSHIP
Journal articles written from this thesis work are listed below. The individual
contributions of all members are listed below.
CHAPTER 2
Article Title: Damping of Inter-Area Oscillation in Power Systems by Static Var
Compensator (SVC) Using PMU Acquired Remote Bus Voltage Angles
Status: Published in International Journal of Emerging Electric Power Systems, Vol.
8, Issue 4, Article 6, 2007
This work is extensively supervised by Dr. R. K. Varma. All simulations pertaining to
this paper in EMTDC/PSCAD and DSA Power Tools are conducted jointly by
Soubhik Auddy and Dr. R. P. Gupta. The manuscript is written and all the plots and
figures are primarily drawn by Soubhik Auddy and corrected by Dr. R. K. Varma.
Reviewers' comments are addressed by Soubhik Auddy and various formatting
requirements needed to make the paper ready to print in the journal are also taken care
of by Soubhik Auddy.
CHAPTER 3
Article Title: Mitigation of Subsynchronous Resonance by SVC using PMU-Acquired
Remote Generator Speed
Status: A part of this work is published in Proc. of IEEE Power India Conference,
New Delhi, India, April, 10-12, 2006. The entire contribution is to be submitted in
IEEE Transactions in Power Delivery with a few more additional results.
v
This work is rigorously supervised by Dr. R. K. Varma. All the simulations in
EMTDC/PSCAD and MATLAB are performed by Soubhik Auddy. The manuscript is
written by Soubhik Auddy and corrected by Dr. R. K. Varma.
CHAPTER 4
Article Title: Mitigation of Subsynchronous Resonance in a Series Compensated
Wind Farm using FACTS Controllers
Status: Accepted for publication in IEEE Transactions in Power Delivery, 2007
This work is thoroughly supervised by Dr. R. K. Varma. All the simulations in
EMTDC/PSCAD and MATLAB are performed by Soubhik Auddy. The manuscript is
written by Soubhik Auddy and corrected by Dr. R. K. Varma. Reviewers' comments
are jointly addressed by Soubhik Auddy and Dr. R. K. Varma.
CHAPTER 5
Article Title: Overvoltages at the Point of Interconnection of a Large Wind Farm and
Extra High Voltage Double Circuit Transmission Lines
Status: The central issue of this work and a few key results are published in Proc. of
CIGRE Canada Conference, Calgary, Alberta, August 26th-28th, 2007. Several major
results with extensive simulations are to be submitted in IEEE Transactions in Power
Systems.
This work is chiefly supervised by Dr. R. K. Varma and supported Dr. Michael Dang
of Hydro One Network Inc. All the simulations in EMTDC/PSCAD and MATLAB
are performed by Soubhik Auddy. The manuscript is written by Soubhik Auddy and
corrected by Dr. R. K. Varma.
VI
APPENDIX A
Article Title: Field Validation of a Doubly Fed Induction Generator (DFIG) Model
and System Performance Improvement
Status: Initial results are published in Proc. of IEEE Electric Power Conference,
Montreal, Quebec, 25th - 26th October, 2007. The full contribution is to be submitted
in IEEE Transactions in Power Delivery.
This work is supervised by Dr. R. K. Varma and supported by Dr. Michael Dang of
Hydro One Network Inc. All the simulations in EMTDC/PSCAD and MATLAB are
performed by Soubhik Auddy. The manuscript is written by Soubhik Auddy and
corrected by Dr. R. K. Varma and Dr. Michael Dang.
vii

Dedicated to my
Parents
vm

ACKNOWLEDGEMENTS
I would like to sincerely thank my supervisor Dr. Rajiv K Varma for his able
supervision, invaluable guidance and immense support which has finally seen me
through. I consider myself extremely fortunate for having got the opportunity to learn
and work with him. His advice in all respects is of tremendous value. No words are
adequate to express my gratefulness to him. I can only convey my humble and warm
regards to him.
I am also very grateful to Dr. Michael Dang of Hydro One Network Inc. to provide
me a rare opportunity to work with industrial problems. I am really thankful to him
for having so much trust on me and also for furnishing me with all kinds of
confidential technical resources which would have been otherwise impossible to
access. His continuous care for me during my stay at Hydro One is simply
indescribable. I convey my profound respect to him as well.
I am extremely fortunate to learn from Dr. T. S. Sidhu, Dr. G. Moschopoulos, Dr.
M. Moallem and Dr. K. Mclsaac during various courses offered by them and also
during the course of teaching assistantship.
I sincerely acknowledge the technical support offered by Dr. R. P. Gupta of CGL,
India during his stay as a post doctoral fellow in our department at Western. The
stimulating discussions with him provided me a great opportunity to learn different
aspects of power system. His thoughts helped me to get a different insight of the
subject. I wish him a very happy prosperous and healthy life.
I am grateful to all of my lab mates for their continuous encouragement and moral
support during this research. Special thanks should go to Fadhel Albasri, German
Rosas Ortiz, Jayender Jagadeeshan, Pradeep Kumar Gangadharan, Balamorougan
Vinayagam, Tamije Selvy Munian, Dhaval Patel, Nilanjan Ray Chaudhuri and Amir
Ostadi.
IX

Survival is a necessary condition for any success. I survived in Canada due to the
limitless support of my friend and roommate Avisekh and Soumita. Words are really
not enough to express my sincerest gratitude for their unbounded help, care and
warmth during the four years of my stay at London. I shared each and every moment
of my life during the past years with them. I wish them every success to
every endeavor they would ever make in their life.
At last but not the least, I humbly express profound indebtedness to my parents for
the perennial blessings, selfless love and endless support for their only son.
Soubhik Auddy
x

TABLE OF CONTENTS
CERTIFICATE OF EXAMINATION ii
ABSTRACT iii
CO-AUTHORSHIP v
DEDICATION viii
ACKNOWLEDGEMENTS ix
TABLE OF CONTENTS xi
LIST OF TABLES xvii
LIST OF FIGURES xviii
LIST OF ABBREVIATIONS xxvii
CHAPTER 1: INTRODUCTION 1
1.1 Inter-area Oscillations 1
1.2 Subsynchronous Resonance (SSR) 4
1.2.1 Steady State SSR 5
1.2.1.1 Induction Generator Action 5
1.2.1.2 Torsional Interaction 6
1.2.2 Transient SSR 6
1.2.3 Mitigation of SSR 7
1.3 Ferroresonance and Self-excitation 8
1.4 Integration of Wind Power Systems 10
1.4.1 Global Status of Wind Energy 10
1.4.2 Wind Energy in Canada 12
1.4.3 Wind Turbine Generator (WTG) Configurations 13
1.4.3.1 Squirrel cage or Self-excited Induction Generator
(SEIG/SCIG) 14
1.4.3.2 Doubly Fed Induction Generator (DFIG) 15
1.4.3.3 Direct Drive Synchronous Generator 17
1.4.4 Grid Integration Issues of Wind Farms 18
xi
1.4.4.1 Modeling of Wind Turbine Generators 18
1.4.4.2 Reactive Power Requirement of Wind Farm 19
1.4.4.3 Series Compensated Wind Farm 20
1.4.4.4 Overvoltages Encountered by Wind Farms 20
1.5 Flexible AC Transmission System (FACTS) 21
1.5.1 Basic Elements of SVC 23
1.5.2 Basic Elements of TCSC 26
1.5.3 Applications of FACTS Devices 28
1.5.3.1 Damping of Inter-area Oscillations 28
1.5.3.2 Damping of Subsynchronous Resonance 30
1.6 Motivation of the Thesis 31
1.7 Objective and Scope of the Thesis 33
1.8 Outline of the Thesis 34
1.9 References 36
CHAPTER 2: DAMPING OF INTER-ARE A OSCILLATION IN POWER
SYSTEMS BY STATIC VAR COMPENSATOR (SVC) USING PMU
ACQUIRED REMOTE BUS VOLTAGE ANGLES 45
2.1 Introduction 45
2.2 Relationship between Generator Load Angle and Bus Voltage Angle 48
2.3 System Modeling for Eigenvalue Analysis 50
2.3.1. Eigenvalues of the State Matrix and Participation Factors 50
2.4 SVC Auxiliary Controller Design 52
2.5 System Studies 52
2.5.1. System Description 52
2.5.2. Operating Conditions 53
2.5.3. Validation of the Relationship between Rotor Angle and Generator
Bus Angle 54
2.5.4. Case Studies 55
2.5.5. Eigenvalue Analysis 56
2.5.6 Time Domain Simulations 64
xn
2.5.7 Performance of Varying Loading Conditions 68
2.5.8 Effect of Transmission Delay and Delay Compensation 68
2.6 Robustness of the Delay Compensator 71
2.7 Discussions 74
2.8 Conclusions 74
2.9 References 75
CHAPTER 3: MITIGATION OF SUBSYNCHRONOUS RESONANCE BY
SVC USING PMU-ACQUIRED REMOTE GENERATOR SPEED 78
3.1 Introduction 78
3.2 System Configuration and Modeling 80
3.2.1 Configuration 80
3.2.2 Modeling 80
3.3 Controller Design of SVC 81
3.4 Performance of the System with SVC-SSDC using Remote Generator
Speed 83
3.4.1 Critical Series Compensation Xc = 0.47 p.u 83
3.4.2 Critical Series Compensation Xc = 0.38 p.u 87
3.4.3 Critical Series Compensation Xc = 0.285 p.u 91
3.4.4 Critical Series Compensation Xc = 0.185 p.u 94
3.5 Effect of Signal Transmission Delay 97
3.6 Conclusions 98
3.7 References 98
CHAPTER 4: MITIGATION OF SUBSYNCHRONOUS RESONANCE IN
A SERIES COMPENSATED WIND FARMS USING FACTS
CONTROLLERS 101
4.1 Introduction 101
4.2 Subsynchronous Resonance 102
4.2.1 Induction Generator Effect 103
4.2.2 Torsional Interactions 104
xiii

4.2.3 Transient SSR 104
4.3 System Configuration 105
4.3.1 Choice of System Parameters 105
4.3.2 Actual Study System 105
4.4 SSR in Series Compensated Wind Farm 107
4.4.1 Induction Generator (IG) Self-Excitation Effect 107
4.4.1.1 Variation in Wind Generator Power Output 107
4.4.1.2 Variation in Levels of Series Compensation 109
4.4.2 Torsional Interactions (TI) 111
4.4.2.1 Variation in Wind Generator Power Output I l l
4.4.2.2 Variation in Levels of Series Compensation 114
4.5 Controller Design of SVC and TCSC 115
4.5.1 Controller Design of SVC 115
4.5.2. Controller Design of TCSC 117
4.6 Performance of SVC in the Mitigation of SSR 119
4.6.1 Damping of IG Effect 119
4.6.2 Damping of TI Effect 121
4.7 Performance of TCSC in Mitigation of SSR and Comparison with SVC .... 122
4.7.1 Damping of IG Effect 123
4.7.2 Damping of TI Effect 124
4.8 Conclusions 126
4.9 References 127
CHAPTER 5: OVERVOLTAGES AT THE POINT OF
INTERCONNECTION OF A LARGE WIND FARM AND EXTRA HIGH
VOLTAGE DOUBLE CIRCUIT TRANSMISSION LINES 129
5.1 Introduction 129
5.2 Study System 131
5.3 System Modeling 132
5.4 Ferroresonance 132
5.5 Effect of Wind Farm Interconnections 137
xiv
5.5.1 Wind Farm Modeled as an Ideal Source 137
5.5.2 Wind Farm Modeled as SEIG 140
5.5.3 Wind Farm Modeled as DFIG 144
5.5.4 Limitations of the DFIG Model 148
5.6. Remedial Measures of the Overvoltages 148
5.6.1 Self-excitation in SEIG 151
5.6.2 Self-excitation in DFIG 153
5.6.3 Mitigation of Self-excitation 155
5.7 Conclusions 157
5.8 References 158
CHAPTER 6: CONCLUSIONS AND FUTURE WORK 160
6.1. Major Contributions 160
6.2. Chapter-wise Summary 161
6.2.1 Damping of Inter-area Oscillations 161
6.2.2 Performance of Remote Generator Speed in the Damping of SSR .. 162
6.2.3 SSR in Series Compensated Wind Farms 162
6.2.4 Overvoltages at the Terminal of a Large Wind Farm Connected to
a Double Circuit Transmission Line 163
6.2.5 Modeling and Validation of GE 1.5 MW Doubly Fed Wind
Turbine Generators 164
6.3. Future Directions of Research 164
APPENDIX A: FIELD VALIDATION OF A DOUBLY FED INDUCTION
GENERATOR (DFIG) MODEL AND SYSTEM PERFORMANCE
IMPROVEMENT 167
A.l Introduction 167
A.2 Study System 170
A.3 DFIG Model 173
A.4 Modeling of the Test System in PSS/E 174
A.5 Validation Results 176
xv
A. 5.1 Test 1: 8 MVAr Capacitor Switch Off at Port Burwell WGS 176
A.5.2 Test2: 8 MVAr Capacitor Switch On at Port Burwell WGS 177
A.5.3 Improvement of System Performance by Controller Parameter
Tuning 179
A.5.3.1 Variation in KQi 179
A.5.3.2 Variation in Kvi 181
A.6 Comparison of the Test Results and Simulated Responses 183
A.6.1 Test 1: 8 MVAr Capacitor Switch Off at Port Burwell WGS 183
A.6.2 Test 2: 8 MVAr Capacitor Switch On at Port Burwell WGS 186
A.7 Recommendations for Wind Farm Testing 187
A.8 Conclusions 188
A.9 References 189
APPENDIX B: DATA OF IEEE FIRST BENCHMARK SYSTEM FOR SSR
STUDIES 190
APPENDIX C: DATA FOR THE WIND FARM 191
VITA 192
xvi

LIST OF TABLES
Table 2.1 Complete eigenvalues of the study system without SVC 57
Table 2.2 Complete eigenvalue of the study system with SVC auxiliary
control with optimal weights 59
Table 2.3 Damping ratios and frequencies of Critical Inter-area mode
for 150% loading in 39-Bus System 61
xvii

LIST OF FIGURES
Figure 1.1 A two area system 3
Figure 1.2 A two area system with a fault in the tie line 3
Figure 1.3 Turbine generator feeding infinite bus through series compensated
transmission line 4
Figure 1.4 Typical ferroresonance circuit with its characteristic frequency 8
Figure 1.5 Total installed capacity of wind power all over the world (Source:
GWEC press release in February, 2007) [25] 11
Figure 1.6 Total installed capacity of wind power in Canada
(Source: CANWEA) [25] 12
Figure 1.7 Grid coupled squirrel cage induction generator 14
Figure 1.8 Doubly fed (wound rotor) induction generator with back-to-back
voltage source converter feeding the rotor winding 16
Figure 1.9 Direct drive synchronous generator grid coupled through a back-
to-back voltage source converter or a diode rectifier and voltage
source converter 17
Figure 1.10 Basic elements of SVC and its control system 23
Figure 1.11 (a) V-I characteristics of an SVC; (b) Q-V characteristics of an
SVC 25
Figure 1.12 Control structure of the SVC 25
Figure 1.13 Basic elements of a TCSC and its control system 26
xviii
Figure 1.14 (a) TCSC V-I characteristics; (b) TCSC reactance characteristics.... 27
Figure 1.15 Current control scheme for a TCSC 28
Figure 1.16 Wide Area Measurement (WAM) structure 29
Figure 2.1 Single Machine Infinite Bus (SMIB) system 48
Figure 2.2 Phasor diagram 49
Figure 2.3 Structure of SVC auxiliary control 52
Figure 2.4 The New England system with SVC at bus 16 53
Figure 2.5 Comparison of actual speed signal ©15 and the derivative of
generator bus voltage angle d6]5/dt without SVC auxiliary control
for disturbance 1 54
Figure 2.6 Comparison of actual speed signal ©15 and the derivative of
generator bus voltage angle dGis/dt with SVC auxiliary control
for (a) disturbance 1; (b) disturbance 2; (c) disturbance 3 55
Figure 2.7 SVC bus power at 150 % loading after disturbance-1 at 10 sec 62
Figure 2.8 Oscillation in speeds of different generators 62
Figure 2.9 Variation of modal damping with signal weights 63
Figure 2.10 System performance for disturbance 1 65
Figure 2.11 System performance for disturbance 2 66
Figure 2.12 System performance for disturbance 3 67
Figure 2.13 Performance considering transmission delay and with delay
compensator for disturbance 1 at 150% loading 70
xix
Figure 2.14 Performance considering transmission delay and with delay
compensator for disturbance 2 at 150% loading 70
Figure 2.15 Performance considering transmission delay and with delay
compensator for disturbance 3 at 150% loading 71
Figure 2.16 (a) SVC bus power, (b) angular difference between G9 and Gl
and (c) reactive support of SVC for 0.8s signal transmission delay.. 72
Figure 2.17 (a) SVC bus power, (b) angular difference between G9 and Gl
and (c) reactive support of SVC for 40 millisecond signal
transmission delay 73
Figure 3.1 IEEE 1st Benchmark model for SSR studies 81
Figure 3.2 Generalized SVC auxiliary control 81
Figure 3.3 Structure of SVC Subsynchronous Damping Controller (SSDC) .... 82
Figure 3.4 FFT of generator rotor speed for Xc = 0.47 p.u 84
Figure 3.5 Generator rotor speed without SVC for Xc = 0.47 p.u 84
Figure 3.6 Generator rotor speed with SVC-SSDC for Xc = 0.47 p.u 85
Figure 3.7 LPA-LPB torque without SVC for Xc = 0.47 p.u 85
Figure 3.8 LP A-LPB torque with SVC-SSDC for Xc = 0.47 p.u 85
Figure 3.9 Gen-Exc torque without SVC for Xc = 0.47 p.u 86
Figure 3.10 Gen-Exc torque with SVC-SSDC for Xc = 0.47 p.u 86
Figure 3.11 Machine terminal voltage without SVC for Xc = 0.47 p.u 86
Figure 3.12 Machine terminal voltage with SVC-SSDC for Xc = 0.47 p.u 87
Figure 3.13 SVC reactive power for Xc = 0.47 p.u 87
xx

Figure 3.14 Generator rotor speed without SVC for Xc = 0.38 p.u 88
Figure 3.15 Generator rotor speed with SVC-SSDC for Xc = 0.38 p.u 88
Figure 3.16 LPA-LPB torque without SVC for Xc = 0.38 p.u 88
Figure 3.17 LP A-LPB torque with SVC-SSDC for Xc = 0.38 p.u 89
Figure 3.18 Gen-Exc torque without SVC for Xc = 0.38 p.u 89
Figure 3.19 Gen-Exc torque with SVC-SSDC for Xc = 0.38 p.u 89
Figure 3.20 Machine terminal voltage without SVC for Xc = 0.38 p.u 90
Figure 3.21 Machine terminal voltage with SVC-SSDC for Xc = 0.38 p.u 90
Figure 3.22 SVC reactive power for Xc = 0.38 p.u 90
Figure 3.23 Generator rotor speed without SVC for Xc = 0.285 p.u 91
Figure 3.24 Generator rotor speed with SVC-SSDC for Xc - 0.285 p.u 91
Figure 3.25 LP A-LPB torque without SVC for Xc = 0.285 p.u 92
Figure 3.26 LP A-LPB torque with SVC-SSDC for Xc = 0.285 p.u 92
Figure 3.27 Gen-Exc torque without SVC for Xc = 0.285 p.u 92
Figure 3.28 Gen-Exc torque with SVC-SSDC for Xc = 0.285 p.u 93
Figure 3.29 Machine terminal voltage without SVC for Xc = 0.285 p.u 93
Figure 3.30 Machine terminal voltage with SVC-SSDC for Xc = 0.285 p.u 93
Figure 3.31 SVC reactive power for Xc = 0.285 p.u 94
Figure 3.32 Generator rotor speed without SVC for Xc = 0.185 p.u 94
Figure 3.33 Generator rotor speed with SVC-SSDC for Xc = 0.185 p.u 95
xxi
Figure 3.34 LPA-LPB torque without SVC for Xc = 0.185 p.u 95
Figure 3.35 LPA-LPB torque with SVC-SSDC for Xc = 0.185 p.u 95
Figure 3.36 Gen-Exc torque without SVC for Xc = 0.185 p.u 96
Figure3.37 Gen-Exc torque with SVC-SSDC for Xc = 0.185 p.u 96
Figure 3.38 Machine terminal voltage without SVC for X c = 0.185 p.u 96
Figure 3.39 Machine terminal voltage with SVC-SSDC for Xc = 0.185 p.u 97
Figure 3.40 SVC reactive power for Xc = 0.185 p.u 97
Figure 4.1 Equivalent circuit diagram of a generic induction machine Ri =
stator resistance; Xi = stator leakage reactance; R2 = rotor
resistance referred to stator; X2 = rotor leakage reactance referred
to stator; Re = core-loss resistance; Xm = magnetizing reactance 104
Figure 4.2 Study system 1 - Wind turbine generator shunt compensated with
SVC 106
Figure 4.3 Study system 2 - Wind turbine generator with the transmission line
compensated by a TCSC 106
Figure 4.4 Electromagnetic torque for different WTG power outputs and
same series compensation level 108
Figure 4.5 Electromagnetic torque for different series compensation and same
power flow level 110
Figure 4.6 Mechanical torque between mass 1 and mass 2 (T/2) and
electromagnetic torque Te for different power transfer levels at
same series comp 112
xxn
Figure 4.7 Mechanical torque between mass 1 and 2 (Ti2) and
electromagnetic torque Te for different series compensation and
same power flow; fr = 0.8 Hz 114
Figure 4.8 Generalized SVC auxiliary control 116
Figure 4.9 Structure of SVC Subsynchronous Resonance Damping Controller
(SSRDC) 116
Figure 4.10 General configuration of a TCSC 117
Figure 4.11 TCSC Constant Current Controller 118
Figure 4.12 Performance of SVC in damping SSO due to IG effect: (a)
Electromagnetic torque 119
Figure 4.12 (Contd.) (b) Generator rotor speed; (c) Generator terminal voltage;
(d) SVC reactive power 120
Figure 4.13 Performance of SVC in damping SSO due to TI Effect (a)
Mechanical torque between Mass 1 and Mass 2 121
Figure 4.13 (Contd.) (b) Generator rotor speed; (c) SVC reactive power 122
Figure 4.14 Performance comparison of SVC and TCSC in damping SSO due
to IG effect (a) Electromagnetic torque 123
Figure 4.14 (Contd.) (b) Generator rotor speed; (c) Generator terminal voltage.. 124
Figure 4.15 Performance comparison of SVC and TCSC in damping TI
(a) Mechanical torque between Mass 1 and Mass 2;
(b) Generator rotor speed 125
Figure 4.16 Variation of TCSC reactance in damping of SSO 126
Figure 5.1 Study system 131
xxiii

Figure 5.2 Part of the system for ferroresonance studies 133
Figure 5.3 Instantaneous voltage at the point of tapping for varying
power flow levels 134
Figure 5.4 FFT of instantaneous voltage at the point of tapping for 800 MW
power flow through B562L 135
Figure 5.5 Transformer primary current in phase A for varying power flow
levels 136
Figure 5.6 FFT of transformer primary current for 800 MW power flow
through B562L 137
Figure 5.7 Instantaneous voltage of phase A at the point of tapping for
varying wind power penetration 139
Figure 5.8 Transformer primary current in phase A for varying wind power
penetration 139
Figure 5.9 (a) Instantaneous voltage of phase A at the point of tapping and (b)
its frequency content 141
Figure 5.10 (a) Transformer primary current in phase A (b) its frequency
content 142
Figure 5.11 (a) Instantaneous phase A voltage at wind turbine generator
terminal 142
Figure 5.11 (Contd.) (b) Frequency content of the WTG terminal voltage 143
Figure 5.12 Active and reactive power of the wind farm 143
Figure 5.13 Generator rotor speed (pu) 144
Figure 5.14 (a) Instantaneous voltage of phase A at the point of tapping and
(b) its frequency content 145
xxiv
Figure 5.15 (a) Transformer primary current in phase A 145
Figure 5.15 (Contd.) (b) its frequency content 146
Figure 5.16 (a) Instantaneous phase A voltage at wind turbine generator
terminal and (b) its frequency content 146
Figure 5.17 Active power of the wind farm 147
Figure 5.18 Reactive power of the wind farm 147
Figure 5.19 Generator rotor speed 147
Figure 5.20 Protection of the transmission line 149
Figure 5.21 Protection scheme dividing B562L into two zones of protection 149
Figure 5.22 Three-ended differential protection scheme 150
Figure 5.23 Possible occurrence of self-excitation of the wind farm 151
Figure 5.24 (a) Instantaneous voltage at the point of tapping (b) Transformer
primary current, (c) WTG terminal voltage 152
Figure 5.24 (Contd.) (b) FFT plot of WTG terminal voltage signal 153
Figure 5.25 (a) The self-excitation effect of the DFIG and (b) its FFT analysis .. 154
Figure 5.26 Protection scheme to fully alleviate the overvoltage problem 156
Figure 5.27 Mitigation of self-excitation of SEIG 156
Figure 5.28 Mitigation of self-excitation of DFIG 157
Figure A.1 99 MW wind farm at AIM ERIE Shore 171
Figure A.2 DFIG configuration in PSS/E [7, 10] 173
Figure A.3 Voltage and reactive power control of GE 1.5 MW DFIG 174
xxv
Figure A.4 Study system 175
Figure A.5 Reactive power flow on collector feeder 176
Figure A.6 Active power flow of the WTGs 177
Figure A.7 Collector bus voltage 177
Figure A.8 Reactive power flow on the collector feeder 178
Figure A.9 Active power flow of the WTGs 178
Figure A.10 Collector bus voltage 178
Figure A.ll Reactive power response for varying KQ; 180
Figure A.12 Reactive power response for varying KVi 182
Figure A.13 Collector bus voltage at Port Burwell (zoomed in) 185
Figure A.14 Power flow from the generators (zoomed in) 185
Figure A.15 FFT plot of measured power flow signal 186
Figure A.16 Collector bus voltage at Port Burwell (zoomed in) 186
Figure A.17 Power flow from the generators (zoomed in) 187
Figure A.18 FFT plot of measured power flow signal 187
xxvi

LIST OF ABBREVIATIONS
PSDC
WAM
PMU
SSR
IG
TI
FBM
FACTS
SVC
TCSC
SSRDC/SSDC
CC
WTG
WECS
WPS
SEIG
Power Swing Damping Controller
Wide Area Measurement
Phasor Measurement Unit
Subsynchronous Resonance
Induction Generator
Torsional Interactions
First Benchmark Model
Flexible AC Transmission Systems
Static VAR Compensator
Thyristor Controlled Series Capacitor
Subsynchronous Damping Controller
Closed-loop current control
Wind Turbine Generator
Wind Energy Conversion System
Wind Power System
Self-excited Induction Generator
xxvii

DFIG
PSS/E
EMTDC
PSCAD
EMTP
FFT
Doubly Fed Induction Generator
Power System Simulator for Engineering
Electromagnetic Transients including DC
Power System CAD or Computer Aided Design
Electromagnetic Transient Program
Fast Fourier Transform
XXVlll

CHAPTER 1
Introduction
The electric power system is highly nonlinear and time varying in nature. The
operating conditions as well as the system configurations of a power system are
changing at every instant. As a result the problems associated with such a system are
diverse. Some of the problems in a power system employing multiple machines are
inter-area oscillations, various network resonances such as subsynchronous resonance,
ferroresonance, issues related to integration of wind farms, modeling and validation of
emerging distributed generators, etc. This thesis deals with some of these power
system problems and proposes respective solutions for them. A major portion of the
proposed remedies use the application of a class of emerging high power electronic
devices called Flexible AC Transmission System (FACTS) Controllers. In the
following sections, these issues are independently addressed. Subsequently, the
general FACTS devices are described along with their application in resolving the
problems concerned. After that the motivation behind this work and the objectives of
the thesis are presented in a concise manner. Finally a chapter-wise summary is
provided for easy reference.
1.1 Inter-area Oscillations
A balance between the power supply and load demand is the basic requirement of a
power grid. As the supply becomes limited and existing transmission networks
become increasingly stressed the reserve margins tend to become lower. The
consequent decreasing system stability is a serious concern for power engineers.
Electro-mechanical oscillations between interconnected synchronous generators
are the phenomena inherent to power systems. The damping of these oscillations is of
2
vital concern, and is a prerequisite of stable system operation. These oscillations can
be associated with a single generator, or a very closely connected group of units of a
generating plant. Some unstable oscillations are also observed when large systems are
connected through relatively weak tie lines. These electro-mechanical oscillations are
of low frequency in nature and can be of various characteristics. Oscillations
associated with a single generator or single plant are called local modes or plant
modes. Similarly, oscillations between the rotors of a few generators close to each
other are called inter-machine or inter-plant modes. On the other hand, oscillations
involving groups of generators, or generating plants, on one side of the tie line
oscillating against the groups of generators on the other side of the tie line are called
inter-area modes or inter-area oscillations [1-6].
The typical frequency range of local modes or inter-machine modes is 0.7 to 2 Hz.
On the other hand inter-area oscillations usually have two distinct ranges. One is in
very low frequency range of 0.1-0.3 Hz essentially between two large areas each of
which has a large number of generators. The other is in a slightly higher frequency
range of 0.4-0.7 Hz involving sub-group of generators swinging against each other
[6]. Out of these various types, inter-area modes are of main interest to this thesis and
hence elaborated further.
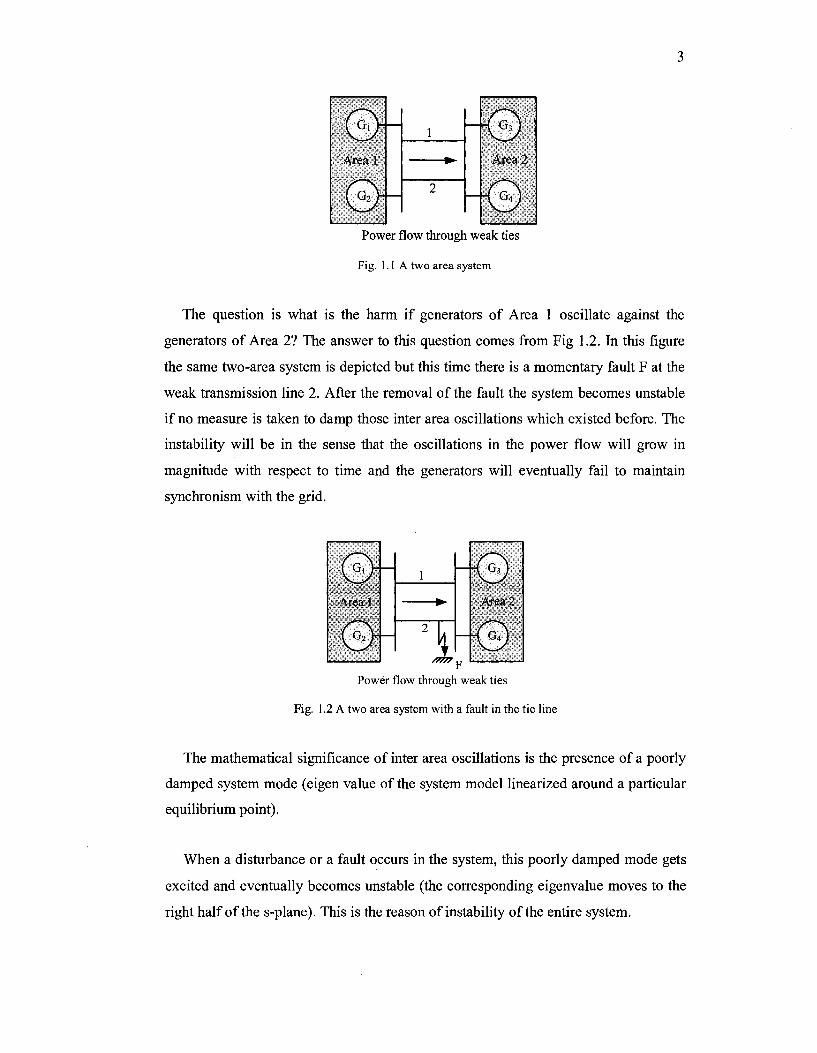
To explain the phenomena of inter-area oscillations pictorially, a simple two-area
system is considered in Fig 1.1. An "area" means a geographical boundary in which
all the generators are tightly coupled and oscillate together. They can thus be modeled
as a large equivalent machine. The system consists of four identical generators, two of
which form one area. These two areas are connected through two weak tie lines,
which are two transmission lines with high impedance. In this scenario, it is observed
that if power is transferred from Area 1 to Area 2 or vice versa, generators of Area 1
may oscillate with respect to generators of Area 2. That means the rotors of Gi, G2
may oscillate with respect to the rotors of G3, G4. These oscillations are reflected in
the power transmitted through the tie line (since the power is a function of generator
rotor angles) and are known as inter-area oscillations.
Power flow through weak ties
Fig. 1.1 A two area system
The question is what is the harm if generators of Area 1 oscillate against the
generators of Area 2? The answer to this question comes from Fig 1.2. In this figure
the same two-area system is depicted but this time there is a momentary fault F at the
weak transmission line 2. After the removal of the fault the system becomes unstable
if no measure is taken to damp those inter area oscillations which existed before. The
instability will be in the sense that the oscillations in the power flow will grow in
magnitude with respect to time and the generators will eventually fail to maintain
synchronism with the grid.
Power flow through weak ties
Fig. 1.2 A two area system with a fault in the tie line
The mathematical significance of inter area oscillations is the presence of a poorly
damped system mode (eigen value of the system model linearized around a particular
equilibrium point).
When a disturbance or a fault occurs in the system, this poorly damped mode gets
excited and eventually becomes unstable (the corresponding eigenvalue moves to the
right half of the s-plane). This is the reason of instability of the entire system.

1.2 Subsynchronous Resonance (SSR)
The Subsynchronous Resonance (SSR) phenomenon is usually associated with a
synchronous machine connected to series compensated transmission network. The
definition of SSR by IEEE SSR task force [7, 8] is: "Subsynchronous resonance is an
electric power system condition where the electric network exchanges energy with the
turbine-generator at one or more of the natural frequencies of the combined system
below the synchronous frequency of the system".
The SSR phenomenon is known to manifest in two different forms [7-11]:
1. Self-excited or steady state SSR resulting from the following mechanisms:
• Induction generator effects
• Torsional interaction
2. Transient SSR
To understand these different aspects a simple radial system is considered. This
system consists of a synchronous generator connected to an infinite bus through a
series compensated transmission line as shown in Fig. 1.3.
Generator
tXH>^} RL X L XC
Turbines Transformer Infinite Bus
Fig. 1.3 Turbine generator feeding infinite bus through series compensated transmission line

5
The series resonant frequency^ of the electrical network is given by:
f = f [K= f I Xc = A - /o ( L 1 )
J. Jo J HX.+X. r-j—-
kX„
Where
Xs = Reactance of the generator and transformer (pu)
Xe = Line reactance (pu)
Xc = Reactance of the series capacitor (pu)
Xz = Total reactance of the system = Xe + Xs
k = Degree of series compensation = —-
f0 = Nominal system frequency in Hz
/ , < / 0 since k < 1
1.2.1 S teady State S S R
Electrical subsynchronous currents of frequency fe flowing in the armature induce
subsynchronous torques and currents in the rotor circuit having frequencies fr given
as:
fr=f0-fe (1-2)
These rotor currents result in subsynchronous armature voltage components which
may enhance subsynchronous armature currents to produce self excitation or steady
state SSR. Self-excitation can be divided into two categories, one involving electrical
system dynamics alone and the other involving both the electrical system and
mechanical system (turbine-generator) dynamics.
1.2.1.1 Induction Generator Effect
The induction generator effect relates only to the electrical system dynamics. This

6
results from the apparent negative resistance characteristic of generators at
frequencies below the system synchronous frequency. At the system resonant
frequency^,, if this apparent negative resistance exceeds the sum of the armature and
network resistances, the subsynchronous armature currents may be negatively
damped.
1.2.1.2 Torsional Interaction
This form of self-excitation involves both the electrical and mechanical system
dynamics. Torsional interaction problems may occur when the electrical resonant
frequency^ is near the complement of a torsional resonant frequency/, of the turbine
generator shaft system. In this context, the word complement implies the difference
between synchronous frequency and the torsional natural frequency. Under these
conditions, a small voltage induced in the generator armature by rotor oscillations can
result in large subsynchronous current. When the net circuit resistance is positive, this
current will produce a rotor torque which is phased to sustain or enhance the rotor
oscillations. If the component of subsynchronous torque in phase with the rotor
velocity deviation equals or exceeds the inherent damping torque of the rotating
system, the coupled electromechanical system will experience growing oscillations.
It is emphasized that the induction generator effect and torsional interaction are not
mutually exclusive but will co-exist. It is only due to ease in analysis they are treated
separately.
1.2.2 Transient SSR
Transient SSR generally refers to transient torques on segments of the T-G shaft
resulting from subsynchronous oscillating currents in the network caused by faults or
switching operations. This usually occurs when the complement of the electrical
network resonant frequency gets closely aligned with one of the torsional natural
frequencies. Although, these transient torques decay with time their magnitudes are
large and have the potential to cause serious damage to the T-G unit.
7
In fact, even if torques such as those produced by the steady state subsynchronous
currents may be limited in magnitude and result in stresses within the elastic limit,
failure of a shaft can be caused due to cyclic fatigue stress which is cumulative.
The phenomena of subsynchronous oscillations (SSO) are not restricted to series
compensated system alone [7]. Subsynchronous oscillations have been reported to
result on adverse interaction between the turbine torsional system and HVDC control,
dc converter loads and power system stabilizers. Even the SSR can be created with
shunt capacitor compensated system if it is attempted to operate a long distance
transmission system at a power angle in excess of 180 .
1.2.3 Mitigation of SSR
SSR has been studied in depth and a number of counter measures to damp SSR
have been devised by the utilities [9, 11]. The solution to SSR problems is classified
in following categories:
• Filtering and damping
• Relaying and protective devices
• System switching and generator tripping
• Generator and system modifications
Injection of properly phased sinusoidal signal from rotor motion in the excitation
regulator to damp out the modes to which turbine generator shaft unit is vulnerable,
NGH-SSR damping scheme, extraction of the subsynchronous components from the
transmission line currents and cancellation of the original subsynchronous currents
which would otherwise cause SSR by this extracted current are some of the widely
used SSR counter measures by electric utility. FACTS devices have also been
successfully used to damp SSR which will be separately discussed in a subsequent
section.

1.3 Ferroresonance and Self-excitation
The research involving ferroresonance in transformers dates back to as early as
1907 [12, 13]. In simple terms, ferroresonance is a series resonance involving a
capacitor and a nonlinear inductor as shown in Fig. 1.4.
Nonlinear inductor exhibits a nonlinear voltage versus current characteristic and
hence has a variable reactance. Ferroresonance typically involves the saturable
magnetizing inductance, which is a good example of nonlinear inductor, of a
transformer and a capacitive distribution cable or transmission line connected to the
transformer. When an unloaded or a lightly loaded transformer is energized, the
inrush currents have instantaneous values that are much larger compared to the
transformer rated current.
_/X L M R
© f = 27IVLLMC XC
Fig. 1.4 Typical ferroresonance circuit with its characteristic frequency
The worst case is encountered when the transformer is energized at the instant of
the ac voltage reaching at its zero point on the voltage wave. As the voltage increases,
the flux rises during the first half-cycle to a high value, creating high saturation of the
transformer core. This results in the flow of excessively high values of exciting
current. This high current persists for a few cycles and then gradually reduces to the
normal low value of excitation current. If the transformer is fed from a series
capacitor in the circuit, the high current may continue to flow. The series capacitor
acts as an additional voltage source. A temporary or a permanent resonant condition
might occur. Ferroresonance is different from the resonance in linear RLC circuit. In

9
linear systems, resonance results in high sinusoidal voltages and currents of the
resonant frequency. Ferroresonance can also result in high voltages and currents, but
the waveforms are usually irregular in shape. In fact, any operating mode which
results in a significantly distorted transformer voltage and current waveform is
typically referred to as ferroresonance. Higher order odd harmonics are the
characteristic of the waveforms, whose shapes might be conceptually explained in
terms of the effective natural frequency fM as LLM goes in and out of saturation. It is to
be noted that although the ferroresonant frequency is attempted to be characterized
with fM there is no definite resonant frequency, more than one response is possible for
the same set of parameters, and gradual drifts or transients may cause the response to
jump from one steady state response to another.
The following situations lead to ferroresonance [14, 15]:
1. Manual switching of an unloaded, cable-fed, three-phase transformer where
only one phase is closed. Ferroresonance may be observed when the first
phase is closed upon energization or before the last phase is opened on de-
energization.
2. Switching of lightly loaded or unloaded transformers. Power transformers
energized in only one or two phases.
3. Lightly loaded power transformers energized by a series compensated line.
4. Very long underground cable circuits.
5. Low-loss transformers
6. Three-phase systems with single-phase switching devices.
7. Voltage transformers energized through grading capacitors of open circuit
breakers.
8. Voltage transformers connected to an isolated or resonant neutral system
(distribution networks).
Self-excitation phenomenon in induction motors has been well-known since the
1930s [16]. When an induction machine is disconnected from the supply, and driven

10
by a mechanical source, terminal voltage builds up if its lagging VAR demand is
supplied externally, and sufficient residual magnetism is present in the rotor core.
This is known as self-excitation phenomenon. Shunt compensation capacitors are the
most common VAR supplies for induction motors, which may result in self-
excitation. The use of an induction machine as an autonomous generator has been
extensively investigated by several researchers, especially for wind power generation
[17]-[22]. Recommended practices for power-factor improvement of induction
motors supplied from the utility grid are given in various standards and handbooks in
detail [23], [24]. Since the motor reactive power does not change too much from no-
load to full load, fixed shunt capacitors can be installed in different configurations for
power-factor improvement. Among these, the use of capacitors directly connected to
motor terminals is the cheapest and the simplest solution to this problem. Maximum
capacitor rating should not be in excess of 100% and 90% of no-load reactive power
consumption of the motor as recommended in [23] and [24], respectively. A
capacitance higher than the recommended values leads to overvoltages at the motor
terminals owing to self-excitation, when the motor is disconnected from the utility
grid. Even though the capacitor ratings are chosen according to recommended
practice, they may lead to self-excitation of the motor in some cases.
1.4 Integration of Wind Power Systems
1.4.1 Global Status of Wind Energy
Utilization of renewable energy as a means of environment friendly electric power
generation is the current trend. Out of various renewable sources of energy such as
solar, tidal, biogas etc, wind power systems is one of the fastest growing technologies
of producing electricity. Global Wind Energy Council (GWEC) [25] announced 2006
to be another year of record increase in wind generation integration all over the globe.
Wind energy developments in more than 70 countries around the world show that the
year 2006 experienced the installation of additional 15,197 MW, taking the total
installed wind energy capacity to 74,223 MW, from the previous 59,091 MW in 2005.
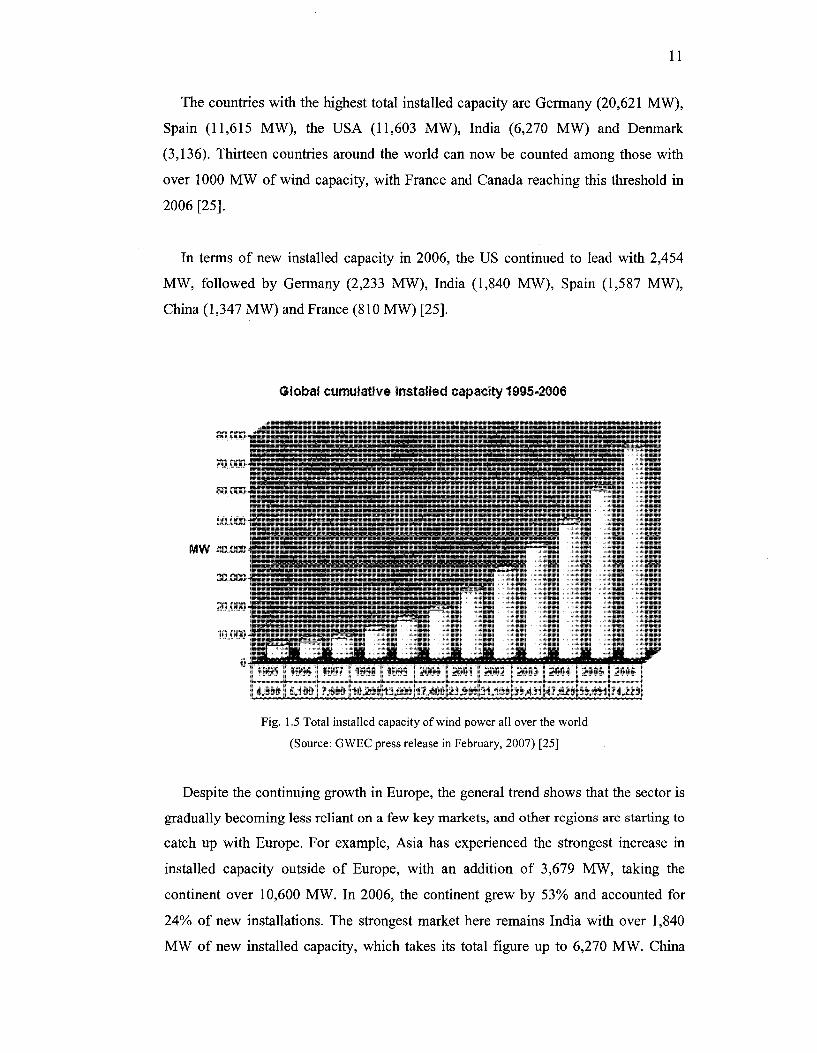
The growth in total installed capacity of the wind power all over the world from 1995
to 2006 is shown in Fig. 1.5.
11
The countries with the highest total installed capacity are Germany (20,621 MW),
Spain (11,615 MW), the USA (11,603 MW), India (6,270 MW) and Denmark
(3,136). Thirteen countries around the world can now be counted among those with
over 1000 MW of wind capacity, with France and Canada reaching this threshold in
2006 [25].
In terms of new installed capacity in 2006, the US continued to lead with 2,454
MW, followed by Germany (2,233 MW), India (1,840 MW), Spain (1,587 MW),
China (1,347 MW) and France (810 MW) [25].
Global cumulative installed capacity 1995-2806
S9,§§1}?4,223[
Fig. 1.5 Total installed capacity of wind power all over the world
(Source: GWEC press release in February, 2007) [25]
Despite the continuing growth in Europe, the general trend shows that the sector is
gradually becoming less reliant on a few key markets, and other regions are starting to
catch up with Europe. For example, Asia has experienced the strongest increase in
installed capacity outside of Europe, with an addition of 3,679 MW, taking the
continent over 10,600 MW. In 2006, the continent grew by 53% and accounted for
24% of new installations. The strongest market here remains India with over 1,840
MW of new installed capacity, which takes its total figure up to 6,270 MW. China

12
more than doubled its total installed capacity by installing 1,347 MW of wind energy
in 2006, a 70% increase from last year's figure. This brings China up to 2,604 MW of
capacity, making it the sixth largest market world wide.
1.4.2 Wind Energy in Canada
The installed capacity in Canada till December, 2006 is 1451 MW [26]. As of now,
total installed capacity of the wind farms in Canadian provinces has reached 1587
MW out of a proposed target of 2767 MW. Wind power penetration is expected to
grow to around 7500 MW by 2012, representing 3.5% of Canada's total generation
mix.
The average annual growth rate in wind power penetration is 38% from year 2000
to 2005. This growth rate is accelerating and has reached 54% in 2005. In 2006, the
installed capacity of wind power exceeded 600 MW. The total installed capacity of
the country from 2000 to 2006 is shown in Fig. 1.6.
1C0O
1500
1400
1500
1200
1100
1000
900
£00
700
COO
500
400
500
200
100
0
Fig.
t « 1
684 . .
2000 2001 2002 2003 2004 2005 December 2005
1.6 Total installed capacity of wind power in Canada
(Source: CANWEA) [25]
13
In Ontario, between 2009 and December 2011, there would be an expected
additional connection of 1,175 MW projects. Currently Hydro One Network Inc
(HONI) of Ontario has three large wind farms in service. They are 39.6 MW EPCOR
Kingsbridge Wind Farm near Goderich substation consisting of 22 VESTAS V80 1.8
MW wound rotor induction type wind turbine generators (WRIG), 99 MW AIM Erie
Shore Wind Farm at Port Burwell Substation comprising 66 GE 1.5 MW doubly-fed
induction type wind turbine generators (DFIG) and 67 MW Canadian Hydro
Melanchton Wind Farm having 45 GE 1.5 MW doubly-fed induction type wind
turbine generators (DFIG).
1.4.3 Wind Turbine Generator (WTG) Configurations
A wind farm usually comprises a group of identical wind turbine generators from a
particular vendor. These wind turbine generators can be equipped with different types
of three phase generator. Today, the demand for grid compatible electric current can
be met by connecting frequency converters, even if the generator supplies alternating
current (AC) of variable frequency or direct current (DC). Several generic types of
generators may be used in wind turbines [27]:
• Asynchronous (induction) generator:
o Squirrel cage induction generator (SCIG);
o Wound rotor induction generator (WRIG):
• OptiSlip induction generator (OSIG)
• Doubly fed induction generator (DFIG)
• Synchronous generator:
o Wound rotor synchronous generator (WRSG)
o Permanent magnet synchronous generator (PMSG)
• Other generator types of potential interest:
o High voltage generator (HVG);
o Switch reluctance generator (SRG);
o Transverse flux generator (TFG)

14
Out of these various configurations three widely used wind turbine generator
configurations are described below. They are squirrel cage or self-excited induction
generator (SEIG/SCIG), doubly fed induction generator (DFIG) and direct drive
synchronous generator [28].
1.4.3.1 Squirrel Cage or Self-Excited Induction Generator
(SEIG/SCIG)
The first configuration is a grid coupled squirrel cage induction generator as shown
in Fig. 1.7. This type of WTG consists of a rotor coupled to a squirrel cage induction
generator through a gearbox. The gearbox is needed, because the optimal rotor and
generator speed ranges are different. The generator is directly coupled to the grid.
Therefore, rotor speed variations are very small as the only speed variations which
can occur are due to the changes in the rotor slip. The order of magnitude of these
speed changes is usually small. The speed variations of these types of generators
being very small, the turbine is normally considered to operate at constant speed. A
squirrel cage induction generator consumes reactive power. Therefore in case of large
wind turbines connected to weak grids, capacitors are normally added at the generator
terminal to provide additional reactive support which in turn improves the power
factor of the system.
Rotor
A
\
Squirrel Cage Induction Generator
Gear BOY ^—v.
<s Grid
Compensating Capacitance
Fig. 1.7 Grid coupled squirrel cage induction generator
15
The power extracted from the wind needs to be limited when wind flow crosses a
particular speed limit. This wind speed is referred to cut-out speed. This is important
as the high wind speed would otherwise overload the machine or the pullout torque
could be exceeded leading to rotor speed instability. This is achieved by using the
stall effect. This requires the rotor geometry to be designed in such a way that its
aerodynamic properties make the rotor efficiency decrease in high wind speeds
limiting the power extracted from the wind, preventing the generator from being
damaged and the rotor speed from becoming unstable. It is to be noted that during
normal operation of a stall regulated wind turbine no controllers are active.
1.4.3.2 Doubly Fed Induction Generator (DFIG)
The second configuration is a wind turbine with doubly fed (wound rotor)
induction generator in which a back-to-back voltage source converter feeds the rotor
winding. A gearbox is also necessary in this type of WTGs to couple the rotor to the
generator, because of the difference in the rotor and generator speed ranges.
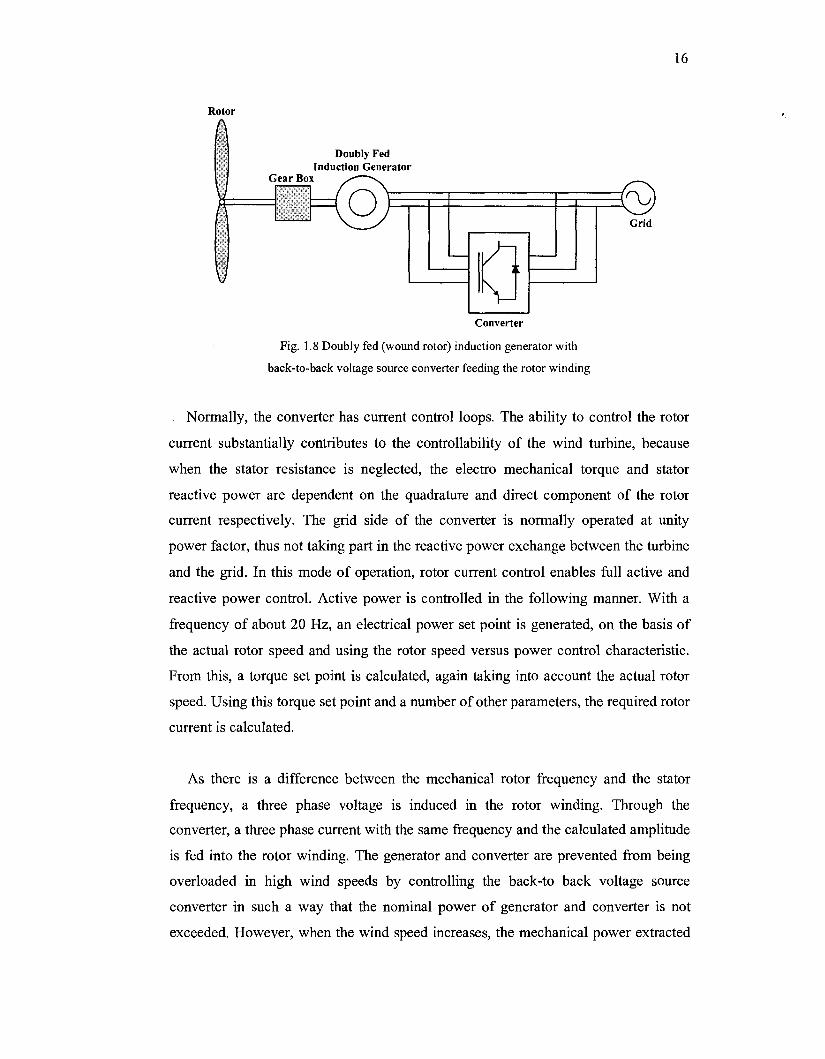
The stator winding of the doubly fed induction generator is coupled to the grid; the
rotor winding is coupled to a back-to-back voltage source converter. The other side of
the converter that feeds the rotor winding is coupled to the grid. The converter
decouples the electrical grid frequency and the mechanical rotor frequency, thus
enabling variable speed operation of the wind turbine. The sum of the mechanical
rotor frequency, multiplied by the number of pole pairs, and the electrical rotor
frequency equals the grid frequency applied to the stator. The system is depicted in
Fig. 1.8.
16
Rotor
1 Doubly Fed
Induction Generator
Converter
Fig. 1.8 Doubly fed (wound rotor) induction generator with
back-to-back voltage source converter feeding the rotor winding
Normally, the converter has current control loops. The ability to control the rotor
current substantially contributes to the controllability of the wind turbine, because
when the stator resistance is neglected, the electro mechanical torque and stator
reactive power are dependent on the quadrature and direct component of the rotor
current respectively. The grid side of the converter is normally operated at unity
power factor, thus not taking part in the reactive power exchange between the turbine
and the grid. In this mode of operation, rotor current control enables full active and
reactive power control. Active power is controlled in the following manner. With a
frequency of about 20 Hz, an electrical power set point is generated, on the basis of
the actual rotor speed and using the rotor speed versus power control characteristic.
From this, a torque set point is calculated, again taking into account the actual rotor
speed. Using this torque set point and a number of other parameters, the required rotor
current is calculated.
As there is a difference between the mechanical rotor frequency and the stator
frequency, a three phase voltage is induced in the rotor winding. Through the
converter, a three phase current with the same frequency and the calculated amplitude
is fed into the rotor winding. The generator and converter are prevented from being
overloaded in high wind speeds by controlling the back-to back voltage source
converter in such a way that the nominal power of generator and converter is not
exceeded. However, when the wind speed increases, the mechanical power extracted

17
from the wind increases as well, if no countermeasures are taken. This increases the
rotor speed because the mechanical power becomes higher than electrical power. To
limit the rotor speed, the blades are pitched, thus reducing the mechanical power
extracted from the wind and restoring the balance between mechanical power and
electrical power. In this way, the rotor speed is prevented from becoming too high.
1.4.3.3 Direct Drive Synchronous Generator
The third important contemporary wind turbine topology is the direct drive
synchronous generator. In this configuration, the rotor is directly coupled to the
generator and no gearbox is needed. The system is depicted in Fig. 1.9.
Rotor
Direct Drive Synchronous Generator
I Gear Box ••—->.
J
Converter
Fig. 1.9 Direct drive synchronous generator grid coupled through a back-to-back voltage source
converter or a diode rectifier and voltage source converter
The synchronous generator is a ring generator with a large number of poles. In
view of the low mechanical frequency, it is necessary to use a ring generator to
achieve an acceptable generator weight for the desired power rating. The stator
winding of the direct drive synchronous generator is coupled to a voltage source
converter or a diode rectifier. When a back-to-back voltage source converter is used,
the generator torque is controlled by changing the stator currents through controlling
the generator side converter voltage. When a diode rectifier is used, the generator
torque is controlled indirectly by controlling the DC link voltage using the voltage
source converter at the grid side. As the voltage source converter is self-commutated,
reactive power can be generated as well as consumed by the grid side of the converter

18
by injecting a leading or lagging current. Thus, the current on the grid side of the
converter is controlled in such a way that the generator real power is transferred to the
grid and the terminal voltage nearly equals a reference value. In short this
configuration enables full active and reactive power control. In high wind speeds the
generator power is again limited to protect both the generator and the converter,
resulting in an unbalance between mechanical power extracted from the wind and
generated electrical power. This leads to an increase in rotor speed, which needs to be
limited. This is again done by pitching the blades.
1.4.4 Grid Integration Issues of Wind Farms
With the abundance of priceless wind flow in nature, an obvious question which
can be raised is why more and more wind farms are not allowed to be integrated with
the grid. The answer to the question is not straight forward. Unlike conventional
synchronous generators wind turbine generators are not so well understood and
analyzed. The integration of a wind farm with grid may have a number of impacts and
issues which need to be carefully analyzed before a wind farm is allowed to be
connected to the grid. Some of the important issues of wind farm integration are
briefly described below.
1.4.4.1 Modeling of Wind Turbine Generators
One of the main differences between wind farms and conventional power plants is
that wind farms usually employ a number of identical wind turbine generators of
induction type [29]. More over, to capture the optimum power output from the wind
flow these fixed speed induction generators are equipped with power electronic
converters connected to both the rotor and with the grid to make them variable speed.
In addition to that, other types of machines such as permanent magnet synchronous
machines are also emerging with full scale stator side converters having the rated
capacity of the generator itself. Accurate models of these new classes of generators in
different simulation domains are still the subject of research and are not readily
available in literature.

19
Although wind turbine generator models based on wind turbine power curve,
subtransient and transient models of wind turbine generators of various configurations
are discussed and reported in literature [28, 30, 31, 32], neither the validation of these
models with field tests is reported nor the systematic procedure of implementing these
models in electro-magnetic transient domain or in transient stability domain is
publicly available. As a result the challenge of properly modeling these wind turbine
generators and validation of these models with field tests still exists. Extensive
research is needed to implement and validate these models in EMTDC/PSCAD or in
PSS/E and to make these models available for the ready use in system studies.
1.4.4.2 Reactive Power Requirement of Wind Farm
Induction generators do not have the capability to produce reactive power without
being connected to the grid. Even though the wind turbine generators are equipped
with power converters to control the active and reactive power produced by them they
need to remain connected to the grid to achieve this controllability. Whether there is a
need to have additional fast reactive power support when these generators are subject
to contingencies [31], if these generators can operate in islanded mode without having
a dedicated energy source such as battery storage to keep their excitation system alive
and how fast the machines can ride through the fault, are subjects of research. It has
been reported that dynamic reactive support by means of shunt Flexible AC
Transmission System (FACTS) devices namely Static VAR Compensators (SVC) or
Static Synchronous Compensator (STATCOM) is required for a self excited induction
generator to make them ride through the fault at the generator terminal. The power
electronic converters at the grid side of Doubly Fed Induction Generators (DFIG) can
provide reactive support during contingencies and hence do not require any FACTS
devices [31]. However, even with DFIGs the question remains how far these
machines can survive in the face of multiple contingencies? The current trend and
IEEE standards recommend the disconnection of any distribution generator from the
grid with the onset of contingencies. However, this practice has to be changed and
remedial measures have to be taken to keep them operational in order to maintain
electric power supply from renewable sources to the grid.

20
1.4.4.3 Series Compensated Wind Farm
With the growing wind power penetration, bulk power needs to be transmitted
through the transmission corridors. It is well known that series compensated
transmission line is an effective means of transmitting large amounts as of power over
long distances. However, series compensation is known to have a detrimental effect
on steam turbine driven synchronous generator which is subsynchronous resonance as
mentioned in section 1.2. SSR comprises the induction generator effect, and hence
when actual wind turbine driven induction generators are connected to series
compensated transmission lines for evacuation of bulk power, there is a strong
likelihood of SSR [32-36]. Hence the potential issue of subsynchronous resonance
must be thoroughly analyzed before the interconnection of large wind farms with
series compensated transmission lines.
1.4.4.4 Overvoltages Encountered by Wind Farms
Wind farms are usually integrated with a grid in two ways. One is high tension
interconnection where a high voltage transmission line typically operating at 118 kV,
230 kV or in rare cases 500 kV voltage rating is tapped at a particular location
through a step down transformer of voltage levels 34.5 kV or 27.6 kV and the wind
turbine generators are normally connected at the low tension side of the transformer.
On the other hand, wind farms can also be connected to the grid through 44 kV or
13.8 kV distribution feeders. In this connection a distributed feeder which normally
supplies the load also accommodates the wind farm.
Problem of overvoltage due to ferroresonance and self-excitation could occur in
the High Voltage (HV) connection especially when the line which is tapped for the
interconnection of the wind farm gets opened at its both ends. In this case, first of all
the shunt line charging capacitor may now appears in series with the step down
transformer and the voltage at the charging capacitanace will immediately be
impressed across the transformer driving it deep into saturation. If the transmission
line to which the wind farm is interconnected is of double circuit configuration,
21
disconnection of the tapped line may lead to the strong interaction of the coupling
capacitance between the two lines with the step down transformer and can cause
ferroresonance. The overvoltages due to ferroresonance may then damage the wind
turbine generators. To suppress this problem the ferroresonance path is normally
disrupted and the wind farm is disconnected from the transformer along with the
transmission line. This could further lead to self-excitation of the shunt compensated
induction type wind turbine generators supplying power to the grid. The magnitude of
the overvoltage also depends on the load at the generator terminal as the loads form
an energy dissipation path of the isolated generators.
In the wind farm connection to the distribution feeders, the line charging
capacitance is low and hence it is not likely to interact with the main step down
transformer. However, the shunt compensator at the induction generator terminal may
still be a candidate to self-excite the machine if the ratings of these capacitors are not
properly chosen.
1.5 Flexible AC Transmission System (FACTS)
With the growing requirement of transmitting bulk power to expanding load
centers over restricted right of ways, the need for optimum utilization of existing
transmission facilities is being increasingly recognized. The power transfer capability
of long transmission line is limited from both steady state and transient stability
considerations. An inadequate level of available system damping may further
aggravate the problem.
As stated in section 1.1, transfer of bulk power over long and weak tie lines from
one area to another leads to under-damped, low frequency oscillations. Power transfer
is restricted due to the existence of these inter-area oscillations. The inherent ability of
Flexible AC Transmission System (FACTS) devices to provide rapid, continuously
controllable reactive compensation in response to changing system conditions, has
been shown to result in addition to many other advantages, an enhancement of these
stability limits and increased system damping. However, a pure voltage or reactive
power control is often not adequate for the damping of power swings in the system. A

22
significant contribution of system damping is achieved when auxiliary feedback is
introduced in the FACTS control system. This leads to further improvement in power
carrying capability of the network.
Flexible AC Transmission System (FACTS) is defined by IEEE as [37]:
"Alternating current transmission systems incorporating power electronic-based and
other static Controllers to enhance controllability and increase power transfer
capability." FACTS devices incorporate switches and passive elements such as
inductors and capacitors. The power electronic switches are Insulated Gate Bipolar
Junction Transistors (IGBTs), Gate Turn Off Thyristors (GTOs) etc.
The main idea of introducing power electronic switches is to achieve the following
objectives:
• Very fast switching of capacitors and inductors.
• Continuous control of reactive power.
FACTS devices are broadly classified into the following categories:
• Shunt connected devices such as: Static Var Compensator (SVC), Static
Compensator (STATCOM) etc.
• Series connected devices such as Thyristor Controlled Series Capacitors
(TCSC), Static Synchronous Series Compensators (SSSC)
• Composite series and shunt devices such as Unified Power Flow Controller
(UPFC) etc.
Another classification of FACTS devices could be based on the power electronic
implementation which is as follows:
- Thyristor based FACTS devices such as SVC, TCSC, Thyristor Controlled
Phase Angle Regulator (TCPAR) etc.
• Voltage source converter based FACTS devices namely STATCOM, SSSC,
UPFC, Interline Power Flow Controller (IPFC) etc.
23
SVCs and TCSCs are the two widely used devices in power systems worldwide.
Hence main emphasis is given to these two devices in this thesis. In the following
paragraph, operating principles of these two devices are described.
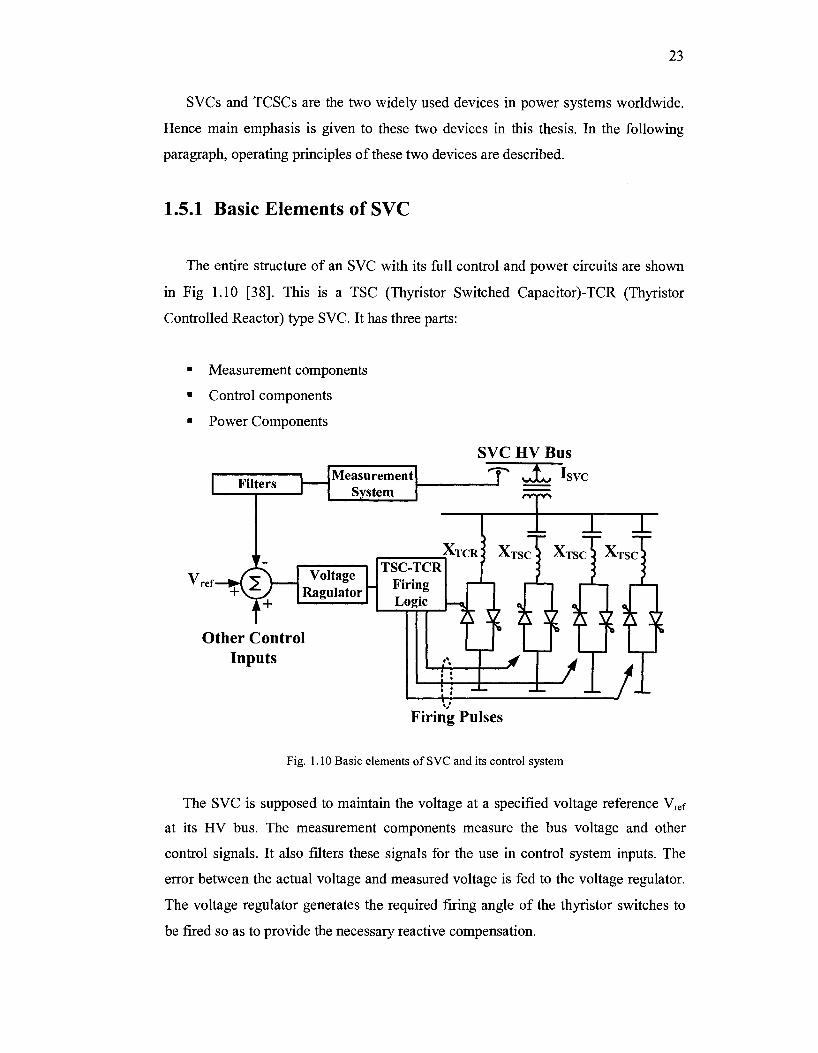
1.5.1 Basic Elements of SVC
The entire structure of an SVC with its full control and power circuits are shown
in Fig 1.10 [38]. This is a TSC (Thyristor Switched Capacitor)-TCR (Thyristor
Controlled Reactor) type SVC. It has three parts:
• Measurement components
• Control components
• Power Components
SVC HV Bus
Filters Measurement
System
TSC-TCR - | Firing
Logic
Other Control Inputs irria/i
Firing Pulses
Fig. 1.10 Basic elements of SVC and its control system
The SVC is supposed to maintain the voltage at a specified voltage reference Vref
at its HV bus. The measurement components measure the bus voltage and other
control signals. It also filters these signals for the use in control system inputs. The
error between the actual voltage and measured voltage is fed to the voltage regulator.
The voltage regulator generates the required firing angle of the thyristor switches to
be fired so as to provide the necessary reactive compensation.
24
The steady state and dynamic characteristics of an SVC describe the variation of
SVC bus voltage with SVC current or reactive power. Two alternative representations
of these characteristics are shown. Fig. 1.11(a) illustrates the terminal voltage - SVC
current characteristic while Fig. 1.11(b) depicts the terminal voltage - SVC reactive
power relationship. The dynamic V-I characteristics of the SVC comprise:
• A voltage reference Vref at the terminals of the SVC during floating condition
i.e. when the SVC is neither absorbing nor generating any reactive power. The
reference voltage can be varied between the maximum and minimum limits
Vref max and Vref min either by the SVC control system (in case of thyristor
controlled compensators) or by the taps of the coupling transformer (in the
case of saturated reactor compensator).
• A linear operating range over which SVC terminal voltage varies linearly
with SVC current or reactive power as the latter is varied over its entire
capacitive to inductive range.
• A slope or droop of the V-I characteristic defined as the ratio of voltage
magnitude change to current magnitude change over the linear controlled
range of the compensator and several other operating limits such as overload
limit, over current limit etc to prevent the costly power electronic devices.
Although SVC is a Controller for voltage regulation, that is, for maintaining
constant voltage at a bus, a finite slope is incorporated in the dynamic characteristic of
an SVC. The slope reduces the reactive power rating of the SVC substantially for
achieving nearly the same objective. It also prevents the SVC from reaching its
reactive power limits too frequently. Due to this slope, sharing of reactive power is
facilitated among multiple compensators operating in parallel. These are a few
advantages of slope despite a slight deregulation of the bus voltage.
It is to be noted that this configuration itself does not have any capability to
provide damping. This can be achieved with a separate controller named auxiliary or
power swing damping controller, which modulates the bus voltage and thereby

25
introduces system damping. This auxiliary control is based on additional signals such
as line current, bus frequency, remote generator speed etc. These auxiliary signals
provide a measure of the rotor oscillations which need to be damped. The controller
structure including auxiliary controller is shown in Fig. 1.12.
^SVCA
Steady-State Characteristic
Overcurrent Limit
Overload Range
Dynamic Characteristic
(a)
Steady-State Characteristic Overcurrent Limit
Overload Range
Dynamic Characteristic
Qsvc
<b)
Fig. 1.11: (a) V-I characteristics of an SVC; (b) Q-V characteristics of an SVC
Reference Signals
Auxiliary Controller
Auxiliary Control Signals
• *
Slope KSL In,
Compensator Current
Measurement System
SVC Bus Voltage V,„„,
V„,
Voltage Regulator
Power System
Other Control Inputs
Synchronization System
Valve Voltagel
Gate Pulse Generator
TSC-TCR Combination
Fig. 1.12 Control structure of the SVC
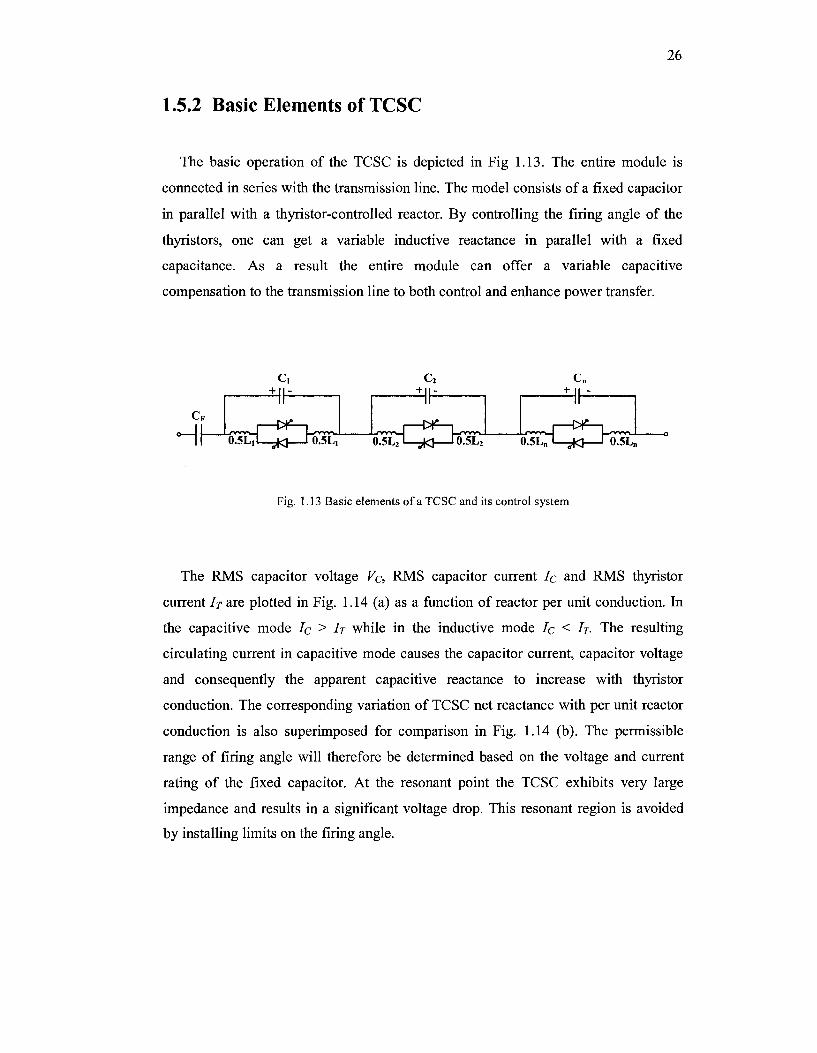
26
1.5.2 Basic Elements of TCSC
The basic operation of the TCSC is depicted in Fig 1.13. The entire module is
connected in series with the transmission line. The model consists of a fixed capacitor
in parallel with a thyristor-controlled reactor. By controlling the firing angle of the
thyristors, one can get a variable inductive reactance in parallel with a fixed
capacitance. As a result the entire module can offer a variable capacitive
compensation to the transmission line to both control and enhance power transfer.
0.5L71—yK] 10.5L, 0.5L71—jK] l0.5L2 0.5L„ I—jK|—" o.5Ln
Cn
Fig. 1.13 Basic elements of a TCSC and its control system
The RMS capacitor voltage V& RMS capacitor current IQ and RMS thyristor
current IT are plotted in Fig. 1.14 (a) as a function of reactor per unit conduction. In
the capacitive mode Ic > IT while in the inductive mode IQ < IT- The resulting
circulating current in capacitive mode causes the capacitor current, capacitor voltage
and consequently the apparent capacitive reactance to increase with thyristor
conduction. The corresponding variation of TCSC net reactance with per unit reactor
conduction is also superimposed for comparison in Fig. 1.14 (b). The permissible
range of firing angle will therefore be determined based on the voltage and current
rating of the fixed capacitor. At the resonant point the TCSC exhibits very large
impedance and results in a significant voltage drop. This resonant region is avoided
by installing limits on the firing angle.
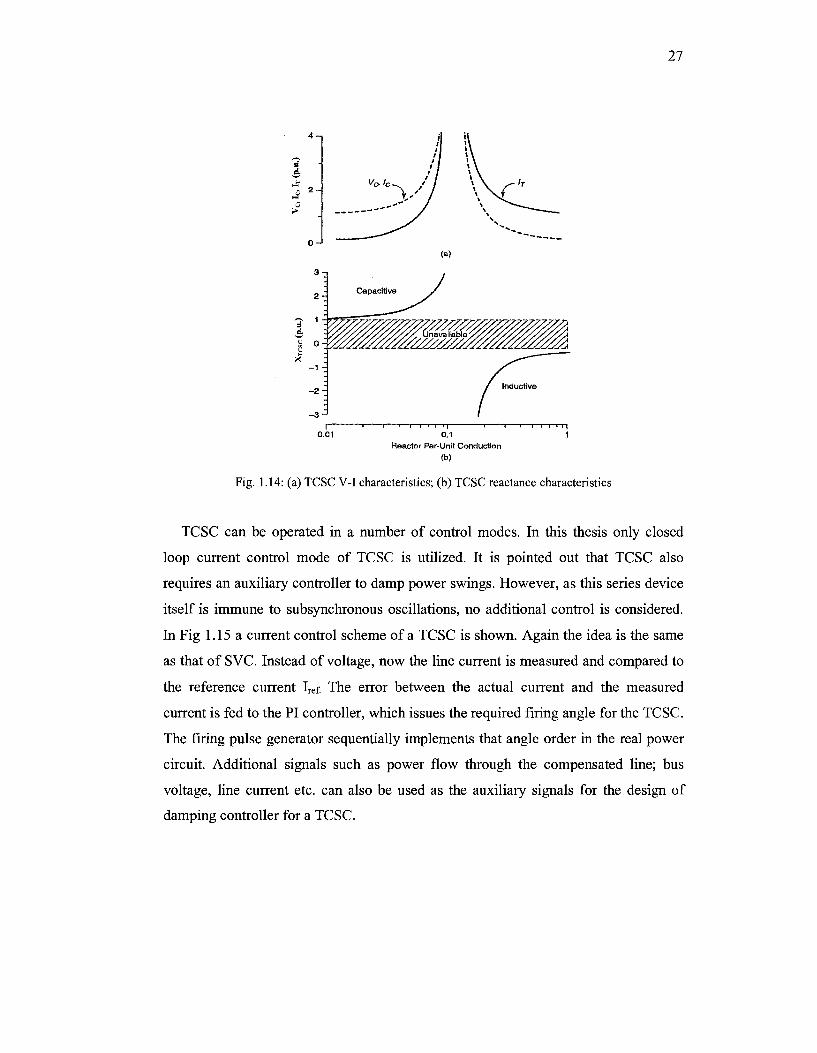
27
| 1 1 1—r—r-n-n 1 1 1—i i i i F| 0.01 0.1 1
Reactor Per-Unit Conduction
(b)
Fig. 1.14: (a) TCSC V-I characteristics; (b) TCSC reactance characteristics
TCSC can be operated in a number of control modes. In this thesis only closed
loop current control mode of TCSC is utilized. It is pointed out that TCSC also
requires an auxiliary controller to damp power swings. However, as this series device
itself is immune to subsynchronous oscillations, no additional control is considered.
In Fig 1.15a current control scheme of a TCSC is shown. Again the idea is the same
as that of SVC. Instead of voltage, now the line current is measured and compared to
the reference current Iref. The error between the actual current and the measured
current is fed to the PI controller, which issues the required firing angle for the TCSC.
The firing pulse generator sequentially implements that angle order in the real power
circuit. Additional signals such as power flow through the compensated line; bus
voltage, line current etc. can also be used as the auxiliary signals for the design of
damping controller for a TCSC.

28
"Line
• ^
Filtering and Scaling
PI Controller
Linearization Block
Operating Mode
Selector
Firing Pulse Generator
Fig. 1.15 Current control scheme for a TCSC
1.5.3 Applications of FACTS Devices
Various types of FACTS devices are available with their individual versatility of
applications. SVC and TCSC are the two major thyristor based FACTS devices which
are considered in this thesis to alleviate inter-area oscillations and subsynchronous
resonance. It is to be pointed out that voltage source converter (VSC) based FACTS
devices such as STATCOM, SSSC, UPFC etc., can also be equally effective in these
applications. However, their design and control for these purposes are beyond the
scope of this thesis and hence are not discussed further.
1.5.3.1 Damping of Inter-area Oscillations
SVC and TCSC both have been successfully used to damp inter-area oscillations in
power system. A vast body of literature [40-66] is available which reports the
application of different linear control techniques such as pole placement, gain margin
and phase margin, FLo control, linear matrix inequality (LMI) etc to design the
auxiliary controller for these FACTS devices. On the other hand, intelligent control
methods based on neural network, fuzzy logic, genetic algorithm etc are also applied
for the design of power swing damping controller (PSDC).
Successful design of auxiliary controllers or power swing damping controllers
(PSDC) also depends substantially on the proper choice of auxiliary signal. The

29
auxiliary signal is the main input to the PSDC which actually modulates the bus
voltage in case of shunt FACTS devices such as SVC or the line power in case of
series FACTS devices such as TCSC and thereby damps the power swing. The chosen
signal must contain the oscillating mode which is to be damped. In mathematical
terms, the undamped mode must be controllable by the chosen auxiliary signal and
also must be observable in the same signal [45].
Local signals which are readily available at the terminals of the FACTS devices
have been successfully used in past to damp inter-area oscillations [43-55]. However,
with the growing complexity and vastness of today's power system it is quite possible
that an undamped mode has participation from rotor speeds or rotor angles of a
number of generators remotely placed from the location of the installed FACTS
devices. In addition, several undamped modes are likely to contribute to a power
swing. In this scenario, a single controller may not be sufficient to damp all the
modes. Therefore, an obvious choice is to go for multiple FACTS Controllers.
Another requirement for the stable operation of a large interconnected power system
network is to have an overall picture of all the generator rotor angle modes, which
reflect the information of power system oscillations. After capturing this information,
a coordinated control strategy may need to be implemented to stabilize the entire
power system subjected to a list of credible contingencies. The control strategy should
ensure a proper coordination of multiple FACTS Controllers with respect to all the
sensitive system modes. To achieve such a broad picture of a system, the Wide Area
Measurement (WAM) technology [68-80] is utilized. The idea is depicted in the
following picture:
I Controller |
Fig. 1.16 Wide Area Measurement (WAM) structure

30
WAM structure works as follows:
• Phasor Measurement Units (PMUs) sample the voltage and current signals
from different buses and transmission lines in a large power system.
• Sampled signals with their sampling instant are sent to Geostationary
Positioned Satellite (GPS) via Communications Channels and Links.
• GPS system sends the samples to the Control Centre. In Control Centre, the
current and voltage phasors are computed. The phasor information is sent to
auxiliary controller of the FACTS devices installed in actual power system for
damping control.
Wide Area Measurement based remote signals are demonstrated to damp inter-area
oscillations of a very large power system having several undamped low frequency
modes [67]. In several cases, dedicated optical fibers are utilized for transmitting the
control signal from remote generators to the FACTS devices []. It is also shown that
the performance of such a decentralized controller which uses remote or global
signals of a power system is better than local signal based centralized controller.
Several advanced control techniques have been applied to design remote signal based
damping controller.
One drawback of acquiring remote signals is the inherent signal transmission
delay. The typical range of such delay is 10-40 milliseconds. Transmission delays
could be detrimental and could make the system eventually unstable if they are not
properly taken into account while designing the damping controller. Proper
representation of the time delays and the design of damping controllers which will be
unaffected by the effects of these delays are also reported [81, 82]. However, the
compensation of such time delays is often found to be difficult to achieve and is still
under research.
1.5.3.2 Damping of Subsynchronous Resonance
Static VAR Compensator (SVC) is shown to successfully damp all the four SSR
modes which are critically excited with specific levels of series compensation in IEEE
31
Is Benchmark Model. The SVC is originally installed at the generator terminal for the
voltage control purpose. Addition of a suitably designed auxiliary controller damps
the torsional and self-excitation modes of this system [83].
Thyristor controlled reactor used in a modulated inductance stabilizer (MIS) is also
proved to provide positive damping to SSR modes when a zero phase shift is
produced in its control [84].
A comparative study of damping SSR by an SVC using various auxiliary signals
such as computed internal frequency (CIF) [86, 87], computed rotor frequency (CRF),
bus frequency and line reactive current has been reported in past. The CIF signal
gives the best damping performance for all the SSR modes for all levels of series
compensation (5%-99%).
Similar to SVC, a vast body of literature is also available showing the effectiveness
of the series FACTS devices in damping SSR. Series devices have inherent capability
to damp SSR [88-91]. More specifically, series FACTS devices are immune to SSR
because at the subsynchronous frequencies these devices offer very high impedance.
As mentioned in section 1.3, thyristor controlled series compensators (TCSC) are
widely used series devices. It is reported in [88] that a TCSC with an open loop firing
angle control when employed in a transmission system supplied with conventional
steam turbine-driven synchronous generators, offers more resistance at increased
levels of series compensation at subsynchronous frequencies while at fundamental
frequency the same TCSC offers capacitive reactance enhancing the power flow
through the transmission line. This shows that TCSC has an inherent capability of
damping SSR while increasing the power transfer capability of a transmission line.
1.6 Motivation of the Thesis
Proposition of some innovative techniques to solve some of the diverse power
system problems described in previous sections is the main motivation behind the
thesis. The thesis starts with a very general idea of damping inter-area oscillations
with static var compensators (SVC) employing remote signals as the input to the

32
auxiliary controller. With today's complex, interconnected and multi-machine power
system, the remote signal is shown to provide better damping than the local signals
which may not necessarily exhibit the most undamped mode of oscillations. The
performance of various remote and local signals and their varied combination has
been thoroughly investigated to find out the best auxiliary signal.
Subsynchronous resonance of series compensated transmission network is another
intricate problem where multiple modes of subsynchronous frequencies become
unstable. The instability is much more complicated than the low frequency inter-area
oscillation because of the fact that at a particular level of series compensation all four
subsynchronous modes need to be damped. Another challenge is to ensure that a
single controller configuration with same parameter values should be able to damp all
the unstable SSR modes. To achieve both of these objectives the possibility of
utilizing remote signal as the input to subsynchronous damping controller of a FACTS
device has been explored for the first time.
With the increased penetration of wind power a natural question is that can SSR
occur in a series compensated wind farm? To answer the question a new area of
research is opened up by investigating the possibility of the existence of
subsynchronous resonance in such a wind farm and its potential solutions.
Another aspect of research is to examine the issues related to interconnecting large
wind farms directly to an Extra High Voltage (EHV) double circuit transmission line.
This thesis studies the overvoltage issues arising from interconnecting a large wind to
such a network.
It is found from the study of overvoltages across the wind farm that the
characteristics of overvoltages may depend on the modeling of WTGs. Especially, the
modeling of the DFIG in this study is crucial as it is equipped with a voltage-source
converter based excitation system being a potential factor of severe overvoltages. To
obtain the accurate model of a WTG the simulation model needs to be validated with
the field test results. Although the overvoltage study is performed in electromagnetic
transient domain, as the first step towards achieving a field validated model, a widely
used transient stability software package having a readily available DFIG model is
33
used in this thesis. Wind turbine generator models manufactured by different vendors
and having various configurations may be readily available in software packages.
However, neither the detailed implementation procedure of these models is disclosed
nor there is any literature reporting the validation of these existing models with the
field test results. In this thesis an attempt is made for the first time to validate a doubly
fed wind turbine generator model with the field test results.
1.7 Objective and Scope of the Thesis
The objectives and the scope of the thesis are as follows:
1. Damping of inter-area oscillations in multi-machine power system with static
VAR compensator using the derivative of the remote generator bus voltage
angle as the auxiliary signal to the SVC power swing damping controller and
to study the effect of remote signal transmission delay with its compensation.
2. Damping subsynchronous resonance (SSR) with a static VAR compensator
using remote generator speed as the auxiliary signal to its subsynchronous
damping controller.
3. To study the potential of the SSR occurrence in a series compensated wind
farm and to damp this SSR using different FACTS devices namely SVC and
TCSC.
4. To thoroughly investigate the overvoltage problem at the terminal of a large
wind farm to be interconnected with the EHV double circuit transmission
corridor and to propose various economical means to suppress the
overvoltages caused by ferroresonance, self-excitation etc.
5. To validate GE 1.5 MW doubly fed wind turbine generator models of PSS/E
with the field test results and to propose some system performance
improvements by tuning the parameters of the models. To further recommend
some guidelines to conduct more successful tests and also to obtain more
accurate test results of a wind farm.
34
1.8 Outline of the Thesis
A chapter-wise summary of the work done in this thesis is given below:
In chapter 2, it is shown that irrespective of the complexity and the number of
machines of a given power system, the derivative of generator bus voltage angle
closely follows the low frequency inter-area oscillations observed in generator rotor
speed. In other words, the derivative of generator bus voltage angle mimics generator
rotor speed signal. An SVC utilizing the weighted combination of the derivative of the
participating generator bus voltage angle as the input to its auxiliary controller is used
to damp the low frequency inter-area oscillations in IEEE 39 bus New England Test
System which is subjected to a number of contingencies and varied operating
conditions. A transmission delay of reasonable duration is purposely simulated to
show that it can make the system eventually unstable. A suitable lead lag compensator
is designed to compensate the delay. The robustness of such a compensator is
extensively tested by varying the duration of the time delay. It is observed that the
compensator is equally effective within a wide range of time delay.
Chapter 3 demonstrates for the first time the effectiveness of the remote generator
speed in damping SSR through SVC. It is proved that the same subsynchronous
damping controller of a mid-point located SVC in the IEEE 1st Benchmark system can
effectively damp all the SSR modes for three critical levels of series compensation. A
slight variation of the same controller is able to damp the SSR modes corresponding
to the fourth and the highest compensation level.
Chapter 4 establishes the existence of SSR in a series compensated wind farm. It is
first of all shown that induction generator effect and torsional interaction both co-exist
in a wind farm consisting of a group of self-excited induction generators and
supplying power through a series compensated transmission line. The frequencies of
subsynchronous oscillations are also identified. It is found that the subsynchronous
oscillations due to the induction generator effect and torsional interaction can be
detrimental even at very realistic levels of series compensation. The subsynchronous
oscillations due to these two effects are damped by a simple voltage regulator of a
35
static VAR compensator originally employed at the generator terminal for the fast
voltage or reactive power support of the wind farm. Addition of an auxiliary
controller to the SVC, using generator rotor speed deviation as the input signal is
found to have better performance in damping the oscillations due to torsional
interactions. A performance comparison is carried out to prove that thyristor
controlled series compensator (TCSC) is more effective compared to SVC in damping
SSR even if the SVC is equipped with subsynchronous damping controller (SSRDC).
Chapter 5 is concerned with the overvoltage problem encountered by a large wind
farm connected to EHV lines. The upcoming Kingsbridge II wind farm will be
connected to a 500 kV long double circuit transmission line of Hydro One Networks
Inc. through a step down transformer. This transmission corridor is a major
interconnection transferring bulk power from Bruce nuclear power station to
Longwood. The problem of potential overvoltage, which may be encountered by this
wind farm if the breakers at both ends of the transmission line to which it is connected
get opened, is rigorously addressed. Extensive nonlinear time domain simulations
have been carried out to study the overvoltages faced by the wind turbine generators.
It is found that the voltage at the point of interconnection reaches detrimental
magnitude within two to three cycles if proper protection measures do not disconnect
the wind farm from the high voltage transmission line. The overvoltages may occur
due to several reasons such as ferroresonance involving the capacitive coupling of the
double circuit transmission line and the magnetizing inductance of the station
transformer, self-excitation of the wind farm employing induction generators, LC
oscillations between the line charging capacitance and transformer leakage
inductance, etc. In addition to damaging the costly wind turbine generators this severe
overvoltage may drive the transformer into saturation and thereby reducing its life of
operation. Self-excited induction generators (SEIG) and doubly fed induction
generators (DFIG) are considered to study this phenomenon. Several mitigating
measures have been proposed to arrest this overvoltage.
Finally, Chapter 6 concludes the thesis along with some directions of future
research.
Appendix A deals with the extensive validation of an existing model of a variable
36
speed doubly fed induction generator with the field test results in the Hydro One
network. AIM Erie Shore wind generating station interconnected to the 118.1 kV
Cranberry Junction transformer station (TS) of Hydro One Network Inc. (HONI) has
a group of GE 1.5 MW wind turbine generators. These wind turbine generators are of
doubly fed induction generator configuration which is already implemented in PSS/E
Wind software. Out of a series of tests conducted at the same generating station, a few
of them are simulated in PSS/E to validate the existing models. Simulation results are
found to be in good agreement with the field test results confirming the accuracy of
the GE 1.5 MW wind turbine generator models of PSS/E Wind. In addition, a
systematic tuning of various controller parameters of the power electronic converter is
carried out to obtain improved system performance. It is shown that with the slight
variation of the controller gain the settling time of the voltage and the reactive power
could be substantially reduced. The extent of mismatch between the simulation and
experimental results is also reported and the reasons for the mismatch are pointed out.
Finally, a number of recommendations are made to conduct more meaningful testing
ofWTGs.
1.9 References
[1] P. Kundur, Power System Stability and Control, McGraw-Hill, New York,
1993.
[2] P. Kundur; G. J. Rogers; D.Y. Wong,; L. Wang; M. G. Lauby, "A
comprehensive computer program package for small signal stability analysis
of power systems," IEEE Transactions on Power Systems, vol.5, no.4,
pp.1076-1083, Nov 1990.
[3] M. Klein, G. J. Rogers, S. Moorty and P. Kundur, "Analytical Investigation of
Factors Influencing Power System Stabilizers Performance," IEEE
Transaction on Energy Conversion, vol.7, no.3, pp.382-390, Sep 1992.
[4] P. Kundur, M. Klein, G J. Rogers and M. S. Zywno, "Application of power
system stabilizers for enhancement of overall system stability," IEEE Trans.
Power Syst, vol. 4, no. 2, pp. 614-626, May. 1990.

37
[5] M. Klein, G. J. Rogers and P. Kundur, "A fundamental study of inter-area
oscillations in power systems," IEEE Trans. Power Syst., vol. 6, no. 3, pp.
914-921, Aug. 1991.
[6] Powertech Short Course Notes on Analysis and Mitigation of Power System
Oscillations, Powertech Lab, Surrey, BC, November, 2004.
[7] K. R. Padiyar, Analysis of Subsynchronous Resonance in Power Systems,
Kluwer Academic Publishers, Massachusetts, USA, 1999.
[8] IEEE SSR Task Force Report, "Analysis and Control of Subsynchronous
Resonance," presented at 1976 IEEE Power Engineering Society Winter
Meeting and Tesla Symposium.
[9] R. K. Varma, "Control of Static VAR Systems for Improvement of Dynamic
Stability and Damping of Torsional Oscillations," Ph.D. dissertation, Dept.
Elect. Eng., Indian Institute of Technology, Kanpur, UP, April, 1988.
[10] IEEE Committee Report, "Reader's Guide to Subsynchronous Resonance,"
IEEE Trans, on Power Systems, vol. 7, no. 1, pp. 150-157, February 1992.
[11] IEEE Working Committee Report, "Third Supplement to a Bibliography for
the Study of Subsynchronous Resonance between Rotating Machines and
Power Systems," IEEE Trans, on Power Systems, vol. 6, no. 2, pp. 830-834,
May 1991.
[12] P.M. Anderson and R.G. Farmer, Series Compensation of Power Systems,
PBLSH Inc., California, USA, 1996.
[13] Slow Transients Task Force of the IEEE Working Group on Modeling and
Analysis of Systems Transients Using Digital Programs, "Modeling and
Analysis Guidelines for Slow Transients-Part III: The Study of
Ferroresonance," IEEE Trans, on Power Delivery, vol. 15, no. 1, pp. 255-265,
January 2000.
[14] R. C. Dugan, M. F. McGranaghan, S. Santoso and H. W. Beaty, Electrical
Power Systems Quality, McGraw-Hill, New York, 2000.
[15] M. Val Escudero, I. Dudurych, M. Redfem, "Understanding ferroresonance,"
in Proc. of International Universities Power Engineering Conference
(IUPEC), Vol. 2, pp. 1262-1266, September, 2004.
[16] M. Ermis; Z. Cakir; I. Cadirci; G. Zenginobuz; H. Tezcan, "Self-excitation of
induction motors compensated by permanently connected capacitors and

38
recommendations for IEEE std 141-1993," IEEE Transactions on Industry
Applications, vol.39, no.2, pp. 313-324, Mar/Apr 2003.
[17] N. Mohan and M. Riaz, "Wind-driven capacitor excited induction generators
for residential electric heating," presented at the IEEE PES Winter Meeting,
New York, 1978, Paper A 78 050-7.
[18] D. W. Novotny and G. H. Studtmann, "Self excitation in inverter driven
induction machines," IEEE Trans. Power App. Syst, vol. PAS-96, pp. 1117-
1125, July/Aug. 1977.
[19] J. M. Elder, J. T. Boys, and Prof.J. L. Woodward, "The process of
selfexcitation in induction generators," Proc. Inst. Elect. Eng., pt. B, vol.130,
no. 2, pp. 103-108, Mar. 1983.
[20] G. Raina and O. P. Malik, "Wind energy conversion using a self excited
induction generator," IEEE Trans. Power App. Syst., vol. PAS-102, pp. 3933-
3936, Dec. 1983.
[21] J. M. Elder and J. T. Boys, "Self-excited induction machine as a small low-
cost generator," in Proc. Inst. Elect. Eng., vol. 131, no. 2, pp. 33^41, Mar.
1984.
[22] S. P. Singh, B. Singh, and M. P. Jain, "Performance characteristics and
optimum utilization of a cage machine as capacitor excited induction
generator," IEEE Trans. Energy Conversion, vol. 5, pp. 679-685, Dec. 1990.
[23] IEEE Recommended Practice for Electric Power Distribution for Industrial
Plants, IEEE Std. 141 (Red Book), 1993.
[24] SIEMENS Electrical Installations Handbook Part 2, 2nd revised and enlarged
Ed. New York: Wiley, 1987.
[25] Global Wind Energy Markets Continue to Boom - 2006 Another Record Year,
Global Wind Energy Council, Press Release, Brussels, 2nd Feb., 2007.
[26] Available: www.canwea.ca
[27] T. Ackerman, Power Wind Power in Power Systems, John Wiley & Sons,
2005.
[28] J. G. Slootweg; S.W.H. de Haan; H. Polinder; W.L. Kling, "Modeling wind
turbines in power system dynamics simulations," Proc. of IEEE Power
Engineering Society Summer Meeting, 2001, vol.1, no., pp.22-26 vol.1, 2001.
[29] R. Zavadil, N. Miller, A. Ellis, and E. Muljadi, "Making Connections," IEEE
Power & Energy Magazine, pp. 28-37, November/December 2005.

39
[30] R. J. Koessler, S. Pillutla, L. H. Trinh and P. D. L. Dickmander, "Integration
of Large Wind Farms into Utility Grids (Part 1 - Modeling of DFIG)," in
Proc. 2003 IEEE Power Engineering Society General Meeting Conf, pp.
1512-1519.
[31] P. Pourbeik, R. J. Koessler, D. L. Dickmander, and W. Wong, "Integration of
Large Wind Farms into Utility Grids (Part 2 - Performance Issues)," in Proc.
2003 IEEE Power Engineering Society General Meeting Conf, pp. 1520-1525.
[32] N. W. Miller, J. J. Sanchez-Gasca, W. W. Price and R. W. Delmerico,
"Dynamic modeling of GE 1.5 and 3.6 MW wind turbine generators for
stability simulations," in Proc. IEEE PES General Meeting, July 2003,
Toronto pp. 1977-1983.
[33] T. Thiringer and J. A. Dahlberg, "Periodic Pulsations from a Three-Bladed
Wind Turbine," IEEE Trans, on Energy Conversion, vol. 16, no. 2, pp. 128-
133, June 2001.
[34] E. N. Hinrichsen and P. J. Nolan, "Dynamics and Stability of Wind Turbine
Generators," IEEE Trans, on Power Apparatus and Systems, vol. PAS-101,
no. 8, pp. 2640-2648, Aug. 1982.
[35] P.M. Anderson and A. Bose, "Stability Simulation of Wind Turbine Systems,"
IEEE Transactions on Power Apparatus and Systems, vol.PAS-102, no. 12,
pp.3791-3795,Dec. 1983.
[36] A. Murdoch, J.R. Winkelman, S.H. Javid, R.S. Barton, "Control Design and
Performance Analysis of a 6 MW Wind Turbine-Generator," IEEE
Transactions on Power Apparatus and Systems, vol.PAS-102, no.5, pp.1340-
1347, May 1983.
[37] N. G. Hingorani and L. Gyugyi, Understanding FACTS, IEEE Press, 1996.
[38] R.M. Mathur and R.K. Varma, Thyristor-Based FACTS Controllers for
Electrical Transmission Systems IEEE Press and Wiley Interscience, New
York, USA, Feb. 2002.
[39] N. G. Hingorani, "Role of FACTS in a deregulated market," Power
Engineering Society Summer Meeting, vol. 3, pp. 1463 - 1467, 16-20 July.
2000.
[40] J. H. Chow and J. J. Sanchez-Gasca, "Pole-placement designs of power system
stabilizers," IEEE Trans. Power Syst, vol. 4, no. 1, pp. 271-277, Feb. 1989.

40
[41] M. E. Abul-Ela, A. A. Sallam, J. D. McCally and A. A. Fouad, "Damping
controller design for power system oscillations using global signals," IEEE
Trans. Power Syst, vol. 11, no. 2, pp. 767-772, May. 1996.
[42] K. R. Padiyar and R. K. Varma, "Damping torque analysis of static var system
controllers," IEEE Trans. Power Syst, vol. 6, no. 2, pp. 458-465, May. 1991.
[43] N. Noroozian and G. Andersson, "Damping of power system oscillations by
use of controllable components," IEEE Trans. Power Delivery, vol. 9, no. 4,
pp. 2046-2054, Oct. 1994.
[44] Q. Zhao and J. Jiang, "Robust SVC controller design for improving power
system damping," IEEE Trans. Power Syst., vol. 10, no. 4, pp. 1927-1932,
Nov. 1995.
[45] E. V. Larsen, J. J. Sanchez-Gasca and J. H. Chow, "Concepts for design of
FACTS controllers to damp power swings," IEEE Trans. Power Systems., vol.
10, no. 2, pp. 948-956, May. 1995.
[46] M. Klein, L. X. Le, G. J. Rogers, S. Farrokhpay and N. J. Balu, "Hm damping
controller design in large power systems," IEEE Trans. Power Syst., vol. 10,
no. l ,pp. 158-166, Feb. 1995.
[47] G. N. Taranto and J. H. Chow, "A robust frequency domain optimization
technique for tuning series compensation damping controllers," IEEE Trans.
Power Syst., vol. 10, no. 3, pp. 1219-1225, Aug. 1995.
[48] P. Shrikant and I. Sen, "Robust pole placement stabilizer design using Linear
Matrix Inequalities," IEEE Trans. Power Syst, vol. 15, no. 1, pp. 313-319,
Feb. 2000.
[49] M. Djukanovic, M. Khammash and V. Vittal, "Application of the structured
singular value theory for robust stability and control analysis in multi-machine
power systems part-I: framework development," IEEE Trans. Power Syst,
vol. 13, no. 4, pp. 1311-1316, Nov. 1998.
[50] M. Djukanovic, M. Khammash and V. Vittal, "Application of the structured
singular value theory for robust stability and control analysis in multi-machine
power systems part-II: numerical simulations and results," IEEE Trans. Power
Syst, vol. 13, no. 4, pp. 1317-1322, Nov. 1998.
[51] M. Noroozian, M. Ghandhari, G. Andersson, J. Gronquist and I. Hiskens, "A
robust control strategy for shunt and series reactive compensators to damp
41
electromechanical oscillations," IEEE Trans. Power Delivery, vol. 16, no. 4,
pp. 812-817, Oct. 2001.
[52] B. C. Pal, A. H. Coonick and D. C. Macdonald, "Robust damping controller
design in power systems with superconducting magnetic energy storage
devices," IEEE Trans. Power Syst., vol. 15, no. 1, pp. 320-325, Feb. 2000.
[53] X. Yu, M. Khammash and V. Vittal, "Robust design of a damping controller
for static var compensators in power systems," IEEE Trans. Power Syst., vol.
16, no. 3, pp. 456-462, Aug. 2001.
[54] M. Yue and R. Schlueter, "u-synthesis power system stabilizer design using a
bifurcation subsystem based methodology," IEEE Trans. Power Syst, vol. 18,
no. 4, pp. 1497-1505, Nov. 2003.
[55] B. Chaudhuri, B. C. Pal, A. C. Zolotas, I. Jaimoukha and T. Green, "Mixed-
sensitivity approach to Hoo control of power system oscillations employing
multiple FACTS devices," IEEE Trans. Power Syst., vol. 18, no. 3, pp. 1149-
1156, Aug. 2003.
[56] B. Chaudhuri and B. C. Pal, "Robust damping of multiple swing modes
employing global stabilizing signals with a TCSC," IEEE Trans. Power Syst,
vol. 19, no. 1, pp. 499-506, Feb. 2004.
[57] Y. H. Song, R. K. Aggarwal and A. T. Johns, "Nonlinear thyristor control
SVC control for power system stability enhancement," in IEEE TENCON pp.
19-22 1993.
[58] M. Noroozian, L. Angquist, M. Ghandhari and G. Andersson, "Improving
power system dynamics by series connected FACTS devices," IEEE Tans.
Power Delivery, vol. 12, no. 4, pp. 1635-1641, Oct. 1997.
[59] M. Sekoguchi, H. Konishi, M. Goto, A. Yokoyama and Q. Lu "Nonlinear
optimal control applied to STATCOM for power system stabilization," in
PESC General Meeting, pp. 342-347.
[60] M. Ghandhari, G. Andersson and I. Hiskens, "Control Lyapunov functions for
controllable series devices," IEEE Trans. Power Syst, vol. 16, no. 4, pp. 689-
694, Nov. 2001.
[61] G. Escobar, P. Mattavelli and R. Ortega, "On the nonlinear control of TCSC,"
in Proc. of the 35th HICSS-35 2002.
42
[62] N. G. Bretas and L. F. C. Alberto, "Lyapunov function extension for power
systems with transfer conductances: extension of the invariance principle,"
IEEE Trans. Power Syst, vol. 18, no. 3, pp. 769-777, May. 2003.
[63] R. A. Ramos, L. F. C. Alberto and N. G. Bretas, "A new methodology for the
coordinated design of robust decentralized power system damping
controllers," IEEE Trans. Power Syst, vol. 19, no. 1, pp. 444-454, Feb. 2004.
[64] I. Kamwa, G. Trudel and D. Lefebvre, "Optimization-based tuning and
coordination of flexible damping controllers for bulk power systems," Proc. of
the 1999 IEEE International Conference on Control Applications, pp. 826-
832.
[65] X. Lei, E. N. Lerch and D. Povh, "Optimization and coordination of damping
controls for improving system dynamic performance," IEEE Trans. Power
Syst, vol. 16, no. 3, pp. 473-480, Aug. 2001.
[66] Y. L. Abdel-Magid and M. A. Abido, "Optimal multiobjective design of
robust PSS using genetic algorithm," IEEE Trans. Power Syst, vol. 18, no. 3,
pp. 1125-1132, Aug. 2003.
[67] I. Kamwa, R. Grondin and Y. Hebert, "Wide-area measurement based
stabilizing control of large power systems-a decentralized/hierarchical
approach," IEEE Trans. Power Syst, vol. 16, no. 1, pp. 136-153, Feb. 2001.
[68] S. H. Horwitz and A. G. Phadke, "Boosting immunity to blackouts," IEEE
Power & Energy Magazine, September/October 2003 Page 47-53.
[69] F. J. Martin, F. Garcia. Lagos, G. Joya and F. Sandoval, "Genetic Algorithms
for Optimal Placement of Phasor Measurement units in Electric Networks,"
Electronic Letters Vol. 39, No. 19, 18th September 2003.
[70] I. Kamwa and R. Grondin, "P.M.U Configuration for System Dynamic
Performance Measurement in Large Multi-area Power Systems", IEEE Trans.
Power Syst, May 2002 Vol. 17 No. 2, May 2002 Page 385-394.
[71] R. F. Nuqui and A. G.Phadke, "Phasor Measurement Unit Placement Based on
Incomplete Observability", PESC General Meeting 2002 Page 888-893.
[72] E.W. Palmer and G. Ledwich, "Optimal Placement of Angle Transducers in
Power Systems," IEEE Trans. Power Syst, Vol. 2, No. 2, May 1996 Page
788-793.
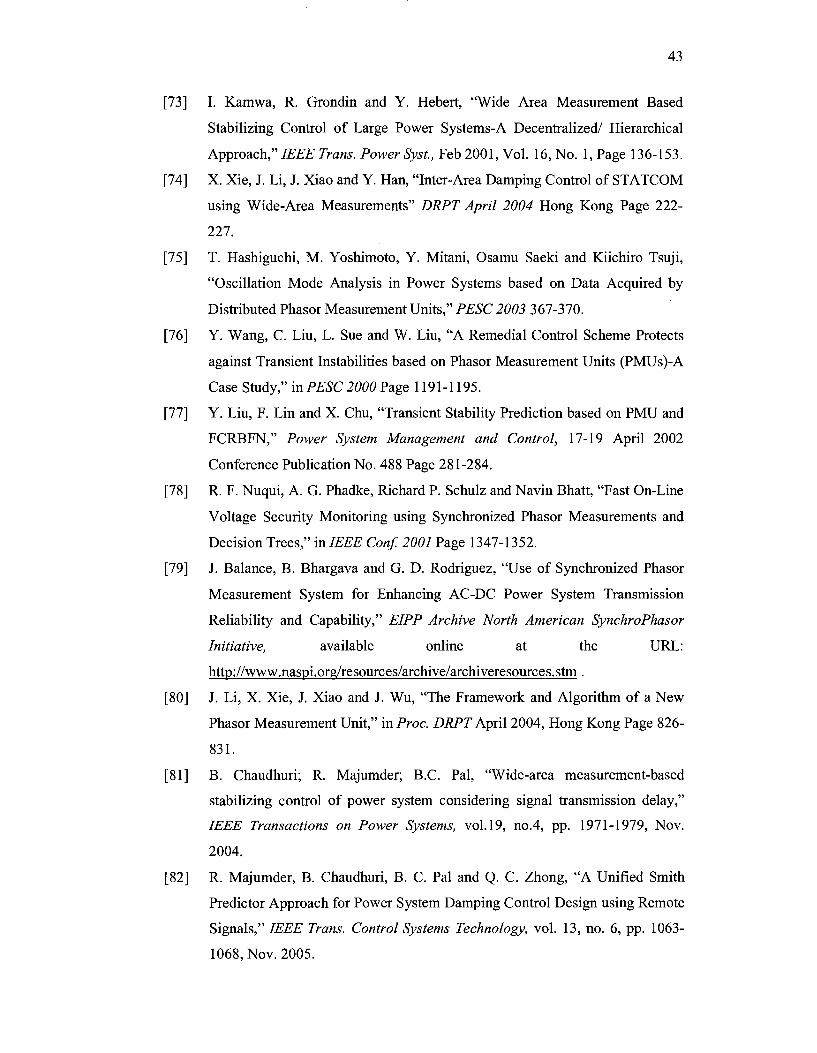
43
[73] I. Kamwa, R. Grondin and Y. Hebert, "Wide Area Measurement Based
Stabilizing Control of Large Power Systems-A Decentralized/ Hierarchical
Approach," IEEE Trans. Power Syst, Feb 2001, Vol. 16, No. 1, Page 136-153.
[74] X. Xie, J. Li, J. Xiao and Y. Han, "Inter-Area Damping Control of STATCOM
using Wide-Area Measurements" DRPT April 2004 Hong Kong Page 222-
227.
[75] T. Hashiguchi, M. Yoshimoto, Y. Mitani, Osamu Saeki and Kiichiro Tsuji,
"Oscillation Mode Analysis in Power Systems based on Data Acquired by
Distributed Phasor Measurement Units," PESC 2003 367-370.
[76] Y. Wang, C. Liu, L. Sue and W. Liu, "A Remedial Control Scheme Protects
against Transient Instabilities based on Phasor Measurement Units (PMUs)-A
Case Study," in PESC 2000 Page 1191 -1195.
[77] Y. Liu, F. Lin and X. Chu, "Transient Stability Prediction based on PMU and
FCRBFN," Power System Management and Control, 17-19 April 2002
Conference Publication No. 488 Page 281-284.
[78] R. F. Nuqui, A. G. Phadke, Richard P. Schulz and Navin Bhatt, "Fast On-Line
Voltage Security Monitoring using Synchronized Phasor Measurements and
Decision Trees," in IEEE Conf. 2001 Page 1347-1352.
[79] J. Balance, B. Bhargava and G. D. Rodriguez, "Use of Synchronized Phasor
Measurement System for Enhancing AC-DC Power System Transmission
Reliability and Capability," EIPP Archive North American SynchroPhasor
Initiative, available online at the URL:
http://www.naspi.org/resources/archive/archiveresources.stm.
[80] J. Li, X. Xie, J. Xiao and J. Wu, "The Framework and Algorithm of a New
Phasor Measurement Unit," in Proc. DRPT April 2004, Hong Kong Page 826-
831.
[81] B. Chaudhuri; R. Majumder; B.C. Pal, "Wide-area measurement-based
stabilizing control of power system considering signal transmission delay,"
IEEE Transactions on Power Systems, vol.19, no.4, pp. 1971-1979, Nov.
2004.
[82] R. Majumder, B. Chaudhuri, B. C. Pal and Q. C. Zhong, "A Unified Smith
Predictor Approach for Power System Damping Control Design using Remote
Signals," IEEE Trans. Control Systems Technology, vol. 13, no. 6, pp. 1063-
1068, Nov. 2005.

44
[83] A. E. Hammad and M. El-Sadek, "Application of a Thyristor Controlled VAR
Compensator for Damping Subsynchronous Oscillations in Power Systems,"
IEEE Trans, on Power Apparatus and Systems, vol. PAS-1-3, no. 1, pp. 198-
212, Jan. 1984.
[84] N.C. Abi Samra, R.F. Smith, T.E. McDermott and M.B. Chidester, "Analysis
of Thyristor Controlled Shunt SSR Counter Measures", IEEE Transactions on
Power Apparatus and Systems, Vol. 104, No.3, pp. 584-597, Mar 1985.
[85] D.G. Ramey, D.S. Kimmel, J.W. Dorney and F.H. Kroening, "Dynamic
Stabilizer Verification Tests at the San Juan Station", IEEE Transactions on
Power Apparatus and Systems, vol.100, pp. 5011-5019, Dec. 1981.
[86] K. R. Padiyar and R. K. Varma, "Static Var System Auxiliary Controller for
Damping Torsional Oscillations," International Journal of Power and Energy
Systems, Vol. 12, No. 4, pp. 271-286, October 1990.
[87] K. R. Padiyar, R. K. Varma, S. Gupta, and M. Kumar, "A Novel Static Var
System Control for damping Subsynchronous Oscillations," Proceedings of
VII National Power System Conference, New Delhi, India, December 1994,
pp. 331-335.
[88] W. Zhu, R. Spee, R.R. Mohler, G.C. Alexander, W.A. Mittelstadt, D.
Maratukulam, "An EMTP Study of SSR Mitigation Using the Thyristor
Controlled Series Capacitor", IEEE Transactions on Power Delivery, Vol. 10,
No. 3, pp. 1479-1485, July 95.
[89] J.F. Hauer, W.A. Mittelstadt, R.J. Piwko, B.L. Damsky, and J.D. Eden,
"Modulation and SSR Tests Performed on the BPA 500kV Thyristor
Controlled Series Capacitor Unit at Slatt Substation", IEEE Trans. Power
Systems, vol. 11, No.2 May 1996, pp. 801-06.
[90] R. Rajaraman; I. Dobson,, "Damping estimates of subsynchronous and power
swing oscillations in power systems with thyristor switching devices," IEEE
Transactions on Power Systems, vol.11, no.4, pp. 1926-1930, Nov 1996.
[91] R. Rajaraman; I. Dobson; R.H. Lasseter; S. Yihchih, "Computing the damping
of subsynchronous oscillations due to a thyristor controlled series capacitor,"
IEEE Transactions on Power Delivery, vol.11, no.2, pp.1120-1127, Apr 1996.

CHAPTER 2
Damping of Inter-Area Oscillation in Power
Systems by Static Var Compensator (SVC) Using
PMU Acquired Remote Bus Voltage Angles
2.1 Introduction
Electromechanical oscillations (0.1 to 2.0 Hz) are phenomena inherent to power
systems [1]. There are mainly two types of electromechanical oscillations involved in
power systems: one associated with a single generator or a single plant called local mode
oscillation (0.8 to 2.0 Hz) and the other related to a group of generators or group of plants
called inter-area oscillation (0.1 to 0.8 Hz) [1]. Conventionally, Power System Stabilizers
(PSS) are used to damp electro-mechanical oscillations [2], [3]. However, PSS is more
effective in damping local mode oscillations as compared to inter-area mode oscillations
[4].
Flexible AC Transmission System (FACTS) Controllers are effective means of
damping low frequency inter-area oscillations following a disturbance in power systems
[5], [6]. Static Var Compensators (SVC) are a class of FACTS Controllers that are widely
used in power systems for voltage control as well as for damping enhancement using
auxiliary control signals [7]. An additional controller called power swing damping
controller (PSDC) is separately designed to increase the damping of the system.
Traditionally, local signals such as, bus frequency, line active power and line current
magnitude, are utilized to increase the modal damping of the power system, for ease of

46
availability and high reliability. However, local signals usually do not have information
about the entire modal dynamics of the power system. This provided the motivation to
adopt remote/global signals. Since transmission of remote signals posed problems in the
past, remote signals have been synthesized using local measurements [8]-[ll] to improve
the damping of inter-area modes in power systems.
The aggregate machine angles of the coherent areas are synthesized using local
voltages and current measurements, and assuming equivalent impedances [6], [8]
between aggregate generator bus and the bus where FACTS Controller is connected. It is
to be noted that the estimated value of the equivalent impedance should be close enough
to the actual one in order to get satisfactory response of power swing damping control.
Thevenin's voltage at the SVC bus has been used as a control input signal to the PSDC
loop of the SVC installed on the 500 kV transmission line between Arizona and
California [9]. The Thevenin's voltage is synthesized using local measurements and the
estimated value of the Thevenin's equivalent impedance seen from the SVC bus. In
another scheme for system damping, the SVC is made to use the phase angle signal (bus
voltage angle of the generator relative to the SVC bus) as a feedback signal. This signal is
synthesized using local measurement of voltage and power at the SVC location [10]. An
auxiliary signal designated Computed Internal Frequency (CIF) is reported in [11] which
synthesizes internal voltage frequency of the remote generator from electrical
measurements at the SVC bus. hi general, the mechanisms to synthesize remote signals
using local measurements on the SVC location are dependent on the exact knowledge of
intervening impedance between the SVC bus and the generator bus. If the actual
generator and SVC are connected on the same line, the computation becomes complex
due to the presence of intermediate loads. Despite being more effective than local signals,
the synthesized signals, at best, give only an indirect estimation of the oscillations of
generator rotor.
In the last few years, due to rapid advancements in wide area measurement (WAM)
technology [12], [13] remote signals such as remote line currents, remote line power,
remote bus frequency, etc. have been actively considered as control input signals for

47
auxiliary damping controllers of FACTS devices [14] - [17]. In general, the choice of
control signals plays a key role in the effective damping of inter-area oscillations in
power systems [18]. The chosen control input signal should have high modal content of
particular mode of interest. Also, there is a need to address the issue of delay introduced
while transmitting the signals from remote site to the location of FACTS Controller.
In view of the above, the motivation for the damping concept proposed in this chapter
is as follows. Inter-area oscillations are essentially caused by the oscillations of the
generators. Hence the ideal control signals for damping inter-area oscillations would be
the rotor angles of the key generators that participate in inter-area oscillations. It is noted
that the voltage angle of a generator bus closely follows the rotor angle of the generator
itself. Therefore, intuitively, it seems that the bus voltage angle most closely represents
the rotor angle signal as compared to any other signal. While it may not be possible to
transmit these generator rotor angles to remotely located FACTS Controllers, it may be
easier to transmit the generator bus voltage angles utilizing the Wide Area Measurement
(WAM) technology through Phasor Measurement Units (PMUs) [13].
In this chapter, the proposed concept of SVC damping control based on a weighted
sum of the derivatives of voltage angles of relevant remote generator buses is compared
with SVC control based on the conventional local line current signal for damping inter-
area oscillations in a 39-bus multi machine system. Eigenvalue study is carried out using
SSAT/DSA software [19] to analyze the modal behavior of the system and also to design
the SVC auxiliary control. An electromagnetic transient simulation study is then
conducted using PSCAD/EMTDC software [20] to validate the results of eigenvalue
study. An effective control strategy to compensate the delay in the transmission of remote
bus voltage phasors is also presented. The designed compensator is shown to be robust
enough to handle signal transmission delays over a wide range.
The organization of the chapter is as follows. Section 2.2 shows the mathematical
relationship between the generator load angle and bus voltage angle. The system
modeling for eigen value analysis is briefed in section 2.3. Section 2.4 describes the
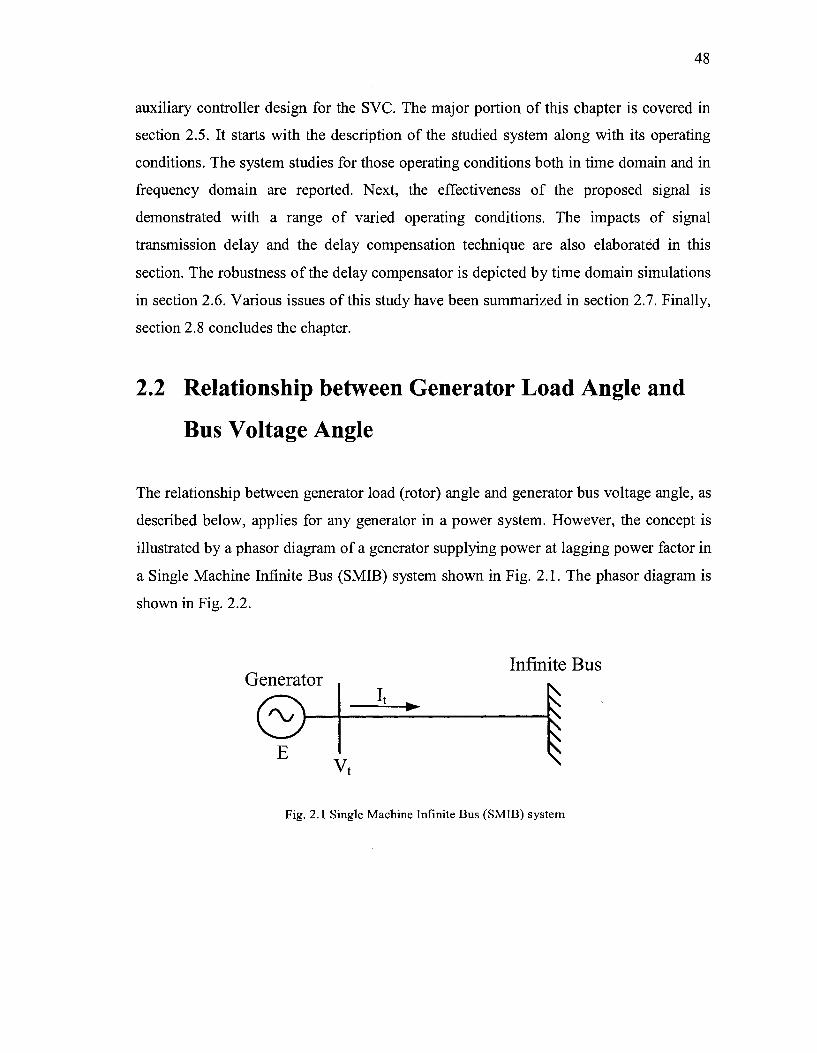
48
auxiliary controller design for the SVC. The major portion of this chapter is covered in
section 2.5. It starts with the description of the studied system along with its operating
conditions. The system studies for those operating conditions both in time domain and in
frequency domain are reported. Next, the effectiveness of the proposed signal is
demonstrated with a range of varied operating conditions. The impacts of signal
transmission delay and the delay compensation technique are also elaborated in this
section. The robustness of the delay compensator is depicted by time domain simulations
in section 2.6. Various issues of this study have been summarized in section 2.7. Finally,
section 2.8 concludes the chapter.
2.2 Relationship between Generator Load Angle and
Bus Voltage Angle
The relationship between generator load (rotor) angle and generator bus voltage angle, as
described below, applies for any generator in a power system. However, the concept is
illustrated by a phasor diagram of a generator supplying power at lagging power factor in
a Single Machine Infinite Bus (SMIB) system shown in Fig. 2.1. The phasor diagram is
shown in Fig. 2.2.
Generator
©-E
It
Vt
Infinite Bus
-i Fig. 2.1 Single Machine Infinite Bus (SMIB) system

49
'c
E / where, V, = generator terminal voltage It = generator current E = internal voltage Ra = winding resistance X, =generator d-axis reactance 8= generator load angle q>= generator power factor angle 9= generator bus voltage angle d-axis = generator d-axis q-axis = generator q-axis D-axis = system D-axis Q-axis = system Q-axis
q-axis
s 'Q-axis
Fig 2.2 Phasor diagram
The generator bus voltage angle 0 is related to the generator load angle 8 as
, \I. \Xncos(p-\I, |i?„sin<2? 0 = o+cot H
Vt I + I It\ Ra C0S<P+ I h I Xq
S i n ^ (2.1)
Eq. (2.1) reveals that the generator bus voltage angle 9 varies linearly with the
generator load angle 5. It also implies that the derivative signal d9/dt follows d8/dt (the
speed oo) of the generator. Hence, 8 and co will be observable in 0 and its derivative
(d0/dt), respectively. The generator bus voltage angle (0) can be easily calculated by
phasor measurement unit and transmitted to the location of damping controller almost in
the real time using the wide area measurement (WAM) techniques. This relationship
between d0/dt and co is validated through time domain simulation using PSCAD/EMTDC
software in 39-bus New England system later in this chapter.

50
2.3 System Modeling for Eigenvalue Analysis
Eigenanalysis is conducted using SSAT/DSA software [19]. In these linear system
analyses, the synchronous generators are represented by their detailed flux linkage model
with one damper winding on d-axis and two damper windings on q-axis [2]. Exciters are
modeled according to IEEE Type-1 model [2]. The SVC is modeled as a thyristor
switched capacitor (TSC) connected in parallel with thyristor controlled reactor (TCR).
SVC voltage regulator is modeled as a PI (proportional integral) controller with SVC
slope reactance.
The linearized model of the ac network is expressed as:
AI=[Y]AV (2.2)
Here AI denotes the vector of incremental bus current injections obtained as the output
of the dynamic device models. AV denotes the vector of incremental bus voltages. [Y] is
the bus admittance matrix for the system.
The overall model of the SVC compensated system is given as:
d/dt (AX) = [Asys] AX (2.3)
Here, [Asys] is the overall system state matrix which is computed by SSAT [19].
2.3.1 Eigenvalues of the State Matrix and Participation Factors
The eigenvalues of the state matrix Asys and the corresponding eigenvectors are
defined by the following equations:
Asys(p = hp
y/Asys=Xy/ (2.4)
In this equation:

51
X is an eigenvalue of the state matrix Asys;
<p is the right eigenvector associated with X;
y is the left eigen vector associated with X
The modal matrices comprising the left and right eigenvectors are given below:
€> = [(/>! (p2 (f>n\
V = [VlV2 VnV (2.5)
A mode is related to the individual state variables by: Z/0 = VjlXl(t)+ Wj2X2(t) + + VjiXi(t) + HfjnXn(t) (2.6)
Here x, is the state variable and y/p is the ith element in the left eigenvector y/y
One problem in using directly the left eigenvector to quantitatively determine the
contribution of a state variable to a mode is that the elements of the left eigenvector are
dependent on units and scaling. The solution is to weight the left eigenvector by the right
eigenvector to obtain a quantity independent of unit and scaling which is expressed by the
following equation:
Pjt= ¥0ji (2-7)
Pp is the participation factor. Participation factors measure the participation of state
variables in modes. For instance, the larger the value of pji the more the state variable xt
participates in the j t h mode.
The eigenvalues of system state matrix reveal the modal behavior of the system.
Modal damping, if less than 2% [2, 4], needs to be improved for power system stability.
In this chapter, SVC auxiliary control with PMU-acquired bus voltage angle as a
feedback signal is proposed, designed and utilized to improve the damping of inter-area
oscillations.

52
2.4 SVC Auxiliary Controller Design
SVC is mainly used to regulate the system bus voltage during disturbances in the
system. In addition, an auxiliary control loop is designed and added suitably to enhance
the modal damping of the system. The controller parameters are chosen using systematic
hit and trial method.
A typical structure of SVC auxiliary control loop used in this study is given in Fig. 2.3.
Measured!
Fig. 2.3 Structure of SVC auxiliary control
The measured signal is converted into its p. u. value and then processed through a 2nd
order low-pass filter to pass only the electromechanical signals (0.1 to 2.0 Hz), as shown
in Fig. 2.3. Subsequently, the filtered signal is transmitted to the lead/lag block through a
washout circuit 10s/ (l+10s). The purpose of washout circuit is to prevent the auxiliary
controller from responding to steady state power flow variations. The output of the
lead/lag block is then fed to SVC voltage regulator loop. A 3.0 % slope in SVC control
characteristic is considered in the present study.
2.5 System Studies
2.5.1 System Description
The New England power system consists of 39-bus and 10-generators as shown in Fig.
2.4 [22]. An SVC connected at bus 16 [24] is considered in the study to demonstrate the
efficacy of the proposed auxiliary signal in large, multi-machine power systems. The

53
rating of SVC is 300 MVAr capacitive and 200 MVAr inductive, as determined from
power flow studies [4].
Yi y i
G8
G10 Q
0 30
Gl © 39 t
37 25
T
26
T 17
T T 27
z 3
" J. 5
»?. 15
16
7
?T 14
TTTi © G2
12
11
10
28
24
29
38
i ys
13
32
0 G9
©G6
35
i21 22
19
0 0
20
~34
33
© G4
23
© G7
36
G3 G5
K : SVC auxiliary controller y1.y2.y3: Remote signals
Q. +. Remote signal transmission
Fig. 2.4 The New England system with SVC at bus 16
2.5.2 Operating Conditions
This study is carried out at a highly stressed system operating point in order to
demonstrate the effectiveness of SVC auxiliary control with the proposed feedback signal
which is the weighted sum of derivatives of the PMU-acquired remote generator bus
voltage angles. Both the generations and loads are increased by 150% to that given in
[22] in order to achieve a highly stressed operating state with negative system damping.
In this initial steady state, the SVC bus power is 890 MW with 354 MVAr reactive
power, both passing through bus 16 to buses 15 and 17. This initial steady state is chosen
identical to that in [24] in order to compare the performance results of different SVC
damping controllers.

54
2.5.3 Validation of the Relationship between Rotor Angle and
Generator Bus Angle
This relationship is demonstrated through time domain simulation using
PSCAD/EMTDC software in the 39-bus New England system. The plots of speed of
generator 1 and derivative of bus voltage angle of generator 1, both with respect to
generator 5, are shown in Fig. 2.5 and Fig 2.6 (a-c) without and with SVC auxiliary
control using the proposed feedback signal. The plots of the signals in Fig 2.6 (a), (b) and
(c) correspond to disturbances 1, 2 and 3, respectively. These disturbances, that are
considered to be critical, are defined as in [24]:
• Disturbance 1: A 3-phase short circuit occurs at bus 17 and cleared in 0.1 s without
line tripping.
• Disturbance 2: A 3-phase short circuit occurs at bus 3 and cleared in 0.14 s by
tripping lines 3-18.
• Disturbance 3: A sudden 75 % reduction of the load at bus 16 and restored in 1.0 s.
10
0.0008
0.0004 "
0.0 "
-0.0004"
A A
[ V V |
A A i
AA/v v \f\l
v V
i i
\f\f\M w yi I I i ^ ! V y I
20 30 40 50 60 70
Fig. 2.5 Comparison of actual speed signal co15 and the derivative of generator bus voltage angle dG^/dt
without SVC auxiliary control for disturbance 1

55
Time (s)
Fig. 2.6 Comparison of actual speed signal coI5 and the derivative of generator bus voltage angle d9i5/dt
with SVC auxiliary control for (a) disturbance 1; (b) disturbance 2; (c) disturbance 3
It is observed from Fig. 2.5 and Fig. 2.6 (a), (b) and (c) that derivative of generator bus
voltage angle (d9/dt) consistently follows the speed (co) of the generator for 150 %
loading both without and with SVC auxiliary control for all three disturbances in the
system. This validates the analytical relation between (8) and (0) given by Eq. (2.1).
2.5.4 Case Studies
To examine the effect of the SVC auxiliary control with the proposed feedback signal,
no other damping controllers such as PSS are included in the system. Various cases have
been studied on the 39-bus New England System as follows:
1) Without SVC auxiliary control.
2) With local line current signal.
56
3) With remote generator speed signal, and.
4) With proposed feedback signal (weighted sum of derivative of bus voltage
angles of remote generators) for SVC auxiliary control.
The SVC auxiliary control has been designed using a systematic hit and trial
procedure, as mentioned in the earlier section, to provide best possible damping and
minimum post-fault settling time in each case. The performance of the different SVC
auxiliary controllers is compared for all the three disturbances as described above. In
practice, the remote signal is transmitted to the SVC location through a communication
system, which causes a signal transmission delay. The study is extended to observe the
effect of delayed feedback signal on the performance of the SVC auxiliary control. A
simple lead compensator is proposed and designed in order to compensate the time delay
introduced by the remote transmission of the feedback signal. The eigenvalue analysis
and time domain simulation studies have been carried out using SSAT/DSA and
PSCAD/EMTDC software, respectively.
2.5.5 Eigenvalue Analysis
The complete lists of eigenvalues of the study system without SVC and with SVC
auxiliary control are calculated using SSAT/DSA software [19] and are shown in table
2.1 and 2.2 respectively. In this study, the generators are modeled as round rotor
synchronous machines with their 6th order dynamics. The models of the generators are
called 'GENROU' in SSAT. On the other hand, the exciters associated with each of the
generators are modeled as IEEE Type 1 Exciter. The exciter dynamics are modeled by 4th
order differential equations. The models of Type 1 exciters are called 'IEEET1'. The
SVC is represented with its 4th order dynamics representing its main voltage regulator
and the auxiliary controllers. The purpose of these tables 2.1 and 2.2 is to depict the
dominant modes and the maximum participating states corresponding to each of the
modes of the 10 machine 39 bus system with and without static VAR compensator
respectively.
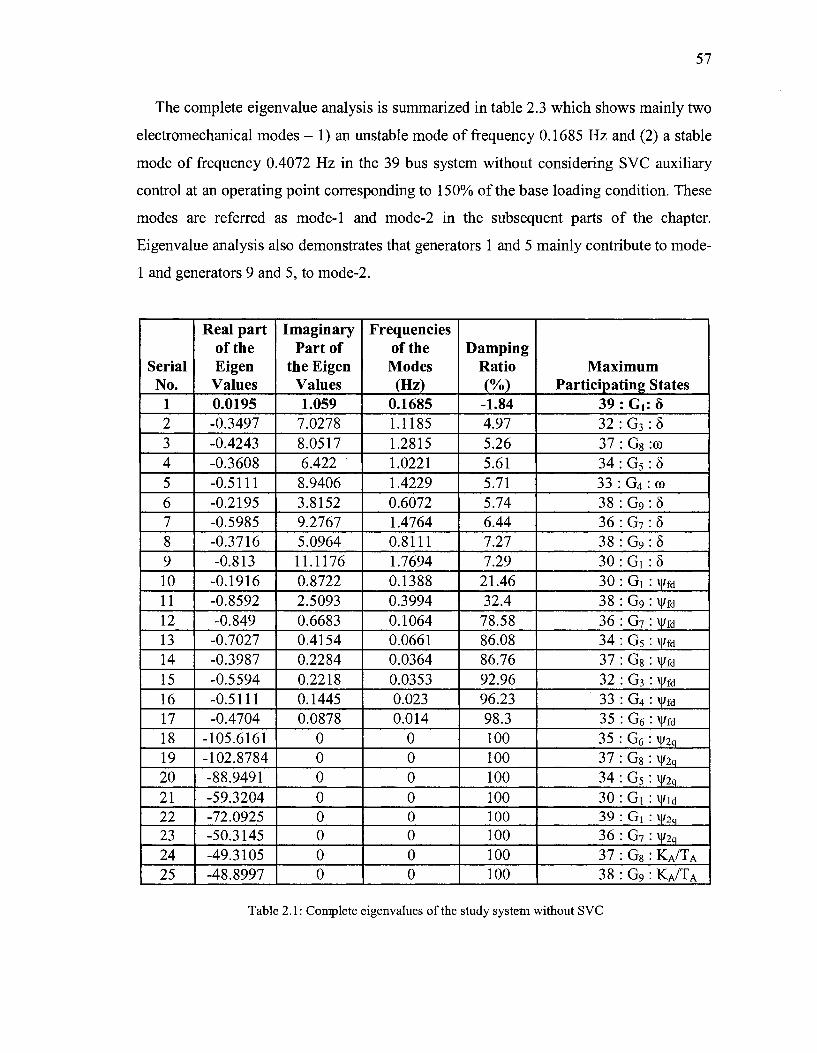
57
The complete eigenvalue analysis is summarized in table 2.3 which shows mainly two
electromechanical modes - 1) an unstable mode of frequency 0.1685 Hz and (2) a stable
mode of frequency 0.4072 Hz in the 39 bus system without considering SVC auxiliary
control at an operating point corresponding to 150% of the base loading condition. These
modes are referred as mode-1 and mode-2 in the subsequent parts of the chapter.
Eigenvalue analysis also demonstrates that generators 1 and 5 mainly contribute to mode-
1 and generators 9 and 5, to mode-2.
Serial No.
1 2 3 4 5 6 7 8 9 10 11 12 13 14 15 16 17 18 19 20 21 22 23 24 25
Real part of the Eigen Values 0.0195 -0.3497 -0.4243 -0.3608 -0.5111 -0.2195 -0.5985 -0.3716 -0.813
-0.1916 -0.8592 -0.849
-0.7027 -0.3987 -0.5594 -0.5111 -0.4704
-105.6161 -102.8784 -88.9491 -59.3204 -72.0925 -50.3145 -49.3105 -48.8997
Imaginary Part of
the Eigen Values 1.059
7.0278 8.0517 6.422 8.9406 3.8152 9.2767 5.0964 11.1176 0.8722 2.5093 0.6683 0.4154 0.2284 0.2218 0.1445 0.0878
0 0 0 0 0 0 0 0
Frequencies of the Modes (Hz)
0.1685 1.1185 1.2815 1.0221 1.4229 0.6072 1.4764 0.8111 1.7694 0.1388 0.3994 0.1064 0.0661 0.0364 0.0353 0.023 0.014
0 0 0 0 0 0 0 0
Damping Ratio (%) -1.84 4.97 5.26 5.61 5.71 5.74 6.44 7.27 7.29
21.46 32.4 78.58 86.08 86.76 92.96 96.23 98.3 100 100 100 100 100 100 100 100
Maximum Participating States
39 : d : 5 32:G 3
37:G 8
34:G 5
33 : G4 : 38 : G9
36:G 7
38:G 9
30:Gi 30:Gi 38:G 9
36:G 7
34:G 5
37:G 8
32:G 3
33 :G4
35:G 6
35:G 6
37:G 8
34 : G5
30:Gi 39:Gi 36:G 7
37:G 8
38:G 9
8 :co 8 CO
8 8 8 8
: Vffl
: Vfd
: \|/f<j
: Vfd : v|/fd
: Vfd
: Vfd
: Vfd
V2q V2q V2q Vld
: V2q
:V2q
• K A / T A
K A / T A
Table 2.1: Complete eigenvalues of the study system without SVC

58
Serial No. 27 28
30 31 32 33 34 35
36 37 38 39 40 41 42 43 44 45 46 47 48 49 50 51 52 53 54 55 56 57 58 59 60
Real part of the Eigen Values
-47.7653 -48.0822
-42.7212 -47.991 -37.55
-39.1301 -38.2032 -31.8657
-29.4538 -28.4531 -25.4776 -15.6083 -15.8891 -15.6611 -16.0649 -7.5432 -7.0018 -5.5787 -5.631
-4.1262 -4.2115 -3.4528 -3.5412 -2.5301 -0.1523 -1.5272 -1.4854 -1.3709 -1.4212 -1.1352 -1.0049 -0.9511 -0.969
Imaginary Part of
the Eigen Values
0 0
0 0 0 0 0 0
0 0 0 0 0 0 0 0 0 0 0 0 0 0 0 0 0 0 0 0 0 0 0 0 0
Frequencies of the Modes (Hz)
0 0
0 0 0 0 0 0
0 0 0 0 0 0 0 0 0 0 0 0 0 0 0 0 0 0 0 0 0 0 0 0 0
Damping Ratio (%) 100 100
100 100 100 100 100 100
100 100 100 100 100 100 100 100 100 100 100 100 100 100 100 100 100 100 100 100 100 100 100 100 100
Maximum Participating States
30 : d :\|/iq
34 : G5: KA/TA
34 : G5: yu
36 : G7 : KA/TA
33 : G4 : v|/id 36 : G7: \[/id
32 : G3: v|/ld
37 : G8: \|Md
35 : G6 : \|/id
32 : G3: y2q
39 : Gi : Via 32 : G3 : KA/TA
30 : Gi : KA/TA
33 : G4 : KA/TA
38 : G9: v|/2q 34 : G5: TE
34 : G5: \|/lq
37 : G8: \|/i„ 35 : G6: \|/iq
36 : G7 :TE
32 : G3: TE
35 : G6: TE
33 : G4 :TE
37 : G8 :TE
39 : G, : v|/fd
39 : d : V l q
30 : Gi :KF/TF
32 : G3: \|/)q
38 : G9: KF/TF
30 : Gi : v|/2q
38 : Go : v|/ia
36 : G7 : \|/iq
33 : G4 : \|/iq
Table 2.1 (Contd.)

59
Serial No.
1 2 3 4 5 6 7 8 9 10 11 12 13 14 15 16 17 18 19 20 21 22 23 24 25 26 27 28 29 30 31 32 33 34 35
Real part of the Eigen Values -0.0372 -0.3497 -0.4243 -0.3608 -0.5111 -0.2195 -0.5985 -0.3716 -0.813
-0.1916 -0.8592 -0.849
-0.7027 -0.3987
-45.5254 -0.5594 -0.5111 -0.4704
-105.6161 -102.8784 -88.9491 -59.3204 -72.0925 -50.3145 -49.3105 -48.8997 -49.2973 -47.7653 -48.0822 -42.4952 -42.7212 -47.991 -37.55
-39.1301 -38.2032
Imaginary Part of
the Eigen Values 1.0298 7.0278 8.0517 6.422 8.9406 3.8152 9.2767 5.0964 11.1176 0.8722 2.5093 0.6683 0.4154 0.2284
24.9718 0.2218 0.1445 0.0878
0 0 0 0 0 0 0 0 0 0 0 0 0 0 0 0 0
Frequencies of the Modes
(Hz) 0.1639 1.1185 1.2815 1.0221 1.4229 0.6072 1.4764 0.8111 1.7694 0.1388 0.3994 0.1064 0.0661 0.0364 3.9744 0.0353 0.023 0.014
0 0 0 0 0 0 0 0 0 0 0 0 0 0 0 0 0
Damping Ratio
(%) 3.61 4.97 5.26 5.61 5.71 5.74 6.44 7.27 7.29
21.46 32.4
78.58 86.08 86.76
87.68 92.96 96.23 98.3 100 100 100 100 100 100 100 100 100 100 100 100 100 100 100 100 100
Maximum Participating States
39 : d : 8 32 : G 3 : 5 37 : G8 :oo 34 : G 5 : 8 33 : G4 : to 38 : G 9 : 8 36 : G 7 : 8 38 : G 9 : 8 30 : Gi :8 30 : Gi : \\>m 38 : G9 : v|/fd
36 : G 7 : v|/fd
34 : G 5 : \|/H
37 : G 8 : \|/fd 16 SVC:Bi 3 2 : G 3
3 3 : G 4
3 5 : G 6
35 : G 6 : 37 : G 8 : 34 : G 5 : 30 : Gi : 39 : Gi : 36 : G 7 : 37 : G 8 : 38 : G9 : 35 : G 6 : 30 : Gi : 34 : G5 :
3 8 : G 9
3 4 : G 5
3 6 : G 7
3 3 : G 4
3 6 : G 7
3 2 : G 3
Vfd Vfd
Vfd ¥2q ¥2q V2q
Vld ¥2q V2q KA/TA
KA/TA
KA/TA
Ylq KA/TA
Via Via
: KA/TA
: Vid : Via
: Vid
Table 2.2: Complete eigenvalues of the study system with SVC auxiliary control with optimal weights

60
Serial No. 36 37 38 39 40 41 42 43 44 45 46 47 48 49 50 51 52 53 54 55 56 57 58 59 60 61 62 63
Real part of the Eigen Values
-31.8657 -29.4538 -28.4531 -25.4776 -15.6083 -15.8891 -15.6611 -16.0649 -7.5432 -7.0018 -5.5787 -5.631
-4.1262 -4.2115 -3.4528 -3.5412 -2.5301 -0.1523 -1.5272 -1.4854 -1.3709 -1.4212 -1.1352 -1.0049 -0.9511 -0.969 -10000 -312.5
Imaginary Part of
the Eigen Values
0 0 0 0 0 0 0 0 0 0 0 0 0 0 0 0 0 0 0 0 0 0 0 0 0 0 0 0
Frequencies of the Modes (Hz)
0 0 0 0 0 0 0 0 0 0 0 0 0 0 0 0 0 0 0 0 0 0 0 0 0 0 0 0
Damping Ratio (%) 100 100 100 100 100 100 100 100 100 100 100 100 100 100 100 100 100 100 100 100 100 100 100 100 100 100 100 100
Maximum Participating States
37 : G8: v|/id
35 : G6 : v|/ld
32 : G3 : y2q
39 : Gi : \|/ld
32 : G3 : KA/TA
30 : Gi : KA/TA
33 : G4 : KA/TA
38 : G9 : \|/2q
34 : G5: TE
34 : G5: y l q
37 : G8: yiq 35 : G6 : \|/iq
36 : G7 :TE
32 : G3: TE
35 : G6 : TE
33 : G4 :TE
37 : G8 :TE
39 : Gi : v|/fd
39 : Gi : ViQ
30 : Gi :KF/TF
32 : G3: \|/iq
38 : G9 : KF/TF
30 : Gi : \|/2q
38 : G9: \|/iq
36 : G7 : \|/iq
33 : G4 : \|/iq
16 :SVC: B3
16 :SVC: B4
Table 2.2 (Continued)
To verify the modes found from eigenvalue study, time domain simulations have been
carried out at 150% loading condition. In these simulations depicted in Fig. 2.7, a three
phase fault at bus 17 (disturbance 1) is considered to excite electromechanical modes in
the system. Mainly two modes are observed - (i) 0.16 Hz and (ii) 0.4 Hz. The mode
corresponding to 0.4 Hz decays out in a few seconds after the disturbance while the mode
corresponding to 0.16 Hz continues to grow in the absence of SVC auxiliary control.

61
SI. No.
1
2 (i) (ii)
(iii) (iv) (v) (vi)
Cases
without SVC auxiliary control
Modes Frequency
(Hz) 0.1685 0.4072
Damping (%) -1.84 5.74
with SVC auxiliary control using remote generator speed signal (co) remote generator bus angle derivative signal (dG/dt) local line current signal (I) local line power flow signal (P) d9/dt signal with transmission delay d0/dt signal with transmission delay and lead compensator
0.1629 0.1639
0.1663 0.1673 0.1783 0.1639
3.61 3.61
1.39 0.58 -0.39 3.61
Table 2.3 Damping ratios and frequencies of Critical Inter-area mode
for 150 % loading in 39-Bus System
The plot of SVC bus power in Fig. 2.7 shows the unstable behavior of the system at
150% loading. The speeds of all the generators, after the mode corresponding to 0.4 Hz
has decayed out, are shown in Fig. 2.8. The following observations are made:
• System is unstable at 150 % loading condition.
• Generators 2 to 10 are swinging against generator 1.
• Frequency of oscillation is 0.16 Hz.
• Magnitude of oscillation in the speed of Generator 5 is the maximum as compared
to that of other generators.
The above observations confirm the presence of one electromechanical mode of
frequency 0.16 Hz with negative damping obtained from eigenvalue study. The major
contribution of Generators 1 and 5 to this mode is also established. Since the mode
corresponding to 0.4 Hz decays out even without SVC auxiliary control, the positive
damping of this mode, as obtained from the eigenvalue study, is also confirmed.
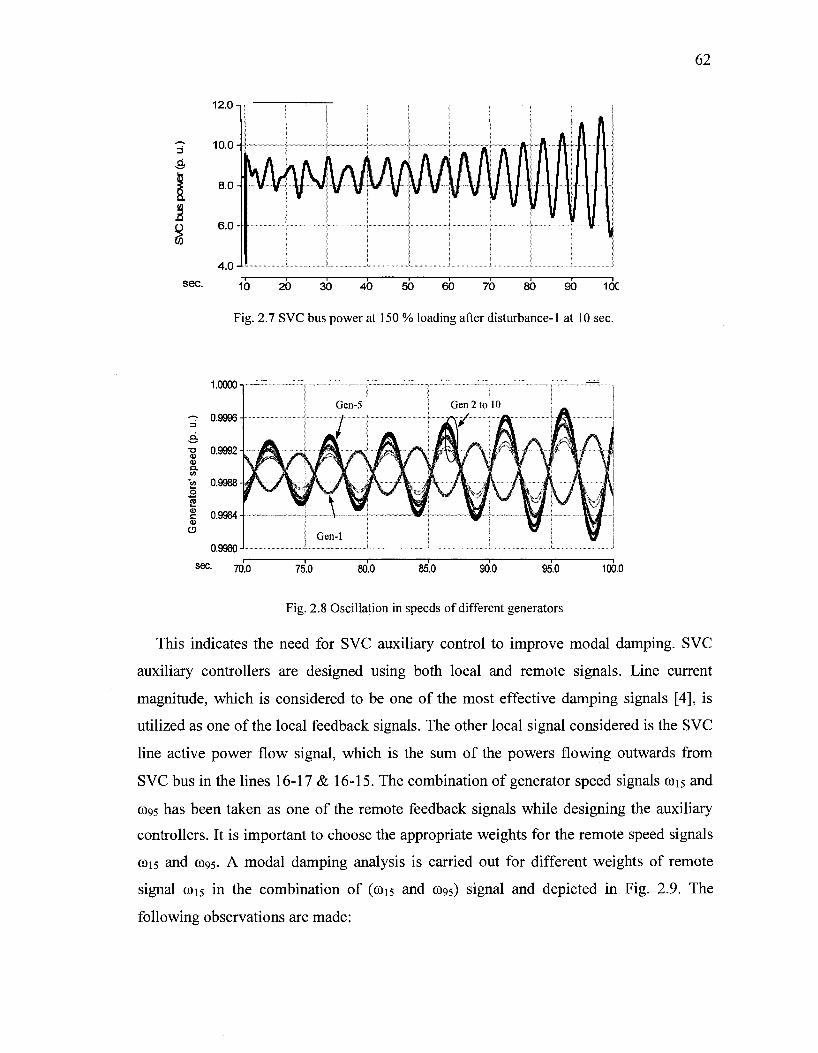
62
10 20 30 40 50 i o 70 80 90 IOC
Fig. 2.7 SVC bus power at 150 % loading after disturbance-1 at 10 sec.
7CL0 7^0 8O0 85^0 9O0 95^0 100.0
Fig. 2.8 Oscillation in speeds of different generators
This indicates the need for SVC auxiliary control to improve modal damping. SVC
auxiliary controllers are designed using both local and remote signals. Line current
magnitude, which is considered to be one of the most effective damping signals [4], is
utilized as one of the local feedback signals. The other local signal considered is the SVC
line active power flow signal, which is the sum of the powers flowing outwards from
SVC bus in the lines 16-17 & 16-15. The combination of generator speed signals coi5 and
CO95 has been taken as one of the remote feedback signals while designing the auxiliary
controllers. It is important to choose the appropriate weights for the remote speed signals
CO15 and CO95. A modal damping analysis is carried out for different weights of remote
signal CO15 in the combination of (CO15 and CO95) signal and depicted in Fig. 2.9. The
following observations are made:
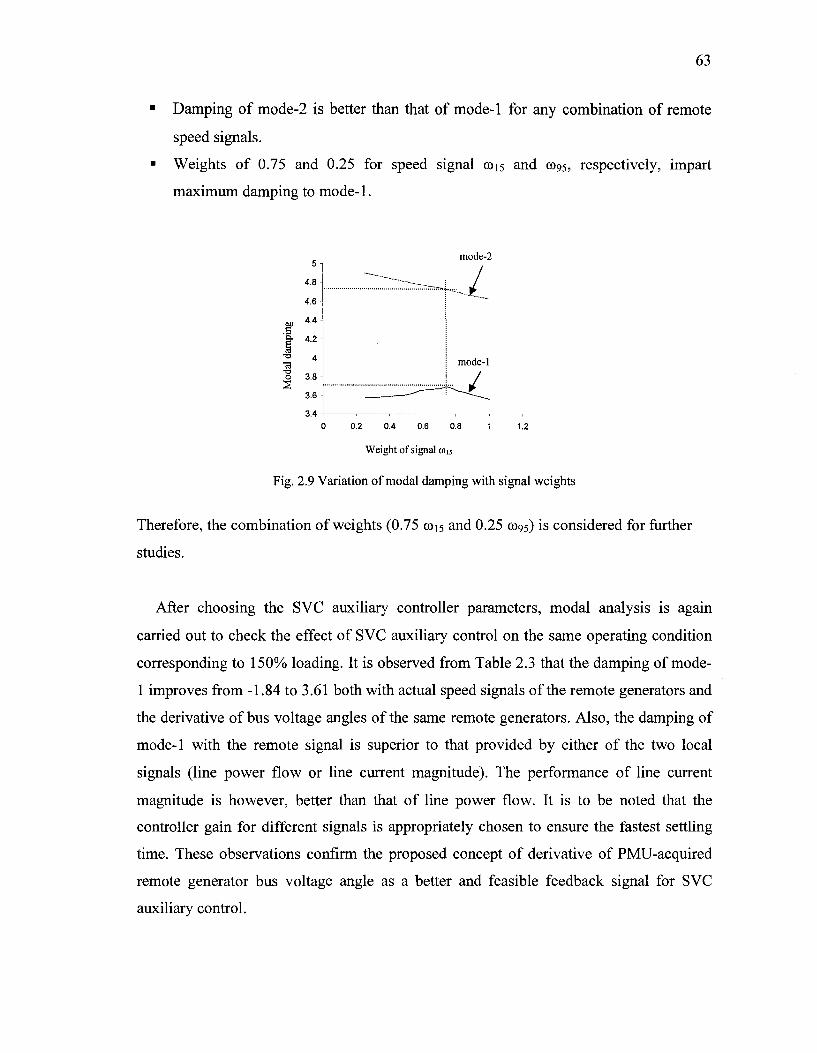
63
Damping of mode-2 is better than that of mode-1 for any combination of remote
speed signals.
Weights of 0.75 and 0.25 for speed signal ©15 and co95, respectively, impart
maximum damping to mode-1.
3.4-1 , r— -r , , , 0 0.2 0.4 0.6 0.8 1 1.2
Weight of signal cois
Fig. 2.9 Variation of modal damping with signal weights
Therefore, the combination of weights (0.75 CO15 and 0.25 0095) is considered for further
studies.
After choosing the SVC auxiliary controller parameters, modal analysis is again
carried out to check the effect of SVC auxiliary control on the same operating condition
corresponding to 150% loading. It is observed from Table 2.3 that the damping of mode-
1 improves from -1.84 to 3.61 both with actual speed signals of the remote generators and
the derivative of bus voltage angles of the same remote generators. Also, the damping of
mode-1 with the remote signal is superior to that provided by either of the two local
signals (line power flow or line current magnitude). The performance of line current
magnitude is however, better than that of line power flow. It is to be noted that the
controller gain for different signals is appropriately chosen to ensure the fastest settling
time. These observations confirm the proposed concept of derivative of PMU-acquired
remote generator bus voltage angle as a better and feasible feedback signal for SVC
auxiliary control.

64
2.5.6 Time Domain Simulations
A detailed time domain simulation is carried out on the 39-bus New England system
using PSCAD/EMTDC software to validate the results obtained from eigenvalue analysis
by SSAT/DSA software. The system behaviour with SVC auxiliary control using the
proposed remote feedback signal (d9/dt) is compared with actual generator speed signal
(co) and local line current magnitude signal for different disturbances described in the
earlier section. The "proposed d0/dt signal" refers to the (0.75d9i5/dt + O.25d095/dt)
signal, whereas the remote generator speed signal (co) corresponds to (0.75 coi5 + 0.25
co95) signal.
The rotor angles of generators 9 and 1 with respect to that of generator 5, SVC bus
power, SVC bus voltage magnitude and the reactive power drawn by the SVC are shown
in Fig. 2.10 (a), (b), (c), and (d), respectively for the critical disturbance 1. Following
observations are made:
• An SVC auxiliary control using remote signals (co and proposed d6/dt) is more
effective as compared to the local current signal.
• The performance of SVC auxiliary control with proposed derivative of bus voltage
signal (0.75 dGis/dt + 0.25 dGgs/dt) almost matches with the actual generator speed
signal (0.75 ©15 + 0.25 CO95).
The study is repeated for other critical disturbances 2 and 3 and simulation results are
shown in Fig. 2.11 and 2.12. It is observed from Fig 2.10 and 2.12 that the responses with
co and d9/dt signals are very close, in fact, overlapping each other.

65
i 1 / \ / \rt|
(a)
ft A
0.9900-
L A « ft
- \jJJ- W
k ft (c ) |
A ,'
* L A A £• * A In l\\r\ f\ / \ K in. *-»/-.•.^'M. | V y \> v v V i v : vi
TIJFII 1 J!\
"W i v w
"fafflt * oT^St\" •M\knw%^>^S:'
yyw^W v \ I
(d)|
j ^ i Jjfc\
\ / Vj
|
il.4 / i
1 |p -- ,.._ty_ _
AtfX VWN\
~ — -
A A L i?
" V ¥ 1/ 1
- L __
—. without auxiliary control -- with local line current signal — with gen. speed (m) signal — with proposed d9/dt signal
10 20 30 40 50
Fig. 2.10 System performance for disturbance 1

66
without auxiliary control " with gen. speed (co) signal • with proposed d9/dt signal
50
Fig. 2.11 System performance for disturbance 2

67
21.0-
22.0-
Ml \ | t p 11 Iff *
A
y ; JW
_y
0! • I f ll
' ' " ' i
1 -11.004
without auxiliary control • with gen. speed (<a) signal . with proposed d9/dt signal
Fig. 2.12 System performance for disturbance 3 at 150 % loading
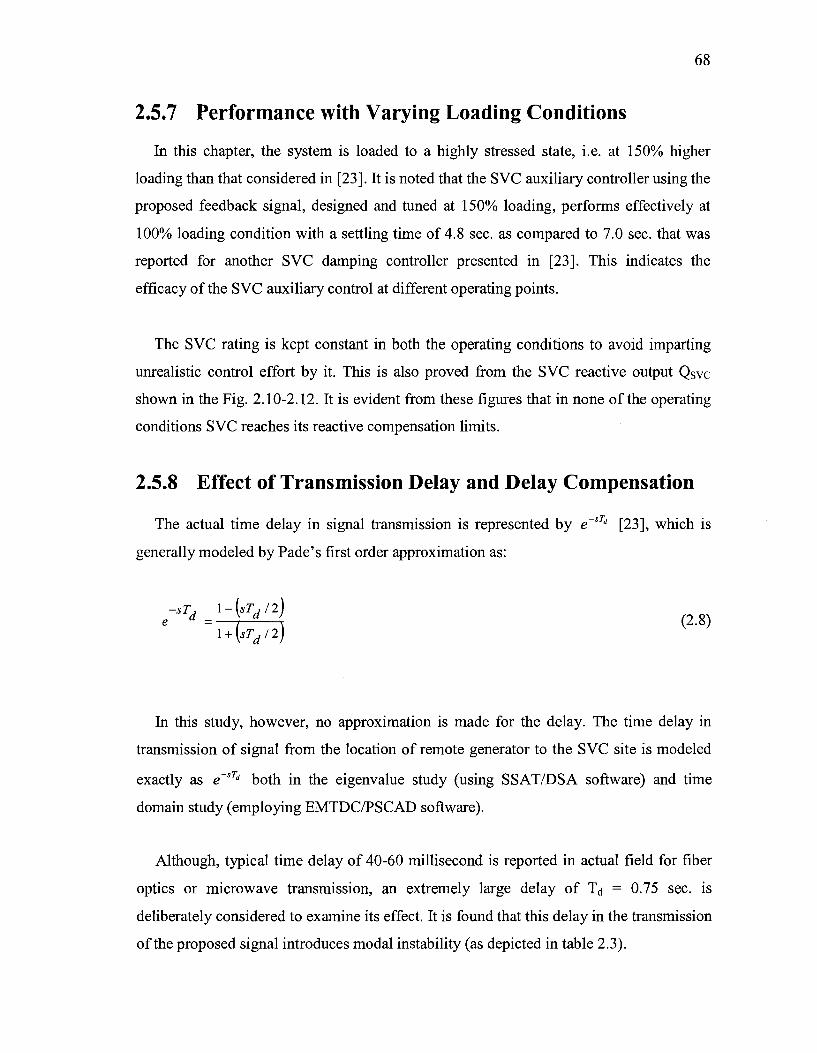
68
2.5.7 Performance with Varying Loading Conditions
In this chapter, the system is loaded to a highly stressed state, i.e. at 150% higher
loading than that considered in [23]. It is noted that the SVC auxiliary controller using the
proposed feedback signal, designed and tuned at 150% loading, performs effectively at
100% loading condition with a settling time of 4.8 sec. as compared to 7.0 sec. that was
reported for another SVC damping controller presented in [23]. This indicates the
efficacy of the SVC auxiliary control at different operating points.
The SVC rating is kept constant in both the operating conditions to avoid imparting
unrealistic control effort by it. This is also proved from the SVC reactive output Qsvc
shown in the Fig. 2.10-2.12. It is evident from these figures that in none of the operating
conditions SVC reaches its reactive compensation limits.
2.5.8 Effect of Transmission Delay and Delay Compensation
The actual time delay in signal transmission is represented by e~sTd [23], which is
generally modeled by Pade's first order approximation as:
e d = V d I ( 2 . 8 )
l + K / 2 )
In this study, however, no approximation is made for the delay. The time delay in
transmission of signal from the location of remote generator to the SVC site is modeled
exactly as e~sTd both in the eigenvalue study (using SSAT/DSA software) and time
domain study (employing EMTDC/PSCAD software).
Although, typical time delay of 40-60 millisecond is reported in actual field for fiber
optics or microwave transmission, an extremely large delay of Td = 0.75 sec. is
deliberately considered to examine its effect. It is found that this delay in the transmission
of the proposed signal introduces modal instability (as depicted in table 2.3).

69
This instability is also validated through the time domain simulation in Figs. 2.13 to
2.15 for the three critical different disturbances. The phase lag introduced in the proposed
feedback signal is 48 degrees for the electromechanical mode of frequency 0.1783 Hz.
A suitable lead compensator is designed [2] to neutralize the effect of the time delay
introduced by remote signal transmission. The structure of the lead circuit is given below:
K K l + sT2j
(2.9)
Here, K = 0.28, T! = 0.64 sec, and T2 = 0.1 sec.
It is observed from eigenvalue studies reported in table 2.3 that the damping of the
critical inter-area mode improves from -0.39 % to 3.61% after introducing a suitable lead
compensator. This is also validated by time domain simulations in Figs. 2.13 to 2.15 for
all the three disturbances.
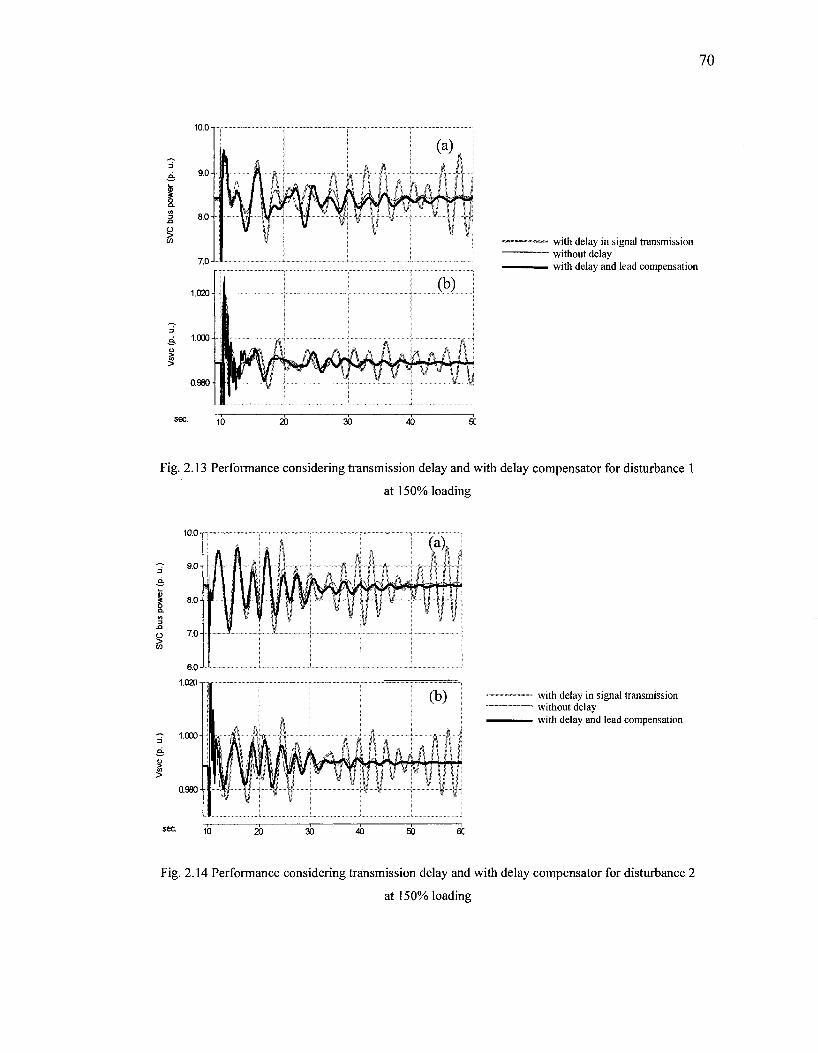
70
10.0
0.980
with delay in signal transmission without delay with delay and lead compensation
sec. i 0 20 30 40
Fig. 2.13 Performance considering transmission delay and with delay compensator for disturbance 1
at 150% loading
10.0
- r 1.000 A
0.9804
™ with delay in signal transmission — without delay — with delay and lead compensation
10 20 30 40 50 6C
Fig. 2.14 Performance considering transmission delay and with delay compensator for disturbance 2
at 150% loading

71
lb 20 io 40 so
Fig. 2.15 Performance considering transmission delay and with delay compensator for disturbance 3
at 150 %loading
2.6 Robustness of the Delay Compensator
To test the robustness of the designed compensator, signal transmission delays of
different ranges are considered. The maximum signal transmission delay is intentionally
chosen to be 0.8s to demonstrate the robustness of the compensator. It is found that the
controller is still effective even if this unusually large delay is involved in signal
transmission. Fig. 2.16 depicts stable SVC bus power, speed deviation between Gg and
Gi and SVC reactive power even though the signal transmission involves the unusually
large transmission delay mentioned above.
In the second test a typical signal transmission delay of 40ms is considered. In this
case also the performance of the delay compensator is satisfactory. Fig. 2.17 plots the
same signals as mentioned above in case of a realistic 40 ms delay. In this case also the
system is stable and the oscillations are damped rapidly.
with delay in signal transmission without delay with delay and lead compensation
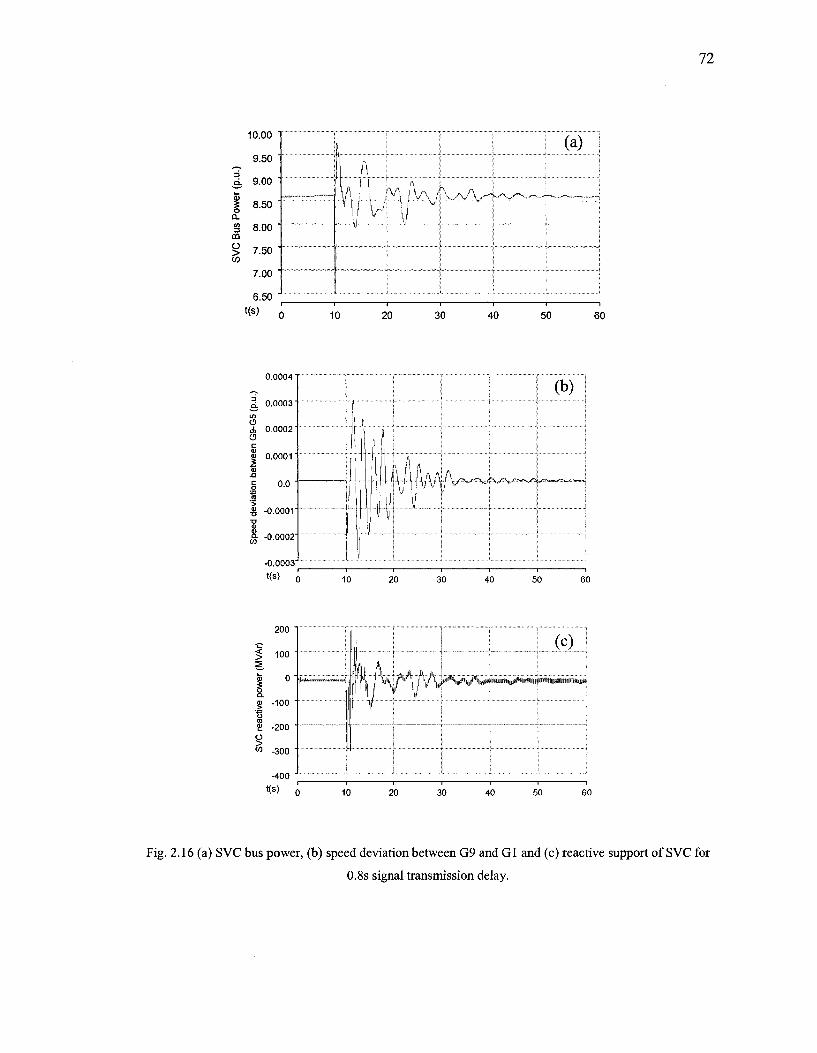
72
.—. 1 I s.
Bus
OAS
10.00
9.50
9.00
8.50
8.00
7.50
7.00
6.50 t(s) 10 20 30 40 50 60
0.0004
(c)
* v / i AAI' ,*"V ,(IA««"«B«** ," , ,"C
20 30 40 50 60
Fig. 2.16 (a) SVC bus power, (b) speed deviation between G9 and Gl and (c) reactive support of SVC for
0.8s signal transmission delay.
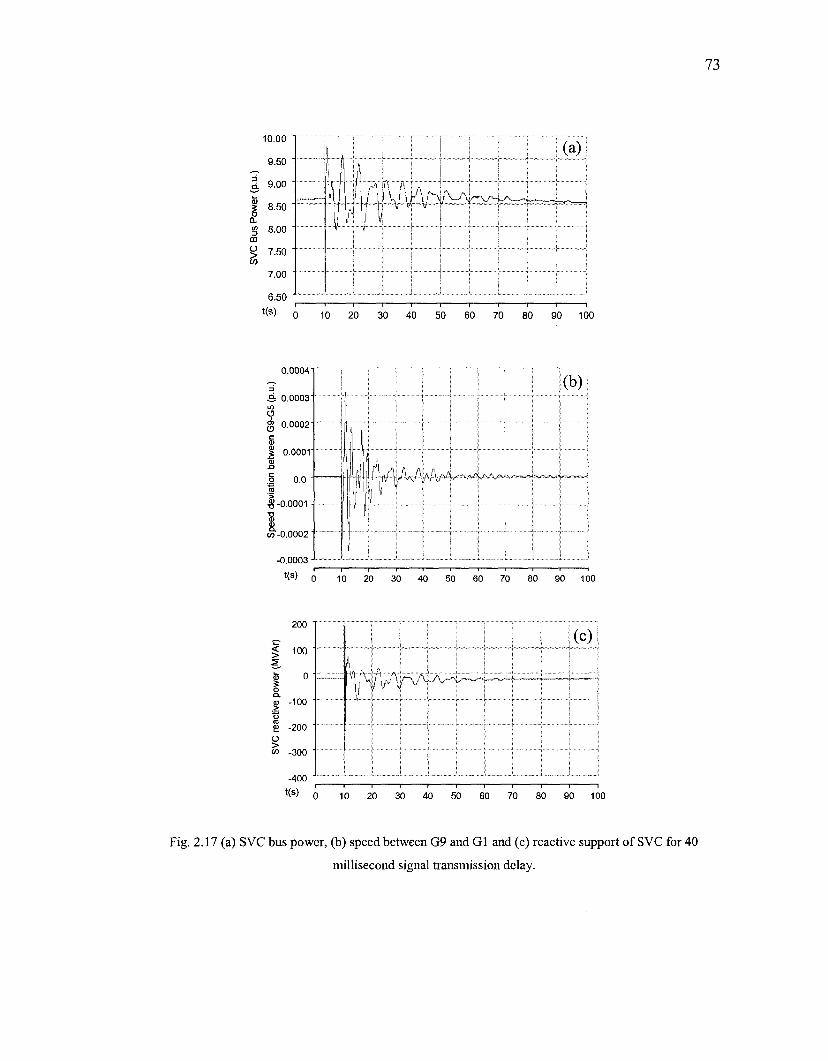
73
10.00
9.50
9.00
% 8.50 o
^ 7.50
7.00
6.50
*(s) o
1 ,
(a)
10 20 30 40 50 60 70 80 90 100
0.00041
S 0.0003
100
100
Fig. 2.17 (a) SVC bus power, (b) speed between G9 and Gl and (c) reactive support of SVC for 40
millisecond signal transmission delay.
74
2.7 Discussions Since inter-area oscillations essentially originate from the generators, it is expected
that a damping signal derived from generator rotor angles should be most effective.
Generator bus voltage angles closely follow the generator rotor angles. Hence, a new
damping signal based on the derivative of bus voltage angle of the generators that
participate in the highly damped or un-damped inter-area mode is proposed. It is shown
that the derivative of generator bus voltage angle signal is almost as effective as the
generator speed signal. If more than one generator participates in the inter-area mode
concerned, a weighted sum of the derivative of bus voltage angles of those generators has
to be chosen. The weights assigned to each generator will depend on its contribution to
the inter-area mode as determined from eigenvalue analysis and transient stability
simulation studies.
The proposed remote signal which is derived from signals resembling rotor
oscillations of actual generators participating in the inter-area mode is shown to be better
than the conventionally preferred local signal - magnitude of the line current. The
effectiveness of the proposed SVC auxiliary controller is demonstrated for a very
stringent system operating condition. This corresponds to a 150 % loading of the system
at which the system is inherently unstable without SVC damping control. In an actual
SVC installation, the remote signal can be used as the primary signal for SVC damping
control, while the local signal can serve as a suitable backup.
2.8 Conclusions
In this chapter, a new concept of static VAR compensator control for damping inter-
area oscillations based on remote signals is presented. The proposed damping signal
comprises a weighted sum of the derivative of bus voltage angles of remote generators
that participate in the inter-area mode oscillations. It is shown for a highly stressed 39-
bus New England system that an SVC damping control based on above signal, which
closely resembles the rotor angles of critical generators, and which can be acquired
through phasor measurement units, is far superior to an SVC control based on the
75
conventionally used local signals. A second order lead compensator can suitably mitigate
the adverse effect of the transmission delays over a wide range, thus maintaining the
effectiveness of these remote signals.
2.9 References
[1] M. Klein, G. J. Rogers, P. Kundur, " A fundamental study of inter-area
oscillations in power systems," IEEE Trans. Power Systems., vol. 6, no. 3, pp.
914-921, Aug. 1991.
[2] P. Kundur, Power System Stability and Control, McGraw-Hill, New York, 1993.
[3] J. H. Chow, J. J. Sanchez-Gasca, H. Ren and S. Wang, "Power System Damping
Controller Design," IEEE Control System Magazine, pp. 82-90, Aug. 2000.
[4] R.M. Mathur and R.K. Varma, "Thyristor-Based FACTS Controllers for
Electrical Transmission Systems", IEEE Press and Wiley Interscience, New York,
USA, Feb. 2002.
[5] M. Noroozian, M. Ghandhari, G. Andersson, J. Gronquist and I. Hiskens, " A
robust control strategy for shunt and series reactive compensators to damp
electromechanical oscillations," IEEE Trans. Power Delivery, vol. 16, no. 4, pp.
812-817, Oct. 2001.
[6] E. V. Larsen, J. J. Sanchez-Gasca and J. H. Chow, "Concepts for design of
FACTS controllers to damp power swings," IEEE Trans. Power Systems., vol. 10,
no. 2, pp. 948-956, May. 1995.
[7] A. E. Hammad, "Analysis of power system stability enhancement by Static Var
Compensators," IEEE Trans. Power Systems., vol. 1, no. 4, pp. 222-227, Nov.
1996.
[8] G. N. Taranto, J. K. Shiau, J. H. Chow, and H. A. Othman, "Robust decentralised
design for multiple FACTS damping controllers"; IEE Proceedings on
Generation, Transmission and Distribution, vol. 144, no. 1, pp. 61-67, Jan. 1997.
[9] E. V. Larsen, K. Clark, M. J. Beshir, M. Bhuiyan, and K. Braun, "Control design
for SVC's on the Mead-Adelanto and Mead-Phoenix transmission project", IEEE
Trans. Power Delivery, vol. 11, no. 3, pp. 1498-1506, July 1996.

76
[10] E. Lerch, D. Povh, and L. Xu, "Advanced SVC control for damping power system
oscillations", IEEE Trans. Power Systems, vol. 6, no. 2, pp. 524-535, May 1991.
[11] K. R. Padiyar and R. K. Varma, "Damping torque analysis of static VAR system
controllers", IEEE Trans. Power Systems, vol. 6, no. 2, pp. 458-465, May 1991.
[12] G. T. Heydt, C. C. Liu, A. G. Phadke, and V. Vittal, "Solution for the crisis in
electric power supply", IEEE Computer Applications in Power, Vol. 14, No. 3 ,
pp. 22-30,2001.
[13] I. Kamwa, R. Grondin, and Y. Hebert, "Wide-area measurement based stabilizing
control of large power systems-a decentralized/hierarchical approach", IEEE
Trans. Power Systems, Vol. 16-1, pp. 136-153, 2001.
[14] B. Chaudhuri and B. C. Pal, "Robust damping of multiple swing modes
employing global stabilizing signals with a TCSC," IEEE Trans. Power Systems,
vol. 18, no. 3, pp. 499-506, Feb. 2004.
[15] L. Rouco and F. L. Pagola, "An eigenvalue sensitivity approach to location and
controller design of controllable series capacitors for damping power system
oscillations," IEEE Trans. Power Systems, vol. 12, no. 4, pp. 1660-1666, Nov.
1997.
[16] B. Chaudhuri, R. Majumder; and B.C. Pal "Wide-Area Measurement-Based
Stabilizing Control of Power System Considering Signal Transmission Delay",
IEEE Trans. Power Systems, vol. 20, pp. 1971-1979, Nov. 2004.
[17] Qun Gu, A. Pandey, S. K. Starrett, "Fuzzy logic control for static VAR
compensator to control system damping using global signal", Electric Power
Systems Research, pp. 115-122, 2003.
[18] M. M. Farssangi, Y. H. Song, and K. Y. Lee, "Choice of FACTS device control
input for damping inter area oscillations", IEEE Trans. Power Systems, vol. 19,
no. 2, pp. 1135-1143, May 2004.
[19] SSAT/DSA Software Manual, Power Tech. Labs, Surrey B.C., Canada.
[20] Manitoba HVDC Research Centre, Manual for EMTDC/PSCAD Software v4,
Winnipeg, MB, Canada.

77
[21] CIGRE Task Force 38.02.17, "Advanced Angle Stability Controls", CIGRE
Technical Brochure No. 155, Paris, France, April 2000
[22] M. A. Pai, Energy Function Analysis for Power System Stability, Prentice-Hall,
1996.
[23] G. F. Franklin, J. D. Powell, and A. E. Naeini, Feedback Control of Dynamic
Systems, Addison-Wesley, Massachusetts, 2004
[24] D. Z. Fang, Y. Xiaodong, T. S. Chung, and K. P. Wong, "Adaptive Fuzzy-Logic
SVC damping controller using strategy of oscillation energy descent", IEEE
Trans. Power Systems., vol. 19, no. 3, pp. 1414-1421, August 2004.
CHAPTER 3
Mitigation of Subsynchronous Resonance by SVC
using PMU-Acquired Remote Generator Speed
3.1 Introduction
Series compensation in an AC transmission line is an effective means to enhance
power transfer capacity and improve transient stability. However, one of the important
problems in power systems employing series capacitors in AC transmission lines is the
interaction between mechanical system comprising various stages of steam turbines,
generator rotor and the series compensated electrical network. If any natural frequency of
oscillation of the combined torsional system matches with the complement of the
resonant frequency of the line inductance and series capacitance, growing oscillations of
subsynchronous frequencies result in the power system. This phenomenon is called
subsynchronous resonance.
SSR with its various preventive measures have been well discussed in a vast body of
literature [1, 2]. Subsynchronous oscillations due to the interactions of series capacitors
with turbine-generator mechanical shaft system lead to the failure of the entire shaft
system, causing electrical instability in a frequency range lower than the normal system
frequency.
Successful application of Flexible AC Transmission System (FACTS) Controllers has
been reported in past to mitigate subsynchronous resonance [3]. One of the widely
referred examples of such applications is [4] where Hammad et. al. used thyristor

79
controlled VAR compensator for damping subsynchronous oscillations. They used a
thyristor controlled VAR compensator connected in shunt at the synchronous generator
bus to damp subsynchronous oscillations besides controlling the system voltage.
Generator speed signal was used as the only stabilizing signal in designing the SVC
auxiliary controller. A practical installation of SVC for SSR mitigation is reported in [5].
Recently, with the advent of Wide Area Measurement (WAM) technology, it is possible
to measure the states of a large interconnected power system with synchronized phasor
measurement units (PMU) [6]. The measurements of states are done at widely separated
geographical locations encompassing the interconnected power system. The
measurements are time synchronized by global positioning system (GPS) technology at
each geographical location. Dedicated fiber-optic communication lines are used to
transmit these measured states to the control centre. These measurements when collected
at a central location provide a coherent picture of a power system network. This
information of the entire power system network is used to design Power System
Stabilizers (PSS) and FACTS Controllers to damp inter-area oscillations [6, 7].
An analysis was performed for an SVC located at the midpoint of a long distance
series compensated line in respect of its effectiveness in damping the generator torsional
oscillation modes in [8], [9]. The signals examined were computed internal frequency
(CIF) [10], computed rotor frequency (CRF), bus frequency and line reactive current. It
was reported that a combination of CIF and line current signals with appropriately chosen
auxiliary controller parameters could concurrently damp the low frequency zeroth mode
and the subsynchronous torsional modes for all levels of series compensation (5%-99%)
including the different critical compensation levels. The composite CIF line current
auxiliary signal was successful in achieving the same objective for different values of
generator power output and transmission line length [11]. However, in this chapter, a new
concept of using remote generator speed signal to mitigate SSR is proposed. It has been
reported in [12] that through a dedicated fiber-optic link the generator speed can be
transmitted to the location of the FACTS Controller to damp inter-area oscillations in a
large interconnected system. In this work, the remote generator speed signal is utilized by
an SVC located at the mid-point of a transmission line to damp subsynchronous

80
oscillations. The SVC is primarily installed to enhance power transfer capacity but with
the proposed controller it can additionally damp all subsynchronous oscillation modes. It
is found that with the remote generator speed a simple subsynchronous damping
controller (SSDC) can damp all the SSR modes with all critical levels of compensation.
The organization of the chapter is as follows: section 3.2 describes the configuration
and modeling of the study system. The overview of the controller design for the SVC is
given in section 3.3. Section 3.4 discusses monotonically increasing oscillations of the
unstable system along with the SSR modes; the auxiliary controller performance has also
been reported in this section. A short description of the effect of signal transmission delay
is presented in section 3.5. Finally, section 3.6 concludes the chapter.
3.2 System Configuration and Modeling
3.2.1 Configuration
The system considered in this work is the IEEE First Benchmark Model for SSR
studies originally reported in [11]. The operating conditions, mechanical system
modeling and the contingency applied are exactly the same as in [11] and given in
Appendix B. In the study system, the SVC is installed in the middle of the transmission
line. The system configuration with the SVC at the midpoint is shown in Fig 3.1. The
rating of the SVC is: QL = 300 MVAr and Qc = 340 MVAr. This is determined from the
loadflow studies.
3.2.2 Modeling
Modeling of the study system shown in Fig. 3.1 has been performed using different
commercial grade software. The steady state modeling of the system for loadflow studies
has been performed with PSAT of DSA Power Tools [13]. The steady state power flow
results have been used to initialize all the dynamic devices in the nonlinear time domain
simulations performed with EMTDC/PSCAD [14].

81
Torsional System h£> t
Xx RL/2 XL/2 RL/2 XL/2 Xc
Aco SVC %
H Remote Signal Transmission
K: Controller
3 Phase Line to Ground Fault
Infinite Bus
Fig. 3.1 IEEE 1st Benchmark model for SSR studies
3.3 Controller Design of SVC
SVC is mainly used to regulate the system bus voltage during disturbances in the
system. In addition, an auxiliary subsynchronous damping controller (SSDC) is designed
and added suitably to enhance the torsional mode damping of the system. The general
linearized configuration of an SVC with its voltage regulator and auxiliary controller is
shown in Fig. 3.2.
Voltage Regulator SVC
Power System
A V - € > - ^ G-svc(s) G(s)
H(s)
Auxiliary Signal ASig
Auxiliary Controller
Fig. 3.2 Generalized SVC auxiliary control
In this study the voltage regulator is a simple PI controller. The proportional gain Kp
and integral gain Kj are varied systematically by hit-and-trial method. The best Ki results
in a minimal settling time with acceptable overshoots in generator terminal voltage in
response to a step change in the reference voltage Vref. The auxiliary controller H(s) can

82
take many different structures depending on which control design technique is employed
[15]. The structure of the auxiliary subsynchronous damping controller (SSDC) is shown
in Fig. 3.3 where ASig is the incremental value of auxiliary feedback signal. The different
signals generally considered as the input signals to the auxiliary controller are line real
power flow, line current magnitude, bus frequency, bus voltage magnitude etc [3]. In this
chapter, the generator speed deviation (Aco) is used as an auxiliary signal to damp the
unstable modes. This choice is due to the fact that the generator speed contains all the
torsional modes of oscillations and also because the SSR phenomenon primarily impacts
the generator rotor speed. It is apparent from Fig. 3.1 that the generator speed is not
readily available at the SVC location. It is assumed according to [12] that through a
dedicated fiber optic link remote generator speed can be transmitted to the location of
SVC.
ASis Washout Block
PD Controller
AY ref
— • ( * ) - * * P I Controller AB ref
Measured Voltage
Fig. 3.3 Structure of SVC Subsynchronous Damping Controller (SSDC)
The SSDC comprises a proportional and derivative controller (PD) together with a
washout circuit. The purpose of washout circuit is to prevent the auxiliary controller from
responding to steady state power flow variations. The gain and the parameters of SSDC
are determined from systematic hit and trial using the nonlinear time domain simulation
using PSCAD software to result in fastest settling time. The designed PD controller is
sufficient to damp all the four SSR modes with the generator remote speed. The output of
the SSDC is then fed to SVC voltage regulator as shown in Fig. 3.3.
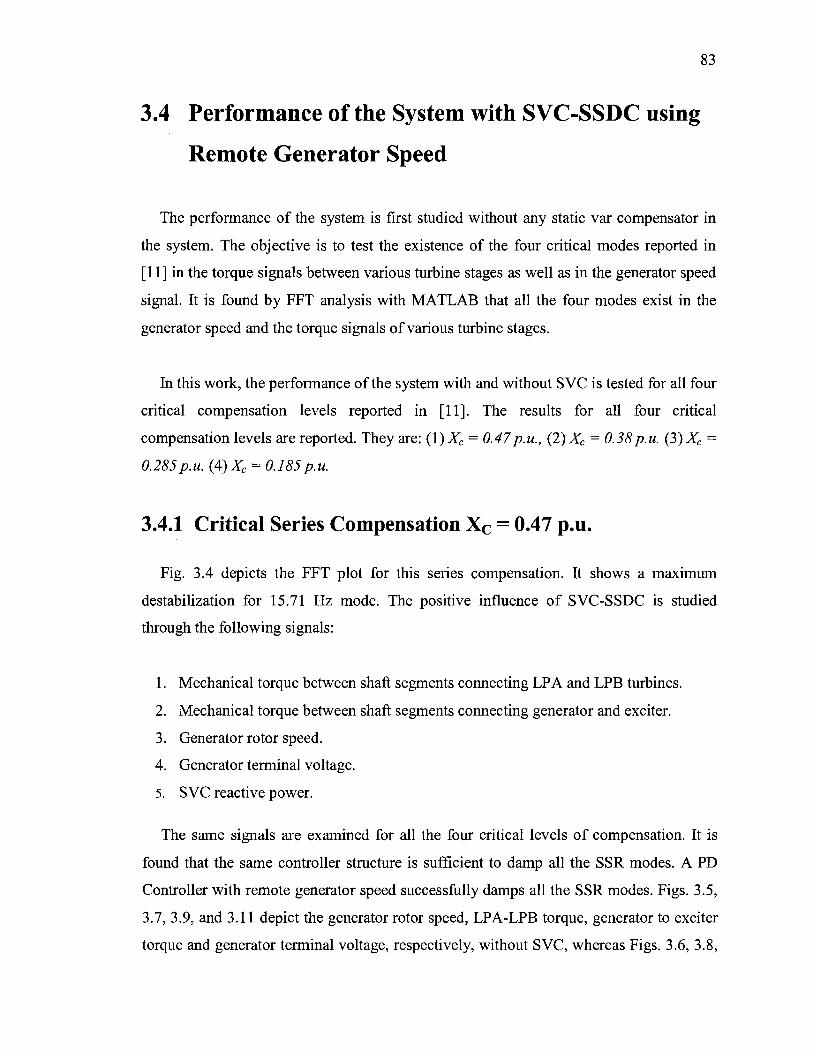
83
3.4 Performance of the System with SVC-SSDC using
Remote Generator Speed
The performance of the system is first studied without any static var compensator in
the system. The objective is to test the existence of the four critical modes reported in
[11] in the torque signals between various turbine stages as well as in the generator speed
signal. It is found by FFT analysis with MATLAB that all the four modes exist in the
generator speed and the torque signals of various turbine stages.
In this work, the performance of the system with and without SVC is tested for all four
critical compensation levels reported in [11]. The results for all four critical
compensation levels are reported. They are: (\)XC = 0.47p.u., (2)XC = 0.38p.u. (3)XC =
0.285p.u. (4)XC = 0.185p.u.
3.4.1 Critical Series Compensation Xc = 0.47 p.u.
Fig. 3.4 depicts the FFT plot for this series compensation. It shows a maximum
destabilization for 15.71 Hz mode. The positive influence of SVC-SSDC is studied
through the following signals:
1. Mechanical torque between shaft segments connecting LP A and LPB turbines.
2. Mechanical torque between shaft segments connecting generator and exciter.
3. Generator rotor speed.
4. Generator terminal voltage.
5. SVC reactive power.
The same signals are examined for all the four critical levels of compensation. It is
found that the same controller structure is sufficient to damp all the SSR modes. A PD
Controller with remote generator speed successfully damps all the SSR modes. Figs. 3.5,
3.7, 3.9, and 3.11 depict the generator rotor speed, LPA-LPB torque, generator to exciter
torque and generator terminal voltage, respectively, without SVC, whereas Figs. 3.6, 3.8,
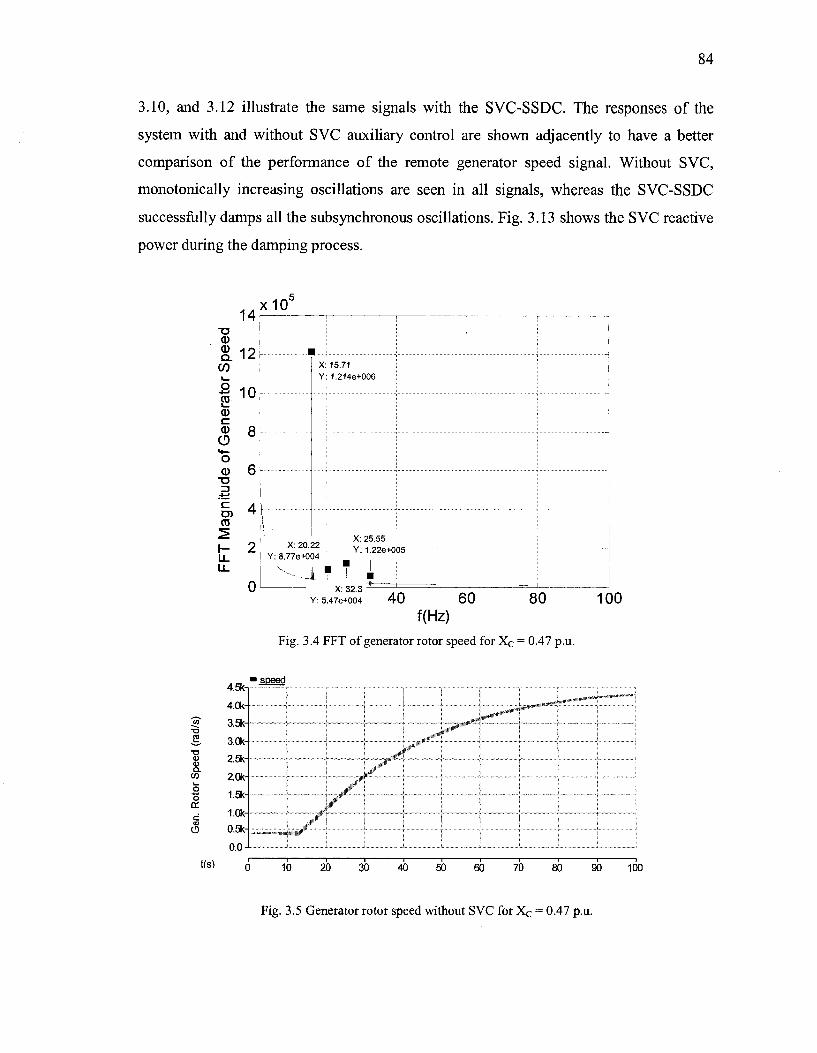
84
3.10, and 3.12 illustrate the same signals with the SVC-SSDC. The responses of the
system with and without SVC auxiliary control are shown adjacently to have a better
comparison of the performance of the remote generator speed signal. Without SVC,
monotonically increasing oscillations are seen in all signals, whereas the SVC-SSDC
successfully damps all the subsynchronous oscillations. Fig. 3.13 shows the SVC reactive
power during the damping process.
T3 a) a> a.
CO
o 2 <D c CD
CD i— o CD TJ *—' C D) CO
14
12
10
8
6
4|
2
0
x10
•
I \
X: 20. Y: 8.77e+0
X Y
?? 34
L '
15.71 1.214e+006
X: 25.55 Y:1.22e+0
•J L. 05 " r
I i _ l
Y:5.47e+004 40 60 80
f(Hz)
Fig. 3.4 FFT of generator rotor speed for X c = 0.47 p.u.
100
I I cc
o
tfs)
4.5k-
4.0k-
3.5k-
3.0k-
2.5k-
2.0kH
1.5k-
1.0k-
0.5k-
0.0-
1 speed
0
^ '
10 20
^
.w-^—T
-L
~30 40 50 60 70 80~ 90 100
Fig. 3.5 Generator rotor speed without SVC for X c = 0.47 p.u.

LP
A-
LPB
To
rqu
e (p
.u.)
L
PA
-LP
B T
orq
ue
(p.u
.)
Ge
ne
rato
r ro
tor
spe
ed
(ra
d/s
)
31
era'
bo
> ft
00 < o
00 O
O
X
o II o '-fe
.
b
S
8 SJ
8 0
01
0
1 1 1
i 1 j I
1 i
C
= \ !•
n 8
& | ^ | 1
h ft
s
o o
On
I !
! <-
I 1— 5 5 i ? s Lie
31 er
a'
U) ^ r-1 PA-L ,_*.
0 »-{
>B
CD |.
S*
O
00 < 0 S>
>-
i !x!
n II O
4^
-J
XS
b
0-
ho
0
-
o- 6- 8- 8- a- 8- 8- i~
i
i t 1 3
1 .3
1
5
_
j
— J
--
^ i
| (
-•
•
; !
L.
l
| |
8
21 dS
'
O
s 0>
T3 0)
CD
00 < O
• 00
00 o
o
o 4^ b
&
I I
OO

^ D a. CD 3 2" o 1-o ifl <D
C3
t(s)
4.0-1
3.0-
?o-
m-00-
-1.01
-2.01
-3.0 J
-4.0-
C
• Gen to Exc toraue
. : • : , . . : . . , :
•
• 1
• •
1 •' . '
i '4ii|ij : M •' i r
) 10 20
J
• •
*
30
1 '
40
,
• r
i '
•
50
1 i i '
60
/
70
•
f
•
1
80
•
90 10
Fig. 3.9 Gen-Exc torque without SVC for Xc = 0.47 p.u.
*ifi-
1 2-5' i" o.o-
o x oc •
c ° 50 -
« Gen to Exc tora
IlllWI
|
e
itmifiiiii
i i
• i
!
iiiiN#tiM
£
t(s) 10 20 30 40 50 60 70 80 90 100
Fig. 3.10 Gen-Exc torque with SVC-SSDC for Xc = 0.47 p.u.
3 a <D en
ta
o > 15 c jE <D
0)
chin
i
16.0-,
14.0-
12.0-
10.0-
8.0-
6.0-
4.0-
2.0-
o.o J
/ y"
/ /
nr """"y
tfs)
^ ^ 1 "1'
-J-"* ^4-**
10 20 30 ~40 50 60 70 80 90 100
Fig. 3.11 Machine terminal voltage without SVC for X c = 0.47 p.u.

87
3
O >
I
1 Ntechine Output Volts p.u.
1.40
1.20
1.00
0.80
0.20
0.00-
j p i [ i « i » ^ ^
0.60-
0.40
trs) 0 10 20 30 40 50 60 70 80 90 100
Fig. 3.12 Machine terminal voltage with SVC-SSDC for Xc = 0.47 p.u.
tfs)
'Qsvc
1.0k-
0.6k-
0.3k-
0.0-
-0.3k-
-0.6k4
-1.0k-
10 ~20 30 40 50 60~ 70 80 90 100
Fig. 3.13 SVC reactive power for Xc = 0.47 p.u.
3.4.2 Critical Series Compensation Xc = 0.38 p.u.
At this critical level of compensation Figs. 3.14, 3.16, 3.18, and 3.20 depict the
generator rotor speed, LPA-LPB torque, generator to exciter torque and generator
terminal voltage, respectively, without SVC, whereas Figs. 3.15, 3.17, 3.19, and 3.21
illustrate the same signals with the SVC-SSDC. Without SVC, growing oscillations are
seen in all signals, whereas the SVC-SSDC successfully damps all the subsynchronous
oscillations. Fig. 3.22 shows the SVC reactive power.

900
800
700-
600-
500-
400
3004
200
100
0
-100
'speed
0 10 20 30 40 50 70 80 90 100
Fig. 3.14 Generator rotor speed without SVC for Xc = 0.38 p.u.
' W Generator
440
420
400
340-
320
300 ->
380" ^tallfliiNiBiiw^^
360-
20 40 60 100
Fig. 3.15 Generator rotor speed with SVC-SSDC for Xc = 0.38 p.u.
iLBMoLFB torque 1b0-i
100-
50-
100-
150-
200-
i '% \ \
I ! '
'^^mmmmKttrm
! I 1
1.
10 20 30 40 50 60 70 80 90 100
Fig 3.16 LPA-LPB torque without SVC for X c = 0.38 p.u.

Gen
-Exc
Tor
que
(p.u
.)
Gen
-Exc
Tor
que
(p.u
.)
LPA
-LP
B T
orqu
e (p
.u.)
CO
N>
->•
O
.-*
fO
CO
^
CO
^ O
-*
• CO
^
—i
1 1
I 1
1 !—
(O
W
-*
-i
I _»
. -*
IN
J l\3
cn
oc
no
cn
oo
io
cn
oc
n O
OO
OO
OO
OO
OO
S1
(fo' o
ft a I tt X
o ft < • as
in
D
O
X
o 00 c
8 8- 8"1
31
OQ
'
Q
1 W
o ft o GO
< O X
o p
00
>T3 C
8- 8J
T
i 1
i i
= —
h
-. i
r
51 I
51 T
O"
1>J t-1 > •8
< O
1 GO
G
O
O
O
o II p
00
8 8
N)
-1
-»
1 -*
->
• N
J o
oi
oc
no
cj
io
cn
o O
OO
OO
OO
OO
I
1 1
1 1
1 1
! 1
_ I
00
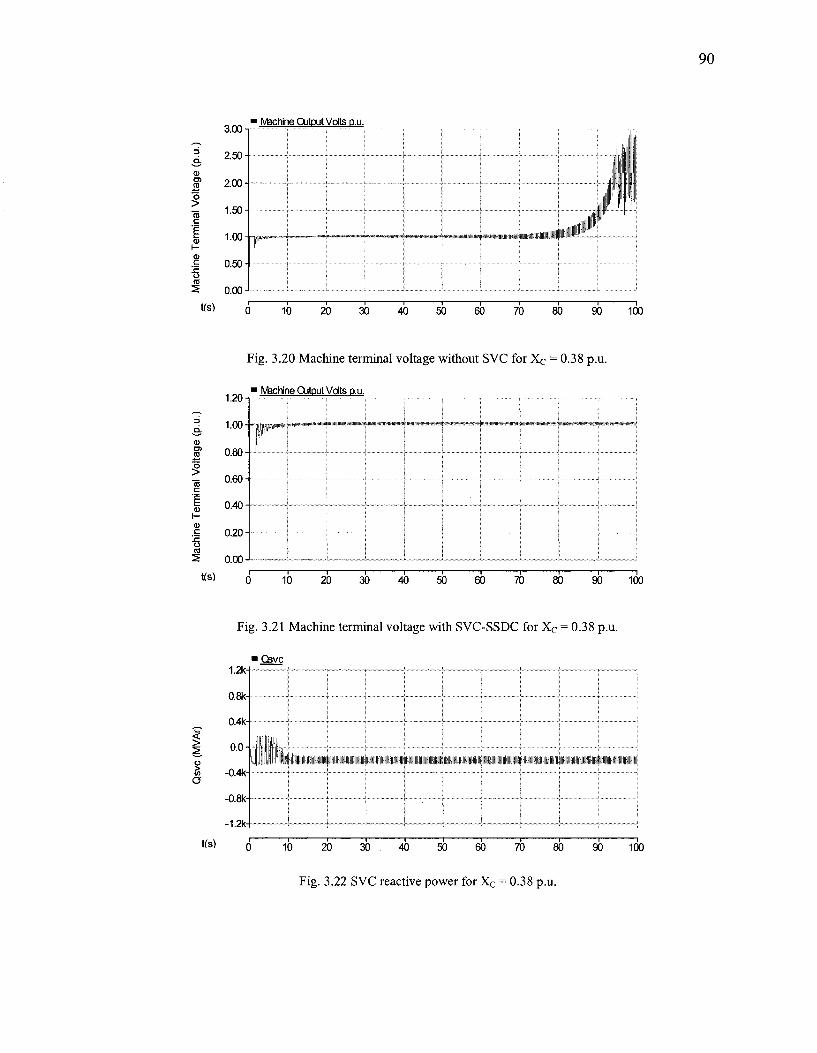
1 Machine Cutput Volts p.u
3
CD
Vol
ta
min
al
h-
Vla
chi
3.00-1
2.50-
2.00-
1.50-
1.00-
0.50-
0.00-
-p_
I I I i | j I !
i ! I I I i . i . | | |
l l J l ill #11
mmm0^
Us) 10 20 30 40 50 60 70 80 90 100
I H (U
c
1 CO
2
1.20
Fig. 3.20 Machine terminal voltage without SVC for X c = 0.38 p.u.
• Machine Cutput Volts p.u.
1.00-1-1
0.80
0.60-1
0.40
0.20
0.00-1
tfs) 0 10 20 30 40 50 60 70 80 90 100
%
Fig. 3.21 Machine terminal voltage with SVC-SSDC for X c = 0.38 p.u.
•Csvc 1.2k-
0.8k-
0.4k-(
0.0
a -0.4k-
-0.8k-
-1.2k-
l(s) 0 10 20 30 40 50 60 7o" 80 90 100
Fig. 3.22 SVC reactive power for X c = 0.38 p.u.

91
3.4.3 Critical Series Compensation Xc = 0.285 p.u.
Similar to the previous section, at this level of compensation Figs. 3.23, 3.25, 3.27,
and 3.28 depict the generator rotor speed, LPA-LPB torque, generator to exciter torque
and generator terminal voltage, respectively, without SVC, whereas Figs. 3.24, 3.26,
3.28, and 3.30 illustrate the same signals with the SVC-SSDC. Here also the SVC-SSDC
successfully stabilizes all the SSR modes. Fig. 3.31 depicts the SVC reactive power.
«s)
speed
Is)
• o
£ T3
CD o. CO i -
o
a. d o> CD
2.5k-,
2.3k-
2.0k-
1.8k-
1.5k-
1.3k-
1.0k-
0.8k-
0.5k-
0.3k-
—
_ j j ]
| """V"'
•ttmrlHl
10 20 30 40 50 60 70 90 100
Fig. 3.23 Generator rotor speed without SVC for Xc = 0.285 p.u.
I 2
P
CD
t(s)
440 -i ' W Generator
420
400
380
360
340
320
300 J
%ilil«ll»i»illl»ii«*^^
0 10 20 30 ~40 50 60 70~ B0 90 100
Fig. 3.24 Generator rotor speed with SVC-SSDC for Xc = 0.285 p.u.
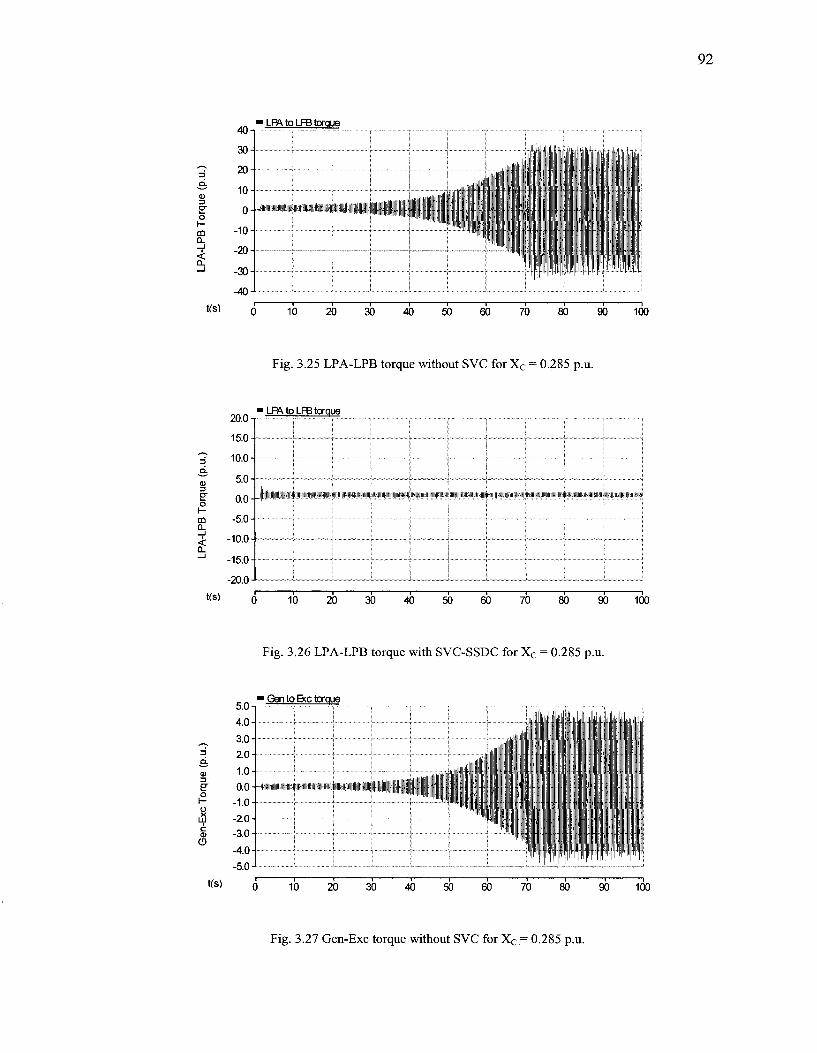
Ge
n-E
xc T
orq
ue
(p.u
.)
LP
A-L
PB
To
rqu
e (p
.u.)
L
PA
-LP
B T
orq
ue
(p.u
.)
cD
io
bb
oo
bo
fc
jo
b O
-i
I !
1 1
1 !
1 1
! !
1
21
era'
O
ro
P I X
CD
o g.
oo
O X
o II o to
00
S
8-
oo
oo
oo
oo
o o
, j
! !
! !
! !
! 1
£
21
cfq'
to
ON
r hi > I r 1 00 < O
i 00
00
O
O
X
o II o to
0
0 U
\
e 8 S
J J L
f l_
i I \
I
o o
o °-
>
—'—
' •
L
21
era"
to > t r ca
a o g_
00
< O
X
o I! o to
0
0 U
l
C
8 8
I g
to
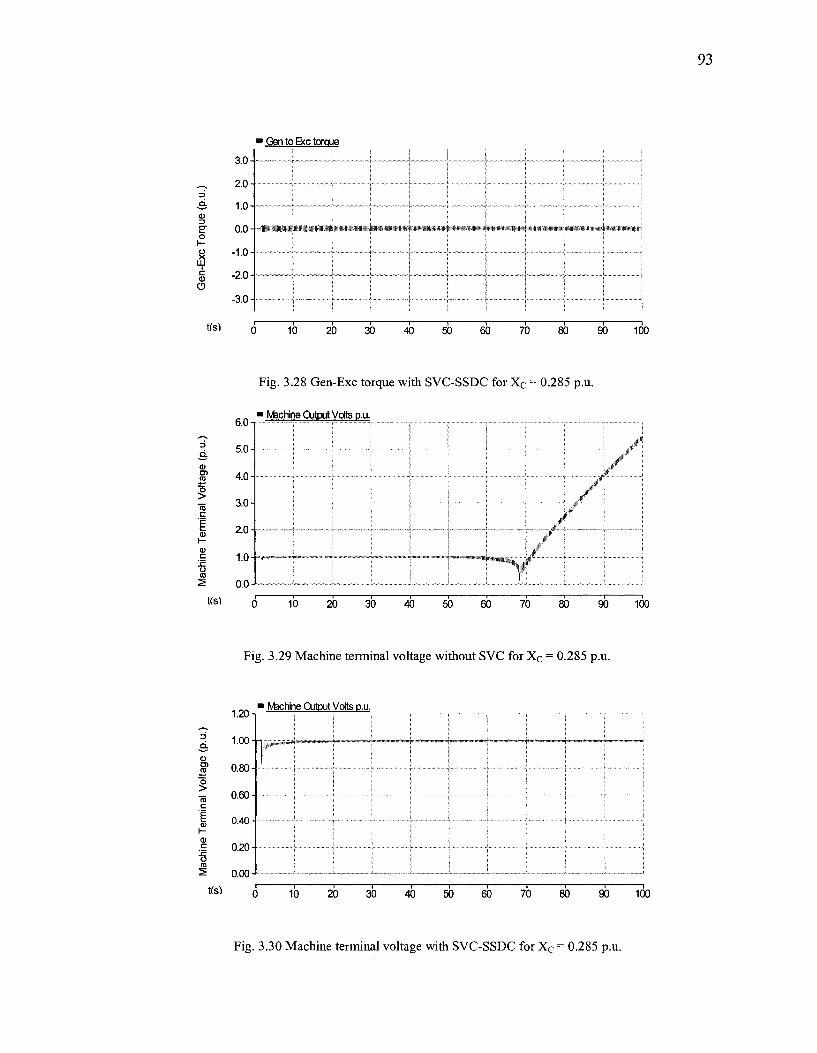
93
o
£ •
c <D
' Gen to B(c torque i
3.0 +
2.0-
1.0-
o.o +wm
-1.0 •
-2.0
-3.0
Ks)
iiii«*»»>iiwi»i**«»»»ii«N«"i"™««««« fMWimttimWIWfiWMWW
10 20 1 5 40 50 60 70~ "io so ioo
a> D)
^
<u 1-<u c
'JO o as
tfs)
Fig. 3.28 Gen-Exc torque with SVC-SSDC for X c = 0.285 p.u.
• Machine Output Volts p.u.
10 20 30 40 50 60 70 80 90 100
Fig. 3.29 Machine terminal voltage without SVC for X c = 0.285 p.u.
3 Q.
I
1.20 -I
1.00-h
0.80
0.60
0.40
0.20 -
0.00-
Machine Output Volts p.u.
tfs) 0 10 20 30 40 50 60 70 90 100
Fig. 3.30 Machine terminal voltage with SVC-SSDC for X c = 0.285 p.u.
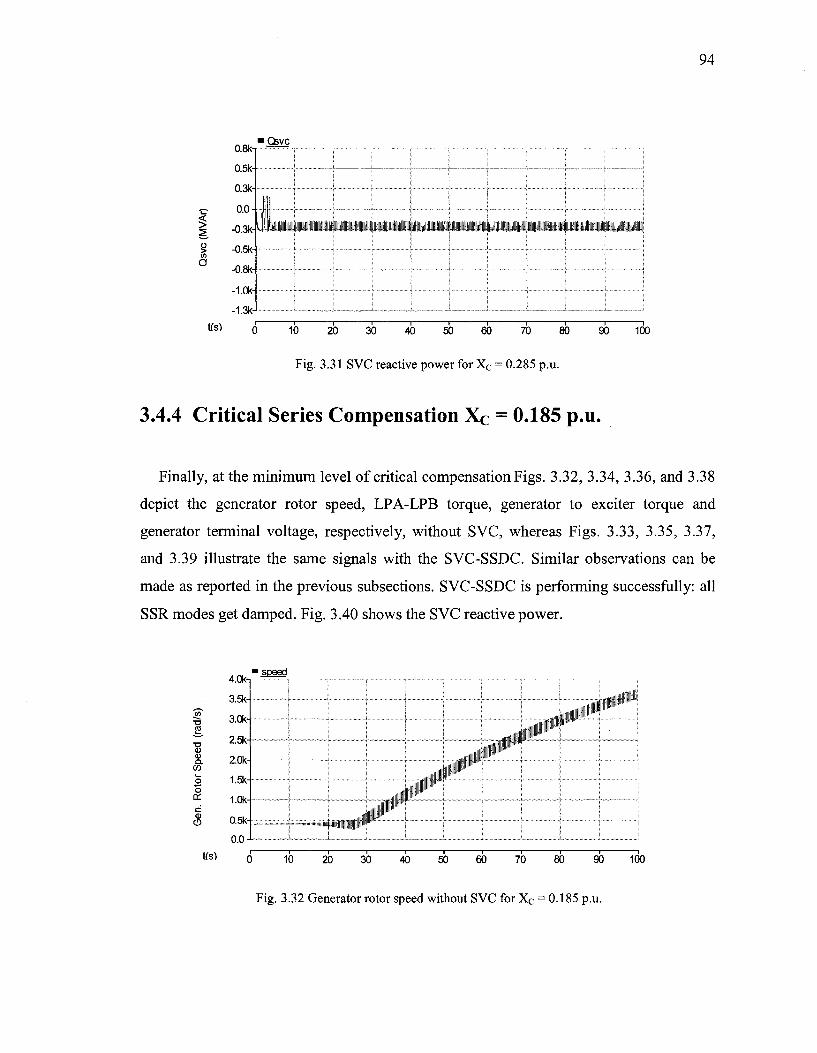
94
I o
> a
0.8k-
0.5k-
0.3k-
0.0-
-0.3k-
-0.5k-
-0.8k-
-1.0k-
-1.3k-
'Qsvc
tfs) 0 10 20 30 40 50 60 70 80 90 100
Fig. 3.31 SVC reactive power for Xc = 0.285 p.u.
3.4.4 Critical Series Compensation Xc = 0.185 p.u.
Finally, at the minimum level of critical compensation Figs. 3.32, 3.34, 3.36, and 3.38
depict the generator rotor speed, LPA-LPB torque, generator to exciter torque and
generator terminal voltage, respectively, without SVC, whereas Figs. 3.33, 3.35, 3.37,
and 3.39 illustrate the same signals with the SVC-SSDC. Similar observations can be
made as reported in the previous subsections. SVC-SSDC is performing successfully: all
SSR modes get damped. Fig. 3.40 shows the SVC reactive power.
tfs)
^ s/p
10
•o <D 0> Q . OT O O cr c <a
4.0k-,
3.5k-
3.0k-
2.5k-
2.0k-
1.5k-
1.0k-
0.5k-
0.0-
..........
- —
\ I
• . . mm.llWIWill^
10 20 30 40 50 60 70 80 90 100
Fig. 3.32 Generator rotor speed without SVC for Xc = 0.185 p.u.
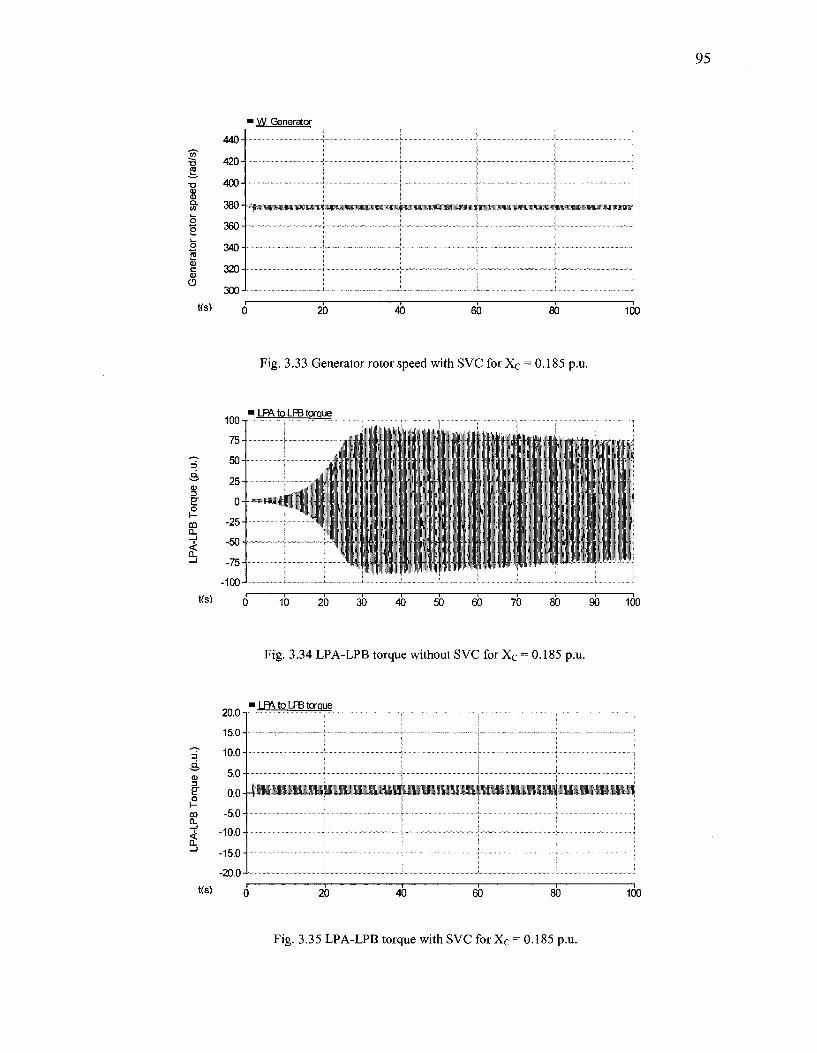
• W Generator
440
4204
400
380
360
340
3204
300
0 20 40 60 80 100
Fig. 3.33 Generator rotor speed with SVC for Xc = 0.185 p.u.
1001
75-
50-
25-
0-
-25-
-50-
-75-
100-
• LFfttoLFBtoraue
— . • . ' • ; • ' . , ' ' . ' : - . - • ' > ; . . . • • .
\ \ ' ' ' 1 ' • l ' • • •
lllllilli ' ' 1 ' ' ' ' ' I ' '
— " * • •' • i w i- . i '. ; i ,- ' ' . ' , ' ' : ! ' >\'
• . i > ' i i 1 1 / • * i
' I t I t •"• t " i ' ' ' , " "
i
\ \ "' \ I j i !
10 20 30 40 50 60 70 80 90 100
Fig. 3.34 LPA-LPB torque without SVC for Xc = 0.185 p.u.
•LBMoLFB torque
20.0- — *—
15.0
10.0
5.0-
0.0 - ,
-5.0-
-10.0-
-15.0-
-20.0 0 20 40 60 80 100
Fig. 3.35 LPA-LPB torque with SVC for X c = 0.185 p.u.
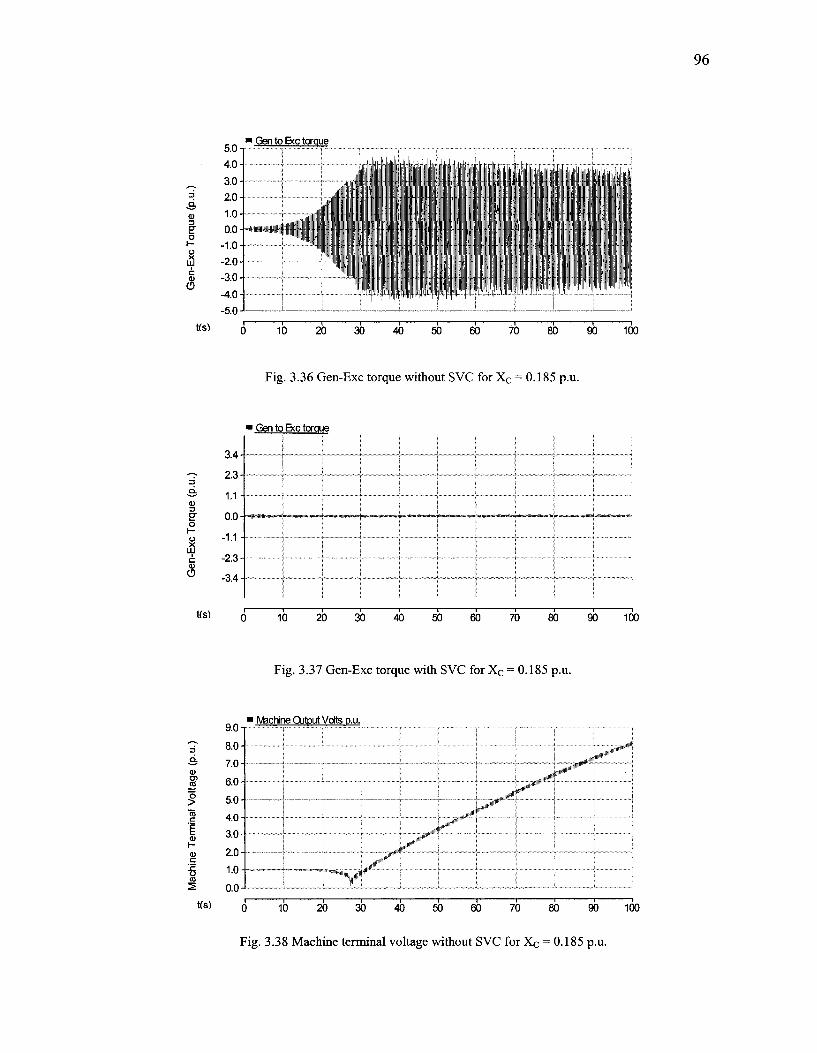
^ -E
xc T
orqu
e (p
.u
Gen
5.0-1
4.0-
3.0-
2.0-
1.0-
0.0-
-1.0-
-2.0-
-3.0-
-4.0-
• Gen to Exc torque
t •
- '• .' •
i i • i • i . i . :
. ' • , . ' • v • . • i-i . i , i > , •• • i
' , •; , • • • , • •
• ' • ' • • ' •• 1 . , . ' , ' •
>:• " • i ' , • . M , - i ' . • , i ; 1 . ; '
j i i • . i i . i
' ' " . . \ ' • ' : . ' • ! ' . ' • . " . ' 1 • I > . • I '
1 • . ' . • " . , ' •
I l l
| |[ 1 l[ 11 M l ' ! " > l l l • - | • | | • | | - 1 | •; 1 • | ;
1
. 1 •
• 1 1 1 •
1 1 . 1
1 1
Us) 10 20 30 40 50 60 70 80 90 100
Fig. 3.36 Gen-Exc torque without SVC for Xc = 0.185 p.u.
0) S" o h-o
I c <u CD
Us) 10 20 30 40 50 60
3.4-
2.3-
1.1-
•1.1-
2.3-
-3.4-
• Gen to Exc toraue
f j
™ ™ „ ™ m , ^ ™ « . » L j — ~ ~ ™ „ „ . ~ ,
t I I
~™.~™.~J
i * !
1
:
70 80 90 100
Fig. 3.37 Gen-Exc torque with SVC for Xc = 0.185 p.u.
1 & a> s? — 2
nal
erm
H 0) c fi ra ^
9.0
8.0
7.0
6.0
5.0
4.0
3.0
2.0
1.0
0.0
tfs)
' Machine Output Volts p.u.
**y X" X*
^ <*<*"
H0»*
0 10 20 30 40 50 60 70 80 90 100
Fig. 3.38 Machine terminal voltage without SVC for Xc = 0.185 p.u.

97
S
1.20
1.00-h-
0.80
0.60
0.40
0.20
0.00
Machine Cutout Volte p.u.
tfs) 0 10 20 30 40 50 60 70 90 100
Fig. 3.39 Machine terminal voltage with SVC for Xc = 0.185 p.u.
o > CO
o
t(s)
1.2k-
0.8k-
0.4k-
0.0-
-0.4k-
-0.8k-
-1.2k-
'Qsvc
\ \ \ ]\
0 10 ~20 30 40 50 60 70 80 90 100
Fig. 3.40 SVC reactive power for Xc = 0.185 p.u.
3.5 Effect of Signal Transmission Delay
An important aspect with remote signal acquisition is the transmission delay. This is
the delay in the transmission of the acquired signal from the remote site to the location
where it is to be used. The typical range of this delay is 40-50 milliseconds. The delayed
arrival of the remote signal to the FACTS Controller location may cause system
instability. As a result, suitable controllers have been recently designed to compensate the
effect of delay in damping inter-area oscillation modes typically in the frequency range
0.1-0.8 Hz [6].
98
The effect of transmission delay in remote signals is examined for the damping of SSR
modes (typically in the range of 10-40 Hz) by the SVC SSDC. It is found that a 40
milliseconds delay may cause the system to become unstable. The delay is modeled with
a transportation lag block (e"sT). Suitable compensator is being designed to offset the
effect of this delay.
3.6 Conclusions
In this chapter, the performance of the remote generator speed to damp SSR has been
studied. It is found that a subsynchronous damping controller (SSDC) of SVC that is
based on remote generator speed, can successfully damp all SSR modes for all critical
compensation levels. The SSDC has a simple structure of a proportional derivative
controller. The same SSDC can damp all subsynchronous oscillations modes for three
critical compensation levels. A minor change in the SSDC gain can stabilize all the
oscillation modes for the fourth critical compensation level, too. Thus the midpoint SVC
can achieve both the objectives of power transfer enhancement and SSR mitigation,
simultaneously. The signal transmission delay is found to make the system unstable. An
appropriate scheme of delay compensation is being developed.
3.7 References
[1] IEEE Committee Report, "Reader's Guide to Subsynchronous Resonance," IEEE
Trans, on Power Systems., vol. 7, no. 1, pp. 150-157, February 1992.
[2] IEEE Torsional Issues W.G., "Fourth supplement to a Bibliography for the Study
of Subsynchronous Resonance between Rotating Machines and Power Systems",
IEEE Transactions on Power Systems, Vol. 12, No. 3, pp. 1276-1282, Aug. 1997.
[3] R.M. Mathur and R.K. Varma, Thyristor-Based FACTS Controllers for Electrical
Transmission Systems IEEE Press and Wiley Interscience, New York, USA, Feb.
2002.
99
[4] A. E. Hammad and M. El-Sadek, "Application of a Thyristor Controlled VAR
Compensator for Damping Subsynchronous Oscillations in Power Systems,"
IEEE Trans, on Power Apparatus and Systems, vol. PAS-1-3, no. 1, pp. 198-212,
Jan. 1984.
[5] D.G. Ramey, D.S. Kimmel, J.W. Dorney and F.H. Kroening, "Dynamic
Stabilizer Verification Tests at the San Juan Station", IEEE Transactions on
Power Apparatus and Systems, vol.100, pp. 5011-5019, Dec. 1981.
[6] Innocent Kamwa, Robert Grondin and Yves Hebert, "Wide Area Measurement
Based Stabilizing Control of Large Power Systems-A Decentralized/ Hierarchical
Approach," IEEE Trans, on Power Systems, vol. 16, no. 1, pp. 136-153, Feb
2001.
[7] R. Majumder, B. Chaudhuri, B. C. Pal and Q. C. Zhong, "A Unified Smith
Predictor Approach for Power System Damping Control Design using Remote
Signals," IEEE Trans. Control Systems Technology, vol. 13, no. 6, pp. 1063-1068,
Nov. 2005.
[8] K. R. Padiyar and R. K. Varma, "Static Var System Auxiliary Controller for
Damping Torsional Oscillations," International Journal of Power and Energy
Systems, Vol. 12, No. 4, pp. 271-286, October 1990.
[9] K. R. Padiyar, R. K. Varma, S. Gupta, and M. Kumar, "A Novel Static Var
System Control for damping Subsynchronous Oscillations," Proceedings of VII
National Power System Conference, New Delhi, India, December 1994, pp. 331-
335.
[10] K.R. Padiyar and R.K. Varma, "Damping Torque Analysis of Static Var System
Controllers", IEEE Transactions on Power Systems, Vol. 6, No. 2, pp. 458-465,
May 1991.
[11] IEEE Committee Report, "First Benchmark Model for Computer Simulation of
Subsynchronous Resonance," IEEE Trans, on Power Apparatus and Systems, vol.
PAS-96, no. 5, pp. 1565-1572, Sept. / Oct. 1977.
[12] J. H. Chow, Juan J. Sanchez-Gasca, Haoxing Ren and Shaopeng Wang, "Power
System Damping Controller Design using Multiple Input Signals," IEEE Control
System Magazine, pp. 82-90, Aug. 2000.

[13] DSA Power Tools User manual, Power Tech Lab, Surrey, BC, 2005.
[14] EMTDCPSCAD User Manual, HVDC Research Center, Manitoba, 2003.
[15] P. Kundur, Power Systems Stability and Control: New McGraw-Hill, 1994.
CHAPTER 4
Mitigation of Subsynchronous Resonance in a
Series Compensated Wind Farm using FACTS
Controllers
4.1 Introduction
Environmental pollution and shortage of conventional fossil fuel are the two major
concerns which have led to the global emergence of wind energy as an effective means of
power production. Wind generating capacities have increased from negligible levels in
early nineties to over 74 GW today [1-2]. This shift to wind energy will inevitably lead to
large wind turbine generators (WTG) being integrated into electric power grids. It will be
further necessary to transmit the generated power through transmission networks that can
sustain large power flows. It is well known that series compensation is an effective means
of increasing power transfer capability of an existing transmission network. However,
series compensation is shown to cause a highly detrimental phenomenon called
Subsynchronous Resonance in electrical networks [3-4].
Flexible AC Transmission System (FACTS) can provide an effective solution to
alleviate SSR [5-9] and Thyristor Based FACTS Controllers have been employed in field
for this purpose [10-11]. Wind turbines are subject to mechanical modes of vibrations
related to turbine blades, shaft, gear train, tower, etc [12-13]. In the case of wind turbine
generators operating radially on the end of a series compensated transmission line there is
the potential for induction machine self-excitation SSR [14-15].
102
The main motivation behind this work is to utilize thyristor based FACTS devices for
mitigation of SSR. The FACTS devices may be already installed for achieving other
objectives and SSR damping function can be additionally included, or the FACTS
devices can be exclusively connected for mitigating SSR. For instance, an SVC may be
already located at the wind farm for dynamic reactive power support or for other power
quality improvement purposes. Similarly, a TCSC may already be inserted in the
transmission network to increase the power transfer capability, and the large capacity
wind farm may now need to evacuate power through this series compensated network.
In this work, both an SVC at the wind farm terminal and a TCSC in series with the
line are applied to damp subsynchronous oscillations. The SVC performance is examined
with both voltage controller and auxiliary SSR Damping Controller (SSRDC). The TCSC
is equipped with a current controller. The performance of SVC and TCSC in damping
SSR is investigated over a wide range of operating conditions.
The organization of the chapter is as follows. The two mechanisms of SSR - induction
generator (IG) effects and torsional interaction (TI) effects are briefly described in section
4.2. Section 4.3 outlines the study system configuration; section 4.4 proves the potential
occurrence of SSR both due to IG and TI effects in a series compensated wind farm.
Section 4.5 covers the control system design of the SVC and TCSC. The performance of
the SVC in mitigating SSR is shown in section 4.6. The comparative performance of
SVC and TCSC in obviating SSR is presented in section 4.7. Finally section 4.8
concludes the chapter.
4.2 Subsynchronous Resonance
Subsynchronous resonance occurs in a power system network when the mechanical
system of the generator exchanges energy with the electrical network [3-4]. Series
compensation in the line results in excitation of subsynchronous currents at electrical
frequency^ given by:

103
fe~f0jXCj; (4-D
Where xc = reactance of the series capacitor; x% = reactance of the line including that of
the generator and transformer; and fo - the nominal frequency of the power system.
These currents result in rotor torques and currents at the complementary frequency/- as
fr=fo~ fe (4.2)
These rotor currents result in subsynchronous armature voltage components which
may enhance subsynchronous armature currents to produce SSR. There are two aspects
of the SSR:
(a) Self excitation involving both Induction generator effect and Torsional Interaction
(b) Transient torque (also called as transient SSR)
4.2.1 Induction Generator Effect
Self-excitation of the electrical system alone is caused by induction generator effect.
This can be explained in case of a wind farm comprising self excited induction generators
(SEIG) from the generic equivalent circuit of SEIG drawn in Fig. 4.1. As the rotating
MMF produced by the subsynchronous frequency armature currents is moving at a speed
Ns which is slower than the speed of the rotor Nr, the resistance of the rotor (at the
subsynchronous frequency viewed from the armature terminals) is negative, as the slip
"s" of the induction generator is negative. This is clear from the equivalent circuit shown
in Fig. 4.1.
s = s r
Ns (4-3)
When the magnitude of this resistance exceeds the sum of the armature and network
resistances at a resonant frequency, there will be self-excitation, and the subsynchronous
electrical current will tend to increase rapidly.
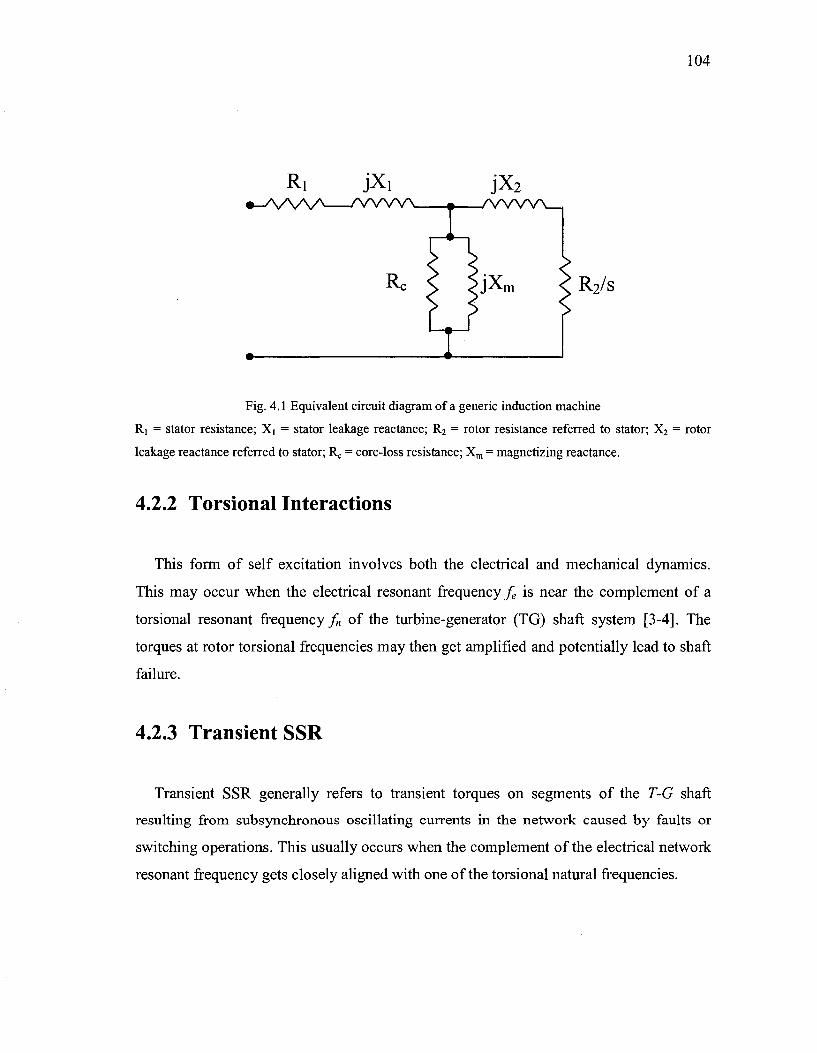
104
Ri •-AAM-
JXi w w w
Re
j'X2
• /WW\__
>JX: m R2/s
Fig. 4.1 Equivalent circuit diagram of a generic induction machine
R.! = stator resistance; Xi = stator leakage reactance; R2 = rotor resistance referred to stator; X2 = rotor
leakage reactance referred to stator; Re = core-loss resistance; Xm = magnetizing reactance.
4.2.2 Torsional Interactions
This form of self excitation involves both the electrical and mechanical dynamics.
This may occur when the electrical resonant frequency fe is near the complement of a
torsional resonant frequency^ of the turbine-generator (TG) shaft system [3-4]. The
torques at rotor torsional frequencies may then get amplified and potentially lead to shaft
failure.
4.2.3 Transient SSR
Transient SSR generally refers to transient torques on segments of the T-G shaft
resulting from subsynchronous oscillating currents in the network caused by faults or
switching operations. This usually occurs when the complement of the electrical network
resonant frequency gets closely aligned with one of the torsional natural frequencies.
105
4.3 System Configuration
4.3.1 Choice of the System Parameters
Wind farms with tens or even hundreds of similar wind turbine generators (WTGs)
have been erected, leading to large scale wind power projects [1]. The choice of the study
systems in this chapter are based on the rating of wind farms functioning in Ontario
province in Canada, as well as the wind farms operational worldwide. In Ontario, wind
farms of 100 MW capacity are already in service for instance, the Kings Bridge North II
wind farm and the Erie Shore wind farm at Port Burwell.
In USA, the King Mountain Wind Range in Upton County, West Texas consists of
214 wind turbines of 1.3 MW each leading to a capacity of 278.2 MW [21]. Moreover,
several alternatives of integrating 500 MW to 1000 MW conventional induction wind
generations are being investigated into the Dakotas transmission system, for export to the
Twin Cities, Wisconsin, Iowa and Illinois [14]. In [20], a conventional synchronous
generator is replaced with an equivalent wind turbine of 500 MVA rating. Based on these
practical systems, the system studies in this chapter are conducted for a wind farm having
a power output varying from 100 to 500 MW. Most studies are reported for a realistic
wind power generation of 100 MW. Since a majority of existing Wind Turbine
Generators (WTGs) are based on Self Excited Induction Generator (SEIG) [1], the
studies in this chapter are conducted with SEIG based WTGs. In addition to that, as SEIG
is an economic and widely used wind turbine generator with its inherent ruggedness, it is
still being installed in actual field.
4.3.2 Actual Study System
The transmission network of the study system is derived essentially from the IEEE
first benchmark model of SSR studies [16]. There are two separate systems which have
been investigated. First of all, a set of coherent induction generators is connected to grid
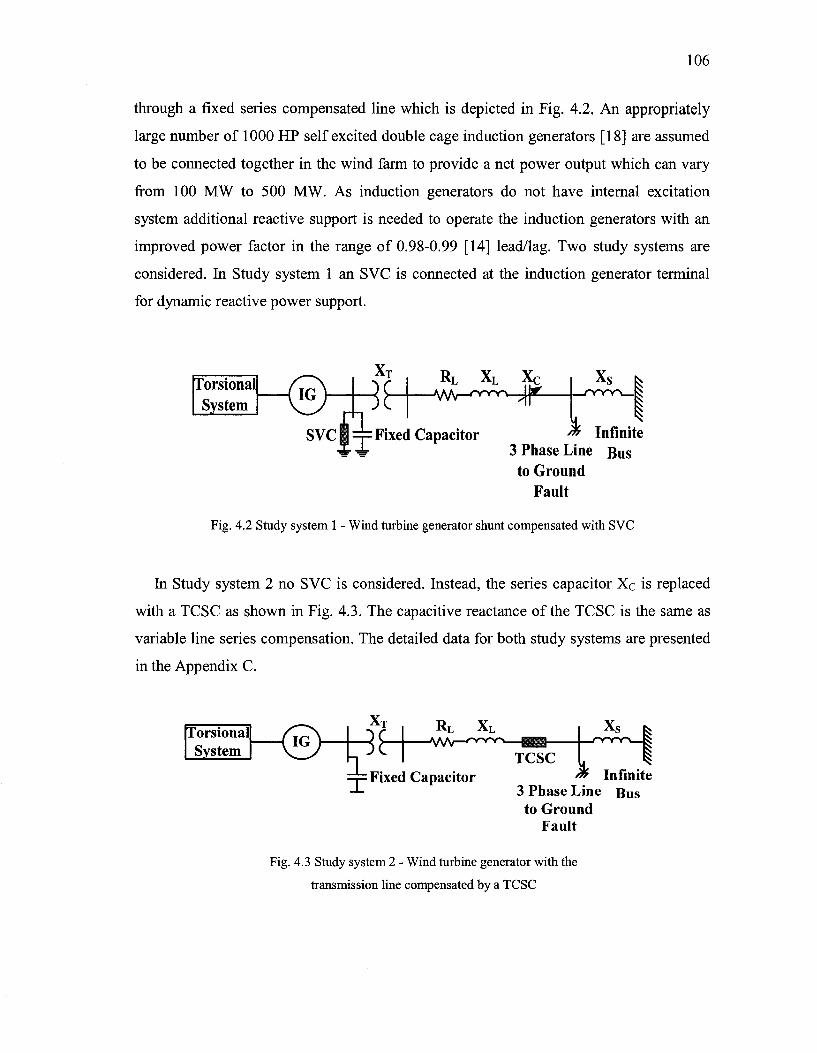
106
through a fixed series compensated line which is depicted in Fig. 4.2. An appropriately
large number of 1000 HP self excited double cage induction generators [18] are assumed
to be connected together in the wind farm to provide a net power output which can vary
from 100 MW to 500 MW. As induction generators do not have internal excitation
system additional reactive support is needed to operate the induction generators with an
improved power factor in the range of 0.98-0.99 [14] lead/lag. Two study systems are
considered. In Study system 1 an SVC is connected at the induction generator terminal
for dynamic reactive power support.
RL XL XC Torsional System
s v c | ^ \ Fixed Capacitor * Infinite 3 Phase Line Bus
to Ground Fault
Fig. 4.2 Study system 1 - Wind turbine generator shunt compensated with SVC
In Study system 2 no SVC is considered. Instead, the series capacitor Xc is replaced
with a TCSC as shown in Fig. 4.3. The capacitive reactance of the TCSC is the same as
variable line series compensation. The detailed data for both study systems are presented
in the Appendix C.
Torsional System © XT
=r= Fixed Capacitor
RL X L
TCSC % Infinite
3 Phase Line Bus to Ground
Fault
Fig. 4.3 Study system 2 - Wind turbine generator with the
transmission line compensated by a TCSC
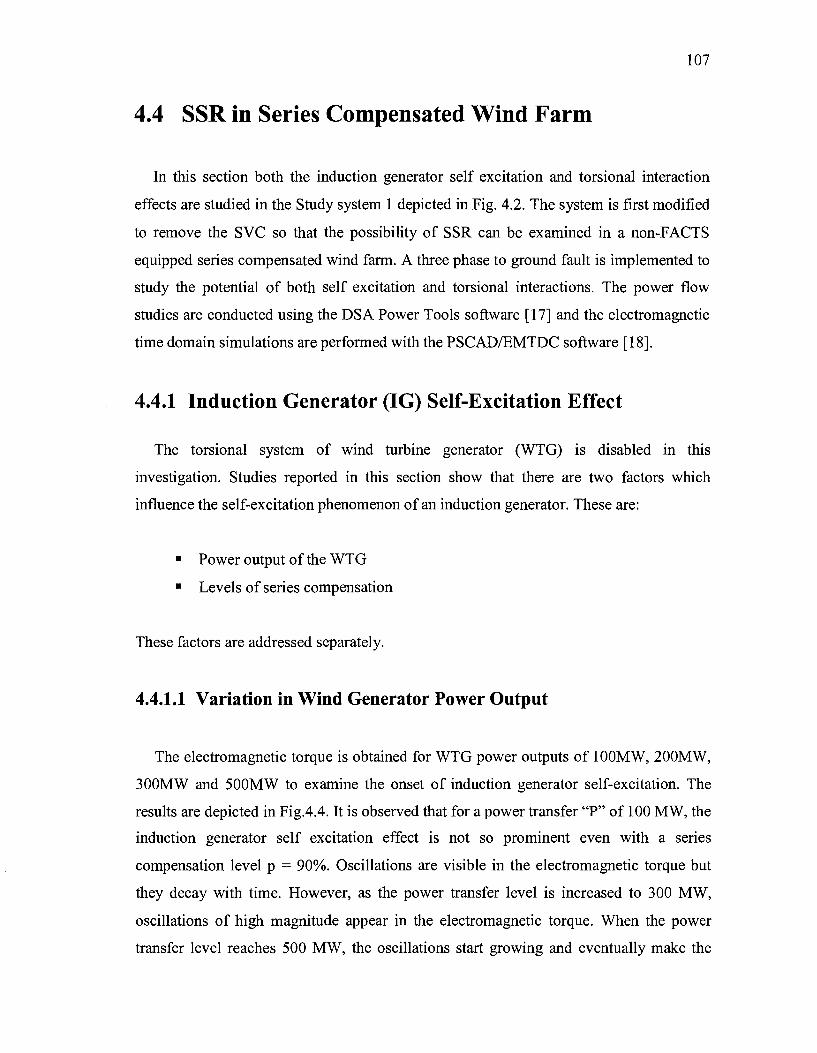
107
4.4 SSR in Series Compensated Wind Farm
In this section both the induction generator self excitation and torsional interaction
effects are studied in the Study system 1 depicted in Fig. 4.2. The system is first modified
to remove the SVC so that the possibility of SSR can be examined in a non-FACTS
equipped series compensated wind farm. A three phase to ground fault is implemented to
study the potential of both self excitation and torsional interactions. The power flow
studies are conducted using the DSA Power Tools software [17] and the electromagnetic
time domain simulations are performed with the PSCAD/EMTDC software [18].
4.4.1 Induction Generator (IG) Self-Excitation Effect
The torsional system of wind turbine generator (WTG) is disabled in this
investigation. Studies reported in this section show that there are two factors which
influence the self-excitation phenomenon of an induction generator. These are:
• Power output of the WTG
• Levels of series compensation
These factors are addressed separately.
4.4.1.1 Variation in Wind Generator Power Output
The electromagnetic torque is obtained for WTG power outputs of 100MW, 200MW,
300MW and 500MW to examine the onset of induction generator self-excitation. The
results are depicted in Fig.4.4. It is observed that for a power transfer "P" of 100 MW, the
induction generator self excitation effect is not so prominent even with a series
compensation level p = 90%. Oscillations are visible in the electromagnetic torque but
they decay with time. However, as the power transfer level is increased to 300 MW,
oscillations of high magnitude appear in the electromagnetic torque. When the power
transfer level reaches 500 MW, the oscillations start growing and eventually make the

108
system unstable. At this high power level, the induction generator is operated at a much
higher speed over the synchronous speed. This increased power transfer makes the
apparent negative rotor resistance exceed the sum of total armature and network
resistance, thus giving rise to subsynchronous oscillations. The dominant electrical mode
'%" in this case is 20.54 Hz.
For each power flow level, if the line resistance is decreased, these oscillations
become larger and continue for a longer duration which is expected of induction
generator self excitation oscillations. However, the line resistance reduction is not a
realistic option and is hence not reported here.
4.4 4.6 Time (s)
4.4 4.6 Time (s)
Fig. 4.4 Electromagnetic torque for different WTG power outputs and same series compensation level

109
1
0.5
0
-0.5
CD C O) «J E S o .S> ill
-1
-1.5
-2
-2.5
- i __—j L i- i
fliii! If liilttiii •If'111 1 1-1 ! flllWIM
- - l-l v l L - i i 1 (c) P: 300 MW; p = 90%
4.2 4.4 4.6 Time (s)
4.8
4.4 4.6 Time (s)
Fig. 4.4 (Contd.)
4.4.1.2 Variation in Levels of Series Compensation
Next, the series compensation level is varied for 500 MW generator power output. The
electromagnetic torque is depicted for 50%, 60% and 80% line compensation in Fig. 4.5
while that for 90% compensation is already illustrated in Fig. 4.4. It is observed that with
increasing series compensation levels the oscillations due to induction generator self
excitation get enhanced making the system eventually unstable. The electrical frequency
fe in the electromagnetic torque increases according to (1) and consequently, the rotor
torque frequency/- decreases as in (2).

110
4.4 4.6 Time (s)
4.4 4.6 Time (s)
4.4 4.6 Time (s)
Fig. 4.5 Electromagnetic torque for different series compensation
and same power flow level

I l l
4.4.2 Torsional Interactions (TI)
A very high level of series compensation is typically needed as indicated by (1) and
(2) to generate a rotor torque at a frequency in the close vicinity of the resonant frequency
of the wind turbine mechanical system (comprising rotor blades and gear train). There are
in fact two typical resonant frequencies [12-13]:
• 1.1 Hz corresponding to the tower side ways oscillations
• 2.5 Hz relating to mechanical system
A two-mass torsional system model is added to the induction generator model in
PSCAD [18]. Since both the frequencies are very close, only one torsional frequency is
considered to represent the effect of both these natural frequencies. Hence, Mass 1
models the combined tower and wind turbine mechanical system and Mass 2 represents
the inertia of the generator, hi this case also varied levels of power flow as well as series
compensations are considered to verify the existence of the torsional interactions.
4.4.2.1 Variation in Wind Generator Power Output
The WTG power output is varied with a very high level of series compensation of
90%. Fig 4.6 depicts both the electromagnetic torque Te and mechanical torque between
mass 1 and mass 2, Tn, for varying levels of power flow of 50 MW, 70 MW and 100
MW. It is observed that even at 70 MW power flow the system becomes unstable with
growing oscillations visible both in Te and Tn-
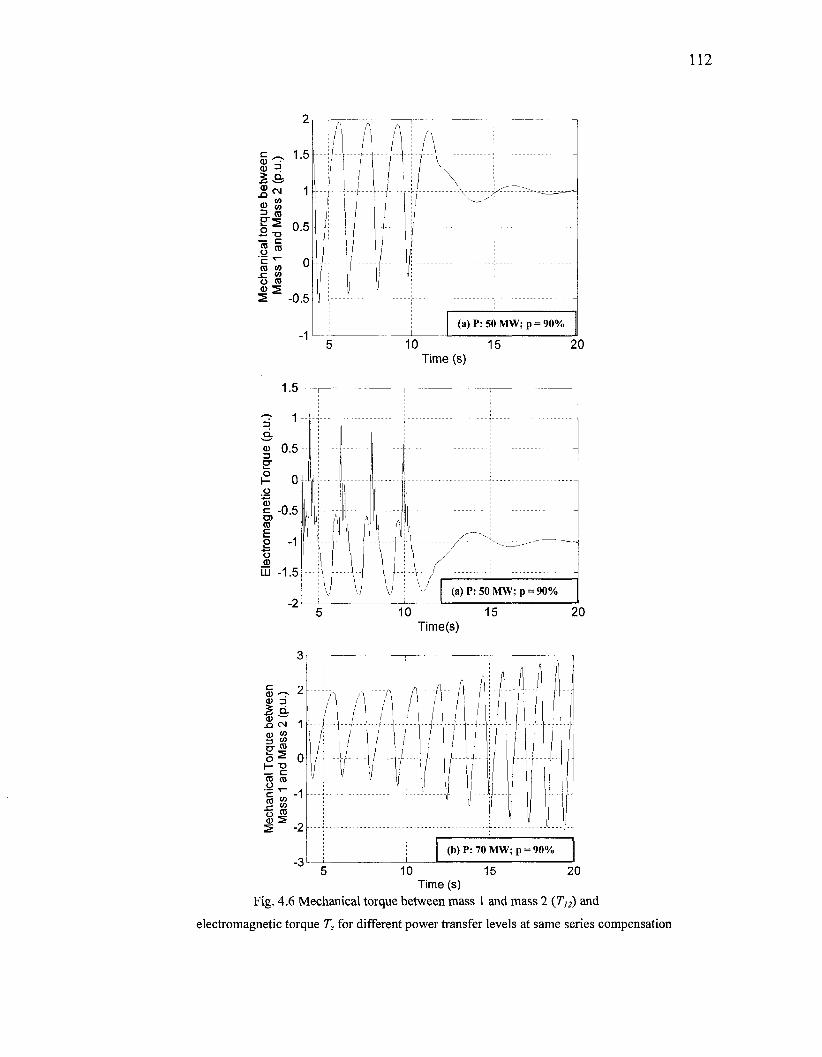
O
CfQ
3 CO
c ro
CO
3
2 qo" £ ro
o
3" o
Mec
hani
cal T
orqu
e be
twee
n M
ass
1 an
d M
ass
2 (p
.u.)
Ele
ctro
mag
netic
Tor
que
(p.u
.) M
echa
nica
l tor
que
betw
een
Mas
s 1
and
Mas
s 2
(p.u
.)
a. •—
1 CD
T
3 O 3 transfe ^ 01 <
ro
ro 2 ro ro nmass H
-*
s 5 P.
d 3 e(s)
to
ro
re"
o
o 3 T
3 ro
3 w
95
rt- o
3
H, and
O
to

Ele
ctro
mag
netic
Tor
que
(p.u
.)
Mec
hani
cal t
orqu
e be
twee
n M
ass
l an
d M
ass
2 (p
.u.)
E
lect
rom
agne
tic T
orqu
e (p
.u.)
OJ

114
4.4.2.2 Variation in Levels of Series Compensation
The mechanical torque Tn between Mass 1 and Mass 2 and electromagnetic torque Te
of the WTG are depicted for varying levels of series compensations of 50%, 65% at 100
MW power flow in Fig. 4.7. The results for 90% are already displayed in Fig. 4.6. It is
observed that with increasing series compensation levels the oscillations due to torsional
interaction also get enhanced making the system eventually unstable even at realistic
levels of compensation of 65% [3,4,5,19]. In each case, the electromagnetic torque signal
displays both the torsional mode and subsynchronous electrical mode oscillations super
imposed on it.
10 15 Time (s)
20
10 15 20 Time (s)
Fig. 4.7 Mechanical torque between mass 1 and 2 (T12) and electromagnetic torque Te for different series compensation and same power flow; fr = 0.8 Hz

115
3 Q.
3 a -
a> c CO
o
LU
10 15 Time (s)
20
10 15 Time (s)
Fig. 4.7 (Contd.)
20
4.5 Controller Design of SVC and TCSC
4.5.1 Controller Design of SVC
In Study system 1, the SVC is mainly used to regulate the wind farm bus voltage
during disturbances in the system. An auxiliary subsynchronous resonance damping
controller (SSRDC) is designed and added suitably to enhance the torsional mode
damping of the system. The general configuration of an SVC with its voltage regulator
and auxiliary controller is shown in Fig. 4.8.

116
Voltage Regulator SVC
Power System
A V - H | H K ' ^ Gsvc(s) G(s)
Auxiliary Signal ASig
H(s)
Auxiliary Controller
Fig. 4.8 Generalized SVC auxiliary control
In this study the voltage regulator is a simple PI controller whose proportional gain is
set to zero. The integral gain is selected by systematic hit-and-trial method using time
domain simulation [18] to give the best Kj which results in a fast rise time and minimal
settling time with acceptable overshoot (10%) in generator terminal voltage in response
to a step change in the reference voltage Vref. The auxiliary controller H(s) can take
different structures depending on which control design technique is being employed [19].
The structure of the auxiliary subsynchronous damping controller (SSRDC) is shown in
Fig. 4.9 where ASig represents the incremental value of the auxiliary signal or the
feedback signal. The different signals generally considered as input to the auxiliary
controller are line real power flow, line current magnitude, bus frequency, bus voltage
magnitude, etc [6]. In this chapter, the wind turbine generator speed deviation (Aco) has
been used as an auxiliary signal to damp the unstable modes.
AY ref
ASig^ Washout Block
- * •
Proportional Controller -*®-
Measured Voltage
PI Controller AB ' re f
Fig. 4.9 Structure of SVC Subsynchronous Resonance Damping Controller (SSRDC)
The SSRDC comprises a simple proportional controller through a washout circuit. The
purpose of washout circuit is to prevent the auxiliary controller from responding to steady

117
state power flow variation. The proportional gain of SSRDC is determined from
systematic hit and trial using the nonlinear time domain simulation using PSCAD
software to result in fastest settling time. The output of the SSDC is then fed to SVC
voltage regulator as shown in Fig. 4.9.
4.5.2 Controller Design of TCSC
The thyristor controlled series capacitor (TCSC) increases the power transfer
capability of a transmission network in addition to several other functions [5-6]. It
provides a rapid, continuous control of the transmission line series compensation level
thus dynamically controlling the power flow in the line.
In Study system 2, the TCSC is assumed to be primarily employed in the network for
controlling line reactance and thereby the power flow. The SSR damping function is
added through constant current control for this study. It is reported [9] that a TCSC
operating at fundamental frequency offers a pure capacitive reactance to increase the
power transfer capability of the network. On the other hand the same TCSC offers
resistive and inductive impedance at subsynchronous frequencies which assists in
damping subsynchronous modes. The resistive impedance of the TCSC increases with the
increased boost factor which is the ratio of the capacitive reactance offered by the TCSC
and the total line reactance.
The general configuration of a TCSC is shown below:
X f
Fig. 4.10 General configuration of a TCSC
For this configuration the equivalent TCSC reactance is computed as per the following
equation:

118
XTCSC = XC ~ xi 2y? + sin2/?
XC ~XL +
4X£ cos 2 p k tan k/3 - tan fi
n XC-XL k2_l 71 (4.4)
Here /? = angle of advance (before the forward voltage becomes zero) = n-oc, a is the
firing angle of the thyristors. It is noted from (4) that a parallel resonance is created
between Xc and XL at the fundamental frequency, corresponding to the values of firing
angle ares, given by:
a res -n - (2m -1 )
TtCO
2cor (4.5)
The different resonances can be reduced to only one by proper choice of k = cor/oo =
V (Xc/ XL) in the range 90° < a < 180°. As Xc is known, XL can be calculated once a
proper value of k is chosen to ensure a single resonant peak. Once the Xc and XL values of
the TCSC are computed, a closed loop current control scheme is employed for the
proposed application. The functional block diagram of TCSC is depicted in Fig. 4.11.
a
1
'•' »£s v2
^Line
$ ~
Xc., II
X L ~ L
PI Controller — •
Linearization Block
r — > •
Lj T2
Firing Pulse Ge nerator
)
^
Fig. 4.11 TCSC Constant Current Controller
Here Iref is the pre-fault or pre-contingency current calculated from EMTDC/PSCAD
line-current phasor. The main current controller is a PI Controller. The parameters of this
controller are also adjusted systematically through electromagnetic transient simulation
studies by hit-trial to get the minimum settling time or fastest damping.

119
4.6 Performance of SVC in the Mitigation of SSR
Having demonstrated above that the SSR phenomenon can potentially exist in the
series compensated wind farms, the damping of subsynchronous oscillations (SSO)
through SVC control is now considered in this section.
4.6.1 Damping of IG Effect
The performance of the SVC in alleviating IG effect is evaluated at the worst possible
operating point of 500 MW power transfer and 90% series compensation level. Fig. 4.12
depicts signals below with and without SVC voltage regulator.
• Electromagnetic torque of the generator (Te)
• Generator rotor speed {cor)
• Generator terminal voltage (Vt)
• SVC reactive power (Qsvc)
6. a> or
CD £ TO . as E p
_CD - 4
Without SVC •With SVC VR
ill!
T r; |Ti!'i'^ ijlfrij: l|§; fejlS
^f^t i : ^ ?1 T^ i ^ L iri^: iH ii ii '- i^ i^^: N ii i il I ; V; n if ' 1 i'^ r?'i'r iit n; B i; w i | • f: i iri 'rH
(a)
4 5 6 7 8 9 10 Time (s)
Fig. 4.12 Performance of SVC in damping SSO due to IG effect: (a) Electromagnetic torque
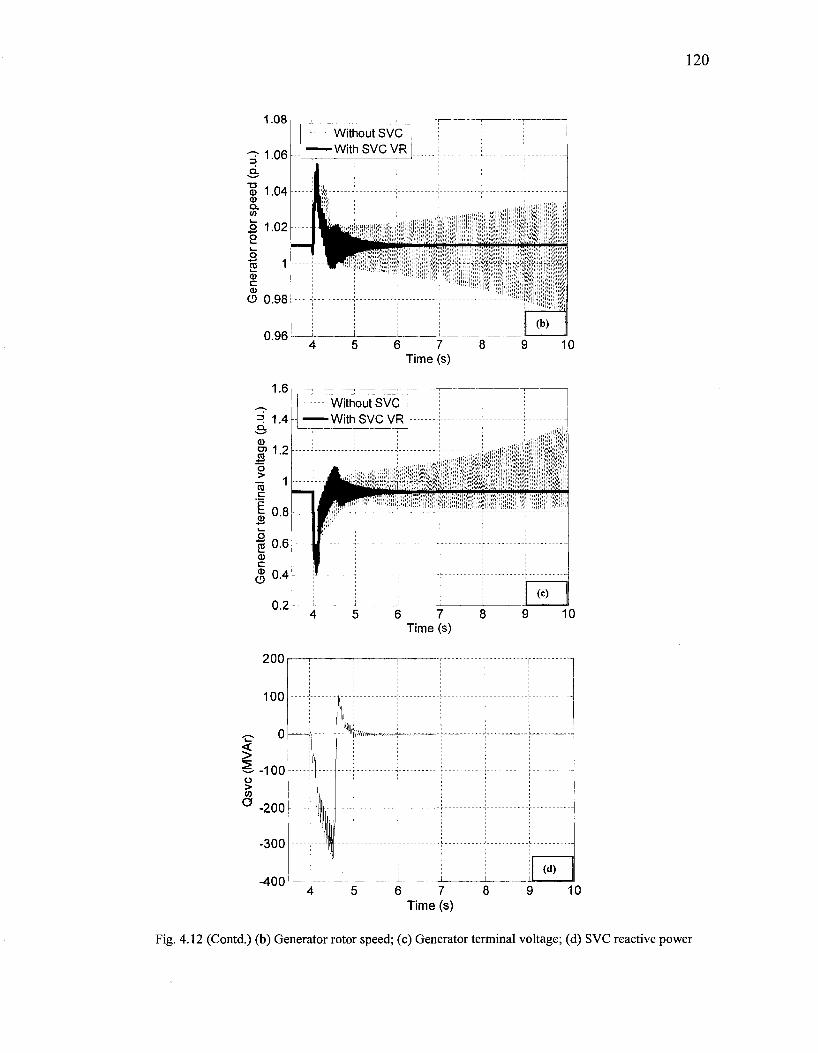
1.08
SSiiMffl
(b)
6 7 Time (s)
10
1.6
=! 1.4
| 1-2 o
c
0.8
| 0.6
c (D O
0.4
0.2
Without SVC •With SVC VR
i BWIftife^
(c)
6 7 Time (s)
10
2 o > to
O
200
100
0
-100
-200
-300
-400 (d)
6 7 8 9 Time (s)
10
Fig. 4.12 (Contd.) (b) Generator rotor speed; (c) Generator terminal voltage; (d) SVC reactive power
121
4.6.2 Damping of TI Effect
Torsional interactions become prominent at a power transfer level of 100 MW. As a
result the damping performance of SVC with respect to TI effect is shown at 100 MW
power flow and 90% series compensation. The signals reported to demonstrate the
damping performance of SVC are:
• Mechanical torque between Mass 1 and Mass 2 {Tii)
• Generator rotor speed (a>r)
• SVC reactive power (Qsvc)
The impact of the SVC voltage regulator and SSRDC is displayed in Fig. 4.13. It is
observed that the SVC voltage regulator damps the SSO due to TI effect. Moreover, the
damping is substantially enhanced by SSRDC of SVC.
10 15 Time (s)
Fig. 4.13 Performance of SVC in damping SSO due to TI Effect (a) Mechanical torque between Mass 1 and Mass 2
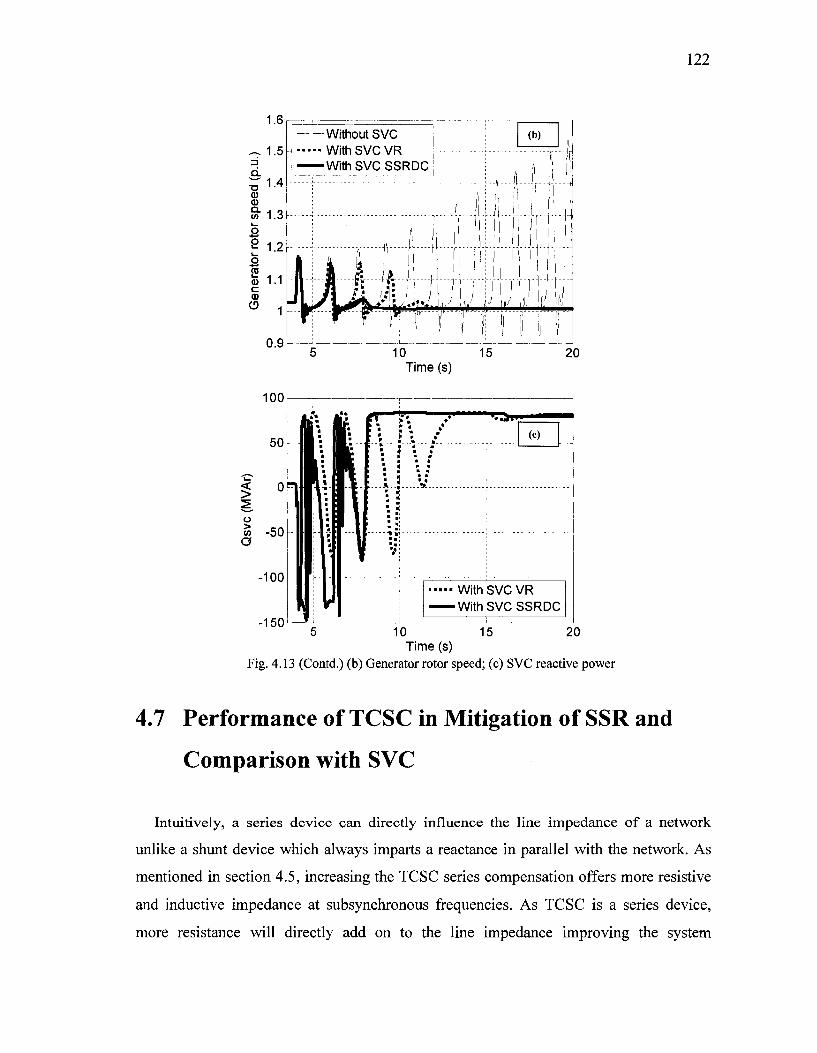
122
100
Time (s)
With SVC VR With SVC SSRDC
-150 5 10 15 20
Time (s) Fig. 4.13 (Contd.) (b) Generator rotor speed; (c) SVC reactive power
4.7 Performance of TCSC in Mitigation of SSR and
Comparison with SVC
Intuitively, a series device can directly influence the line impedance of a network
unlike a shunt device which always imparts a reactance in parallel with the network. As
mentioned in section 4.5, increasing the TCSC series compensation offers more resistive
and inductive impedance at subsynchronous frequencies. As TCSC is a series device,
more resistance will directly add on to the line impedance improving the system

123
damping. From these two factors TCSC is expected to be more effective in damping SSR
both due to torsional interactions and induction generator effects. The following figures
compare the performance of the TCSC and SVC in damping IG and TI effects. In case of
torsional interactions TCSC closed-loop current control performs even better than the
SSRDC of the SVC.
4.7.1 Damping of IG Effect
In this case, the damping performance of the TCSC is shown for the worst possible
operating condition of 500 MW power flow and 90% series compensation. The signals
utilized for examining the damping performance of TCSC are:
• Electromagnetic torque of the generator (Te)
• Generator rotor speed {cor)
• Generator terminal voltage (Vt)
These signals are depicted in Fig. 4.14 for the cases - without any FACTS device, with
SVC voltage regulator (VR) and with TCSC current controller (CC). The performance of
TCSC is clearly superior in damping SSO due to IG effect for the case of 90% series
compensation.
4 4.5 5 Time(s)
Fig. 4.14 Performance comparison of SVC and TCSC in damping SSO due to IG effect
(a) Electromagnetic torque

124
1.08 Without FACTS With SVC-SSRDC WithTCSCCC
illiilMil
Fig. 4.14 (Contd.) (b) Generator rotor speed; (c) Generator terminal voltage
4.7.2 Damping for TI Effect
Finally, the damping of TCSC in mitigating torsional interaction is investigated. The
signals examined are:
Mechanical torque between Mass 1 and Mass 2 (Tj2)
Generator rotor speed (cor)
TCSC reactance (XTCSC)
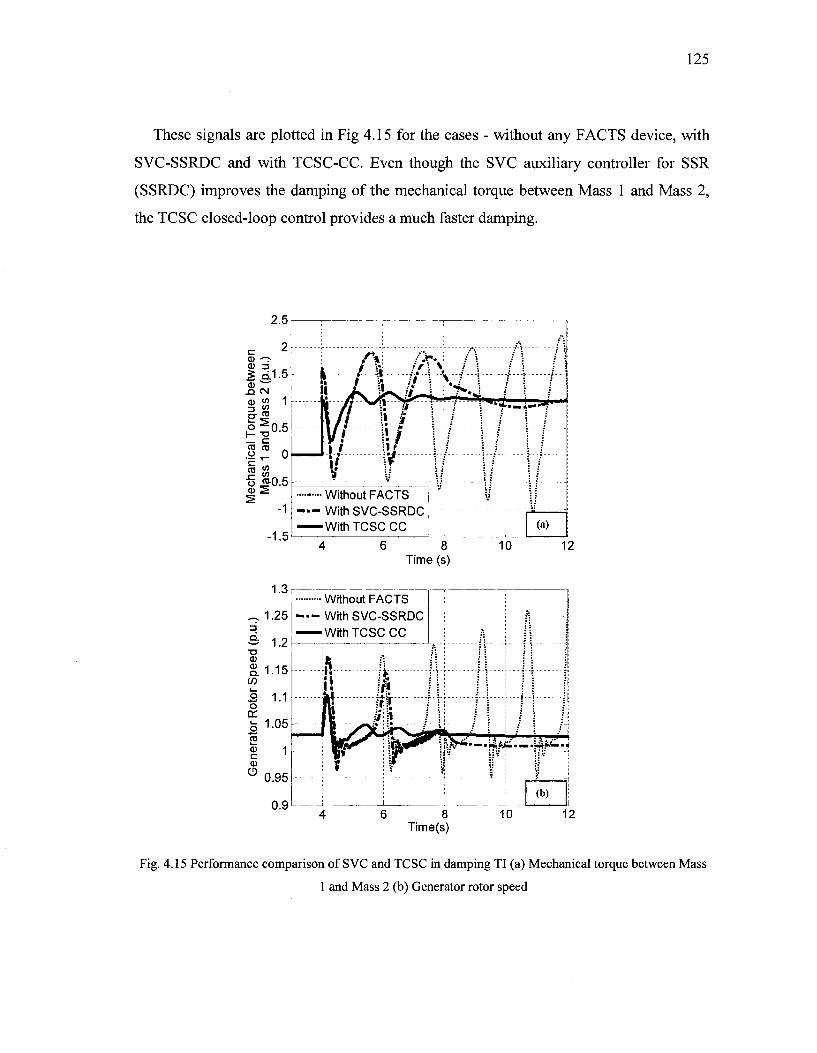
125
These signals are plotted in Fig 4.15 for the cases - without any FACTS device, with
SVC-SSRDC and with TCSC-CC. Even though the SVC auxiliary controller for SSR
(SSRDC) improves the damping of the mechanical torque between Mass 1 and Mass 2,
the TCSC closed-loop control provides a much faster damping.
2.5
c 2 CD -~?
M Q.1.5 CD ^ xa CM to w 1
.8 | 0
o J-0.5 CD 2
-1
-1.5
1.3
1.25
1.2
Without FACTS I — With SVC-SSRDC
— With TCSC CC
6 8 Time (s)
10 12
T3 CD
8.1.15 in 3 1.1 o a: S 1.05 S CD 1 C ' CD
° 0.95
0.9
Without FACTS With SVC-SSRDC With TCSC CC
Fig. 4.15 Performance comparison of SVC and TCSC in damping TI (a) Mechanical torque between Mass
1 and Mass 2 (b) Generator rotor speed
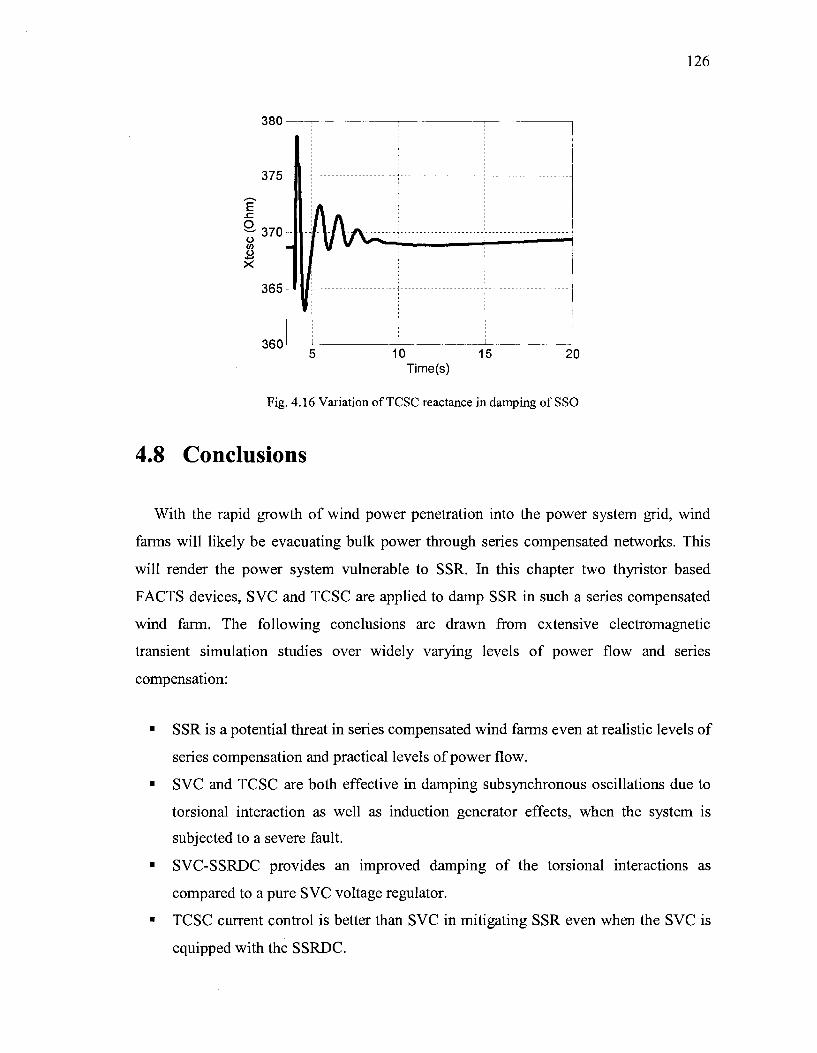
126
380
375
E .c O o (/> o
370
365
360 10 15 Time(s)
20
Fig. 4.16 Variation of TCSC reactance in damping of SSO
4.8 Conclusions
With the rapid growth of wind power penetration into the power system grid, wind
farms will likely be evacuating bulk power through series compensated networks. This
will render the power system vulnerable to SSR. In this chapter two thyristor based
FACTS devices, SVC and TCSC are applied to damp SSR in such a series compensated
wind farm. The following conclusions are drawn from extensive electromagnetic
transient simulation studies over widely varying levels of power flow and series
compensation:
SSR is a potential threat in series compensated wind farms even at realistic levels of
series compensation and practical levels of power flow.
SVC and TCSC are both effective in damping subsynchronous oscillations due to
torsional interaction as well as induction generator effects, when the system is
subjected to a severe fault.
SVC-SSRDC provides an improved damping of the torsional interactions as
compared to a pure SVC voltage regulator.
TCSC current control is better than SVC in mitigating SSR even when the SVC is
equipped with the SSRDC.
127
In this chapter, the possibility of SSR occurrence is studied with self-excited induction
generators (SEIG) based wind farms. Studies are presently being conducted to investigate
the SSR potential with WTGs based on doubly fed induction generators (DFIG) and AC-
DC-AC converter based synchronous generators.
4.9 References
[ 1 ] IEEE Power & Energy Magazine, November/December 2005.
[2] T. Ackerman, Power Wind Power in Power Systems, John Wiley & Sons, 2005.
[3] IEEE Committee Report, "Reader's Guide to Subsynchronous Resonance," IEEE
Trans, on Power Systems, vol. 7, no. 1, pp. 150-157, February 1992.
[4] IEEE Working Committee Report, "Third Supplement to a Bibliography for the
Study of Subsynchronous Resonance between Rotating Machines and Power
Systems," IEEE Trans, on Power Systems, vol. 6, no. 2, pp. 830-834, May 1991.
[5] N. G. Hingorani and L. Gyugyi, Understanding FACTS, IEEE Press, 1996.
[6] R.M. Mathur and R.K. Varma, Thyristor-Based FACTS Controllers for Electrical
Transmission Systems IEEE Press and Wiley Interscience, New York, USA, Feb.
2002.
[7] A. E. Hammad and M. El-Sadek, "Application of a Thyristor Controlled VAR
Compensator for Damping Subsynchronous Oscillations in Power Systems,"
IEEE Trans, on Power Apparatus and Systems, vol. PAS-1-3, no. 1, pp. 198-212,
Jan. 1984.
[8] N.C. Abi Samra, R.F. Smith, T.E. McDermott and M.B. Chidester, "Analysis of
Thyristor Controlled Shunt SSR Counter Measures", IEEE Transactions on
Power Apparatus and Systems, Vol. 104, No.3, pp. 584-597, Mar 1985.
[9] W. Zhu, R. Spee, R.R. Mohler, G.C. Alexander, W.A. Mittelstadt, D.
Maratukulam, "An EMTP Study of SSR Mitigation Using the Thyristor
Controlled Series Capacitor", IEEE Transactions on Power Delivery, Vol. 10, No.
3, pp. 1479-1485, July 95.
128
[10] D.G. Ramey, D.S. Kimmel, J.W. Domey and F.H. Kroening, "Dynamic
Stabilizer Verification Tests at the San Juan Station", IEEE Transactions on
Power Apparatus and Systems, Vol.100, pp. 5011-5019, Dec. 1981.
[11] J.F. Hauer, W.A. Mittelstadt, RJ. Piwko, B.L. Damsky, and J.D. Eden,
"Modulation and SSR Tests Performed on the BPA 500kV Thyristor Controlled
Series Capacitor Unit at Slatt Substation", IEEE Trans. Power Systems, vol. 11,
No.2May 1996, pp. 801-06.
[12] T. Thiringer and J. A. Dahlberg, "Periodic Pulsations from a Three-Bladed Wind
Turbine," IEEE Trans, on Energy Conversion, vol. 16, no. 2, pp. 128-133, June
2001.
[13] E. N. Hinrichsen and P. J. Nolan, "Dynamics and Stability of Wind Turbine
Generators," IEEE Trans, on Power Apparatus and Systems, vol. PAS-101, no. 8,
pp. 2640-2648, Aug. 1982.
[14] P. Pourbeik, R. J. Koessler, D. L. Dickmander, and W. Wong, "Integration of
Large Wind Farms into Utility Grids (Part 2 - Performance Issues)," in Proc.
2003 IEEE Power Engineering Society General Meeting Conf, pp. 1520-1525.
[15] R. K. Varma and S. Auddy, "Mitigation of subsynchronous resonance in a series
compensated wind farm using static var compensator," in Proc. IEEE General
Meeting, Montreal, Quebec, June 18-22, 2006, Paper 06 GM1272.
[16] IEEE Committee Report, "First Benchmark Model for Computer Simulation of
Subsynchronous Resonance," IEEE Trans, on Power Apparatus and Systems ,vol.
PAS-96, no. 5, pp. 1565-1572, Sept. / Oct. 1977.
[ 17] DSA Power Tools User manual, Power Tech Lab, Surrey, BC, 2005.
[ 18] EMTDC PSCAD User Manual, HVDC Research Center, Manitoba, 2003.
[19] P. Kundur, Power Systems Stability and Control: New McGraw-Hill, 1994.
[20] J. J. Sanchez-Gasca, N. W. Miller and W. W. Price, " A Modal Analysis of a
Two-Area System with Significant Wind Power Penetration," in Proc. 2004 IEEE
Power Systems Conference and Exposition, pp. 1-5.
[21] J. G. Slootweg, and W. L. King, "Is the Answer Blowing in Wind?," IEEE Power
& Energy Magazine, pp. 26-33, November/December 2003.
CHAPTER 5
Overvoltages at the Point of Interconnection of a
Large Wind Farm and Extra High Voltage Double
Circuit Transmission Lines
5.1 Introduction
Ferroresonance and self-excitation are two known causes of severe overvoltages,
transformer saturation and harmonic pollution in power systems [1-4]. These two
phenomena can occur in a variety of system configurations. Double circuit transmission
line is one of the configurations where ferroresonance is reported to occur [2].
Application of extra high voltage (EHV) double circuit lines is an effective means of
transmitting bulk power over long distances. However, when the two lines run on the
same tower there exists a capacitive coupling between them. If one of the two lines gets
disconnected due to any contingency, high amount of electric charge is trapped in this
capacitive coupling which may interact with the magnetizing inductance of a transformer
connected to the de-energized line. This is a classical ferroresonance scenario and can be
the cause of severe overvoltages across transformer terminals [2]. With the increasing
penetration of wind energy based distributed generation in power systems, large wind
farms will likely be connected to the low tension side of such a transformer feeding the
grid through these EHV double circuit lines. The wind turbine generators may then be
subjected to overvoltages caused by ferreoresonance.

130
In a severe contingency of this nature warranting the disconnection of the main
transmission line, protection systems will ensure the shut down of the wind farm
connected to it. In this scenario, as an operational wind farm supplying power through the
same interconnection suddenly gets disconnected, self-excitation of the wind turbine
connected induction generator may occur due to its interaction with the compensating
capacitance connected either at its own terminal [5-9] or with the power electronic
converter associated with it. This self-excitation will aggravate the overvoltage and
eventually lead to potential damage of costly wind turbine generators and other installed
equipment.
Although the issue of overvoltages caused by distributed generators has been
addressed in literature [10-12], the case of large wind farms of capacity greater than 100
MW and especially its interconnection in the unique double circuit configuration, have
not been considered. In this chapter, first the wind farm is represented as a group of self-
excited double-cage induction generators with their detailed nonlinear electromagnetic
transient models. Later, the wind turbine generators are modeled as a vector controlled
doubly fed induction generator (DFIG) of appropriate rating. DFIG is also modeled in
detail, representing all the power electronic converters with their nonlinear high
frequency switching characteristics. A number of operating conditions are studied to
investigate the severity of the problem. It is observed that the overvoltages at the point of
interconnection and also at the generator terminal are generic and independent of
generator configurations. Several remedial measures have been further proposed to arrest
the overvoltage.
The organization of the chapter is as follows. In section 5.2 the study system is
described with its operating conditions. Modeling of the system is briefly outlined in
section 5.3. Section 5.4 proves the existence of ferroresonance in this unique
configuration of double circuit transmission line. The overvoltages encountered by the
wind farm with different modeling details are reported in section 5.5. In this section the
need for the field validated model of a doubly fed induction generator is pointed out.
Possible mitigating measures are proposed in section 5.6 with an emphasis on most
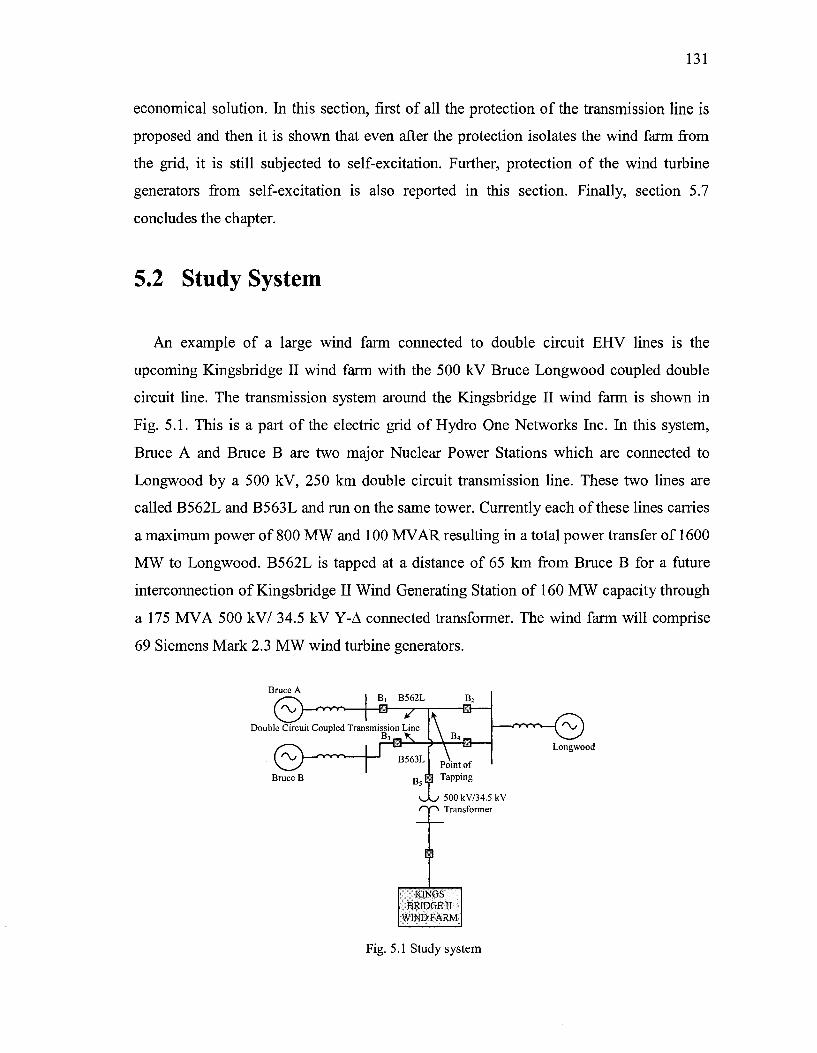
131
economical solution. In this section, first of all the protection of the transmission line is
proposed and then it is shown that even after the protection isolates the wind farm from
the grid, it is still subjected to self-excitation. Further, protection of the wind turbine
generators from self-excitation is also reported in this section. Finally, section 5.7
concludes the chapter.
5.2 Study System
An example of a large wind farm connected to double circuit EHV lines is the
upcoming Kingsbridge II wind farm with the 500 kV Bruce Longwood coupled double
circuit line. The transmission system around the Kingsbridge II wind farm is shown in
Fig. 5.1. This is a part of the electric grid of Hydro One Networks Inc. In this system,
Bruce A and Bruce B are two major Nuclear Power Stations which are connected to
Longwood by a 500 kV, 250 km double circuit transmission line. These two lines are
called B562L and B563L and run on the same tower. Currently each of these lines carries
a maximum power of 800 MW and 100 MVAR resulting in a total power transfer of 1600
MW to Longwood. B562L is tapped at a distance of 65 km from Bruce B for a future
interconnection of Kingsbridge II Wind Generating Station of 160 MW capacity through
a 175 MVA 500 kV/ 34.5 kV Y-A connected transformer. The wind farm will comprise
69 Siemens Mark 2.3 MW wind turbine generators.
Bruce A
(>\A—'v-w-B, B562L
Double Circuit Coupled Transmission Line
B,_*r
Bruce B
B563L Point of B 5 * Tapping
0 0 500 kV/34.5 kV H O Transformer
KINGS BRIDGE II
WIND FARM
Fig. 5.1 Study system

132
This system has a unique configuration of double circuit transmission line. Usually
double circuit lines are connected to the same generating source. However, here the two
lines B562L and B563L originate from two different generating stations Bruce A and
Bruce B but run on the same tower for a distance of 250 km and eventually merge in the
same TS called Longwood. Due to their proximity there exists a high coupling
capacitance between these two lines.
5.3 System Modeling
The study system shown in Fig. 5.1 is modeled using the nonlinear, electromagnetic
transient program EMTDC/PSCAD [13]. Power flow through the lines is specified by
Hydro One. Unified magnetic equivalent circuit or UMEC approach of the EMTDC has
been adopted to model the transformer with its detailed saturation characteristics supplied
by the manufacturer. In UMEC modeling approach, the transformer saturation is modeled
using a piecewise linear technique. Wind turbine generators are also modeled with high
accuracy and detail. Self-excited induction generators are modeled as squirrel cage
induction machines with double cage rotor. On the other hand the doubly fed induction
generator is modeled as an appropriately rated wound rotor induction machine with grid
side and rotor side voltage source converters which are vector controlled to achieve
decoupled active and reactive power flows.
5.4 Ferroresonance
The part of the study system which is likely to cause ferroresonance is identified in
Fig. 5.2. In this diagram the system comprises the double circuit transmission line and the
interconnecting transformer which is open at its secondary side. Ferroresonance will
occur the moment the breakers B\ and B2 get opened and B5 fails to open. At this instant
the saturable transformer magnetizing reactance appears in series with the coupling
capacitance between the two lines, forming a ferroresonance path. This is a practical
scenario where Bi and B2 can malfunction due to any contingency outside their

133
protection zone and get opened at the same time. This is typically called nuisance
tripping of the breakers. As the breaker B5 will experience high voltage due to the
opening of Bi and B2, B5 may get stuck and fail to isolate the transformer.
Bruce A
Bruce B Point of Tapping B5 i
H Open Breaker Status ^ • Closed Breaker Status
Fig. 5.2 Part of the system for Ferroresonance studies
Varying power flow levels of 150 MW, 500 MW and 800 MW through B562L are
considered to study the magnitude of the overvoltage and the time it takes to reach a
detrimental level. In each of the cases power flow through B563L is maintained at a
constant level of 800 MW. Breakers Bi and B2 are tripped at t = 2s. Fig. 5.3 (a), (b) and
(c) display the instantaneous voltages of phase A at the point of tapping for 150, 500, 800
MW power flow levels respectively. The voltage waveform shows that within 3 cycles, it
reaches 3.0 pu peak which could be detrimental for the transformer. For low levels of
power flow the voltage reaches higher value than that of a higher power flow level. The
reason is at high power flow the inductive effect of the line reduces the pre-contingency
voltage at the point of tapping. However, the voltage magnitude remains almost same for
100 MW and 500 MW power flows through B562L. For 800 MW power flow it reduces
to 2.5 pu peak which is not widely different from that of 100 MW or 500 MW scenario.
The frequency content of the voltage signal is shown in Fig. 5.4. There is a prominent
third harmonic component due to transformer saturation.

9 I s»
3 ft o < O
Q
ft
S3*
ro
X
! O 3'
o •8
3'
OQ
Inst
anta
neou
s vo
ltage
of
phas
e A
at
the
poin
t of
conn
ectio
n (p
u)
a o
ft" <
Inst
anta
neou
s vo
ltage
of
phas
e A
at
the
poin
t of
conn
ectio
n (p
u)
Inst
anta
neou
s vo
ltage
of
phas
e A
at
the
poin
t of
conn
ectio
n (p
u)
s «3
*-•
3 CTQ
T
5 owei
ho
KJ
K) en
4^
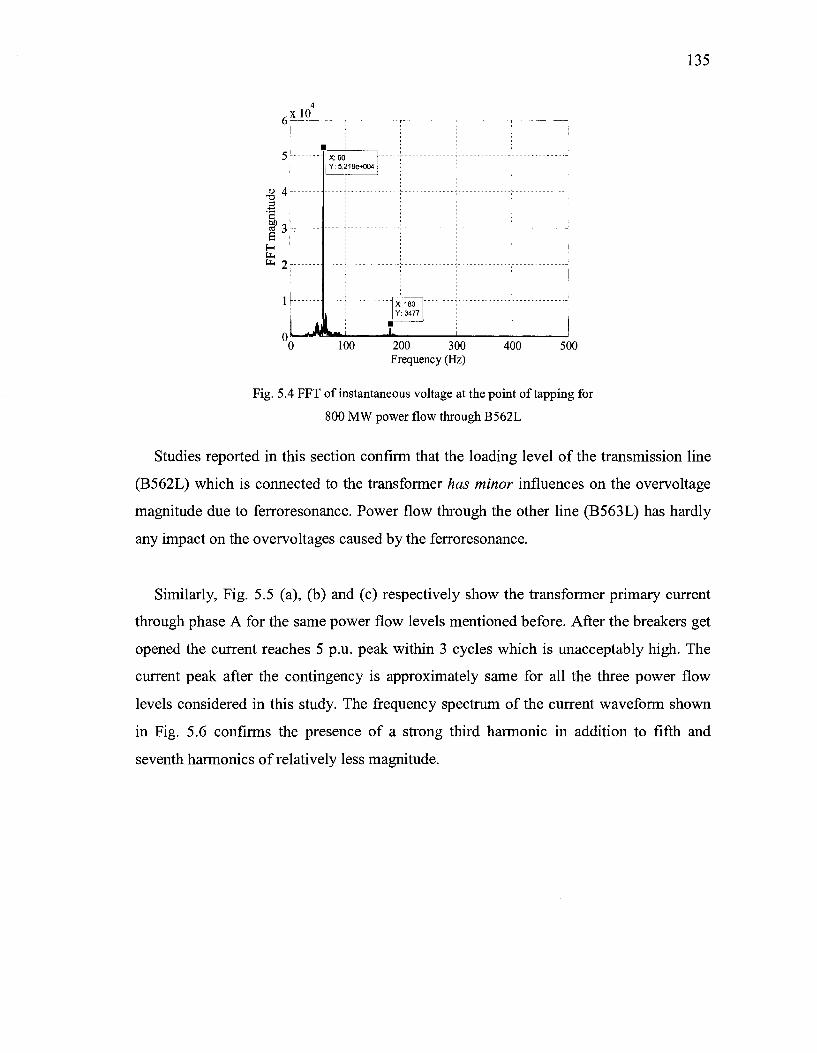
6 4
xlO
5
•8 4 3 S
I 3 h* U,
1
0 100 200 300 400 500 Frequency (Hz)
Fig. 5.4 FFT of instantaneous voltage at the point of tapping for
800 MW power flow through B562L
Studies reported in this section confirm that the loading level of the transmission line
(B562L) which is connected to the transformer has minor influences on the overvoltage
magnitude due to ferroresonance. Power flow through the other line (B563L) has hardly
any impact on the overvoltages caused by the ferroresonance.
Similarly, Fig. 5.5 (a), (b) and (c) respectively show the transformer primary current
through phase A for the same power flow levels mentioned before. After the breakers get
opened the current reaches 5 p.u. peak within 3 cycles which is unacceptably high. The
current peak after the contingency is approximately same for all the three power flow
levels considered in this study. The frequency spectrum of the current waveform shown
in Fig. 5.6 confirms the presence of a strong third harmonic in addition to fifth and
seventh harmonics of relatively less magnitude.
•
^jy
X:60 Y: 5,219e+004
l IX Y
M~ .1,
180 3477

§
Tra
nsfo
rmer
pri
mar
y cu
rren
t in
pha
se A
(pu
) T
rans
form
er p
rim
ary
curr
ent
in p
hase
A (
pu)
Tra
nsfo
rmer
pri
mar
y cu
rren
t in
pha
se A
(pu
)
o 3
ON

137
15000
^ 10000
H fe 5000
X:60 Y: 1.494e+004
—AW —<«L.
180 4029
X:300 Y: 462.6
X-. 420 Y: 138.5
100 200 300 Time (s)
400 500
Fig. 5.6 FFT of transformer primary current for 800 MW power flow through B562L
5.5 Effect of Wind Farm Interconnections
Wind farm interconnections with a utility network can be classified into two broad
categories. In the first category, the wind farm is connected to a high voltage transmission
line through a station transformer owned by the utility. Typical transmission line voltage
levels are 115 kV, 230 kV, 500 kV etc. On the other hand the wind farm may be directly
connected to a low voltage distribution network through the pad-mounted transformers of
the wind turbine generators. Distribution network can also be of different voltage levels
such as 28 kV, 34.5 kV, 44 kV etc. Kingsbridge II wind farm falls in the first category.
This will be interconnected at the 34.5 kV side of the transformer shown in Fig. 5.1. The
effects of this upcoming wind farm and its interactions with the Bruce-Longwood
transmission corridor of Hydro One are studied in this section.
5.5.1 Wind Farm Modeled as an Ideal Source
First of all the wind farm is simulated to be an ideal source which is added to the 34.5
kV side of the transformer. The power output of the wind farm is varied from 50% to
100% of its rated capacity. The power flows through B562L and B563L are kept constant
to a level of 800 MW which is currently the maximum power transfer through Bruce-
Longwood transmission corridor. For this power flow level, the effects of 50% and 100%

138
wind penetration on the overvoltage at the point of interconnection are examined. The
contingency is the same as described in section 5.4 (i.e. Breakers Bi and B2 are tripped at
t = 2s).
In this scenario B562L which is the main line transmitting power from Bruce A and
also from the Kingsbridge II wind farm, is suddenly disconnected. Operation of Bi and
B2 disconnects Bruce A but the wind farm near Kingsbridge will continue to feed B562L
which is already de-energized. However, as there is no energy dissipation path
overvoltage is experienced by the transformer and the wind generating station. After
B562L is disconnected, the remaining path comprising the wind farm and its
interconnecting transformer may be prone to the following:
• Ferroresonance between the mutual coupling of the two transmission lines and the
magnetizing inductance of the transformer.
• Self-excitation of the wind turbine generators.
• LC oscillations between the line charging capacitance and the transformer leakage
inductance.
The overvoltage could also be a combined effect of all the factors mentioned above.
Fig. 5.7 (a) and (b) show the instantaneous voltage at interconnection point for 80 MW
(50%) and 160 MW (100%) wind power penetrations whereas Fig. 5.8 (a) and (b) display
transformer primary current for the same wind power generation. Overvoltage magnitude
in this case reaches to 3.0 p.u. peak as observed in Fig. 5.7.

139
2.05 2.1 2.15 2.2 2.25 Time (s)
Fig. 5.7 Instantaneous voltage of phase A at the point of tapping
for varying wind power penetration
2.05 2.1 2.15 Time (s)
2.25
Fig. 5.8 Transformer primary current in phase A for varying wind power penetration

140
2.05 2.1 2.15 Time (s)
Fig. 5.8 (Contd.)
2.2 2.25
Comparison of Fig. 5.3 and Fig. 5.7 shows that although the overvoltage peak after the
addition of wind farm reaches 3.0 p.u. momentarily it does not increase any further unlike
the ferroresonance scenario where the voltage waveform was of modulated nature with an
increased peak of 5.0 pu. As a result, addition of the wind farm as an ideal source, which
is essentially a sink, provides a dissipation path of the trapped energy in the coupling
capacitance of the double circuit line previously causing ferroresonance. In this case as
well, the variable output of the wind farm has insignificant effects on the overvoltages
caused due to the tripping of B562L. The magnitude of voltage and current peaks remains
almost same in Fig. 5.7 and 5.8, respectively.
5.5.2 Wind Farm Modeled as SEIG
In the next stage of studies, the wind farm is modeled as a group of 200, 1000 HP
coherent self-excited induction generators. The wind farm generates 50% of its rated
capacity which is 80 MW. The output of the wind farm is kept much less than its rated
capacity, as all the wind turbine generators of a wind farm rarely operate at their full
capacity at the same time. However, wind farm operating at its full capacity has also been
studied. The overvoltage peak remains same for that case as explained in section 5.5.1.

141
The power flow through B562L, B563L and the contingency are same as in the previous
sections.
Fig. 5.9 (a), 5.10 (a), 5.11 (a) respectively depict the instantaneous voltage of phase A
at the point of interconnection, transformer primary current and the terminal voltage at
the wind turbine generators. Fig. 5.9 (b), 5.10 (b) and 5.11 (b) show the Fast Fourier
Transform (FFT) analysis of the corresponding signals. It is apparent from all the figures
that the voltage and current peaks reach a dangerous level within 3 cycles after the
tripping of the breakers. The frequency spectrum shows that both the voltage and currents
contain prominent third and fifth harmonics which appear due to the saturation of the
interconnecting transformer.
2.05 2.1 Time (s)
.xlO
u 3 5
'c
g
2.25
•
I
:
X:60
Y: 7.618e+004
• . ! 1
X
Y
180
3872
1
X:300
Y:1889
I (b)
100 200 300 Frequency (Hz)
400 500
Fig. 5.9 (a) Instantaneous voltage of phase A at the point of tapping and (b) its frequency content
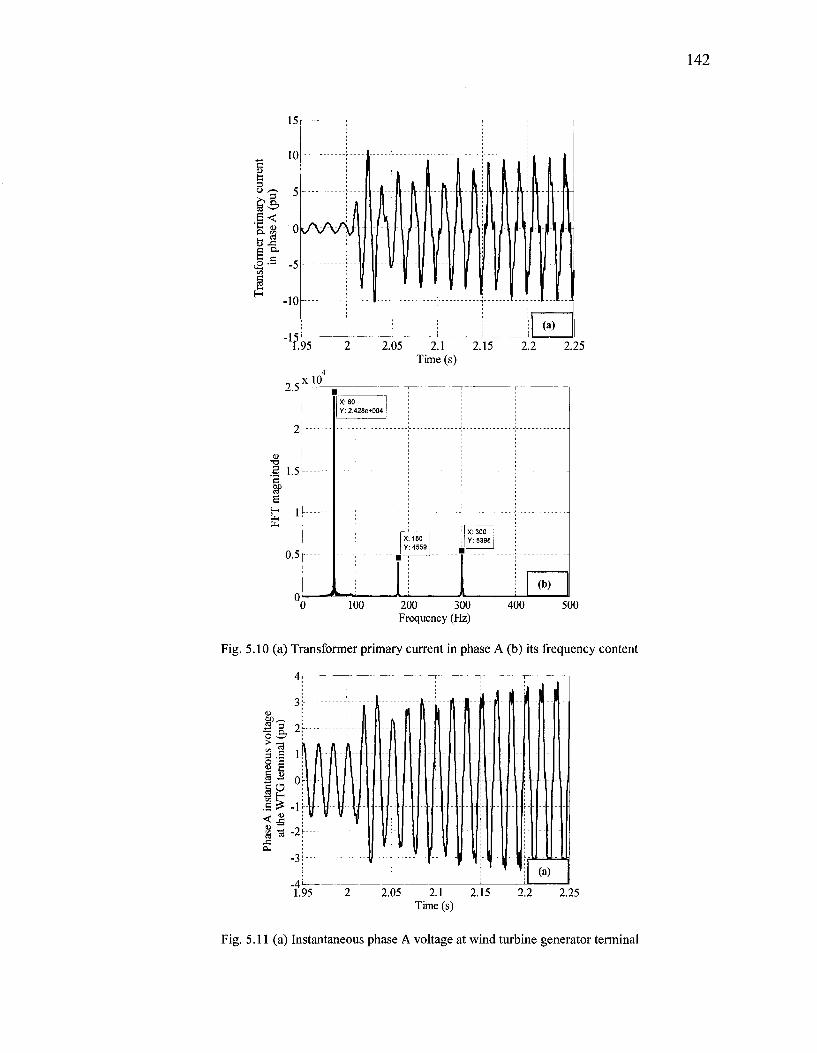
142
2.05 2.1 2.15 2.2 2.25 Time (s)
2.5 xlO
2
M 1.5 0
0.5
X:60 Y: 2.428e+004
X:180 Y: 4559
X: 300 Y: 5398
A. (b)
0 100 200 300 Frequency (Hz)
400 500
Fig. 5.10 (a) Transformer primary current in phase A (b) its frequency content
4r
2.05 2.1 2.15 2.2 2.25 Time (s)
Fig. 5.11 (a) Instantaneous phase A voltage at wind turbine generator terminal
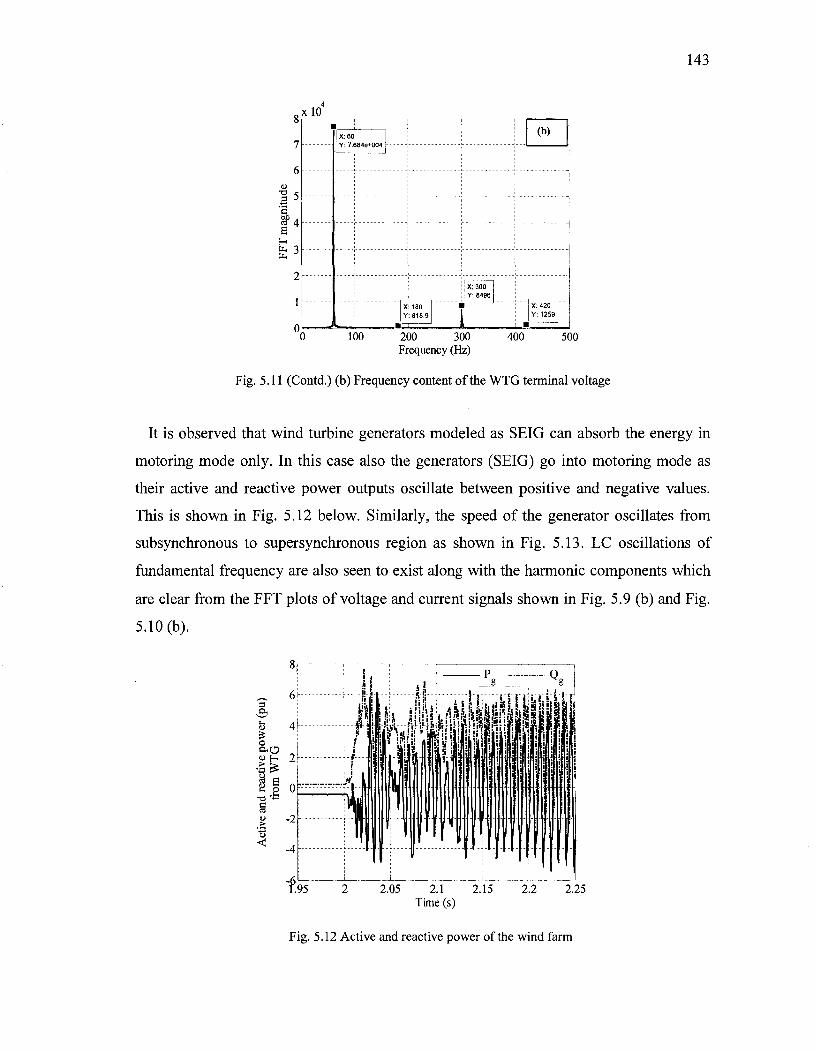
143
,xlO
7
6 a
e
£3
• : X:60 Y: 7.6846+004
- - . . X Y
x:300 Y: 8496
18oH • 818.9 1
• '
(•>)
X:420 Y:1259
100 200 300 Frequency (Hz)
400 500
Fig. 5.11 (Contd.) (b) Frequency content of the WTG terminal voltage
It is observed that wind turbine generators modeled as SEIG can absorb the energy in
motoring mode only. In this case also the generators (SEIG) go into motoring mode as
their active and reactive power outputs oscillate between positive and negative values.
This is shown in Fig. 5.12 below. Similarly, the speed of the generator oscillates from
subsynchronous to supersynchronous region as shown in Fig. 5.13. LC oscillations of
fundamental frequency are also seen to exist along with the harmonic components which
are clear from the FFT plots of voltage and current signals shown in Fig. 5.9 (b) and Fig.
5.10(b).
2.05 2.1 2.15 Time (s)
2.25
Fig. 5.12 Active and reactive power of the wind farm

144
2 2.2 2.4 2.6 2.8 3 Time (s)
Fig. 5.13 Generator rotor speed (pu)
5.5.3 Wind Farm Modeled as DFIG
Same scenario as in previous sections is simulated when the wind turbine generators
are modeled as doubly fed induction generators (DFIG). The power flow levels,
contingency and the examined signals are identical to section 5.5.2.
Fig. 5.14 (a), 5.15 (a), 5.16 (a) respectively show the instantaneous phase A voltage at
the point of connection, instantaneous transformer primary current through phase A and
A phase terminal voltage of the wind turbine generators. Fig. 5.14 (b), 5.15 (b) and 5.16
(b) depict the frequency components of the corresponding signals. Similar to the case of
SEIG, the DFIG is subjected to an overvoltage of 3.0 p.u. peak once B562L is de-
energized. Here also, odd harmonic components are prominent in transformer primary
current due to the saturation of the transformer.
Doubly fed machines also operate in motoring mode and are vulnerable to overvoltages
of detrimental magnitudes when they are connected to a de-energized long transmission
line. Power output from the generator depicted in Fig. 5.17 oscillates between positive
and negative values which clearly show the machine is oscillating between generating
and motoring mode. Similar is the situation of reactive power output of the machine in
Fig. 5.18. Generator rotor speed in Fig. 5.19 stays subsynchronous.
1.04
~ 1.03 3
^ 1 . 0 2
| 1.01 *-.
I ' o 0.99 •8
| 0.98 53
° 0.97
0.96
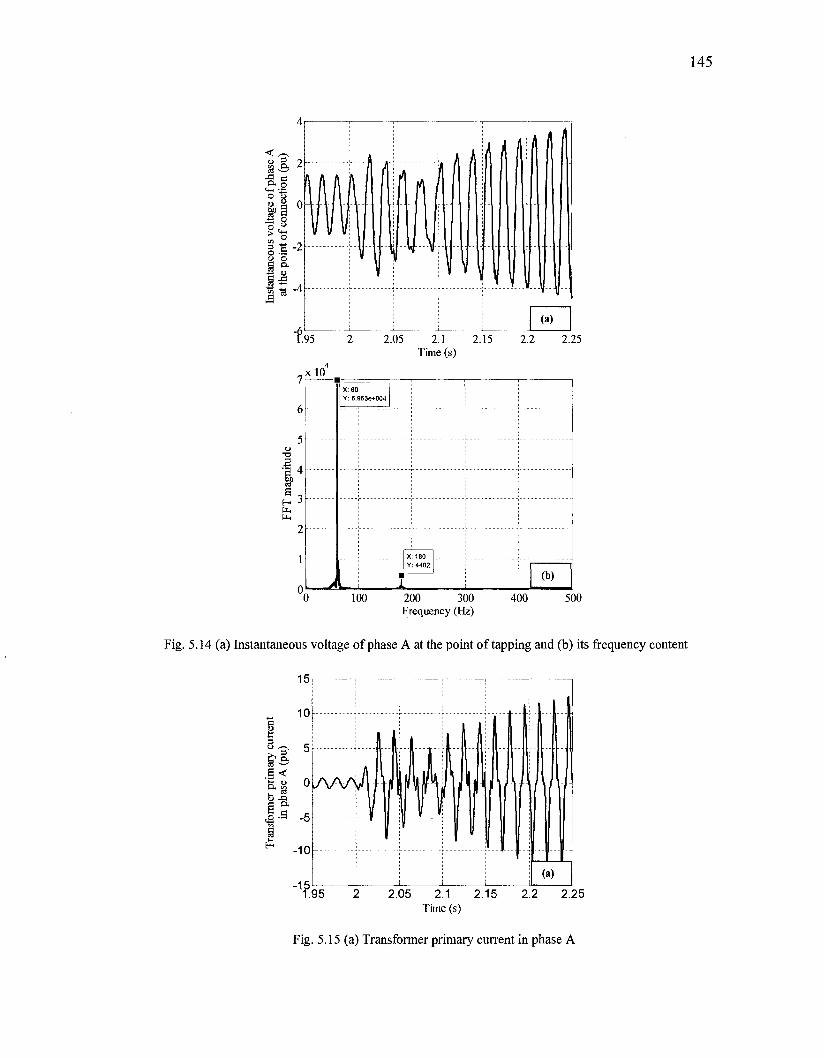
f.95
7 x lO
6
5
2.05 2.1 2.15 Time (s)
2.25
a1
/J
X:60 Y: 6.963e*004
•
X:180 Y: 4402
(b)
0 100 200 300 Frequency (Hz)
400 500
Fig. 5.14 (a) Instantaneous voltage of phase A at the point of tapping and (b) its frequency content
15r
M<
H -10
2.05 2.1 2.15 Time (s)
2.25
Fig. 5.15 (a) Transformer primary current in phase A

146
2.5
•a 3 1.5
xlO
0.5
• X:60 Y; 2.237e+004
.A
•
X:180 Y:5340
1 X:300 Y: 789.1
I
(b)
,_! X:420 Y: 376.7
100 200 300 Frequency (Hz)
400 500
Fig. 5.15 (Contd.) (b) its frequency content
2.25
, x l 0
7
6 o
3 5
e
H ^ 3
•
_J
X:60 Y: 7.228e«-004
I k _ I
X:180 Y: 784.2
X:300 Y: 855.5
'
(b)
. X:420 Y:1668
100 200 300 Frequency (Hz)
400 500
Fig. 5.16 (a) Instantaneous phase A voltage at wind turbine generator terminal
and (b) its frequency content
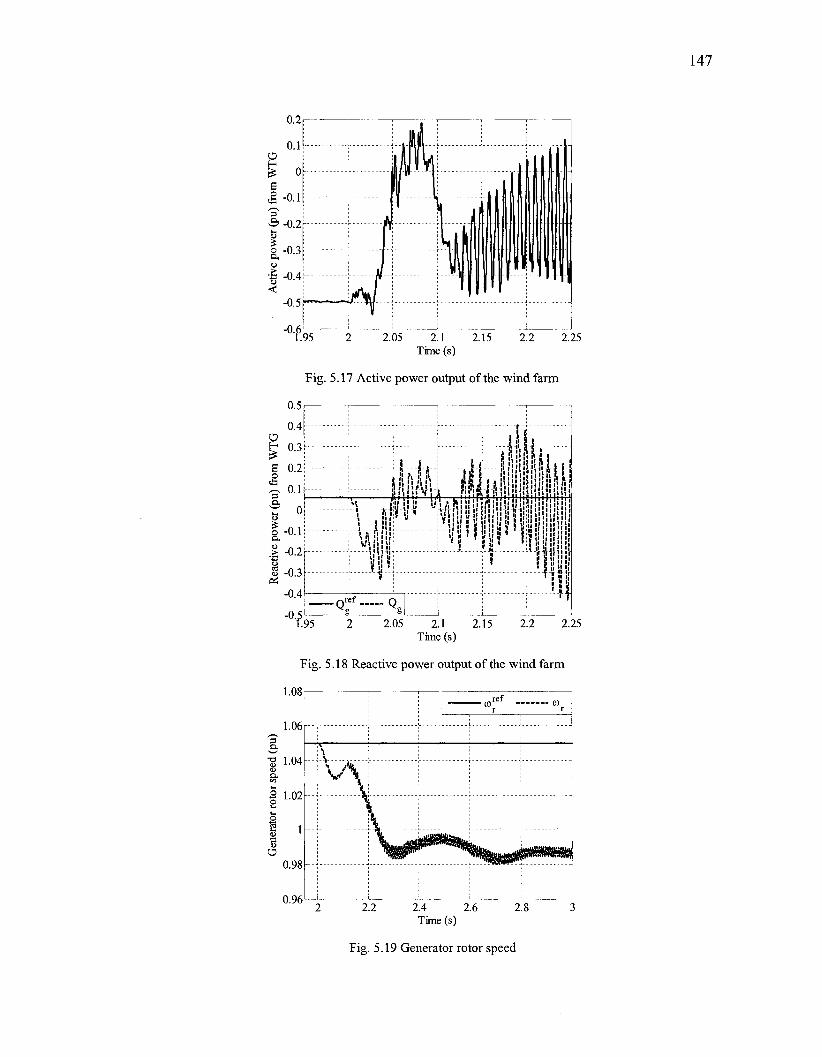
2.25
Fig. 5.17 Active power output of the wind farm
Time (s)
Fig. 5.18 Reactive power output of the wind farm
O
1.08
1.06
1.04
1.02
1
0.98
0.96
:\
1 V\ \ i *
m r r f : r r
!
•fflMydsW*^ ^ ^ ^ S w t o < i uh'rittMTl^MiifM
2.2 2.4 2.6 2.8 Time (s)
Fig. 5.19 Generator rotor speed

148
5.5.4 Limitations of the DFIG Model
The study of overvoltages at the terminal of the wind farm comprising an
appropriately rated DFIG is carried out with the generic model available in
EMTDC/PSCAD. The magnitude of the overvoltage peak and the time it takes to reach
the peak value depend on the proper modeling of the doubly fed generator and the
converter system associated with it. Hence a field validated DFIG model in
EMTDC/PSCAD is necessary to further evaluate the overvoltages at its terminal. Prior to
the validation of a DFIG model in electromagnetic transient domain, the validation of the
same DFIG model in transient stability domain may be necessary. The Appendix A of
this thesis reports such a validation study of a doubly fed induction generator model with
field test results in transient stability domain. The GE 1.5 MW doubly fed wind turbine
generator model available in PSS/E Wind Software and installed at AIM Erie Shore
Wind Farm of HONI is attempted to validate with the field tests conducted at this wind
farm.
5.6 Remedial Measures of the Overvoltages
Protection of the transmission line along with the wind farm from this detrimental
overvoltage is challenging. The first step is to protect the transmission line which is
subjected to overvoltage at the point of interconnection. Fig. 5.20 pictorially depicts the
protection task.
With the simultaneous opening of Bi and B2, B5 should disconnect the transformer
along with the wind farm. This will break the ferroresonance path and also save the
transmission line. However two concerns are raised by Hydro One with this protection
scheme. First of all this study proves that if B5 fails to operate severe overvoltage may
damage the transmission line, transformer and the wind turbine generators. To overcome
this situation another breaker B5A is planned to be installed as the backup of B5. The main
challenge in this scheme is to ensure synchronized operation of Bi, B2, and B5 or B5A. At
the first stage it was planned to divide B562L into two separate zones of protection so
that the entire line section will not be out of service at the same time. The wind farm will
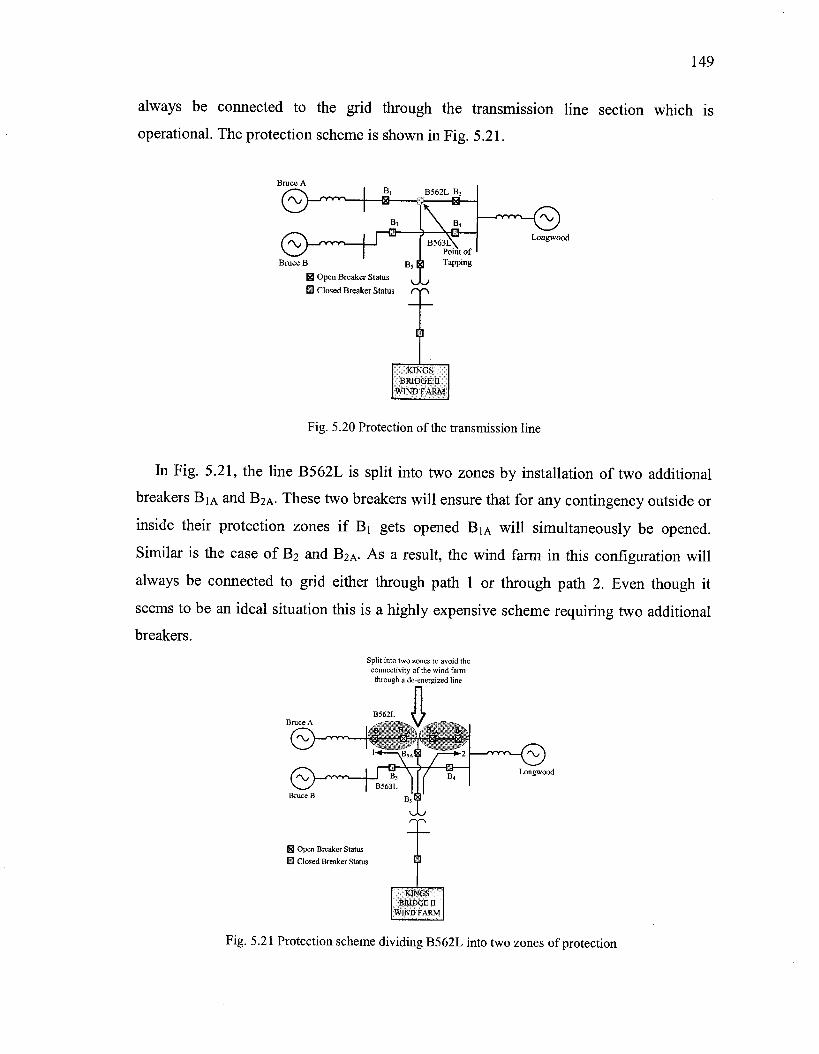
149
always be connected to the grid through the transmission line section which is
operational. The protection scheme is shown in Fig. 5.21.
Fig. 5.20 Protection of the transmission line
In Fig. 5.21, the line B562L is split into two zones by installation of two additional
breakers BiA and B2A- These two breakers will ensure that for any contingency outside or
inside their protection zones if Bi gets opened BiA will simultaneously be opened.
Similar is the case of B2 and B2A- As a result, the wind farm in this configuration will
always be connected to grid either through path 1 or through path 2. Even though it
seems to be an ideal situation this is a highly expensive scheme requiring two additional
breakers.
Split into two zones to avoid the connectivity of the wind farm through a de-energized line
Fig. 5.21 Protection scheme dividing B562L into two zones of protection

150
A more practical 3-ended differential protection scheme is eventually proposed which
is shown in Fig. 5.22.
Bruce A
3-ended differential protection scheme which will ensure almost simultaneous operations of BH B2 and B5
; /... ; GE L90 1 GE L90 2 i
B, B562LB2
Bruce B
E3 Open Breaker Status
H Closed Breaker Status
Backup of B5 Ensures disruption of Ferroresonance path
KINGS BRIDGE II
WIND FARM
Fig. 5.22 Three-ended differential protection scheme
The 3-ended differential scheme on B562L will have 'A' and 'B' line differential
relays at Bruce A, Longwood and Kingsbridge II tap substation. Channel 'A' scheme is
described with the understanding that the 'B' scheme is similar.
The 'A' protection will have a GE L90 at each of the three terminals listed above,
linked by dedicated communication channels (Chi and Ch2). As an arbitrary assignment,
Chi will daisy chain from Bruce A L90, to Kingsbridge II Tap L90 to Longwood L90,
and back to Bruce A L90. Ch2 will daisy chain the other way - from Bruce A L90 to
Longwood L90 to Kingsbridge II Tap L90, and back to Bruce A L90. With this
configuration, each L90 is in direct communication with the other two L90s, so that any
failure on any one leg of a channel is not a problem, as the L90s connected to the broken
channel can still communicate via the third L90 on the non-problematic channel.
For the situation where Bruce A, and Longwood both open the B562L line
simultaneously, the L90 logic can be made to evaluate the status of breakers and line
disconnects at both Bruce A and Longwood. If all breaker/switch combinations point to
an open line, the L90s at both Longwood and Bruce A can send trip to Kingsbridge II

151
Tap station. The typical transmission time would be 8ms through synchronous optical
network (SONET).
It is to be noted that the protection schemes mentioned above will ensure the complete
protection of the transmission line. However, even if B5 or B5A operates the wind farm is
still connected to the transformer and is subject to the overvoltages caused by self-
excitation. This is shown in Fig. 5.23.
Studies are conducted to show that once the wind farm is disconnected from the
transformer, even though the voltage at the point of interconnection and the transformer
primary current become zero, wind turbine generators are indeed subjected to
overvoltages due to self-excitation. The SEIG and DFIG configurations of wind turbine
generators are considered to study the effects of self-excitation in wind farm.
GE L90 2
n~>
E3 Open Breaker Status
H Closed Breaker Status
Still Susceptible to "Self-excitation
Fig. 5.23 Possible occurrence of self-excitation of the wind farm
5.6.1 Self-excitation in SEIG
In this section the wind farm is represented as in section 5.5.2. The self-excitation
occurs due to the interaction of the induction generator with its shunt compensator. In this
case Bi, B2 and B5 are opened simultaneously at t- 2s with the transformer and the wind
farm connected.

<T
H
ran if)
o B
i-t
Tt <-t 3 $ o s CD
3 "
•* ^ H
o
CD
H rt
SJ
vol 05
<ro
<D
Tf «.
<JQ
5.2 -t> ,—N
»>
3 V
I
P3
3 3 ft
O c en < O
0J
ITQ
att 3"
CD
T3 O a o "5 app 3 rro
Phas
e A
ins
tant
aneo
us v
olta
ge
at th
e W
TG
term
inal
(pu
)
Tra
nsfo
rmer
pri
mar
y cu
rren
t in
pha
se A
(pu
) In
stan
tane
ous
volta
ge o
f ph
ase
A
at th
e po
int o
f co
nnec
tion
(pu)
r ft
UJ
"5
:1
to

153
14000
12000
10000
1 •f 8000
6000
4000
2000
°0
• X:60 Y:1.359e+004
[
• 1
/
:
i Y:6625 \
\
;
' : \ /'
X:203 Y: 716.9
V . — « • r-(d)
100 200 300 Frequency (Hz)
400 500
Fig. 5.24 (Contd.) (d) FFT plot of WTG terminal voltage signal
From Fig. 5.24 (a) and (b) it is clear that although the instantaneous voltage at the
point of interconnection and transformer primary current become zero once B5 gets
opened, the voltages at the WTG terminal still exist and reach as high as 2.5 pu peak and
shown in Fig. 5.24 (c). This overvoltage could be harmful for the wind turbine generators
if proper protection is not there. The FFT analysis of the generator terminal voltage
depicted in Fig. 5.24 (d) proves a few high frequency harmonic contents in the range of
100 to 200 Hz which may be caused by the self-excited, isolated generator. Further
analysis is needed to theoretically justify the reasons for the emergence of these modes.
5.6.2 Self-excitation in DFIG
The wind farm is now modeled as in section 5.5.3. In this case the self-excitation
occurs due to the interaction of the excitation system of DFIG comprising the power
electronic converters and the induction generator. Only the voltage at the wind turbine
generator terminal is shown in Fig. 5.25 (a). The instantaneous voltage at the point of
interconnection and the transformer primary current will remain same and are already
displayed in Fig. 5.24. It is clear from Fig. 5.25 that high terminal voltage of 4.0 pu peak
will occur at the generator terminal which is a potential threat to the costly generators.
The FFT analysis of the generator terminal voltage as shown in Fig. 5.25 (b) depicts a
few predominant high frequency harmonics in between 125 Hz and 135 Hz. There are

154
some more high frequency contents around the frequency ranges of 300 and 410 Hz
respectively with far less magnitude than the harmonic content between 125 Hz and 135
Hz. These high frequency contents may be due to the self-excited doubly fed induction
generator whose rotor speed will naturally increase once it is isolated from the
transmission line. The power electronic converters may also be responsible to produce
some of these high frequency components. However, further analytical studies will be
required to determine the origin of these modes.
-3 3 4
« *c3
8 1 IS o 1 H .S£ -2 < £
8 3 -4
-6
(illil 1
(a)
r.95
.xlO
X: 60 . Y: 1.329e+004
•O
a
0.5
——^^B^^nBlMiE_
2.05 2.1 2.15 Time (s)
X: 135.6 Y: 1.603e-H)04
X: 125 Y:1.11e+O04
X:300 Y:1096
2.2 2.25
(b)
X: 409.8 Y: 964.8
100 200 300 Frequency (Hz)
400 500
Fig. 5.25 (a) The self-excitation effect of the DFIG and (b) its FFT analysis
155
5.6.3 Mitigation of Self-excitation
Transfer trip scheme is usually installed with the new interconnection of wind farms,
especially for high voltage interconnection of this type. However, transfer trip scheme
may be too slow in this situation. This is due to the fact that the transmittal time of the
trip signal through communication channels is directly proportional to the length of the
transmission line. However, the overvoltages may reach a dangerously high magnitude
within 3 cycles (less than 50 ms time) which is much faster than the signal transmission
time of transfer trip scheme. That is one of the reasons for the proposal of 3-ended
differential protection. However, as it is shown in the previous sections 5.6.1 and 5.6.2
respectively that differential protection of the transmission line alone may not guarantee
the full protection of the system due to the self-excitation effects of the generators.
In addition to that the excitation system of the generators has to be shut down with
equal speed as that of the transmission line breakers. Disconnecting the excitation system
solves the self-excitation problem and a few wind turbine generator manufacturers such
as VESTAS do ensure that the shunt capacitor at the generator terminal gets disconnected
when the machine is cut out from the system. Similar recommendations are also
applicable to the DFIG where the switches of the power electronic converters have to be
blocked once the machine is out from the point of connection. Then only full overvoltage
protection could be ensured. The protection scheme to completely alleviate this
overvoltage problem is shown in Fig. 5.26. In this figure B6 and B7 must be opened with
the opening of B5 or BSA- The generator terminal voltages for the SEIGs and DFIGs after
their excitation systems are turned off are shown in Fig. 5.27 and Fig. 5.28, respectively.
It is clear that once the excitation system is turned off high voltage across the
disconnected generator disappears. The machine terminal voltage decays to zero. As
there is no shunt capacitor at the DFIG terminal the voltage across it decays much faster
than that of the SEIG. However, it also depends on the machine time constants and
parameters.

3-ended differential protection scheme which will ensure almost simultaneous operations of B, B2 and B5
JL GE L90 1 GE L90 2 '•
Bj B562L B2 !
a lit a—j-
H Open Breaker Status
H Closed Breaker Status O ^
Backup of B5 Ensures disruption of Ferroresonance path
B„$ GENKRATOR PROTKC"! I O \
KINGS BRIDGE 11
VIND FARM
EXCITATION SYSTEM SHUTS DOWN
B6 and B7 must be opened with the opening of B5 or B5A
Fig. 5.26 Protection scheme to fully alleviate the overvoltage problem
.95 2.15 2.35 2.55 2.75 2.95 3.15 3.35 3.5 Time (s)
Fig. 5.27 Mitigation of self-excitation of SEIG
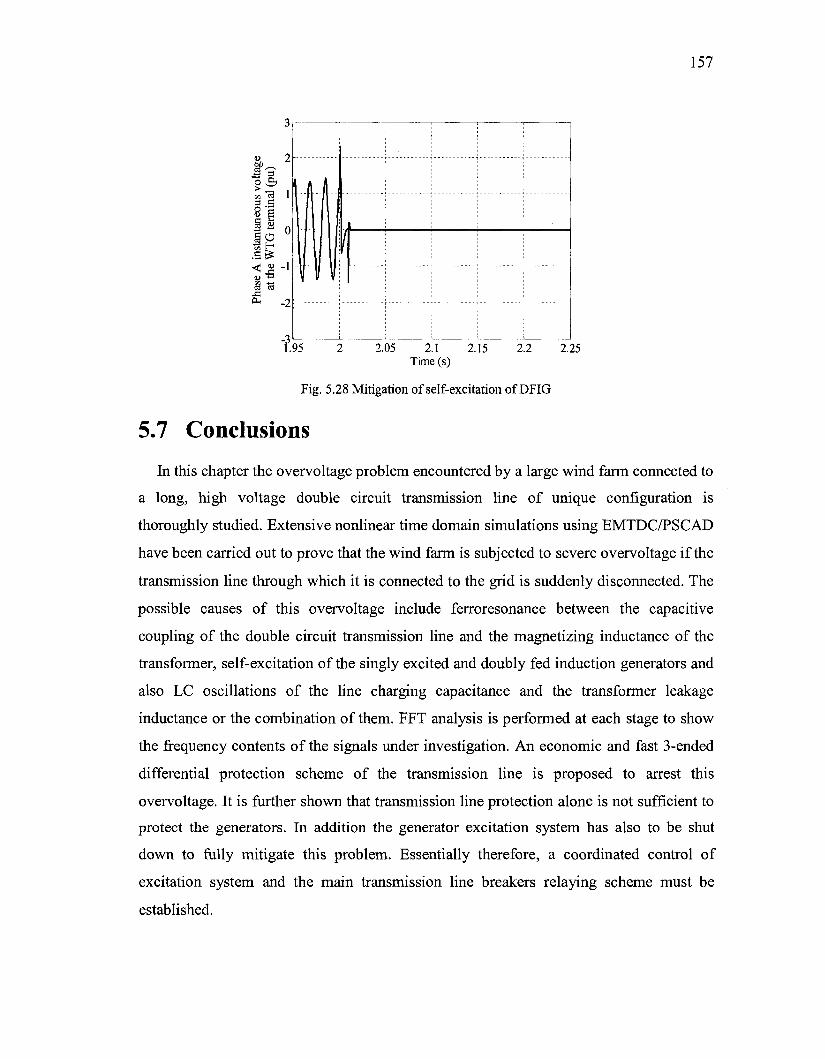
157
on "ro 1 3 d
l o ° l h < a -i S3 13
J3 -2-
?.<
II 1
If
95 2.05 2.1 2.15 2.2 2.25 Time (s)
Fig. 5.28 Mitigation of self-excitation of DFIG
5.7 Conclusions In this chapter the overvoltage problem encountered by a large wind farm connected to
a long, high voltage double circuit transmission line of unique configuration is
thoroughly studied. Extensive nonlinear time domain simulations using EMTDC/PSCAD
have been carried out to prove that the wind farm is subjected to severe overvoltage if the
transmission line through which it is connected to the grid is suddenly disconnected. The
possible causes of this overvoltage include ferroresonance between the capacitive
coupling of the double circuit transmission line and the magnetizing inductance of the
transformer, self-excitation of the singly excited and doubly fed induction generators and
also LC oscillations of the line charging capacitance and the transformer leakage
inductance or the combination of them. FFT analysis is performed at each stage to show
the frequency contents of the signals under investigation. An economic and fast 3-ended
differential protection scheme of the transmission line is proposed to arrest this
overvoltage. It is further shown that transmission line protection alone is not sufficient to
protect the generators. In addition the generator excitation system has also to be shut
down to fully mitigate this problem. Essentially therefore, a coordinated control of
excitation system and the main transmission line breakers relaying scheme must be
established.

158
5.8 References [1] P.M. Anderson and R.G. Farmer, Series Compensation of Power Systems, PBLSH
Inc., California, USA, 1996.
[2] Slow Transients Task Force of the IEEE Working Group on Modeling and
Analysis of Systems Transients Using Digital Programs, "Modeling and Analysis
Guidelines for Slow Transients-Part III: The Study of Ferroresonance," IEEE
Trans, on Power Delivery, vol. 15, no. 1, pp. 255-265, January 2000.
[3] M. V. Escudero, I. Dudurych and M. Redfern, "Understanding Ferroresonance,"
in Proc. 2004 UPECConf., pp. 1262-1266.
[4] R. Gagnon, P. Viarouge, G. Sybille and F. Tourkhani, "Identification of
Ferroresonance as the Cause of SVC Instability in a Degraded Series
Compensated Network," in Proc. 2000 IEEE PES Winter Meeting Conf., pp.
1377-1382.
[5] M. Nagpal, F. Plumptre, R. Fulton, and T. G. Martinich, "Dispersed Generation
Interconnection—Utility Perspective," IEEE Trans, on Power Delivery, vol. 42,
no. 3, pp. 864-872, May/June 2006.
[6] C. S. Demoulias and P. S. Dokopoulos, "Transient Behavior and Self-Excitation
of Wind-Driven Induction Generator after its Disconnection from the Power
grid," IEEE Trans, on Energy Conversion, vol. 5, no. 2, pp. 272-278, Junel990.
[7] M. A. Ouhrouche, X. D. Do, Q. M. Le and R. Chaine, "EMTP Based Study of
Self-Excitation Phenomenon in an Induction Generator", in Proc. 1995
CCEC/CCGFI Conf., pp. 172-176.
[8] M. A. Ouhrouche, X. D. Do, Q. M. Le and R. Chaine, "EMTP Based Simulation
of a Self-Excited Induction Generator after its Disconnection from the Grid,"
IEEE Trans, on Energy Conversion, vol. 13, no. 1, pp. 7-14, March 1998.
[9] L. Tang and R. Zavadil, "Shunt Capacitor Failures due to Windfarm Induction
Generator Self-Excitation Phenomenon," IEEE Trans, on Energy Conversion, vol.
8, no. 3, pp. 513-519, September 1993.
159
[10] R. Wamkeue, S. Moraogue and I. Kamwa, "Distribution Network Fed in Co-
Generation by Induction Generators: Incidence of Self-Excitation Phenomenon,"
in Proa 2001IEMDC Conf. pp 594-603.
[11] W. B. Gish, W. E. Feero and S. Greuel, "Ferroresonance and Loading
Relationships for DSG Installations," IEEE Trans, on Power Delivery, vol.
PWRD-2, no. 3, pp. 953-959, July 1987.
[12] W. E. Feero and W. B. Gish, "Over voltages Caused by DSG Operation:
Synchronous and Induction Generators," IEEE Trans, on Power Delivery, vol.
PWRD-1, no. 1, pp. 258-264, January 1986.
[13] EMTDC PSCAD User Manual, HVDC Research Center, Manitoba, 2003.

CHAPTER 6
Conclusions and Future Work
This thesis deals with diverse power system problems related to wind farm integration
and their alleviation through FACTS devices. It begins with a study of inter-area
oscillations of multi-machine power systems and various resonance issues encountered in
a power system network fed by conventional synchronous generators as well as wind
turbine generators. The thesis further deals with the validation of doubly fed wind turbine
generators and relevant applications of Flexible AC Transmission System devices to
solve some of these problems. FACTS devices are primarily applied as the remedial
measures to subsynchronous resonance and inter-area oscillations with local and remote
signals acquired by wide area measurements. The contributions of the thesis are
summarized at first. Major conclusions drawn from the various system studies reported in
this thesis are then outlined. Finally, future directions of research are also suggested.
6.1 Major Contributions
• A weighted sum of the derivative of remote generator bus voltage angle signals is
effectively utilized in SVC control for damping inter-area oscillations.
• Remote generator speed signal used for the first time for SSR damping with SVC.
• Subsynchronous resonance is shown to be a potential threat in series compensated
wind farms even at realistic series compensation levels.
• Damping of above SSR accomplished both with SVC and TCSC for the first time.

161
• Potential of severe overvoltages demonstrated for the first time in grid
interconnection of large wind farms and remedial measures proposed.
• GE 1.5 MW Doubly Fed Induction Generator model has been validated through
extensive field tests in Hydro One's network. This study has been done for the first
time in HONI network in Ontario.
• Recommendations for system performance improvement provided.
6.2 Chapter-wise Summary
6.2.1 Damping of Inter-area Oscillations
Damping of inter-area oscillations by FACTS devices using PMU-acquired global
signals is well reported. However, a simple replication of generator rotor speed deviation
by means of the derivative of the remote generator bus voltage angles acquired by the
phasor measurement units is one of the contributions of this thesis. It is shown that the
derivative of the generator bus voltage angle can mimic the generator rotor speed and
hence is equally effective in inter-area oscillation damping when used as the input to the
power swing damping controller of a static VAR compensator. The effectiveness of the
proposed signal is compared with different local signals such as line current or line power
and is found to be superior even with a highly stressed network condition subjected to
different types of contingencies. Signal transmission delay encountered in wide area
measurements is duly taken care of and a lead lag compensator is designed to compensate
the delay. The main conclusion from this work is that a weighted combination of global
signals performs better than the locally acquired signals in damping low frequency inter-
area oscillations as the lightly damped modes contributed by multiple machines are more
observable in remote generator speed than many other local signals. Although signal
162
transmission delay affects the performance of the remote signals, its effects can be
minimized through appropriate compensation.
6.2.2 Performance of Remote Generator Speed in the Damping
ofSSR
Performance of remote signals in damping subsynchronous resonance is not well
reported. This thesis proposes to employ remote generator speed as the input to
subsynchronous damping controller of a mid-point connected SVC originally meant for
voltage control purposes. The study is performed on the IEEE 1st Benchmark Model for
SSR studies. The main conclusion is that remote generator speed deviation prominently
exhibits all the unstable subsynchronous modes. As a result this signal is capable to damp
all four SSR modes for all critical levels of compensations. A single proportional and
derivative controller is sufficient to damp the SSR corresponding to first three critical
levels of compensation whereas a slight modification of the same controller successfully
damps the SSR for most critical level of series compensation. Such studies involving
remote generator speed for damping SSR using an SVC have been done for the first time.
6.2.3 SSR in Series Compensated Wind Farms
The possibility of occurrence of SSR in a series compensated transmission line fed by
a wind farm and mitigation of the same with FACTS devices are first reported in this
thesis with rigorous nonlinear time domain simulations. This study shows that induction
generator effects and torsional interactions are likely to occur in a wind farm supplying
power to the grid by a series compensated line. Even a realistic series compensation level
may cause potential instability of the system due to these two effects. The frequencies of
oscillations appearing in various system variables due to these effects are identified by
the FFT analysis. The relation between these frequencies and series compensation levels
is also justified. Alleviation of this severe system instability is extensively studied using
two FACTS devices, static VAr compensator and thyristor controlled series capacitor. A
163
comparative study of the damping performance of SVC voltage regulator, SVC
subsynchronous damping controller and the TCSC current controller proves the
superiority of TCSC over the SVC. In short, subsynchronous resonance is a potential
problem of a series compensated wind farm and it can be overcome by using additional
damping capability of FACTS devices which are installed for other system performance
improvement purposes. These studies have also been performed for the first time.
6.2.4 Overvoltages at the Terminal of a Large Wind Farm
Connected to a Double Circuit Transmission Line
The potential overvoltages that may occur at the terminal of a wind farm connected to
one of the lines of a coupled double circuit transmission corridor is not well discussed in
literature. In this unique configuration of wind farm interconnection, ferroresonance and
self-excitation can respectively take place once the transmission line which is fed by the
wind turbine generators gets disconnected and followed protection initiated isolation of
the wind farm from the main step down transformer (which steps down the transmission
voltage level to a lower voltage level suitable for collector bus). In this study different
wind turbine generator configurations are considered. A potential problem of 2.5-3 pu
overvoltage is seen to exist at the terminals of the wind turbine generators due to these
two phenomena irrespective of the generator configuration. This overvoltage could be a
serious concern to the utilities as it reaches its peak level within 2-3 cycles which is
almost equal to or less than the main breaker operation time. The main conclusion of this
study is that this detrimental overvoltage can saturate the transformer which is the link
between the wind farm and the transmission line. This overvoltage can also be the cause
of serious damage to the wind turbine generators and the associated equipment if proper
protection is not undertaken. In this configuration the protection task is found to be
challenging due to the fact that not only the wind farm and the main transformer have to
be isolated from the high tension transmission corridor but also the excitation system of
the wind turbine generators has to be shut down to avoid self-excitation. Surge arrestors
could be an interim measure to arrest the overvoltage so that it does not reach to a

164
detrimental value before the protection system operates. This planning study for a large
wind farm has also been done for the first time.
6.2.5 Modeling and Validation of GE 1.5 MW Doubly Fed
Wind Turbine Generators
Analytical modeling of doubly fed wind turbine generators is widely discussed and
reported in literature. However, majority of those analytical models are mainly based on
some theoretical approaches and are tested on hypothetical systems. The performance of
those models are not normally validated with test results obtained from field experiments
conducted in a wind farm which is operational in practice. In this thesis the GE 1.5 MW
doubly fed wind turbine generators implemented in PSS/E Wind Software package are
extensively validated with field tests which are conducted in AIM Erie Shore wind farm
of Hydro One Networks. This wind farm has an installed capacity of 99 MW consisting
of 66 GE 1.5 MW wind turbine generators. The simulated system responses of the test
events in PSS/E show a good agreement with the actual field test results and thereby
validating those wind turbine generator models for transient stability study of bulk power
systems. From this study an industry guideline of the wind farm testing has been evolved.
Further, it is shown that appreciable improvement in the transient responses of the DFIGs
can be achieved by the systematic tuning of the voltage and reactive power controllers of
the machines. This field validation performed for the first time in Ontario in the Hydro
One power grid.
6.3 Future Directions of Research
The following are some of the problems which could be studied in future based on the
work reported in this thesis:
1. The delay encountered in signal transmission from remote location to the site of
the FACTS controller is a major concern. The problem becomes severe when

165
multiple torsional modes of subsynchronous frequencies are excited as in case of
SSR and the transmission of the auxiliary signal such as generator rotor speed
containing all of the subsynchronous modes is delayed. The delay compensation
for such a signal becomes difficult because of the existence of a number of high
frequencies and hence larger phase lags need to be compensated in more than one
stage. A thorough mathematical modeling of delay and the design of auxiliary
controller to compensate the delay for SSR may be a future direction of research.
2. The SSR in wind farm comprising self-excited induction type generators are
discussed and solution techniques are proposed. However, this is an entirely new
direction of research and a variety of studies can be conducted. First of all, finding
the possibility of occurrence of SSR involving other types of wind turbine
generators such as doubly fed induction generators, directly connected
synchronous machines with stator converter etc., is a vast area of research.
Remedial converter control measures for alleviating this problem for such
generators need to be devised as well. Further the interaction of neighboring
FACTS control systems with those of the wind turbine generator converters is a
novel area of research that may be pursued in future.
3. The overvoltages at the terminal of the wind farm connected to one of the lines of
a coupled double circuit transmission corridor may be due to either
ferroresonance or self-excitation or a complex combination of them. The
boundary between these three factors is to be clearly drawn so that it could be
easily understood that if the voltage signal at the point of tapping takes a
particular shape and magnitude then that can be attributed to one of the specific
factors mentioned above. Although this factor is best attempted to be justified in
this thesis, modeling of different transformer saturation characteristics and
configurations need to be done to verify the demarcation.
4. Modeling and validation of different configurations of wind turbine generator
models in nonlinear electromagnetic time domain programs namely

166
EMTDC/PSCAD or EMTP still need to be done. Although there is a plenty of
hypothetical wind turbine generator models implemented in those platforms and
reported in literature their performance has to be validated with field test results.
EMTDC/PSCAD or EMTP models the power system components to the highest
degree of detail and simulations carried out in these platforms are supposed to be
the closest representation of the real life scenario. This thesis deals with this
problem with the wind turbine generator models available in PSS/E which is
primarily a transient stability program and can perform fundamental frequency
phasor simulations. The shortcoming for such a validation process is that some of
the high frequency switching harmonics appearing in the measurements could not
be modeled and studied. Hence validation of the WTG models in
EMTDC/PSCAD or EMTP domains need to be undertaken.

APPENDIX A
Field Validation of a Doubly Fed Induction
Generator (DFIG) Model and System
Performance Improvement
A.l Introduction
A global hike in wind power penetration is imminent as wind power is increasingly
being considered not only an environment friendly way of producing power but also an
economic generation alternative in areas with appropriate wind speed [1]. The Canadian
wind market has grown by an average of more than 30% over each of the last six years as
a result of a combination of federal incentives and initiatives by individual provinces to
increase the contribution from renewable energy. Total installed capacity of the wind
farms in Canadian provinces has reached 1588 MW out of a proposed target of 2767
MW. In Ontario, between 2009 and December 2011, new interconnections of wind farms
having the installed capacity of 1,175 MW will be allowed in selected areas [2].
Improved models for wind turbines and wind farms are absolutely necessary for the
overall solution to the transmission challenges imposed by this growing wind power
integration. However, as the industry history of modeling conventional generating
equipment proves, the process for developing these models and their validation will likely
not be short [4]. This requires a comprehensive development of the mathematical models
of different classes of wind turbine generators and their controls, implementing these
formulations in different computer simulation tools, theoretical validation and
168
explanation of the performances of these wind turbines when connected to the grid and, at
last, validation of the simulation models with the field measurements. In addition, the
complexity of the models and the rapid advances being made in the technology itself must
be taken into account. As a result it is clear that developing a wind turbine generator
model is a challenge and needs attention to ensure accurate system studies which evaluate
the performance of this new class of generating systems to be integrated with the power
system grid [4, 5].
One of the principal differences between the wind farms and conventional generating
plants is that in most cases wind farms employ induction generators instead of
synchronous generators as an electro-mechanical energy conversion device. Wind turbine
generators are broadly classified into three categories which are:
1. Fixed speed asynchronous wind turbines employing self-excited induction generator
(SEIG) or wound rotor induction generators (WRIG) with external resistance
connected to the rotor terminals.
2. Variable speed doubly fed induction generator (DFIG) with back to back voltage
source power electronic converters.
3. Synchronous generator with full size ac-dc-ac power converter connected to its
stator.
Various software tools have the capability to model wind turbine generators (WTG) of
these three categories in different domains of analysis. A few such software tools and
WTG models widely used in power industry are mentioned below:
1. Electromagnetic Transient Domain Models of first two categories of wind turbine
generators in EMTDC/PSCAD software [6]
2. Transient stability models of VESTAS V80 1.8 MW wind turbine generator
employing wound rotor induction generator and GE 1.5 MW doubly fed induction
generator (DFIG) in PSS/E software [7]

169
3. Electromagnetic transient domain and electro-mechanical transient domain models
of first two categories of wind turbine generators in SIMPOW [8]
4. Electromagnetic transient domain and electromechanical transient domain models
of all three categories of wind turbine generators in DIgSILENT Power Factory [9]
In spite of the availability of the wind turbine generator models in these widely
employed power system simulation tools, scant literature is available which reports the
validation studies of these models with the field tests. The objective of this work is to
evaluate the modeling and validation requirements of a doubly fed induction generator
(DFIG) and to establish a thoroughly tested DFIG model which could be used in power
system studies.
This study is possibly the first attempt to validate a DFIG model available in a widely
used commercial software with the results obtained from the field test conducted in an
operational wind farm of Hydro One Network Inc. (HONI).
The organization of the chapter is as follows. Section A.2 describes the wind generating
station and the lay out of the studied system. The modeling of the GE 1.5 MW wind
turbine generators is briefed in section A.3. Modeling of the test system and the
simulation of the test conditions using PSS/E are outlined in section A.4. Section A.5
reports the validation results and some improvements in system responses by varying the
controller parameters of DFIG. The possible reasons behind the differences between the
simulation and test results are accounted and various issues regarding the test procedure
are brought out in section A.6. Based on the conducted studies reported in this chapter
some recommendations are made in section A. 7 which will ensure more realistic and
accurate field tests leading to proper utilization of the invested resources. Section A.8
concludes the chapter.

170
A.2 Study System
This study is a part of the project undertaken by Hydro One Network Inc. (HONI) in
their ongoing efforts to obtain accurate models of wind turbine generators of different
configurations. These wind turbines are manufactured by different vendors and their
models need to be validated by the utilities who are allowing the customers to connect to
their network. The need for establishing accurate models is of paramount importance as
these validated models will be extensively used to evaluate the impact of distributed
generation sources on the existing power system grid. Although manufacturers may have
validated their machine models but the results of their studies are not easily available in
literature.
Hydro One has already interconnected wind farms consisting of a large number of GE
1.5 MW wind turbine generators. The GE 1.5 MW wind turbine generators are good
examples of this doubly fed configuration and their models are available in PSS/E Wind
software. Hence the model of GE 1.5 MW doubly fed asynchronous wind turbine
generator implemented in PSS/E software has been tested and validated in this project.
Several tests were carried out by Hydro One, in their AIM Erie Shore Wind Farm at
Port Burwell substation. This wind farm is located 25 kilometers south of Tillsonburg,
Ontario down the Glen Erie line. It has 66 GE 1.5 MW wind turbine generators, resulting
in 99 MW installed capacity, uniformly distributed over a vast geographical terrain near
Lake Erie shore. The wind farm along with the network configuration around its near
vicinity is taken from the full scale Hydro One system and is shown in Fig. A. 1.
Testing of a wind farm sometimes proves to be a time consuming and tedious process
due to the random nature of wind. Tests should not be performed until there is enough
wind flow and the turbines are producing appreciable power. Besides the wind,
substantial manpower is required to perform measurements and document the test results.
Involvement of nine organizations for three consecutive days was required to make this
test successful.
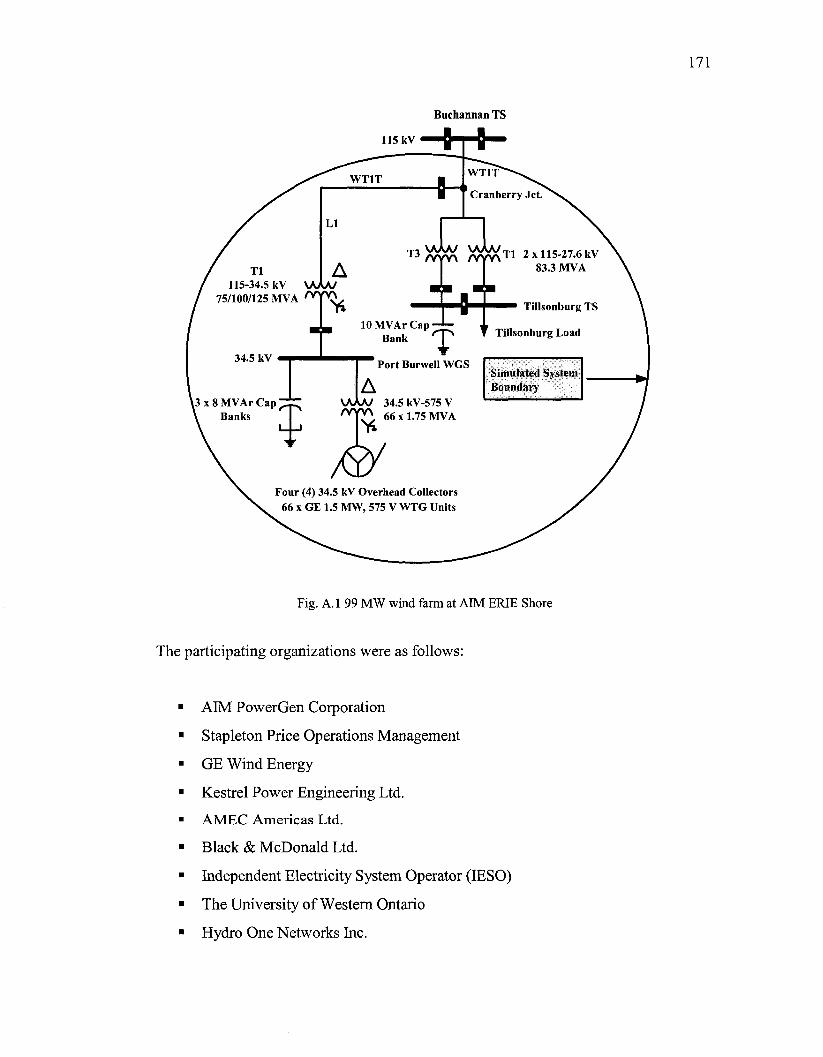
Buchannan TS
115 kV
Fig. A. 1 99 MW wind farm at AIM ERIE Shore
The participating organizations were as follows:
AIM PowerGen Corporation
Stapleton Price Operations Management
GE Wind Energy
Kestrel Power Engineering Ltd.
AMEC Americas Ltd.
Black & McDonald Ltd.
Independent Electricity System Operator (IESO)
The University of Western Ontario
Hydro One Networks Inc.
172
The participating organizations were involved in various activities to make the test
event successful. AIM PowerGen Corporation and Stapleton Price Operations
Management are the owners of the Port Burwell Wind Farm and permitted Hydro One
Network Inc. (HONI) to conduct the test. GE Wind Energy, Kestrel Power and Black &
McDonald were in charge of the measurements of various parameters at the WTG
terminals and at the Port Burwell generating stations. HONI was the main organizer of
this test and also was in charge of measurements of several system variables at the
Tillsonburg Transformer Station. The substations and the protection equipment necessary
to interconnect this wind farm with HONI network were installed by AMEC. The
University of Western Ontario and IESO were responsible to conduct the simulation
studies in PSS/E for the validation of the DFIG models.
A number of tests were conducted employing a single wind turbine generator as well
as multiple wind turbine generators on the same collector feeder. The tests included:
1. Capacitor bank switching on and off at 34.5 kV Port Burwell wind generating
station
2. Capacitor bank switching on and off at 115 kV Tillsonburg transformer station
3. Wind farm reference voltage change by ± 2%
Out of these tests only a few events are chosen to validate the PSS/E models of GE 1.5
MW wind turbine generators. The test events are chosen in such a way that they fall into
PSS/E recommended transient domain in which these models are supposed to be valid.
The study results show good agreement of the PSS/E models with the field
measurements.

173
A.3 DFIG Model
GE 1.5 MW wind turbine generator configuration is shown in Fig. A.2. This model
has been implemented in PSS/E to simulate the single rotor branch (single cage) doubly-
fed (wound rotor) induction (asynchronous) generator machine by representing
mechanical dynamics but neglecting stator and rotor flux linkage dynamics. The model
has been significantly modified based on results of studies of weakly interconnected wind
farms and the manufacturer's recommendations. Details of the device dynamics have
been substantially simplified. Specifically, the very fast dynamics associated with the
control of the generator converter have been modeled as algebraic (i.e. instantaneous)
approximations of their response. Representation of the turbine mechanical controls has
been simplified as well.
Wind Turbine Collector System (e. g. 34.5 kV Bus)
Field Converter
Fig. A.2 DFIG configuration in PSS/E [7, 10]
Voltage and reactive power control in steady state as well as during transient operation
are possible in this configuration of doubly fed wind turbine generator. The controller
structure and various controller gains, e.g. KQ> Kyi, are shown in Fig. A.3. The reactive
power controller receives the reactive power command from either of the Wind VAR
Emulator system, steady state reactive demand or from power factor control system.
Wind VAR Emulator system is a supervisory control system which controls and monitors
the collector bus voltage of the entire wind farm. On the other hand, power factor control
system dynamically maintains the specified power factor at the machine terminal
depending on changing active power demand which varies with wind speed as well as
with grid requirements. At the time of testing Wind VAR Emulator and power factor
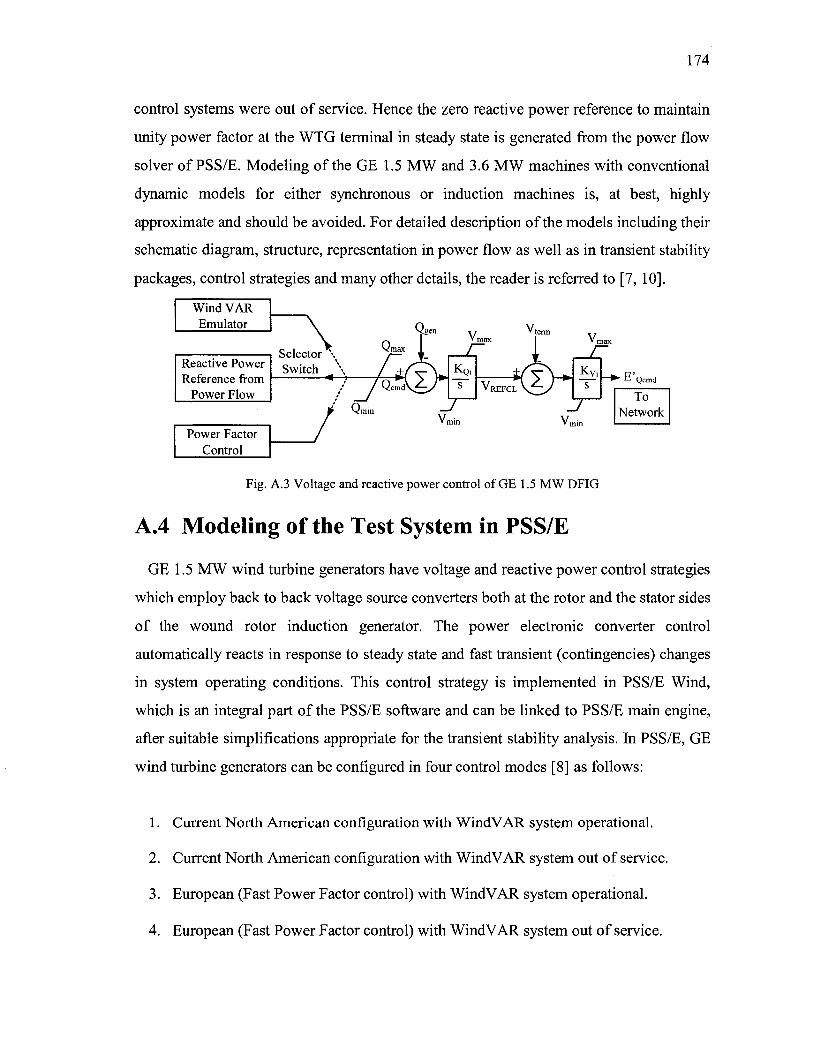
174
control systems were out of service. Hence the zero reactive power reference to maintain
unity power factor at the WTG terminal in steady state is generated from the power flow
solver of PSS/E. Modeling of the GE 1.5 MW and 3.6 MW machines with conventional
dynamic models for either synchronous or induction machines is, at best, highly
approximate and should be avoided. For detailed description of the models including their
schematic diagram, structure, representation in power flow as well as in transient stability
packages, control strategies and many other details, the reader is referred to [7,10].
Wind VAR Emulator
Reactive Power Reference from
Power Flow
Power Factor Control
Selector \t
Switch
/
Vmin
vmax
/ &( Vcmd* lb*
Vmax
r KQI
s
_y VRE
'term
*l\£) — •
Vmax
r K V i
J
f. C " •^ ^ Qcmd
To Network
Fig. A.3 Voltage and reactive power control of GE 1.5 MW DFIG
A.4 Modeling of the Test System in PSS/E
GE 1.5 MW wind turbine generators have voltage and reactive power control strategies
which employ back to back voltage source converters both at the rotor and the stator sides
of the wound rotor induction generator. The power electronic converter control
automatically reacts in response to steady state and fast transient (contingencies) changes
in system operating conditions. This control strategy is implemented in PSS/E Wind,
which is an integral part of the PSS/E software and can be linked to PSS/E main engine,
after suitable simplifications appropriate for the transient stability analysis. In PSS/E, GE
wind turbine generators can be configured in four control modes [8] as follows:
1. Current North American configuration with WindVAR system operational.
2. Current North American configuration with WindVAR system out of service.
3. European (Fast Power Factor control) with WindVAR system operational.
4. European (Fast Power Factor control) with WindVAR system out of service.

175
At the time of field measurements a single feeder was isolated and all the 11 wind
turbine generators connected to that feeder were subjected to different test conditions.
The total power output from the generators was approximately 10 MW. Wind turbine
generators are configured as in mode 2. Correspondingly, in PSS/E the mode 2 was
implemented in steady state and in dynamic activities.
The validation studies are conducted in a system which is further reduced but not
shown in Fig. A.l. The single line diagram of the study system is shown in Fig. A.4. It
mainly encompasses the Port Burwell wind generating station (WGS), Cranberry Junction
as the grid or infinite bus, Tillsonburg Transformer Station (TS) and the corresponding
TS load.
Collector Feeder
#
12 GE 1.5 MW Machines on Same Collector Feeder
^ ^ T - ^ X
/7f77
Y/A
Infinite Bus
Line 1 Line 2
Line 3 Point of Measurement
X
/////
Fig. A.4 Study system
Two test conditions are mainly considered for this study. They are:
• An 8 MVAr capacitor is switched on at 34.5 kV collector bus of Port Burwell
Substation;
• The same capacitor bank is then switched off from the Port Burwell 34.5 kV bus.
Test conditions were implemented in PSS/E as accurately as possible so that the actual
transient events are simulated. Validation results are reported in the next section.

176
A.5 Validation Results
The entire validation study is carried out in a few stages. Firstly, two different test
events mentioned in the previous section are simulated to validate the original GE 1.5
MW DFIG model with its nominal parameters recommended by the manufacturer and
implemented in PSS/E Wind software [7, 10]. Secondly, it is shown that the reactive
power and hence voltage responses of a DFIG can be substantially improved with proper
tuning of controller parameters. The study shows a maximum difference lower than 2%
between the simulated and test responses, thus validating the DFIG model.
A.5.1 Test 1: 8 MVAr Capacitor Switch Off at Port Burwell
WGS
The figures below show the system responses for 8 MVAR capacitor bank switch off
at Port Burwell 34.5 kV collector bus. The signals examined are active and reactive
power flows of the wind turbine generators measured on the collector feeder and the
collector bus voltage, which are displayed in Fig. A.5 to Fig. A.7. The results show
acceptable agreement between the simulated response and the field results. Original
model with nominal parameters implemented in PSS/E Wind software is used for this
study.
10
8
r-, 6
> £ 4
o 5=
° 2
0
"20 5 10 15 Time (s)
Fig. A.5 Reactive power flow on collector feeder
I ~ = I — 1
7
Simulated ^™" Experimental

177
12
11.5
11
10.5
10
9.5
to**?Mto^^
Simulated ' Experimental
2 4 6 8 Time (s)
Fig. A.6 Active power flow of the WTGs
10
60
55
50
> 45
I 40
>°35
30
25
20
Simulated ^ ^ Experimental""
5 10 15 Time (s)
Fig. A.7 Collector bus voltage
A.5.2Test 2: 8 MVAr Capacitor Switch On at Port Burwell
WGS
In continuity with the previous test, the same 8 MVAr capacitor is switched on in the
next test event. It is to be noted that these two tests are usually done consecutively to keep
the other parameters, e.g. wind speed, unchanged. Same signals as reported in section
A.5.1 are reported in Fig. A.8, A.9, and A. 10 respectively. Reasonable matching is
observed between the actual and field test results. This validates the DFIG model used in
PSS/E.
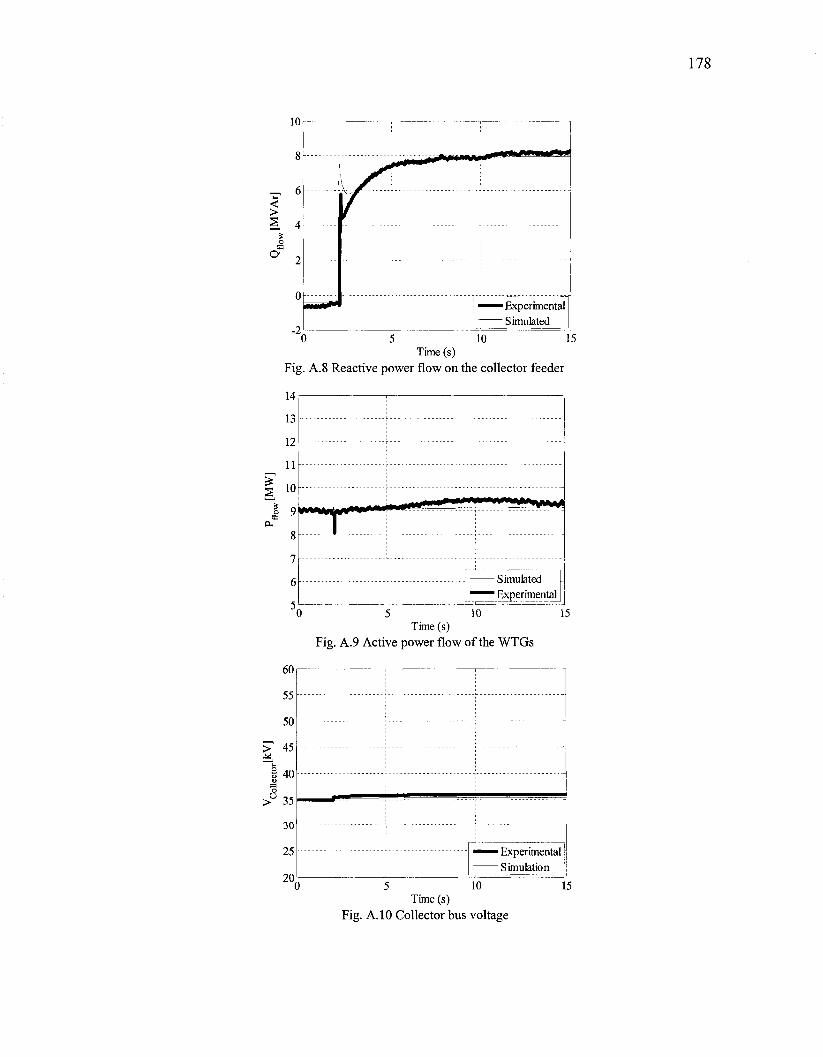
178
10
8
4
< >
a
— * J
^mmmBKaammet
mmmm' Experimental Simulated
0 5 10 15 Time (s)
Fig. A.8 Reactive power flow on the collector feeder
14
13
12
11
10
mmmm Experimental
60
55
50
> 45
! 40
>°35
30
25
20
10 15 Time (s)
Fig. A.9 Active power flow of the WTGs
^—• Experimental Simulation
5 10 Time (s)
Fig. A. 10 Collector bus voltage
15
179
A.5.3 Improvement of System Performance by Controller
Parameter Tuning
It is apparent from Fig. A. 5 and Fig. A. 8 that the reactive power response takes several
seconds to settle down. This is mainly due to the detuned parameters of the voltage and
reactive power controllers. The structure of reactive power and voltage controller of the
GE 1.5 MW WTG is shown in Fig A.3. At the time of test the wind turbine generators
were operating close to unity power factor and their wind VAR management system was
shut down. As a result, neither fast reactive power control nor voltage control was
operational. Only steady state reactive power control was enabled and hence KQJ, Kvi are
the only controller gains which could be controlled. Similar operating scenario is
simulated in PSS/E. A systematic tuning procedure based on trial and error is adopted for
its ease of implementation. At first Kv; is kept constant and KQ; is varied and next the
reverse procedure is adopted. The reactive power responses for these two control
parameters variations are reported in separate subsections. It is to be noted that
parameters are tuned only for one test event which is an 8 MVAr capacitor switch off at
Port Burwell WGS. Similar results are obtained for capacitor switch on but are not
reported to avoid repetition.
A.5.3.1 Variation in KQJ
A wide range of values of KQJ is selected from KQJ = 0.05 to KQJ = 5. The Kvi is kept
fixed at 40. The reactive power responses are shown in Fig. A. 11.
From Fig. A. 11 it is evident that corresponding to KQJ = 0.5, although the measured
reactive power deviates from that of simulated quantity, the settling time of the signal
becomes less than 3s compared to 8s for KQJ = 0.05. However, further increase in KQ;
makes the response gradually oscillatory which is also vividly illustrated in this figure.
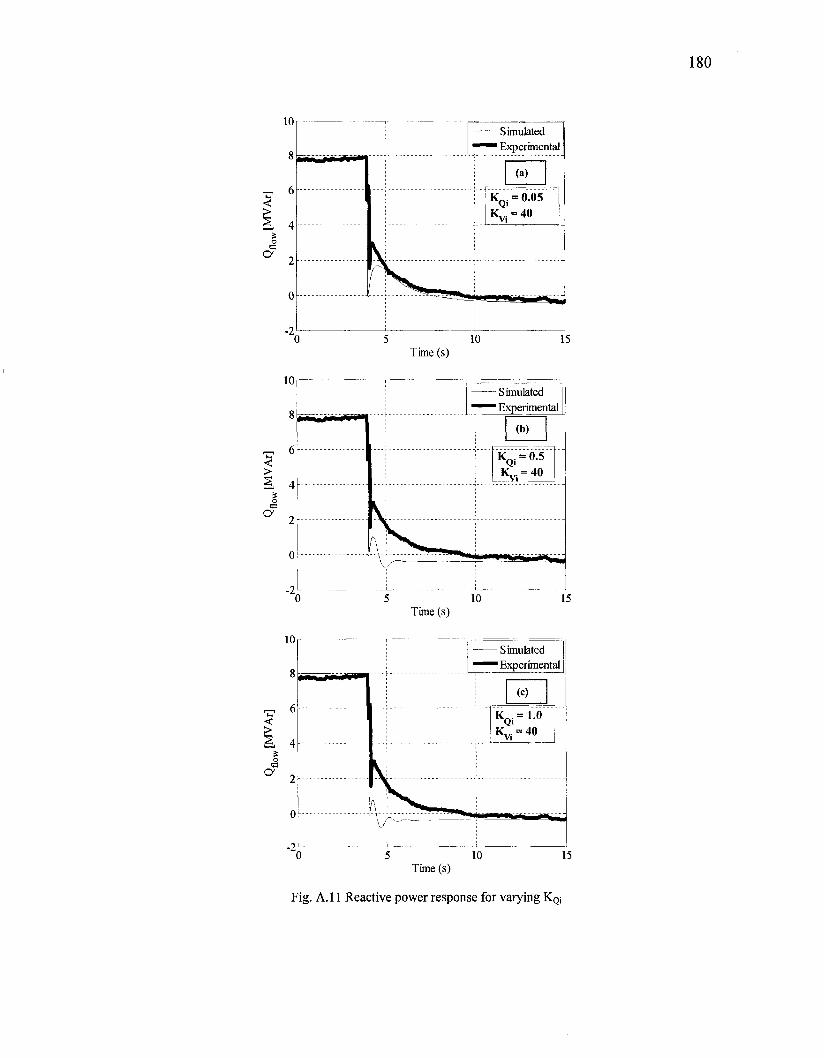
180
10
53
f
^
Simulated ^^"" Experimental
(a)
KQ. = 0.05
Kv , -40
5 10 Time (s)
15
< >
O
5 10 Time (s)
15
10
^ 6 <! >
• M K . a^^/^ftftM
Simulated " " Experimental
1 !
A L S - ^ , \ w. ^
W
KQ j=1.0 ^ = 40
V ! " •
5 10 Time (s)
15
Fig. A. 11 Reactive power response for varying KQi
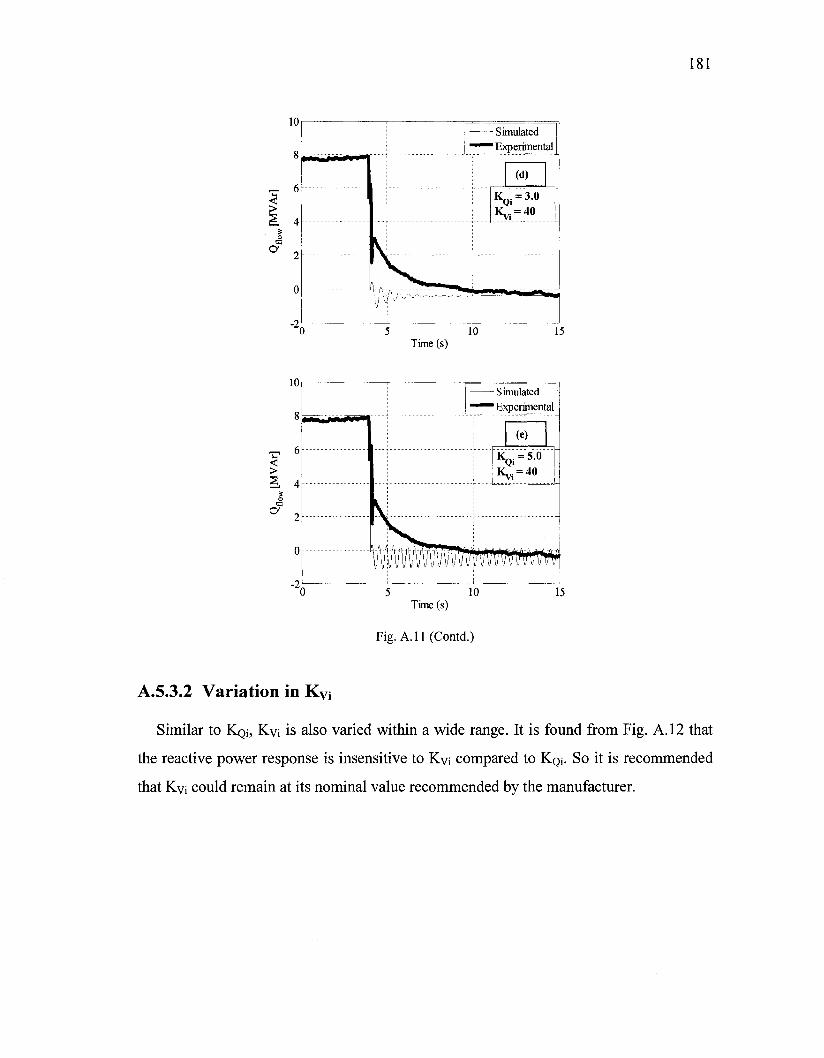
181
10
-r. 6 I ~1 1 Simulated
—••" Experimental
i (d)
i KQi =
30
! K v i = 40 I
V \ f r ^ ^ 5 10
Time (s) 15
10
>
a
4-
W
Simulated " ~ ^ Experimental
(e)
KQ. = 5.0 Kv. = 40
" '1 " "^T**^7Va • : . . . .
WWW 5 10
Time (s)
Fig. A. 11 (Contd.)
15
A.5.3.2 Variation in K Vi
Similar to KQJ, Kvi is also varied within a wide range. It is found from Fig. A. 12 that
the reactive power response is insensitive to Kvi compared to KQJ. SO it is recommended
that Kvi could remain at its nominal value recommended by the manufacturer.
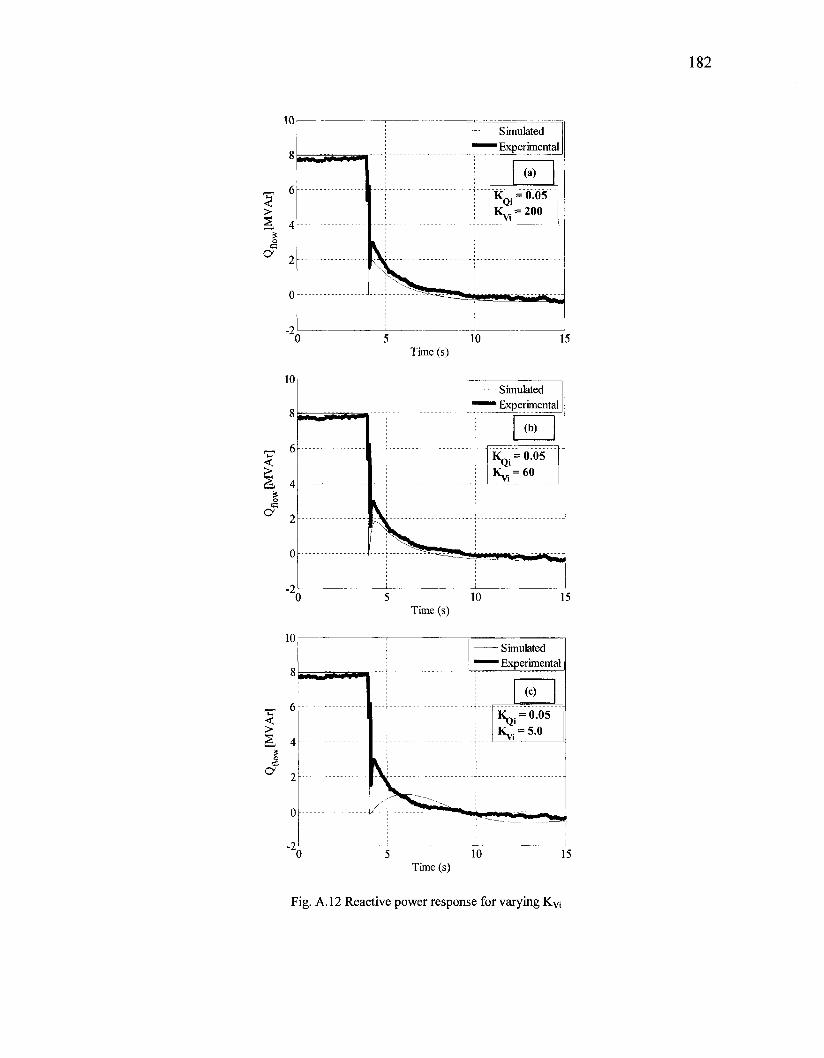
182
5 10 Time (s)
15
10
^-, 6 < >
<y 2-
1
Simulated "" Experimental
(b)
K«. = 0.05 Qi
Kyi = 60
5 10 Time (s)
15
10
< >
•M^a^PMOT^^j
/.
Simulated " " " • Experimental
: (c)
KQ. = 0.05
! Kyi = 5-°
- . ..JBJ
5 10 Time (s)
15
Fig. A. 12 Reactive power response for varying K Vi
183
A.6 Comparison of the Test Results and Simulated
Responses
It is shown in section A.5.1 and A.5.2 that the reactive power responses match very
closely with the test results. However, there are some differences in power flow and
voltage response signals. This is shown in this section by zooming in the plots of those
signals for the two test events simulated.
A.6.1Test 1: 8 MVAr Capacitor Switch Off at Port Burwell
WGS
Figs A. 13 and A. 14 show the expanded plots of voltage and power flow signals during
this test event. Following observations are made:
• The simulated steady state value of the collector bus voltage is within 2% of the
value obtained in actual test. This is a very good correlation considering the facts
listed below:
o The most simplified configuration of the WTG to get an insight of its
operating principles
o The wind VAR emulator system was out of service at the time of testing.
• The voltage overshoot is larger in actual test than in simulation. It is also observed
from Fig. A. 5 that the overshoot in reactive power is less in actual field test data
than that in simulation. The overshoot magnitude depends on several factors such
as system strength or short circuit capacity, power output levels from the wind
generators and so on which always vary at every instant in real system. But the
settling time of voltage and reactive power response remains same as it depends
on system damping. This settling time is very close between the actual and
simulated response and is quite apparent from Fig A.5 and Fig. A. 13.
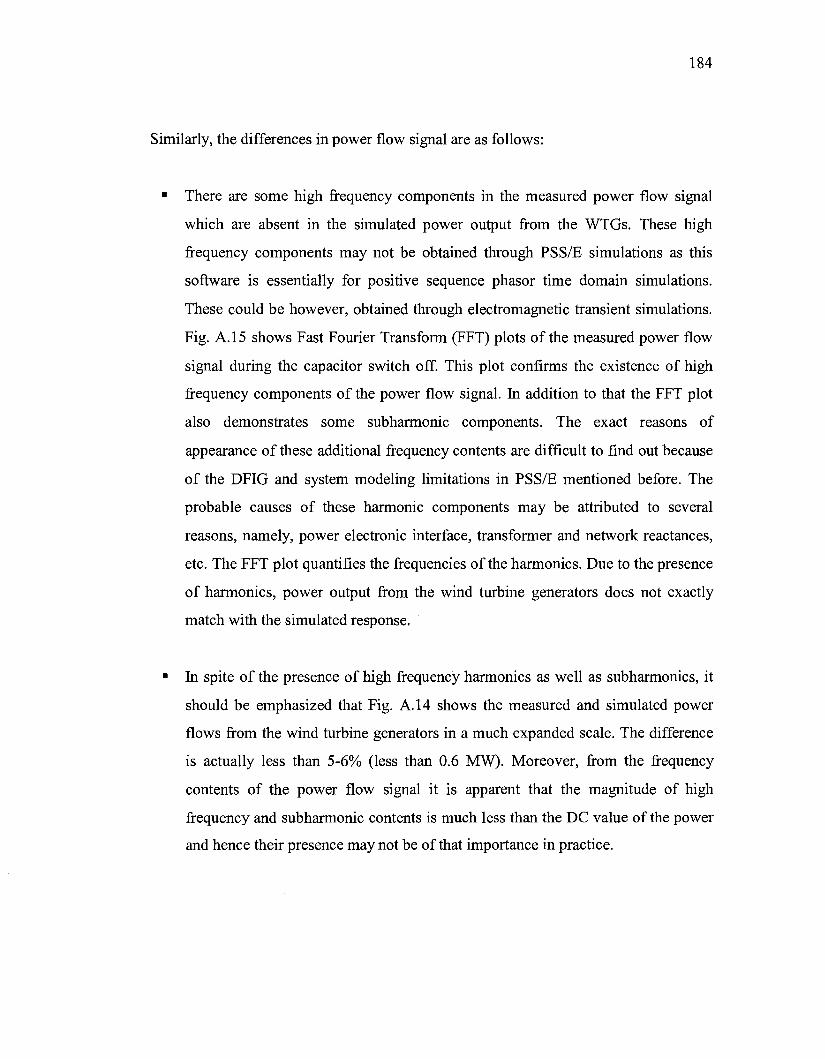
184
Similarly, the differences in power flow signal are as follows:
• There are some high frequency components in the measured power flow signal
which are absent in the simulated power output from the WTGs. These high
frequency components may not be obtained through PSS/E simulations as this
software is essentially for positive sequence phasor time domain simulations.
These could be however, obtained through electromagnetic transient simulations.
Fig. A. 15 shows Fast Fourier Transform (FFT) plots of the measured power flow
signal during the capacitor switch off. This plot confirms the existence of high
frequency components of the power flow signal. In addition to that the FFT plot
also demonstrates some subharmonic components. The exact reasons of
appearance of these additional frequency contents are difficult to find out because
of the DFIG and system modeling limitations in PSS/E mentioned before. The
probable causes of these harmonic components may be attributed to several
reasons, namely, power electronic interface, transformer and network reactances,
etc. The FFT plot quantifies the frequencies of the harmonics. Due to the presence
of harmonics, power output from the wind turbine generators does not exactly
match with the simulated response.
• In spite of the presence of high frequency harmonics as well as subharmonics, it
should be emphasized that Fig. A. 14 shows the measured and simulated power
flows from the wind turbine generators in a much expanded scale. The difference
is actually less than 5-6% (less than 0.6 MW). Moreover, from the frequency
contents of the power flow signal it is apparent that the magnitude of high
frequency and subharmonic contents is much less than the DC value of the power
and hence their presence may not be of that importance in practice.

185
• There is a dip in power flow signal both in measurements and in simulation once
the capacitor is switched off. The dip in power is larger in actual test. This dip is
expected as there is an abrupt dip in voltage at the instant of capacitor switch off.
36.4
36.2
36
^ 35.8
= 35.6
35.4
35.2
35 0
l * * * * ^ * " " * *
^] Simulated
™""" Experimental
—— ^
AV=0.61 kV
X: 12.97 Y: 35.73
A
= 1.739%
X: 12.97 Y: 35.12 ^ '
M ^ ^ ^ * f e j 0 0 B |
10 15 Time (s)
Fig. A. 13 Collector bus voltage at Port Burwell (zoomed in)
11
10.9
10.8
I 10'7
& 10.6
10.5
10.4
10.3
| i | iJ JUttM
0 10 15 Time (s)
Fig. A. 14 Power flow from the generators (zoomed in)

186
70
60
50 o •a 3 •3 40 3" 2 H u.
FFT Plot of P During Capacitor Switch Off (Expanded) gen
14.48 Hz i
/ : 46,1:5 Hz
/ K ; 3P.77 Hz
"trTii 100 200 300 400 500 600 700
Frequency (Hz)
Fig. A. 15 FFT plot of measured power flow signal
A.6.2Test 2: 8 MVAr Capacitor Switch On at Port Burwell
WGS
In this study same observations are made as mentioned in section A.6.1. The
difference in voltage is again within 2% and is apparent from Fig. A. 16. The difference in
power flow signal is also similar as that of section A.6.1 at the instant of capacitor switch
on which is depicted in Fig. A. 17. In simulation the power output from the WTGs is
found to increase at the time of the capacitor switch on. This is expected as the voltage at
collector bus also jumps at the instant of capacitor switch on. The frequency content of
the power flow signal for capacitor bank switch on is shown in Fig. A. 18.
36.2
36
35.8
> a 35.6
o 3 5 . 4
+~J
K—-"'"
ta^lAi X: 12.97 ' Y: 35.98
AV = 0.57kV= 1.5942%
X: 12.97 Y: 35.41 .
k
'
•bxpen Simuli
mental ition
35.2
35
34.8 0 5 10 15
Time (s)
Fig. A. 16 Collector bus voltage at Port Burwell (zoomed in)

187
9.6
9.4
9.2
9
8.8
8.6
8.4
.!l*t..'. i
* . ^
;
:
-- — ^ Simulated Experimental
5 10 Time (s)
15
Fig. A. 17 Power flow from the generators (zoomed in)
140
120
FFT Plot of P >en during Capacitor Switch On (Expanded)
100
1 80
60
40
20
15.63 !Hz 45.96 Hz
0 ' '•ll
100 200 300 400 500 600 700
Frequency (Hz)
Fig. A. 18 FFT plot of measured power flow signal
In short, in this test also reasonable match between the field test and simulation results
is observed in reactive power, voltage and power flow signals. The extent of mismatch is
within an acceptable band and the validity of the model is once again confirmed.
A.7 Recommendations for Wind Farm Testing
Based on the studies reported in this chapter a number of recommendations are made
which will help utilities to conduct more accurate tests in near future. A tremendous co
ordination of several agencies and investment in terms of time, money and manpower are

188
required for organizing a field test. Hence all efforts should be made to ensure that the
field testing is a success. The recommendations to achieve this goal are as follows:
• As mentioned in section A.2, at the time of testing several other experiments are
carried out. However, those test results are either difficult to simulate in PSS/E or
may not be theoretically explained. It should therefore be made mandatory to
extensively simulate the test conditions according to the test plan for the wind
farm for all likely wind speeds and the system conditions expected at the time of
field testing. This will give prior idea of how the system responses should be
before the tests are conducted. If the field results do not correspond to simulation
results the possible reasons of mismatch should be identified onsite and necessary
corrections may be done in field testing.
• Based on simulations if it can be shown that modifications in WTG control may
substantially improve system performance, an agreement may be reached a priori
with the representatives of the manufacturers so that the field tests may be
repeated with improved WTG control parameters. This will ensure optimum
system performance.
A.8 Conclusions
From this study it is concluded that the GE 1.5 MW wind turbine generator model
implemented in PSS/E shows reasonable accuracy with actual field measurements. It is
also shown that the system performance can be significantly improved with proper tuning
of controller gains. The mismatches between the test and simulation results are compared
and possible explanations are provided. Presence of high frequency harmonics in
measured power flow signals has been found and their frequency ranges are shown by
FFT analysis. These high frequency harmonics may be investigated only by detailed
electromagnetic transient simulations through EMTDC/PSCAD or EMTP software.
However, the DFIG models for electromagnetic transient analysis are not readily

189
available. These field validation studies have been done for the first time in the electrical
network of Hydro One in Ontario. These studies have further provided useful insights in
the operation of the WTGs.
A.9 References
[1] T. Ackerman, Power Wind Power in Power Systems, John Wiley & Sons, 2005.
[2] Available: http://www.canwea.ca/images/uploads/File/WindSight/
[3] P. Kundur, Power Systems Stability and Control: New McGraw-Hill, 1994.
[4] R. Zavadil, N. Miller, A. Ellis, and E. Muljadi, "Making Connections," IEEE
Power & Energy Magazine, pp. 28-37, November/December 2005.
[5] E. A. DeMeo, W. Grant, M.R. Milligan, and M. J. Schuerger, "Wind plant
integration," IEEE Power and Energy Magazine, vol.3, no.6, pp. 38-46, Nov.-
Dec. 2005.
[6] EMTDC PSCAD User Manual, HVDC Research Center, Manitoba, 2003.
[7] PSS/E WIND User Manual, Siemens Power Transmission and Distribution
(SPTD), Power Technologies Incorporation (PTI), Schenectady, New York, Issue
3.0.0, November 2006.
[8] SIMPOWXJser Manual, HVDC STRIAB, Sweden, 2007.
[9] DIgSILENTPOWER FACTORYUser Manual, GmbH, Germany, 2006.
[10] N. W. Miller, J. J. Sanchez-Gasca, W. W. Price and R. W. Delmerico, "Dynamic
modeling of GE 1.5 and 3.6 MW wind turbine generators for stability
simulations," in Proc. IEEE PES General Meeting, July 2003, Toronto pp. 1977-
1983.
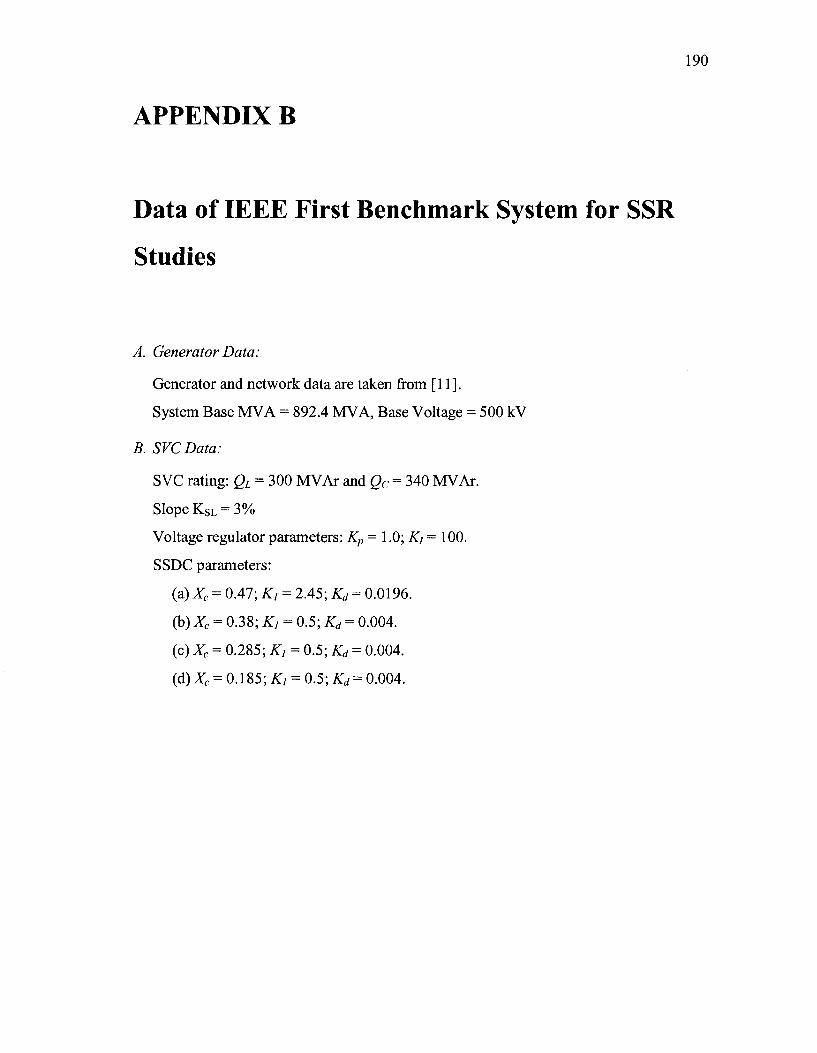
190
APPENDIX B
Data of IEEE First Benchmark System for SSR
Studies
A. Generator Data:
Generator and network data are taken from [11].
System Base MVA = 892.4 MVA, Base Voltage = 500 kV
B. SVC Data:
SVC rating: QL = 300 MVAr and Qc = 340 MVAr.
Slope KSL = 3%
Voltage regulator parameters: Kp=\ .0; Kj = 100.
SSDC parameters:
(&)XC = 0.47; K, = 2.45; Kd = 0.0196.
(b) Xc = 0.38; Kj = 0.5; Kd = 0.004.
(c)Xc = 0.285; Kj = 0.5; Kd = 0.004.
(d)Xc = 0.185; Kj - 0.5; Kd = 0.004.

191
APPENDIX C
Data for the Wind Farm
A. Self-Excited double-cage Induction Generator (SEIG) Data:
Power Rating = 1000 HP; VLL = 26.0 kV;
Rs = 0.015 p.u. XLS = 0.091 p.u. RrJ = 0.0507 p.u.
Rr2 = 0.0095 p.u. XL1 = 0.0 p.u. XL2 = 0.0539 p.u.
Xml2 = 0.1418 p.u. HG = 0.5 p.u.
Higher generator power output is obtained by choosing an appropriate number of
machines acting coherently.
B. Torsional System Data:
Power= 100 MW; HT= 12.5 p.u. HG = 0.5 p.u. KGT= 0.15 p.u.
C. SVC Data:
100 MW Power Transfer:
Qc = 150 MVAr; QL = 100 MVAr.
500 MW Power Transfer:
gc= 300 MVAr; QL = 200 MVAr.
Voltage Regulator: KP = 0.0; Ki = 200.
SSR Damping Controller: Kaux =100; Kw =1.0; Tw = 10.0 s.
SVC slope = 3%.
D. TCSCData:
p= Percentage series compensation Xo/X^ = 90%, 65%, 50%; XL = Calculated from
(4.5) to avoid multiple resonances in TCSC reactance-firing angle characteristics.
TCSC Current Controller: KP = 0.0; Ki = 200.

VITA
NAME: SoubhikAuddy
ACADEMICS
The University of Western Ontario, London, Canada Sept 2003 - Present
Doctorate of Philosophy, Department of Electrical and Computer Engineering
Specialization: FACTS, Wind Power Integration, Modeling of Wind Turbine Generator,
Power System Dynamics and Stability
Indian Institute of Technology, Kanpur, India July 2001 - April 2003
Master of Technology (M.Tech), Department of Electrical and Computer Engineering
Specialization: Power Electronics and Electric Motor Drives
Jadavpur University, Kolkata, India July 1996 - July 2000
Bachelor of Engineering (B.E.), Department of Electrical Engineering
Specialization: Electric Machines and Power Systems
PUBLICATIONS
1. R. K. Varma, S. Auddy and Y. Semsedini, "Mitigation of Subsynchronous
Resonance in a Series Compensated Wind Farm using FACTS Controllers"
accepted for publication (in press) in IEEE Transactions on Power Delivery,2007
2. R. K. Varma, R. P. Gupta and S. Auddy, "Damping of Inter-Area Oscillation in
Power Systems by SVC using PMU-Acquired Remote Bus Voltage Angles,"
International Journal of Emerging Electric Power Systems, Vol. 8, Issue 4, Article
6, 2007
3. R. K. Varma, M. Dang and S. Auddy, "Overvoltages at the Terminal of a Wind
Farm Connected to a Coupled Double Circuit Transmission Line in Ontario," in
Proc. ofCIGRE Canada Conference, Calgary, Alberta, August 26th-28th, 2007.
193
4. S. Auddy, R. K. Varma and M. Dang, "Field Validation of a Doubly Fed Induction
Generator (DFIG) Model," accepted for publications in Proc. of Electric Power
Conference, to be held in Montreal, Quebec, in October, 2007.
5. R. K. Varma and S. Auddy, "Mitigation of subsynchronous resonance in a series
compensated wind farm using static var compensator," in Proc. of IEEE PES
General Meeting, Montreal, Quebec, June, 2006, pp. 1-7.
6. R. K. Varma and S. Auddy, "Mitigation of subsynchronous resonance by SVC
using PMU-acquired remote generator speed," in Proc. of IEEE Power India
Conference, New Delhi, India, April 10-12, 2006.
7. R. K. Varma, Y. Semsedini and S. Auddy, "Mitigation of subsynchronous
oscillations in a series compensated wind farm with thyristor controlled series
capacitors (TCSC)," in Proc. of Power System Conference, Advanced Metering,
Protection, Control, Communications and Distributed Resources, Clemson, USA
March, 2007.
8. R. K. Varma, W. Litzenberger, S. Auddy and D. Patel, "Bibliography of HVDC
Transmission: 2001-2003 Part I IEEE Working Group Report," ID: 07GM1498,
accepted for publication in Proc. of IEEE PES General Meeting, Tampa, Florida,
June 2007.
9. R. K. Varma, W. Litzenberger, S. Auddy and D. Patel, "Bibliography of HVDC
Transmission: 2001-2003 Part II IEEE Working Group Report," Paper:
07GM1497, in Proc. of IEEE PES General Meeting, Tampa, Florida, June 2007.
10. R. K. Varma, W. Litzenberger, S. Auddy and D. Patel, "Bibliography of HVDC
Transmission: 2005-2006 IEEE Working Group Report," Paper: 07GM1340, in
Proc. of IEEE PES General Meeting, Tampa, Florida, June 2007.
11. R. K. Varma, W. Litzenberger, A. Ostadi and S. Auddy, "Bibliography of FACTS:
2005-2006 Part I IEEE Working Group Report," Paper: 07GM1490, in Proc. IEEE
PES General Meeting, Tampa, Florida, June 2007.
12. R. K. Varma, W. Litzenberger, A. Ostadi and S. Auddy, "Bibliography of FACTS:

194
2005-2006 Part II IEEE Working Group Report," Paper: 07GM1494, in Proc. of
IEEE PES GM Florida, 2007.
13. R. K. Varma, W. Litzenberger, S. Auddy, J. Berge, A. C. Cojocaru and T. Sidhu,
"Bibliography of FACTS: 2004-2005 - Part I IEEE Working Group Report," in
Proc. IEEE PES General Meeting, Montreal, Quebec, June, 2006, pp. 1-8.
14. R. K. Varma, W. Litzenberger, S. Auddy, J. Berge, A. C. Cojocaru and T. Sidhu,
"Bibliography of FACTS: 2004-2005 - Part II IEEE Working Group Report," in
Proc. IEEE PES General Meeting, Montreal, Quebec, June, 2006, pp. 1-8.
15. R. K. Varma, W. Litzenberger, S. Auddy, J. Berge, A. C. Cojocaru and T. Sidhu,
"Bibliography of FACTS: 2004-2005 - Part III IEEE Working Group Report," in
Proc. IEEE PES General Meeting, Montreal, Quebec, June, 2006, pp. 1-6.
16. R. K. Varma, W. Litzenberger, S. Auddy, J. Berge, A. C. Cojocaru and T. Sidhu,
"Bibliography of HVDC: 2004-2005 IEEE Working Group Report," in Proc.
IEEE PES General Meeting, Montreal, Quebec, June, 2006, pp. 1-7.
17. S. Auddy and S. P. Das, "A Comparative Study of Rotor Flux Estimation of an
Induction Machine Employed in a Direct Vector Control Application using Linear
and Nonlinear State Observers," in Proc. of National Conference of Recent
Advances in Power, Signal Processing and Control (APSC-2004), NIT Rourkela,
pp. 6-12, Nov. 2004.
18. A. U. Gene, S. Auddy, D. Erdogmus, S. P. Das and J. C. Principe, "Adaptive
Extended Luenberger Observer in State Feedback Control of Nonlinear Dynamical
Systems," accepted for publication in Proc. of 12th Mediterranean Conference on
Control and Automation (Med-04), Paper ID: 1062,Turkey, June. 2004
19. S. Auddy, "A Comparative Study of some Rotor Flux Estimation Methods for an
Induction Machine", Masters of Technology Thesis, Indian Institute of
Technology, Kanpur, India, April-2003.

195
HONORS AND AWARDS
"Outstanding Presentation Award" in the graduate symposium Feb 2005
held at the Department of Electrical and Computer Engineering,
UWO.
Session Chair in Poster session in IEEE PES General Meeting, June 2006
Montreal, Quebec
Hydro-One scholarship Feb. 2005
Western Engineering Scholarship, Special University Scholarships, Sept 2003-Present
International Graduate Student Scholarship, The University of
Western Ontario, Canada
Institute Assistantship (for teaching and research assistantship), IIT, July 2001-July
Kanpur, India 2003
Secured 70th all India rank in Graduate Aptitude Test in Engineering March 2003
(GATE) examination out of 6500 candidates.