modeling and validation of autoinducer-mediated bacterial gene expression in microfluidic...
TRANSCRIPT

Modeling and validation of autoinducer-mediated bacterial gene expression inmicrofluidic environmentsCaitlin M. Austin, William Stoy, Peter Su, Marie C. Harber, J. Patrick Bardill, Brian K. Hammer, and Craig R.Forest Citation: Biomicrofluidics 8, 034116 (2014); doi: 10.1063/1.4884519 View online: http://dx.doi.org/10.1063/1.4884519 View Table of Contents: http://scitation.aip.org/content/aip/journal/bmf/8/3?ver=pdfcov Published by the AIP Publishing Articles you may be interested in Rapid microfluidic solid-phase extraction system for hyper-methylated DNA enrichment and epigenetic analysis Biomicrofluidics 8, 054119 (2014); 10.1063/1.4899059 Planar lens integrated capillary action microfluidic immunoassay device for the optical detection of troponin I Biomicrofluidics 7, 064112 (2013); 10.1063/1.4837755 A microfluidic platform for real-time and in situ monitoring of virus infection process Biomicrofluidics 6, 034122 (2012); 10.1063/1.4756793 A microfluidic device for physical trapping and electrical lysis of bacterial cells Appl. Phys. Lett. 92, 214103 (2008); 10.1063/1.2937088 Microfluidic chip for fast bioassays—evaluation of binding parameters Biomicrofluidics 1, 024101 (2007); 10.1063/1.2723647
This article is copyrighted as indicated in the article. Reuse of AIP content is subject to the terms at: http://scitation.aip.org/termsconditions. Downloaded to IP:
130.88.53.18 On: Sun, 07 Dec 2014 13:54:39
Modeling and validation of autoinducer-mediated bacterialgene expression in microfluidic environments
Caitlin M. Austin,1 William Stoy,2 Peter Su,3 Marie C. Harber,1
J. Patrick Bardill,4 Brian K. Hammer,4 and Craig R. Forest11George W. Woodruff School of Mechanical Engineering, Georgia Institute of Technology,Atlanta, Georgia 30332, USA2Wallace H. Coulter Department of Biomedical Engineering, Georgia Institute ofTechnology, Atlanta, Georgia 30332, USA3Department of Chemical and Biomolecular Engineering, University of California,Berkeley, California 94720, USA4School of Biology, Georgia Institute of Technology, Atlanta, Georgia 30332, USA
(Received 11 April 2014; accepted 10 June 2014; published online 17 June 2014)
Biosensors exploiting communication within genetically engineered bacteria are
becoming increasingly important for monitoring environmental changes. Currently,
there are a variety of mathematical models for understanding and predicting how
genetically engineered bacteria respond to molecular stimuli in these
environments, but as sensors have miniaturized towards microfluidics and are
subjected to complex time-varying inputs, the shortcomings of these models have
become apparent. The effects of microfluidic environments such as low oxygen
concentration, increased biofilm encapsulation, diffusion limited molecular
distribution, and higher population densities strongly affect rate constants for gene
expression not accounted for in previous models. We report a mathematical model
that accurately predicts the biological response of the autoinducer N-acyl
homoserine lactone-mediated green fluorescent protein expression in reporter
bacteria in microfluidic environments by accommodating these rate constants. This
generalized mass action model considers a chain of biomolecular events from input
autoinducer chemical to fluorescent protein expression through a series of six
chemical species. We have validated this model against experimental data from our
own apparatus as well as prior published experimental results. Results indicate
accurate prediction of dynamics (e.g., 14% peak time error from a pulse input) and
with reduced mean-squared error with pulse or step inputs for a range of
concentrations (10 lM–30 lM). This model can help advance the design of
genetically engineered bacteria sensors and molecular communication devices.VC 2014 AIP Publishing LLC. [http://dx.doi.org/10.1063/1.4884519]
I. INTRODUCTION
Using synthetic biology to genetically engineer bacteria that is responsive to molecular
cues has enabled a variety of sensing applications. For example, engineered bacteria have
been used as toxicology biosensors to detect the presence of pollutants including metals,1 ar-
senic pollution,2 and to monitor membrane biofouling.3 These sensors are typically housed in
flasks, wells, or agar plates,1–3 but miniaturization is becoming increasingly common and im-
portant because it enables one to minimize reagents and to have greater control over stimuli,
population size, density, flow rate, temperature, and other factors. As noted by van der Meer,
and Belkin, “owing to their small size, bacterial bioreporter cells are highly suitable for incor-
poration onto microengineered platforms, transforming such devices into whole-cell bio-
sensors.”4 Additionally polydimethylsiloxane (PDMS) is emerging as the material of choice
for the design and fabrication of three-dimensional microfluidic networks of bacterial-cell
arrays.4
1932-1058/2014/8(3)/034116/10/$30.00 VC 2014 AIP Publishing LLC8, 034116-1
BIOMICROFLUIDICS 8, 034116 (2014)
This article is copyrighted as indicated in the article. Reuse of AIP content is subject to the terms at: http://scitation.aip.org/termsconditions. Downloaded to IP:
130.88.53.18 On: Sun, 07 Dec 2014 13:54:39
To understand and engineer bacteria for sensor applications, several groups have examined
the response of engineered bacteria to stimuli, either in bulk culture or in a microfluidic envi-
ronment.4 Whitaker et al.5 showed the effect of population density on the ability of bacteria to
respond in microliter-scale volume wells. Further, the effects of flow on reporter bacteria have
been examined in a microfluidic device.6 Delivering a chemical stimulus to engineered bacteria
in a microfluidic environment, while monitoring fluorescent response, was done previously by
Groisman et al.7 Communication between two bacterial populations over time has been exam-
ined through means of a micro-ratchet structure8 and self-regulating populations that act as
oscillators.9,10
A variety of models for chemical transduction that apply to genetically engineered bacteria
sensors have been posed that rely on a combination of the Hill equation,11 Michaelis–Menten
equation,12 and general mass action (GMA) equations.13 The Hill equation quantifies the degree
of co-operativity of the binding of a ligand (e.g., N-Acyl homoserine lactone (AHL)) to a re-
ceptor (e.g., LuxR). In particular, the Hill coefficient in the Hill equation describes the fraction
of the receptor saturated by ligand as a function of the ligand concentration. The
Michaelis–Menten equation is one of the best known models of enzyme kinetics that relates
reaction velocity to substrate concentration for a system where a substrate binds reversibly to
an enzyme, forming a complex. GMA equations describe the dynamics of chemical species
arising from reactions with kinetic rates. The rate of a chemical reaction is directly proportional
to the molecular concentrations of the reacting species. Thus, a series of mass balances consist-
ing of first-order differential equations can capture the dynamics between several chemical spe-
cies that ultimately activate production of fluorescence (e.g., green fluorescent protein (GFP)).
Leveau and Lindow14 made great strides towards modeling bacteria response by consider-
ing the activity of a promoter sequence as well as GFP maturation time and GFP degradation
using such methods as Michaelis–Menten and a system of ordinary differential equations simi-
lar to GMA. This model has been utilized by many15,16 for non-microfluidic environments.
Since Leveau and Lindow’s work, numerous attempts have been made to create a simplified
model for reporter bacteria utilizing ordinary differential equations, the Hill equation or
Michaelis–Menten equation. Previously, a series of ordinary differential equations was derived
for the quorum sensing signaling pathway in Vibrio fischeri or V. fischeri.17 Michaelis–Menten
have been used to model the quorum sensing regulatory system of the Aeromonas hydrophila.16
Another group looked to characterize a promoter with different number of DNA copies; with
induction curves fitted with the Hill equation.15 The use of this model is challenging because
the necessary Hill coefficient varies widely between reports,15,18 depends on specifics of the ex-
perimental system, and different forms of the Hill equation are often used as well. Both works
were done in non-microfluidic settings.
In a previous study, the response of reporter bacteria to AHL was examined in microfluidic
channels under flow and no-flow (quasi-static) conditions.6 The Hill equation was used to pre-
dict the change in fluorescence over time using the input AHL concentration. Although the
model included factors such as GFP degradation, the authors noted that “influences of a reduced
oxygen concentration due to respiration, which might affect both the maturation of GFP and
the cell physiology, were assumed to be negligible.” This assumption, together with the over
simplification of combining several chemical species and processes into a single equation, is
limiting. In fact, the microfluidic environment, with time-varying inputs, exacerbates some of
the shortcomings not only of the simplified models but also the more encompassing and general
Leveau and Lindow model. This can lead to a poor fit between model and experimental data in
microfluidic biological sensor literature.6
Microfluidic environments affect bacterial populations most importantly by limiting molec-
ular distribution to diffusion. Under shear stresses prevalent in microfluidic environments with
constant flow, biofilm formation is increased relative to wells or flasks with low shear stress
flow or no flow.19 Additionally Escherichia coli, or E. coli, commonly used for genetically
engineered sensors, increase biofilm production in stressful environments20 (i.e., low oxygen).
Biofilm material slows diffusion of small molecules21–23 such as oxygen and AHL. PDMS, a
silicone elastomer often used for manufacturing microfluidic biosensors, is permeable to
034116-2 Austin et al. Biomicrofluidics 8, 034116 (2014)
This article is copyrighted as indicated in the article. Reuse of AIP content is subject to the terms at: http://scitation.aip.org/termsconditions. Downloaded to IP:
130.88.53.18 On: Sun, 07 Dec 2014 13:54:39

oxygen, yet the oxygen concentration in a PDMS microfluidic biosensor can be considered dif-
fusion limited, in contrast with open wells or flasks.24 The concentration of oxygen in a PDMS
microfluidic biosensor is difficult to predict, but it is influenced by geometry, especially, thick-
ness to the external atmosphere, and the concentration of silicone elastomer to curing agent,
which controls stiffness. Ultimately, oxygen concentration to the bacterial populations is influ-
enced by biofilm, PDMS, atmospheric concentration, and oxygen dissolved in media. The
expression of over 200 genes in E. coli can be affected by oxygen concentration,25 and during
the maturation of GFP, from immature GFPi to mature GFPm, a high amount of oxygen is
needed.26 The oxidation processes has been quantified and found to be rate limiting27 and this
has been quantified.28
We present a model that accounts for diffusion-limiting microfluidic environmental effects
with experimental data collected from our microfluidic chambers, the design of which have
been described previously.29 The model utilizes a series of generalized mass action equations to
describe the change in the concentration of each chemical species. After comparing this model
and experiment, we apply the model to experimental data from Meyer et al.6 to show its broad
applicability.
II. METHODS
A. Bacteria
One of the common organisms used for biosensing is a genetically modified strain of
E. coli, which expresses genes from the quorum sensing, or autoinducer, system of V. fischeri.4
In V. fischeri, the lactone AHL reversibly binds to the regulatory LuxR protein. This complex
then binds to the promoter for the luxI gene, inducing transcription. In genetically modified E.coli, the luxI promoter is engineered to control production of an unstable variant of GFP, thus,
causing the bacteria to emit green fluorescence in the presence of AHL. The E. coli bacteria do
not encode the genes to produce AHL, and thus act only as reporters.
To create a model for the sequence of biological processes, in which a population of genet-
ically engineered reporter bacteria emits fluorescence in response to AHL stimulus, we first dia-
grammed the sequence of events that occur. Figure 1 shows a block diagram of the processes
that occur in biosensing in E. coli with this LuxR system. Although this diagram is still a sim-
plification of the signaling pathway from the literature,30 it illustrates reactions and chemical
species not accounted for in previous modeling efforts and is generally applicable for both
macro- and microfluidic environments.
In this system, “external” AHLe diffuses through the biofilm material surrounding the bac-
teria and subsequently across the bacteria membrane, becoming “internal” AHLi at rate kc. A
constitutive promoter, Pon, drives the expression of the luxR gene that codes for the AHL recep-
tor protein, LuxR at rate kLc. AHLi and LuxR form a dimer complex (C1), which reversibly
binds to the luxI promoter sequence, PLux, forming complex C2, which induces transcription
and translation at rate ktr of an unstable, immature variant of GFPi. GFPi folds into a mature
fluorescent form GFPm. Both GFPi and GFPm can degrade at rates kGd (see Figure 1).
We have previously reported our experimental methods but briefly summarize them here.29
We used the microfluidic chip design of Danino et al.9 to study our genetically engineered bac-
teria biosensors. This microfluidic design comprises a simple chamber for the bacteria popula-
tion with an adjacent flow channel for delivery of both nutrients and chemical stimulus (AHL).
This microfluidic environment facilitates control of stimulus concentration, stimulus duration,
bacteria population size, temperature, flow rates, and measurement of response using fluores-
cence microscopy.
Standard microbiological techniques were used for culturing E. coli. All experiments were
performed in 2xYT lysogeny broth (LB) media.31 E. coli strain DH5a was used for all cloning.
Reporter bacteria were derived from the fully sequenced K-12 strain MG1655.32 To generate
the reporter plasmid, Biobrick BBa T9002 (partsregistry.org) was modified using PCR based
methods to append an ssrA-degradation tag (ANDENYALAA) to the C-terminus of GFP.33
The resulting plasmid was transformed into MG1655 to create the reporter bacteria. Thus, the
034116-3 Austin et al. Biomicrofluidics 8, 034116 (2014)
This article is copyrighted as indicated in the article. Reuse of AIP content is subject to the terms at: http://scitation.aip.org/termsconditions. Downloaded to IP:
130.88.53.18 On: Sun, 07 Dec 2014 13:54:39
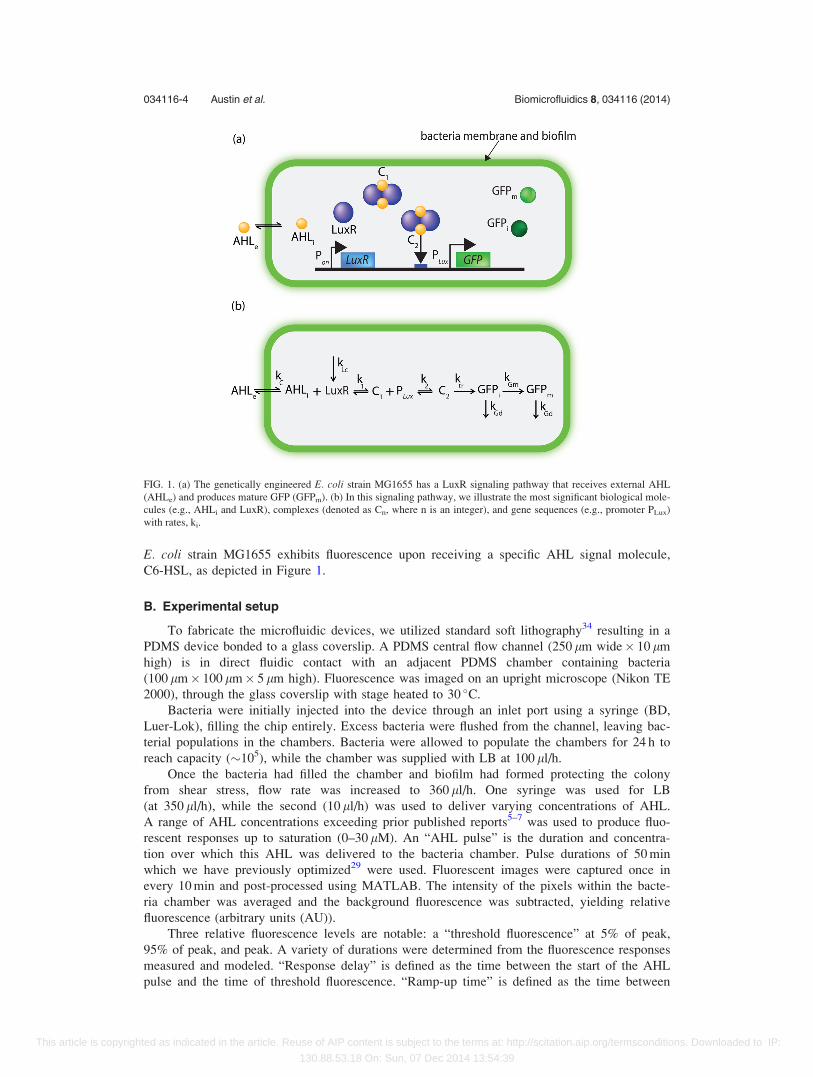
E. coli strain MG1655 exhibits fluorescence upon receiving a specific AHL signal molecule,
C6-HSL, as depicted in Figure 1.
B. Experimental setup
To fabricate the microfluidic devices, we utilized standard soft lithography34 resulting in a
PDMS device bonded to a glass coverslip. A PDMS central flow channel (250 lm wide� 10 lm
high) is in direct fluidic contact with an adjacent PDMS chamber containing bacteria
(100 lm� 100 lm� 5 lm high). Fluorescence was imaged on an upright microscope (Nikon TE
2000), through the glass coverslip with stage heated to 30 �C.
Bacteria were initially injected into the device through an inlet port using a syringe (BD,
Luer-Lok), filling the chip entirely. Excess bacteria were flushed from the channel, leaving bac-
terial populations in the chambers. Bacteria were allowed to populate the chambers for 24 h to
reach capacity (�105), while the chamber was supplied with LB at 100 ll/h.
Once the bacteria had filled the chamber and biofilm had formed protecting the colony
from shear stress, flow rate was increased to 360 ll/h. One syringe was used for LB
(at 350 ll/h), while the second (10 ll/h) was used to deliver varying concentrations of AHL.
A range of AHL concentrations exceeding prior published reports5–7 was used to produce fluo-
rescent responses up to saturation (0–30 lM). An “AHL pulse” is the duration and concentra-
tion over which this AHL was delivered to the bacteria chamber. Pulse durations of 50 min
which we have previously optimized29 were used. Fluorescent images were captured once in
every 10 min and post-processed using MATLAB. The intensity of the pixels within the bacte-
ria chamber was averaged and the background fluorescence was subtracted, yielding relative
fluorescence (arbitrary units (AU)).
Three relative fluorescence levels are notable: a “threshold fluorescence” at 5% of peak,
95% of peak, and peak. A variety of durations were determined from the fluorescence responses
measured and modeled. “Response delay” is defined as the time between the start of the AHL
pulse and the time of threshold fluorescence. “Ramp-up time” is defined as the time between
FIG. 1. (a) The genetically engineered E. coli strain MG1655 has a LuxR signaling pathway that receives external AHL
(AHLe) and produces mature GFP (GFPm). (b) In this signaling pathway, we illustrate the most significant biological mole-
cules (e.g., AHLi and LuxR), complexes (denoted as Cn, where n is an integer), and gene sequences (e.g., promoter PLux)
with rates, ki.
034116-4 Austin et al. Biomicrofluidics 8, 034116 (2014)
This article is copyrighted as indicated in the article. Reuse of AIP content is subject to the terms at: http://scitation.aip.org/termsconditions. Downloaded to IP:
130.88.53.18 On: Sun, 07 Dec 2014 13:54:39

the threshold fluorescence and 95% of peak. “Peak time” is defined as the time between the
start of the AHL pulse and the time of peak fluorescence. “Response duration” is the duration
that the response is above the threshold fluorescence. “Ramp-down time” is the time between
the 95% of peak after achieving peak and threshold fluorescence. We computed the absolute
value of the difference between measured and modeled durations at each concentration and
averaged them. To ensure that outlier responses did not skew our data, we excluded any
responses whose maximum amplitude were more than two standard deviations from the
average. Experimental duration for setup, growth, and one cycle of stimulation and response
averaged approximately two days.
C. Modeling
Our modeling method utilizes generalized mass action equations, GMA, based upon the
chemical pathway shown in Figure 1(b). Transcription and translation were represented as a sin-
gle species to simplify the model, while other biological processes affected by the microfluidic
environment, such as diffusion of signal molecule AHL and maturation of GFP, were kept ac-
cessible. The general form of a GMA system of ordinary differential equations is given by
_Xi ¼X
6ki
YXj
� �; (1)
where _Xi is the rate of change of a concentration of molecular species i, ki is the corresponding
rate constant, and Xj is a concentration of molecular species j. For the processes described in
Figure 1, the following equations were determined to model the bacteria response
dAHLi
dt¼ kc AHLe � AHLið Þ � k1AHL2
i LuxR2 þ k1C1; (2)
dC1
dt¼ k1AHL2
i LuxR2 � k1C1 þ k2C1PLux; (3)
dC2
dt¼ k2C1PLux � k2C2 � ktrC2; (4)
dLuxR
dt¼ kLc � 2C1 � 2C2; (5)
dGFPi
dt¼ ktrC2 � kGmGFPi � kGdGFPi; and (6)
dGFPm
dt¼ kGmGi � kGdGFPm: (7)
AHLi and AHLe are the concentrations of internal and external AHL, respectively; LuxR is the
population of free LuxR; C1 is the LuxR-AHL dimer; C2 is the complex involving the dimer
bound to the promoter sequence; GFPi represents “immature” GFP, in its inactive,
non-fluorescent form; and GFPm represents mature, fully fluorescent GFP.
The rate constant kc governs mass transfer through the bacteria membrane and biofilm.
Nilsson et al.35 previously determined this rate of diffusion for membrane and biofilm sepa-
rately; k1 governs the association and dissociation of C1; k2 governs the association and dissoci-
ation of C2; kLc represents the constitutive rate of production of LuxR; ktr is the rate of protein
production of GFP, encompassing transcription and translation; kGm governs GFP maturation;
and kGd governs the rate of GFP degradation. Note that kGd is the same for both Gi and Gm, as
GFP degradation proteases do not differentiate between the species. The vector k represents the
set of rate constants k¼ [kc k1 k2 kLc ktr kGm kGd].
This system of ordinary differential equations was solved numerically in MATLAB using
Euler’s method. The set of initial values for the rate constants was based on literature as shown
034116-5 Austin et al. Biomicrofluidics 8, 034116 (2014)
This article is copyrighted as indicated in the article. Reuse of AIP content is subject to the terms at: http://scitation.aip.org/termsconditions. Downloaded to IP:
130.88.53.18 On: Sun, 07 Dec 2014 13:54:39
in Table I. Rate constants, k1, k2, and kLc were held fixed because they are processes that are
independent of environment (e.g., oxygen concentration, biofilm) and thus literature values
were assumed accurate, while kc, ktr, kGm, and kGd were allowed to vary by up to one order of
magnitude from literature values. To determine the quality of fit for each vector k, the sum of
square errors (SSE) was calculated between the numerically approximated result and the experi-
mentally measured fluorescence. SSE was minimized by iteratively adjusting k with an
interior-point algorithm.36 After a set of rate constants that minimized SSE was found, their
sensitivity was analyzed. Rate constants ki were individually varied in increments of 6100%,
610%, 61%, 60.1%, while holding the others constant to create a vector kn for which a new
SSE was calculated. The difference in error between k and kn was then plotted to determine
the sensitivity of each rate constant. This showed which variables have the greatest influence
on the model and therefore must be considered when adjusting for the microfluidic
environment.
III. RESULTS AND DISCUSSION
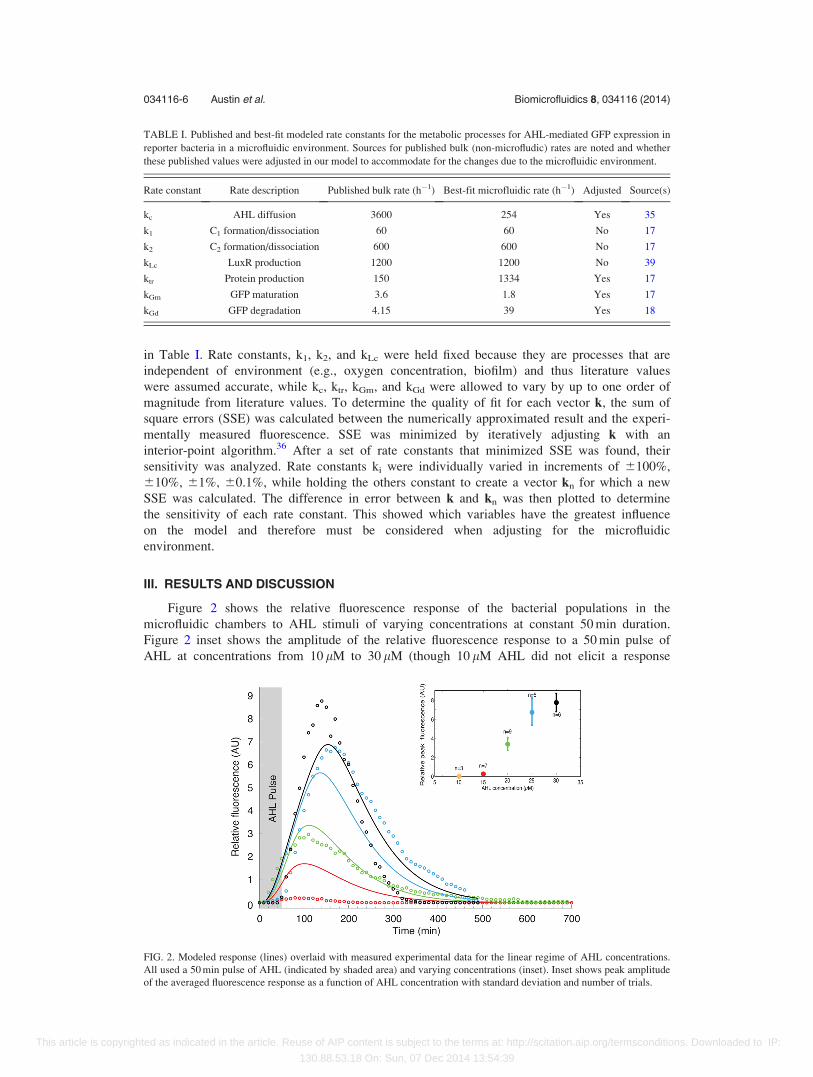
Figure 2 shows the relative fluorescence response of the bacterial populations in the
microfluidic chambers to AHL stimuli of varying concentrations at constant 50 min duration.
Figure 2 inset shows the amplitude of the relative fluorescence response to a 50 min pulse of
AHL at concentrations from 10 lM to 30 lM (though 10 lM AHL did not elicit a response
TABLE I. Published and best-fit modeled rate constants for the metabolic processes for AHL-mediated GFP expression in
reporter bacteria in a microfluidic environment. Sources for published bulk (non-microfludic) rates are noted and whether
these published values were adjusted in our model to accommodate for the changes due to the microfluidic environment.
Rate constant Rate description Published bulk rate (h�1) Best-fit microfluidic rate (h�1) Adjusted Source(s)
kc AHL diffusion 3600 254 Yes 35
k1 C1 formation/dissociation 60 60 No 17
k2 C2 formation/dissociation 600 600 No 17
kLc LuxR production 1200 1200 No 39
ktr Protein production 150 1334 Yes 17
kGm GFP maturation 3.6 1.8 Yes 17
kGd GFP degradation 4.15 39 Yes 18
FIG. 2. Modeled response (lines) overlaid with measured experimental data for the linear regime of AHL concentrations.
All used a 50 min pulse of AHL (indicated by shaded area) and varying concentrations (inset). Inset shows peak amplitude
of the averaged fluorescence response as a function of AHL concentration with standard deviation and number of trials.
034116-6 Austin et al. Biomicrofluidics 8, 034116 (2014)
This article is copyrighted as indicated in the article. Reuse of AIP content is subject to the terms at: http://scitation.aip.org/termsconditions. Downloaded to IP:
130.88.53.18 On: Sun, 07 Dec 2014 13:54:39

above the noise threshold (signal-to-noise ration greater than five29) and 30 lM approaches satu-
ration). The relative fluorescence response data in Figure 2 is averaged across at least five trials
at each concentration. For each concentration, experimentally and modeled, we determined
threshold fluorescence, 95% of peak fluorescence, peak fluorescence, response delay, ramp-up
time, response duration, and ramp-down time. Peak time averages 124.9 min for this range of
concentrations. We measured an average absolute difference between the modeled and meas-
ured peak times for all concentrations as 17.1 min, or 14% error. Individually, peak time aver-
ages (and absolute differences between modeled and measured) were as follows: 79.8 min
(22.6 min), or 28%, for 15 lM; 109.9 min (0.1 min), or 0%, for 20 lM; 170.0 min (32.8 min), or
19%, for 25 lM; and 140.0 min (12.9 min), or 9%, for 30 lM. To our knowledge, no other
reported model for genetically engineered bacteria has the capability of predicting response
peak time for time-varying stimuli. This feature of our model is important for applications in
biosensing because the delay between stimulus and peak critically informs stimulus onset time.
Applications of engineered bacteria also involve communication networks,29 in which the
response delay, ramp-up time, response duration, and ramp-down time are important for data
rate determination. Across all concentrations, we measured average (and absolute difference
between modeled and measured) values as the following: response delay¼ 34.3 min (17.6 min),
ramp-up time¼ 77.5 min (15.2 min), response duration¼ 344.5 min (114.5 min), and ramp-down
times¼ 241.4 min (95.4 min). Corresponding errors range from 20% to 52%. These errors are
large, but represent the first modeling effort to date at capturing such dynamics of a bacterial
population in a microfluidic environment. Communication schemes are being developed29,37,38
that accommodate these errors, while further efforts are underway to improve repeatability (see
inset) and modeling accuracy. Experimental data collection are painstaking, and thus this data
represent a sampling of the linear regime over which this bacterial system operates.
Parameter sensitivity analysis was conducted to determine the rate constants with the great-
est effect on the model fit. Rate constants of high sensitivity produced divergent SSE values.
The GMA model had the highest sensitivity to the rate parameter for GFP maturation, kGm.
This shows the importance of adjusting this term to account for changes in the environment.
Critically, during maturation of GFP, from immature GFPi to mature GFPm, a high amount of
oxygen is needed26 and thus this term is very sensitive to the microfluidic environment.
For the constant flow rate in all experiments, shear stress is constant, thus biofilm thickness
is constant, and thus oxygen diffusion rate is constant. We verified that by lowering the AHL
diffusion rate, kc, the modeled bacterial response was slowed as expected.
Using parameter estimation, rate constants matching the kinetics of our system were deter-
mined, as shown in Table I (and used to generate the models of Figure 2). As previously men-
tioned, rate constants, k1, k2, and kLc are constant regardless of environmental factors (e.g., dif-
fusion rate and oxygen concentration). AHL diffusion rate, kc, was slowed from 3600 h�1 to
254 h�1, a 93% change. This change accommodates dramatically slowed diffusion through the
biofilm in addition to the bacteria membrane.
The GFP maturation rate, kGm, was decreased from 3.6 h�1 to 1.8 h�1, a 50% change. This
change has been suggested qualitatively in literature,26 but has not heretofore been quantified
for a microfluidic environment. Constant kGm is rate-limiting,27 and our analysis confirms its
sensitivity. Although it is not clear how the microfluidic environment can affect protein produc-
tion rate (ktr) and GFP degradation (kGd) rate, we note an increase in both in our model.
Specifically, ktr was found to increase by from 150 h�1 to 1334 h�1. Some literature suggests
that gene expression (e.g., ktr) in E. coli can be affected by oxygen concentration,25 but this is
not well understood and indicates an area of future study. In our model, rate constant kGd was
found to increase by nearly 10� over published values.18 GFP degradation is not commonly
studied since most prior work focuses on constant rather than time-varying inputs. Some have
assumed changes in kGd are negligible,6 and some have ignored this parameter altogether,5
while we report here that it is critical and varies between the macro- and micro- environment.
The generalizability of this model to other microfluidic experiments with genetically engi-
neered bacteria can be seen by examining the work done by Meyer et al.6 In their study, a sim-
ilar microfluidic environment was used to predict relative fluorescence of GFP by Pseudomonas
034116-7 Austin et al. Biomicrofluidics 8, 034116 (2014)
This article is copyrighted as indicated in the article. Reuse of AIP content is subject to the terms at: http://scitation.aip.org/termsconditions. Downloaded to IP:
130.88.53.18 On: Sun, 07 Dec 2014 13:54:39
pupida IsoF biosensor strain in response to several external AHL concentrations, utilizing the
Hill equation. To explore if our model was relevant to Meyer’s data, we performed the follow-
ing procedure. The published bulk rate values cited by Meyer were used to constrain our pa-
rameter estimation (see Meyer et al.6 Table I). As before, rate constants k1, k2, and kLc were
fixed, while kc, ktr, kGm, and kGd were allowed to vary by up to one order of magnitude from
initial values with parameter estimation using the same Eqs. (2)–(7) and again minimizing SSE
by iteratively adjusting k with an interior-point algorithm.
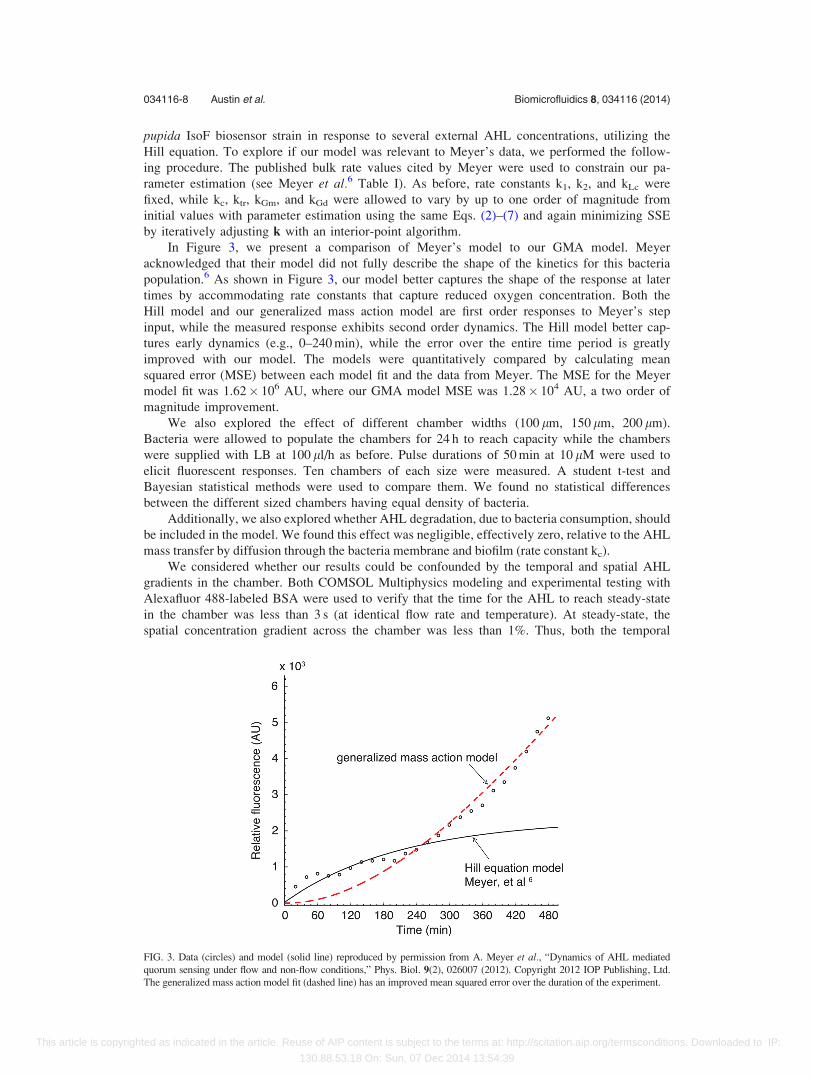
In Figure 3, we present a comparison of Meyer’s model to our GMA model. Meyer
acknowledged that their model did not fully describe the shape of the kinetics for this bacteria
population.6 As shown in Figure 3, our model better captures the shape of the response at later
times by accommodating rate constants that capture reduced oxygen concentration. Both the
Hill model and our generalized mass action model are first order responses to Meyer’s step
input, while the measured response exhibits second order dynamics. The Hill model better cap-
tures early dynamics (e.g., 0–240 min), while the error over the entire time period is greatly
improved with our model. The models were quantitatively compared by calculating mean
squared error (MSE) between each model fit and the data from Meyer. The MSE for the Meyer
model fit was 1.62� 106 AU, where our GMA model MSE was 1.28� 104 AU, a two order of
magnitude improvement.
We also explored the effect of different chamber widths (100 lm, 150 lm, 200 lm).
Bacteria were allowed to populate the chambers for 24 h to reach capacity while the chambers
were supplied with LB at 100 ll/h as before. Pulse durations of 50 min at 10 lM were used to
elicit fluorescent responses. Ten chambers of each size were measured. A student t-test and
Bayesian statistical methods were used to compare them. We found no statistical differences
between the different sized chambers having equal density of bacteria.
Additionally, we also explored whether AHL degradation, due to bacteria consumption, should
be included in the model. We found this effect was negligible, effectively zero, relative to the AHL
mass transfer by diffusion through the bacteria membrane and biofilm (rate constant kc).
We considered whether our results could be confounded by the temporal and spatial AHL
gradients in the chamber. Both COMSOL Multiphysics modeling and experimental testing with
Alexafluor 488-labeled BSA were used to verify that the time for the AHL to reach steady-state
in the chamber was less than 3 s (at identical flow rate and temperature). At steady-state, the
spatial concentration gradient across the chamber was less than 1%. Thus, both the temporal
FIG. 3. Data (circles) and model (solid line) reproduced by permission from A. Meyer et al., “Dynamics of AHL mediated
quorum sensing under flow and non-flow conditions,” Phys. Biol. 9(2), 026007 (2012). Copyright 2012 IOP Publishing, Ltd.
The generalized mass action model fit (dashed line) has an improved mean squared error over the duration of the experiment.
034116-8 Austin et al. Biomicrofluidics 8, 034116 (2014)
This article is copyrighted as indicated in the article. Reuse of AIP content is subject to the terms at: http://scitation.aip.org/termsconditions. Downloaded to IP:
130.88.53.18 On: Sun, 07 Dec 2014 13:54:39
and spatial gradients are negligible relative to the bacteria fluorescent response. Similarly, the
bacterial fluorescence response exhibited a spatial gradient in the chamber, which we measured
by comparing the intensity of chamber sub-sections comprising of 50 000 bacteria. We found
that the total intensity variation across the chamber to be negligibly less than 1%.
IV. CONCLUSION
Using a series of generalized mass action equations, we created a model that captures the
dynamics of autoinducer-mediated bacterial gene expression, specifically AHL-mediated GFP
expression, in reporter bacteria in a microfluidic environment. We subsequently fit that model
to experimental data from both our laboratory and that of Meyer et al.6 The model accurately
captures the response peak time, with 14% error, and somewhat captures the response delay,
ramp-up time, response duration, and ramp-down time for time-varying inputs across a range of
input concentrations. The model is a substantial improvement, as measured by mean squared
error, over previously reported models for time-constant inputs in microfluidic environments.
Four of the seven rate constants involved in metabolic processes for AHL-mediated GFP
expression in reporter bacteria were found to vary between the macro-environment and the
micro-environment explored in this work. By relaxing assumptions made in prior modeling
efforts, we were able to capture AHL diffusion rate changes, GFP transcription and translation
rate changes, GFP maturation rate changes, and GFP degradation rate changes. These rates
changed due to increased biofilm formation in the microfluidic environment, which resulted in
changes in oxygen and AHL concentration from what would be expected in bulk conditions.
Most sensitively, GFP maturation is a sensitive, rate-limiting step, and this rate is greatly
affected by oxygen content.
This model is versatile: applicable to microfluidic or traditional macro-environments; it can
be used with time varying (pulse) or constant (step) inputs. This model can serve as a valuable
tool in understanding genetically engineered bacteria and improving biosensor design capabil-
ities, opening the door for sensors that adapt to environmental dynamics and communicate with
each other.
ACKNOWLEDGMENTS
C.R.F., B.K.H., and J.P.B. are grateful for funding by the National Science Foundation (CISE
1110947). C.R.F. acknowledges funding by the National Science Foundation (EHR 0965945), NIH
Single Cell Grant 1 R01 EY023173, NIH Computational Neuroscience Training Grant (DA032466-
02), Georgia Tech Translational Research Institute for Biomedical Engineering & Science
(TRIBES) Seed Grant Awards Program, Georgia Tech Fund for Innovation in Research and
Education (GT-FIRE), Wallace H. Coulter Translational/Clinical Research Grant Program and sup-
port from Georgia Tech through the Institute for Bioengineering and Biosciences Junior Faculty
Award, Technology Fee Fund, Invention Studio, and the George W. Woodruff School of
Mechanical Engineering. C.M.A. and W.S. acknowledge the National Science Foundation
Graduate Fellowship Program, without which this work would not be possible. P.S. is grateful for
the National Science Foundation’s National Nanotechnology Infrastructure Network (NNIN)
Summer Research Experience for Undergraduates (REU) program that funded his participation in
this research, and M.H. is thankful for the Georgia Tech President’s Undergraduate Research
Award and Undergraduate Research Opportunities Program that supported her contributions.
The authors declare no competing financial interest or conflict of interest in this work.
1T. Charrier et al., “A multi-channel bioluminescent bacterial biosensor for the on-line detection of metals and toxicity.Part II: Technical development and proof of concept of the biosensor,” Anal. Bioanal. Chem. 400(4), 1061–1070 (2011).
2J. Stocker et al., “Development of a set of simple bacterial biosensors for quantitative and rapid measurements of arseniteand arsenate in potable water,” Environ. Sci. Technol. 37(20), 4743–4750 (2003).
3M. F. Siddiqui et al., “Targeting N-acyl-homoserine-lactones to mitigate membrane biofouling based on quorum sensingusing a biofouling reducer,” J. Biotechnol. 161(3), 190–197 (2012).
4J. R. van der Meer and S. Belkin, “Where microbiology meets microengineering: Design and applications of reporterbacteria,” Nat. Rev. Microbiol. 8(7), 511–522 (2010).
034116-9 Austin et al. Biomicrofluidics 8, 034116 (2014)
This article is copyrighted as indicated in the article. Reuse of AIP content is subject to the terms at: http://scitation.aip.org/termsconditions. Downloaded to IP:
130.88.53.18 On: Sun, 07 Dec 2014 13:54:39
5R. D. Whitaker et al., “Single cell time-resolved quorum responses reveal dependence on cell density and configuration,”J. Biol. Chem. 286(24), 21623–21632 (2011).
6A. Meyer et al., “Dynamics of AHL mediated quorum sensing under flow and non-flow conditions,” Phys. Biol. 9(2),026007 (2012).
7A. Groisman et al., “A microfluidic chemostat for experiments with bacterial and yeast cells,” Nat. Methods 2(9),685–689 (2005).
8S. Park et al., “Microfabricated ratchet structure integrated concentrator arrays for synthetic bacterial cell-to-cell commu-nication assays,” Lab Chip 12(20), 3914–3922 (2012).
9T. Danino et al., “A synchronized quorum of genetic clocks,” Nature 463(7279), 326–330 (2010).10A. Prindle et al., “A sensing array of radically coupled genetic ‘biopixels’,” Nature 481(7379), 39–44 (2012).11A. V. Hill, “The mode of action of nicotine and curari, determined by the form of the contraction curve and the method
of temperature coefficients,” J. Physiol. 39(5), 361–373 (1909).12L. Michaelis and M. M. Menten, “The kinetics of invertin action,” FEBS Lett. 587(17), 2712–2720 (2013).13F. Horn and R. Jackson, “General mass action kinetics,” Arch. Ration. Mech. Anal. 47(2), 81 (1972).14J. H. Leveau and S. E. Lindow, “Predictive and interpretive simulation of green fluorescent protein expression in reporter
bacteria,” J. Bacteriol. 183(23), 6752–6762 (2001).15S. Zucca et al., “Characterization of an inducible promoter in different DNA copy number conditions,” BMC Bioinf.
13(Suppl 4), S11 (2012).16C. Garde et al., “Quorum sensing regulation in Aeromonas hydrophila,” J. Mol. Biol. 396(4), 849–857 (2010).17M. Weber and J. Buceta, “Dynamics of the quorum sensing switch: Stochastic and non-stationary effects,” BMC Syst.
Biol. 7, 6 (2013).18S. Basu et al., “A synthetic multicellular system for programmed pattern formation,” Nature 434(7037), 1130–1134
(2005).19A. Park et al., “Effect of shear stress on the formation of bacterial biofilm in a microfluidic channel,” BioChip J. 5(3),
236–241 (2011).20H. L. Vieira, P. Freire, and C. M. Arraiano, “Effect of Escherichia coli morphogene bolA on biofilms,” Appl. Environ.
Microbiol. 70(9), 5682–5684 (2004).21P. S. Stewart, “Diffusion in biofilms,” J. Bacteriol. 185(5), 1485–1491 (2003).22J. R. Lawrence, G. M. Wolfaardt, and D. R. Korber, “Determination of diffusion-coefficients in biofilms by confocal laser
microscopy,” Appl. Environ. Microbiol. 60(4), 1166–1173 (1994).23J. D. Bryers and F. Drummond, “Local macromolecule diffusion coefficients in structurally non-uniform bacterial bio-
films using fluorescence recovery after photobleaching (FRAP),” Biotechnol. Bioeng. 60(4), 462–473 (1998).24S. G. Charati and S. A. Stern, “Diffusion of gases in silicone polymers: Molecular dynamics simulations,”
Macromolecules 31(16), 5529–5535 (1998).25M. Losen et al., “Effect of oxygen limitation and medium composition on Escherichia coli fermentation in shake-flask
cultures,” Biotechnol. Progr. 20(4), 1062–1068 (2004).26R. Y. Tsien, “The green fluorescent protein,” Annu. Rev. Biochem. 67, 509–544 (1998).27T. D. Craggs, “Green fluorescent protein: Structure, folding, and chromophore maturation,” Chem. Soc. Rev. 38(10),
2865–2875 (2009).28R. Iizuka, M. Yamagishi-Shirasaki, and T. Funatsu, “Kinetic study of de novo chromophore maturation of fluorescent
proteins,” Anal. Biochem. 414(2), 173–178 (2011).29B. Krishnaswamy et al., “Time-elapse communication: Bacterial communication on a microfluidic chip,” IEEE Trans.
Commun. 61(12), 5139–5151 (2013); B. Krishnaswamy et al., “When bacteria talk: Time elapse communication forsuper-slow networks,” in 2013 IEEE International Conference on Communications (ICC) (IEEE, 2013).
30P. V. Dunlap, “Quorum regulation of luminescence in Vibrio fischeri,” J. Mol. Microbiol. Biotechnol. 1(1), 5–12 (1999).31L. Chong, “Molecular cloning - A laboratory manual, 3rd edition,” Science 292(5516), 446–446 (2001).32F. R. Blattner et al., “The complete genome sequence of Escherichia coli K-12,” Science 277(5331), 1453 (1997).33J. B. Andersen et al., “New unstable variants of green fluorescent protein for studies of transient gene expression in
bacteria,” Appl. Environ. Microbiol. 64(6), 2240–2246 (1998).34J. C. McDonald et al., “Fabrication of microfluidic systems in poly(dimethylsiloxane),” Electrophoresis 21(1), 27–40
(2000).35P. Nilsson et al., “Kinetics of the AHL regulatory system in a model biofilm system: How many bacteria constitute a
‘quorum’?,” J. Mol. Biol. 309(3), 631–640 (2001).36R. H. Byrd, M. E. Hribar, and J. Nocedal, “An interior point algorithm for large-scale nonlinear programming,” SIAM J.
Optim. 9(4), 877–900 (1999).37I. F. Akyildiz et al., “Monaco: Fundamentals of molecular nano-communication networks,” IEEE Wireless Commun.
19(5), 12–18 (2012).38M. Pierobon and I. F. Akyildiz, “Capacity of a diffusion-based molecular communication system with channel memory
and molecular noise,” IEEE Trans. Inf. Theory 59(2), 942–954 (2013).39Y. Tanouchi et al., “Noise reduction by diffusional dissipation in a minimal quorum sensing motif,” PLoS Comput. Biol.
4(8), e1000167 (2008).
034116-10 Austin et al. Biomicrofluidics 8, 034116 (2014)
This article is copyrighted as indicated in the article. Reuse of AIP content is subject to the terms at: http://scitation.aip.org/termsconditions. Downloaded to IP:
130.88.53.18 On: Sun, 07 Dec 2014 13:54:39