modeling capture zones to determine potential threats to
TRANSCRIPT

University of New MexicoUNM Digital Repository
Water Resources Professional Project Reports Water Resources
12-5-2008
Modeling Capture Zones to Determine PotentialThreats to the Public Water Supply WellsJordan Wollak
Follow this and additional works at: https://digitalrepository.unm.edu/wr_sp
This Technical Report is brought to you for free and open access by the Water Resources at UNM Digital Repository. It has been accepted for inclusionin Water Resources Professional Project Reports by an authorized administrator of UNM Digital Repository. For more information, please [email protected].
Recommended CitationWollak, Jordan. "Modeling Capture Zones to Determine Potential Threats to the Public Water Supply Wells." (2008).https://digitalrepository.unm.edu/wr_sp/100

Modeling Capture Zones to Determine Potential Threats to the
Public Water Supply Wells
by
Jordan Wollak
Committee
Dr. Bruce Thomson
Dr. Gary Weissmann
Dr. Paul Zandbergen
A Professional Project Report Submitted in Partial Fulfillment
Of the Requirements for the Degree of
Master of Water Resources
Policy and Management Concentration
Water Resources Program
The University of New Mexico
Albuquerque, New Mexico
December 2008

2
Committee Approval
The Master of Water Resources Professional Project Report of Jordan Wollak, entitled
Mapping Ground Water Contamination in Albuquerque: Determination of
Potential Threats to Public Water Supply, is approved by the committee:
_________________________________ ________________________
Chair - Dr. Bruce Thomson Date
_________________________________ ________________________
Dr. Gary Weissmann
_________________________________ ________________________
Dr. Paul Zandbergen

3
Table of Contents
Table of Contents ................................................................................................................ 3 Acknowledgments............................................................................................................... 5 Abstract ............................................................................................................................... 6 Acronyms ............................................................................................................................ 7 1.0 Introduction ................................................................................................................. 8
1.1 Study Area ............................................................................................................. 10 1.2 Objective of Study ................................................................................................. 13
2.0 Hydrogeologic Background ....................................................................................... 14 2.1 Geology .................................................................................................................. 14
2.2 Groundwater Hydrology ........................................................................................ 14 2.3 Surface Water Hydrology ...................................................................................... 18
3.0 Contamination Sources .............................................................................................. 18
3.1 Superfund Sites ...................................................................................................... 21 3.2 Resource Conservation and Recovery Act ............................................................ 24
3.3 Landfills ................................................................................................................. 26 3.4 Petroleum Storage Tanks ....................................................................................... 27
4.0 Regulatory Requirements........................................................................................... 28 4.1 Safe Drinking Water Act ....................................................................................... 29 4.2 New Mexico Drinking Water Regulations ............................................................ 30
4.3 New Mexico Ground and Surface Water Regulations ........................................... 30
4.4 CERCLA Regulations ........................................................................................... 31 4.5 Resource Conservation and Recovery Act (RCRA) .............................................. 31 4.6 NMED Petroleum Storage Tank Regulations ........................................................ 32
5.0 Groundwater Monitoring ........................................................................................... 32 5.1 Direction of Flow ................................................................................................... 32
5.2 Groundwater Sampling .......................................................................................... 33 6.0 Methods...................................................................................................................... 37
6.1 Locating Hazardous Waste Sites ........................................................................... 37
6.2 Albuquerque Basin Groundwater Model ............................................................... 38
6.3 MODFLOW ........................................................................................................... 41 6.4 MODFLOW output as ArcGIS input ..................................................................... 42
7.0 Results ........................................................................................................................ 43 8.0 Discussion .................................................................................................................. 49
8.1 Limitations and Assumptions ................................................................................ 49 8.2 Future Work ........................................................................................................... 51
References ......................................................................................................................... 53
ArcGIS References ........................................................................................................... 56 Appendix 1- Primary Drinking Water Standards (USEPA, 2004) ................................... 57 Appendix 2 - NMED Ground Water Quality Standards (NMED, 2001) ......................... 66

4
List of Figures
Figure 1- Location of ABCWUA wells in Albuquerque, NM............................................ 9
Figure 2- ABCWUA distribution of drinking water to customers (ABCWUA, 2008a). . 11
Figure 3-Arsenic variation (ppb) from 2007 groundwater monitoring results (ABCWUA,
2008a). .............................................................................................................................. 12
Figure 4- Mesa del Sol property in relation to Ridgecrest Trunk wells............................ 13
Figure 5-Hydrochemical Zones of the MRGB, study area shown in red (Plummer et al.,
2004). ................................................................................................................................ 15
Figure 6- Sites incorporated into study because of their proximity to public wells. ........ 20
Figure 7-Quantity of groundwater pumped through time for ABCWUA (ABCWUA,
2008b). .............................................................................................................................. 40
Figure 8- MODFLOW image of 50 year capture zones delineated with MODPATH for
each of the Ridgecrest Trunk wells in relation to the hydraulic head in Layer 6. ............ 43
Figure 9-Capture zones delineated for the Ridgecrest Trunk wells. ................................. 45
Figure 10-Example of contamination movement through soil layers (USEPA, 2001). ... 47
List of Tables
Table 1-Sites that were reviewed as National Priority List candidates in study area
(USEPA, 2008c). .............................................................................................................. 22
Table 2-RCRA Sties within 3 miles of Ridgecrest Trunk Wells (USEPA, 2008c). ......... 25
Table 3-Detections values of VOCs in Ridgecrest Trunk wells during 2002-2008
(ABCWUA, 2008b) .......................................................................................................... 34
Table 4-List of sites within capture zones ........................................................................ 46
5
Acknowledgments
I want to thank all of my committee members for their patience and assistance. This
includes Dr. Bruce Thomson for his assistance with clarifying concepts and his insight to
approaching issues, Dr. Gary Weissmann who made himself available to work through
the kinks of the groundwater model and to Dr. Paul Zandbergen for his continuous
support.
In addition, there was a lot of support from my coworkers at the Albuquerque Bernalillo
County Water Utility Authority including Barbara Gastian, Harold Greear, Bagher
Dayyani, and Carlos Madrid for being available and taking time to answer all of my
questions, ensure data incorporated in the project was correct and ensure I understood
that the operations to provide water to the public is a multi-faceted endeavor.
Doug McAda at the US Geological Survey also had his part in contributing to this project
because he provided the groundwater model that provided all the capture zones.
I also want to thank all the people around me that supported me while I completed this
project. Thanks to my neighbor, Judy, who fed me, my family and friends who never
once doubted that I would finish and my dear fiancé who left me alone for the summer to
be a hero. Thanks to all.

6
Abstract
The Albuquerque Bernalillo County Water Utility Authority uses groundwater wells to
provide drinking water to the residents of the Albuquerque metropolitan area. Proper
management is needed to ensure that the residents have safe drinking water. This study
focuses on a particular water distribution trunk of the Albuquerque Water System.
Ridgecrest Trunk wells provide approximately 20 percent of the water for Albuquerque,
New Mexico. However, throughout the area there are numerous sites that have known
releases of hazardous materials that have contaminated soil and groundwater. Mapping
sites that have known soil or groundwater contamination is useful to determine the
proximity of the contamination source to the public water supply wells. This project
utilizes MODFLOW-2000 software to simulate how groundwater pumping affects the
aquifer with a model created by the U.S. Geological Survey for the Albuquerque Basin.
Capture zones were modeled for each well in the study area to determine how the water
will move in a defined period of time. When sites of known hazardous waste fall within
a capture zone, there is a risk that the contamination will travel and impact drinking
water. Of the 168 sites included in the study, 17 contaminant sites fell within the 50 year
capture zones for the Ridgecrest Trunk wells. The results of this study provide a
preliminary assessment of groundwater movement to determine if the Ridgecrest Trunk
wells are vulnerable to contamination from hazardous waste dumped on the ground
surface.

7
Acronyms
ABCWUA Albuquerque Bernalillo County Water Utility Authority
bgs below ground surface
CERCLA Comprehensive Environmental Response, Compensation and Liability Act
ET Evapotranspiration
gpm gallons per minute
KAFB Kirtland Air Force Base
MCL Maximum Contaminant Level
MEK Methyl ethyl ketone
MRGB Middle Rio Grande Basin
MTBE Methyl tert-butly ether
NPL National Priority List
NMED New Mexico Environment Department
PCE Tetrachloroethylene
ppb parts per a billion
PST petroleum storage tanks
RCRA Resource Conservation and Recovery Act
TCE Trichloroethylene
THF Tetrahydrofuran
USEPA U.S. Environmental Protection Agency
USGS U.S. Geological Survey
UST underground storage tanks
VOC volatile organic compound

8
1.0 Introduction
The Albuquerque Bernalillo County Water Utility Authority (ABCWUA) provides water
supply and wastewater collection and treatment for the greater Albuquerque metropolitan
area. As the largest utility in New Mexico, the ABCWUA operates 89 groundwater
wells in the Albuquerque Water System, which pump approximately 32 billion gallons of
water a year (Personal Communication with B. Gastian, September 25, 2008) (Figure 1).
Currently 560,000 people depend on the ABCWUA to provide safe drinking water that
complies with Safe Drinking Water Act regulations. Therefore the Albuquerque Water
System must be aware of pollution sources that may threaten the municipal water supply.
(Personal Communication with B. Gastian, September 25, 2008).
Albuquerque became recognized as a city in 1706. Major thoroughfares for the city such
as the construction of the railroad in 1880 and the establishment of Route 66 in 1926,
caused a boom in Albuquerque’s economy and industry. Unfortunately in the first half of
the 20th
century, urban growth in Albuquerque as well as across the country resulted in
damage to aquifers by improper waste disposal methods and poor groundwater well
construction. Albuquerque has three U.S. Environmental Protection Agency (USEPA)
National Priority List sites, also known as Superfund, resulting from operations in the
early and middle 1900’s. There are also fuel storage tank leaks and manufacturing plants
that created and utilized hazardous waste that contaminated the groundwater. Best case
scenarios include cleaning up the contamination, but remediation is costly, takes time,
and is not always successful. Due to the nature of organic contaminants and the

9
Figure 1-Location of ABCWUA Wells in Albuquerque, NM. Figure 1- Location of ABCWUA wells in Albuquerque, NM.

10
remediation strategies, sites will retain concentrations of pollutants for many decades into
the future. Therefore groundwater monitoring is necessary to ensure the public’s
drinking water is safe for consumption.
Considering the large number of contaminated sites in the Albuquerque area, there is the
risk of contamination reaching municipal wells. When contamination is present and
above drinking water quality standards in groundwater, options are to take wells out of
service or construct water treatment facilities. Due to the threat of contamination,
ABCWUA needs to evaluate whether its current and future wells are vulnerable to
contamination from hazardous waste dumped on the surface. The purpose of this study
was to use an existing groundwater model to make a preliminary assessment of the threat
to wells in southeast Albuquerque along Ridgecrest Distribution Trunk.
1.1 Study Area
This study does not incorporate the entire Albuquerque Water System, but instead
focuses on a particular distribution trunk that provides 20 percent of water production and
has several known contaminated sites that present a threat to underlying groundwater
quality. Throughout Albuquerque, groundwater is moved from well fields to reservoirs.
Pump stations are used to move water to a higher pressure, or elevation, zone. Reservoirs
are organized in distribution trunks. Drinking water is then delivered to customers by
gravity flow (Figure 2). This method for delivering water ensures proper pressure is
maintained in the distribution system and also allows for water to be mixed along a trunk
to maintain certain levels of water quality parameters. (ABCWUA, 2008a)

11
Figure 2- ABCWUA distribution of drinking water to customers (ABCWUA, 2008a).
This study area involves the Ridgecrest Trunk, which includes San Jose, Miles, Burton,
Ridgecrest, and Yale facilities that include wells, reservoirs, and pump stations. Yale
wells were recently rerouted to the Ridgecrest Trunk to supply Miles Reservoir. In the
past 15 years, four wells have been abandoned due to mechanical failure or the presence
of contamination; therefore there are a total of 15 wells currently supplying water to this
trunk (Figure 1).
The Ridgecrest Trunk is critical to the ABCWUA for several of reasons. First, the area
supplies water with arsenic values that do not exceed 10 parts per a billion (ppb) (Figure
3). Throughout Albuquerque’s regional aquifer there is naturally occurring arsenic in the
north-east and areas west of the Rio Grande. A new arsenic drinking water standard of
10 ppb has been implemented because high arsenic concentrations in drinking water have
been linked to skin damage, circulatory problems, and increased risk of cancer (USEPA,
2007a). The ABCWUA has generated plans to meet the arsenic rule by blending water
from areas with low arsenic values with areas of high arsenic.

12
Figure 3-Arsenic variation (ppb) from 2007 groundwater monitoring results (ABCWUA, 2008a).
The Ridgecrest Trunk is also important as a source of water for the new Mesa del Sol
development (Figure 4). Mesa del Sol acquired 20 square miles of land south of the
Albuquerque International Airport and has plans to build 37,500 homes for 100,000
residents (Forest City Covington, 2007). The distribution line that will supply water to
Mesa del Sol is connected to the Ridgecrest Trunk. The increased population in the
southern outskirts of Albuquerque will ultimately increase the demand for water on
Ridgecrest Trunk.

13
Figure 4- Mesa del Sol property in relation to Ridgecrest Trunk wells.
1.2 Objective of Study
Contaminant plumes are a threat to the public water supply because once the
contamination reaches a well, management must decide whether the well should be taken
out of service or whether treatment options should be considered to keep the well in
production. It will be important to ABCWUA to keep the groundwater wells in operation
since the Ridgecrest Distribution Trunk provided approximately 20 percent of the water
for the Albuquerque Water System in 2007 (ABCWUA, 2007). The objective of this
study was to determine which wells serving the Ridgecrest Trunk are vulnerable to
contamination from known sources of soil and water pollution including Superfund sites,
Resource Conservation and Recovery Act (RCRA) sites, landfills, and leaking

14
underground petroleum storage tanks. If the methods are effective the model can be used
to make an assessment for all of Albuquerque Water System wells.
2.0 Hydrogeologic Background
2.1 Geology
The Albuquerque regional aquifer is composed of basin-fill deposits known as the Santa
Fe Group. Santa Fe Group varies in thickness from 1,400 feet at the edges of the basin,
to 14,000 feet at the deepest parts of the Middle Rio Grande Basin (MRGB) (Bartolino
and Cole, 2002). The deposits are heterogeneous and anisotropic which result in
complicated groundwater flow patterns that have variations in quantity and quality of
water produced from different production wells in the basin.
2.2 Groundwater Hydrology
In the Albuquerque metropolitan area Santa Fe Group aquifer ranges between 250 to
9,000 feet (Bartolino and Cole, 2002). Only the upper 2,000 feet of aquifer is typically
used for water supply. In fact no municipal well in the Albuquerque Water System has
been drilled below 1,800 feet (ABCWUA, 2008b). In 2001, the average depth to water
in the study area was approximately 380 feet; the shallowest depth to water was 44 feet
and located close to the Rio Grande, and the deepest was 600 feet and located furthest
east of the river (ABCWUA, 2008b).
The U.S. Geological Survey (USGS) performed multiple groundwater studies in the
MRGB, one of which divided the entire basin into 13 zones that have similar chemical
15
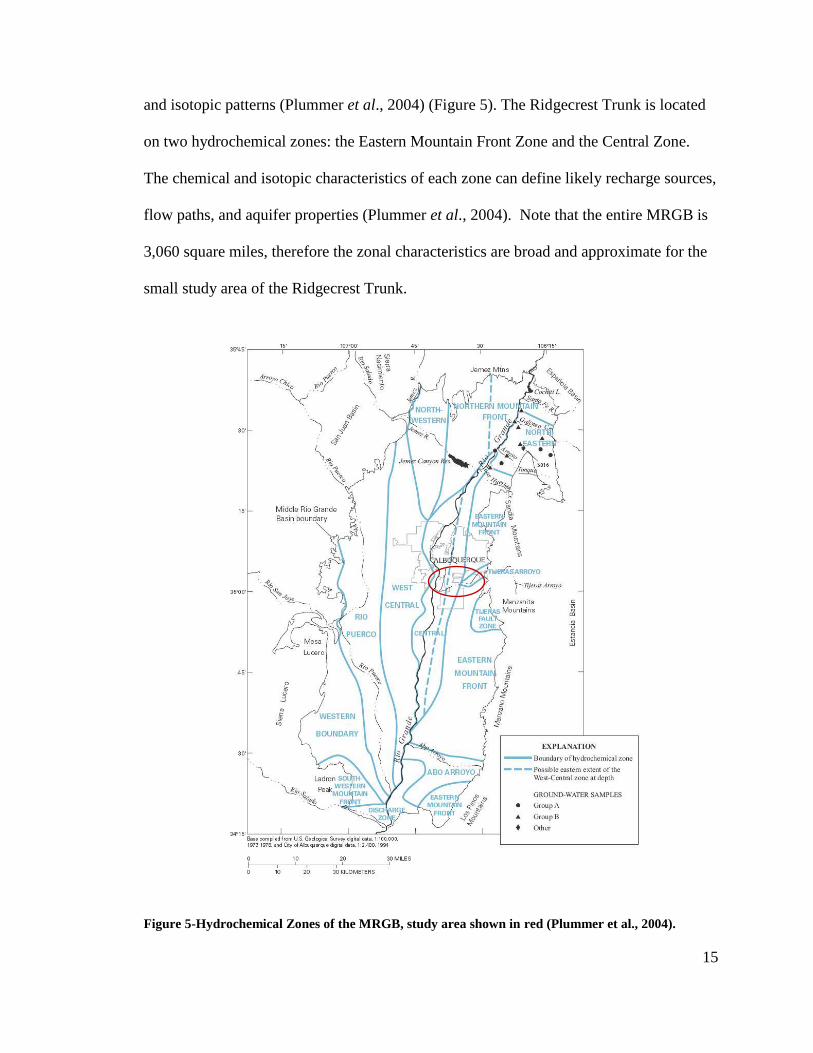
and isotopic patterns (Plummer et al., 2004) (Figure 5). The Ridgecrest Trunk is located
on two hydrochemical zones: the Eastern Mountain Front Zone and the Central Zone.
The chemical and isotopic characteristics of each zone can define likely recharge sources,
flow paths, and aquifer properties (Plummer et al., 2004). Note that the entire MRGB is
3,060 square miles, therefore the zonal characteristics are broad and approximate for the
small study area of the Ridgecrest Trunk.
Figure 5-Hydrochemical Zones of the MRGB, study area shown in red (Plummer et al., 2004).
16
The East Mountain Front Zone extends along the west face of the Sandia, Manzanita,
Manzano, and Los Pinos mountain fronts, although the study area for this project only
includes the Sandia Mountains (Plummer et al., 2004). The Sandia Mountains provide
mountain front recharge and recharge associated with the Tijeras Arroyo. There is a
general north-south groundwater gradient in the entire MRGB, but localized pumping
effects of drawdown result in varying flow directions in throughout the Albuquerque
area.
The Central Zone consists of a one to ten mile buffer along the Rio Grande and generally
extends farther east along the river than west (Plummer et al., 2004). The Rio Grande is
the main source of recharge, although there is mixing along the Eastern Mountain Front
Zone. The ground water flow gradient is also on average north to south.
Both zones have groundwater outflows from the aquifer through well production, seepage
into the Rio Grande and riverside drains, evapotranspiration (ET), and subsurface
underflow between basins. If groundwater recharge is less than overall discharge, water
levels in the aquifer decline. Water levels of the aquifer have declined between 20 feet to
more than 120 feet in the study area from 1960 to 2002 (Bexfield and Anderholm, 2002).
Water level decline can affect water quality, pumping costs, well production, and cause
land subsidence (Bartolino and Cole, 2002). Decline in water levels also influence the
direction of groundwater movement, since water flow and direction is determined by the
hydraulic gradient (Hornberger et al., 1998).

17
Municipal wells have a great impact on groundwater movement velocities and direction
because they pump large volumes of water from the underlying formation. Therefore the
proximity of the wells to contamination sites greatly affects the rate at which the
pollution plumes expand and travel through the subsurface. The study area includes the
Ridgecrest Trunk and currently has a total of 15 production wells to provide drinking
water. Wells in the study area have an average pumping capacity of roughly 2,500
gallons per a minute (gpm) for each well, with the range being between 1,500 and 3,120
gpm (ABCWUA, 2008b). These wells do not typically run 24 hours a day, but rather at
night to take advantage of off-peak electric costs. When demand is high, pumps will
draw water for the majority of the day and even for months at a time regardless of
operating costs.
The USGS performed multiple studies along the Rio Grande in cooperation with
ABCWUA and its predecessor the City of Albuquerque, to develop an understanding of
the hydrology of the MRGB and the water quality of the regional aquifer. Work included
the development of groundwater flow models based on aquifer properties and well
pumping rates to simulate the movement of groundwater. The 1995 version of the
groundwater model was used to make the preliminary assessment of groundwater
movement for this study thus this model will be discussed in further detail in the
methods.

18
2.3 Surface Water Hydrology
Albuquerque receives on average approximately 9 inches of precipitation annually.
Precipitation will runoff, increase flow of the Rio Grande, and a portion of it will
infiltrate to recharge the aquifer. The Rio Grande is the main hydrologic feature that
flows north to south on the west side of the study area. In addition to the Rio Grande,
mountain-front runoff and snowmelt provide recharge to the aquifer. There is added
recharge around drainages and arroyos in Albuquerque. Tijeras Arroyo is an established
drainage located in the south part of the study area, which captures mountain-front runoff
of the Sandia Mountains.
3.0 Contamination Sources
The study area includes many known sites of soil and/or ground water contamination;
additionally, there are probably sites that have gone undiscovered and there is potential
for future contamination. Fortunately, there has been an increase of federal and state
environmental laws to protect water resources and enforce clean-up activities. In the
past, people were unaware of the harm associated with dumping hazardous chemicals, but
today, efforts are in place to protect Albuquerque’s regional aquifer. In 1998, the Ground
Water Protection Advisory Board was established to consider threats to Albuquerque’s
regional aquifer and protect groundwater quality. The board is now in the process of
expanding its scope to protect surface water sources as well.
Sites that involve the known release of hazardous waste of petroleum product or
chlorinated solvents pose a threat to municipal wells. These sites are often characterized

19
with the release of volatile organic compounds (VOCs). VOCs are a subset of organic
compounds with inherent physical and chemical properties that allow them to move
between water and air and persist in groundwater (Zogorski et al., 2006). In general,
VOCs have high vapor pressures, low-to-medium water solubilities and low molecular
weights. VOCs are linked to health concerns including liver and kidney damage and are
carcinogenic with prolonged exposure (Moran et al., 2005); therefore there are drinking
water quality standards for 21 compounds. VOCs are used as paints, paint stripers,
cleaning supplies, pesticides, glues and adhesives, dry-cleaning chemicals, and fuels.
The large scale use of VOCs has resulted in their release into the environment and
monitoring is warranted. VOCs are commonly detected in the soil and groundwater at
abandoned landfills and at industrial, commercial, and military sites (Zogorski et al.,
2006). Detection of any VOC in groundwater relates to the vulnerability of the aquifer
and demonstrates a potential pathway exists for toxic compounds to reach drinking water
supply wells. This is a concern for Albuquerque’s municipal water supply because VOCs
have been detected at various sites although there have been no detections above the
prescribed Maximum Contaminant Levels (MCLs).
Sites of contamination include Superfund and RCRA sites, landfills, and leaking
underground petroleum storage tanks. Sites considered as threats to the Ridgecrest Trunk
were included in this study if they fell within a three-mile radius of the municipal wells
(Figure 6).

20
Figure 6- Sites incorporated into study because of their proximity to public wells.
21
3.1 Superfund Sites
The USEPA manages the Superfund program which identifies and cleans up the worst
hazardous waste sites in the United States under authorization provided by the
Comprehensive Environmental Response, Compensation and Liability Act (CERCLA).
USEPA administers the program with cooperation of individual states and tribal
governments (USEPA, 2007b). Before Superfund, properties that had hazardous waste
problems were abandoned and contaminated large areas of soil and groundwater. Sites
include abandoned warehouses, manufacturing facilities, processing plants and landfills.
Due to the amount of citizen concern, Congress enacted the Superfund Program in 1980
(USEPA, 2007b).
Three Superfund sites lie in the study area for this project including South Valley, AT &
SF Albuquerque, and Fruit Avenue Plume. All three Superfund sites are undergoing
remediation to clean up the contaminated soil and groundwater associated with the sites.
Additionally, the Randolph Road and University Boulevard Site is being considered for
Superfund status. There have been nine other sites in the study area that were subject to
review to determine whether they should be should be placed on the National Priority
List (NPL) (Table 1).

22
Table 1-Sites that were reviewed as National Priority List candidates in study area (USEPA, 2008c).
Site Name Location in Albuquerque, NM
South Valley-Superfund Broadway and Woodward
Fruit Avenue Plume-Superfund Intersection of Edith and Grand Ave
AT&SF Railway Albuquerque-Superfund 3300 South 2nd Street SE
Buena Vista and Coal Avenue 417 Buena Vista SE
Central and Yale Plume Central Avenue and Yale Boulevard
Fox Candeleria 2501 Candelaria NE
Fox and Associates of NM, Inc. 3412 Bryn Mawr Dr NE
Groundwater Plume at 4th
and Haines St. Between 2nd and 5th, St. McKnight and Aspen
Ross Aviation 3890 Aberdeen Avenue
Service Circuits, Inc. 607 Virginia SE
US Kirtland Air Force Base 2000 Wyoming SE
USGS Contaminated Well Iron and Kit Carson Streets
Randolph Road and University Blvd. SE Corner of Randolph Road and University Blvd.
The South Valley Superfund site was designated as a Superfund site in 1983. The site
included operations of manufacturing aircraft engines first by the U. S. Air Force (1967-
1984) then by General Electric Aircraft Engines who took ownership in 1984. Other
potential responsible parties include Chevron, Duke City Distributing, Edmunds Street
Facility, Texaco, ATA Pipeline, and Whitfield Tank Lines. VOCs including
Trichloroethylene (TCE), Tetrachloroethylene (PCE), cis-1,2-Dichloroethene, Vinyl
chloride, and Methyl tert-butly ether (MTBE) contaminated the soil and groundwater.
Action has been taken to clean the area with soil vacuum extraction and using pump and
treat techniques to extract water from the aquifer, treat the water, then return the water
back to aquifer. (Harding Lawson Associates, 2000)
23
The AT & SF Albuquerque Superfund Site was the Atchison, Topeka and Santa Fe
Railway Company tie treating plant located on 85 acres and operated from 1907-1971.
The facility used unlined holding ponds of creosote and oil mixtures to treat railroad
cross ties, bridge timbers, and fence posts. In 1990, 8,250 tons of contaminated soil and
debris was removed and filled with clean soil. In 1999, another 6,000 tons of soil was
removed at the wastewater reservoir located on the AT & SF Railway Company premise.
Site contamination included floating product ranging from 1.0 to 8.8 feet in depth and the
detection of polycyclic aromatic hydrocarbons (PAHs). Contamination was removed
from the groundwater though pump and treat techniques. (USEPA, 2002a)
The Fruit Avenue Plume was the result of a dry cleaning facility which operated from
1940-1970. The site has a defined groundwater plume of chlorinated solvents; in fact the
Cola-Cola Bottling Plant’s supply well and the St. Joseph Hospital well were shut down
due to the presence of cis-1,2-Dichloroethene, TCE, and PCE contamination. Two
municipal wells are located within 2 mile of the site. The area is currently undergoing
soil vapor extraction and a pump and treat process in which contaminated groundwater is
treated by air stripping to remove pollutants from the center of the plume. (USEPA,
2001)
The Randolph Road and University Boulevard Site is going through a Preliminary
Assessment to begin analysis to see if the site ranks for Superfund action. The site has
been designated as a threat because of a groundwater plume of chlorinated and aromatic
hydrocarbons. Potential sources for the contamination include a dry cleaning facility,
service stations, and auto repair shops. Also the South Yale Landfill, Albuquerque’s
24
International Airport, and Kirtland Air Force Base are in close proximity. (NMED,
2008a)
3.2 Resource Conservation and Recovery Act
The RCRA program establishes criteria and procedures for management of hazardous
waste. All operations that generate, transport, treat, store, or dispose of hazardous waste
are required to supply information pertaining to the activity to state environmental
agencies. States then turn the information over to the USEPA.
Designation as a RCRA site does not mean there has been a release of hazardous waste.
Sites that are subject to RCRA are included in other inventories such as Large Waste
Generators, Toxic Release Inventory, or Aerometric Facilities Subsystem. Large Waste
Generators generate over 1,000 kilograms per a month of hazardous waste or more than 1
kilogram per a month of acutely hazardous waste (USEPA, 2008a). The Toxic Release
Inventory includes a database of 300 toxic chemicals and facilities that release those
chemicals directly to air, water, land, or transport off-site (USEPA, 2008b). Aerometric
Facilities Subsystems is used to track emission and compliance data from industrial
plants that release airborne pollutants (USEPA, 2008b). There are 32 RCRA sites
located within a three-mile radius of Ridgecrest Trunk wells (Table 2).

25
Table 2-RCRA Sties within 3 miles of Ridgecrest Trunk Wells (USEPA, 2008c).
RCRA Sites Address
Creamland Dairies 1911 2nd St. NW
DPC Industries, Inc. 3501 2nd St. SW
General Electric Aviation 336 Woodward Rd. SE
Laun-Dry Supply Company, Inc. 1503 12th St. NW
Ponderosa Products Inc. 1701 Bellamah NW
Southside Water Reclamation Plant 4201 2nd St. SW
Safety Kleen Corp. 700801 2720 Girard NE
Sandia National Laboratory 1515 Eubank SE
Creamland Dairies Inc. 500 Broadway SE
Ethicon Inc. 3801 University Blvd. SE
Presbyterian Hospital 1100 Central SE
Univar USA Inc. Albuquerque 3301 Edmunds SE
Old Coca Cola Facility 205 Marquette NW
Borden Inc. Dairy 333 Aspen NW
Agronics Inc. 701 Madison NE
Siemens Stromberg Carlson 501 Morris NE
Siemens Transmission Systems Inc. 1 Camino de Lenkurt NE
Southeastern Ice Plant 601 Commercial Ave. NW
U.S. DOE Sandia National Labs H and Pennsylvania St. SE
National Research Labs Inc. 650 Haines NW
Industrial Plating 310 Florida SE
Emcore Corp. 10420 Research Rd. SE
Bueno Foods 2001 4th St. SW
US DOE ABQ Microelectronics Operation Kirtland Air Force Base
Person Generating Station Rio Bravo and Broadway SE
Wellborn Paint Manufacturing Co. 215 Rossmoor Rd. SW
Kaseman Presbyterian Hospital 8300 Constitution NE
Delta Person-Generating Station 725 Electric Ave. SE
Chevron Terminal No. 1324760 3200 Broadway SE
CMC Steel Fabricators Inc. 2300 1st St. NW
University of New Mexico 1801 Tucker St. NE, Building 233
Truly Nolen Exterminating Inc. 510 Candelaria Rd. NE

26
3.3 Landfills
The study area also has several solid waste landfills operated by the City, County,
Kirtland Air Force Base and Sandia National Laboratories that received residential and
commercial waste. All of the landfills within a three-mile radius of the Ridgecrest Trunk
are of concern because they have no lining to prevent seepage of contaminants into the
underlying soil and groundwater. When landfills are un-lined the leachate can
contaminate the groundwater. For this reason, there are monitoring wells in place to
monitor groundwater quality. Leachate is the fluid that passes through the waste of a
landfill and gathers suspended and dissolved materials along the way (USEPA, 2002b).
Leachate depends on climate and type of waste because it will include the liquid
originally contained in the waste as well as precipitation that enters the landfill.
City River Landfill operated in the 1920s through the 1940s and was located along the
east riverbank of the Rio Grande. At this site, groundwater is immediately below ground
surface (bgs) at 5-15 feet with the depth of waste being about 15 feet deep. (Nelson,
1997)
South Eubank Landfill operated from 1963-1984. The landfill was in close proximity to
the GTE telecommunications plant and there may have been chemical drums from GTE
disposed of in this landfill in addition to residential, commercial, and construction and
demolition wastes from the City of Albuquerque Solid Waste Department. The depth of
the waste is 30-40 feet with the groundwater being about 575 feet bgs. (Nelson, 1997)

27
South Yale Landfill was in operation from 1948-1965. Depth of solid waste varies
between 5 to 23 feet and some of the fill has been transported to the Southwest or Cerro
Colorado Landfills in connection to construction projects located on the landfill property.
Groundwater monitoring results have shown contamination but this could be attributed to
the proposed Randolph Road and University Blvd. Superfund site. (Nelson, 1997)
Kirtland Air Force Base (KAFB) has operated seven landfills of significance on the base
with only one being currently open and operated since 1989. The landfills on the base
are not lined. Of the six closed landfills, three received drums of hazardous waste, one
was filled with aircraft parts, another was filed with construction and demolition waste as
well as Toxicology Research Institute laboratory waste, and another was filled with
hospital and mess hall waste. Only 3 of the 7 landfills at KAFB have monitoring wells in
place and no contamination above regulatory levels has been detected. (Nelson, 1997)
The study area also includes two private landfills: Schwartzman and Wyndham Hotel Fill
Landfills. No further information was found pertaining to them.
3.4 Petroleum Storage Tanks
Another risk to the municipal water supply is leaking petroleum storage tanks (PSTs).
Most are buried and therefore referred to as underground storage tanks (USTs).
Approximately 600 leaking USTs have been identified in the city of Albuquerque and
over 160 in the study area (Personal Communication with S. Reuter, October 2, 2008).
Often the amount of petroleum product that has been leaked goes unnoticed and
sometimes USTs are abandoned through change of property ownership. The amount of

28
contamination is unknown and the size of storage tanks typically ranging between 100
and 55,000 gallons.
Although not designated as an UST, the KAFB-Bulk Fuels Facility is of serious concern
as it has been revealed that approximately one million gallons of petroleum product has
leaked from a 16” fuel line on KAFB that was discovered in 1999. In February 2007, 1.4
ft of floating petroleum product was discovered to be present on the water table surface in
monitoring wells for the site. KAFB Bulk Fuels Facility used three aviation fuels in
significant quantities including AVGAS, JP-4 and JP-8. Soil tests proved that all three
aviation fuels had been leaking at the fuel offloading rack of the site, therefore the leak
dates back more than 30 years because AVGAS was used until 1975. (CH2M Hill, Inc.,
2007)
4.0 Regulatory Requirements
There are numerous regulations to protect the environment and the public’s health. These
regulations ensure that hazardous waste sites are investigated and corrective action is
taken as public health is a top priority. Regulations are implemented nationally by the
USEPA and by the New Mexico Environment Department (NMED). Some relevant
regulations include the Safe Drinking Water Act, NMED Drinking Water,
Comprehensive Environmental Response, Compensation, and Liability Act (CERCLA),
RCRA, and NMED Protection of Petroleum Storage Tanks. This is not a comprehensive
list, but includes applicable regulations.

29
4.1 Safe Drinking Water Act
The Safe Water Drinking Act of 1974 ensures that proper precautions are taken to protect
drinking water and its sources. The Act authorizes the USEPA to set national standards,
or MCLs, for drinking water to protect human health from contaminants that may be
present. There are numerous threats like pesticides, human waste and improperly
disposed chemicals that can contaminant the water. Even the way the drinking water is
treated or disinfected may pose a health risk. Drinking water standards are implemented
at levels that are feasible to implement considering available treatment technologies as
well as the cost to consumers (USEPA, 2004). The Albuquerque Water System is a
public water system that must comply with these drinking water quality standards
(Appendix 1).
In addition to the enforced MCLs, there are monitoring requirements for how often the
system must test for inorganic, organic, and radionuclide elements and compounds.
Monitoring must be completed once every 3 years and the sampling must be taken at
every entry point to the distribution system (CFR, 2007).
As a public water system, ABCWUA must conduct a Sanitary Survey every 3 years to
evaluate operations and maintenance of all facilities (USEPA, 1999). The NMED
Drinking Water Bureau performs the comprehensive inspection to evaluating the source
of water, facilities, equipment, operation, maintenance, and management so that the
system’s integrity and capability to consistently and reliably deliver an adequate supply
of safe drinking water to consumers is determined.

30
Although there are MCLs for organics, inorganics, radiologicals, and microbiologicals,
this project focuses on soluble contaminants because these will be transported most
rapidly by groundwater flow. Most of the contaminants from sites included in the study
are VOCs. It is important to recognize that this study is not constrained to a single
contaminant or class of contaminant. Any regulated contaminant present in solution
could be considered as a potential threat to the Albuquerque Water System.
4.2 New Mexico Drinking Water Regulations
The State of New Mexico has adopted the USEPA’s regulations pertaining to drinking
water with minimal additional contributions from the state. New Mexico Administrative
Code (NMAC) 20.7.10 adopts 40 CFR Part 141 and Part 143 as New Mexico regulation
by reference (NMED, 2007).
4.3 New Mexico Ground and Surface Water Regulations
Water Quality Act regulations (20.6 NMAC) are in place to protect New Mexico’s
ground water resources by identifying, investigating, and cleaning up contaminated sites.
The regulations mandate that discharge and injection well permits must be issued for
such practices. Discharge permits apply to sewerage systems, irrigation use, reuse, and
any other discharge of water that may move directly into groundwater and affect its
quality (NMED, 2001). The regulations also implement ground water standards
(Appendix 2).
31
4.4 CERCLA Regulations
The Superfund program is executed through CERCLA to protect the environment and the
health of citizens. The process is lengthy and complex and includes a preliminary
assessment, placement on the National Priorities List, Remedial Investigation, filing of
the Record of Decision, and the proposal of the Remedial Design and Remedial Action
(USEPA, 2007b). Regulations provide that owners and managers have a responsibility to
report a release of substances, and cleanup must be preformed to “permanently and
significantly reduce the volume, toxicity, or mobility of the hazardous substances,
pollutants, and contaminants (CFR, 2004).” CERCLA provides that financial
responsibility will first rely on responsible party or parties, but additionally funds were
set up with the program to ensure money is available to take action with sites designated
as Superfund. The regulations also provide that there will be high priority given to
facilities where the release of hazardous substances has resulted in “closing of drinking
water wells or has contaminated a principal drinking water supply (CFR, 2004).”
4.5 Resource Conservation and Recovery Act (RCRA)
While Superfund deals with cleaning up inactive and abandoned hazardous waste sites,
RCRA deals with hazardous materials and wastes that are currently being generated,
stored, and destined to be disposed. USEPA must manage hazardous waste sites from
“cradle to the grave.” RCRA organizes proper management of hazardous waste by
permitting facilities before they treat, store, or dispose of hazardous waste and by
tracking generators of waste and their practices. RCRA also manages municipal solid

32
waste and nonhazardous industrial waste. In 1994, regulations were implemented to
include the location of where landfills are allowed and required liners and groundwater
monitoring. RCRA regulations also include that responsible parties are financially
responsible to providing funds for cleanup procedures in case of soil or groundwater
contamination. Similarly, it is written into law that corrective action must be taken if
hazardous waste is mismanaged. (USEPA, 1997)
4.6 NMED Petroleum Storage Tank Regulations
NMED has regulations in place for above-ground and underground petroleum storage
tanks (PST). All PSTs must be registered with the NMED Petroleum Storage Tank
Bureau. Regulations focus on the owner’s and operator’s responsibility of PSTs by
enforcing that a suspected or confirmed release must be reported, corrective action must
be taken, and all private wells with a 1000 ft radius of the release, or public supply wells
within one mile must be identified. If groundwater has been contaminated, non-aqueous
phase liquid and contaminated soil must be removed. Sites are deemed to have No
Further Action when the leak is believed to be adsorbed to the soil and have no further
movement through the soil. (NMED, 2008)
5.0 Groundwater Monitoring
5.1 Direction of Flow
Groundwater movement occurs in response to hydraulic gradients. Hydraulic head is
represented by the top of the water table, where porous media is saturated with water.
Hydraulic head fluctuates in response to inputs and outputs. Inputs include precipitation,

33
mountain front recharge, irrigation seepage, river and canal leakage, and groundwater
inflow. Water exits the system by way of ET, groundwater outflow, and groundwater
withdrawals. In the study area there is a major effect of pumping by the Albuquerque
Water System wells. Pumping decreases the hydraulic head at the well and increases the
hydraulic gradient towards the well. This is referred to as drawdown and the extent of
drawdown depends on pumping rates. The drawdown affects the hydraulic head which
amplifies the rate at which groundwater moves in the vicinity of groundwater wells.
The effect of drawdown induces groundwater movement to the well. If a soluble
contaminant is present, pumping will decrease the time it takes for contamination to reach
a well and increase the size of the contamination plume. For this reason wells that are in
closer proximity to hazardous waste sites should be considered for increased monitoring.
5.2 Groundwater Sampling
Drinking water quality regulations require that all entry points to the distribution system
be sampled every 3 years for VOCs to ensure results do not exceed MCLs (CFR, 2007).
Starting in 1991, voluntary monitoring of wells was completed annually. Furthermore,
some wells are tested more frequently when there are known soil and groundwater
contamination in proximity of the wells. This is the case for all the wells included in this
study. San Jose and Yale well fields are all monitored four times a year for VOCs
(ABCWUA, 2008b). San Jose wells have increased monitoring because of their
proximity to the South Valley Superfund site. Yale wells have increased monitoring
because of leaking underground storage tank investigations. Ridgecrest wells and two
34
Burton wells were formerly being tested four times a year, but monthly monitoring due to
the KAFB Bulk Fuel contamination has recently begun for all Burton and Ridgecrest
wells (ABCWUA, 2008b).
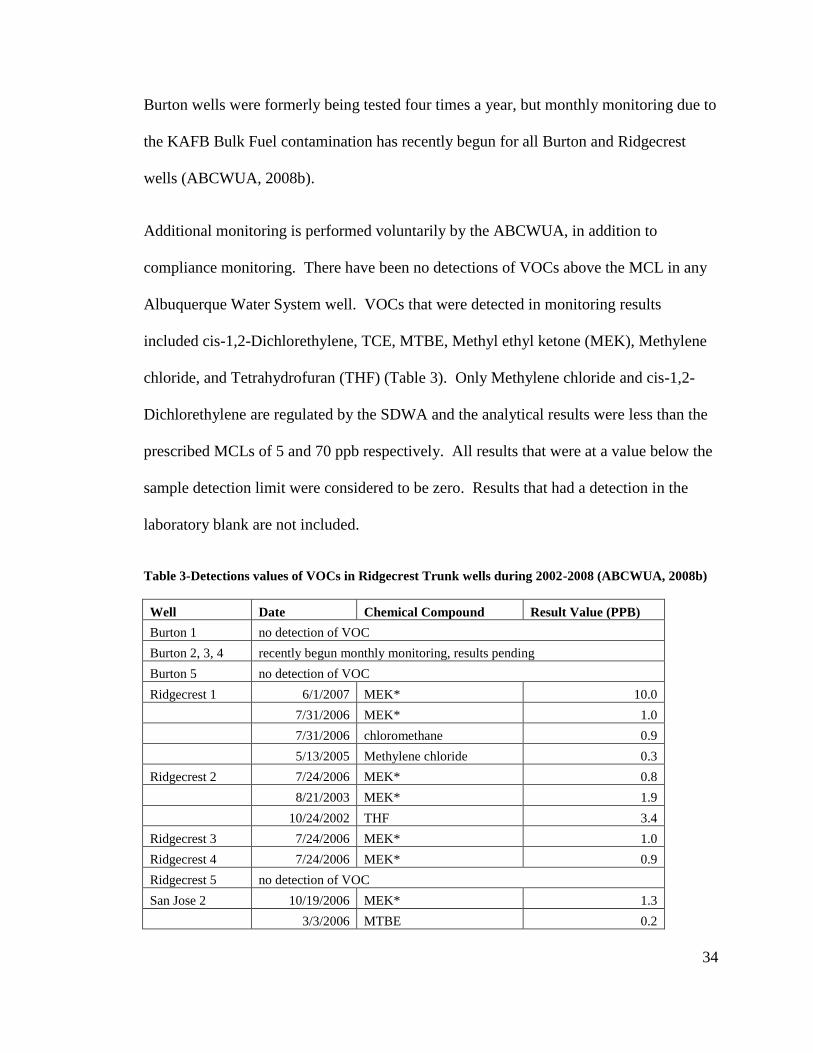
Additional monitoring is performed voluntarily by the ABCWUA, in addition to
compliance monitoring. There have been no detections of VOCs above the MCL in any
Albuquerque Water System well. VOCs that were detected in monitoring results
included cis-1,2-Dichlorethylene, TCE, MTBE, Methyl ethyl ketone (MEK), Methylene
chloride, and Tetrahydrofuran (THF) (Table 3). Only Methylene chloride and cis-1,2-
Dichlorethylene are regulated by the SDWA and the analytical results were less than the
prescribed MCLs of 5 and 70 ppb respectively. All results that were at a value below the
sample detection limit were considered to be zero. Results that had a detection in the
laboratory blank are not included.
Table 3-Detections values of VOCs in Ridgecrest Trunk wells during 2002-2008 (ABCWUA, 2008b)
Well Date Chemical Compound Result Value (PPB)
Burton 1 no detection of VOC
Burton 2, 3, 4 recently begun monthly monitoring, results pending
Burton 5 no detection of VOC
Ridgecrest 1 6/1/2007 MEK* 10.0
7/31/2006 MEK* 1.0
7/31/2006 chloromethane 0.9
5/13/2005 Methylene chloride 0.3
Ridgecrest 2 7/24/2006 MEK* 0.8
8/21/2003 MEK* 1.9
10/24/2002 THF 3.4
Ridgecrest 3 7/24/2006 MEK* 1.0
Ridgecrest 4 7/24/2006 MEK* 0.9
Ridgecrest 5 no detection of VOC
San Jose 2 10/19/2006 MEK* 1.3
3/3/2006 MTBE 0.2

35
3/3/2006 cis-1,2-Dichloroethylene 0.2
3/3/2006 TCE 0.3
5/13/2005 Methylene chloride 0.3
2/27/2003 Methylene chloride 1.4
San Jose 3 8/3/2006 MEK* 1.0
10/28/2005 MEK* 1.2
5/13/2005 Methylene chloride 0.3
12/9/2004 MEK* 5.4
2/27/2003 Methylene chloride 1.6
Yale 1 5/16/2008 MTBE 0.2
5/16/2008 TCE 0.2
3/14/2008 MTBE 0.2
3/14/2008 TCE 0.2
12/7/2007 cis-1,2-Dichloroethylene 0.1
12/7/2007 TCE 0.2
9/20/2007 TCE 0.3
6/8/2007 cis-1,2-Dichloroethylene 0.1
6/8/2007 TCE 0.4
3/9/2007 MTBE 0.2
3/9/2007 cis-1,2-Dichloroethylene 0.2
3/9/2007 TCE 0.3
10/12/2006 TCE 0.3
7/27/2006 MEK* 1.2
7/27/2006 MTBE 0.1
7/27/2006 TCE 0.2
5/5/2006 TCE 0.3
12/1/2005 cis-1,2-Dichloroethylene 0.2
12/1/2005 TCE 0.3
9/14/2005 cis-1,2-Dichloroethylene 0.2
9/14/2005 TCE 0.3
6/23/2005 cis-1,2-Dichloroethylene 0.2
6/23/2005 TCE 0.3
3/31/2005 MEK* 1.2
3/31/2005 cis-1,2-Dichloroethylene 0.2
3/31/2005 TCE 0.3
12/16/2004 cis-1,2-Dichloroethylene 0.2
12/16/2004 TCE 0.3
9/16/2004 TCE 0.2
6/10/2004 MEK* 17.8
6/10/2004 cis-1,2-Dichloroethylene 0.1

36
6/10/2004 TCE 0.3
8/16/2002 Chloroethane 0.6
Yale 2 5/15/2008 MTBE 0.1
6/1/2007 MEK* 10.1
7/27/2006 MEK* 1.0
3/31/2005 MEK* 1.2
6/10/2004 MEK* 14.2
Yale 3 6/1/2007 MEK* 10.5
2/27/2006 MEK* 0.8
3/31/2005 MEK* 1.2
3/31/2005 THF 0.6
6/10/2004 MEK* 9.4
*MEK between the ranges of 0-2 ppb is often a result of laboratory or sampling
contamination, while levels over 10 ppb are directly linked to newly installed PVC
piping. Additionally, MEK detections are often found in multiple samples in close time
periods and should be regarded as a laboratory or sampling contamination. (Personal
Communication with M. Trujillo, October 6, 2008)
MTBE is not regulated as part of the drinking water standards but is listed on the
Contaminant Candidate List, which means it is undergoing a process to determine if it
should require national drinking water quality regulation. There has been limited
evidence from animal studies but inadequate or no data in humans to prove that MTBE is
harmful to human health (USEPA-OGWDW, 1999). Similarly with MEK, there has
been inadequate human evidence to show that it causes cancer (USEPA-OGWDW,
1999).
The detection of VOCs in Albuquerque Water System wells is a reason for concern and
suggests that groundwater has been contaminated. The fact that MCLs have not been
surpassed is encouraging, but occurrence of non-regulated substances should not be
overlooked. It proves that the harmful chemicals that have been disposed of on soil are

37
mobile and it may be a matter of time before wells are taken out of operation or treatment
is installed to ensure public health is regarded as a top priority.
6.0 Methods
Geographic information system (GIS) is a powerful tool that enables data to be
represented visually and eases the understanding of geographically referenced
information. By mapping the location of municipal groundwater wells and known sites
of hazardous waste, it is possible to determine if there is a threat to the municipal water
supply. This project modeled the capture zones for each well in the study area. Capture
zones represent the areal extent from which groundwater will flow to a well over a
specific length of time. MODFLOW-2000 is the groundwater simulation software that
was used to delineated capture zones.
6.1 Locating Hazardous Waste Sites
In order to determine the threats, the first step was to locate areas with known soil and/or
groundwater contamination that could pose a threat to the wells that serve Ridgecrest
Trunk. The USEPA maintains a database of hazardous waste locations for the entire
United States; the Envirofacts service provides locations of Superfund, proposed
Superfund sites, and RCRA sites. The Superfund sites were then converted into polygons
to depict the entire area that potentially contributed to the point source pollution. Landfill
polygons were obtained from the City of Albuquerque. The leaking underground storage
tank locations were determined from coordinates posted on the NMED PST Bureau’s
website in addition to addresses mapped from records maintained by the ABCWUA. The
38
hazardous waste sites were mapped in ArcGIS ArcView License 9.2. All sites were
projected in Continuous Lambert Conformal Conic, with a 1927 North American Datum;
this projection matched the projection of the Albuquerque Basin model acquired from US
Geological Survey.
6.2 Albuquerque Basin Groundwater Model
The USGS groundwater model of the Albuquerque basin, developed using MODFLOW-
2000 was used to simulate groundwater flow in order to determine if known sites of
contamination would threaten the Ridgecrest Trunk wells. Kernodle et al. (1994)
developed a model to simulate common features of the Albuquerque Basin to predict the
movement of the water within the groundwater system. The model was updated in 1996.
In the model the aquifer extends over the entire Middle Rio Grande Basin. The shape of
the aquifer is represented with a grid that varies in size, with the grid size being smaller in
the Albuquerque metropolitan area and expands for the outlying areas. Therefore the
horizontal grid size for the study area of this project is 200 meters by 200 meters.
The model is three dimensional and has 11 vertical layers. Layers 1-4 at the top of the
water bearing formation are each 20 feet in depth, while layers 5-11 range between 50
and 500 feet; layer 11 is the deepest. For the Albuquerque Basin model, most municipal
wells pump from elevation between 350 and 600 feet below the ground surface, therefore
layer 6 was used for the groundwater simulation and analysis of contaminant transport.
Layer 6 was the first, most complete layer in terms of having hydraulic head values for
the entire layer; layers 1-5 were not as complete because the depth of water varies from

39
44 to 600 feet bgs across the study area. This introduces complexity to the model
because there was a disconnection between the hydraulic layers above.
The USGS Albuquerque Basin model was developed with multiple time steps. Initial
aquifer conditions were simulated by utilizing a steady state model for pre-development
conditions. Then transient models were used for the historical period of 1901-1995. The
time period was broken into several time steps and utilized actual pumping data as well
as best known approximations of recharge and ET and the latest hydraulic characteristics
known for the basin in each time step. Additionally, four scenarios for the future
conditions were developed based on varying predictions of the Albuquerque Basin
having a medium growth rate with varied rates of groundwater production.
The original version of the model was divided into 30 semiannual time steps representing
the summer (April-September) and winter (October-March) of 1980 through 1995. This
project used the model’s last time step to set initial conditions and the model was
changed to be steady state because of computer memory limitations. The results for this
technique will undoubtedly be different than the original transient model because it does
not allow for seasonal variations in pumping due to fluctuations in water demand.
The last time step for the USGS Albuquerque Basin model was the winter of 1995;
therefore winter approximations of ET, recharge, drain seepage, irrigation seepage, et
cetera were utilized. The quantity of water pumped by wells was averaged over the last
summer and winter time periods. In addition to averaging the pumping rates, wells that
had been abandoned were excluded from the simulation and the location of one of the
40
wells (Burton 2) was updated and moved one cell to the west to better match its actual
location.
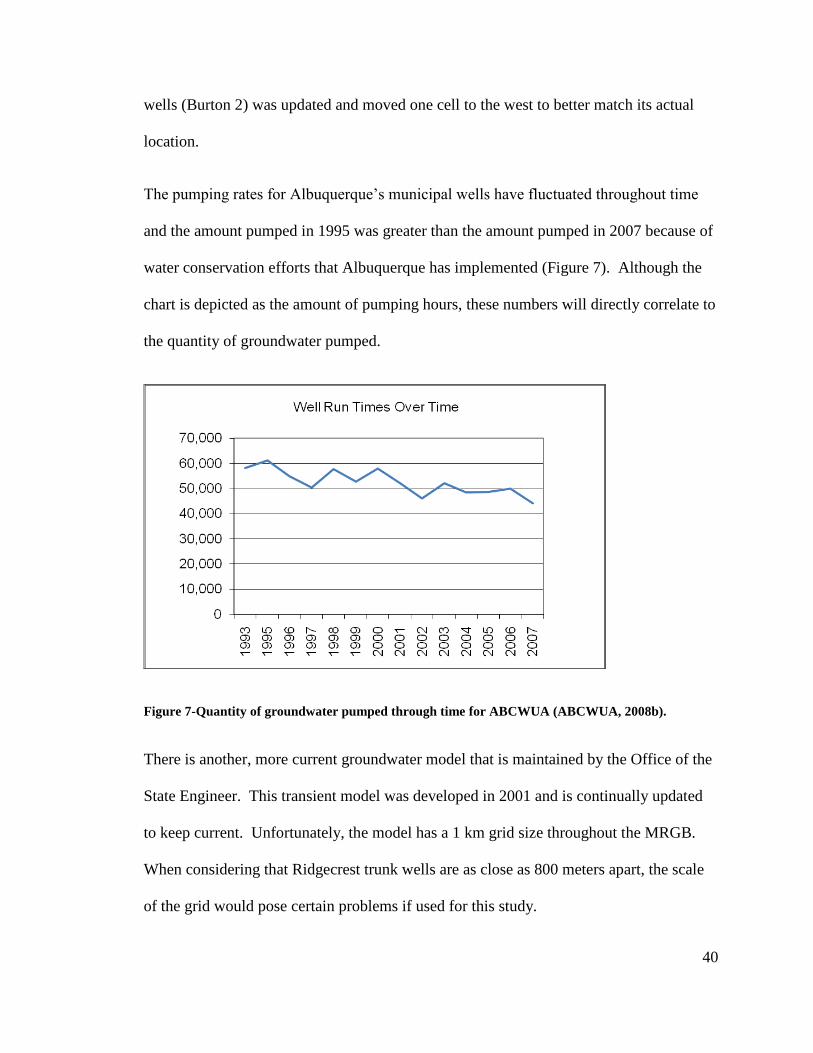
The pumping rates for Albuquerque’s municipal wells have fluctuated throughout time
and the amount pumped in 1995 was greater than the amount pumped in 2007 because of
water conservation efforts that Albuquerque has implemented (Figure 7). Although the
chart is depicted as the amount of pumping hours, these numbers will directly correlate to
the quantity of groundwater pumped.
Figure 7-Quantity of groundwater pumped through time for ABCWUA (ABCWUA, 2008b).
There is another, more current groundwater model that is maintained by the Office of the
State Engineer. This transient model was developed in 2001 and is continually updated
to keep current. Unfortunately, the model has a 1 km grid size throughout the MRGB.
When considering that Ridgecrest trunk wells are as close as 800 meters apart, the scale
of the grid would pose certain problems if used for this study.

41
6.3 MODFLOW
MODFLOW utilizes the partial differential equation of groundwater flow through porous
media to describe the three-dimensional movement of groundwater in a regional aquifer
(McDonald and Harbaugh, 1988):
t
hSW
z
hK
zy
hK
yx
hK
xszzyyxx
where: zzyyxx KKK ,, are values of hydraulic conductivity along the x, y, and z
coordinate axes, which are assumed to be parallel to the major
axes of the hydraulic conductivity (Lt-1
);
h is the potentiometric head (L);
W is the volumetric flux per unit volume and represents sources
and/or sinks of water (t-1
);
sS is the specific storage of the porous material ( L-1
); and
T is time ( t ).
This equation is derived from a mass balance of water within the model domain because
the sum of all flows into and out of the cell must equal the change in storage of a cell.
The model utilizes several different packages. Each package pertains to a specific
function of the hydraulic system; packages included are block-centered flow, drain,

42
evapotranspiration, recharge, river, and well (McDonald and Harbaugh, 1988). The
output of the model is hydraulic head levels throughout the basin.
Once the ground water flow is determined with MODFLOW an additional post-
processing package, MODPATH, can be used to track particles. In addition to tracking
the advective movement of the particle, MODPATH tracks the time of travel for the
particles without considering diffusion or dispersion. By combining the particle path and
time of travel, MODPATH can delineate well capture zones. Capture zones are created
by applying a negative velocity to the extraction well and defining the duration (Pollock,
1994). For this project 25 year and 50 year capture zones were delineated.
6.4 MODFLOW output as ArcGIS input
Once the capture zones were delineated in MODFLOW the particle tracks were exported
as a chart of X and Y coordinates. A transformation was applied to the X and Y
coordinates then were inputs for ArcGIS. Originally there were 36 separate particle paths
for each capture zone. To simplify the process the paths were converted into capture
zone boundaries. Boundaries were delineated by connecting all the outermost points of
the 36 particle paths from each well (Figure 8).

43
Figure 8- MODFLOW image of 50 year capture zones delineated with MODPATH for each of the
Ridgecrest Trunk wells in relation to the hydraulic head in Layer 6.
7.0 Results
There were a total of 3 Superfund sites, 10 Superfund candidate sites, 32 RCRA sites, 9
landfills, and 114 sites containing leaking petroleum tanks within a three-mile radius of
the Ridgecrest Trunk production wells. When looking at the various locations of soil or
groundwater contamination in relation to the municipal wells’ capture zones, the overall
picture looks non-threatening (Figure 9).
The capture zones delineated for this project simulate the outer boundary and distance
that groundwater will travel for 25 and 50 years at approximately 350-550 ft. bgs because

44
the capture zones were delineated in layer 6. The groundwater model used had many
changes and had not been updated since 1995; therefore the depicted capture zones
provide only a preliminary idea of which areas should be further researched to make
better conclusions of whether contaminant plumes may threaten a particular wellhead.
Groundwater managers must use judgment when looking at the results because particle
paths may reach wells faster or slower than the model simulates.
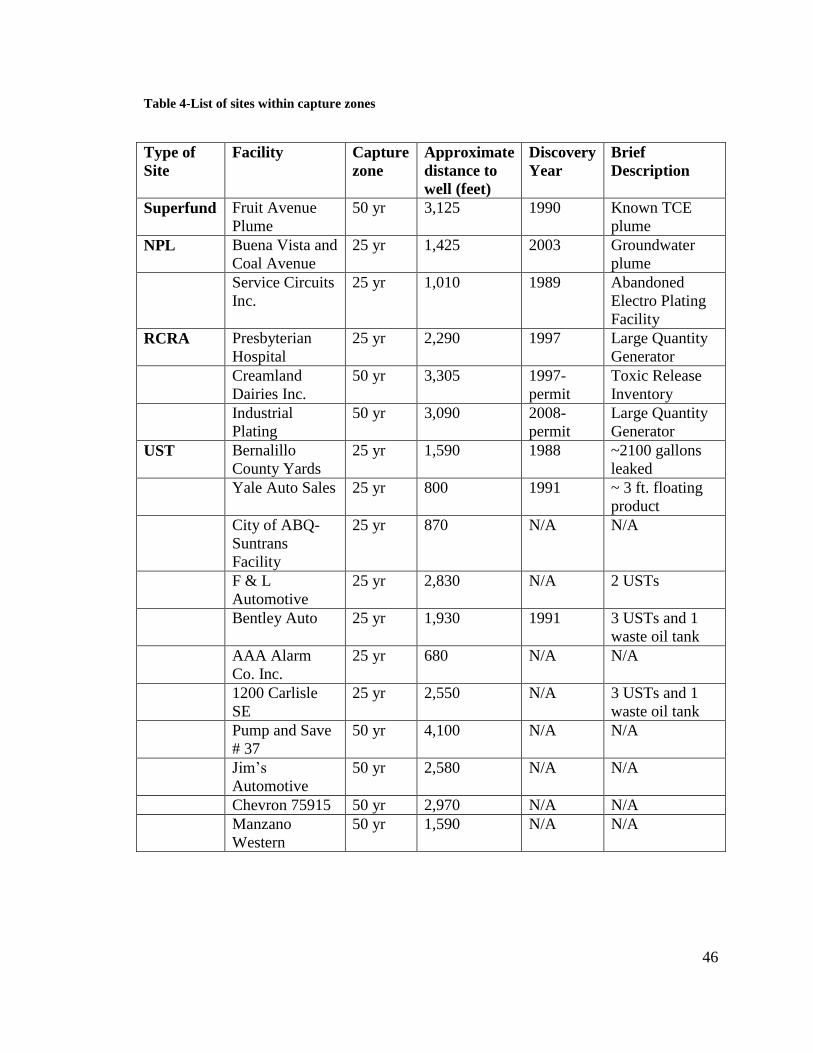
Of the 168 sites included in the study only 17 contaminant sites fell within the 25 and 50
year capture zones for the Ridgecrest Trunk wells. The 25 year capture zones had seven
leaking petroleum storage tanks and the Presbyterian Hospital RCRA site located within
the boundaries. The 50 year capture zones included the Fruit Avenue Plume Superfund
site, Creamland Dairies Incorporated and Industry Plating RCRA sites, four leaking
USTs, and two sites that were nominated to be Superfund sites (Table 4).
Theoretically, the capture zones would be worst case scenarios since the MODPATH tool
does not take into account attenuation mechanisms such as adsorption, dilution, or
biodegradation. The model is also simulating groundwater movement approximately
350-550 ft. bgs, therefore contaminants would have to travel down a well’s borehole or
from the surface through the soil to the saturated formation to be available to move
through Layer 6 and contaminate a well. The groundwater plume of TCE associated with
the Fruit Avenue Plume Superfund site is an example how contamination can travel down
a well’s borehole to contaminate a large area (Figure 10). Because these sites deal with
the release of VOCs, which pose certain health threats, the worst case scenario is a useful
tool to ensure that potential problems are detected before they become actual problems.

45
Figure 9-Capture zones delineated for the Ridgecrest Trunk wells.
46
Table 4-List of sites within capture zones
Type of
Site
Facility Capture
zone
Approximate
distance to
well (feet)
Discovery
Year
Brief
Description
Superfund Fruit Avenue
Plume
50 yr 3,125 1990 Known TCE
plume
NPL Buena Vista and
Coal Avenue
25 yr 1,425 2003 Groundwater
plume
Service Circuits
Inc.
25 yr 1,010 1989 Abandoned
Electro Plating
Facility
RCRA Presbyterian
Hospital
25 yr 2,290 1997 Large Quantity
Generator
Creamland
Dairies Inc.
50 yr 3,305 1997-
permit
Toxic Release
Inventory
Industrial
Plating
50 yr 3,090 2008-
permit
Large Quantity
Generator
UST Bernalillo
County Yards
25 yr 1,590 1988 ~2100 gallons
leaked
Yale Auto Sales 25 yr 800 1991 ~ 3 ft. floating
product
City of ABQ-
Suntrans
Facility
25 yr 870 N/A N/A
F & L
Automotive
25 yr 2,830 N/A 2 USTs
Bentley Auto 25 yr 1,930 1991 3 USTs and 1
waste oil tank
AAA Alarm
Co. Inc.
25 yr 680 N/A N/A
1200 Carlisle
SE
25 yr 2,550 N/A 3 USTs and 1
waste oil tank
Pump and Save
# 37
50 yr 4,100 N/A N/A
Jim’s
Automotive
50 yr 2,580 N/A N/A
Chevron 75915 50 yr 2,970 N/A N/A
Manzano
Western
50 yr 1,590 N/A N/A

47
Figure 10-Example of contamination movement through soil layers (USEPA, 2001).
Conceptually, a system of ranking the sites within the capture zones would be useful
when taking into consideration that each site has varying amounts of hazardous waste and
start dates. For example, the RCRA sites only manufacture or handle waste and there
may not be any release of contaminants to the environment. RCRA sites often have their
waste transported to other facilities that recycle or properly handle the waste. These sites
would have a lower ranking when considering their potential to threaten a well.

48
A system would have to be devised to determine how to rank leaking underground
storage tanks because there are limitations to the amount of petroleum product leaked.
Leakage depends on how much product the tank holds and where the leak was located
because only the product above the opening can be leaked out. The minimum leakage
amount that has to be reported to the NMED PST Bureau is 30 gallons (NMED, 2008).
Records for how much product was leaked were often not reported in the documents used
for this study. There is also the possibility that some of the sites have been subject to
corrective action and are no longer a threat.
Conversely, the Fruit Avenue Plume Superfund Site would have a higher ranking because
of its known chlorinated carbon plume, particularly TCE. Furthermore, the site’s plume
may be approaching the well because the USEPA alleged that the site was disposing of
hazardous waste from 1940-1970; therefore is represented to be approximately 40-70
years old. Analytical results for monitoring on Yale 3, the well in which Fruit Avenue
Plume would contaminate, have not shown that plume has reached the well. There have
been three detections of MEK since 2004 and one detection of THF in 2005, neither
contaminant has been linked to any health threats (Table 3).
The other sites that were listed on the National Priorities List to be considered as
Superfund sites would need additional research to determine the nature and extent of
contamination. Their rank could then be determined to assess the threat associated with
these sites.

49
Although this study has only addressed the idea that sites could have a system of ranking,
further research needs to be conducted to determine the factors that should be used to
prioritize sites. The distance of the site to the well could be included in determining the
rank, although the shapes depicted by the capture zones vary and would present an
inconsistency to this ranking option.
8.0 Discussion
It is commonly stated “All models are wrong, some are useful” (Box, 1979). This
statement should not be taken lightly, just as the results from the study should not be used
as hard science. The limitations and assumptions of the model must be considered. It is
my opinion the future work is necessary to determine if there are threats pending to the
public water supply and diligent monitoring efforts must be continued.
Modeling tools can provide insight for making decisions even if it means that further
research needs to be conducted. The findings of this project point out that interested
agencies should work together and share information openly as to not prevent data gaps
within studies.
8.1 Limitations and Assumptions
When considering whether to base management decisions on the MODFLOW results for
the Albuquerque Basin, many assumptions and limitation need to be recognized
including:

50
The Albuquerque Basin MODFLOW model was based on the understanding that
horizontal ground water movement predominates; the actual ratio of horizontal to
vertical movement was at a ratio of 200:1. This is important to consider when the
model has multiple layers and the prediction of capture zones was only preformed
for layer 6. Contaminants would have to travel approximately 350-550 feet below
the grounds surface for the capture zones to represent the boundaries in which
contamination can reach a well. Alternatively, the contamination can travel down
a well’s bore hole that may not have a secure seal.
The model’s grid size resolution was 200 meters for the study area, therefore
details remain unrefined, this would include the accuracy of the capture zones.
This model was chosen over the more recent model created for the Middle Rio
Grande Basin hat has a 1000 meter grid size.
The model uses hydraulic characteristics that were approximated in 1995, and did
not incorporate more recent observations.
MODFLOW uses a block-centered package for its simulation, with this package
characteristics of the cell are uniform throughout the cell. Also, all wells are
placed in the center of a cell, which means that results may skew 100 meters in
any direction to correct for the well’s actual location.
The pumping rates used within the model averaged the summer and winter time
steps of 1995. Overall city usage has decreased since 1995, but in 2006 the new
arsenic standard of 10 ppb became effective. This has changed the pumping plans

51
of various wells throughout the city with some pumping more and others less.
Using more accurate pumping rates or using an updated transient model could
have improved the steady state model using 1995 pumping rates.
The MODPATH extension mathematical method for processing data does not
take into account for attenuation of contaminants through interactions with the
soil dilution, or biodegradation. Adsorption will retard the migration of
contaminants, while dilution and biodegradation will lower their concentrations.
Therefore actual arrival times and concentrations in the production well water will
be reduced.
The steady state model will have results that vary when compared to a transient
model that utilizes actual records of pumping, recharge, or river properties.
Sites with hazardous waste contaminating the soils and groundwater begun at
different times, therefore all the pollution problems of this study did not start at
once and some sites are approaching their 50 year mark. An alternative approach
for this problem would have been to utilize a contamination site’s known plume
extent as it was in 1995, and then all sites would have the same start time.
8.2 Future Work
Because this project served as a first step in looking at sites of hazardous waste that may
threaten the public water supply, continued research and improvements to groundwater
models can hone the results to provide better simulations.

52
The results of this project highlighted areas that further research can focus on to
determine if there is the possibility for contamination to reach a well and affect the
public’s health. The first step in improving the results obtained would be to update the
data used in the Albuquerque Basin MODFLOW model since the model dates back to
1996. This could be done by applying more accurate hydraulic properties to the entire
model or focusing in on areas of concern. There are undoubtedly areas that have more
threats than others; therefore these areas should be looked at more closely. Additionally,
utilizing a smaller grid size over areas of interest may also minimize discrepancies
induced by broad characterizations and averages of hydraulic properties and the capture
zone shapes and sizes may be more accurate.
Additionally, monitoring well results could be used to calibrate the Albuquerque Basin
MODFLOW model with the MOD-Predict tool. This would be a way to incorporate
actual groundwater movement and improve the analysis of the model’s simulation of
groundwater movement.
Furthermore, additional sites can be included to make the study more comprehensive.
Gas stations or dry cleaning facilities are just a few examples of sites that can be included
in this study to be more helpful.

53
References
Albuquerque Bernalillo County Water Utility Authority (ABCWUA), 2007. Water
Utility Authority Production January-December 2007.
Albuquerque Bernalillo County Water Utility Authority (ABCWUA), 2008a. Arsenic
Variation in the Distribution System.
http://www.abcwua.org/content/view/294/505/. Accessed August 2008.
Albuquerque Bernalillo County Water Utility Authority (ABCWUA), 2008b. Water
Quality Share Drive files data. Accessed April 2008.
Bartolino, J. and J. Cole, 2002. Ground-Water Resources of the Middle Rio Grande
Basin. U.S. Geological Survey Circular 1222.
http://pubs.er.usgs.gov/usgspubs/cir/cir1222.
Bexfield, L. and S. Anderholm, 2002. Estimated Water-Level Declines in the Santa Fe
Group Aquifer System in the Albuquerque Area, Central New Mexico,
Predevelopment to 2002. U. S. Geological Survey Water Resources Investigation
Report 02-4233. http://pubs.er.usgs.gov/usgspubs/wri/wri024233.
Box, G., 1979. Robustness in the Strategy of Scientific Model Building. In: Robustness in
Statistics, R. Launer. Academic Press: New York.
CH2M Hill, Inc., 2007. Kirtland Air Force Base, Albuquerque, New Mexico: Stage 2
Abatement Plan Modification Bulk Fuels Facility (ST106).
Code of Federal Regulations (CFR), 2004. Title 42, Chapter 103-Comprehensive
Environmental Response, Compensation and Liability, Subchapter I.
http://www.access.gpo.gov/uscode/title42/chapter103_.html.
Forest City Covington, 2007. Mesa del Sol Overview: The Big Picture.
www.mesadelsolnm.com. Accessed September 2008.
Gastian, B., 2008. Compliance Director for Albuquerque Bernalillo County Water
Utility Authority. Personal Communication on September 25, 2008. Subject:
Albuquerque Bernalillo County Water Utility Authority.
Harding Lawson Associates, 2000. Five-Year Review Report of Remedial Actions for
Plant 83/General Electric Operable Unit South Valley Superfund Site. HLA
Project No. 50052.47.01 http://www.epa.gov/superfund/sites/fiveyear/f00-
06014.pdf. Accessed August 2008.
Hornberger, G., J. Raffensperger, P. Wiberg, and K. Eshleman, 1998. Elements of
Physical Hydrology. John Hopkins University Press, Baltimore, Maryland.

54
McDonald, M. and A. Harbaugh, 1988. A Modular Three-Dimensional Finite-Difference
Ground-Water Flow Model. U.S. Geological Survey Techniques of Water-
Resource Investigation 06-A1. http://pubs.er.usgs.gov/usgspubs/twri/twri06A1.
Moran, M., J.Zogorski, and B. Rowe, 2005. Approach to an Assessment of Volatile
Organic Compounds in the Nation’s Ground Water and Drinking-Water Supply
Wells. U. S. Geological Survey Open File Report 2005-1452.
http://pubs.er.usgs.gov/usgspubs/ofr/ofr20051452.
Nelson, T., 1997. Past and Present Solid Waste Landfills in Bernalillo County, New
Mexico. School of Public Administration Professional Paper, University of New
Mexico, Albuquerque, New Mexico.
New Mexico Environment Department (NMED), 2001. Water Quality Regulations.
Title 20, Chapter 6, Part 2. New Mexico Administrative Code (revised 01-15-
2001).
New Mexico Environment Department (NMED), 2007. Drinking Water Regulations.
Title 20, Chapter 7, Part 10. New Mexico Administrative Code (revised 4-16-
2007).
New Mexico Environment Department (NMED), 2008. Petroleum Storage Tank
Regulations. Title 20, Chapter 5. New Mexico Administrative Code (revised 4-
04-2008).
New Mexico Environment Department (NMED), 2008a. Preliminary Assessment Report
Randolph Road and University Boulevard Site, Bernalillo County, New Mexico
CERCLIS ID #NMN000606846. NMED Ground Water Quality Bureau
Superfund Oversight Section.
Plummer, N., L. Bexfield, S. Anderholm, W. Sanford, and E. Busenberg, 2004.
Geochemical Characterization of Ground-water Flow in the Santa Fe Group
Aquifer System, Middle Rio Grande, Basin, New Mexico. U.S. Geological
Survey Water-Resources Investigation Report 03-4131.
http://pubs.er.usgs.gov/usgspubs/wri/wri034131.
Pollock, D., 1994. User’s Guide for MODPATH/MODPATH-PLOT, Version 3: A
Particle tracking post-processing package for MODFLOW the U.S. Geological
Survey finite-difference ground-water flow model. U.S. Geological Survey
Open-File Report 94-464. http://pubs.er.usgs.gov/usgspubs/ofr/ofr94464.
Reuter, S., 2008. NMED Petroleum Storage Tank Bureau. Personal communication on
October 2, 2008. Subject: Albuquerque leaking underground storage tanks.
Trujillo, M., 2008. Personal Communication on October 6, 2008. Subject: MEK
detections in groundwater samples.

55
United States Environmental Protection Agency (USEPA), 1997. RCRA: Reducing Risk
from Waste. EPA Report 530-K-97-004.
http://www.epa.gov/epawaste/inforesources/pubs/risk/risk.htm.
United States Environmental Protection Agency (USEPA) Office of Ground Water and
Drinking Water, 1999. Maximum Contaminant Levels and Health Advisory
Levels. Appendix D to The Class V Underground Injection Control Study. EPA
Report 816-R-99-014a. http://www.epa.gov/safewater/uic/class5/pdf/study_uic-
class5_classvstudy_mcl-ha_appd.pdf.
United States Environmental Protection Agency (USEPA), 1999. Guidance Manual for
conducting Sanitary Surveys of Public Water Systems; Surface Water and
Ground Water Under the Direct Influence (GWUDI). U.S. Environmental
Protection Agency Office of Water. EPA Report 815-R-99-016.
http://www.epa.gov/safewater/mdbp/pdf/sansurv/sansurv.pdf
United States Environmental Protection Agency (USEPA), 2001. Superfund Record of
Decision: Fruit Avenue Plume Albuquerque, New Mexico.
http://www.epa.gov/superfund/sites/rods/fulltext/r0601009.pdf. Accessed August
2008
United States Environmental Protection Agency (USEPA), 2002a. EPA Superfund
Record of Decision AT&SF (Albuquerque) New Mexico.
http://www.epa.gov/superfund/sites/rods/fulltext/r0602005.pdf. Accessed August
2008
United States Environmental Protection Agency (USEPA) Office of Research and
Development, 2002b. Technical Approaches to Characterizing and Redeveloping
Brownfield Sites: Municipal Landfills and Illegal Dumps. EPA Report 625/R-
02/002. http://www.epa.gov/nrmrl/pubs/625r02002/625r02002.pdf. Accessed
September 2008.
United States Environmental Protection Agency (USEPA), 2004. National Primary
Drinking Water Regulations. Code of Federal Regulations Title 40, Chapter 1,
Subchapter D, Part 141. http://www.epa.gov/safewater/regs.html.
United States Environmental Protection Agency (USEPA), 2007a. Just the Facts for
Consumers: Arsenic in Your Drinking Water. Environmental Protection Agency
Office of Ground Water and Drinking Water. EPA Report 816-F-07-002.
http://www.epa.gov/safewater/arsenic/pdfs/fs_arsenic_justthefactsforconsumers.p
df.
United States Environmental Protection Agency (USEPA), 2007b. Superfund: Basic
Information. http://epa.gov/superfund/about.htm. Accessed September 2008.

56
United States Environmental Protection Agency (USEPA), 2008a. Hazardous Waste
Generators. http://www.epa.gov/epawaste/hazard/generation/index.htm.
Accessed August 2008.
United States Environmental Protection Agency (USEPA), 2008b. Program System
Definitions. http://www.epa.gov/enviro/html/fii/prog_sys.html#airs/afs.
Accessed August 2008.
United States Environmental Protection Agency (USEPA), 2008c. Envirofacts Data
Warehouse. http://www.epa.gov/enviro. Accessed September 2008.
Zogorski, J., J. Carter, T. Ivahnenko, W. Lapham, M. Moran, B. Rowe, P. Squillace, and
P. Toccalino, 2006. Volatile Organic Compounds in the Nation’s Ground Water
and Drinking-Water Supply Wells. U.S. Geological Survey Circular 1292.
http://pubs.er.usgs.gov/usgspubs/cir/cir1292.
ArcGIS References
City of Albuquerque, 2006. Environmental Issues: Landfill Sites.
City of Albuquerque, 2008. Geographic Information Systems Data from the City of
Albuquerque: Major Streets. http://www.cabq.gov/gis/download.html Accessed
August 21, 2008.
City of Albuquerque, 2008. Geographic Information Systems Data from the City of
Albuquerque: Street Network. http://www.cabq.gov/gis/download.html
Accessed August 21, 2008.
Leak, T., 1997. Currently Open Cases in Bernalillo County. Accessed in Barbara
Gastian file system.
NMED, 2008. Reports and Lists of Facility Leak Sites.
http://www.nmenv.state.nm.us/ust/gisfac.html Accessed May 10, 2008
US EPA, 2008. U.S. Environmental Protection Agency Geospatial Data Download
Service Geospatial Data File. Document No.:51-FRS-RPT-0077. Washington,
D.C.

57
Appendix 1- Primary Drinking Water Standards (USEPA, 2004)
Microorganisms
Contaminant MCLG
1
(mg/L)2
MCL or
TT1
(mg/L)2
Potential Health Effects from
Ingestion of Water
Sources of
Contaminant in
Drinking Water
Cryptosporidium
(pdf file)
zero TT 3 Gastrointestinal illness (e.g.,
diarrhea, vomiting, cramps)
Human and animal fecal
waste
Giardia lamblia zero TT3 Gastrointestinal illness (e.g.,
diarrhea, vomiting, cramps)
Human and animal fecal
waste
Heterotrophic plate
count
n/a TT3 HPC has no health effects; it is an
analytic method used to measure the
variety of bacteria that are common
in water. The lower the
concentration of bacteria in drinking
water, the better maintained the
water system is.
HPC measures a range of
bacteria that are naturally
present in the
environment
Legionella zero TT3 Legionnaire's Disease, a type of
pneumonia
Found naturally in water;
multiplies in heating
systems
Total Coliforms
(including fecal
coliform and E.
Coli)
zero 5.0%4 Not a health threat in itself; it is
used to indicate whether other
potentially harmful bacteria may be
present5
Coliforms are naturally
present in the
environment; as well as
feces; fecal coliforms
and E. coli only come
from human and animal
fecal waste.
Turbidity n/a TT3 Turbidity is a measure of the
cloudiness of water. It is used to
indicate water quality and filtration
effectiveness (e.g., whether disease-
causing organisms are present).
Higher turbidity levels are often
associated with higher levels of
disease-causing microorganisms
such as viruses, parasites and some
bacteria. These organisms can cause
symptoms such as nausea, cramps,
diarrhea, and associated headaches.
Soil runoff
Viruses (enteric) zero TT3 Gastrointestinal illness (e.g.,
diarrhea, vomiting, cramps)
Human and animal fecal
waste
Disinfection Byproducts
Contaminant MCLG1 MCL or Potential Health Effects from Sources of

58
(mg/L)2 TT
1
(mg/L)2
Ingestion of Water Contaminant in
Drinking Water
Bromate zero 0.010 Increased risk of cancer Byproduct of drinking
water disinfection
Chlorite 0.8 1.0 Anemia; infants & young children:
nervous system effects
Byproduct of drinking
water disinfection
Haloacetic acids
(HAA5)
n/a6 0.060
7 Increased risk of cancer Byproduct of drinking
water disinfection
Total
Trihalomethanes
(TTHMs)
n/a6 0.080
7 Liver, kidney or central nervous
system problems; increased risk of
cancer
Byproduct of drinking
water disinfection
Disinfectants
Contaminant MRDLG
1
(mg/L)2
MRDL1
(mg/L)2
Potential Health Effects
from Ingestion of Water
Sources of Contaminant
in Drinking Water
Chloramines
(as Cl2)
MRDLG=41 MRDL=4.0
1 Eye/nose irritation; stomach
discomfort, anemia
Water additive used to
control microbes
Chlorine (as
Cl2)
MRDLG=41 MRDL=4.0
1 Eye/nose irritation; stomach
discomfort
Water additive used to
control microbes
Chlorine
dioxide (as
ClO2)
MRDLG=0.81 MRDL=0.8
1 Anemia; infants & young
children: nervous system
effects
Water additive used to
control microbes
Inorganic Chemicals
Contaminant MCLG
1
(mg/L)2
MCL or
TT1
(mg/L)2
Potential Health Effects from
Ingestion of Water
Sources of Contaminant in
Drinking Water
Antimony 0.006 0.006 Increase in blood cholesterol;
decrease in blood sugar
Discharge from petroleum
refineries; fire retardants;
ceramics; electronics; solder
Arsenic 07 0.010
as of
01/23/06
Skin damage or problems with
circulatory systems, and may
have increased risk of getting
cancer
Erosion of natural deposits;
runoff from orchards, runoff
from glass &
electronicsproduction wastes
Asbestos
(fiber >10
micrometers)
7
million
fibers
per liter
7 MFL Increased risk of developing
benign intestinal polyps
Decay of asbestos cement in
water mains; erosion of
natural deposits
Barium 2 2 Increase in blood pressure Discharge of drilling wastes;
discharge from metal
refineries; erosion of natural
deposits

59
Beryllium 0.004 0.004 Intestinal lesions Discharge from metal
refineries and coal-burning
factories; discharge from
electrical, aerospace, and
defense industries
Cadmium 0.005 0.005 Kidney damage Corrosion of galvanized
pipes; erosion of natural
deposits; discharge from
metal refineries; runoff from
waste batteries and paints
Chromium
(total)
0.1 0.1 Allergic dermatitis Discharge from steel and
pulp mills; erosion of natural
deposits
Copper 1.3 TT8;
Action
Level=1.3
Short term exposure:
Gastrointestinal distress
Long term exposure: Liver or
kidney damage
People with Wilson's Disease
should consult their personal
doctor if the amount of copper
in their water exceeds the action
level
Corrosion of household
plumbing systems; erosion
of natural deposits
Cyanide (as free
cyanide)
0.2 0.2 Nerve damage or thyroid
problems
Discharge from steel/metal
factories; discharge from
plastic and fertilizer
factories
Fluoride 4.0 4.0 Bone disease (pain and
tenderness of the bones);
Children may get mottled teeth
Water additive which
promotes strong teeth;
erosion of natural deposits;
discharge from fertilizer and
aluminum factories
Lead zero TT8;
Action
Level=0.015
Infants and children: Delays in
physical or mental development;
children could show slight
deficits in attention span and
learning abilities
Adults: Kidney problems; high
blood pressure
Corrosion of household
plumbing systems; erosion
of natural deposits
Mercury
(inorganic)
0.002 0.002 Kidney damage Erosion of natural deposits;
discharge from refineries
and factories; runoff from
landfills and croplands
Nitrate
(measured as
Nitrogen)
10 10 Infants below the age of six
months who drink water
containing nitrate in excess of
the MCL could become
seriously ill and, if untreated,
may die. Symptoms include
Runoff from fertilizer use;
leaching from septic tanks,
sewage; erosion of natural
deposits

60
shortness of breath and blue-
baby syndrome.
Nitrite
(measured as
Nitrogen)
1 1 Infants below the age of six
months who drink water
containing nitrite in excess of
the MCL could become
seriously ill and, if untreated,
may die. Symptoms include
shortness of breath and blue-
baby syndrome.
Runoff from fertilizer use;
leaching from septic tanks,
sewage; erosion of natural
deposits
Selenium 0.05 0.05 Hair or fingernail loss;
numbness in fingers or toes;
circulatory problems
Discharge from petroleum
refineries; erosion of natural
deposits; discharge from
mines
Thallium 0.0005 0.002 Hair loss; changes in blood;
kidney, intestine, or liver
problems
Leaching from ore-
processing sites; discharge
from electronics, glass, and
drug factories
Organic Chemicals
Contaminant MCLG
1
(mg/L)2
MCL or
TT1
(mg/L)2
Potential Health Effects
from Ingestion of Water
Sources of
Contaminant in
Drinking Water
Acrylamide zero TT9 Nervous system or blood
problems; increased risk of
cancer
Added to water
during
sewage/wastewater
treatment
Alachlor zero 0.002 Eye, liver, kidney or spleen
problems; anemia; increased
risk of cancer
Runoff from
herbicide used on
row crops
Atrazine 0.003 0.003 Cardiovascular system or
reproductive problems
Runoff from
herbicide used on
row crops
Benzene zero 0.005 Anemia; decrease in blood
platelets; increased risk of
cancer
Discharge from
factories; leaching
from gas storage
tanks and landfills
Benzo(a)pyrene (PAHs) zero 0.0002 Reproductive difficulties;
increased risk of cancer
Leaching from
linings of water
storage tanks and
distribution lines
Carbofuran 0.04 0.04 Problems with blood, nervous
system, or reproductive
system
Leaching of soil
fumigant used on rice
and alfalfa
Carbon zero 0.005 Liver problems; increased Discharge from

61
tetrachloride risk of cancer chemical plants and
other industrial
activities
Chlordane zero 0.002 Liver or nervous system
problems; increased risk of
cancer
Residue of banned
termiticide
Chlorobenzene 0.1 0.1 Liver or kidney problems Discharge from
chemical and
agricultural chemical
factories
2,4-D 0.07 0.07 Kidney, liver, or adrenal
gland problems
Runoff from
herbicide used on
row crops
Dalapon 0.2 0.2 Minor kidney changes Runoff from
herbicide used on
rights of way
1,2-Dibromo-3-
chloropropane (DBCP)
zero 0.0002 Reproductive difficulties;
increased risk of cancer
Runoff/leaching from
soil fumigant used on
soybeans, cotton,
pineapples, and
orchards
o-Dichlorobenzene 0.6 0.6 Liver, kidney, or circulatory
system problems
Discharge from
industrial chemical
factories
p-Dichlorobenzene 0.075 0.075 Anemia; liver, kidney or
spleen damage; changes in
blood
Discharge from
industrial chemical
factories
1,2-Dichloroethane zero 0.005 Increased risk of cancer Discharge from
industrial chemical
factories
1,1-Dichloroethylene 0.007 0.007 Liver problems Discharge from
industrial chemical
factories
cis-1,2-Dichloroethylene 0.07 0.07 Liver problems Discharge from
industrial chemical
factories
trans-1,2-Dichloroethylene 0.1 0.1 Liver problems Discharge from
industrial chemical
factories
Dichloromethane zero 0.005 Liver problems; increased
risk of cancer
Discharge from drug
and chemical
factories
1,2-Dichloropropane zero 0.005 Increased risk of cancer Discharge from
industrial chemical
factories
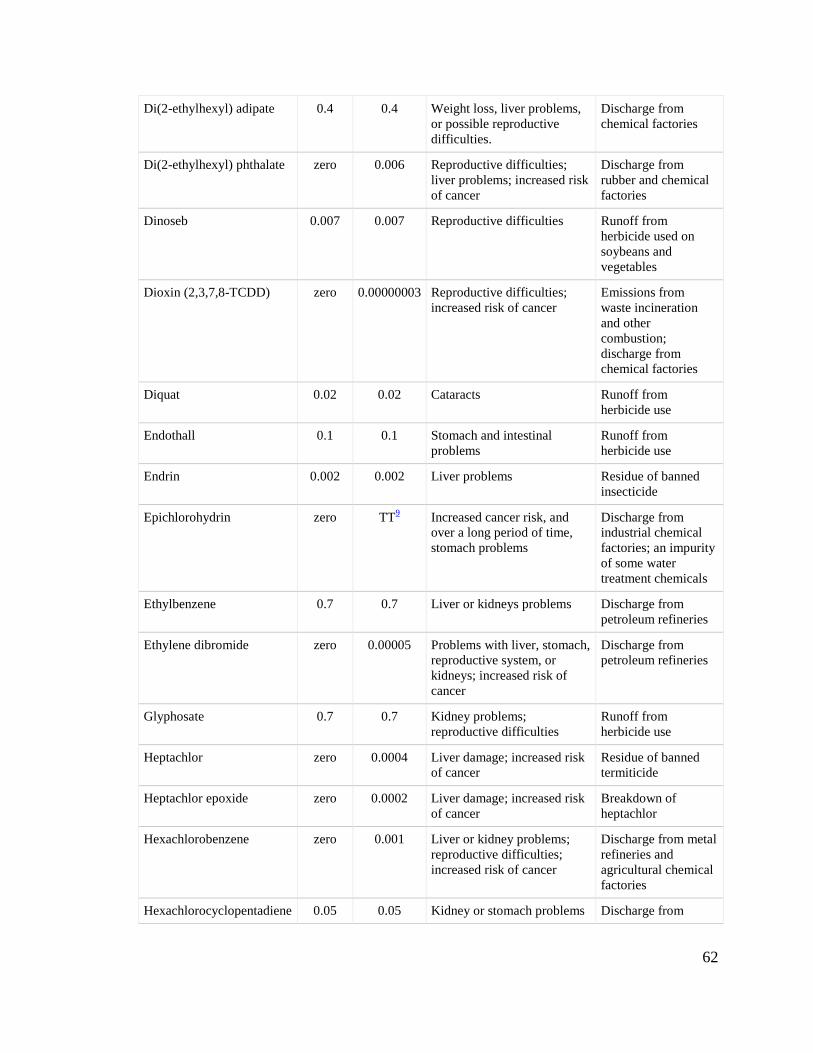
62
Di(2-ethylhexyl) adipate 0.4 0.4 Weight loss, liver problems,
or possible reproductive
difficulties.
Discharge from
chemical factories
Di(2-ethylhexyl) phthalate zero 0.006 Reproductive difficulties;
liver problems; increased risk
of cancer
Discharge from
rubber and chemical
factories
Dinoseb 0.007 0.007 Reproductive difficulties Runoff from
herbicide used on
soybeans and
vegetables
Dioxin (2,3,7,8-TCDD) zero 0.00000003 Reproductive difficulties;
increased risk of cancer
Emissions from
waste incineration
and other
combustion;
discharge from
chemical factories
Diquat 0.02 0.02 Cataracts Runoff from
herbicide use
Endothall 0.1 0.1 Stomach and intestinal
problems
Runoff from
herbicide use
Endrin 0.002 0.002 Liver problems Residue of banned
insecticide
Epichlorohydrin zero TT9 Increased cancer risk, and
over a long period of time,
stomach problems
Discharge from
industrial chemical
factories; an impurity
of some water
treatment chemicals
Ethylbenzene 0.7 0.7 Liver or kidneys problems Discharge from
petroleum refineries
Ethylene dibromide zero 0.00005 Problems with liver, stomach,
reproductive system, or
kidneys; increased risk of
cancer
Discharge from
petroleum refineries
Glyphosate 0.7 0.7 Kidney problems;
reproductive difficulties
Runoff from
herbicide use
Heptachlor zero 0.0004 Liver damage; increased risk
of cancer
Residue of banned
termiticide
Heptachlor epoxide zero 0.0002 Liver damage; increased risk
of cancer
Breakdown of
heptachlor
Hexachlorobenzene zero 0.001 Liver or kidney problems;
reproductive difficulties;
increased risk of cancer
Discharge from metal
refineries and
agricultural chemical
factories
Hexachlorocyclopentadiene 0.05 0.05 Kidney or stomach problems Discharge from

63
chemical factories
Lindane 0.0002 0.0002 Liver or kidney problems Runoff/leaching from
insecticide used on
cattle, lumber,
gardens
Methoxychlor 0.04 0.04 Reproductive difficulties Runoff/leaching from
insecticide used on
fruits, vegetables,
alfalfa, livestock
Oxamyl (Vydate) 0.2 0.2 Slight nervous system effects Runoff/leaching from
insecticide used on
apples, potatoes, and
tomatoes
Polychlorinated
biphenyls (PCBs)
zero 0.0005 Skin changes; thymus gland
problems; immune
deficiencies; reproductive or
nervous system difficulties;
increased risk of cancer
Runoff from
landfills; discharge of
waste chemicals
Pentachlorophenol zero 0.001 Liver or kidney problems;
increased cancer risk
Discharge from wood
preserving factories
Picloram 0.5 0.5 Liver problems Herbicide runoff
Simazine 0.004 0.004 Problems with blood Herbicide runoff
Styrene 0.1 0.1 Liver, kidney, or circulatory
system problems
Discharge from
rubber and plastic
factories; leaching
from landfills
Tetrachloroethylene zero 0.005 Liver problems; increased
risk of cancer
Discharge from
factories and dry
cleaners
Toluene 1 1 Nervous system, kidney, or
liver problems
Discharge from
petroleum factories
Toxaphene zero 0.003 Kidney, liver, or thyroid
problems; increased risk of
cancer
Runoff/leaching from
insecticide used on
cotton and cattle
2,4,5-TP (Silvex) 0.05 0.05 Liver problems Residue of banned
herbicide
1,2,4-Trichlorobenzene 0.07 0.07 Changes in adrenal glands Discharge from
textile finishing
factories
1,1,1-Trichloroethane 0.20 0.2 Liver, nervous system, or
circulatory problems
Discharge from metal
degreasing sites and
other factories
1,1,2-Trichloroethane 0.003 0.005 Liver, kidney, or immune Discharge from

64
system problems industrial chemical
factories
Trichloroethylene zero 0.005 Liver problems; increased
risk of cancer
Discharge from metal
degreasing sites and
other factories
Vinyl chloride zero 0.002 Increased risk of cancer Leaching from PVC
pipes; discharge from
plastic factories
Xylenes (total) 10 10 Nervous system damage Discharge from
petroleum factories;
discharge from
chemical factories
Radionuclides
Contaminant MCLG
1
(mg/L)2
MCL or
TT1
(mg/L)2
Potential Health Effects from
Ingestion of Water
Sources of
Contaminant in
Drinking Water
Alpha particles none7
----------
zero
15
picocuries
per Liter
(pCi/L)
Increased risk of cancer Erosion of natural
deposits of certain
minerals that are
radioactive and may
emit a form of radiation
known as alpha radiation
Beta particles and
photon emitters
none7
----------
zero
4
millirems
per year
Increased risk of cancer Decay of natural and
man-made deposits of
certain minerals that are
radioactive and may
emit forms of radiation
known as photons and
beta radiation
Radium 226 and
Radium 228
(combined)
none7
----------
zero
5 pCi/L Increased risk of cancer Erosion of natural
deposits
Uranium zero 30 ug/L
as of
12/08/03
Increased risk of cancer, kidney
toxicity
Erosion of natural
deposits
Notes 1 Definitions:
Maximum Contaminant Level (MCL) - The highest level of a contaminant that is allowed in drinking water. MCLs are
set as close to MCLGs as feasible using the best available treatment technology and taking cost into consideration.
MCLs are enforceable standards.
Maximum Contaminant Level Goal (MCLG) - The level of a contaminant in drinking water below which there is no
known or expected risk to health. MCLGs allow for a margin of safety and are non-enforceable public health goals.
Maximum Residual Disinfectant Level (MRDL) - The highest level of a disinfectant allowed in drinking water. There
is convincing evidence that addition of a disinfectant is necessary for control of microbial contaminants.
Maximum Residual Disinfectant Level Goal (MRDLG) - The level of a drinking water disinfectant below which there
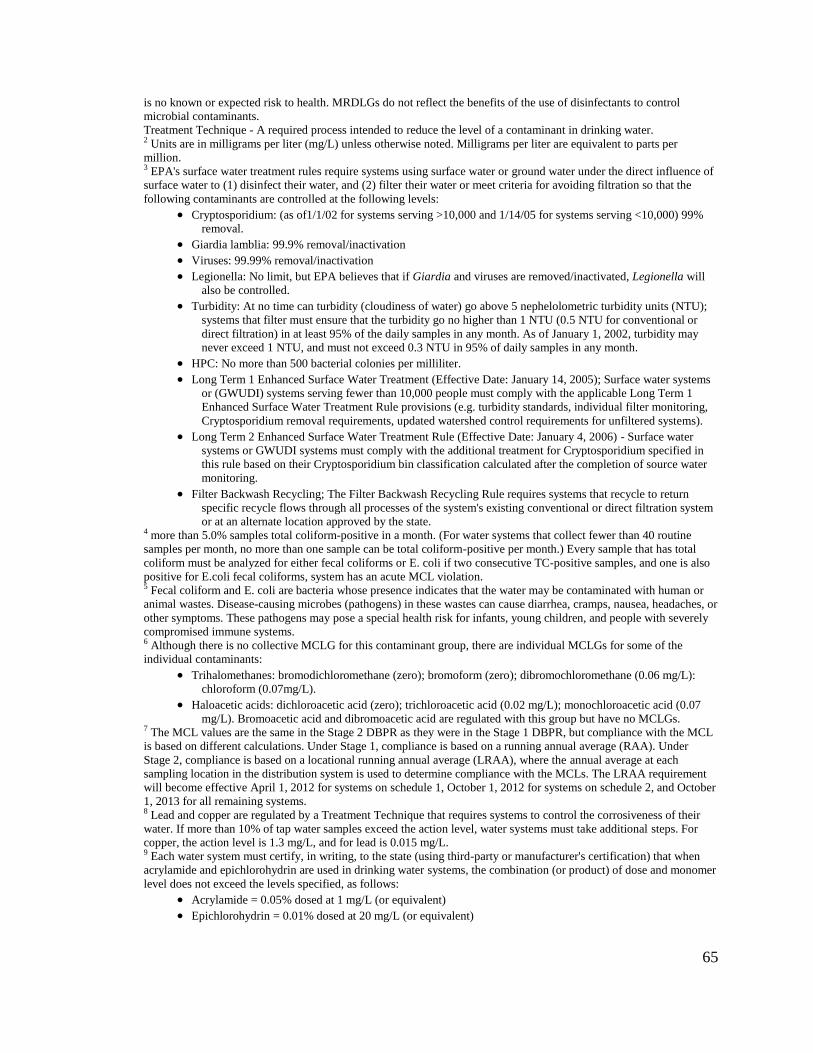
65
is no known or expected risk to health. MRDLGs do not reflect the benefits of the use of disinfectants to control
microbial contaminants.
Treatment Technique - A required process intended to reduce the level of a contaminant in drinking water. 2 Units are in milligrams per liter (mg/L) unless otherwise noted. Milligrams per liter are equivalent to parts per
million. 3 EPA's surface water treatment rules require systems using surface water or ground water under the direct influence of
surface water to (1) disinfect their water, and (2) filter their water or meet criteria for avoiding filtration so that the
following contaminants are controlled at the following levels:
Cryptosporidium: (as of1/1/02 for systems serving >10,000 and 1/14/05 for systems serving <10,000) 99%
removal.
Giardia lamblia: 99.9% removal/inactivation
Viruses: 99.99% removal/inactivation
Legionella: No limit, but EPA believes that if Giardia and viruses are removed/inactivated, Legionella will
also be controlled.
Turbidity: At no time can turbidity (cloudiness of water) go above 5 nephelolometric turbidity units (NTU);
systems that filter must ensure that the turbidity go no higher than 1 NTU (0.5 NTU for conventional or
direct filtration) in at least 95% of the daily samples in any month. As of January 1, 2002, turbidity may
never exceed 1 NTU, and must not exceed 0.3 NTU in 95% of daily samples in any month.
HPC: No more than 500 bacterial colonies per milliliter.
Long Term 1 Enhanced Surface Water Treatment (Effective Date: January 14, 2005); Surface water systems
or (GWUDI) systems serving fewer than 10,000 people must comply with the applicable Long Term 1
Enhanced Surface Water Treatment Rule provisions (e.g. turbidity standards, individual filter monitoring,
Cryptosporidium removal requirements, updated watershed control requirements for unfiltered systems).
Long Term 2 Enhanced Surface Water Treatment Rule (Effective Date: January 4, 2006) - Surface water
systems or GWUDI systems must comply with the additional treatment for Cryptosporidium specified in
this rule based on their Cryptosporidium bin classification calculated after the completion of source water
monitoring.
Filter Backwash Recycling; The Filter Backwash Recycling Rule requires systems that recycle to return
specific recycle flows through all processes of the system's existing conventional or direct filtration system
or at an alternate location approved by the state. 4 more than 5.0% samples total coliform-positive in a month. (For water systems that collect fewer than 40 routine
samples per month, no more than one sample can be total coliform-positive per month.) Every sample that has total
coliform must be analyzed for either fecal coliforms or E. coli if two consecutive TC-positive samples, and one is also
positive for E.coli fecal coliforms, system has an acute MCL violation. 5 Fecal coliform and E. coli are bacteria whose presence indicates that the water may be contaminated with human or
animal wastes. Disease-causing microbes (pathogens) in these wastes can cause diarrhea, cramps, nausea, headaches, or
other symptoms. These pathogens may pose a special health risk for infants, young children, and people with severely
compromised immune systems. 6 Although there is no collective MCLG for this contaminant group, there are individual MCLGs for some of the
individual contaminants:
Trihalomethanes: bromodichloromethane (zero); bromoform (zero); dibromochloromethane (0.06 mg/L):
chloroform (0.07mg/L).
Haloacetic acids: dichloroacetic acid (zero); trichloroacetic acid (0.02 mg/L); monochloroacetic acid (0.07
mg/L). Bromoacetic acid and dibromoacetic acid are regulated with this group but have no MCLGs. 7 The MCL values are the same in the Stage 2 DBPR as they were in the Stage 1 DBPR, but compliance with the MCL
is based on different calculations. Under Stage 1, compliance is based on a running annual average (RAA). Under
Stage 2, compliance is based on a locational running annual average (LRAA), where the annual average at each
sampling location in the distribution system is used to determine compliance with the MCLs. The LRAA requirement
will become effective April 1, 2012 for systems on schedule 1, October 1, 2012 for systems on schedule 2, and October
1, 2013 for all remaining systems. 8 Lead and copper are regulated by a Treatment Technique that requires systems to control the corrosiveness of their
water. If more than 10% of tap water samples exceed the action level, water systems must take additional steps. For
copper, the action level is 1.3 mg/L, and for lead is 0.015 mg/L. 9 Each water system must certify, in writing, to the state (using third-party or manufacturer's certification) that when
acrylamide and epichlorohydrin are used in drinking water systems, the combination (or product) of dose and monomer
level does not exceed the levels specified, as follows:
Acrylamide = 0.05% dosed at 1 mg/L (or equivalent)
Epichlorohydrin = 0.01% dosed at 20 mg/L (or equivalent)
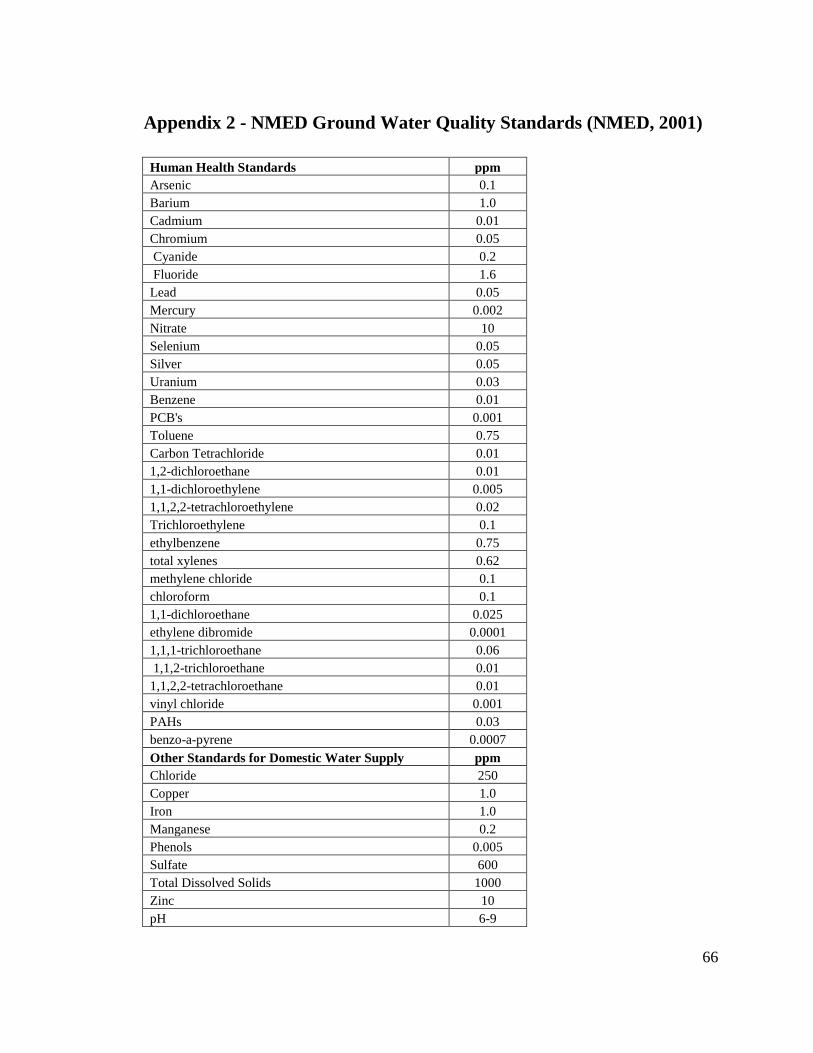
66
Appendix 2 - NMED Ground Water Quality Standards (NMED, 2001)
Human Health Standards ppm
Arsenic 0.1
Barium 1.0
Cadmium 0.01
Chromium 0.05
Cyanide 0.2
Fluoride 1.6
Lead 0.05
Mercury 0.002
Nitrate 10
Selenium 0.05
Silver 0.05
Uranium 0.03
Benzene 0.01
PCB's 0.001
Toluene 0.75
Carbon Tetrachloride 0.01
1,2-dichloroethane 0.01
1,1-dichloroethylene 0.005
1,1,2,2-tetrachloroethylene 0.02
Trichloroethylene 0.1
ethylbenzene 0.75
total xylenes 0.62
methylene chloride 0.1
chloroform 0.1
1,1-dichloroethane 0.025
ethylene dibromide 0.0001
1,1,1-trichloroethane 0.06
1,1,2-trichloroethane 0.01
1,1,2,2-tetrachloroethane 0.01
vinyl chloride 0.001
PAHs 0.03
benzo-a-pyrene 0.0007
Other Standards for Domestic Water Supply ppm
Chloride 250
Copper 1.0
Iron 1.0
Manganese 0.2
Phenols 0.005
Sulfate 600
Total Dissolved Solids 1000
Zinc 10
pH 6-9

67