modeling optimizes asset performance - global … global geophysical eprint.pdf · modeling...
TRANSCRIPT
Modeling Optimizes Asset PerformanceBy Chad Baillie
MISSOURI CITY, TX.–As more welland completion data have become availablein unconventional U.S. oil and gas plays,geoscientists and engineers have soughtto understand exactly which reservoirproperties have the greatest impact onproduction performance in each formation.Over time, operators also have come todepend on seismic data both to mapoverall structure and to delineate reservoirproperties away from well control.
However, it has become painfully clearthat strong well performance cannot becorrelated with individual reservoir prop-erties in unconventional fields. Instead, aunique combination of various propertiesand conditions controls the productivityof any particular well or reservoir. Withso many post-stack and prestack seismicattributes available today (not to mentionwell logs and engineering information),operators are finding it increasingly dif-ficult to sort through and quantify theirmeanings, relationships, and relative con-tributions to reservoir behavior and pro-duction results.
Given that there are simply too manystatic and dynamic variables and potentialoutcomes for traditional analysis, inter-pretation and modeling, seismically-con-strained multivariate statistical analysiswith integrated geoscience and engineeringdata can provide far more reliable pre-dictive models of cumulative production.A case study from the Wolfcamp Shaleplay in the Permian Basin shows howoperators can apply these models to op-timize drilling, completion design andexecution, identify refracturing candidates,and ultimately improve recovery in un-conventional wells and fields.
The strength of multivariate statistics
lies in its ability to whittle down a potentiallist of more than 100 attributes from 3-Dseismic and well data, and to identify thetop five or so attributes that have thegreatest impact on well performance. Theattributes that contribute to cumulativeproduction are known as the well’s keyperformance indicators (KPIs). TypicalKPIs include structural or geometric at-tributes, attributes related to seismic fre-quency or amplitude, mechanical andelastic properties, and even completionor engineering attributes such as proppantmass and fluid volume.
KPIs that emerge from multivariateanalysis are correlated with other welllog, core and completion data to determinewhich reservoir properties or conditionsthey may represent. Once these indicatorsare defined and understood, they can beintegrated into a single 3-D predictivemodel of production.
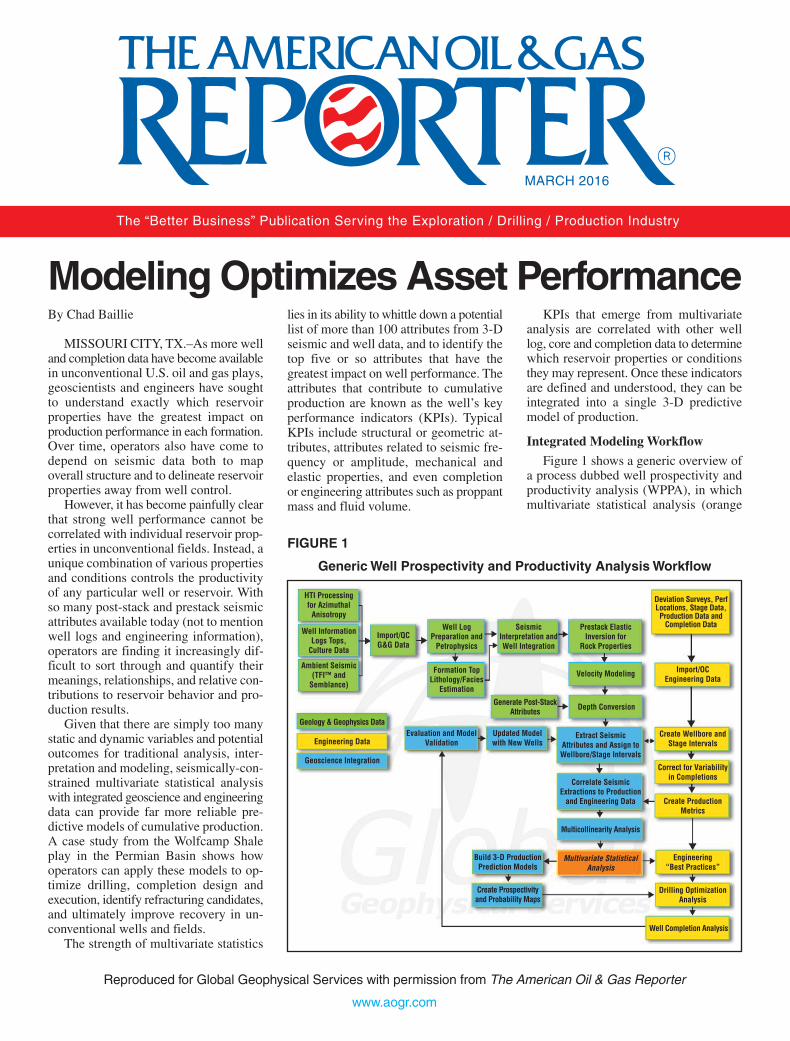
Integrated Modeling Workflow
Figure 1 shows a generic overview ofa process dubbed well prospectivity andproductivity analysis (WPPA), in whichmultivariate statistical analysis (orange
HTI Processingfor AzimuthalAnisotropy
Prestack ElasticInversion for
Rock Properties
SeismicInterpretation andWell Integration
Well LogPreparation andPetrophysics
Import/QCG&G Data
Geoscience Integration
Engineering Data
Geology & Geophysics Data
Ambient Seismic(TFI™ andSemblance)
Well InformationLogs Tops,Culture Data
Formation TopLithology/Facies
Estimation
Import/OCEngineering Data
Velocity Modeling
Updated Modelwith New Wells
Evaluation and ModelValidation
Generate Post-StackAttributes
Depth Conversion
Extract SeismicAttributes and Assign toWellbore/Stage Intervals
Correlate SeismicExtractions to Productionand Engineering Data
Multicollinearity Analysis
Multivariate StatisticalAnalysis
Create Wellbore andStage Intervals
Correct for Variabilityin Completions
Create ProductionMetrics
Engineering“Best Practices”
Drilling OptimizationAnalysis
Well Completion Analysis
Create Prospectivityand Probability Maps
Build 3-D ProductionPrediction Models
Deviation Surveys, PerfLocations, Stage Data,Production Data andCompletion Data
FIGURE 1
Generic Well Prospectivity and Productivity Analysis Workflow
The “Better Business” Publication Serving the Exploration / Drilling / Production Industry
MARCH 2016
Reproduced for Global Geophysical Services with permission from The American Oil & Gas Reporter
www.aogr.com
box in the lower right) plays such acritical role in integrating geological andgeophysical data (green boxes) with en-gineering data (yellow boxes).
The first step is to load and qualitycontrol all the available well informationneeded for production modeling. Primarywell data typically consists of well logsfor geologic interpretation and petrophys-ical analysis, wells with velocity controlfor seismic interpretation and velocitymodeling, and horizontal wells with pro-duction and completion data. Followingthe QC (quality control) of the well in-formation, a rigorous interpretation ofthe formation tops is performed, makingsure the markers are consistently pickedat each well.
After defining reservoir zones and sur-rounding formations, the seismic is tiedto the wells using available sonic infor-mation. If sonic data are not available,either sonic or density can be estimatedfrom the petrophysics. Obtaining accuratewell-ties is essential to further analysis,since any errors that occur at this stagewill propagate, causing significant prob-lems later in the workflow.
Following well-ties and error analysis,formation tops, seismic time interpreta-tions, and well velocity control are inte-grated to build the velocity model. Inparallel, a large number of both post-stack and prestack seismic attributes arecomputed. Finally, the integrated velocity
model is used to convert all seismic in-terpretations and attributes from time todepth.
The first step on the engineering sideof the workflow is to load and QC all rel-evant deviation surveys, perforation loca-tions, stages, completion and productiondata. Stage and completion informationis used to define productive zones for in-tegrating with the geoscience data.
The initial step in integrating the geo-science and engineering data is to extract3-D seismic attributes along each wellboreat or near the stage locations using a sta-tistical sampling method. Next, the ex-tracted attributes are correlated with arange of production metrics, completiondata and well data to determine the degreeto which variables are correlated. Thisalso allows the interpreter to understandthe individual relationships each variablehas with production and what type oftransformation may be needed in the mul-tivariate analysis.
The goal for this stage is to leveragethe integration, allowing the statistics tohighlight the meaning of various rela-tionships between production and seismicattributes. The result of multivariate analy-sis is to identify the KPIs and determinethe optimal transformation required foreach attribute. Finally, the KPIs are com-bined to create a 3-D seismically-calibratedpredictive model and maps of production(or indeed any other response metric).
Based on the input data available, theprocess also can determine engineeringbest practices, and can facilitate additionalsteps to validate the models.
The integrated WPPA workflow can
be repeated and the models can be carriedforward throughout the life of a particularreservoir or field to identify ideal landingpoints for laterals and completion zonesto optimize production.
Permian Basin Application
To demonstrate the potential value ofmultivariate analysis and WPPA tech-nologies, the integrated workflow wasapplied to predict cumulative productionin the Wolfcamp formation in West Texasusing a unique dataset consisting of amulticlient 3-D seismic survey and publicwell and completion data. The objectivewas to determine if the success of pro-duction models created with multivariateanalysis and WPPA for more detailedprojects elsewhere within the basin andin other unconventional plays could bereproduced using these data inputs.
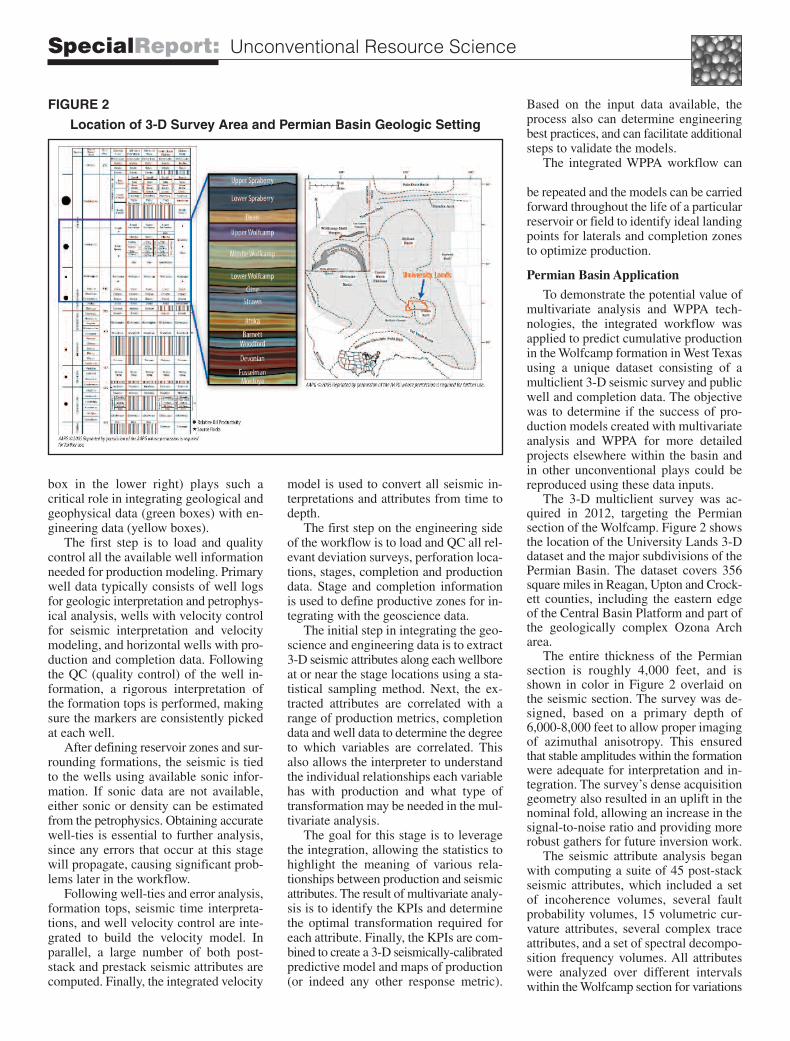
The 3-D multiclient survey was ac-quired in 2012, targeting the Permiansection of the Wolfcamp. Figure 2 showsthe location of the University Lands 3-Ddataset and the major subdivisions of thePermian Basin. The dataset covers 356square miles in Reagan, Upton and Crock-ett counties, including the eastern edgeof the Central Basin Platform and part ofthe geologically complex Ozona Archarea.
The entire thickness of the Permiansection is roughly 4,000 feet, and isshown in color in Figure 2 overlaid onthe seismic section. The survey was de-signed, based on a primary depth of6,000-8,000 feet to allow proper imagingof azimuthal anisotropy. This ensuredthat stable amplitudes within the formationwere adequate for interpretation and in-tegration. The survey’s dense acquisitiongeometry also resulted in an uplift in thenominal fold, allowing an increase in thesignal-to-noise ratio and providing morerobust gathers for future inversion work.
The seismic attribute analysis beganwith computing a suite of 45 post-stackseismic attributes, which included a setof incoherence volumes, several faultprobability volumes, 15 volumetric cur-vature attributes, several complex traceattributes, and a set of spectral decompo-sition frequency volumes. All attributeswere analyzed over different intervalswithin the Wolfcamp section for variations
FIGURE 2
Location of 3-D Survey Area and Permian Basin Geologic Setting
SpecialReport: Unconventional Resource Science

in stratigraphy, thickness, faulting andfracturing, fluid and lateral facies.
From an analytics standpoint, eventhough the interpreter may be interestedonly in the reservoir surrounding the pro-ducing wells, it is also important to un-derstand how adjacent formations mayimpact reservoir properties and conditions,and how the seismic data may respond tothese changes. Therefore, all seismic at-tributes also were extracted and analyzedover other horizons and intervals to seehow they varied laterally across the Uni-versity Lands dataset.
The next step was integrating the seis-mic with the well data used for the mod-eling, which consisted of 21 horizontalwells in the Wolfcamp with productiondata and limited completion information.In addition, 25 other producing wellswere left out of the analysis, reservingthem for blind testing to validate or revisepredications later. A single horizontalsection was created for the 21 input wells,and defined both the completion intervaland the interval for the well-to-seismicextractions.
Formation tops and the correspondingtime horizons were used with well ve-locities from two wells to convert allseismic attributes and horizons to depth.The depth-converted seismic attributesthen were sampled along the target com-pletion interval and averaged for the nextstage of analysis.
The geoscience/engineering integrationincluded individually correlating each at-
tribute with various production metricsto determine the best response or predictorvariable for multivariate analysis. We alsoevaluated how changing these productionmetrics over time affected the correlationswith each attribute. Based on strong linearand nonlinear correlations, three-monthoil production scaled per foot of completionlength was selected as the variable to pre-dict. Using a nonlinear multivariate re-gression method, we identified three pri-mary performance indicators out of awide range of attributes, and tested various
transformations of each one.
Key Performance Indicators
The most important KPIs driving thestatistical predictions of three-month oilper foot, along with the reservoir propertiesor conditions they represented, were:
• Root mean square curvature anddip curvature, by themselves, were nothighly correlated with cumulative pro-duction. However, combined with othervariables, they made a significant contri-bution to well performance. This indicatedthat structural features associated withfaulting and fracturing, seals and migrationpathways were impacting production.
• Relative amplitude change and 24-28 hertz spectral decomposition frequencyvolumes, were used interchangeably, sincerelative amplitude change had a highlinear relationship with midfrequencyvolumes. The lower values of relativeamplitude change indicated an increasein both water and oil production, whichwas verified with hydrocarbon and watersaturation logs in several wells acrossthe field. Significantly higher fractureporosity in these zones of higher fluidsaturation also was noticed.
• 10-14 Hz spectral decompositionattributes correlated with both total organiccarbon and the brittle/ductile quality thatwas calculated at several wells. Correla-tions of nine-month gas production versuslow-frequency volumes also supportedthis relationship. As the 10-14 Hz com-ponent increased, so did both gas pro-
SpecialReport: Unconventional Resource Science
FIGURE 3
Predicted versus Actual Production for 21 Input Wells (Left) And Predicted Input and Blind Wells versus Actual Production (Right)
FIGURE 4
Arbitrary Cross-Section through Six Vertical Wells With Single-Zone Completions

duction and TOC.Next, these top performance drivers
were modeled to production using theoptimal transformations for each, whichthen were summed to form the productionprediction for various models. Using nomore than three seismic attributes foreach model, three unique 3-D models ofthree-month oil per foot were generated.The same extraction parameters wereused to extract the predictions along eachwellbore. The average correlation coeffi-cient between actual versus predictedproduction for the three models was 92percent for the 21 input wells (left panelin Figure 3).
To test how effectively the modelcould predict cumulative production per-formance, the 25 producing wells thathad been excluded from the modelingworkflow were introduced. Adding actualversus predicted production from 17 blindhorizontal wells and eight blind verticalwells with single-zone completions tothe 21 input wells achieved a correlationcoefficient of 83 percent (right panel inFigure 3). Looking only at the eightvertical wells, the model showed a 90percent correlation between predictedand actual production. These high corre-lations demonstrate the predictive powerof multivariate statistical analysis and theimpact it can have on unconventionalfield development.
Refrac Candidate Wells
The decision then was made to examinethe possibility of refracturing some or allof the vertical wells in specific zoneswhere the model indicated high production
potential. This was accomplished by com-paring the ratio of production from theentire Wolfcamp zone with productionextracted at the actual perforation locations.According to the analysis, three of theeight vertical wells with single-zone com-pletions had potential zones of high pro-duction not accessed by the original com-pletions.
Figure 4 displays an arbitrary cross-section through six of the eight verticalwells. The log displayed in color is theextracted production model along thevertical wells. The red disks show theactual completion interval for these wells.Wells 1, 3 and 4 (highlighted in yellow)have the highest probability for refracsuccess.
Looking at the models in 3-D showedhow much lateral variability existed be-tween these wells in the target interval.Figure 5 shows an arbitrary line throughvertical wells 1, 3 and 6 from Figure 4.Note the lateral variations of the pro-duction prediction model. The seismicin the background is co-rendered withthe fault probability, with the productionribbon displayed in color over the reservoirzone.
The best vertical producer in the surveyarea–well 6 shown at the left in Figures4 and 5–had 10,700 barrels of actual pro-duction over three months versus a pre-dicted production of 10,900 barrels (98percent accurate). Well 3 had 2,090 barrelsof actual versus 2,300 barrels of predictedproduction.
Well 1 was one of the poorer per-formers. It produced 101 barrels, and its
predicted production was roughly thesame. However, wells 1 and 3 have thehighest probability for refracturing successbecause the completions in both wellsmissed the sweet spot revealed by multi-variate analysis and predictive modeling.Targeting these zones, each well shouldbe able to generate three-month productionvalues of about 10,000 barrels. It shouldbe remembered that neither of these wellswas used in the initial modeling.
This Permian Basin case study clearlydemonstrates the potential value of usingWPPA workflows to improve well plan-ning, optimize completions, and enhancerecovery, even without a full suite ofdata.
The productivity of any well is a func-tion of the interplay among many staticand dynamic characteristics that requirean integrated, multivariable solution. TheWPPA workflow represents a sophisticatedmultidisciplinary integration of the geo-physical, geological and engineering data.By combining numerous diverse sets ofdata, geoscientists and engineers canidentify the specific attributes essentialto hydrocarbon production in a particularreservoir. Not only can they generatequantitative estimates of the values thatimpact production, but they also can iden-tify the most prospective areas for drilling.Properly applied, this workflow can reduce
CHADBAILLIE
Chad Baillie is a lead reservoirgeophysicist at Global GeophysicalServices. Prior to joining the companyin 2012, he worked as a geophysicistat Prism Seismic/Sigma3. Baillie hasextensive experience in interdisciplinaryreservoir characterization and inter-pretation, and his areas of expertiseinclude multivariate statistics by in-tegrating 3-D seismic attributes, rockmechanics, microseismic, engineeringand geological data to optimize com-pletion and well performance. Heholds a B.S. in geophysics from theColorado School of Mines.
SpecialReport: Unconventional Resource Science
Arbitrary Line through Three Vertical Wells Showing Lateral Variations in Predicted Production
FIGURE 5

drilling risk significantly and improvedrilling programs.
The Wolfcamp case study emphasizesthe value that multivariate statistical analy-sis of 3-D seismic, well and engineeringdata can bring to unconventional reservoirs.The 3-D seismic attributes applied in thePermian Basin can predict well perform-ance down to the stage level.
Similar results have been obtained insuccessful projects in both conventionaland unconventional reservoirs acrossNorth America. Results achieved in thefield have proven that WPPA models canhigh-grade prospective drilling areas, en-hance well planning and geosteering, op-timize completion placement and fracdesign, and boost the estimated ultimate
recoveries of individual wells. �
Editor’s Note: The author acknowl-edges Global Geophysical colleagues Ro-hit Singh, a petroleum engineer, andLeszek Bednarski, a petrophysicist/geol-ogist, for their contributions to the Wolf-camp modeling project.
SpecialReport: Unconventional Resource Science