modeling project
DESCRIPTION
Modeling Project. by. Danielle Rouleau. May 7, 2002. “Bad” Ozone Formation. Urban or photochemical smog. O 2 + O O 3. VOCs + NOx + sunlight smog. VOCs or hydrocarbons: solvents, fuels, chemicals. NOx: fossil fuels. Health Concerns. Irritant. Respiratory Problems. - PowerPoint PPT PresentationTRANSCRIPT

Modeling Project
by
Danielle Rouleau
May 7, 2002

“Bad” Ozone Formation
Urban or photochemical smogO2 + O O3
VOCs + NOx + sunlight smog
VOCs or hydrocarbons: solvents, fuels, chemicals
NOx: fossil fuels
Sources of NOx emissions
20%
51%
17%
12%industrial
automotive
gas pow ered law nequipment, aircraft,locomotives
gas stations
Sources of VOC Emissions
8%
31%
11%
50%
industrial
automotive
gas pow eredlaw n equipment,aircraft,locomotivesgas stations

Health Concerns
Irritant
Respiratory Problems
More problematic for elderly & children
Headaches
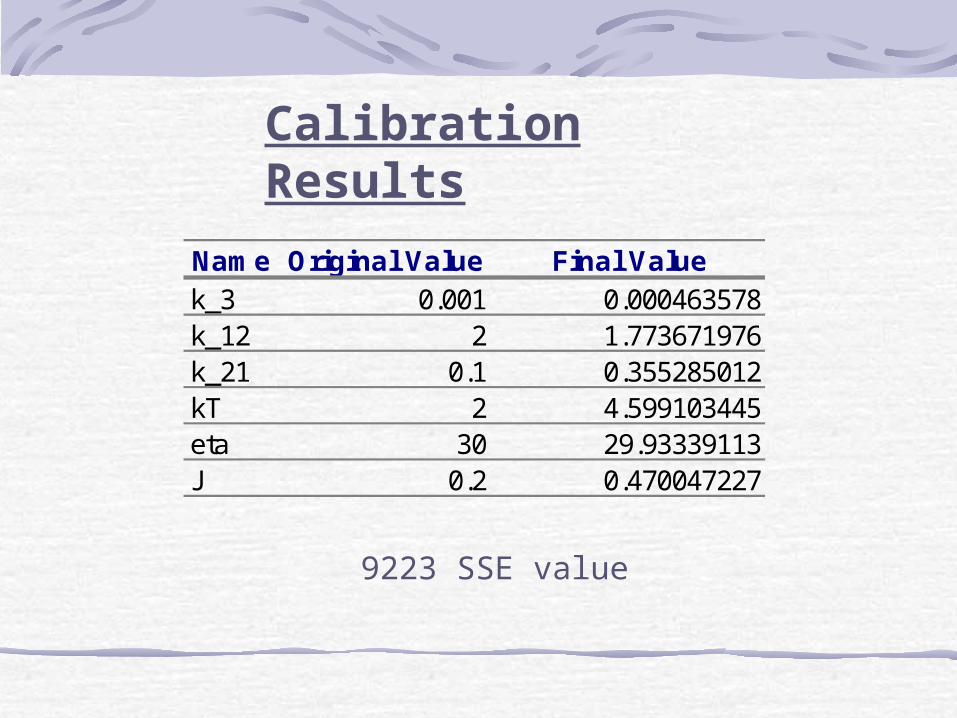
Name Original Value Final Valuek_3 0.001 0.000463578k_12 2 1.773671976k_21 0.1 0.355285012kT 2 4.599103445eta 30 29.93339113J 0.2 0.470047227
Calibration Results
9223 SSE value
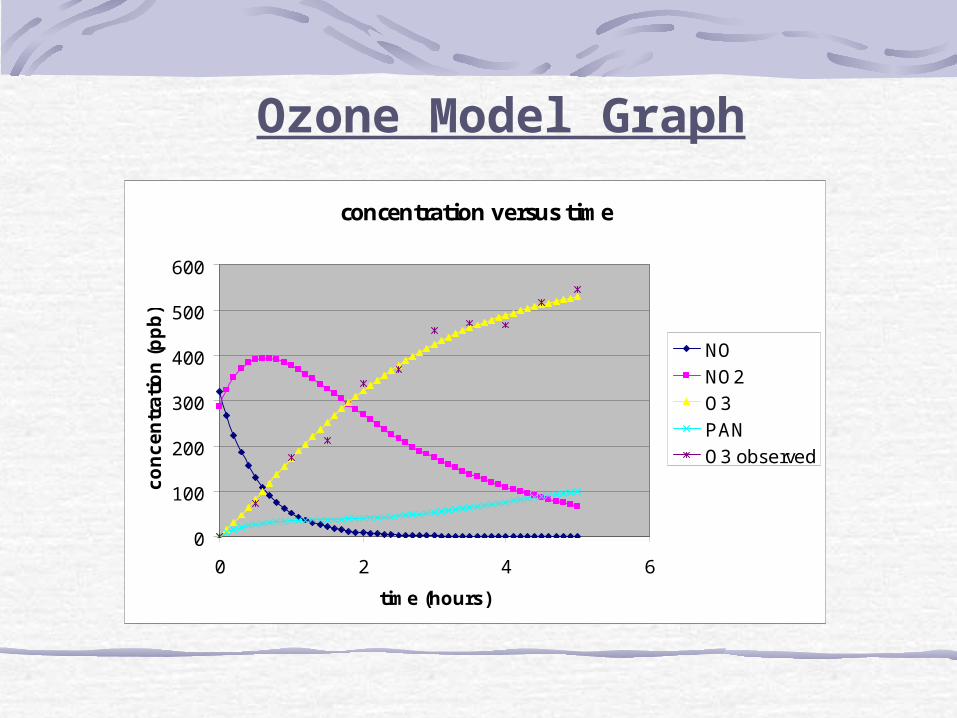
concentration versus time
0
100
200
300
400
500
600
0 2 4 6
time (hours)
co
nc
en
tra
tio
n (
pp
b)
NO
NO2
O3
PAN
O3 observed
Ozone Model Graph

probability distribution
0
0.02
0.04
0.06
20 30 40 50 60 70 80 90
100
110
120
130
140
150
160
170
180
190
200
AQI
prob
abili
ty
St. Louis AQI Probability Distribution

probability of AQI falling within each Health Condition
00.10.20.30.40.50.6
Good 0-50
Moderate51-100
Unhealthyfor some101-150
Unhealthy+151
percent
St. Louis AQI Probability Distribution

How to Model AQI for Distant Locations
Meteorological: temperature, precipitation, pressure
Wind: speed and direction
Topography variations between the locations
Dispersion equations