modeling the behaviour of new zealand steel connections in
TRANSCRIPT
1
Modeling the Behaviour of New Zealand
Steel Connections in Fire
Submitted By
Hao Yang (Raymond) Qiu
Supervised by:
Dr Anthony K. Abu
Associate Professor G. Charles Clifton
This thesis is submitted in partial fulfillment of the requirements for the degree of Master of
Engineering in Fire Engineering
Department of Civil and Natural Resources Engineering
University of Canterbury
Private Bag 4800
Christchurch, New Zealand
i
Abstract
The performance of steel connections are critical in the overall survivability of a building in the
event of a fire, as highlighted by previous accidental fires in multistorey buildings and also by
large scale tests. Although studies on the behavior of steel connections have been conducted
overseas, particularly in Europe and the U.K., a lack of understanding on the behavior of New
Zealand connections currently exists. At present, the New Zealand connections are expected to
perform better in fire conditions than their European equivalents due to their design for ductility
in severe earthquakes.
The researched reported herein investigates this assumption through the use of the non-linear finite
element analysis, using a software called ABAQUS. The analytical packages within the program
were firstly explored and validated through modelling of previously conducted experimental tests,
in particular an isolated web side plate (also known as fin plate) connection and a flexible endplate
connection.
Following the modelling of previously conducted experimental tests, one of the connections of the
large scale test at the Cardington laboratories in 2001 was redesigned using flexible endplate and
web side plate connections in accordance with current design recommendations from New Zealand
and the U.K. The behavior of these connections were then analyzed and compared to determine
their differences in performance.
The finite element models of the designed flexible endplate connections indicate although that they
are both able to largely maintain structural integrity when exposed to extreme fire conditions, the
New Zealand design performed comparatively better as a result of its increased ductility provisions
through the differences in detailing.

ii
On the other hand, the web side plate connections designed using the recommendations of the New
Zealand and U.K. design guides resulted in largely similar designs. Based on this, the performance
between the two web side plate connections are expected to be largely similar in an event of a fire.
iii
Acknowledgements
I would like to express my most sincere gratitude to my supervisors, Dr. Anthony Abu and
Associate Professor G. Charles Clifton for their encouragement, guidance and countless hours of
support during this study. Their passion and insight in structural fire engineering have played a
significant role in helping me undertake this research within the allocated timeframe for which I
am truly grateful. Being able to have them as supervisors has been a privilege.
I would like to extend my gratitude to Kinglsey Ukanwa for his invaluable help with the use of the
finite element software ABAQUS at the initial stages of my study which was instrumental in the
development of the models presented herein.
A special thanks to the Department of Civil Engineering at the University of Canterbury which
has provided me with a suitable environment to carry out this research. In particular, I would like
to acknowledge Olive Dalton and Leigh Davidson for their endless commitment to helping
students such as myself with the set-up of computer systems and administrative tasks.
I would like to thank Fire and Emergency NZ, Arup, SFPE and Olsson Fire and Risk for their
financial support throughout my Master’s degree, and their continued support of the Fire
Engineering program at the University of Canterbury.
Finally, I would like to thank my parents, brother, and friends for their patience, encouragement,
and support without which this study would not be possible. They have been my inspiration to
undertake my Masters’ degree, and I dedicate this work to them.
iv
Table of Contents
Abstract ............................................................................................................................................ i
Acknowledgements ........................................................................................................................ iii
Table of Contents ........................................................................................................................... iv
List of Figures .............................................................................................................................. viii
List of Tables ................................................................................................................................ xii
1 Introduction ............................................................................................................................. 1
1.1 Background ..................................................................................................................... 1
1.2 Behaviour of Steel Connections in Fires ........................................................................ 4
1.3 Objectives ....................................................................................................................... 8
2 Literature Review .................................................................................................................... 9
2.1 Design of Steel Connections in New Zealand .............................................................. 11
2.1.1 New Zealand Design Philosophy .............................................................................. 12
2.2 Design of New Zealand Connections in Fire ................................................................ 14
2.3 Properties of Steel at Elevated Temperature ................................................................. 15
2.3.1 Eurocode 3: Part 1-2 and BS 5950 Part 8 ................................................................. 16
2.3.2 New Zealand Standards ............................................................................................ 19
2.4 Differences in Simple Connection Design between Europe and New Zealand ............ 21
2.4.1 Web side plate connections ....................................................................................... 22
2.4.2 Flexible endplate connections ................................................................................... 25
v
2.5 Investigation of the behaviour of steel connections in fire ........................................... 27
2.5.1 Experimental investigations ...................................................................................... 27
2.5.2 Analytical Investigations .......................................................................................... 36
2.6 Research Approach ....................................................................................................... 39
3 Development of Finite Element Models ................................................................................ 41
3.1 Recreation of Isolated Fin-Plate Connections ............................................................... 43
3.1.1 Model Assembly ....................................................................................................... 44
3.1.2 Modelling Package.................................................................................................... 45
3.1.3 Finite Element Library .............................................................................................. 47
3.1.4 Contact Modeling...................................................................................................... 48
3.1.5 Material Properties .................................................................................................... 49
3.1.6 Boundary Conditions and Loading ........................................................................... 50
3.1.7 Modelling Results of Ambient Temperature Tests ................................................... 51
3.1.8 Tests at Steady State Temperatures .......................................................................... 57
4 Development of Finite Element Models for Cardington Test 7 ............................................ 60
4.1.1 Finite element model description .............................................................................. 62
4.1.2 Heat Transfer Model ................................................................................................. 63
4.1.3 Mechanical Model .................................................................................................... 70
5 Modelling the Behaviour of New Zealand Flexible Endplate Connections .......................... 90
5.1 Design of Flexible Endplate Connections..................................................................... 90
vi
5.2 Design of Flexible Endplate Connections..................................................................... 91
5.3 Flexible Endplate Modelling Scenarios ........................................................................ 96
5.4 Finite Element Models .................................................................................................. 97
5.5 Results and Discussion ................................................................................................. 98
5.5.1 Heat Transfer ............................................................................................................ 98
5.5.2 Subassembly Behaviour ............................................................................................ 99
5.5.3 Stiffness and Ductility of Endplates ....................................................................... 102
5.5.4 Bolt Behaviour ........................................................................................................ 115
6 Analysis of New Zealand Fin Plate Connection Designs .................................................... 118
7 Conclusion and Recommendations ..................................................................................... 125
7.1 Conclusions ................................................................................................................. 125
7.2 Recommendations for Further Research ..................................................................... 127
8 References ........................................................................................................................... 128
Appendix A – Flexible Endplate Calculations ............................................................................ 138
FE1 – New Zealand Design (SCNZ, 2008a) ........................................................................... 138
FE4 – U.K. Design (SCI, 2014) .............................................................................................. 139
Appendix B – Web Side Plate Calculations ............................................................................... 140
New Zealand Design (SCNZ, 2008a) ..................................................................................... 140
U.K. Design (SCI, 2014) ......................................................................................................... 141

vii
viii
List of Figures
Figure 1-1 Fracture of an end plate in the Cardington test (Al-Jabri, 1999) .................................. 5
Figure 1-2 Recovered connection sample from WTC5 (LaMalva, 2007) ...................................... 6
Figure 1-3 Failed connections in WTC5 (FEMA, 2002) ................................................................ 6
Figure 2-1 Axial force in axially restrained composite beam (Wang et al., 2012) ....................... 10
Figure 2-2 Reduction factors for carbon steels and bolts at elevated temperatures in EC3
(European Committee for Standardization, 2005a) ...................................................................... 18
Figure 2-3 Stress-strain curves for S275 steel at elevated temperatures determined by EC3
(European Committee for Standardization, 2005a) ...................................................................... 18
Figure 2-4 Carbon steel reduction factors (European Committee for Standardization, 2005a; New
Zealand Standards Institute, 1997) ............................................................................................... 21
Figure 2-5 Fin plate connection (SCNZ, 2008a) .......................................................................... 24
Figure 2-6 Yield of bolt holes (Murray and Butterworth, 1990) .................................................. 24
Figure 2-7 Capacity testing of flexible end plate connections (Hyland, 2003) ............................ 26
Figure 2-8 Test building in the Cardington test (Moss and Charles Clifton, 2004) ..................... 29
Figure 2-9 Cardington test floor plan and fire compartment for Test 7........................................ 30
Figure 2-10 Deformation of structural elements (Al-Jabri et al., 2007) ....................................... 32
Figure 2-11 Fin plate connection after test (Al-Jabri et al., 2007) ................................................ 32
Figure 2-12 Isolated connection test set up (Yu et al., 2009a) ..................................................... 33
Figure 2-13 Test set up (Wang, Dai, and Bailey, 2011) ............................................................... 35
Figure 3-1 Fin plate connection design (Yu et al., 2009a)............................................................ 44
Figure 3-2 Modelled fin plate connection assembly ..................................................................... 45
Figure 3-3 Fin Plate results at 35o loading and at ambient temperature ....................................... 52
ix
Figure 3-4 Contact between beam and column ............................................................................. 53
Figure 3-5 Deformation of bolt holes in beam web ...................................................................... 54
Figure 3-6 Lateral deformation of fin plates to allow for increased rotation ................................ 55
Figure 3-7 Lateral deformation of beam web and failure of bolts ................................................ 55
Figure 3-8 Fin Plate results at 55o loading .................................................................................... 57
Figure 3-9 Numerical analysis with loading at 55 degrees ........................................................... 57
Figure 3-10 Strength of steel when subject to loading at steady state and transient temperatures
(European Committee for Standardization, 2005a; Renner, 2005) ............................................... 59
Figure 4-1 Cardington fire test layout (Wald et al., 2005) ............................................................ 60
Figure 4-2 Average compartment temperature (BRE, 2004) ........................................................ 61
Figure 4-3 Placement of thermocouples ....................................................................................... 61
Figure 4-4 Fracture of endplate during cooling phase of the fire (Al-Jabri et al., 2007) .............. 62
Figure 4-5 Flexible endplate detail (left) and finite element assembly (right) ............................. 64
Figure 4-6 Model of Cardington sub assembly............................................................................. 65
Figure 4-7 Specific heat (left) and thermal conductivity (right) of carbon steels with respect to
temperature (European Committee for Standardization, 2005a) .................................................. 66
Figure 4-8 Material property input for concrete (European Committee for Standardization,
2005b) ........................................................................................................................................... 67
Figure 4-9 Temperatures in steel beam ......................................................................................... 69
Figure 4-10 Temperatures at the connection ................................................................................ 69
Figure 4-11 Heat transfer model at 56 minutes ............................................................................ 70
Figure 4-12 Interaction between steel beam and concrete slab .................................................... 73
Figure 4-13 Experimental and modelled vertical deflection of the D2-D1 beam ......................... 76
x
Figure 4-14 Cracks in the concrete slab at the Cardington experiment (Wald et. al, 2005) ......... 77
Figure 4-15 Axial force in the beam due to thermal effects ......................................................... 79
Figure 4-16 Contact between the beam and column at 23 minutes .............................................. 80
Figure 4-17 Yielding of flexible end plate. Left: Cardington experiment (Borges, 2003). Right:
Finite element analysis .................................................................................................................. 81
Figure 4-18 View of connection from below. ............................................................................... 81
Figure 4-19 Fracture of flexible endplate and yielding of bottom flange. .................................... 82
Figure 4-20 Deflection of floor slab (Wald et al., 2005) .............................................................. 83
Figure 4-21 Bearing into endplate during heating ........................................................................ 84
Figure 4-22 Strain along depth of endplate during cooling .......................................................... 85
Figure 4-23 Strain along base of the endplate during cooling ...................................................... 88
Figure 4-24 Strain contour along the base of the endplate at failure ............................................ 89
Figure 5-1 Flexible endplate connection (SCNZ, 2008a) ............................................................. 92
Figure 5-2 Model with flexible endplate connection .................................................................... 98
Figure 5-3 Temperatures of subassembly components ................................................................. 99
Figure 5-4 Axial forces in the beam modelled in FE1 ................................................................ 101
Figure 5-5 Strains experienced at the base of each endplate ...................................................... 104
Figure 5-6 Out-of-plane displacement at the base of each endplate ........................................... 106
Figure 5-7 Strain along depth of endplates FE1 and FE4 during cooling .................................. 107
Figure 5-8 Out-of-plane stresses along depth of endplates FE1 and FE4 cooling...................... 110
Figure 5-9 Strain along the base of endplates FE1 and FE4 during cooling .............................. 112
Figure 5-10 Stress along the base of endplates FE1 and FE4 during cooling ............................ 113
Figure 5-11 Stress contour plot at the base of the endplate in FE4 ............................................ 115

xi
Figure 5-12 Tensile stress time history of bolts in FE1 due to prying action ............................. 116
Figure 5-13 Tensile stress time history of bolts in FE4 due to prying action ............................. 116
Figure 6-1 Fin plate connection (SCNZ, 2008a) ........................................................................ 118
xii
List of Tables
Table 3-1 Ambient Temperature Material Properties ................................................................... 49
Table 4-1 Material properties ........................................................................................................ 72
Table 4-2 Boundary Conditions .................................................................................................... 74
Table 4-3 Strain contour of the endplate at different temperatures during cooling ...................... 87
Table 5-1 Flexible endplate designs ............................................................................................. 93
Table 5-2 Flexible endplate modelling scenarios ......................................................................... 97
Table 5-3 Endplate models ........................................................................................................... 98
Table 5-4 Strain contours at the conclusion of each model ........................................................ 102
Table 5-5 Deformation of the FE4 endplate during cooling ....................................................... 109
Table 5-6 Stress contour plots along the width of the FE1 endplate during cooling .................. 114
Table 6-1 Fin plate designs ......................................................................................................... 120
1
1 Introduction
1.1 Background
Due to having structural properties including high strength and ductility, steel is widely accepted
as a globally popular construction material for high rise buildings. Compared to concrete, steel has
significant advantages such as quicker erection time, long spans, adaptability, and is generally
more aesthetically pleasing (Al-Jabri, 1999). However the structural properties of steel are highly
affected by exposure to fire which causes a reduction in strength and stiffness, leading to
deformation and potential collapse (Buchanan and Abu, 2017). This phenomenon has resulted in
a need to understand the behaviour of structural steel elements, providing the motivation of
research into this particular field which began in the late nineteenth century (Lin, 2014). At that
time, research was focused on inventing new methods and materials which could be used to protect
steel members from fire in order to delay its rise in temperature and decrease in strength for
particular periods of time. This led to the development of different forms of applied steel protection
including the use of: concrete encasement, gypsum boards, sprayed concrete and intumescent paint
(Buchanan and Abu, 2017). Although these protection methods have proven to be effective against
fire, they often neutralize the advantages of steel construction as they have been reported to
increase construction costs by up to 30% (El-Rimawi, 1989) as well as causing time delays due to
their installation (Dowling, 1997). More significantly, some aspects of the unprotected structure
such as the composite floor systems may have high inherent resistance to fire and need not to be
protected.
To combat the negative aspects of using protection materials, the recent approach for structural
fire engineering design in buildings has been to design as many unprotected structural steel
members as possible to be able to withstand loads under both ambient and elevated temperatures,
2
rather than protecting all exposed steel members which would typically have only been designed
for ambient temperature loads. As a result, steel framed buildings are commonly designed to
comprise of a mix between protected and unprotected members, decreasing the costs associated
with applying the necessary protection mechanisms to steel by approximately half since the early
1980’s (Robinson, 1998). To accommodate this approach effectively, a deeper understanding of
the behaviour and strength limits of steel is required, expediting the research and development of
new methods for engineering analysis and design of steel members in fire. To date, although the
current knowledge on the performance of steel framing members in fire is well documented for
Standard Fire test conditions and reasonably well documented for performance in a structural
system, there has been much less research into the performance of steel connections in fire.
The historic lack of research in the field of the performance of connections in fire may be a result
of its relative complexity and the assumption that that current connection designs are robust
enough to withstand elevated temperatures, due to the consideration that they are fixed and are
only designed to withstand comparatively simple bending and shear forces (Wang et al., 2010).
Another significant reason lies in the Standard Fire Testing basis of establishing structural element
performance; these tests cover beams, columns and walls but not connections. However, the
importance of understanding the performance of steel connections in fire was demonstrated
through the observed damage of the Broadgate Phase 8 fire and the structural collapse of the World
Trade Center disaster (WTC 1), where it was exemplified that the ability of the connections in
redistributing forces has a large impact on the survival duration of the overall structure in fire
conditions (Al-Jabri, 1999; Steel Construction Institute, 1991). This was contradictory to the
earlier belief that steel connections need not be considered in structural fire design due to an
3
expectation of their ability to sustain structural integrity under elevated temperature conditions,
resulting in research being undertaken in order to better understand the phenomenon.
Although some research has been conducted in recent years to better understand the performance
of beam-to-column connections in fire, the studies undertaken on this topic have been undertaken
in areas of low seismic activity – namely in Europe and the United Kingdom. Thus, the studies
focus on steel connections designed and detailed to resist moment, shear, and axial forces which
were not required to be designed to structurally sustain earthquake-induced loading in accordance
with the local structural design standards (Booth et al., 1998). In New Zealand, steel beam-to-
column connections are designed and detailed to be able to resist seismic loads due to earthquakes
as required by local structural design standards (New Zealand Standards Institute, 1997).
Based on this, it is expected that the design and detailing of connections to resist seismic forces
leads to an improved robustness in fire conditions. However, it is currently unknown at this stage
whether the New Zealand connections are able to perform sufficiently in a real fire due to the
current lack of research surrounding this particular topic. In accordance with the current steel
structures standard, NZS3404 (New Zealand Standards Institute, 1997), there is a lack of guidance
for the specific design of steel connections in fire, where Clause 11.10.1.1 attempts to addresses
this by stating that connections are to be protected with the maximum thickness of fire protection
material used for other members in the frame. Although this method will be for use in limiting the
temperature of the components in the connection, it does not account of the effects of additional
rotation as well as tension and compression forces which are applied as a result of the expansion
and contraction of connecting members during a fire as explained in Section 2 of this study. As a
result, this highlights the lack of guidance on the structural fire design for connections in current
New Zealand design approaches.
4
This study examines the viability of current New Zealand design standards for simple steel
connections through modelling their performance in fire conditions using the Finite-Element-
Modelling software ABAQUS. In particular, the study examines the performance of New Zealand
web side plate connections and flexible end plate connections - otherwise known as fin plate and
partial depth endplate connections in the U.K., due to their common use and differences in
withstanding forces induced by shear and moment.
Therefore, the research described herein is intended to provide information and knowledge about
the performance of these connections in fire and will be the first step in developing a distinct new
area of research in New Zealand on steel connections in fire which will ultimately provide specific
design provisions for these connections in fire conditions.
1.2 Behaviour of Steel Connections in Fires
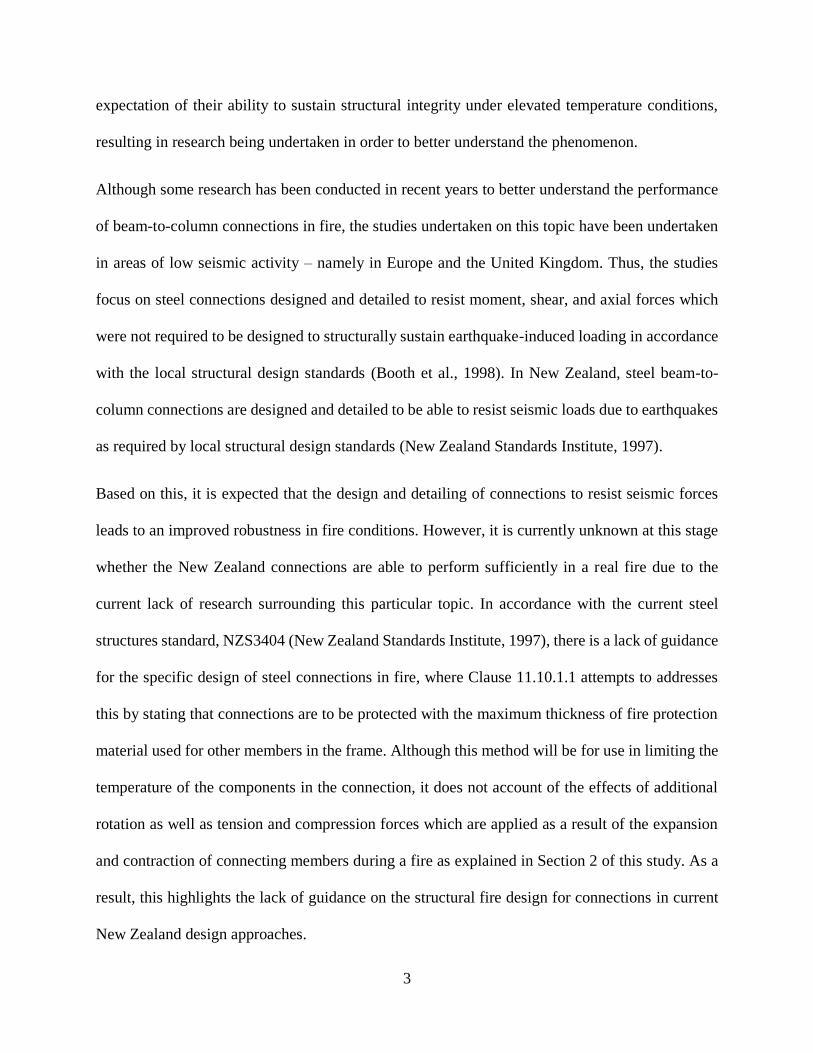
In the Broadgate Phase 8 incident on June 23rd 1990, a major fire occurred on the ground floor of
a 14th storey building during its final stages of construction, causing structural damage to the steel
frame (Al-Jabri, 1999). Despite the steel beams and connections being protected by intumescent
paint, two steel flexible end plate connections above the fire failed as a result of tensile forces
exerted by the connecting beam upon cooling, where two bolts fractured in one connection while
the end plate fractured in the other. The failure modes encompassing fracture of the endplate were
also observed in the Cardington fire tests shown in Figure 1-1.
5
Figure 1-1 Fracture of an end plate in the Cardington test (Al-Jabri, 1999)
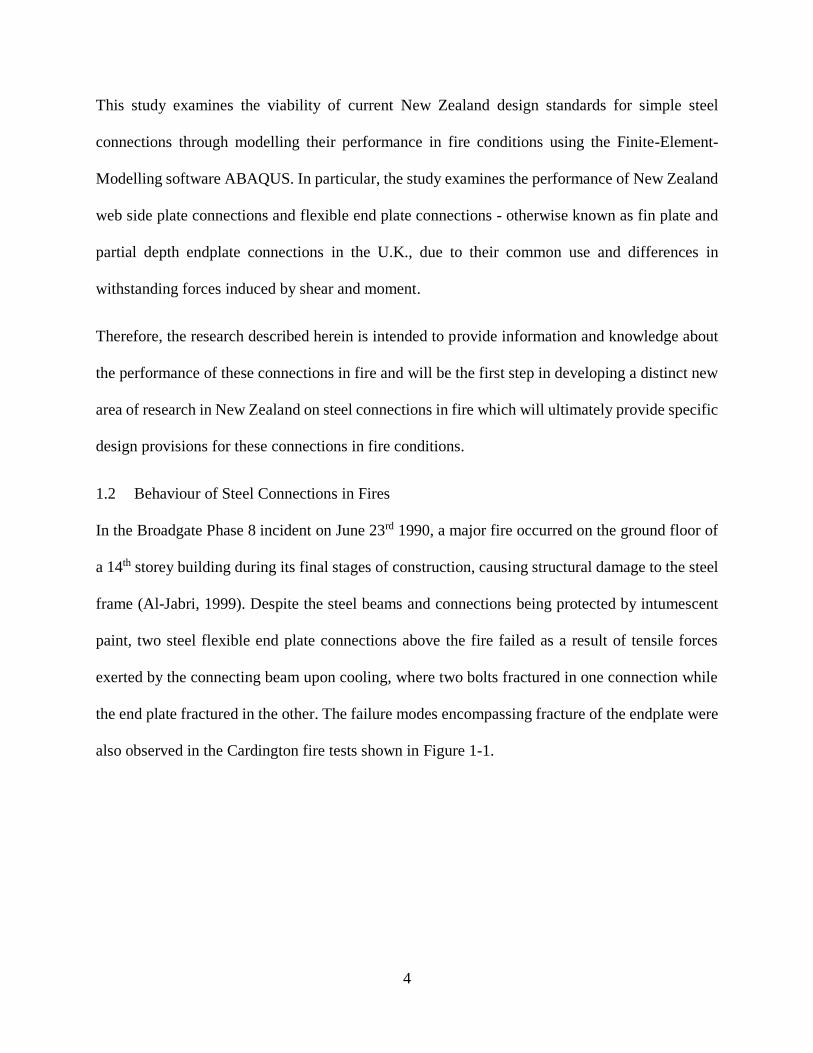
On the other hand, the World Trade Center 5 (WTC 5) was a 9-storey office and retail building
which experienced structural collapse as a result of failure due to fire conditions. The incident
occurred on September 11, 2001 in New York City, where the 9-storey office and retail building
was subjected to a fire caused by flaming debris falling from WTC 1, ultimately causing it to
undergo a progressive collapse from the 8th floor to the 4th floor (LaMalva, 2007). As opposed to
the connections in the Broadgate Phase 8 incident which failed during cooling, it was determined
that plate connections in WTC 5 were reported to have failed during the heating phase where
stresses caused by thermal expansion and deflection of connecting girders causes them to deflect
and place large amounts of stress onto the top bolt holes in a central beam to girder connection
(LaMalva, 2007). Approximately two hours after the fire started, the top bolts ruptured under the
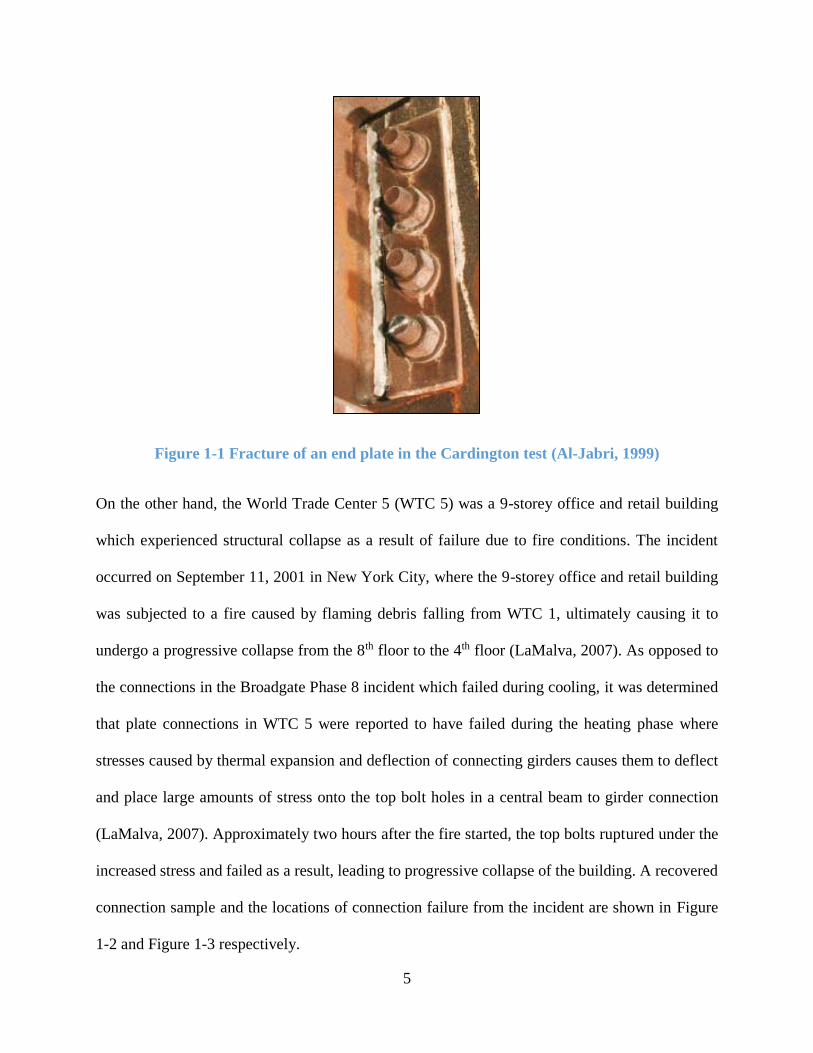
increased stress and failed as a result, leading to progressive collapse of the building. A recovered
connection sample and the locations of connection failure from the incident are shown in Figure
1-2 and Figure 1-3 respectively.
6
Figure 1-2 Recovered connection sample from WTC5 (LaMalva, 2007)
Figure 1-3 Failed connections in WTC5 (FEMA, 2002)
Similarly, World Trade Centre 7 (WTC 7) – a 47 story office building adjacent to the main World
Trade Center complex had also undergone structural collapse due to fire conditions on September
11, 2001 in New York City. In WTC 7, fires ignited on over 10 floors in the building by falling
7
debris from WTC, with fires in the lower floors (7 to 9 and 11 to 13) burning out of control due to
failure in the water supply for the automatic sprinkler system that was installed in the building,
eventually leading to collapse approximately 7 hours after the collapse of the neighboring WTC 1
(NIST, 2008). From the investigation undertaken by NIST, it was reported that the collapse
sequence of the structural frame was initiated as a result of the thermal expansion of steel beams
and girders. Due to extended spans of heated 15 m beams on the north and east sides of the
structure, they experienced considerably large thermal elongations and axial compressive forces,
the simple shear connection used between a column and key girder on the 13th floor failed, which,
along with other structural components damaged by the fire led to the collapse of the 13th floor –
subsequently leading to the progressive collapse of floors below until the 5th floor (NIST, 2008).
Consequentially, the collapse of the floors resulted in the column being unsupported laterally
which eventually buckled and led to the global collapse of the structure. Thus, given the danger of
steel connections failing in fire scenarios, it is important to be able to understand the behaviour of
such connections under elevated temperatures in order to develop design methods and models
which can be used in structural design for fire exposure.
However, accounts of steel connections performing substantially well in fire have been observed
in real instances. This is exemplified by the Broadgate Phase 8 fire involving unprotected steel
beams with composite steel deck/concrete floor, where despite columns being shortened up to 100
mm due to plastic deformation, as well as the floor deflecting up to 600 mm, structural integrity
was able to be maintained throughout the heating and cooling phases (SCI, 1991). Similarly in the
1991 Churchill Plaza fire, a steel frame protected with a 90 minute fire resistance rating supporting
composite steel and concrete flooring was exposed to a fire for a sufficient period before being
extinguished by the building’s sprinkler system, where it was reported that the structure was able

8
to sustain loads up to 50% greater than the design as a result of tensile membrane action. Overall,
these events demonstrate the lack of a full understanding of the behaviour of steel connections
under elevated temperatures which currently exists, as the notation of their observed behaviour in
real fires has provided a large range of possibilities.
1.3 Objectives
The proposed research project described herein will aim to provide knowledge on the behaviour
of common New Zealand steel connections in fires and address the lack of guidance on their
design. As a result of this work, the following information will be provided to practicing structural
fire engineers in New Zealand:
• A deeper understanding of the behaviour of common steel connections in fire during both
the heating and cooling phases
• Assessment of the performance of commonly used New Zealand steel connections under
elevated temperatures. As steel connections in New Zealand are designed to be ductile to
withstand seismic loading in accordance with NZS3404, this research will aim to determine
how they perform under elevated temperatures
• A set of finite element models for common steel connections
This work will ultimately aim to assess the current state of guidance for the design of steel
connections under elevated temperatures and recommend ways in which it can be improved for
robustness, as well as detail methods in which component models may be used for structural fire
analysis.
9
2 Literature Review
In accordance with local and international guidelines for the structural requirements of buildings
(IStructE, 2002; MBIE, 2016), buildings are designed to ensure safety of occupants against
structural failure as a result of loads that are likely to be experienced throughout their lifetime,
including those from disasters such as earthquakes and fires. Hence, buildings are required to be
designed against catastrophes due to failure of connections in fire such as the progressive collapse
mechanism which occurred in the WTC5 and WTC7 incidents, as discussed in Chapter 1. The
term progressive collapse is defined by the occurrence of large scale failure of components within
a structure as a consequence of failure in local components (Starossek, 2007). This is exemplified
by the danger caused by structural steel being heated in fires due to its property of high thermal
conductivity and loss of strength with increasing temperatures. This will impose significant
demands on the connections, with these demands differing between the heating and the cooling
phases. The loss of strength in the connection may lead to the supported floor collapsing onto the
structural components below, inducing sudden dynamic loads and potentially causing the failure
of floors below.
With traditional steel structural fire safety design in which steel is protected against elevated
temperatures by the coverage of all exposed steel beams and columns with materials, there is a
lack of quantifiable guidance on the protection of steel beam-to-column connections based on the
belief that protected connections would conduct less heat due to having comparatively large
masses of steel relative to that of connecting members (Block, 2006) and the lack of suitable fire
testing facilities for connection testing. This approach is effective in limiting the temperature
increase in the protected components and hence the temperature induced member deformations,
however the deformations that still occur are sufficient to generate considerable additional axial
10
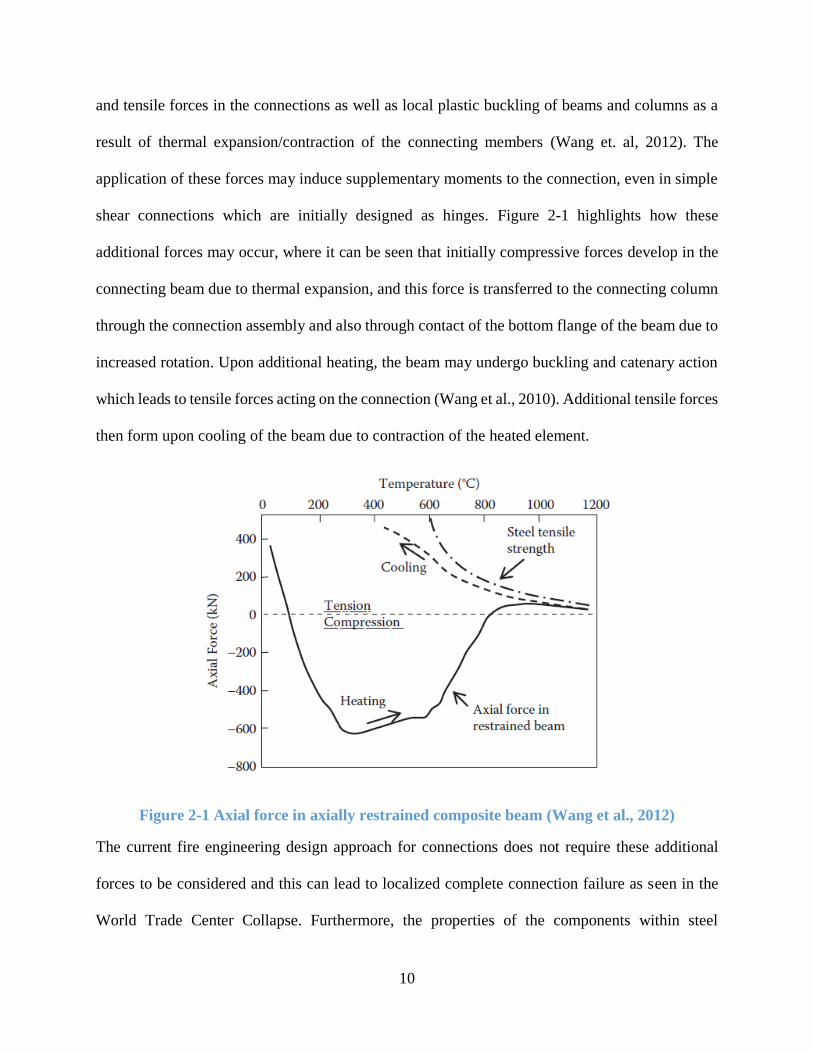
and tensile forces in the connections as well as local plastic buckling of beams and columns as a
result of thermal expansion/contraction of the connecting members (Wang et. al, 2012). The
application of these forces may induce supplementary moments to the connection, even in simple
shear connections which are initially designed as hinges. Figure 2-1 highlights how these
additional forces may occur, where it can be seen that initially compressive forces develop in the
connecting beam due to thermal expansion, and this force is transferred to the connecting column
through the connection assembly and also through contact of the bottom flange of the beam due to
increased rotation. Upon additional heating, the beam may undergo buckling and catenary action
which leads to tensile forces acting on the connection (Wang et al., 2010). Additional tensile forces
then form upon cooling of the beam due to contraction of the heated element.
Figure 2-1 Axial force in axially restrained composite beam (Wang et al., 2012)
The current fire engineering design approach for connections does not require these additional
forces to be considered and this can lead to localized complete connection failure as seen in the
World Trade Center Collapse. Furthermore, the properties of the components within steel
11
connections under elevated temperatures must also be understood as they weaken under the
influence of fire induced heating at different rates to the structural steel members. Nonetheless, in
order to study the performance of connection behaviour in fire, it is important to first understand
the philosophies supporting their design.
2.1 Design of Steel Connections in New Zealand
Connections play a very significant role in providing building stability and integrity for structural
frames during ambient and elevated temperatures. As defined by Eurocode 3 and NZS 3404, a
connection is a location at which two or more elements meet and is required to be capable of
transmitting design action effects including ductility demands (eg from severe earthquake or
severe fire). In both standards, steel connections can be classified into one of three forms: rigid,
semi-rigid or simple, depending on the requirements of the structure. Traditionally, connections
are designed to be either rigid or simple, where rigid connections are designed to transfer the full
moment of the beam end into the column as a result of a high rotational stiffness and therefore the
angles between members remains unchanged up to the attainment of the capacity of the weakest
connecting member, while simple connections transfer shear and axial forces, with negligible
rotational stiffness (Feeney and Clifton, 1995) limiting the moments generated.. The classification
of semi-rigid connections lies between the two extremes and is designed to provide a limited
rotational stiffness under the design loading.
As simple connections provide a number of benefits over semi-rigid or rigid connections, including
lower fabrication and erection costs, they are more commonly used in practice (Hu, 2009), and
have therefore been chosen as the focus of this study. In particular, two simple connection designs
– web side plates and flexible endplates - have been outlined based on the availability of
comparable experimental data of the connections under elevated temperatures, and their
12
widespread use throughout- the two regions. While the behaviour of connections designed to
European standards have been examined in previous studies (Dai et al, 2010; Hu, 2009; Selamet
and Garlock, 2014; Yu et al, 2009a; Yu et. al, 2008) a lack of understanding of the fire performance
of connections designed to New Zealand standards and detailing requirements currently exists.
Although the simple connections designed to the two standards are similar based on appearance,
there are significant differences in detailing due to differences in the grade of materials and demand
capacity requirements between the regions which may influence the connection behaviour under
elevated temperatures as a result.
2.1.1 New Zealand Design Philosophy
Geographically, New Zealand is situated on a plate boundary between the India-Australian plate
and the Pacific plate. This plate boundary includes the Alpine Fault, with over 800 kilometers of
measured fault movement making it the largest known fault displacement worldwide. Many parts
of New Zealand are subjected to high seismic demands and seismic design and detailing
requirements to accommodate the deformation demands. These underpin connection design and
detailing requirements as a result (Robinson, 2014) . Notably, the destruction of buildings as a
result of the M7.8 Hawke’s Bay earthquake in 1931 first highlighted the need for buildings to be
able to sustain lateral forces and dissipate energy in earthquakes (Ingham and Griffith, 2011). In
response to the Hawke’s bay earthquake, the New Zealand Standards Institute published a by-law
(NZSS No. 95), which requires buildings to be designed to be able to sustain a horizontal
acceleration of 0.1g, and includes a suggestion that buildings used as spaces for public gatherings
should be constructed using steel or reinforced concrete (New Zealand Standards Institute, 1935).
It was not until 1965, then 1976 where research was incorporated into the national design standard
13
(NZS 4203) and in major advancement to allow seismic design with other materials, including
timber and reinforced masonry (New Zealand Standards Institute, 1976).
Due to the increased use of steel in New Zealand, significant research and design documents for
the material have undergone rapid development in recent years, most notably the first publication
of NZS3404 - Steel Structures Standard in 1989 (New Zealand Standards Institute, 1989) and
design guides by HERA (Heavy Engineering Research Association) (Clifton, 1994; Feeney and
Clifton, 1995). These documents include applications and principles of the developments in
research to date at the time, in turn recognizing the importance of the design and detailing of steel
connections in order to resist seismic forces. As a basis of comparison, following the observations
of the extensively damaged steel beam-to-column moment resisting connections caused by the
1994 Northridge earthquake in California (Sabol and Engelhardt, 1994), Clifton (1995) conducted
a study to determine the effectiveness of the New Zealand design procedures of steel connections.
Clifton (1995) created a model of the connection using standard New Zealand design procedures
and determined that the beam flange to column flange failure modes of the American connection
are able to be dependably suppressed by the New Zealand connection as a result of differences in
steel strength and design for ductility (Feeney and Clifton, 1995).
The most recent documentation for the design principles of structural steel is outlined in the latest
revision of NZS3404 (New Zealand Standards Institute, 1997), with an adherence to the Steel
Connect design guidance documents developed by Steel Construction New Zealand as design
guide - formulated to increase the robustness steel connections (SCNZ, 2008a, 2008b). These
documents bring updated and improved design philosophies to the design of New Zealand
connections by incorporating the requirement of increased ductility and strength capacity in

14
comparison with their overseas counterparts, with the major differences arising from the focus in
their ability to sustain earthquake induced forces.
In the later revisions of the New Zealand Standards, beam-to-column connections are required to
be designed and detailed in accordance with pre-determined overstrength factors for moment and
shear capacities of the connecting beam, as documented in NZS 3404. This requirement is to
ensure that the ductility of the structural frame can be realized through the formation of plastic
hinges in the connecting beam prior to the failure of the connection which may result in
catastrophic failure of the overall structure (Feeney and Clifton, 1995). Additionally, the minimum
yield strength of steel used for connections in New Zealand has been increased to 300 MPa,
compared to the lower grade steels used in Europe, with the UK often using steel with the minimum
yield strength of 275 MPa. Hence, as a result of the increased capacity of New Zealand connections
designed against seismic forces, it is expected that they have a higher inherent resistance to the
effects of elevated temperatures despite the lack of research to date.
2.2 Design of New Zealand Connections in Fire
Traditionally in New Zealand, there has been no specific guidance on the design of connections in
fire. The conventional approach has been to determine the temperatures at the connection using
simple calculation methods, then to subsequently calculate the capacity of each component in the
connection based on reduced strengths. On the contrary, in local practice, the current version of
the New Zealand standard for structural steel conservatively requires the steel connection to be
fire rated to at least the equivalent level of fire rating applied to the connecting elements. However
as previously discussed, simply fire rating the connection or calculating the residual capacities of
each component does not take into account the additional forces which occur as a result of thermal
effects such as expansion and catenary action of the connecting beam.
15
In recent times, New Zealand standards have begun to progressively recognize and utilize the
design methodologies adopted by the Eurocodes inclusion of modern research. Particularly, the
new revision for the Composite Structures Standard – AS/NZS 2327 (New Zealand Standards
Institute, 2017) incorporates the use of the “Component Method” for the design of connections at
ambient temperatures. The component method allows for a relatively simple approach in
predicting the stiffness and resistance of connections by modelling the joint as an accumulation of
its components. The Component Method has also been developed for steel connections to be used
in fire scenarios, and has proven to be able to recreate results determined from experimental testing
provided that the stiffness and properties of the components are determined accurately (Block,
2006b; Simões da Silva et. al, 2001; Spyrou, 2002; Yu et al., 2009). Although the component
method has been developed to show credible results under elevated temperatures, is has not been
validated for use on New Zealand connection designs due to the lack of available experimental
data. Therefore, the research conducted herein aims to provide some information in terms of better
understanding the performance and differences in New Zealand connections in comparison with
those used abroad. However, to understand the performance of New Zealand connections in fire,
it is important to first understand the basic properties of steel under the influence of elevated
temperatures.
2.3 Properties of Steel at Elevated Temperature
The structural properties of steel at elevated temperatures have been extensively studied in recent
years as this knowledge is fundamental to fire engineering design. Steel undergoes a significant
decrease in stiffness and strength with increasing temperatures, which may ultimately lead to
structural failure due to excessive levels of deflection depending on the application of loads (Sarraj,
2007).
16
The strength properties of steel are defined by stress strain relationships, with typical ambient
temperature behaviour of steel being well established. However upon heating, the stress strain
relationship changes significantly depending on the temperature. Different elevated temperature
mechanical properties have been considered by different countries in the past, although this is now
becoming more standardised on the Eurocode specified mechanical properties.
2.3.1 Eurocode 3: Part 1-2 and BS 5950 Part 8
The properties of structural steel adopted in EN 1993-1-2: Structural Fire Design (European
Committee for Standardization, 2005a) and BS 5950 Part 8: Code of practice for fire resistant
design (British Standards Institution, 2003) are largely based on the experimental studies
conducted by Kirby and Preston (1988). Their experiments consisted of determining the properties
of European carbon steels under transient testing of increasing temperatures with grades 43A and
50B - possessing yield strengths of 275N/mm2 and 355N/mm2 respectively, correlating to grades
S275 and S355. In their tests, the steel specimens were held under constant loads while
temperatures were increased under rates of 2.5, 5, 10 and 20oC/min from temperatures of 20oC to
900oC. From the results generated by the experimental tests, appropriate stress strain curves were
developed over varying temperatures for the purpose of structural fire engineering, and have been
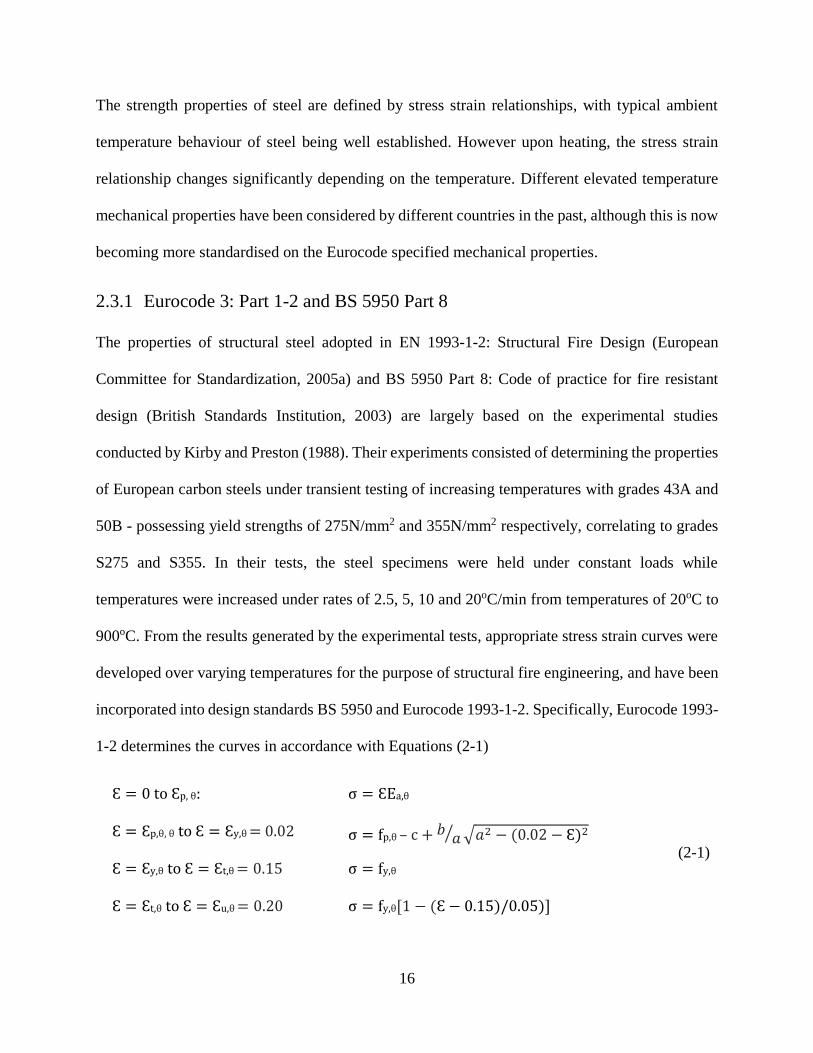
incorporated into design standards BS 5950 and Eurocode 1993-1-2. Specifically, Eurocode 1993-
1-2 determines the curves in accordance with Equations (2-1)
Ɛ = 0 to Ɛp, θ:
σ = ƐEa,θ
(2-1)
Ɛ = Ɛp,θ, θ to Ɛ = Ɛy,θ = 0.02
σ = fp,θ – c + 𝑏 𝑎⁄ √𝑎2 − (0.02 − Ɛ)2
Ɛ = Ɛy,θ to Ɛ = Ɛt,θ = 0.15
σ = fy,θ
Ɛ = Ɛt,θ to Ɛ = Ɛu,θ = 0.20
σ = fy,θ[1 − (Ɛ − 0.15)/0.05)]
17
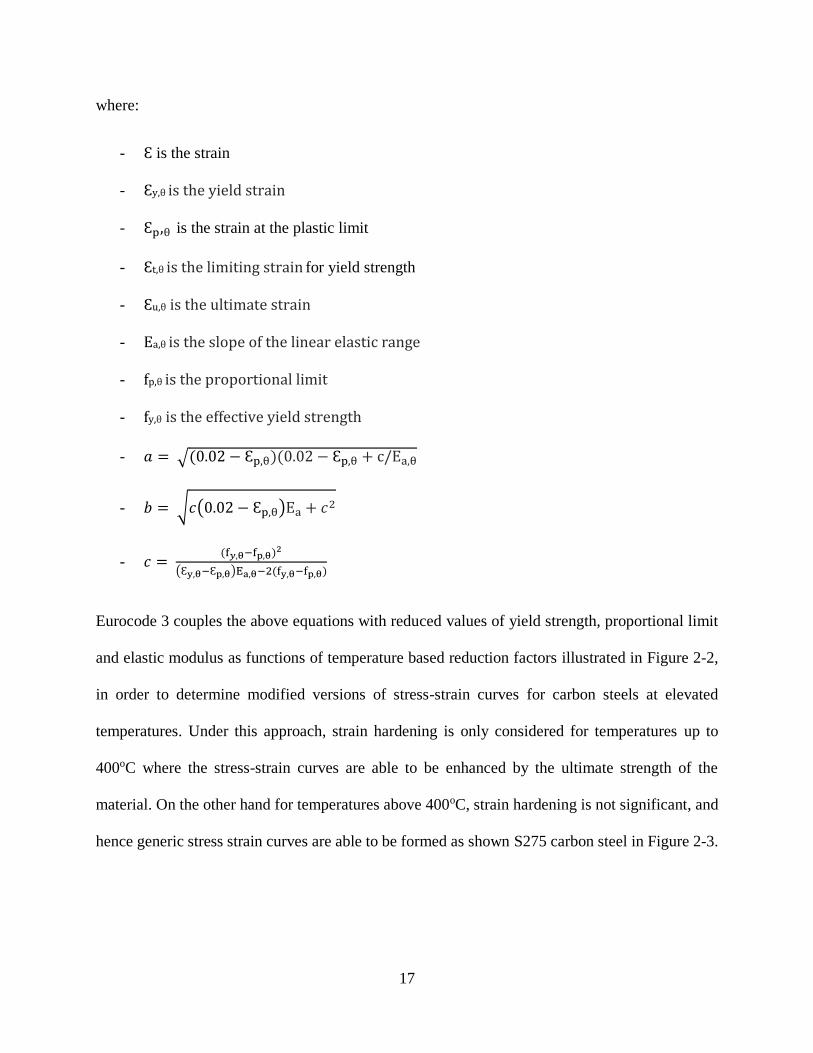
where:
- Ɛ is the strain
- Ɛy,θ is the yield strain
- Ɛp,θ is the strain at the plastic limit
- Ɛt,θ is the limiting strain for yield strength
- Ɛu,θ is the ultimate strain
- Ea,θ is the slope of the linear elastic range
- fp,θ is the proportional limit
- fy,θ is the effective yield strength
- 𝑎 = √(0.02 − Ɛp,θ)(0.02 − Ɛp,θ + c/Ea,θ
- 𝑏 = √𝑐(0.02 − Ɛp,θ)Ea + 𝑐2
- 𝑐 = (f𝑦,θ−fp,θ)2
(Ɛy,θ−Ɛp,θ)Ea,θ−2(fy,θ−fp,θ)
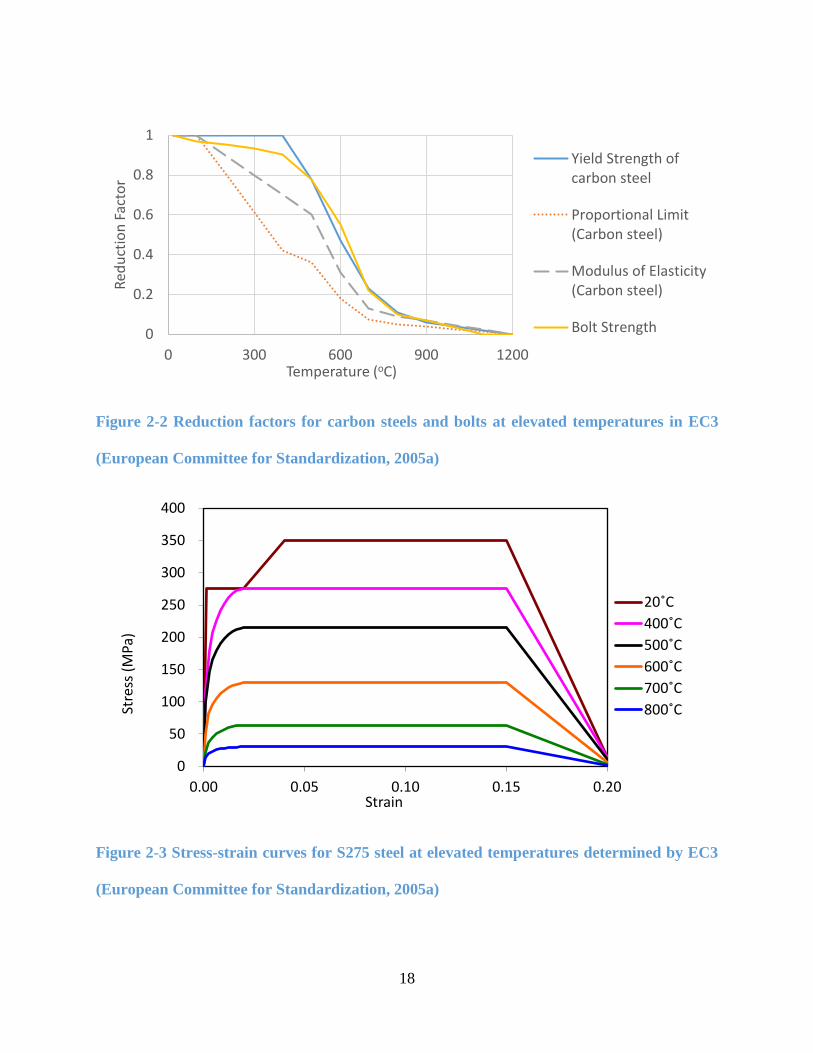
Eurocode 3 couples the above equations with reduced values of yield strength, proportional limit
and elastic modulus as functions of temperature based reduction factors illustrated in Figure 2-2,
in order to determine modified versions of stress-strain curves for carbon steels at elevated
temperatures. Under this approach, strain hardening is only considered for temperatures up to
400oC where the stress-strain curves are able to be enhanced by the ultimate strength of the
material. On the other hand for temperatures above 400oC, strain hardening is not significant, and
hence generic stress strain curves are able to be formed as shown S275 carbon steel in Figure 2-3.
18
Figure 2-2 Reduction factors for carbon steels and bolts at elevated temperatures in EC3
(European Committee for Standardization, 2005a)
Figure 2-3 Stress-strain curves for S275 steel at elevated temperatures determined by EC3
(European Committee for Standardization, 2005a)
0
0.2
0.4
0.6
0.8
1
0 300 600 900 1200
Red
uct
ion
Fac
tor
Temperature (oC)
Yield Strength ofcarbon steel
Proportional Limit(Carbon steel)
Modulus of Elasticity(Carbon steel)
Bolt Strength
0
50
100
150
200
250
300
350
400
0.00 0.05 0.10 0.15 0.20
Stre
ss (
MP
a)
Strain
20˚C
400˚C
500˚C
600˚C
700˚C
800˚C
19
A similar approach of the application of reduction factors for calculating the reduced strength of
bolts under elevated temperatures is also applied in Eurocode 3, with the difference being the
modulus of elasticity is not considered to be significant. Hence, the reduction factors illustrated in
Figure 2-2 are only provided for the strength of bolts which applies for both tension and shear.
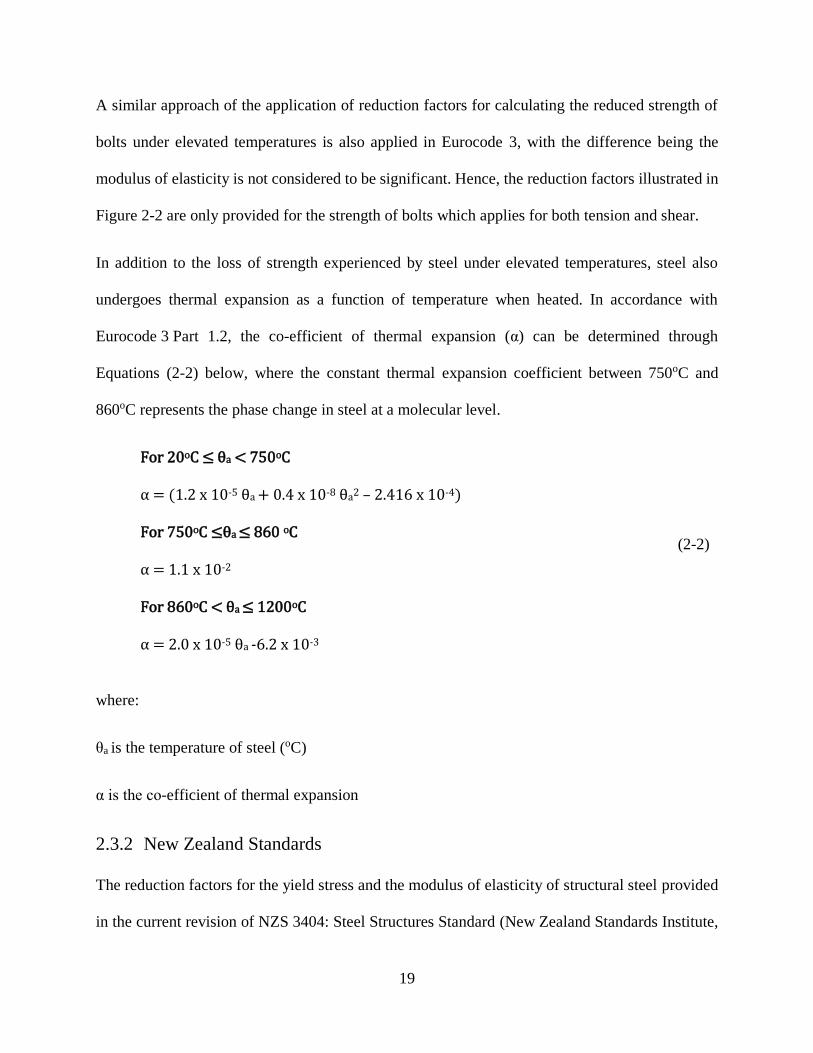
In addition to the loss of strength experienced by steel under elevated temperatures, steel also
undergoes thermal expansion as a function of temperature when heated. In accordance with
Eurocode 3 Part 1.2, the co-efficient of thermal expansion (α) can be determined through
Equations (2-2) below, where the constant thermal expansion coefficient between 750oC and
860oC represents the phase change in steel at a molecular level.
For 20oC ≤ θa < 750oC
(2-2)
α = (1.2 x 10⁻⁵ θa + 0.4 x 10⁻⁸ θa2 – 2.416 x 10⁻⁴) For 750oC ≤θa ≤ 860 oC α = 1.1 x 10⁻² For 860oC < θa ≤ 1200oC α = 2.0 x 10⁻⁵ θa -6.2 x 10⁻³
where:
θa is the temperature of steel (oC)
α is the co-efficient of thermal expansion
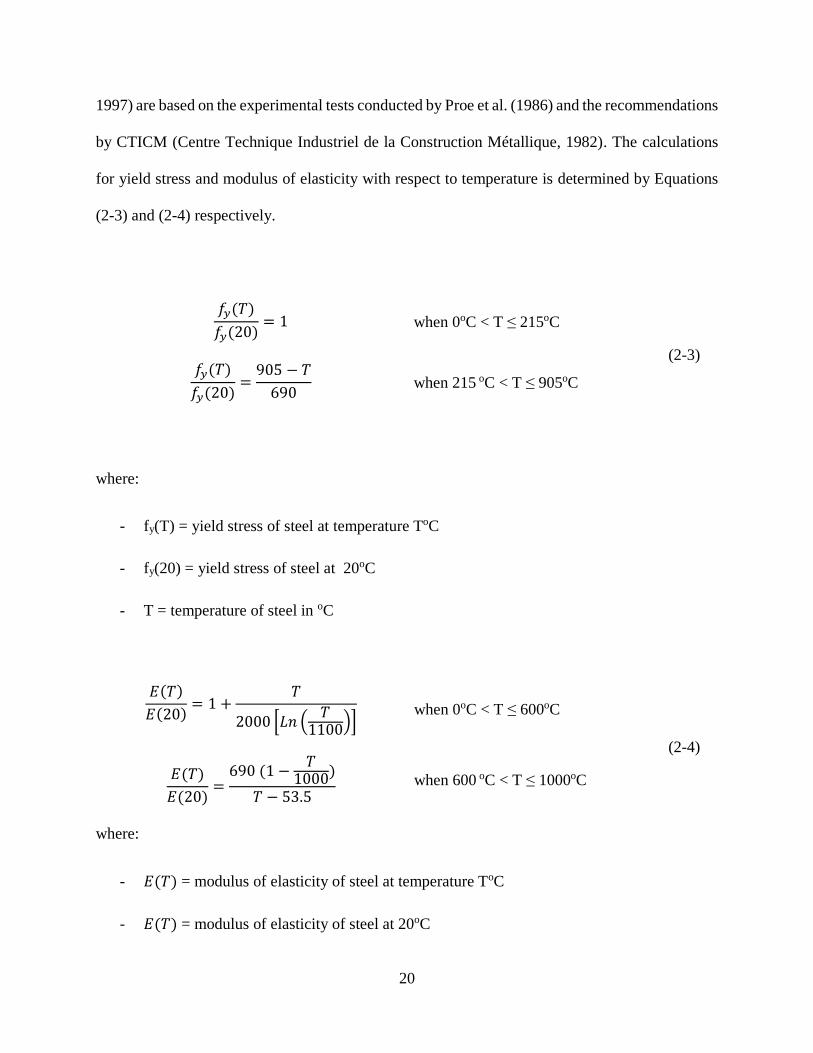
2.3.2 New Zealand Standards
The reduction factors for the yield stress and the modulus of elasticity of structural steel provided
in the current revision of NZS 3404: Steel Structures Standard (New Zealand Standards Institute,
20
1997) are based on the experimental tests conducted by Proe et al. (1986) and the recommendations
by CTICM (Centre Technique Industriel de la Construction Métallique, 1982). The calculations
for yield stress and modulus of elasticity with respect to temperature is determined by Equations
(2-3) and (2-4) respectively.
𝑓𝑦(𝑇)
𝑓𝑦(20)= 1
when 0oC < T ≤ 215oC
(2-3)
𝑓𝑦(𝑇)
𝑓𝑦(20)=
905 − 𝑇
690
when 215 oC < T ≤ 905oC
where:
- fy(T) = yield stress of steel at temperature ToC
- fy(20) = yield stress of steel at 20oC
- T = temperature of steel in oC
𝐸(𝑇)
𝐸(20)= 1 +
𝑇
2000 [𝐿𝑛 (𝑇
1100)]
when 0oC < T ≤ 600oC
(2-4)
𝐸(𝑇)
𝐸(20)=
690 (1 −𝑇
1000)
𝑇 − 53.5
when 600 oC < T ≤ 1000oC
where:
- 𝐸(𝑇) = modulus of elasticity of steel at temperature ToC
- 𝐸(𝑇) = modulus of elasticity of steel at 20oC
21
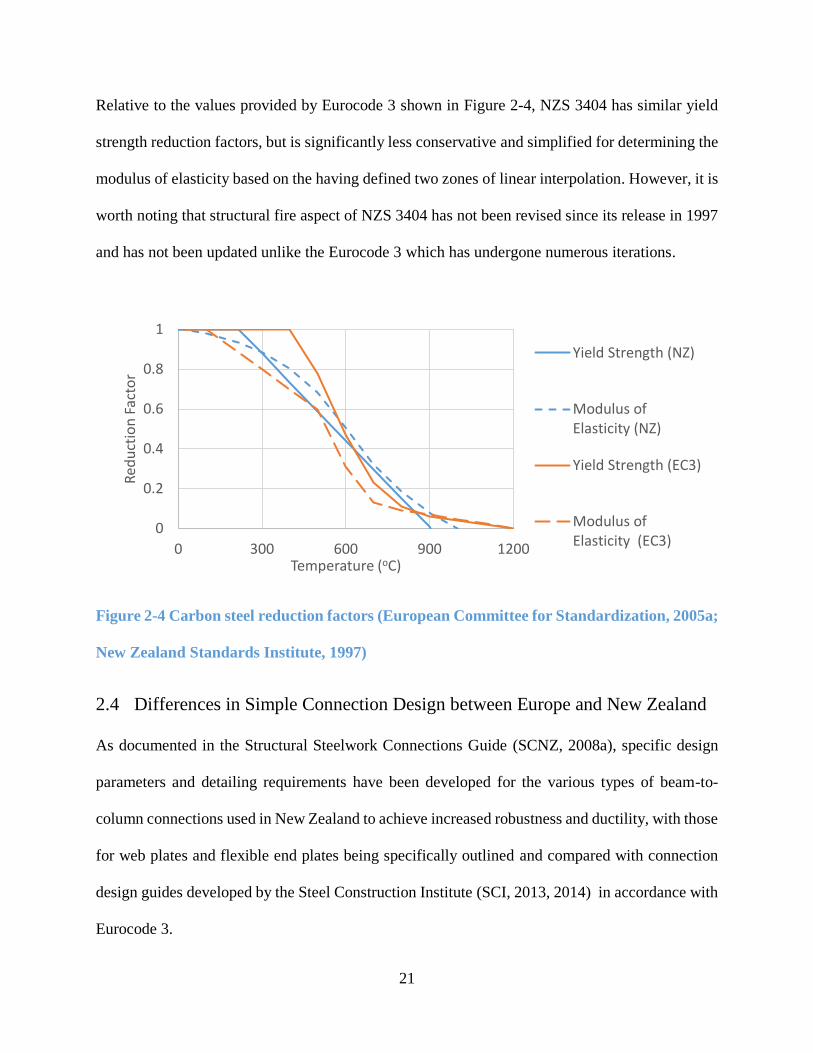
Relative to the values provided by Eurocode 3 shown in Figure 2-4, NZS 3404 has similar yield
strength reduction factors, but is significantly less conservative and simplified for determining the
modulus of elasticity based on the having defined two zones of linear interpolation. However, it is
worth noting that structural fire aspect of NZS 3404 has not been revised since its release in 1997
and has not been updated unlike the Eurocode 3 which has undergone numerous iterations.
Figure 2-4 Carbon steel reduction factors (European Committee for Standardization, 2005a;
New Zealand Standards Institute, 1997)
2.4 Differences in Simple Connection Design between Europe and New Zealand
As documented in the Structural Steelwork Connections Guide (SCNZ, 2008a), specific design
parameters and detailing requirements have been developed for the various types of beam-to-
column connections used in New Zealand to achieve increased robustness and ductility, with those
for web plates and flexible end plates being specifically outlined and compared with connection
design guides developed by the Steel Construction Institute (SCI, 2013, 2014) in accordance with
Eurocode 3.
0
0.2
0.4
0.6
0.8
1
0 300 600 900 1200
Red
uct
ion
Fac
tor
Temperature (oC)
Yield Strength (NZ)
Modulus ofElasticity (NZ)
Yield Strength (EC3)
Modulus ofElasticity (EC3)
22
Notably, structural design in New Zealand recognizes the distinction in designing a structural
system with the capacity to sustain calculated displacements in addition to singularly forced-based
designs (Butterworth, 1995; Priestley, 1993). As a response, New Zealand connection design
quantitatively requires connections to be able to accommodate gravity load and seismic drift
induced rotations of 0.030 radians without collapse (SCNZ, 2008a). This contrasts with Eurocode
3, which although also requires simple connections to have adequate rotation capacity, does not
specify a quantitative limitation. Instead, the requirement is assumed to be met if a bolted
connection meets a criteria which considers the governing design resistance and thickness of
connecting members (European Committee for Standardization, 2004b), ultimately leading to key
differences in the detailing of the steel connections.
2.4.1 Web side plate connections
In order to accommodate the governing 0.030 radians of relative rotation in seismic and extreme
fire scenarios, the design features of New Zealand web side plate (WSP) connections documented
by SCNZ is dependent on the ductile yielding of the connection and the suppression of bolt or
weld failure as the weakest link component in the connection.
The design procedures were developed based on research conducted by Murray and Butterworth
(1990). The study undertook 14 experimental tests of WSP beam-to-column connections with 6
different detailing configurations; each connection being placed under large relative rotations to
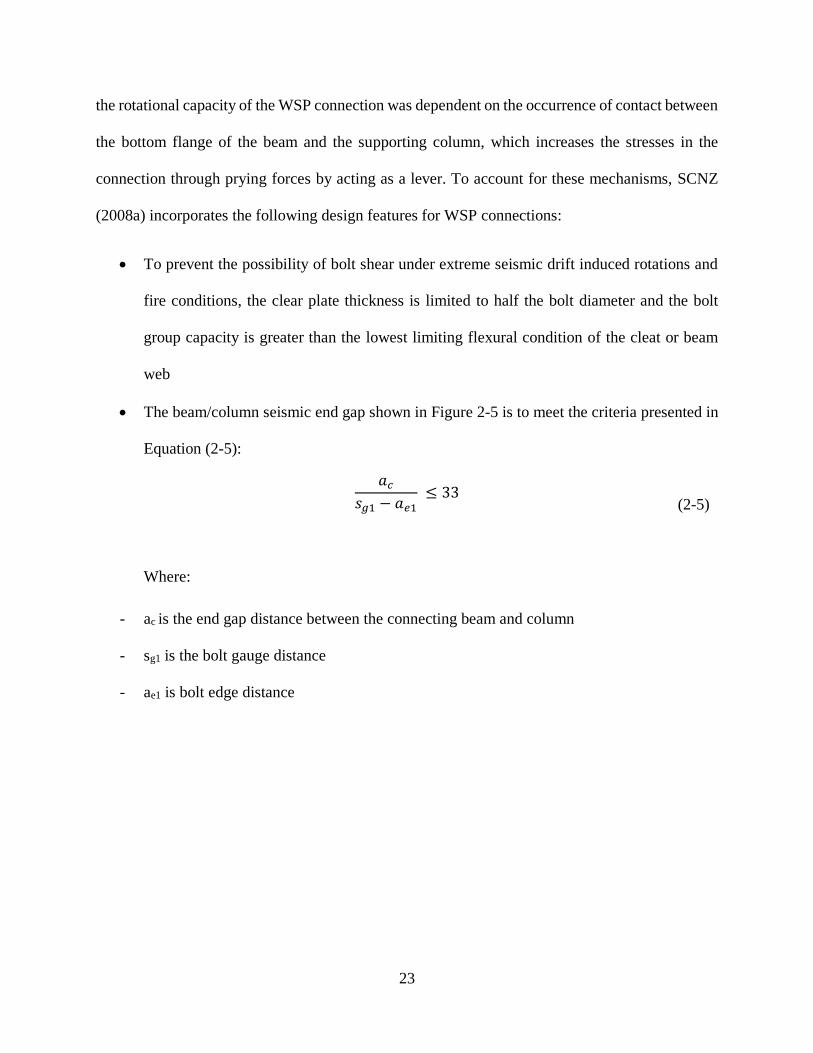
simulate the effects of an earthquake. From this study, it was discovered that yielding of bolt holes,
particularly in the web of the connecting beam (Figure 2-6) is the desirable outcome during large
rotations as it allows for an extremely ductile mechanism, whereas on the contrary, the shearing
of bolts or peeling failure of welds was observed to be a significantly brittle failure mode and is to
be avoided through structural design. Furthermore, Murray and Butterworth (1990) observed that
23
the rotational capacity of the WSP connection was dependent on the occurrence of contact between
the bottom flange of the beam and the supporting column, which increases the stresses in the
connection through prying forces by acting as a lever. To account for these mechanisms, SCNZ
(2008a) incorporates the following design features for WSP connections:
• To prevent the possibility of bolt shear under extreme seismic drift induced rotations and
fire conditions, the clear plate thickness is limited to half the bolt diameter and the bolt
group capacity is greater than the lowest limiting flexural condition of the cleat or beam
web
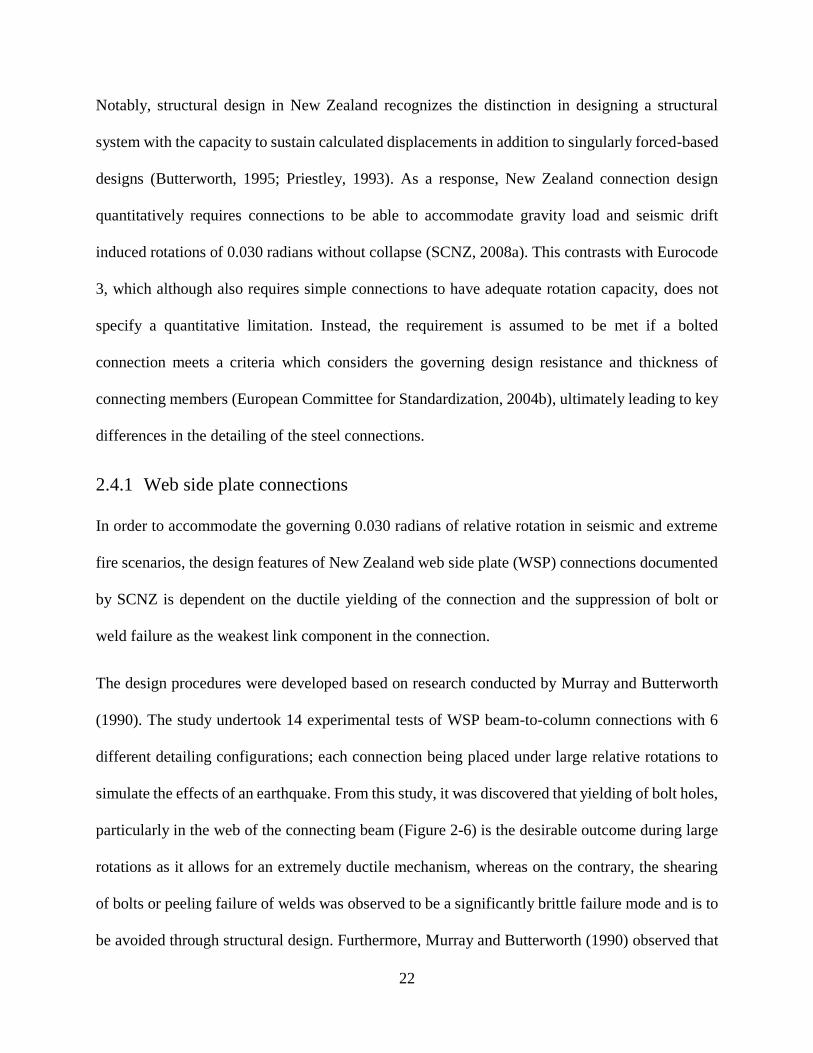
• The beam/column seismic end gap shown in Figure 2-5 is to meet the criteria presented in
Equation (2-5):
𝑎𝑐
𝑠𝑔1 − 𝑎𝑒1 ≤ 33
(2-5)
Where:
- ac is the end gap distance between the connecting beam and column
- sg1 is the bolt gauge distance
- ae1 is bolt edge distance
24
- Figure 2-5 Fin plate connection (SCNZ, 2008a)
Figure 2-6 Yield of bolt holes (Murray and Butterworth, 1990)
In comparison, the SCI (2014) recommends that the rotational capacity of the web side plate
connection is to be achieved through hole distortions of the connecting members, and/or through
shear deformation of bolts; a significant contrast to the ductile design philosophy of the New
Zealand design which does not permit the yielding of bolts due to the resulting brittle failure which
may arise. Hence based on the increased ductility of the New Zealand web side plate connection
design as a result of detailing for higher rotation capacity, they are generally assumed to be able
to accommodate the high rotations which arise when subjected to elevated temperatures in a fire.
25
2.4.2 Flexible endplate connections
Similarly, the design of flexible endplate connections in New Zealand has been documented based
on the requirements of being able to achieve 0.030 radians of rotation due to seismic drift in
addition to thermal strains induced by extreme fire events without collapse. As per the Structural
Steelwork Connections Guide (SCNZ, 2008a), the following design features for flexible endplate
connections have been incorporated to meet the above requirements:
• Welds of cleats to the beams have a design capacity greater than that of the resultant action
due to development of over-strength of 1.2 times the flexural yield of the end plate under
tensile load and direct shear.
• The beam web adjacent to the top of the cleat have sufficient capacity to resist combined
shear and local longitudinal tension, using a Von Mises based stress criterion.
• The end plate is maintained as flexible by limiting the thickness of the endplate as a
function of the bolt gauge in Equation (2-6) below:
11 ≤ 𝑠𝑔
𝑡𝑖≤ 14 (2-6)
where:
- sg is the bolt gauge (mm)
- ti is the thickness of the endplate (mm)
• To prevent transverse tensile tearing in the web below the bottom edge of the end plate,
block transverse shear and tensile yield capacity is assessed based upon a web block 20
mm wide and as deep as the end plate. Compression yield strength is assessed to develop
along the top edge of the web block shear element as long as two local web buckling criteria
are satisfied. The first of these is that the top flange is laterally restrained at the location by
26
a concrete slab or other means. The second criterion is that the clear web depth to web
thickness ratio between the top of the cleat and the underside of the flange, is less than or
equal to 17.5.
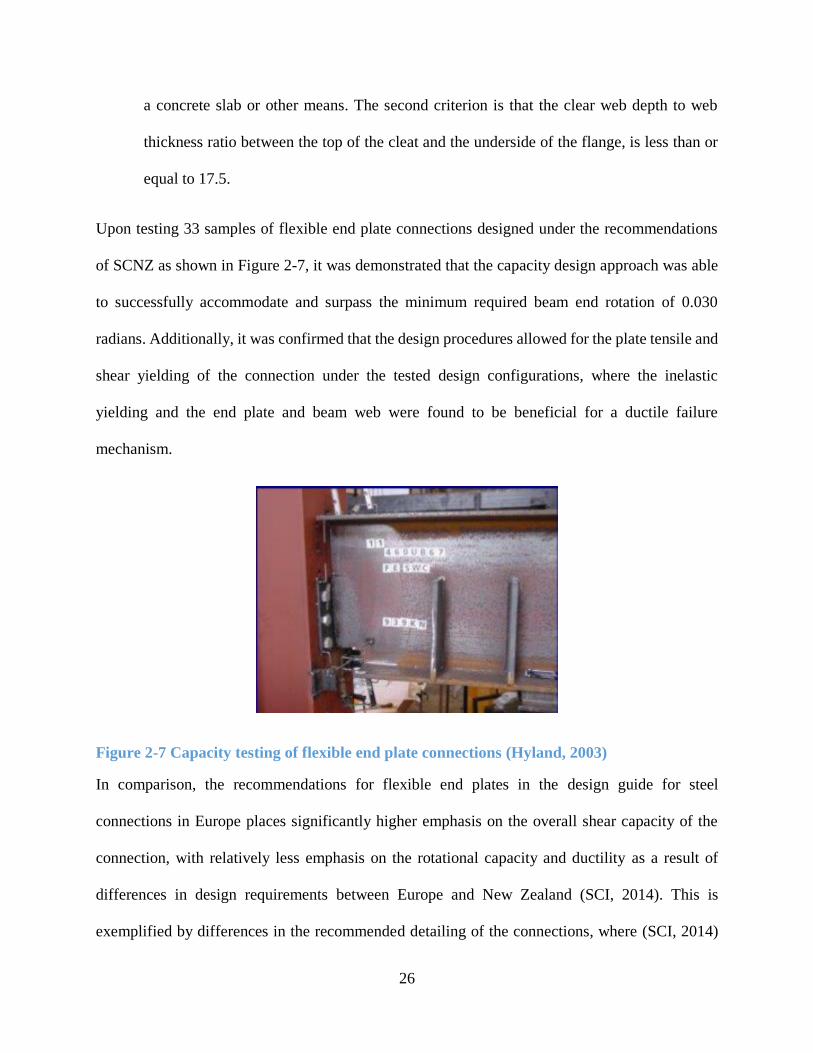
Upon testing 33 samples of flexible end plate connections designed under the recommendations
of SCNZ as shown in Figure 2-7, it was demonstrated that the capacity design approach was able
to successfully accommodate and surpass the minimum required beam end rotation of 0.030
radians. Additionally, it was confirmed that the design procedures allowed for the plate tensile and
shear yielding of the connection under the tested design configurations, where the inelastic
yielding and the end plate and beam web were found to be beneficial for a ductile failure
mechanism.
Figure 2-7 Capacity testing of flexible end plate connections (Hyland, 2003)
In comparison, the recommendations for flexible end plates in the design guide for steel
connections in Europe places significantly higher emphasis on the overall shear capacity of the
connection, with relatively less emphasis on the rotational capacity and ductility as a result of
differences in design requirements between Europe and New Zealand (SCI, 2014). This is
exemplified by differences in the recommended detailing of the connections, where (SCI, 2014)
27
recommends the use of 10mm or 12mm thick end plates and a bolt gauge of 90mm, compared to
(SCNZ, 2008a) which relates the factors to optimise ductility.
Although both design requirements address the importance of achieving sufficient axial tension
capacity, there is significant difference in the capacity requirements. In New Zealand, the required
capacity is a function of the yield strength of the endplate and bolt gauge (SCNZ, 2008a), whereas
the required capacity in Europe is determined by Eurocode 1991-1-7 (European Committee for
Standardization, 2006) for accidental actions which incorporates a criteria for required axial
capacity based on the risk group of the structure in order to mitigate damage by events such as
explosions, impact or consequences of human error.
As a result of the factors described herein, it is expected that the New Zealand connections are
designed to be more robust when operating in the plastic range than their European counterparts.
This is based on the contrasting capacity requirements for rotation and ductility, from which the
assumption of New Zealand connections being adequate under elevated temperatures arose.
Whereas the behaviour of European connections under elevated temperatures is relatively well
understood through previous experimental and numerical studies, the study reported herein sets
the precedence of understanding the behaviour of New Zealand connections and tests their
assumed performance in fire by comparing connections designed as per the two regions and
numerically modelling their behaviour under fire conditions.
2.5 Investigation of the behaviour of steel connections in fire
2.5.1 Experimental investigations
The earliest recorded experimental studies on the performance of isolated steel connections in fire
were undertaken by Kruppa (1976) and British Steel (1982), where a range of connections from
28
“flexible” to “rigid” were tested under rising temperatures following the standard fire curve (ISO,
1975). The results from these early tests established that both bolts and the connecting members
undergo significant deflections and deformations in fire conditions (Simṏes da Silva and Santiago,
2005).
Lawson (1990) investigated the behaviour of connections in fire which had the benefit of structural
continuity by testing specimens of a cruciform set up consisting of a column and two
symmetrically connecting beams. In total, eight specimens of various connection types including
flush endplate, extended endplate and web cleats (with each beam supporting a concrete slab) were
tested under the standard fire curve. Through the eight tests, it was reported that the steel beam
experienced significantly higher temperatures than the components within the connection, where
temperatures in the lower beam flange reached 650oC to 750oC, meanwhile the temperature of
bolts was 150oC to 200oC lower. The results from this experiment suggested that the composite
action from the concrete slabs provided an increased performance of steel connections in fire
through distributing moments, and it is believed that connections feature a natural robustness in
fire, potentially as a result of higher concentrated thermal mass (Sulong, 2005). However due to
restrictions on applicable loads by the testing apparatus, insufficient moment and rotation data was
obtained from the tests.
Following the Broadgate fire incident in 1990, a proper understanding of the behaviour of complete
structures in fire was shown to be critical, leading to full-scale fire tests being conducted at the
Cardington Laboratory in Bedforshire, U.K with the aim of assessing the performance of structural
elements in a fire under natural constraints (Amer and Moore, 1994; Bailey, Lennon, and Moore,
1999; Y.C. Wang, 2002). Although being significantly more expensive in comparison to
experimental tests on isolated steel connections, large scale testing provides an accurate
29
representation of the behaviour of real steel connections in fire based on its ability to consider the
influence of the overall structure.
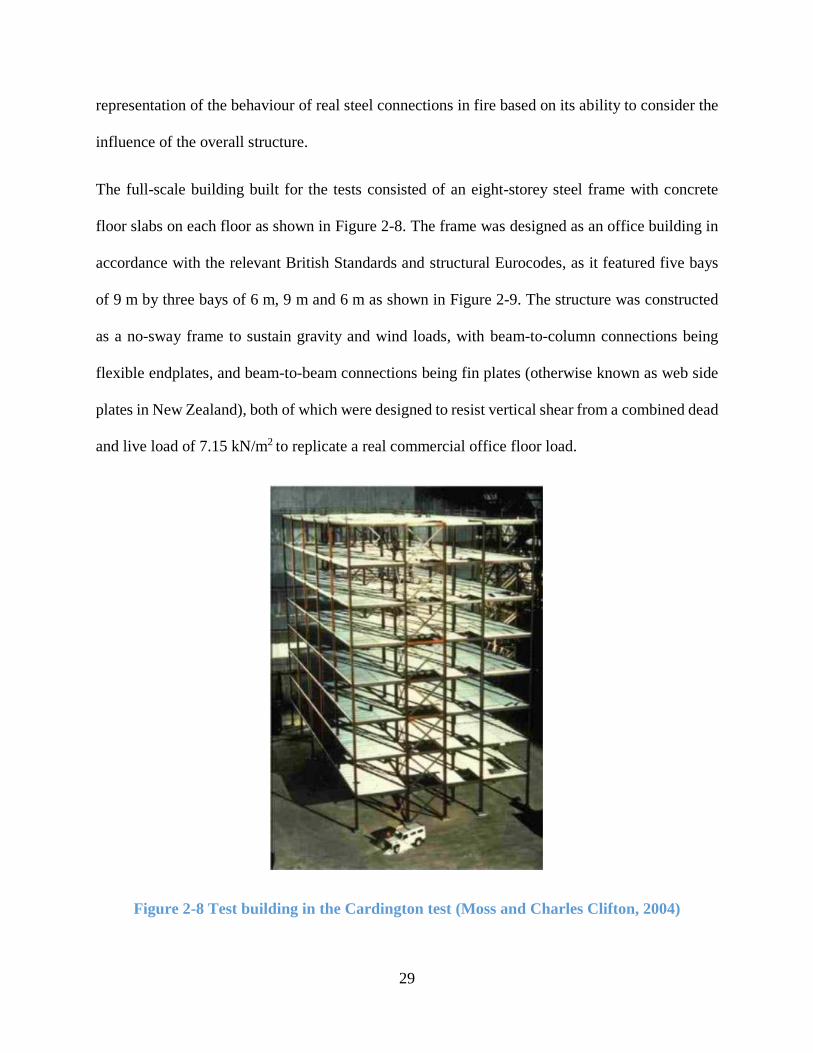
The full-scale building built for the tests consisted of an eight-storey steel frame with concrete
floor slabs on each floor as shown in Figure 2-8. The frame was designed as an office building in
accordance with the relevant British Standards and structural Eurocodes, as it featured five bays
of 9 m by three bays of 6 m, 9 m and 6 m as shown in Figure 2-9. The structure was constructed
as a no-sway frame to sustain gravity and wind loads, with beam-to-column connections being
flexible endplates, and beam-to-beam connections being fin plates (otherwise known as web side
plates in New Zealand), both of which were designed to resist vertical shear from a combined dead
and live load of 7.15 kN/m2 to replicate a real commercial office floor load.
Figure 2-8 Test building in the Cardington test (Moss and Charles Clifton, 2004)
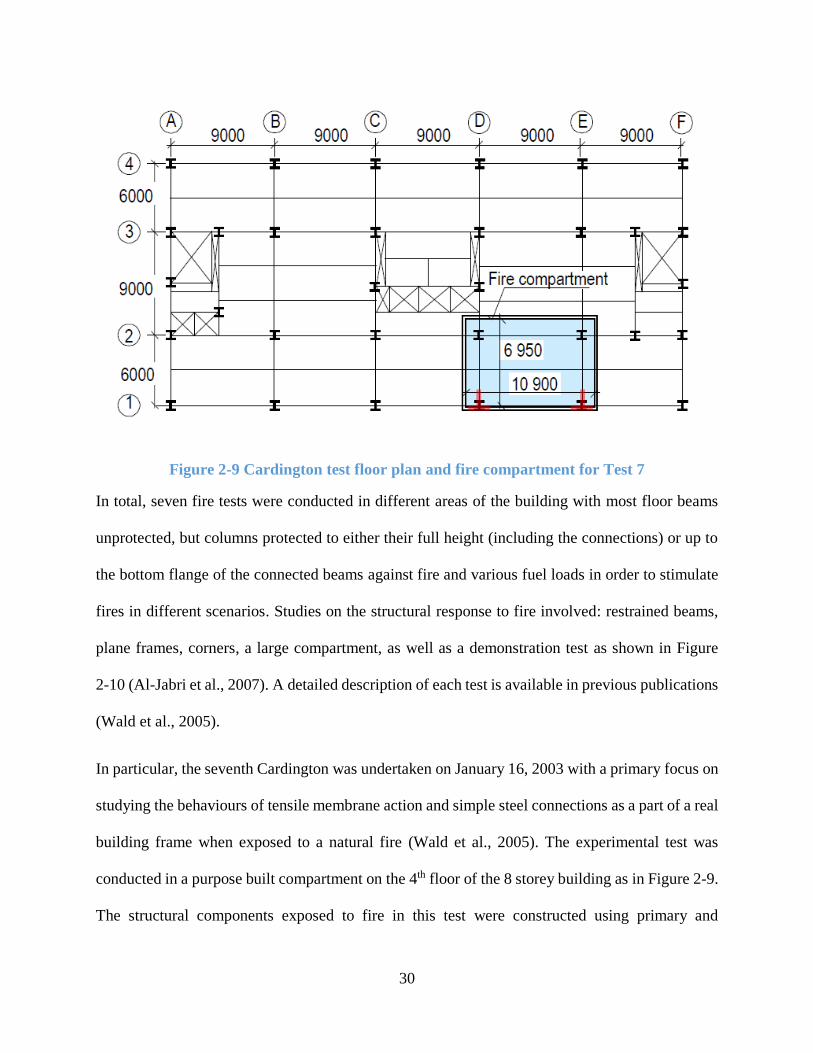
30
Figure 2-9 Cardington test floor plan and fire compartment for Test 7
In total, seven fire tests were conducted in different areas of the building with most floor beams
unprotected, but columns protected to either their full height (including the connections) or up to
the bottom flange of the connected beams against fire and various fuel loads in order to stimulate
fires in different scenarios. Studies on the structural response to fire involved: restrained beams,
plane frames, corners, a large compartment, as well as a demonstration test as shown in Figure
2-10 (Al-Jabri et al., 2007). A detailed description of each test is available in previous publications
(Wald et al., 2005).
In particular, the seventh Cardington was undertaken on January 16, 2003 with a primary focus on
studying the behaviours of tensile membrane action and simple steel connections as a part of a real
building frame when exposed to a natural fire (Wald et al., 2005). The experimental test was
conducted in a purpose built compartment on the 4th floor of the 8 storey building as in Figure 2-9.
The structural components exposed to fire in this test were constructed using primary and
31
secondary composite beams of grade S350 336 x 171 x 51 UB and grade S275 305 x 165 x 40 UB
respectively – both supporting a floor slab with an overall depth of 130 mm and steel decking with
a trough depth of 60 mm. Grade S350 305 x 305 x 198 UC and S350 305 x 305 x 171 UC sections
were used for the internal and external columns respectively. In order to maintain global structural
stability during the fire tests 18 – 22 mm of vermiculite-cement spray was applied to internal
columns up to the bottom flange of connecting beams, and along the full height of perimeter
columns including the connection and short lengths of the connected beams for “coatback” as
approximately shown in Figure 2-9 (Wald et al., 2005). Beyond these, structure was left
unprotected.
To induce a natural fire, the floor area of the fire compartment was covered with 40 kg/m2 of
wooden cribs which was burned until completion to produce a fire representing one which may
occur in an office building. Temperatures were measured using thermocouples which were placed
at 300 mm below ceiling level throughout the compartment, and at points of interest on structural
components, particularly at the mid-span of beams and on the plates of the connections adjacent
to the bolts.
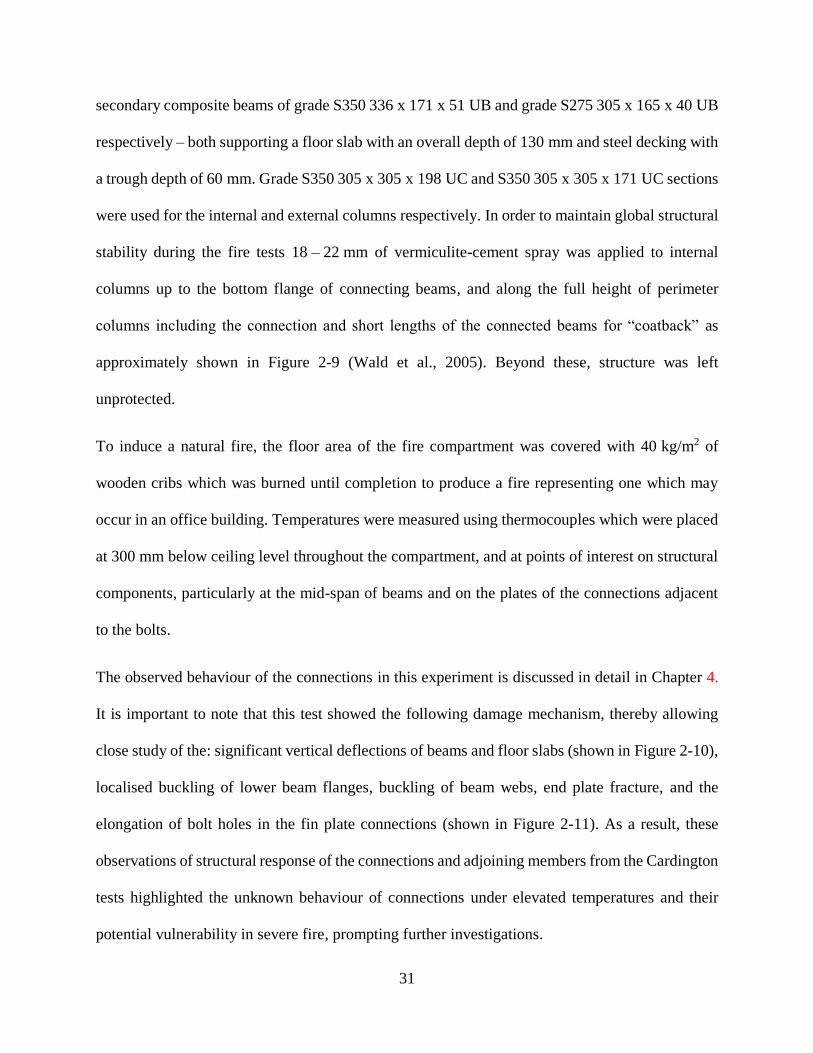
The observed behaviour of the connections in this experiment is discussed in detail in Chapter 4.
It is important to note that this test showed the following damage mechanism, thereby allowing
close study of the: significant vertical deflections of beams and floor slabs (shown in Figure 2-10),
localised buckling of lower beam flanges, buckling of beam webs, end plate fracture, and the
elongation of bolt holes in the fin plate connections (shown in Figure 2-11). As a result, these
observations of structural response of the connections and adjoining members from the Cardington
tests highlighted the unknown behaviour of connections under elevated temperatures and their
potential vulnerability in severe fire, prompting further investigations.
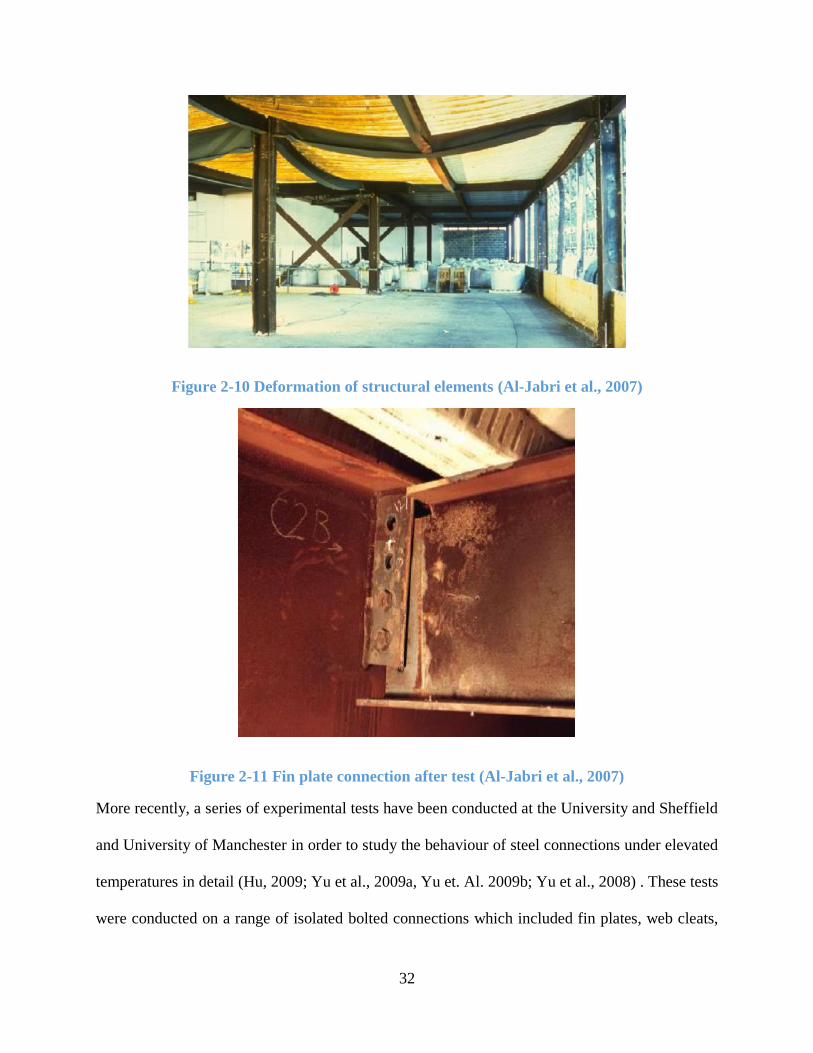
32
Figure 2-10 Deformation of structural elements (Al-Jabri et al., 2007)
Figure 2-11 Fin plate connection after test (Al-Jabri et al., 2007)
More recently, a series of experimental tests have been conducted at the University and Sheffield
and University of Manchester in order to study the behaviour of steel connections under elevated
temperatures in detail (Hu, 2009; Yu et al., 2009a, Yu et. Al. 2009b; Yu et al., 2008) . These tests
were conducted on a range of isolated bolted connections which included fin plates, web cleats,
33
and end plates in order to better understand the behaviour of individual components when
subjected to high temperatures.
In the tests, isolated beam-to-column connections with UC254x89 and UB305x165x40 sections
were placed in an electrically heated oven which slowly heated the specimens to one of four
constant temperatures: 20oC, 450oC, 550oC or 650oC. Once the test specimens had been slowly
heated to the desired temperatures, a load was then applied at an angle of 35o or 55o until failure
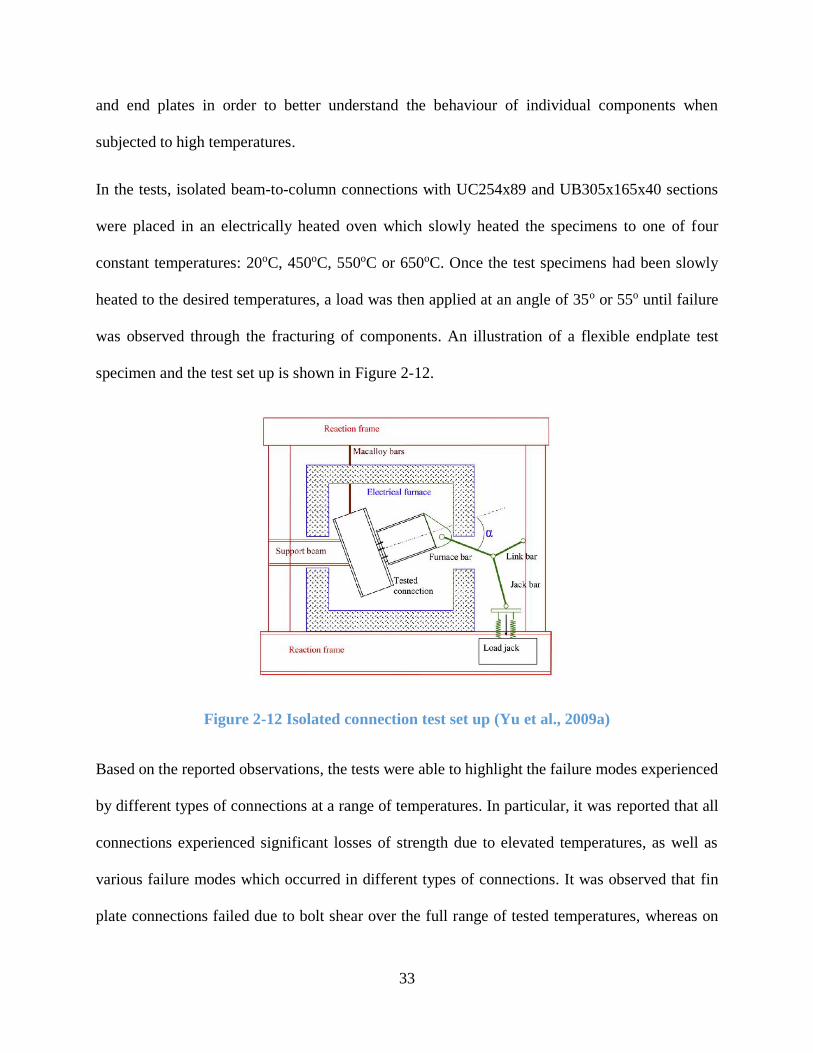
was observed through the fracturing of components. An illustration of a flexible endplate test
specimen and the test set up is shown in Figure 2-12.
Figure 2-12 Isolated connection test set up (Yu et al., 2009a)
Based on the reported observations, the tests were able to highlight the failure modes experienced
by different types of connections at a range of temperatures. In particular, it was reported that all
connections experienced significant losses of strength due to elevated temperatures, as well as
various failure modes which occurred in different types of connections. It was observed that fin
plate connections failed due to bolt shear over the full range of tested temperatures, whereas on
34
the other hand, the endplate tests showed that the connections failed as a result of endplate fracture
at temperatures below 450oC, and bolt fracture at temperatures above 550oC. However as the test
specimens were held at a steady state temperature before a load was applied and that the
experimental set up of the unrestrained beam did not allow for the influence of axial forces caused
by thermal expansion/contraction which arose in the Cardington frame tests, the results from this
test do not fully represent the behaviour of connections in a fire with increasing temperatures.
Nonetheless, the overall results from these experiments highlighted the vulnerability of the steel
connections under elevated temperatures due to the decrease in strength.
In order to more accurately represent the axial forces acting on various beam-to-column
connections as a result of catenary action and thermal expansion of connecting beams, experiments
at the University of Manchester have been undertaken on the behaviour of steel connections in fire
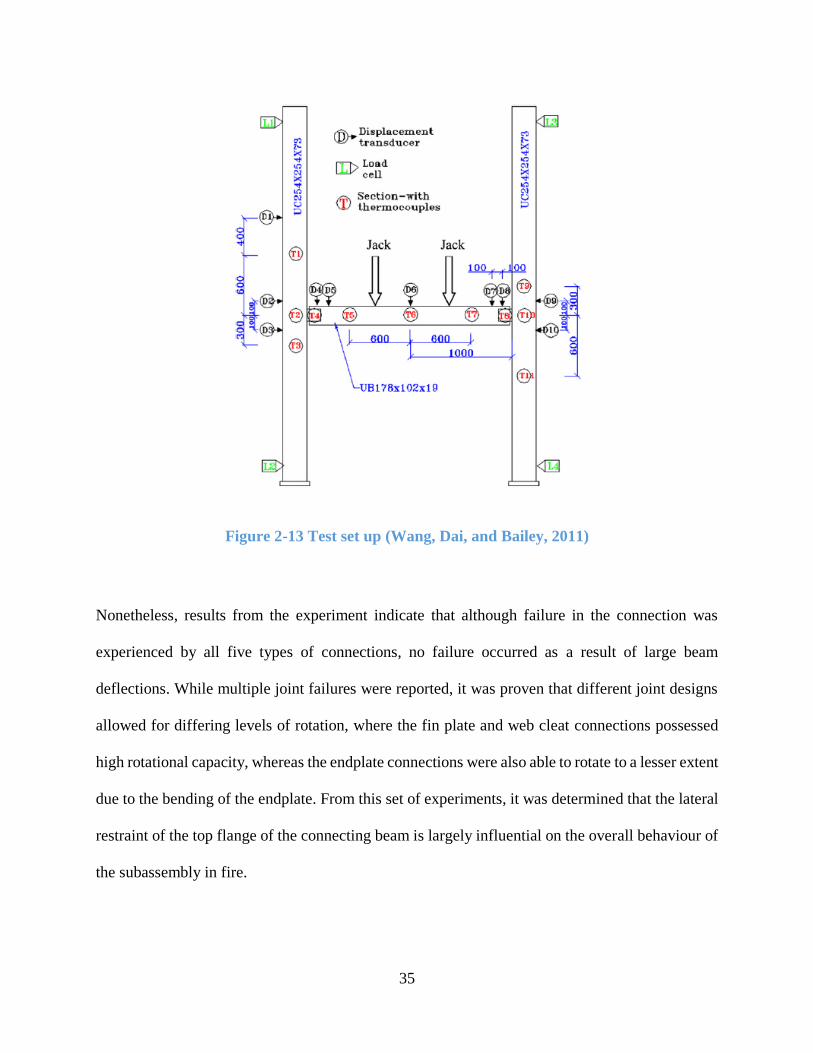
based on frames in the Cardington tests (Liu et al., 2002; Y. C. Wang et al., 2011). As shown in
Figure 2-13, the experiments consisted of H-shaped frames; each with two columns
(UC254x254x73 or UC152x152x23) and a connecting UB178x102x19 beam connected with
different types of joints including fin plate, web cleat, flush endplate, flexible endplate and
extended endplate. To simulate the effect of a concrete slab on the beam in real construction, the
top flange was covered with a ceramic fiber blanket and supported laterally by a specially designed
steel truss. All other parts of the frame were left unprotected.
In the experiment, the frames were placed inside a gas furnace where two point loads of 40kN
magnitude were applied by jacks as shown in Figure 2-13. The gas furnace then applied heat to
elevate the internal temperature to follow the standard fire curve. However due to the small furnace
and relatively large sample, it was reported that the temperature inside the furnace varied up to
200oC in different areas.
35
Figure 2-13 Test set up (Wang, Dai, and Bailey, 2011)
Nonetheless, results from the experiment indicate that although failure in the connection was
experienced by all five types of connections, no failure occurred as a result of large beam
deflections. While multiple joint failures were reported, it was proven that different joint designs
allowed for differing levels of rotation, where the fin plate and web cleat connections possessed
high rotational capacity, whereas the endplate connections were also able to rotate to a lesser extent
due to the bending of the endplate. From this set of experiments, it was determined that the lateral
restraint of the top flange of the connecting beam is largely influential on the overall behaviour of
the subassembly in fire.
36
2.5.2 Analytical Investigations
Liu (1996) was amongst the first who attempted to model the behaviour of steel connections using
finite element software (Al-Jabri et al., 2007). Using eight-noded isoparametric elements, Liu was
able to model the behaviour of different types of joints using a model developed using the finite
element software FEAST which considered the non-linear thermal expansion and behaviour of
steel. Analysis of the data from the models created in this study displayed a close agreement with
experimental data for different types of joints and hence was able to demonstrate the capability of
using finite element analysis to model steel connections (Al-Jabri et al., 2007).
Al-Jabri (1999) conducted three-dimensional finite element models of flush endplate steel
connections under elevated temperatures both with and without the contribution of a composite
slab. In these models, the connections were created using the finite element software ABAQUS,
where each component in the model was represented by a three-dimensional brick element. These
models also took into account the non-linear strength properties of steel, as well as the interaction
between the components as the connection deformed at higher temperatures by using Coulomb
friction. In comparison with the experimental data, the finite element models exhibited relatively
close results regarding the moment-rotation temperature characteristics and the failure modes in
both elastic and plastic regions.
In the work by Sarraj (2007), the author studied the behaviour of steel fin plate connections under
elevated temperatures, also using the finite element program ABAQUS. Sarraj (2007) was able to
introduce and successfully achieve the effect of the interaction between the bolts and the fin plate
caused by the rotation of the connection. As a result, the finite element models of steel fin plate
connections provided a good understanding of the behaviour of shear connections under elevated
temperatures, where load and displacement data was created for the beam web bolt holes in bearing
37
and the bolts in shear. The reported data was validated against tests on lap joints at ambient
temperatures, and also an experimental test conducted at the Czech Technical University by (Wald
et al., 2005) and also provided a benchmark for future researchers studying similar connections.
Overall, this research was paramount in modeling the shear interactions at ambient and elevated
temperatures, capturing failure mechanisms of bolt shearing and plate bearing.
Following the tests on isolated steel beam-to-column connections at the Universities of Sheffield
and Manchester, the authors were then able to recreate the web-cleat and endplate connections
over a range of steady state temperatures using ABAQUS (Hu, 2009; Hu et al., 2008; Yu et al.,
2009b). In the models, it was demonstrated that ABAQUS was able to accurately determine and
predict the behaviour and failure modes of steel connections at both ambient and elevated
temperatures, with the numerical solutions in good agreement with experimental results. However,
it was reported that the models are unable to accurately predict the failure of components, which
may lead to an increased ultimate load carrying capacity in the finite element analysis.
More recently, research on steel beam-to-column connections under elevated temperatures using
the finite element analysis software ABAQUS has placed focus on the influence of frame
assemblies with realistic structural behaviour which accounts for forces gained as a result of
restrained connections, where beams undergo thermal expansion and catenary action with
temperatures increasing and decreasing in accordance with a realistic fire scenario. Selamet and
Garlock (2014), were able to use the finite element software to model fin plate connections
between the secondary and primary beams in Cardington Test 7. In their model, the authors were
able to develop deflections in their beam during both the heating and cooling phases which were
comparable to those recorded in the experimental test. Although their models were able to recreate
the buckling behaviour in the bottom flange of the beam as observed in the experiment, it was
38
reported that the connection in the numerical analysis had shown extensive distortion in the beam
web due to bolt bearing without failure, whereas it was reported that the fin plate connections in
the Cardington test failed due to bolt shear as shown in Figure 2-11. This may be a result of the
model not including a physical component for the concrete slab due to simplicity - instead, the
effect of the slab was taken into account through the use of vertical spring elements along the top
flange of the beam. Despite the spring elements being able to feature a varying stiffness with
temperature similar to that of a concrete slab, the springs do not provide the same horizontal
stiffness of a floor slab which is likely to influence the behaviour and ultimately the failure mode
of the connection.
In the research conducted by Selamet and Bolukbas (2016) the authors modelled a subassembly of
a floor from an existing tall steel building exposed to fire in Istanbul, Turkey. In this study, the
authors examined the fin plate connection of a particular bay which was geometrically comparable
to that of the Cardington test, with a trapezoidal floor slab supported by secondary and primary
beams of 9 m and 6 m lengths respectively. In their model, the authors incorporated the floor slab
by assuming a rectangular profile which was permanently fixed to the top flange of the beam using
the “Tie” function in ABAQUS. Although the modelled subassembly also incorporated
temperatures similar to those recorded in the Cardington test in both the heating and cooling
phases, it was reported that this model ultimately showed the bolts in the fin plate to fail as a result
of the axial forces developed in the beam as it contracted when cooled. Compared to the study
conducted by Selamet and Garlock (2014), it is evident that the influence associated with
incorporating the concrete slab in the model will alter the behaviour of the connection, and should
be included when modelling experiments with composite floors to ensure accuracy.
39
These connection studies have all been undertaken overseas, on simple connections not designed
and detailed for dependable ductility. This project is based on determining the performance under
elevated temperatures of simple connections designed and detailed such that their load carrying
capacity is maintained during the levels of rotation expected in severe earthquakes.
2.6 Research Approach
Undertaking experimental testing on structural components at elevated temperature is expensive
and time consuming, and not currently possible in New Zealand. Hence the use of accurate
modelling techniques is necessary has been looked upon as the desirable method for understanding
the behaviour of steel structures in fire. This has led the increasing use of finite element modeling
in commercial software such as ABAQUS being used structural fire engineering applications
(Wang, 2002).
As highlighted in Section 2.5 the finite element analysis software ABAQUS has been well
established to be able to predict and model the behaviour of steel and concrete composite structures
in fire, exemplified through its ability to recreate test results gained from the Cardington fire tests,
where structural phenomenon such as member buckling and tensile membrane action were able to
be numerically analysed and verified with experimental results (M.; Gillie et al., 2001; Moss and
Clifton, 2004). Utilising the numerous modelling elements with various advantages provided by
ABAQUS, the software has indicated its capability in accurately modelling details of structural
components and behaviour such as buckling, torsion as a result of elevated temperatures (Hu,
2009).
More recently, researchers have been able to successfully and accurately model the behaviour of
detailed connections in fire, where the connections were both isolated and as a part of a larger
40
structure, having been validated against experimental test data (Dai et al., 2010; Sarraj et al., 2007;
Selamet and Garlock, 2014; Yu et al., 2009b). The models used three-dimensional brick elements
in order to replicate the behaviour of components such as bolts and plates which naturally behave
in three dimensions and are not able to be accurately simulated using two dimensional models. As
a result, finite element modelling using ABAQUS has been established as a relatively efficient
method of studying the behaviour of steel connections in fire and hence will be used as an as
analytical tool for this investigation.
In order to understand the functions and capabilities of the software, ABAQUS, steel connection
assemblies have first been modelled based on the physical and numerical experiments undertaken
by previous researchers which are of similar geometries to the web side plates and flexible end
plate connections used in New Zealand. This was completed in order to validate the understanding
and proficiency of using ABAQUS by comparing the model with experimental speculations such
as the displacement-temperature curves, failure modes and general observations. Due to the current
lack of experimental data regarding the behaviour of New Zealand steel connections in fires and
lack of experimental testing capability in New Zealand, this approach will serves as a tool for
determining the accuracy of the finite element models developed in the later stages of this study.
In particular, the experimental tests conducted by the University of Manchester and University of
Sheffield on simple connections have firstly been modelled based on the tests being undertaken on
isolated joints, where modelling particular scenarios from this set of experiments allows for a
comparatively simpler modelling approach due to the relatively small number of components
compared to tests involving a structural frame. Based on the tests on endplate and angle cleat
connections having been previously modelled using ABAQUS (Yu et al., 2009a; H. Yu et al.,
2011), this study has utilised the previously documented techniques to model the fin plate
41
connection tests in order to provide a basis for accurately understanding the modelling packages
offered by the software.
Upon successfully modelling the experimental investigations on isolated connections, a beam-to-
column flexible endplate connection which experienced fracture during Cardington Test 7 was
then modelled to allow for better understanding of the behaviour of the connection in a real fire,
given the focus of this study on beam-to-column connections and that the beam-to-beam fin plate
connections of the Cardington test having been previously studied (Selamet and Garlock, 2014).
It is recognised that the documented results from the experiment will yield greater difficulty to
replicate due to the connection being attached to a large structural frame with steel and concrete
composite floors being exposed to a fire with transient temperatures. However, the benefit
encompasses its higher accuracy in representing the behaviour of an authentic steel connection
under elevated temperatures by taking the influence of the structural frame and varying
temperatures due to the heating and cooling of a natural fire into consideration.
Following the validation of the finite element models with experimental results, the steel
connections specified within the models were then redesigned in accordance with the relevant New
Zealand standard which include the design against seismic loading. These connections were then
analysed to determine their behaviour in the Cardington fire, ultimately providing a basis of
understanding and comparing between the performance differences as a result of differing design
philosophies between New Zealand and the U.K.
3 Development of Finite Element Models
As a result of the significant experimental and numerical research that has been undertaken on
structural fire performance in Europe since the 1990’s, the development of numerical software
42
based on the use of finite elements to analyse the complex behaviour of structures in fire have been
established to provide engineers and researchers with tools for understanding the physics behind
these behaviours (M. Gillie et al., 2001; Huang et al., 1999).
For the purpose of structural fire engineering, the available numerical software consists of general
purpose finite element programs such as ABAQUS, ANSYS or LS Dyna, and specific structural
fire engineering software packages such as Vulcan (Huang et al., 2004) or SAFIR (Franssen,
2005). The software listed herein are able to predict the behaviour of structures in fire by
considering non-linear behaviour resulting from actions such as thermal elongation, large
displacements, and non-linear temperature dependent material properties (Lim and Feeney, 2015).
The listed programs exhibit specific advantages and disadvantages, and have previously shown to
be capable of modelling the behaviour of various structural components in fire. However, when
specifically modelling the detailed behaviour of steel connections, it was found that three-
dimensional models available in general purpose software such as ABAQUS, ANSYS, or LS Dyna
were able to produce results with increased displacements and stresses , and hence more accurate
results than two-dimensional models such as those generally offered by specific structural
engineering software (Krishnamurthy and Graddy, 1976; Kukreti et al., 1987a). Furthermore,
given that the behaviour of bolted steel connections is three-dimensional, they cannot be
satisfactorily represented by two-dimensional models (Vegte, 2004).
As such, study utilises the general purpose finite element software – ABAQUS due to its
availability within the University of Canterbury and its advantages in its versatility in modelling
different materials and rich element library which allows for various types of analysis including
heat transfer and mechanical, which can then be combined in a coupled thermal and mechanical
analysis (Buchanan and Abu, 2017). Subsequently, these advantages have allowed previous
43
researchers to accurately model and validated the behaviour of steel connections in fire (Hu, 2009;
Selamet and Garlock, 2014; Yu et al., 2009b). However, given that ABAQUS is a general-purpose
finite element software, its range of modelling packages must first be understood in order to
produce valid results.
3.1 Recreation of Isolated Fin-Plate Connections
For the purpose of understanding the modelling packages and techniques associated with
ABAQUS including the types of available analysis, selection of finite elements and boundary
conditions, contact interactions and input of material properties through, this section of the study
investigates and recreates the isolated fin plate connection experiments undertaken by Yu et al.
(2009a) through the use of the finite element software.
As discussed in Chapter 2, the Universities of Manchester and Sheffield undertook projects
investigating the behaviour of isolated steel connections under constant elevated temperatures.
Grade 8.8 M20 bolts were used in all tests, in addition to the columns and beams constructed of
Grade S355 UC254×89 and Grade S275 UB305×165×40 sections respectively, and a custom-
made connector for the application of loads bolted to the end face of the beam as shown in Figure
3-1(Yu et al., 2009a, 2009b; H. Yu et al., 2011). These tests were performed on a range of isolated
connections in an electric furnace which slowly heated the samples to a constant temperature, with
increasing loads applied at 35o or 55o angles until failure was reached. Specifically, this study
focuses on the recreation of the tested fin plate connection as it has not been modelled by previous
researchers.
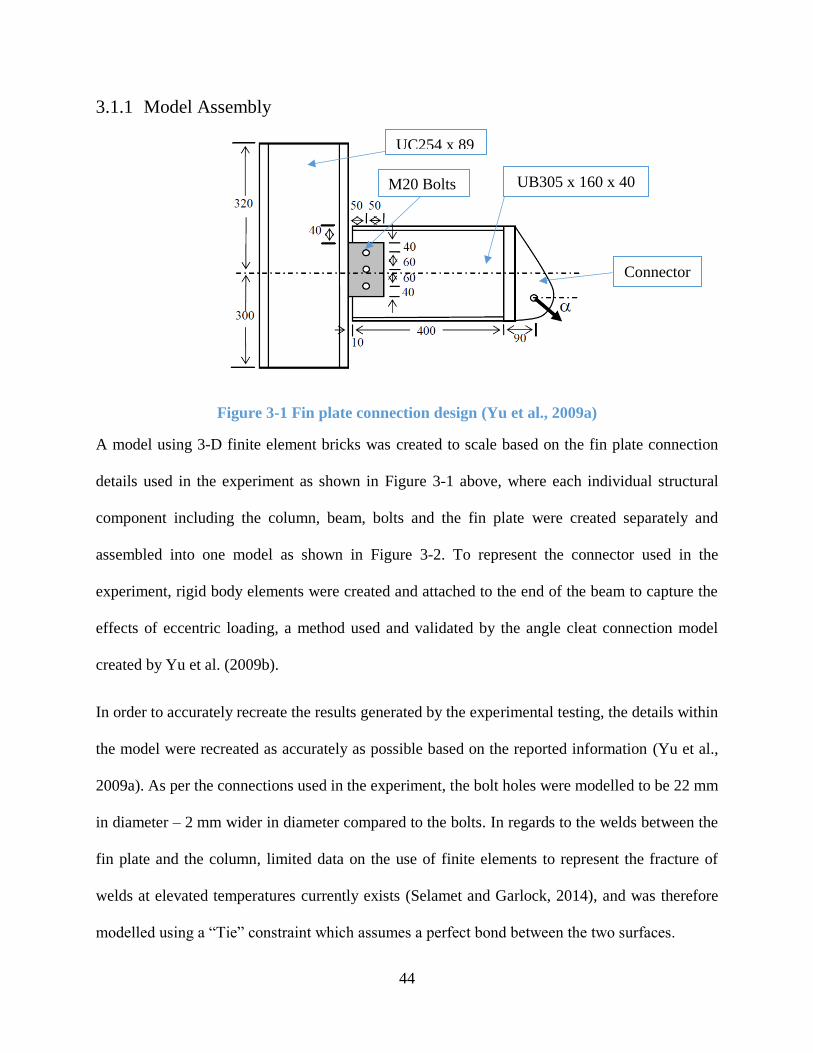
44
3.1.1 Model Assembly
Figure 3-1 Fin plate connection design (Yu et al., 2009a)
A model using 3-D finite element bricks was created to scale based on the fin plate connection
details used in the experiment as shown in Figure 3-1 above, where each individual structural
component including the column, beam, bolts and the fin plate were created separately and
assembled into one model as shown in Figure 3-2. To represent the connector used in the
experiment, rigid body elements were created and attached to the end of the beam to capture the
effects of eccentric loading, a method used and validated by the angle cleat connection model
created by Yu et al. (2009b).
In order to accurately recreate the results generated by the experimental testing, the details within
the model were recreated as accurately as possible based on the reported information (Yu et al.,
2009a). As per the connections used in the experiment, the bolt holes were modelled to be 22 mm
in diameter – 2 mm wider in diameter compared to the bolts. In regards to the welds between the
fin plate and the column, limited data on the use of finite elements to represent the fracture of
welds at elevated temperatures currently exists (Selamet and Garlock, 2014), and was therefore
modelled using a “Tie” constraint which assumes a perfect bond between the two surfaces.
UB305 x 160 x 40 M20 Bolts
UC254 x 89
Connector
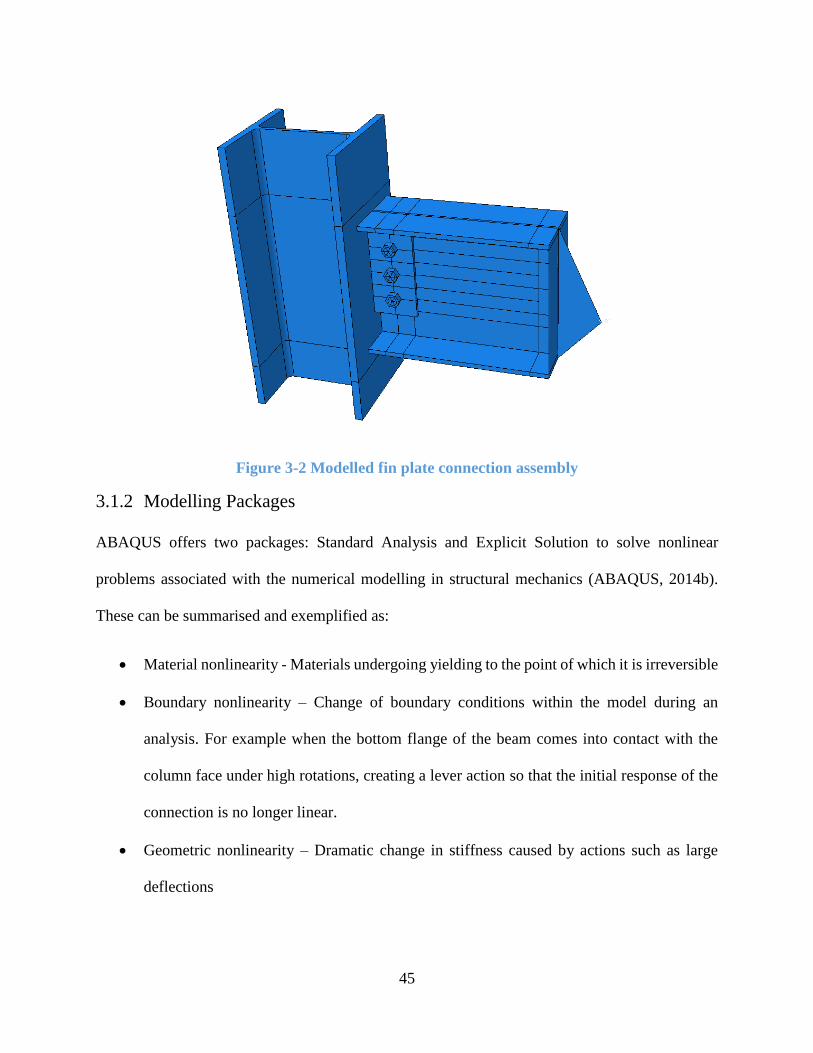
45
Figure 3-2 Modelled fin plate connection assembly
3.1.2 Modelling Packages
ABAQUS offers two packages: Standard Analysis and Explicit Solution to solve nonlinear
problems associated with the numerical modelling in structural mechanics (ABAQUS, 2014b).
These can be summarised and exemplified as:
• Material nonlinearity - Materials undergoing yielding to the point of which it is irreversible
• Boundary nonlinearity – Change of boundary conditions within the model during an
analysis. For example when the bottom flange of the beam comes into contact with the
column face under high rotations, creating a lever action so that the initial response of the
connection is no longer linear.
• Geometric nonlinearity – Dramatic change in stiffness caused by actions such as large
deflections
46
ABAQUS/Standard uses an implicit numerical solution based on linear and nonlinear equations
which rely on static equilibrium throughout the structure (Vegte, 2004).This requires the solution
to converge at each given time step, using the Newton-Raphson method and adjusting the time
increments by default in order to provide nonlinear solutions. According to Hu (2009), although
this approach is suitable for a wide range of nonlinear problems, instabilities may arise from
nonlinear structural phenomena such as buckling/distortions or changes in stiffness due to fire. To
overcome these instabilities, ABAQUS/Standard offers two solutions by adding – volume
proportional damping, and utilizing the Arc-Length algorithm (Riks Method). Nonetheless, it has
been reported that models with numerous complicated interactions such as those present in steel
connections are likely to face difficulties in providing a smooth solution (Hu, 2009).
ABAQUS/Explicit offers a numerical package where the forces and displacement of each node is
calculated to progress through time increments using a dynamic approach. Instead of requiring
convergence at each time step, the explicit solver determines the forces in the body by first
assuming that there is no contact between subsequent time steps. In an occurrence of overclosure
(overlapping of contacting surfaces), the model then calculates and adopts the forces and
displacements required to maintain contact between bodies (Vegte, 2004). This approach allows
for certain advantages over the Standard solver including cases where instances are not initially in
contact, such as bolts in clearance holes, which are designed to be 2 mm larger in diameter. Using
the Standard solver, this results in a numerical singularity error unless the bolts are initially and
carefully aligned with the components in contact under load which is difficult and inefficient for
structural components with complicated load paths (Yu et. al, 2008) . Additionally, this issue is
likely to cause convergence issues within the Standard solver when modeling components with
large numbers of contact pairs such as bolted connections, as it is very difficult for the solver to
47
achieve convergence of all contact pairs at each time step (Yu et al., 2008). Hence based on the
validation and recommendation of using the explicit solver to model steel connections in fire by
previous researchers (Hu, 2009; Yu et al., 2008), ABAQUS/Explicit is adopted in this study.
3.1.3 Finite Element Library
Within ABAQUS, the software includes a large range of pre-programmed hexahedron (brick),
shell, contact and beam elements which have different properties and functions based on the
application for which they are applied. Specifically for modeling the deformation behaviour of
bolted steel connections, the finite element models created for this research will use three-
dimensional brick elements, as they produce results with significantly more accurate deformations
when compared to the same models created with two-dimensional shell elements (Kukreti et al.,
1987b).
To best represent the plasticity-type problems such as those involving the behaviour of steel
connections, first order elements will be used to in order to accurately model the yield lines and
strain fields experienced by the connection under load. There are three types of first order brick
elements integrated into ABAQUS: C3D8, C3D8R and C3D8I, which differ based on their
integration due to varying numbers of Gauss points (ABAQUS, 2014b). Where the C3D8 element
with full integration and 8 Gauss points produces a shear locking phenomenon when simulating
structures in bending which may overestimate failure loads (Bursi and Jaspart, 1998), the C3D8R
elements with reduced integration and hourglass control underestimate the strength value and
plastic failure load due to its theoretical formulation, and C3D8I elements with full integration and
incompatible modes perform comparatively well for simulating elastic, plastic and bending
behaviour. Hence, based on the research conducted and models created by previous researchers,
48
C3D8R elements will be used for this study due to its suitability in controlling hourglass modes,
allowing for a conservative prediction of behaviours (Hu et al., 2008).
3.1.4 Contact Modeling
In order to model the contact between elements in ABAQUS, the standard analysis provides two
formulations for the calculation being “small sliding” and “finite sliding” (ABAQUS, 2014c),
where the “small sliding” formulation is computationally less expensive as it only accounts for
contact surfaces which undergo relatively limited movements and permits arbitrary rotation of the
elements. On the other hand, the “finite sliding” formulation accounts for instances where the
elements may slide, separate and rotate in finite amplitudes. The explicit analysis used in
ABAQUS incorporates varied contact equations where the friction conditions between surfaces is
represented by the Coulomb friction model which has been proven to be suitable for analyzing
steel (Charlier and Habraken, 1990). In this, the model considers the effects of surface weighting
and tracking, as well as the sliding formulation, ultimately allowing for greater efficiency when
modeling elements that engage in contact or separate during an analysis. In the present model, the
“finite sliding” formulation was used with a friction co-efficient of 0.3 for all contact surfaces
based on previous studies on modelling the behavior of steel connections (Dai et al., 2010).
As there is currently limited experimental or numerical data on the behaviour of welds under
elevated temperatures, the welded section between the fin plate and the column has been modeled
using the TIE command in ABAQUS, which represents a perfect bond by not allowing for any
relative motion between them (ABAQUS, 2014b).
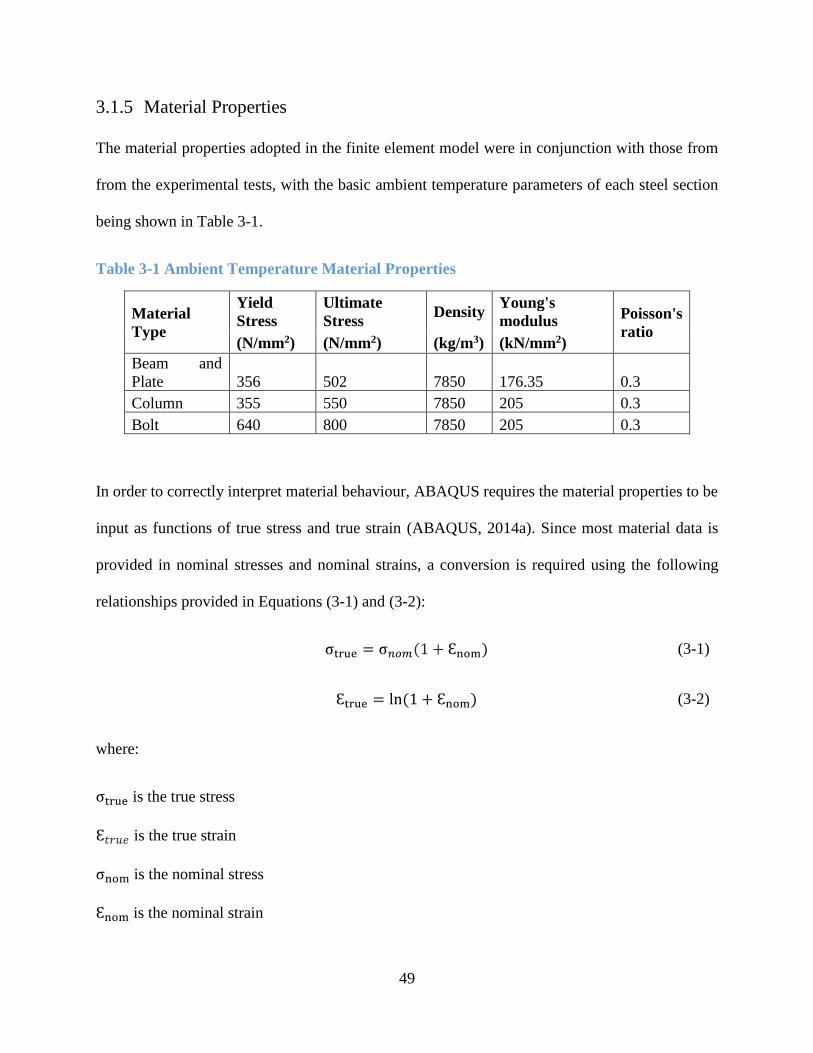
49
3.1.5 Material Properties
The material properties adopted in the finite element model were in conjunction with those from
from the experimental tests, with the basic ambient temperature parameters of each steel section
being shown in Table 3-1.
Table 3-1 Ambient Temperature Material Properties
Material
Type
Yield
Stress
Ultimate
Stress Density
Young's
modulus Poisson's
ratio (N/mm2) (N/mm2) (kg/m3) (kN/mm2)
Beam and
Plate 356 502 7850 176.35 0.3
Column 355 550 7850 205 0.3
Bolt 640 800 7850 205 0.3
In order to correctly interpret material behaviour, ABAQUS requires the material properties to be
input as functions of true stress and true strain (ABAQUS, 2014a). Since most material data is
provided in nominal stresses and nominal strains, a conversion is required using the following
relationships provided in Equations (3-1) and (3-2):
σtrue = σ𝑛𝑜𝑚(1 + Ɛnom)
(3-1)
Ɛtrue = ln (1 + Ɛnom)
(3-2)
where:
σtrue is the true stress
Ɛ𝑡𝑟𝑢𝑒 is the true strain
σnom is the nominal stress
Ɛnom is the nominal strain
50
When inputting the parameters into ABAQUS, strain is required to be entered separately as true
elastic strain (Ɛ𝑒𝑙,𝑡𝑟𝑢𝑒) and plastic strain (Ɛ𝑝𝑙,𝑡𝑟𝑢𝑒) defined by equations provided by ABAQUS
(2014b), and commonly found literature on structural analysis.
Upon determining the material properties at ambient temperature, the material properties of stress,
strain and Young’s Modulus at varying temperatures of the steel components can then be related
based on the equations provided by EC 3 Part 1.2 as described in Chapter 2 of this report.
3.1.6 Boundary Conditions and Loading
In order to accurately replicate an experimental test, it is vital that the boundary conditions applied
to the numerical model closely match those used in experimental set up. In the case of the isolated
connection tests, the boundary conditions used in the numerical simulation were as follows:
• Encastre (fully fixed) top and bottom column surfaces
• The end of the rigid plate at which the load was applied is not permitted to move or rotate
in lateral directions
The load applied to the end of the rigid plate was divided into vector forces in directions according
to the 35 and 55 degree load angles to apply different combinations of shear and tying forces to
the connections (Yu et. al, 2007). This load is applied using a smooth step amplitude curve which
promotes a quasi-static solution by applying the load in a gradual approach. By default,
ABAQUS/Explicit applies loads instantaneously which may produce undesirable results by
inducing the propagation of stress waves throughout the model. The use of the smooth step
amplitude curve addresses this by gradually ramping up and ramping down the loading from zero
to the maximum specified magnitude respectively (ABAQUS, 2014b).
51
3.1.7 Modelling Results of Ambient Temperature Tests
To validate the finite element model, the results and observations are compared with those from
the experiment conducted at the University of Sheffield (Yu et al., 2009a), where the main basis
of comparison arose from the documented Force-Rotation graphs and the observed yielding and
failure of structural components as illustrated by the solid line in Figure 3-3 for a fin plate
connection test with loading at 35o at ambient temperature conditions.
As shown in the Force-Rotation graph in Figure 3-3 corresponding to the ambient temperature test
with a load angle of 35o, the results gained from the finite element analysis show close agreement
with those gained from the experimental study. It can be observed that although the modelled
relationship between force and rotation follow an agreeable relationship with the experimental
result up to the point of failure, some discrepancies between the two graphs do exist.
Firstly, it can be observed in Figure 3-3 that a difference between the initial rotations of the
connection exists between the finite element model (F.E.M.) and experimental test. It can be
observed that while the experimental test requires a force of approximately 10 kN to actualise
rotation in the connection, the numerical analysis requires zero force up to a rotation of 1.7 degrees.
This discrepancy in the initial stages of the finite element analysis is considered to result from the
contribution of rotational stiffness from the pretension force applied to the bolts in the
experimental tests, which was not considered in the finite element model due to the lack of data
available.
.
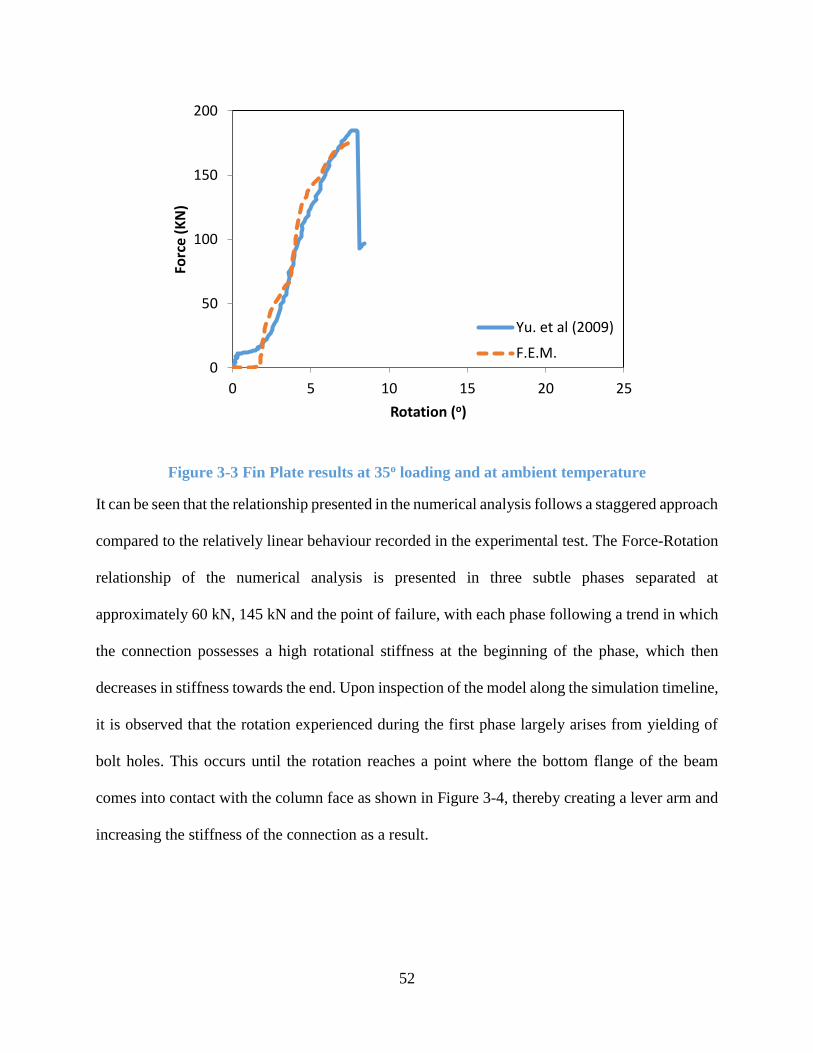
52
Figure 3-3 Fin Plate results at 35o loading and at ambient temperature
It can be seen that the relationship presented in the numerical analysis follows a staggered approach
compared to the relatively linear behaviour recorded in the experimental test. The Force-Rotation
relationship of the numerical analysis is presented in three subtle phases separated at
approximately 60 kN, 145 kN and the point of failure, with each phase following a trend in which
the connection possesses a high rotational stiffness at the beginning of the phase, which then
decreases in stiffness towards the end. Upon inspection of the model along the simulation timeline,
it is observed that the rotation experienced during the first phase largely arises from yielding of
bolt holes. This occurs until the rotation reaches a point where the bottom flange of the beam
comes into contact with the column face as shown in Figure 3-4, thereby creating a lever arm and
increasing the stiffness of the connection as a result.
0
50
100
150
200
0 5 10 15 20 25
Forc
e (
KN
)
Rotation (o)
Yu. et al (2009)
F.E.M.
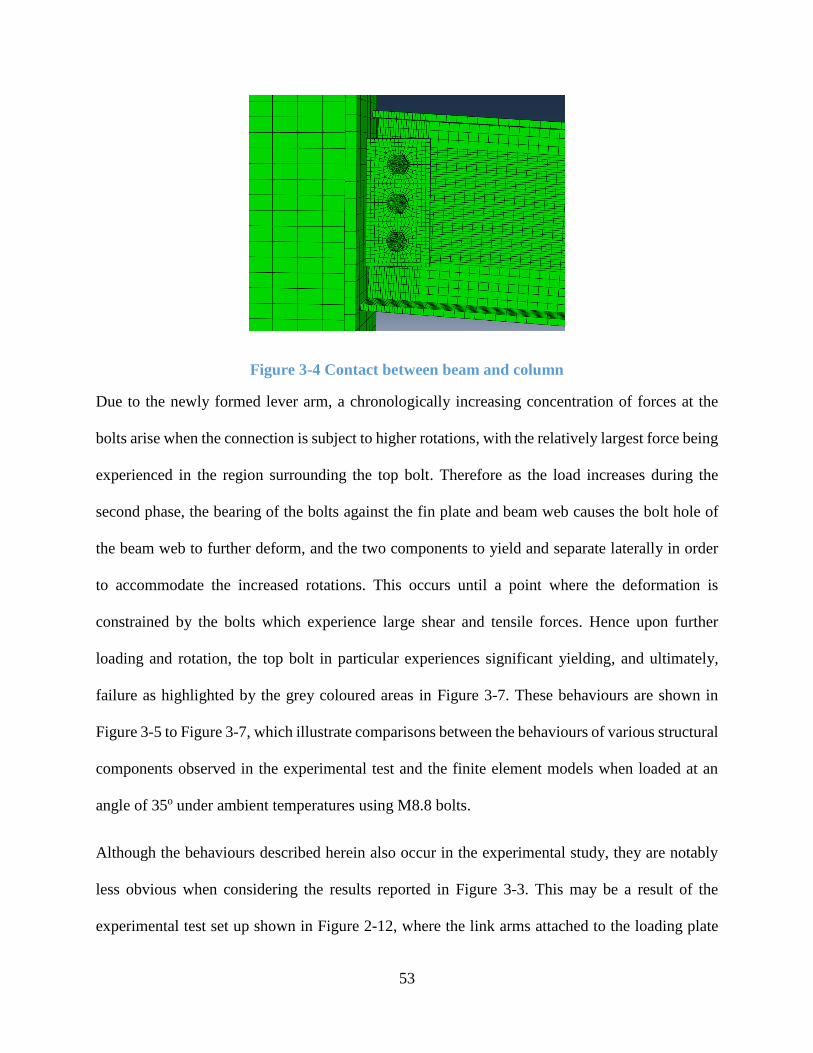
53
Figure 3-4 Contact between beam and column
Due to the newly formed lever arm, a chronologically increasing concentration of forces at the
bolts arise when the connection is subject to higher rotations, with the relatively largest force being
experienced in the region surrounding the top bolt. Therefore as the load increases during the
second phase, the bearing of the bolts against the fin plate and beam web causes the bolt hole of
the beam web to further deform, and the two components to yield and separate laterally in order
to accommodate the increased rotations. This occurs until a point where the deformation is
constrained by the bolts which experience large shear and tensile forces. Hence upon further
loading and rotation, the top bolt in particular experiences significant yielding, and ultimately,
failure as highlighted by the grey coloured areas in Figure 3-7. These behaviours are shown in
Figure 3-5 to Figure 3-7, which illustrate comparisons between the behaviours of various structural
components observed in the experimental test and the finite element models when loaded at an
angle of 35o under ambient temperatures using M8.8 bolts.
Although the behaviours described herein also occur in the experimental study, they are notably
less obvious when considering the results reported in Figure 3-3. This may be a result of the
experimental test set up shown in Figure 2-12, where the link arms attached to the loading plate
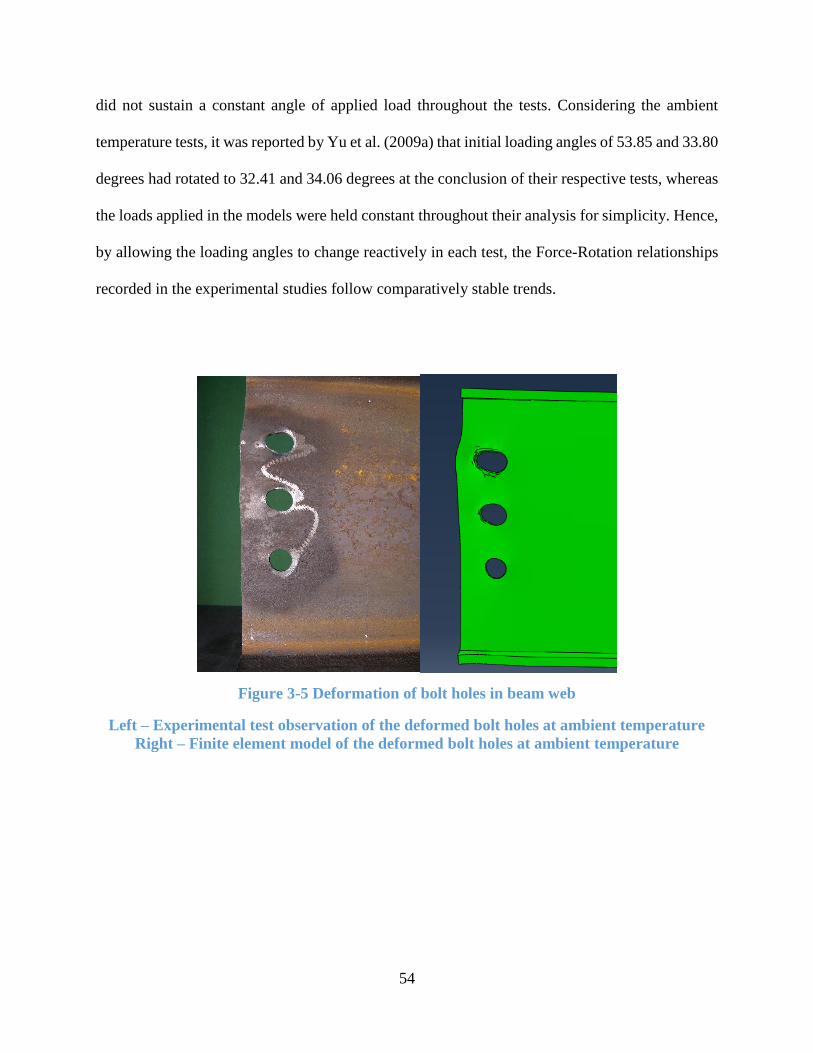
54
did not sustain a constant angle of applied load throughout the tests. Considering the ambient
temperature tests, it was reported by Yu et al. (2009a) that initial loading angles of 53.85 and 33.80
degrees had rotated to 32.41 and 34.06 degrees at the conclusion of their respective tests, whereas
the loads applied in the models were held constant throughout their analysis for simplicity. Hence,
by allowing the loading angles to change reactively in each test, the Force-Rotation relationships
recorded in the experimental studies follow comparatively stable trends.
Figure 3-5 Deformation of bolt holes in beam web
Left – Experimental test observation of the deformed bolt holes at ambient temperature
Right – Finite element model of the deformed bolt holes at ambient temperature
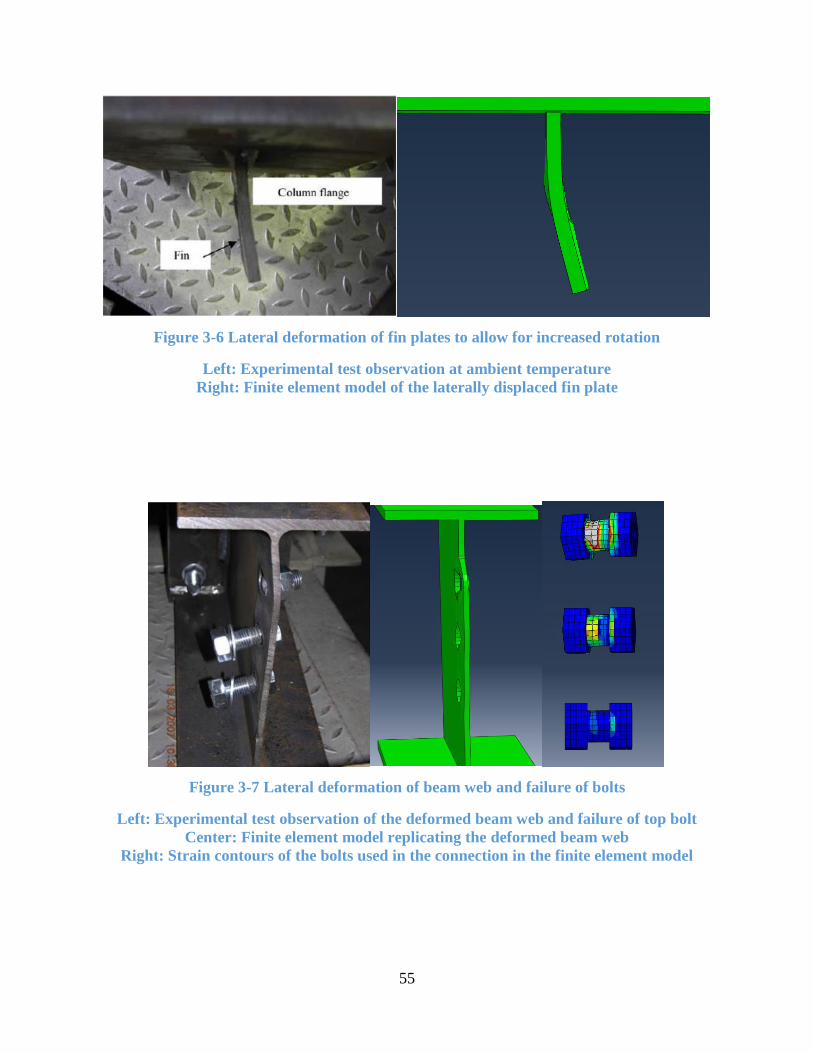
55
Figure 3-6 Lateral deformation of fin plates to allow for increased rotation
Left: Experimental test observation at ambient temperature
Right: Finite element model of the laterally displaced fin plate
Figure 3-7 Lateral deformation of beam web and failure of bolts
Left: Experimental test observation of the deformed beam web and failure of top bolt
Center: Finite element model replicating the deformed beam web
Right: Strain contours of the bolts used in the connection in the finite element model
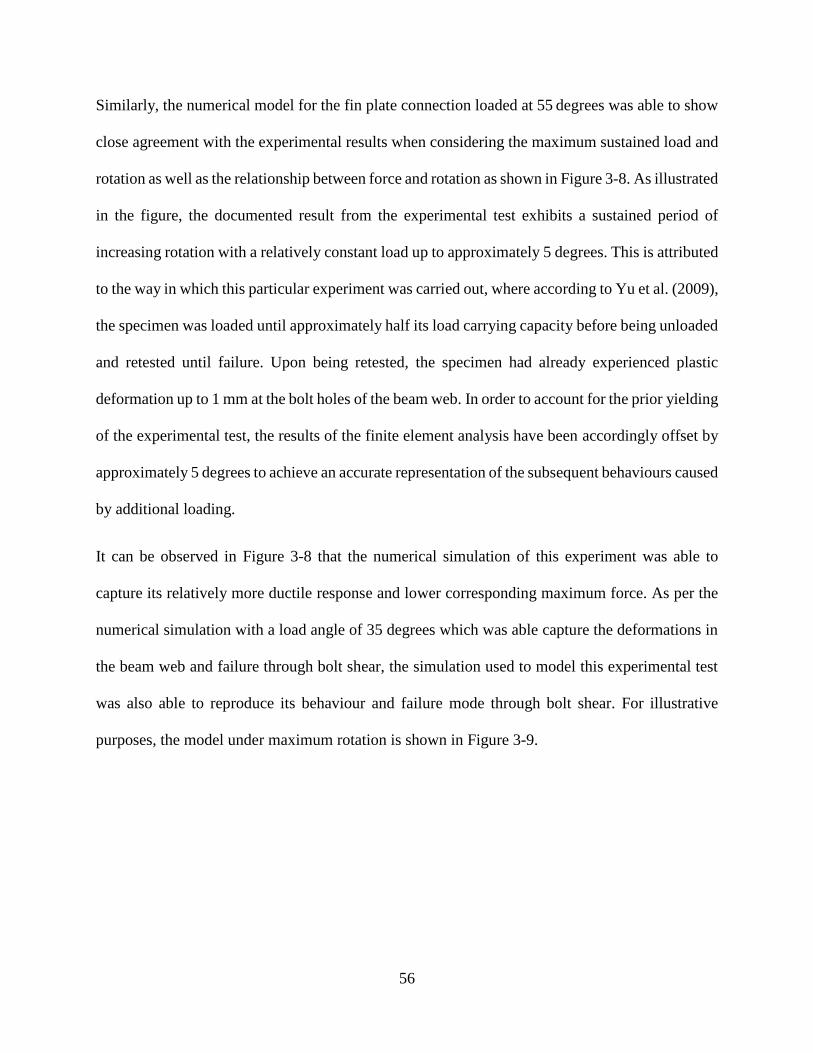
56
Similarly, the numerical model for the fin plate connection loaded at 55 degrees was able to show
close agreement with the experimental results when considering the maximum sustained load and
rotation as well as the relationship between force and rotation as shown in Figure 3-8. As illustrated
in the figure, the documented result from the experimental test exhibits a sustained period of
increasing rotation with a relatively constant load up to approximately 5 degrees. This is attributed
to the way in which this particular experiment was carried out, where according to Yu et al. (2009),
the specimen was loaded until approximately half its load carrying capacity before being unloaded
and retested until failure. Upon being retested, the specimen had already experienced plastic
deformation up to 1 mm at the bolt holes of the beam web. In order to account for the prior yielding
of the experimental test, the results of the finite element analysis have been accordingly offset by
approximately 5 degrees to achieve an accurate representation of the subsequent behaviours caused
by additional loading.
It can be observed in Figure 3-8 that the numerical simulation of this experiment was able to
capture its relatively more ductile response and lower corresponding maximum force. As per the
numerical simulation with a load angle of 35 degrees which was able capture the deformations in
the beam web and failure through bolt shear, the simulation used to model this experimental test
was also able to reproduce its behaviour and failure mode through bolt shear. For illustrative
purposes, the model under maximum rotation is shown in Figure 3-9.
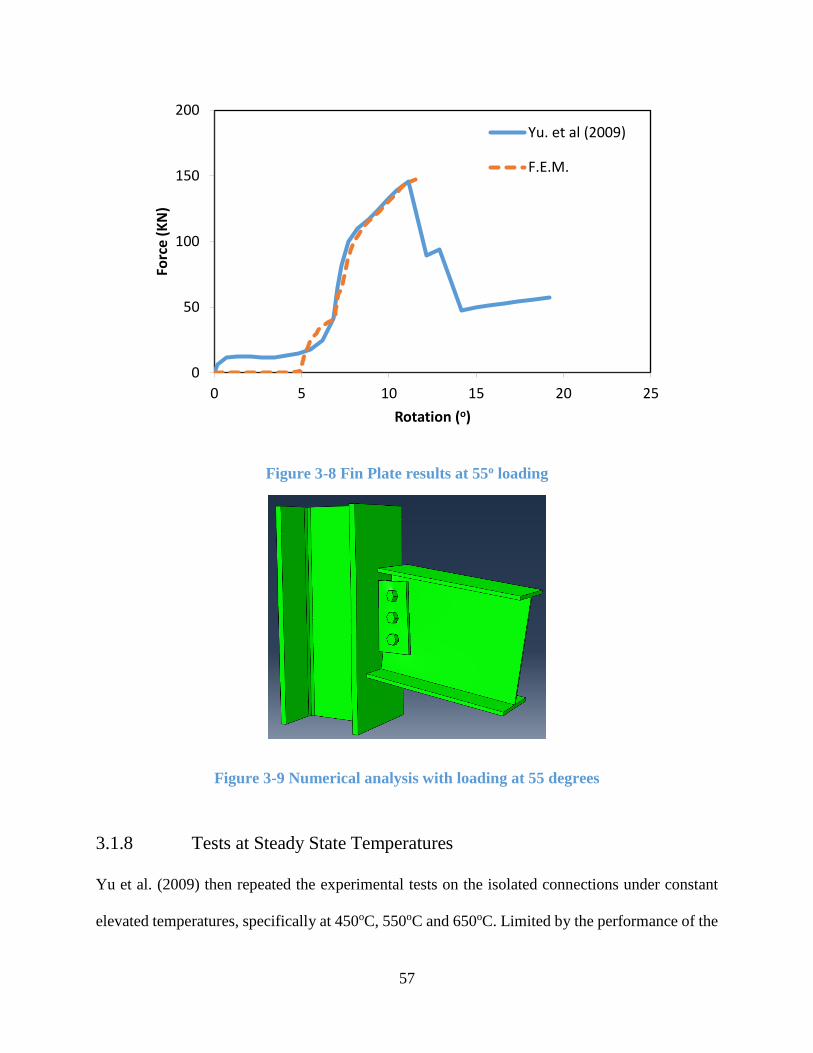
57
Figure 3-8 Fin Plate results at 55o loading
Figure 3-9 Numerical analysis with loading at 55 degrees
3.1.8 Tests at Steady State Temperatures
Yu et al. (2009) then repeated the experimental tests on the isolated connections under constant
elevated temperatures, specifically at 450oC, 550oC and 650oC. Limited by the performance of the
0
50
100
150
200
0 5 10 15 20 25
Forc
e (
KN
)
Rotation (o)
Yu. et al (2009)
F.E.M.
58
furnace, the tested specimens were heated at a slow rate - taking approximately two hours to reach
700oC. Once the specimen reaches and is maintained at the desired steady-state temperature, a load
is then slowly applied at either 35o or 55o until the specimen undergoes failure. Although this test
set up allows for a simplistic study of the performance of the various components within the fin
plate connection when held at constant temperatures, it does not provide an accurate representation
of the behaviour of steel connections as a part of a structural frame being exposed to the transient
temperatures of real fire as discussed in Section 2.5.
The methodology of applying an increasing load to a specimen at steady state temperatures results
in different behaviours of the materials. Considering the temperature dependent properties of steel
provided by EC3 (shown in Figure 2-3) are based on experimental results developed by tests
undertaken at transient temperatures for structural fire engineering purposes (Wang et. al, 2013),
they are inapplicable in the context of steady-state studies such as that described herein (Yu et al.,
2009b). Instead, the material properties of steel determined under slow loading at steady-state
temperatures which are considerably different to those provided by EC3 as illustrated in Figure
3-10, have been shown to provide good correlations for modelling the behaviour of isolated
flexible endplate and angle cleat connections at constant temperatures (Hu, 2009; Yu et al., 2009b).
However, previously undertaken studies have shown that loading in steady state conditions,
particularly in consideration of the applied strain rates have a profound effect on the overall
ductility and must be considered when determining the strength of the material (Renner, 2005).
Given that the scope of this study encompasses the behaviour of steel connections exposed to fires
with transient temperatures with limited considerations given to applied strain rates, and their
contrasting differences with the experimental test described herein, the numerical simulation of
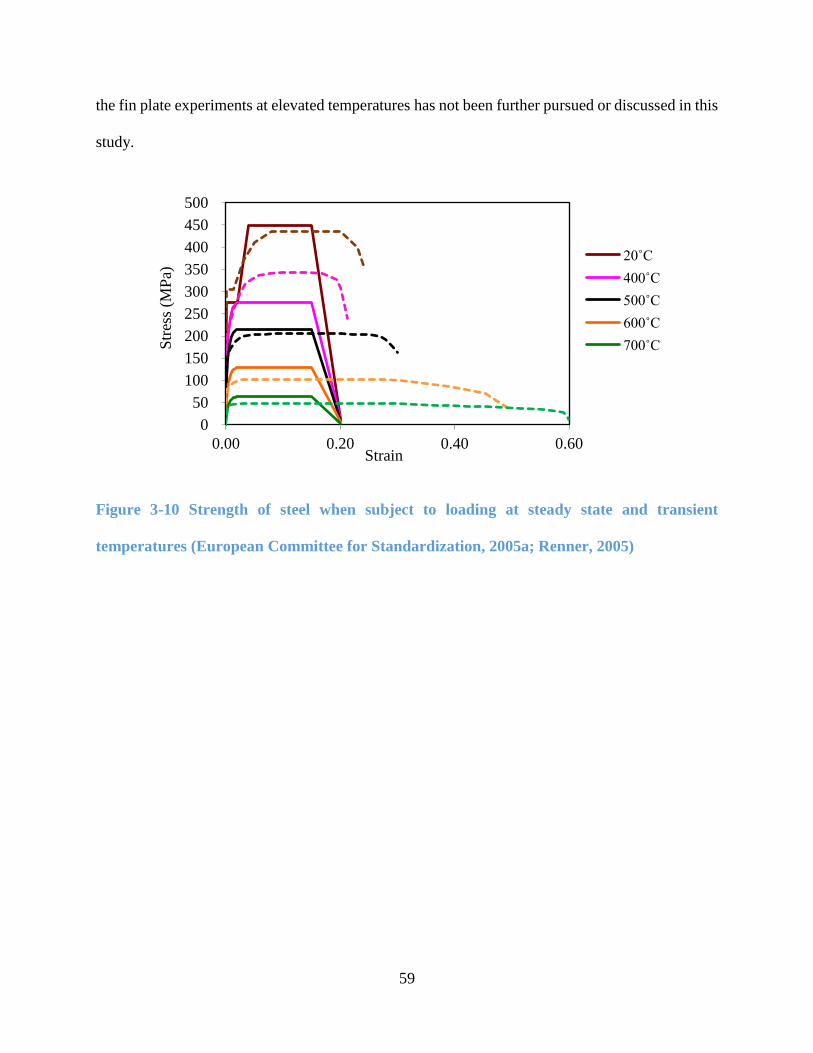
59
the fin plate experiments at elevated temperatures has not been further pursued or discussed in this
study.
Figure 3-10 Strength of steel when subject to loading at steady state and transient
temperatures (European Committee for Standardization, 2005a; Renner, 2005)
0
50
100
150
200
250
300
350
400
450
500
0.00 0.20 0.40 0.60
Str
ess
(MP
a)
Strain
20˚C
400˚C
500˚C
600˚C
700˚C
20
400
500
600
700
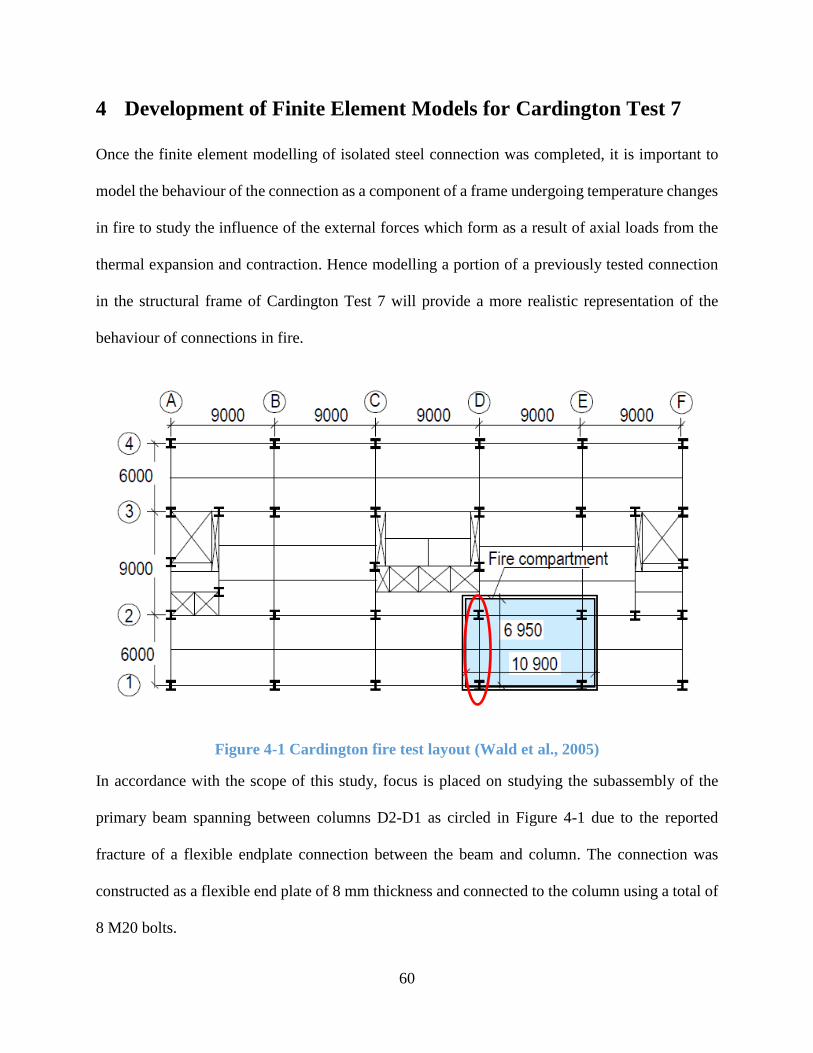
60
4 Development of Finite Element Models for Cardington Test 7
Once the finite element modelling of isolated steel connection was completed, it is important to
model the behaviour of the connection as a component of a frame undergoing temperature changes
in fire to study the influence of the external forces which form as a result of axial loads from the
thermal expansion and contraction. Hence modelling a portion of a previously tested connection
in the structural frame of Cardington Test 7 will provide a more realistic representation of the
behaviour of connections in fire.
Figure 4-1 Cardington fire test layout (Wald et al., 2005)
In accordance with the scope of this study, focus is placed on studying the subassembly of the
primary beam spanning between columns D2-D1 as circled in Figure 4-1 due to the reported
fracture of a flexible endplate connection between the beam and column. The connection was
constructed as a flexible end plate of 8 mm thickness and connected to the column using a total of
8 M20 bolts.
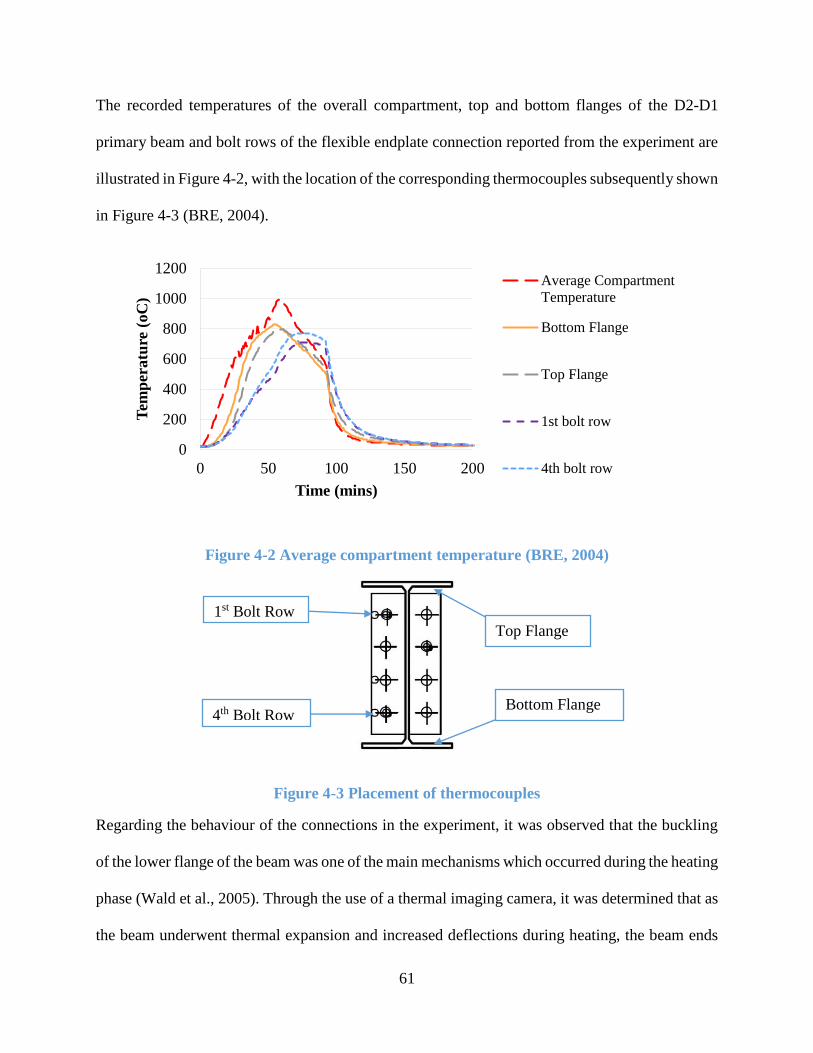
61
The recorded temperatures of the overall compartment, top and bottom flanges of the D2-D1
primary beam and bolt rows of the flexible endplate connection reported from the experiment are
illustrated in Figure 4-2, with the location of the corresponding thermocouples subsequently shown
in Figure 4-3 (BRE, 2004).
Figure 4-2 Average compartment temperature (BRE, 2004)
Figure 4-3 Placement of thermocouples
Regarding the behaviour of the connections in the experiment, it was observed that the buckling
of the lower flange of the beam was one of the main mechanisms which occurred during the heating
phase (Wald et al., 2005). Through the use of a thermal imaging camera, it was determined that as
the beam underwent thermal expansion and increased deflections during heating, the beam ends
0
200
400
600
800
1000
1200
0 50 100 150 200
Tem
per
atu
re (
oC
)
Time (mins)
Average Compartment
Temperature
Bottom Flange
Top Flange
1st bolt row
4th bolt row
1st Bolt Row
4th Bolt Row
Top Flange
Bottom Flange
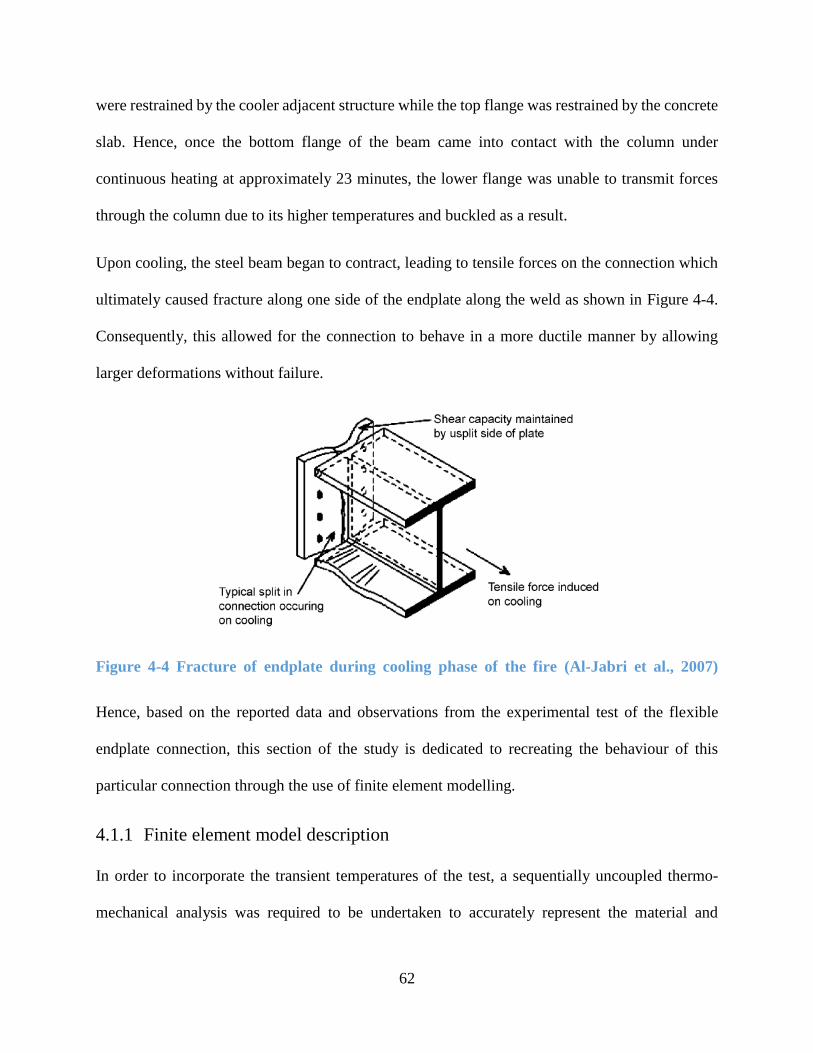
62
were restrained by the cooler adjacent structure while the top flange was restrained by the concrete
slab. Hence, once the bottom flange of the beam came into contact with the column under
continuous heating at approximately 23 minutes, the lower flange was unable to transmit forces
through the column due to its higher temperatures and buckled as a result.
Upon cooling, the steel beam began to contract, leading to tensile forces on the connection which
ultimately caused fracture along one side of the endplate along the weld as shown in Figure 4-4.
Consequently, this allowed for the connection to behave in a more ductile manner by allowing
larger deformations without failure.
Figure 4-4 Fracture of endplate during cooling phase of the fire (Al-Jabri et al., 2007)
Hence, based on the reported data and observations from the experimental test of the flexible
endplate connection, this section of the study is dedicated to recreating the behaviour of this
particular connection through the use of finite element modelling.
4.1.1 Finite element model description
In order to incorporate the transient temperatures of the test, a sequentially uncoupled thermo-
mechanical analysis was required to be undertaken to accurately represent the material and
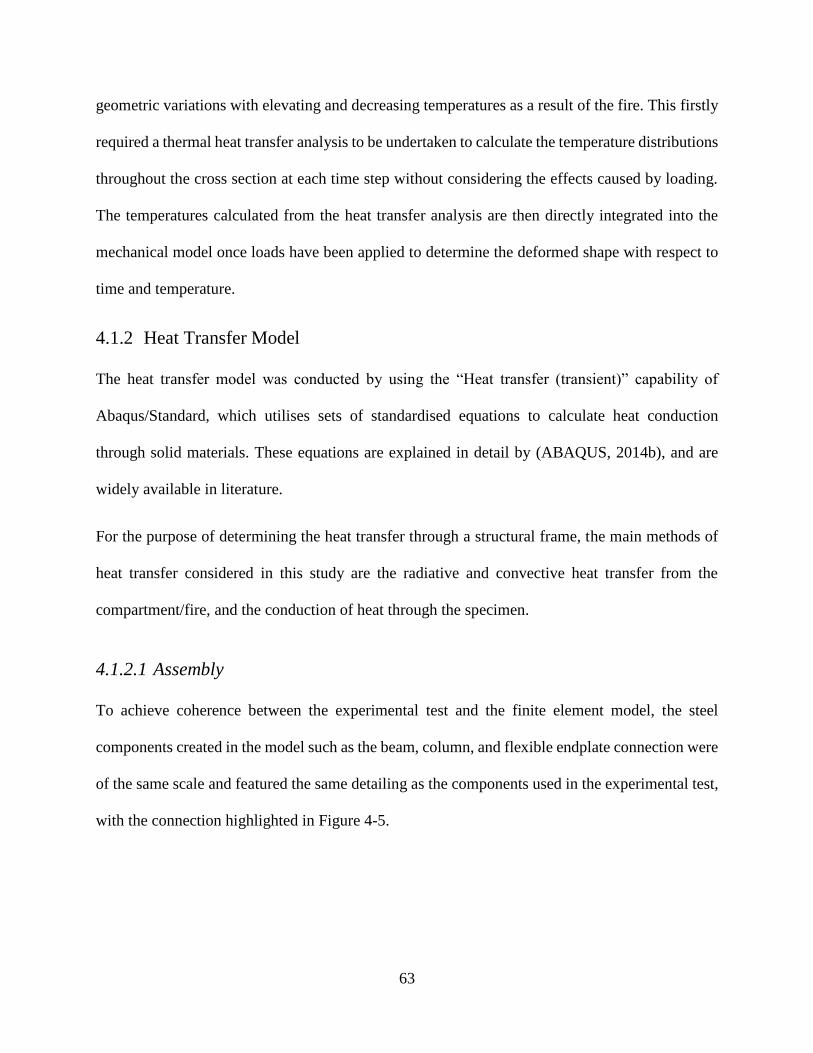
63
geometric variations with elevating and decreasing temperatures as a result of the fire. This firstly
required a thermal heat transfer analysis to be undertaken to calculate the temperature distributions
throughout the cross section at each time step without considering the effects caused by loading.
The temperatures calculated from the heat transfer analysis are then directly integrated into the
mechanical model once loads have been applied to determine the deformed shape with respect to
time and temperature.
4.1.2 Heat Transfer Model
The heat transfer model was conducted by using the “Heat transfer (transient)” capability of
Abaqus/Standard, which utilises sets of standardised equations to calculate heat conduction
through solid materials. These equations are explained in detail by (ABAQUS, 2014b), and are
widely available in literature.
For the purpose of determining the heat transfer through a structural frame, the main methods of
heat transfer considered in this study are the radiative and convective heat transfer from the
compartment/fire, and the conduction of heat through the specimen.
4.1.2.1 Assembly
To achieve coherence between the experimental test and the finite element model, the steel
components created in the model such as the beam, column, and flexible endplate connection were
of the same scale and featured the same detailing as the components used in the experimental test,
with the connection highlighted in Figure 4-5.
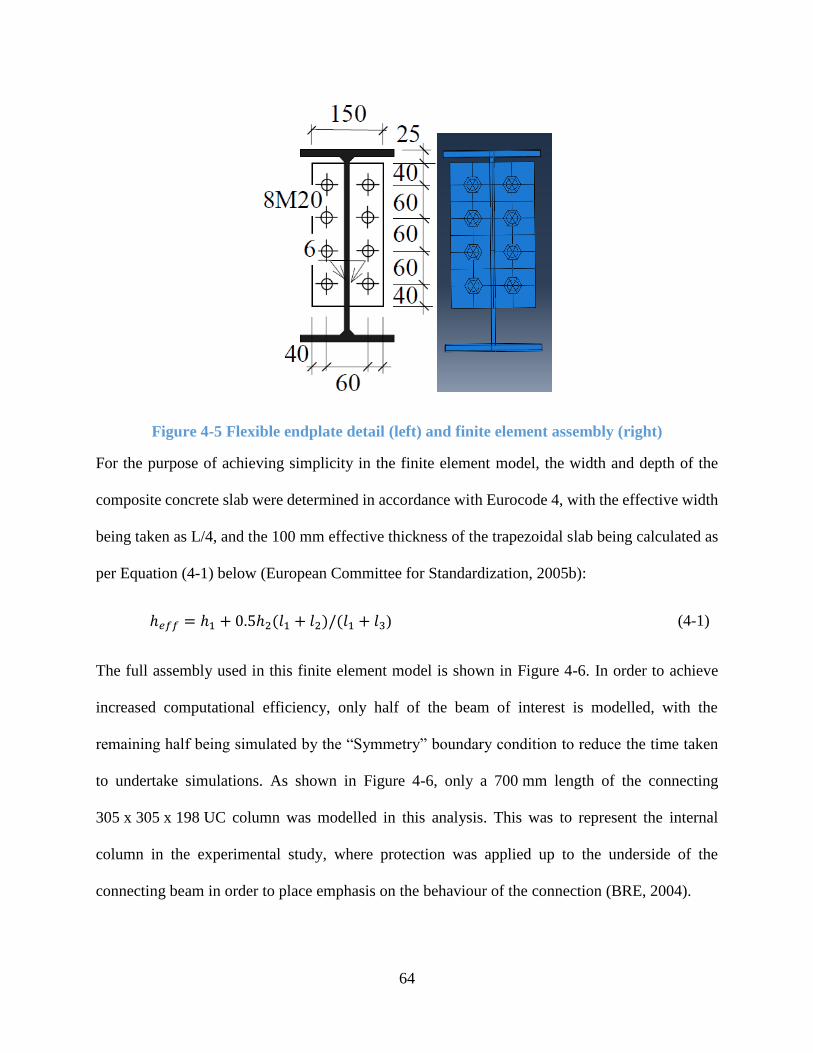
64
Figure 4-5 Flexible endplate detail (left) and finite element assembly (right)
For the purpose of achieving simplicity in the finite element model, the width and depth of the
composite concrete slab were determined in accordance with Eurocode 4, with the effective width
being taken as L/4, and the 100 mm effective thickness of the trapezoidal slab being calculated as
per Equation (4-1) below (European Committee for Standardization, 2005b):
ℎ𝑒𝑓𝑓 = ℎ1 + 0.5ℎ2(𝑙1 + 𝑙2)/(𝑙1 + 𝑙3)
(4-1)
The full assembly used in this finite element model is shown in Figure 4-6. In order to achieve
increased computational efficiency, only half of the beam of interest is modelled, with the
remaining half being simulated by the “Symmetry” boundary condition to reduce the time taken
to undertake simulations. As shown in Figure 4-6, only a 700 mm length of the connecting
305 x 305 x 198 UC column was modelled in this analysis. This was to represent the internal
column in the experimental study, where protection was applied up to the underside of the
connecting beam in order to place emphasis on the behaviour of the connection (BRE, 2004).

65
Figure 4-6 Model of Cardington sub assembly
4.1.2.2 Element Type
The element type used for the three-dimensional analysis was the DCC3D8D 8-node linear
convection/diffusion heat transfer brick. Each node of this element possesses temperature degrees
of freedom and are best suited for heat transfer analysis (ABAQUS, 2014b).
4.1.2.3 Material Properties
To accurately model heat transfer, the finite element model requires an accurate representation of
the properties of the material. In particular, the properties: specific heat, density, conductivity, and
thermal expansion are paramount in accurately calculating the temperature distribution throughout
the subassembly.
In regards to the thermal properties of steel, the density is taken as 7850kg/m3 over the range of
exposed temperatures, with values for specific heat and thermal conductivity being taken based on
the equations provided by Eurocode 4 as illustrated in Figure 4-7 below.
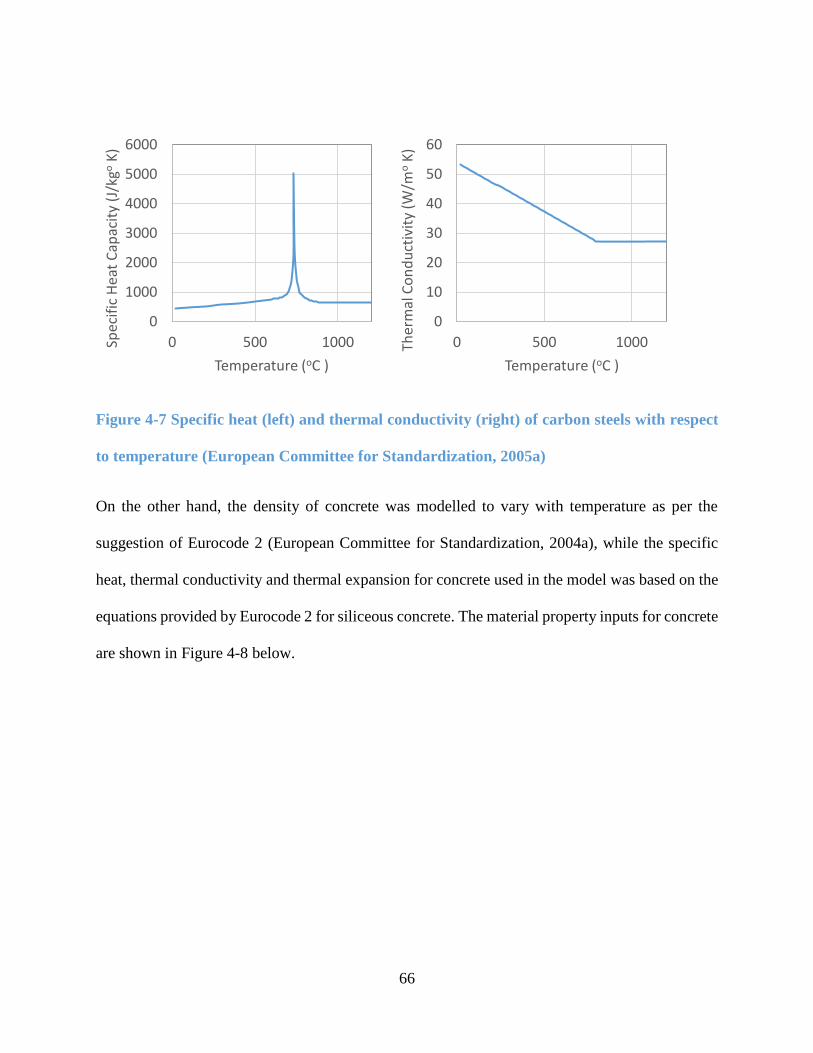
66
Figure 4-7 Specific heat (left) and thermal conductivity (right) of carbon steels with respect
to temperature (European Committee for Standardization, 2005a)
On the other hand, the density of concrete was modelled to vary with temperature as per the
suggestion of Eurocode 2 (European Committee for Standardization, 2004a), while the specific
heat, thermal conductivity and thermal expansion for concrete used in the model was based on the
equations provided by Eurocode 2 for siliceous concrete. The material property inputs for concrete
are shown in Figure 4-8 below.
0
1000
2000
3000
4000
5000
6000
0 500 1000Spec
ific
Hea
t C
apac
ity
(J/k
goK
)
Temperature (oC )
0
10
20
30
40
50
60
0 500 1000Ther
mal
Co
nd
uct
ivit
y (W
/mo
K)
Temperature (oC )
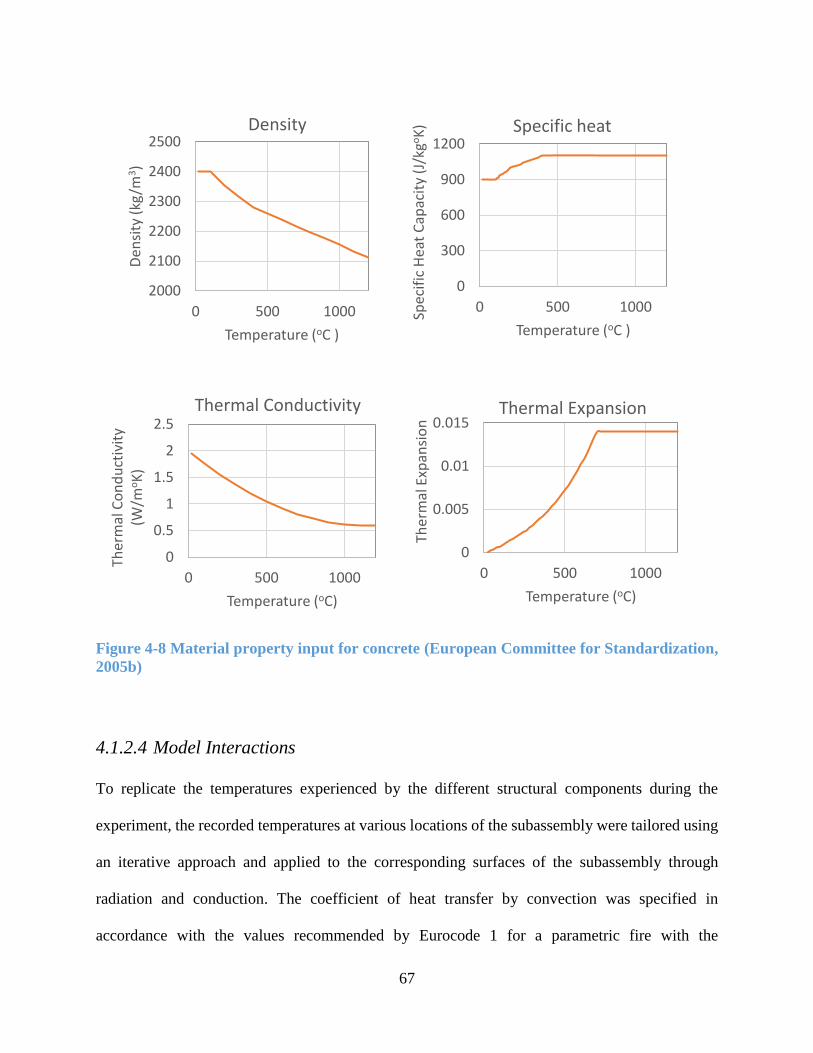
67
Figure 4-8 Material property input for concrete (European Committee for Standardization,
2005b)
4.1.2.4 Model Interactions
To replicate the temperatures experienced by the different structural components during the
experiment, the recorded temperatures at various locations of the subassembly were tailored using
an iterative approach and applied to the corresponding surfaces of the subassembly through
radiation and conduction. The coefficient of heat transfer by convection was specified in
accordance with the values recommended by Eurocode 1 for a parametric fire with the
2000
2100
2200
2300
2400
2500
0 500 1000
Den
sity
(kg
/m3)
Temperature (oC )
Density
0
300
600
900
1200
0 500 1000
Spec
ific
Hea
t C
apac
ity
(J/k
goK
)
Temperature (oC )
Specific heat
0
0.5
1
1.5
2
2.5
0 500 1000
Ther
mal
Co
nd
uct
ivit
y (W
/moK
)
Temperature (oC)
Thermal Conductivity
0
0.005
0.01
0.015
0 500 1000
Ther
mal
Exp
ansi
on
Temperature (oC)
Thermal Expansion
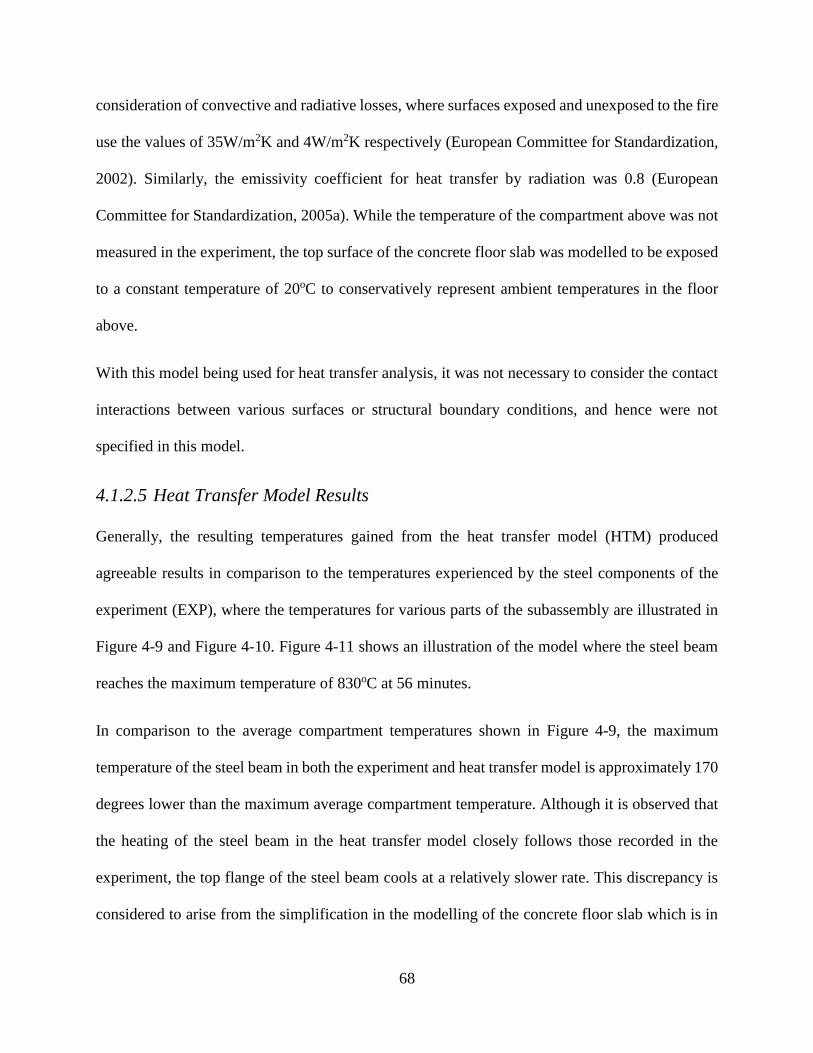
68
consideration of convective and radiative losses, where surfaces exposed and unexposed to the fire
use the values of 35W/m2K and 4W/m2K respectively (European Committee for Standardization,
2002). Similarly, the emissivity coefficient for heat transfer by radiation was 0.8 (European
Committee for Standardization, 2005a). While the temperature of the compartment above was not
measured in the experiment, the top surface of the concrete floor slab was modelled to be exposed
to a constant temperature of 20oC to conservatively represent ambient temperatures in the floor
above.
With this model being used for heat transfer analysis, it was not necessary to consider the contact
interactions between various surfaces or structural boundary conditions, and hence were not
specified in this model.
4.1.2.5 Heat Transfer Model Results
Generally, the resulting temperatures gained from the heat transfer model (HTM) produced
agreeable results in comparison to the temperatures experienced by the steel components of the
experiment (EXP), where the temperatures for various parts of the subassembly are illustrated in
Figure 4-9 and Figure 4-10. Figure 4-11 shows an illustration of the model where the steel beam
reaches the maximum temperature of 830oC at 56 minutes.
In comparison to the average compartment temperatures shown in Figure 4-9, the maximum
temperature of the steel beam in both the experiment and heat transfer model is approximately 170
degrees lower than the maximum average compartment temperature. Although it is observed that
the heating of the steel beam in the heat transfer model closely follows those recorded in the
experiment, the top flange of the steel beam cools at a relatively slower rate. This discrepancy is
considered to arise from the simplification in the modelling of the concrete floor slab which is in
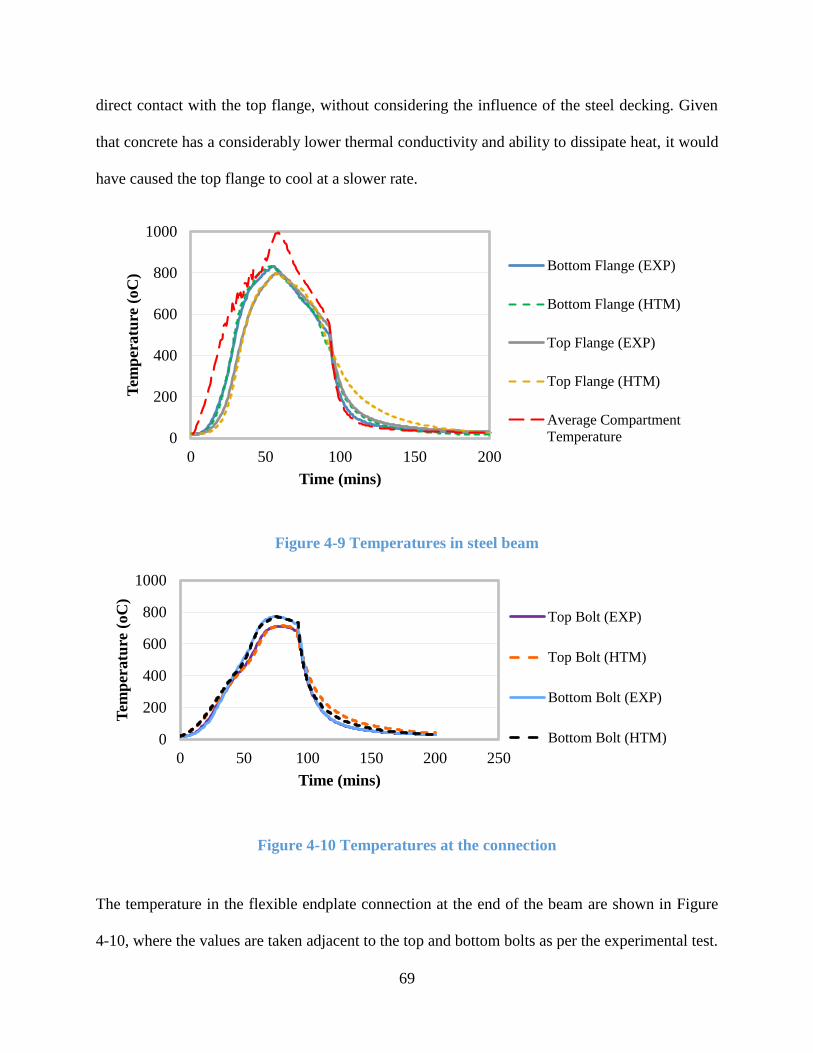
69
direct contact with the top flange, without considering the influence of the steel decking. Given
that concrete has a considerably lower thermal conductivity and ability to dissipate heat, it would
have caused the top flange to cool at a slower rate.
Figure 4-9 Temperatures in steel beam
Figure 4-10 Temperatures at the connection
The temperature in the flexible endplate connection at the end of the beam are shown in Figure
4-10, where the values are taken adjacent to the top and bottom bolts as per the experimental test.
0
200
400
600
800
1000
0 50 100 150 200
Tem
per
atu
re (
oC
)
Time (mins)
Bottom Flange (EXP)
Bottom Flange (HTM)
Top Flange (EXP)
Top Flange (HTM)
Average Compartment
Temperature
0
200
400
600
800
1000
0 50 100 150 200 250
Tem
per
atu
re (
oC
)
Time (mins)
Top Bolt (EXP)
Top Bolt (HTM)
Bottom Bolt (EXP)
Bottom Bolt (HTM)
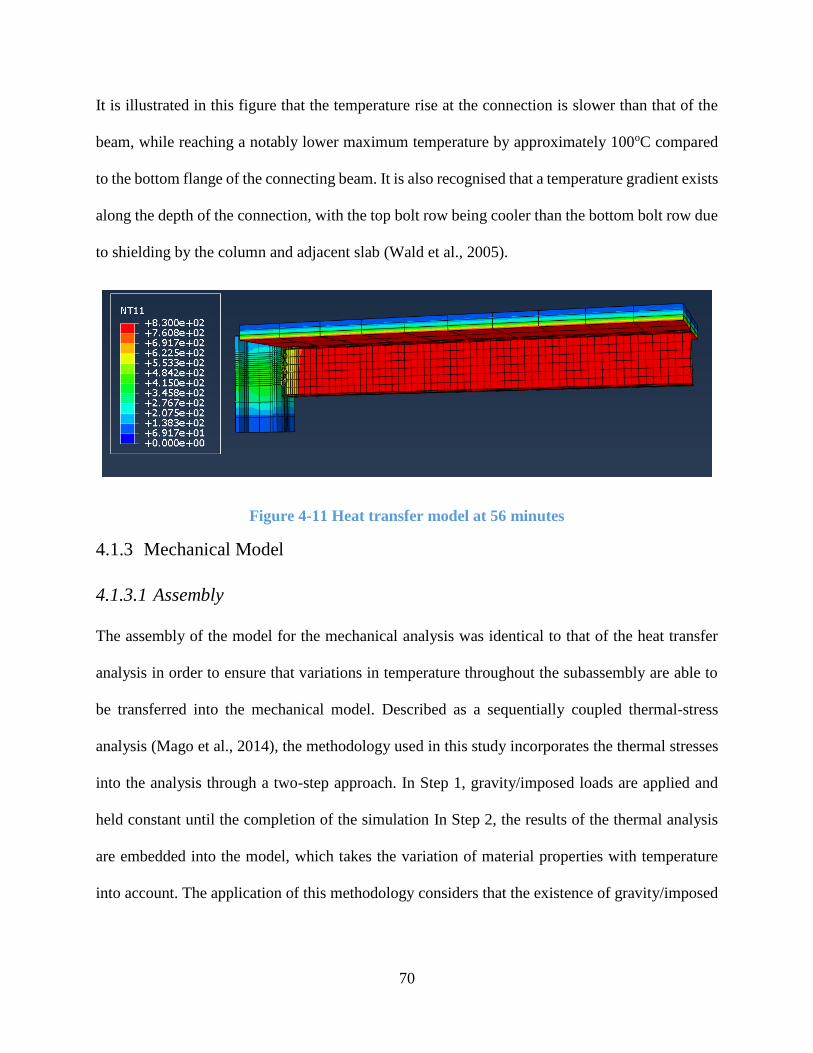
70
It is illustrated in this figure that the temperature rise at the connection is slower than that of the
beam, while reaching a notably lower maximum temperature by approximately 100oC compared
to the bottom flange of the connecting beam. It is also recognised that a temperature gradient exists
along the depth of the connection, with the top bolt row being cooler than the bottom bolt row due
to shielding by the column and adjacent slab (Wald et al., 2005).
Figure 4-11 Heat transfer model at 56 minutes
4.1.3 Mechanical Model
4.1.3.1 Assembly
The assembly of the model for the mechanical analysis was identical to that of the heat transfer
analysis in order to ensure that variations in temperature throughout the subassembly are able to
be transferred into the mechanical model. Described as a sequentially coupled thermal-stress
analysis (Mago et al., 2014), the methodology used in this study incorporates the thermal stresses
into the analysis through a two-step approach. In Step 1, gravity/imposed loads are applied and
held constant until the completion of the simulation In Step 2, the results of the thermal analysis
are embedded into the model, which takes the variation of material properties with temperature
into account. The application of this methodology considers that the existence of gravity/imposed
71
loading has a negligible effect on the thermal resistance and hence the temperature distribution
throughout the subassembly.
The model created to represent the Cardington test followed the same approach to the isolated
connections as described in Section 3.1 in regards to the selection of the finite element modelling
package ABAQUS/Explicit, and the element type C3D8R for the mechanical analysis. Similar to
the earlier models created in this study, the mechanical model for the Cardington subassembly was
created using ABAQUS/Explicit due to its advantage in overcoming the convergence issues
experienced by ABAQUS/Standard as a result of the large number of surfaces repeatedly coming
in and out of contact during the analysis. As per the previous models, the three dimensional brick
model with 8 gauss points and reduced integration (C3D8R) was used for this mechanical analysis
based on its ability to control hourglass modes.
4.1.3.2 Material Properties
The material properties used in the finite element model were taken from the ambient temperature
tests at the Cardington experiment and shown in Table 4-1(Lennon and Moore, 2004). Young’s
modulus was taken as 207 GPa for all steel members, with the properties for hot rolled steels at
elevated temperatures being calculated from EC3 and the properties of bolts from Kirby (1995).
Accordingly, the strength properties of concrete were determined using as per Eurocode 4 and are
subsequently shown in Table 4-1.
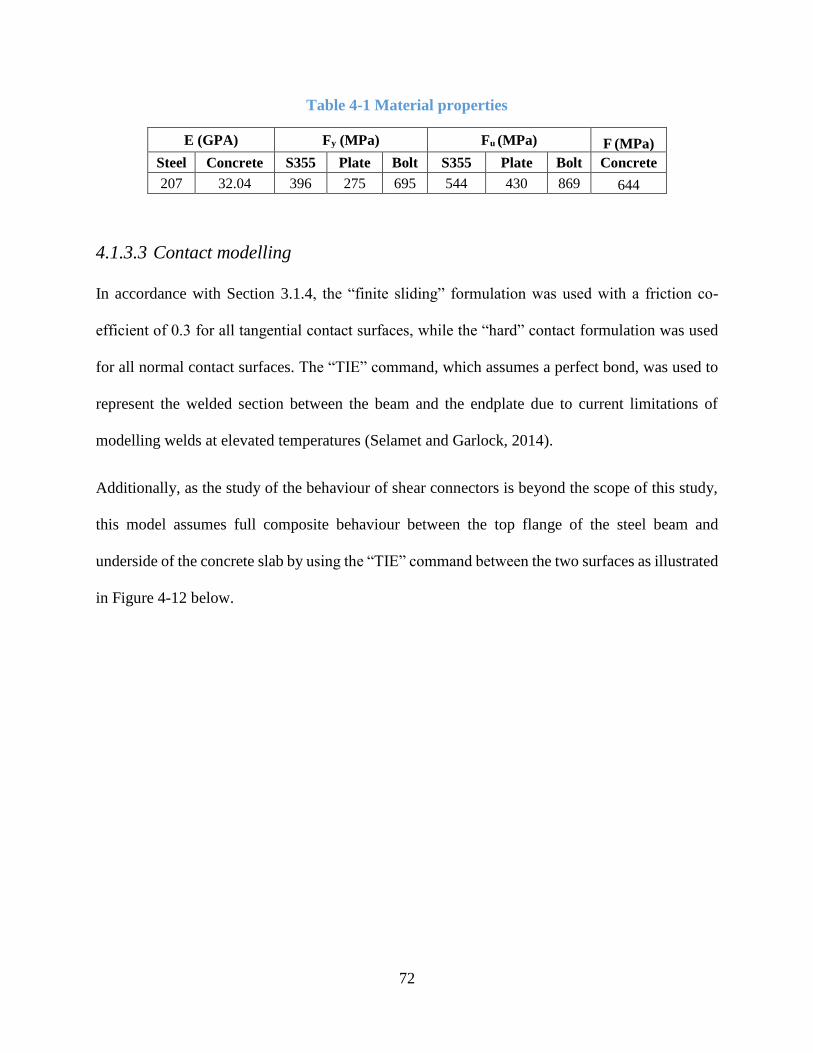
72
Table 4-1 Material properties
E (GPA) Fy (MPa) Fu (MPa) F (MPa)
Steel Concrete S355 Plate Bolt S355 Plate Bolt Concrete
207 32.04 396 275 695 544 430 869 644
4.1.3.3 Contact modelling
In accordance with Section 3.1.4, the “finite sliding” formulation was used with a friction co-
efficient of 0.3 for all tangential contact surfaces, while the “hard” contact formulation was used
for all normal contact surfaces. The “TIE” command, which assumes a perfect bond, was used to
represent the welded section between the beam and the endplate due to current limitations of
modelling welds at elevated temperatures (Selamet and Garlock, 2014).
Additionally, as the study of the behaviour of shear connectors is beyond the scope of this study,
this model assumes full composite behaviour between the top flange of the steel beam and
underside of the concrete slab by using the “TIE” command between the two surfaces as illustrated
in Figure 4-12 below.
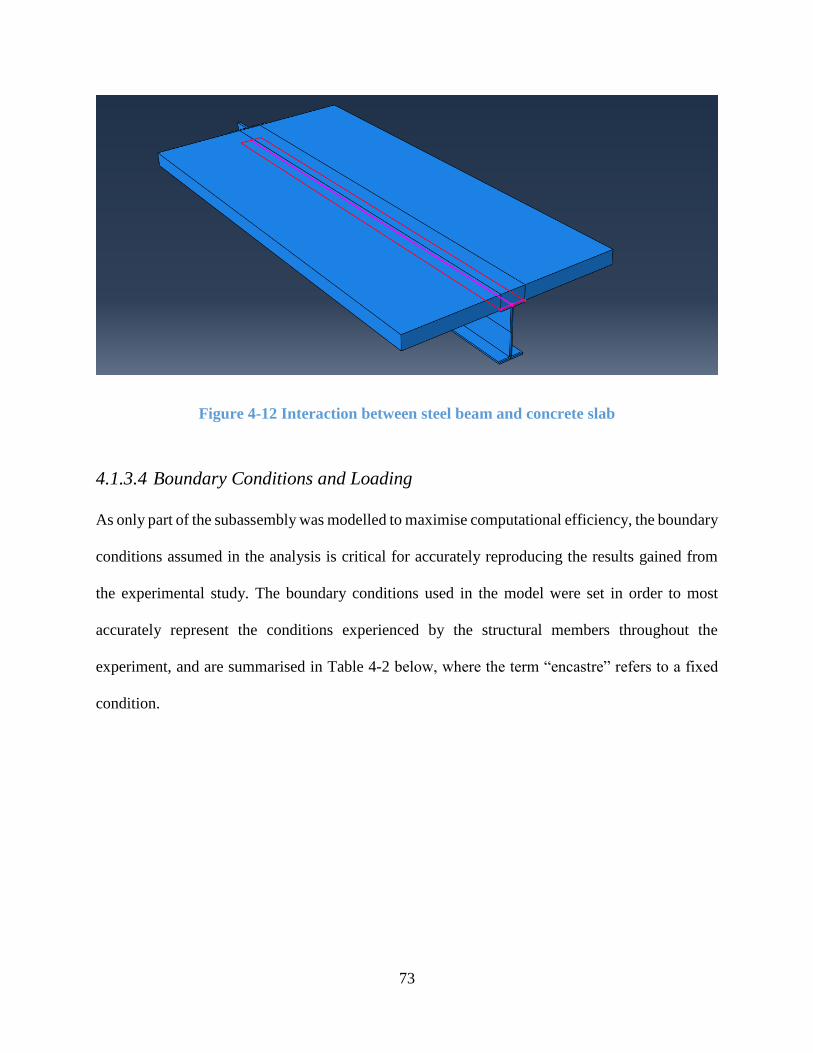
73
Figure 4-12 Interaction between steel beam and concrete slab
4.1.3.4 Boundary Conditions and Loading
As only part of the subassembly was modelled to maximise computational efficiency, the boundary
conditions assumed in the analysis is critical for accurately reproducing the results gained from
the experimental study. The boundary conditions used in the model were set in order to most
accurately represent the conditions experienced by the structural members throughout the
experiment, and are summarised in Table 4-2 below, where the term “encastre” refers to a fixed
condition.
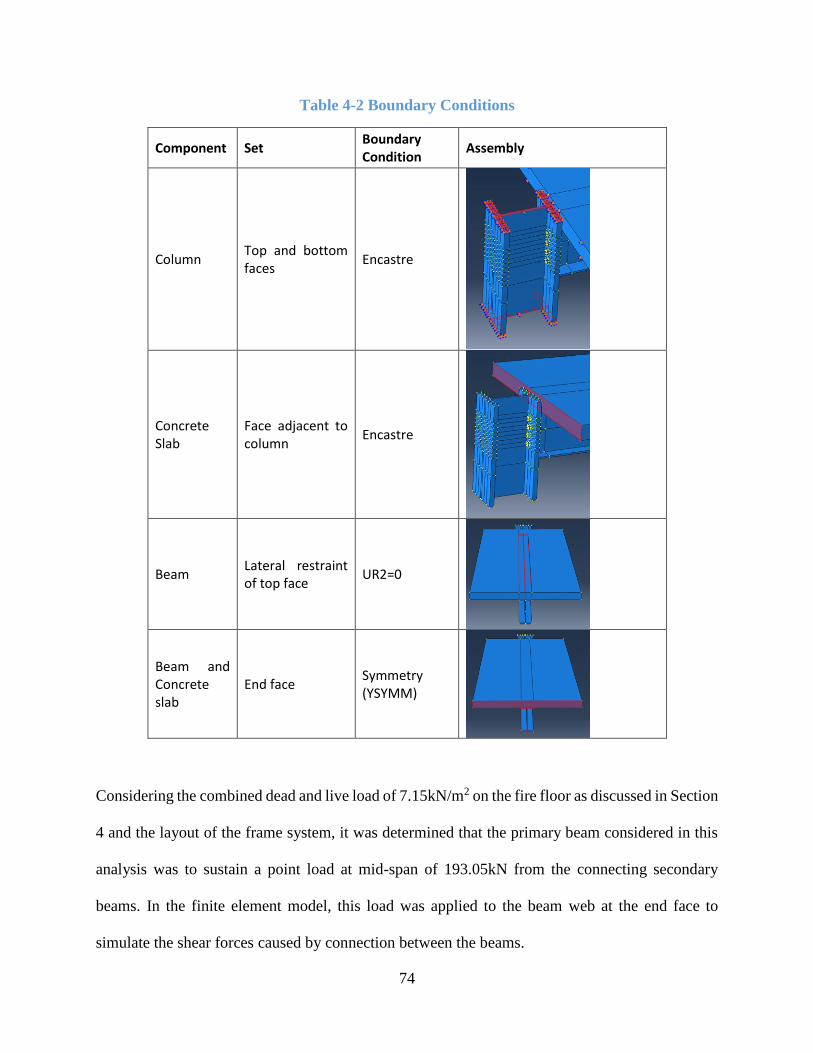
74
Table 4-2 Boundary Conditions
Component Set Boundary Condition
Assembly
Column Top and bottom faces
Encastre
Concrete Slab
Face adjacent to column
Encastre
Beam Lateral restraint of top face
UR2=0
Beam and Concrete slab
End face Symmetry (YSYMM)
Considering the combined dead and live load of 7.15kN/m2 on the fire floor as discussed in Section
4 and the layout of the frame system, it was determined that the primary beam considered in this
analysis was to sustain a point load at mid-span of 193.05kN from the connecting secondary
beams. In the finite element model, this load was applied to the beam web at the end face to
simulate the shear forces caused by connection between the beams.
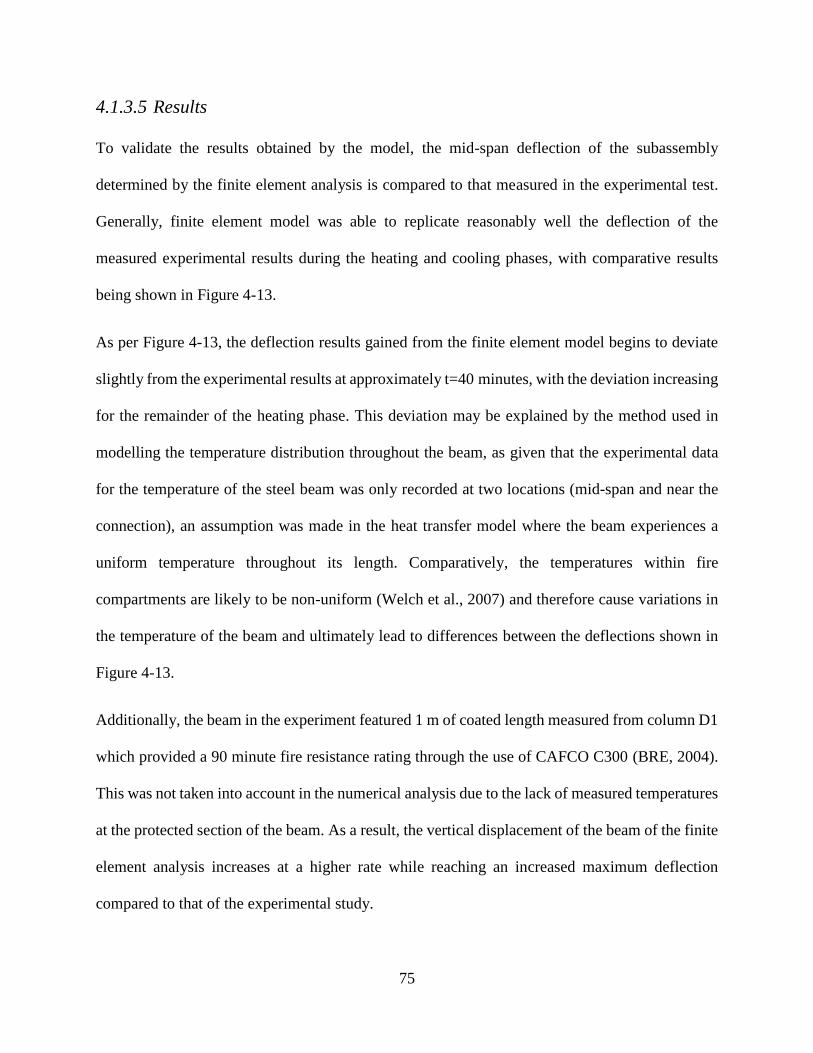
75
4.1.3.5 Results
To validate the results obtained by the model, the mid-span deflection of the subassembly
determined by the finite element analysis is compared to that measured in the experimental test.
Generally, finite element model was able to replicate reasonably well the deflection of the
measured experimental results during the heating and cooling phases, with comparative results
being shown in Figure 4-13.
As per Figure 4-13, the deflection results gained from the finite element model begins to deviate
slightly from the experimental results at approximately t=40 minutes, with the deviation increasing
for the remainder of the heating phase. This deviation may be explained by the method used in
modelling the temperature distribution throughout the beam, as given that the experimental data
for the temperature of the steel beam was only recorded at two locations (mid-span and near the
connection), an assumption was made in the heat transfer model where the beam experiences a
uniform temperature throughout its length. Comparatively, the temperatures within fire
compartments are likely to be non-uniform (Welch et al., 2007) and therefore cause variations in
the temperature of the beam and ultimately lead to differences between the deflections shown in
Figure 4-13.
Additionally, the beam in the experiment featured 1 m of coated length measured from column D1
which provided a 90 minute fire resistance rating through the use of CAFCO C300 (BRE, 2004).
This was not taken into account in the numerical analysis due to the lack of measured temperatures
at the protected section of the beam. As a result, the vertical displacement of the beam of the finite
element analysis increases at a higher rate while reaching an increased maximum deflection
compared to that of the experimental study.
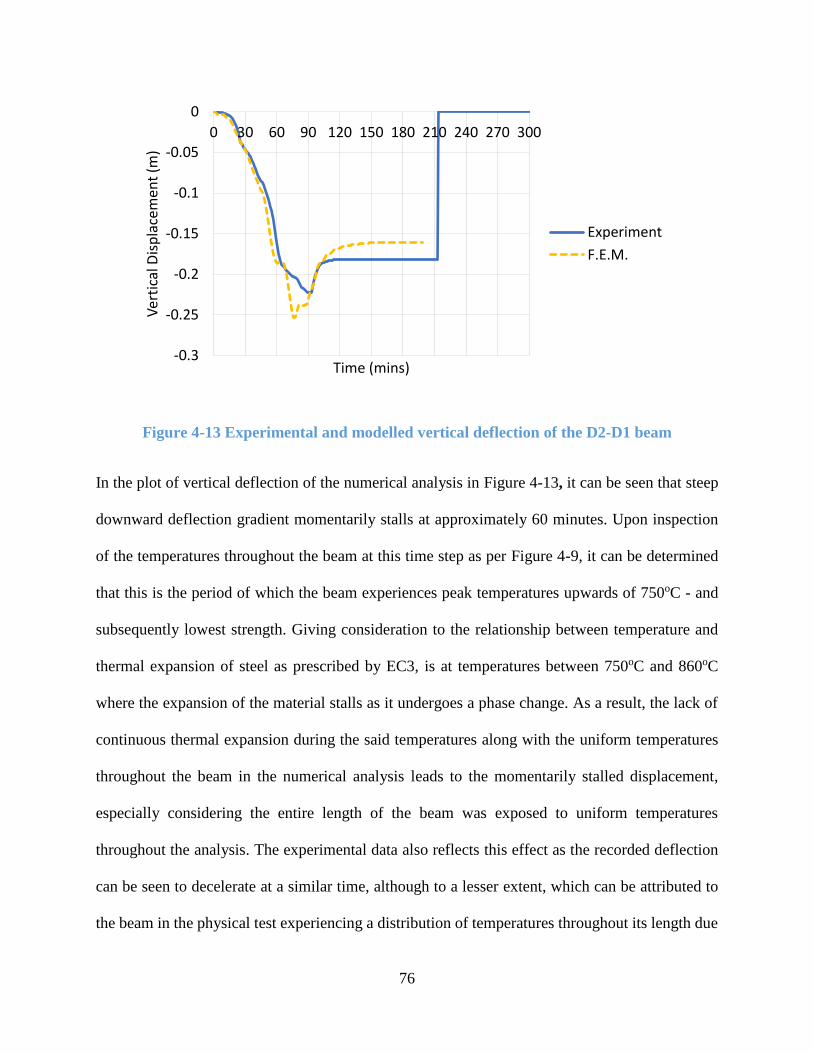
76
Figure 4-13 Experimental and modelled vertical deflection of the D2-D1 beam
In the plot of vertical deflection of the numerical analysis in Figure 4-13, it can be seen that steep
downward deflection gradient momentarily stalls at approximately 60 minutes. Upon inspection
of the temperatures throughout the beam at this time step as per Figure 4-9, it can be determined
that this is the period of which the beam experiences peak temperatures upwards of 750oC - and
subsequently lowest strength. Giving consideration to the relationship between temperature and
thermal expansion of steel as prescribed by EC3, is at temperatures between 750oC and 860oC
where the expansion of the material stalls as it undergoes a phase change. As a result, the lack of
continuous thermal expansion during the said temperatures along with the uniform temperatures
throughout the beam in the numerical analysis leads to the momentarily stalled displacement,
especially considering the entire length of the beam was exposed to uniform temperatures
throughout the analysis. The experimental data also reflects this effect as the recorded deflection
can be seen to decelerate at a similar time, although to a lesser extent, which can be attributed to
the beam in the physical test experiencing a distribution of temperatures throughout its length due
-0.3
-0.25
-0.2
-0.15
-0.1
-0.05
0
0 30 60 90 120 150 180 210 240 270 300V
erti
cal D
isp
lace
men
t (m
)
Time (mins)
Experiment
F.E.M.
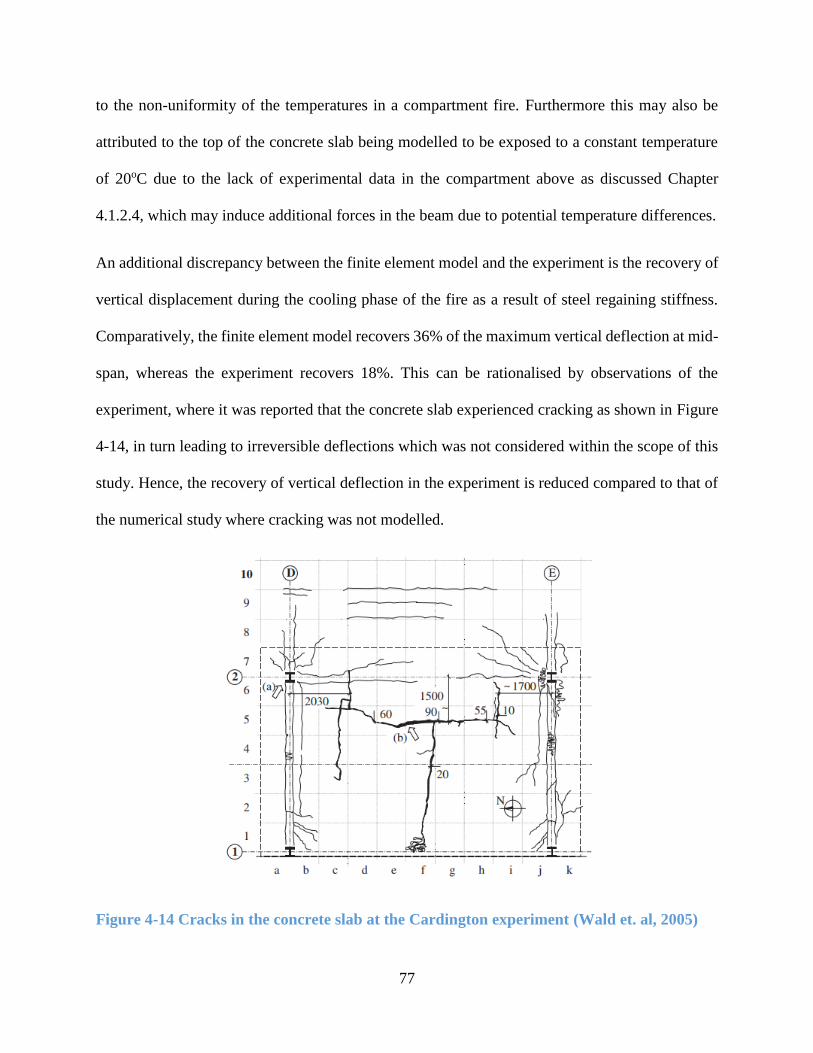
77
to the non-uniformity of the temperatures in a compartment fire. Furthermore this may also be
attributed to the top of the concrete slab being modelled to be exposed to a constant temperature
of 20oC due to the lack of experimental data in the compartment above as discussed Chapter
4.1.2.4, which may induce additional forces in the beam due to potential temperature differences.
An additional discrepancy between the finite element model and the experiment is the recovery of
vertical displacement during the cooling phase of the fire as a result of steel regaining stiffness.
Comparatively, the finite element model recovers 36% of the maximum vertical deflection at mid-
span, whereas the experiment recovers 18%. This can be rationalised by observations of the
experiment, where it was reported that the concrete slab experienced cracking as shown in Figure
4-14, in turn leading to irreversible deflections which was not considered within the scope of this
study. Hence, the recovery of vertical deflection in the experiment is reduced compared to that of
the numerical study where cracking was not modelled.
Figure 4-14 Cracks in the concrete slab at the Cardington experiment (Wald et. al, 2005)
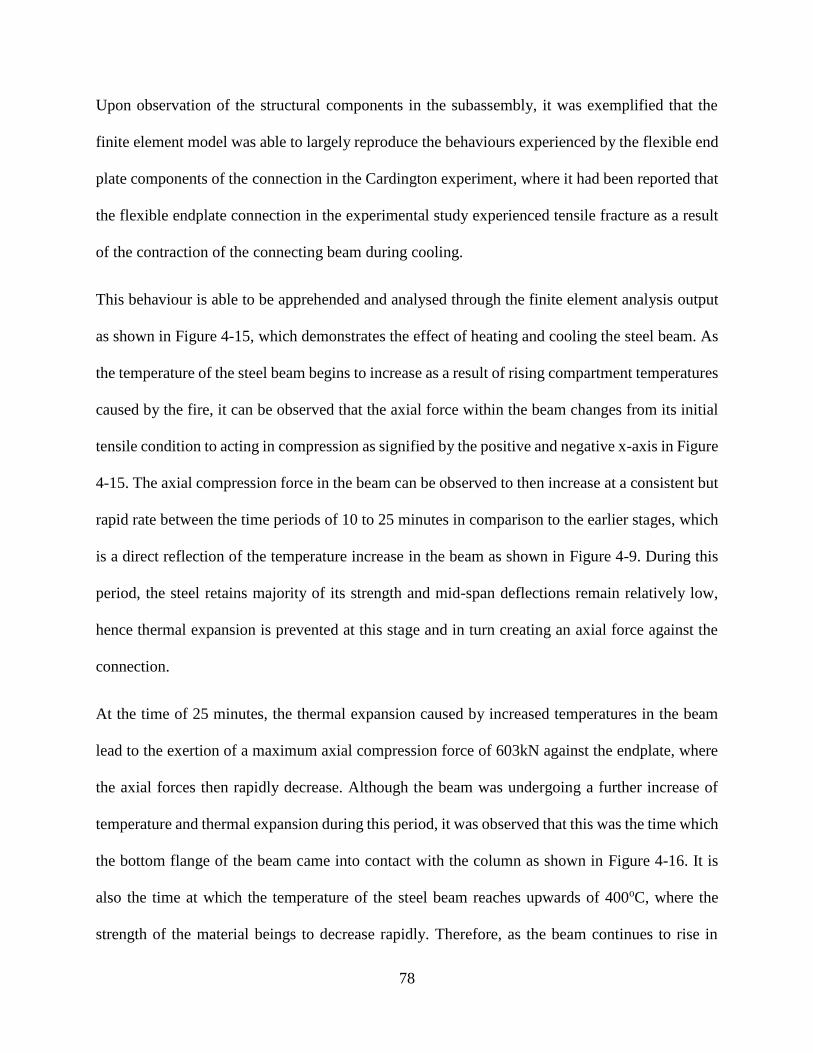
78
Upon observation of the structural components in the subassembly, it was exemplified that the
finite element model was able to largely reproduce the behaviours experienced by the flexible end
plate components of the connection in the Cardington experiment, where it had been reported that
the flexible endplate connection in the experimental study experienced tensile fracture as a result
of the contraction of the connecting beam during cooling.
This behaviour is able to be apprehended and analysed through the finite element analysis output
as shown in Figure 4-15, which demonstrates the effect of heating and cooling the steel beam. As
the temperature of the steel beam begins to increase as a result of rising compartment temperatures
caused by the fire, it can be observed that the axial force within the beam changes from its initial
tensile condition to acting in compression as signified by the positive and negative x-axis in Figure
4-15. The axial compression force in the beam can be observed to then increase at a consistent but
rapid rate between the time periods of 10 to 25 minutes in comparison to the earlier stages, which
is a direct reflection of the temperature increase in the beam as shown in Figure 4-9. During this
period, the steel retains majority of its strength and mid-span deflections remain relatively low,
hence thermal expansion is prevented at this stage and in turn creating an axial force against the
connection.
At the time of 25 minutes, the thermal expansion caused by increased temperatures in the beam
lead to the exertion of a maximum axial compression force of 603kN against the endplate, where
the axial forces then rapidly decrease. Although the beam was undergoing a further increase of
temperature and thermal expansion during this period, it was observed that this was the time which
the bottom flange of the beam came into contact with the column as shown in Figure 4-16. It is
also the time at which the temperature of the steel beam reaches upwards of 400oC, where the
strength of the material beings to decrease rapidly. Therefore, as the beam continues to rise in
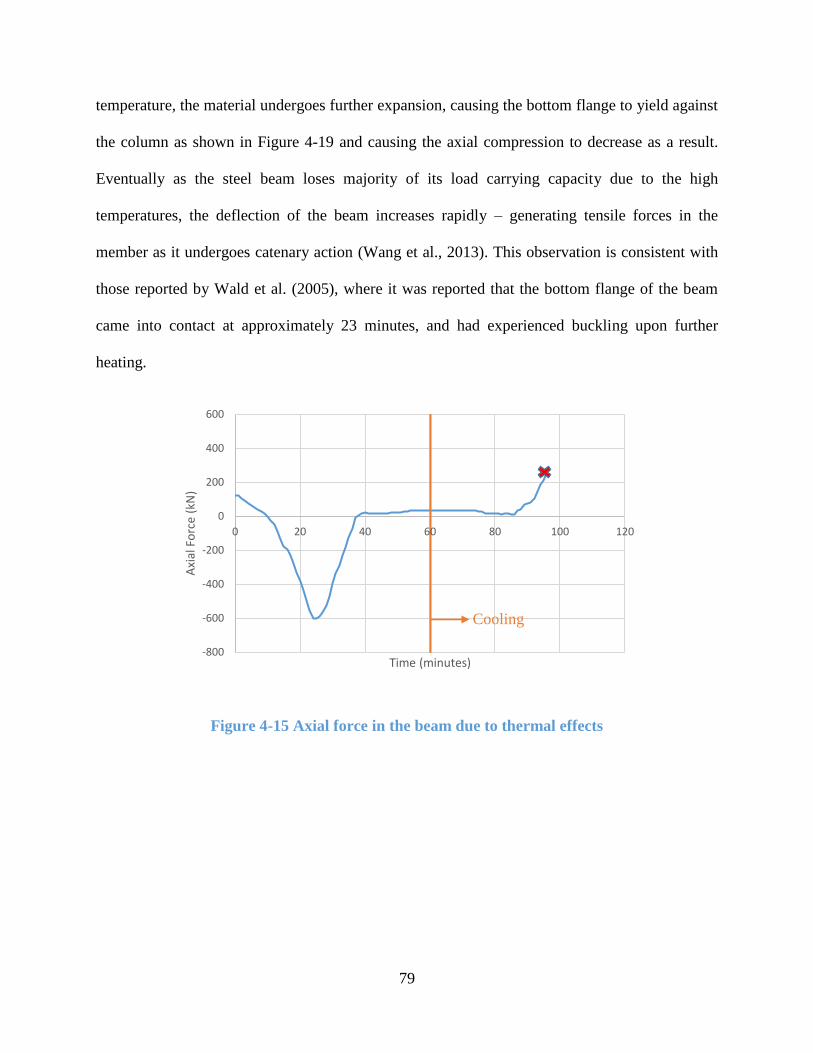
79
temperature, the material undergoes further expansion, causing the bottom flange to yield against
the column as shown in Figure 4-19 and causing the axial compression to decrease as a result.
Eventually as the steel beam loses majority of its load carrying capacity due to the high
temperatures, the deflection of the beam increases rapidly – generating tensile forces in the
member as it undergoes catenary action (Wang et al., 2013). This observation is consistent with
those reported by Wald et al. (2005), where it was reported that the bottom flange of the beam
came into contact at approximately 23 minutes, and had experienced buckling upon further
heating.
Figure 4-15 Axial force in the beam due to thermal effects
-800
-600
-400
-200
0
200
400
600
0 20 40 60 80 100 120
Axi
al F
orc
e (k
N)
Time (minutes)
Cooling
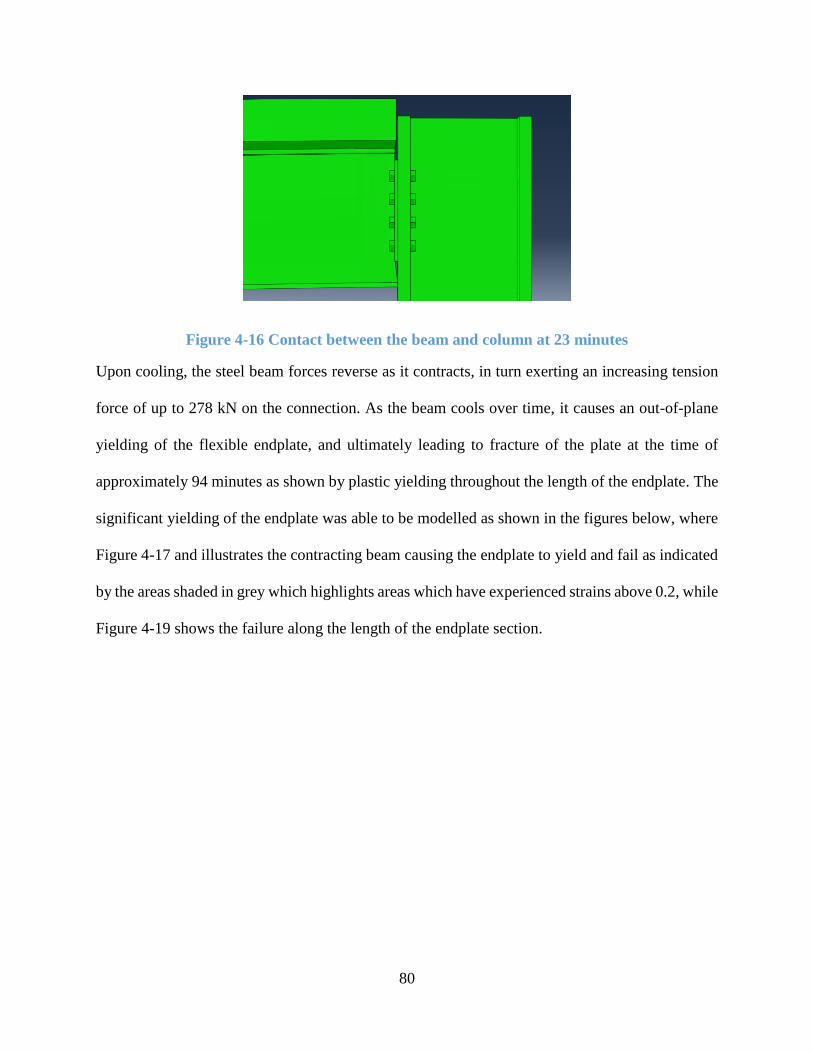
80
Figure 4-16 Contact between the beam and column at 23 minutes
Upon cooling, the steel beam forces reverse as it contracts, in turn exerting an increasing tension
force of up to 278 kN on the connection. As the beam cools over time, it causes an out-of-plane
yielding of the flexible endplate, and ultimately leading to fracture of the plate at the time of
approximately 94 minutes as shown by plastic yielding throughout the length of the endplate. The
significant yielding of the endplate was able to be modelled as shown in the figures below, where
Figure 4-17 and illustrates the contracting beam causing the endplate to yield and fail as indicated
by the areas shaded in grey which highlights areas which have experienced strains above 0.2, while
Figure 4-19 shows the failure along the length of the endplate section.
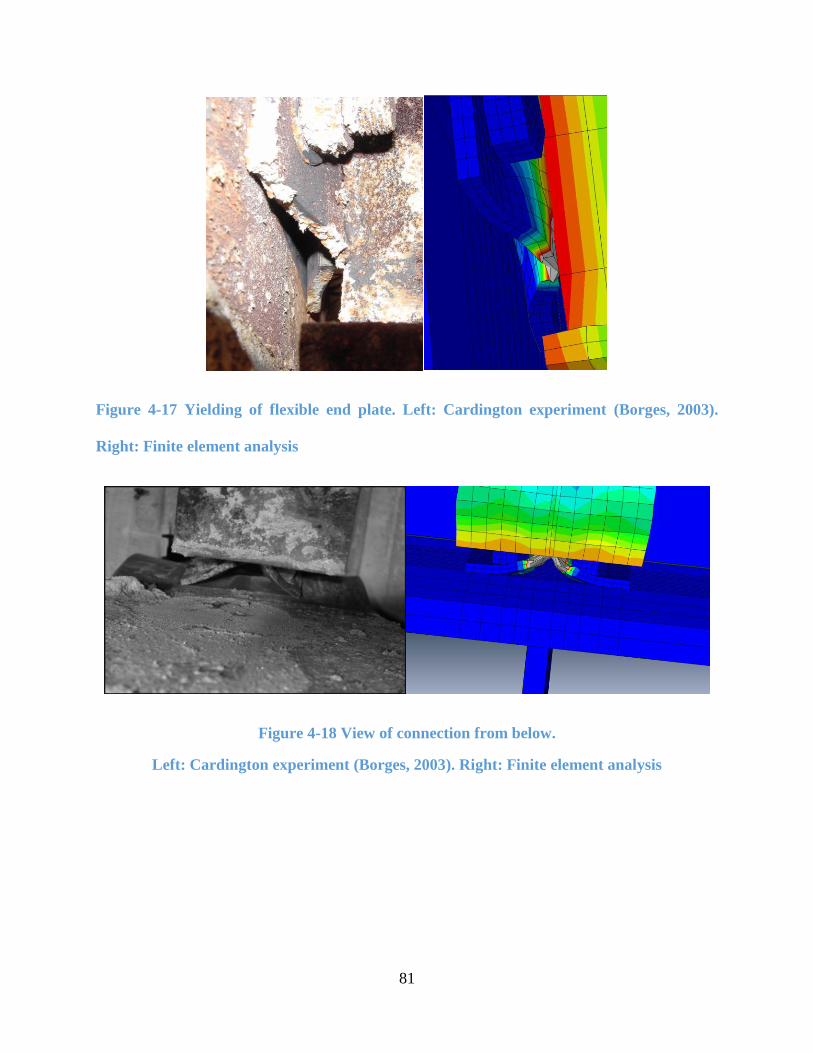
81
Figure 4-17 Yielding of flexible end plate. Left: Cardington experiment (Borges, 2003).
Right: Finite element analysis
Figure 4-18 View of connection from below.
Left: Cardington experiment (Borges, 2003). Right: Finite element analysis
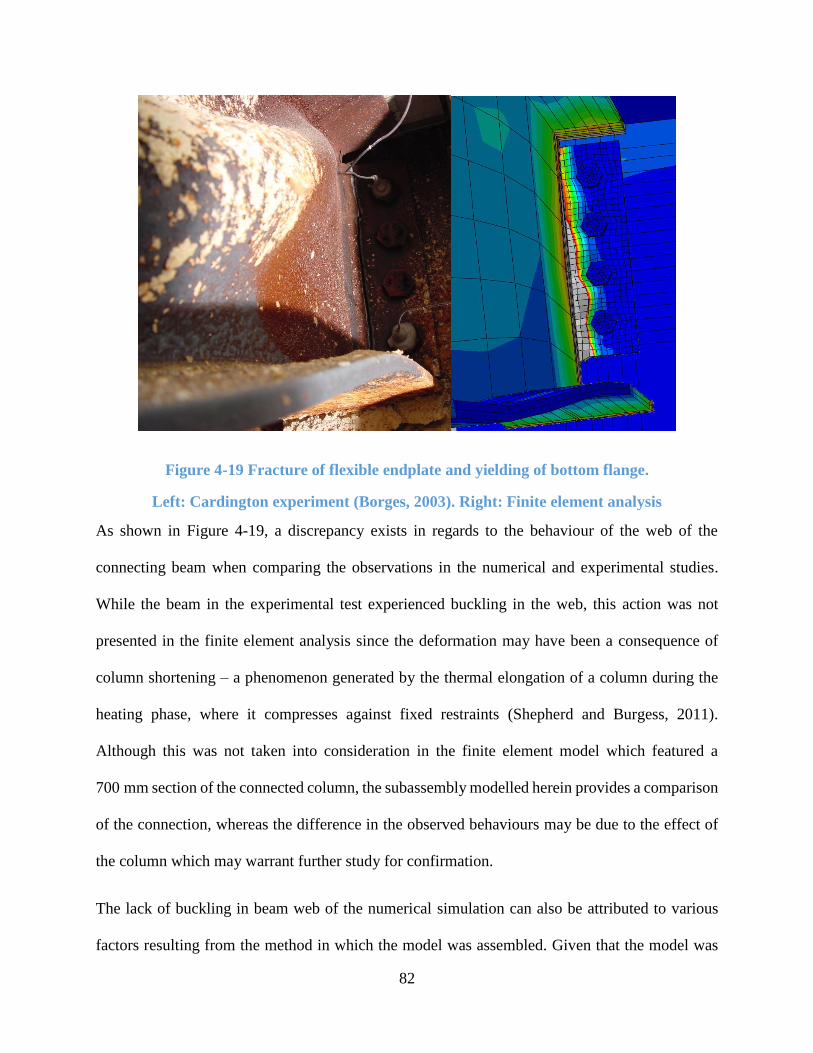
82
Figure 4-19 Fracture of flexible endplate and yielding of bottom flange.
Left: Cardington experiment (Borges, 2003). Right: Finite element analysis
As shown in Figure 4-19, a discrepancy exists in regards to the behaviour of the web of the
connecting beam when comparing the observations in the numerical and experimental studies.
While the beam in the experimental test experienced buckling in the web, this action was not
presented in the finite element analysis since the deformation may have been a consequence of
column shortening – a phenomenon generated by the thermal elongation of a column during the
heating phase, where it compresses against fixed restraints (Shepherd and Burgess, 2011).
Although this was not taken into consideration in the finite element model which featured a
700 mm section of the connected column, the subassembly modelled herein provides a comparison
of the connection, whereas the difference in the observed behaviours may be due to the effect of
the column which may warrant further study for confirmation.
The lack of buckling in beam web of the numerical simulation can also be attributed to various
factors resulting from the method in which the model was assembled. Given that the model was
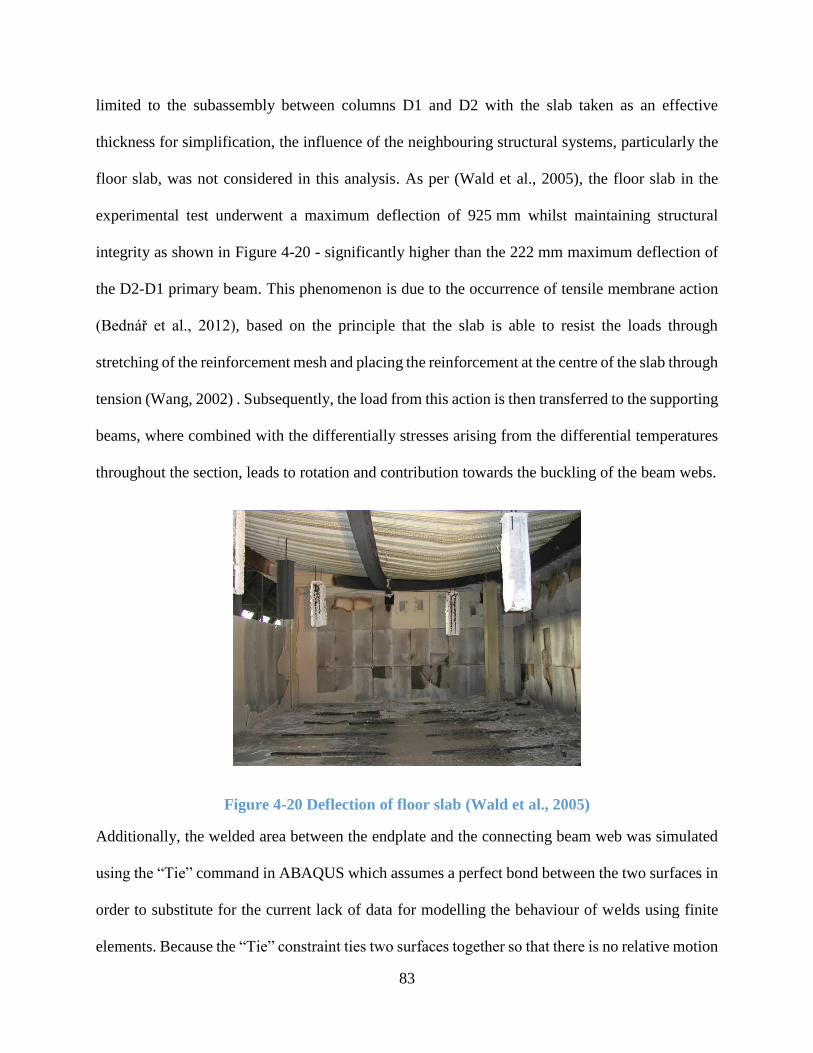
83
limited to the subassembly between columns D1 and D2 with the slab taken as an effective
thickness for simplification, the influence of the neighbouring structural systems, particularly the
floor slab, was not considered in this analysis. As per (Wald et al., 2005), the floor slab in the
experimental test underwent a maximum deflection of 925 mm whilst maintaining structural
integrity as shown in Figure 4-20 - significantly higher than the 222 mm maximum deflection of
the D2-D1 primary beam. This phenomenon is due to the occurrence of tensile membrane action
(Bednář et al., 2012), based on the principle that the slab is able to resist the loads through
stretching of the reinforcement mesh and placing the reinforcement at the centre of the slab through
tension (Wang, 2002) . Subsequently, the load from this action is then transferred to the supporting
beams, where combined with the differentially stresses arising from the differential temperatures
throughout the section, leads to rotation and contribution towards the buckling of the beam webs.
Figure 4-20 Deflection of floor slab (Wald et al., 2005)
Additionally, the welded area between the endplate and the connecting beam web was simulated
using the “Tie” command in ABAQUS which assumes a perfect bond between the two surfaces in
order to substitute for the current lack of data for modelling the behaviour of welds using finite
elements. Because the “Tie” constraint ties two surfaces together so that there is no relative motion
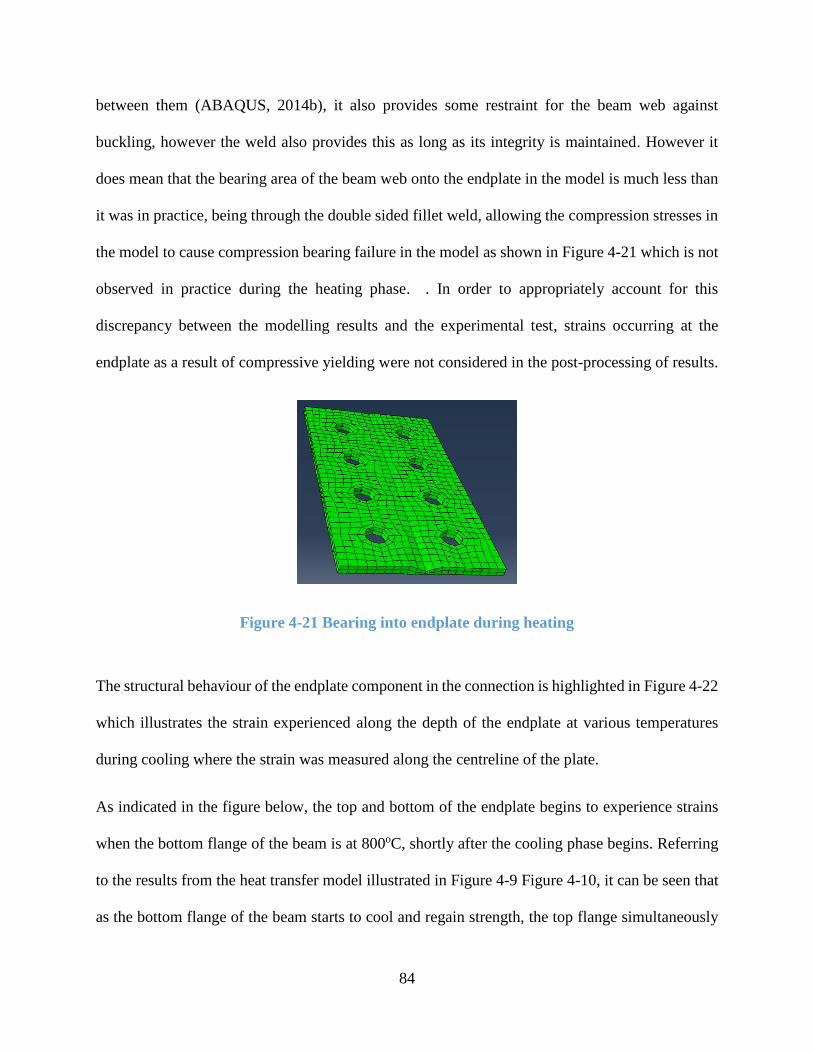
84
between them (ABAQUS, 2014b), it also provides some restraint for the beam web against
buckling, however the weld also provides this as long as its integrity is maintained. However it
does mean that the bearing area of the beam web onto the endplate in the model is much less than
it was in practice, being through the double sided fillet weld, allowing the compression stresses in
the model to cause compression bearing failure in the model as shown in Figure 4-21 which is not
observed in practice during the heating phase. . In order to appropriately account for this
discrepancy between the modelling results and the experimental test, strains occurring at the
endplate as a result of compressive yielding were not considered in the post-processing of results.
Figure 4-21 Bearing into endplate during heating
The structural behaviour of the endplate component in the connection is highlighted in Figure 4-22
which illustrates the strain experienced along the depth of the endplate at various temperatures
during cooling where the strain was measured along the centreline of the plate.
As indicated in the figure below, the top and bottom of the endplate begins to experience strains
when the bottom flange of the beam is at 800oC, shortly after the cooling phase begins. Referring
to the results from the heat transfer model illustrated in Figure 4-9 Figure 4-10, it can be seen that
as the bottom flange of the beam starts to cool and regain strength, the top flange simultaneously
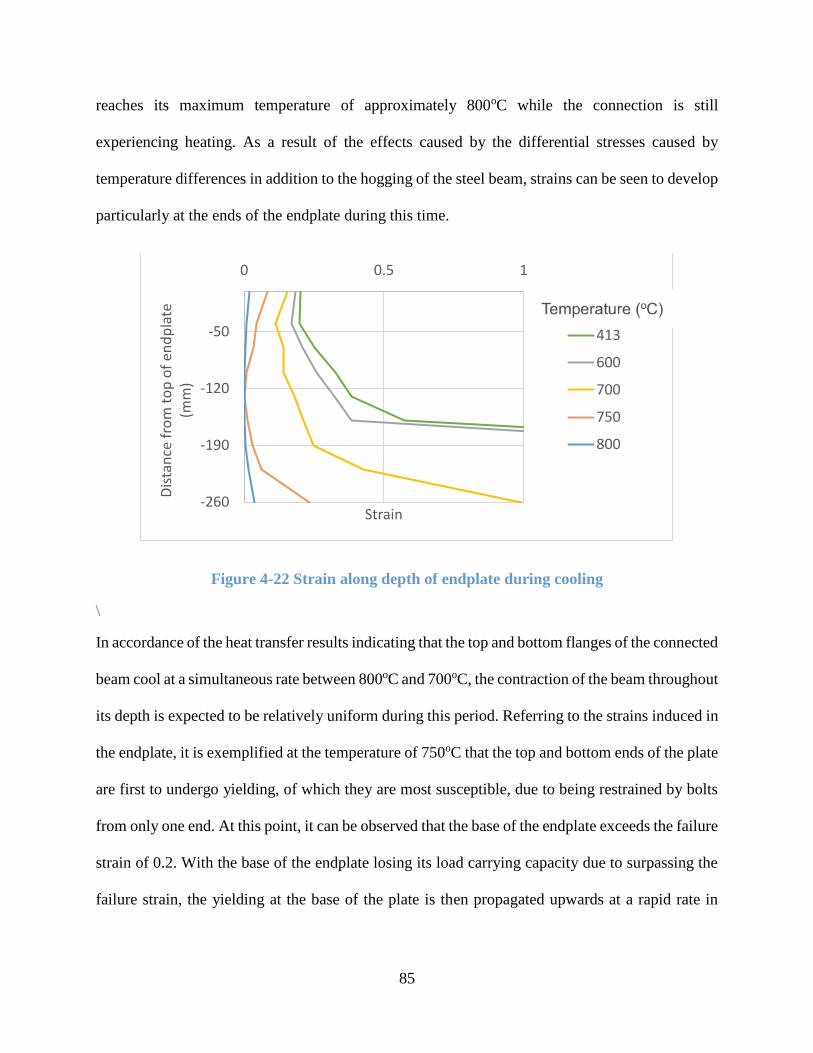
85
reaches its maximum temperature of approximately 800oC while the connection is still
experiencing heating. As a result of the effects caused by the differential stresses caused by
temperature differences in addition to the hogging of the steel beam, strains can be seen to develop
particularly at the ends of the endplate during this time.
Figure 4-22 Strain along depth of endplate during cooling
\
In accordance of the heat transfer results indicating that the top and bottom flanges of the connected
beam cool at a simultaneous rate between 800oC and 700oC, the contraction of the beam throughout
its depth is expected to be relatively uniform during this period. Referring to the strains induced in
the endplate, it is exemplified at the temperature of 750oC that the top and bottom ends of the plate
are first to undergo yielding, of which they are most susceptible, due to being restrained by bolts
from only one end. At this point, it can be observed that the base of the endplate exceeds the failure
strain of 0.2. With the base of the endplate losing its load carrying capacity due to surpassing the
failure strain, the yielding at the base of the plate is then propagated upwards at a rapid rate in
-260
-190
-120
-50
0 0.5 1
Dis
tan
ce f
rom
to
p o
f en
dp
late
(m
m)
Strain
413
600
700
750
800
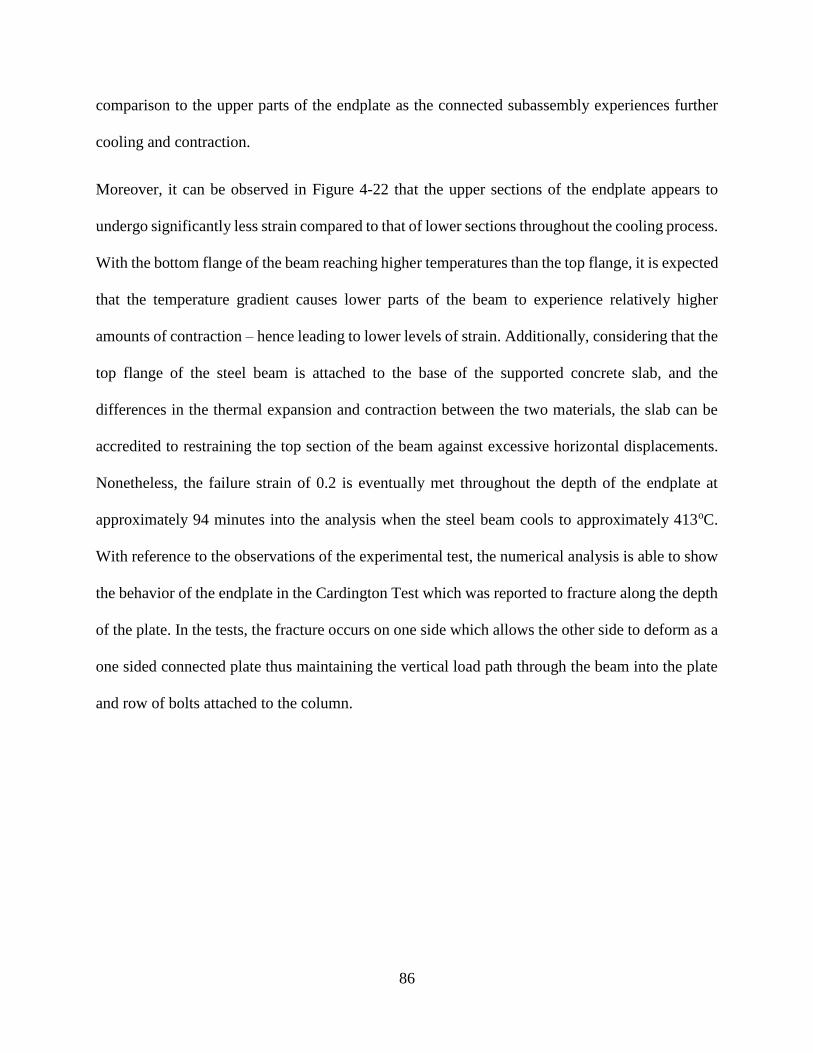
86
comparison to the upper parts of the endplate as the connected subassembly experiences further
cooling and contraction.
Moreover, it can be observed in Figure 4-22 that the upper sections of the endplate appears to
undergo significantly less strain compared to that of lower sections throughout the cooling process.
With the bottom flange of the beam reaching higher temperatures than the top flange, it is expected
that the temperature gradient causes lower parts of the beam to experience relatively higher
amounts of contraction – hence leading to lower levels of strain. Additionally, considering that the
top flange of the steel beam is attached to the base of the supported concrete slab, and the
differences in the thermal expansion and contraction between the two materials, the slab can be
accredited to restraining the top section of the beam against excessive horizontal displacements.
Nonetheless, the failure strain of 0.2 is eventually met throughout the depth of the endplate at
approximately 94 minutes into the analysis when the steel beam cools to approximately 413oC.
With reference to the observations of the experimental test, the numerical analysis is able to show
the behavior of the endplate in the Cardington Test which was reported to fracture along the depth
of the plate. In the tests, the fracture occurs on one side which allows the other side to deform as a
one sided connected plate thus maintaining the vertical load path through the beam into the plate
and row of bolts attached to the column.
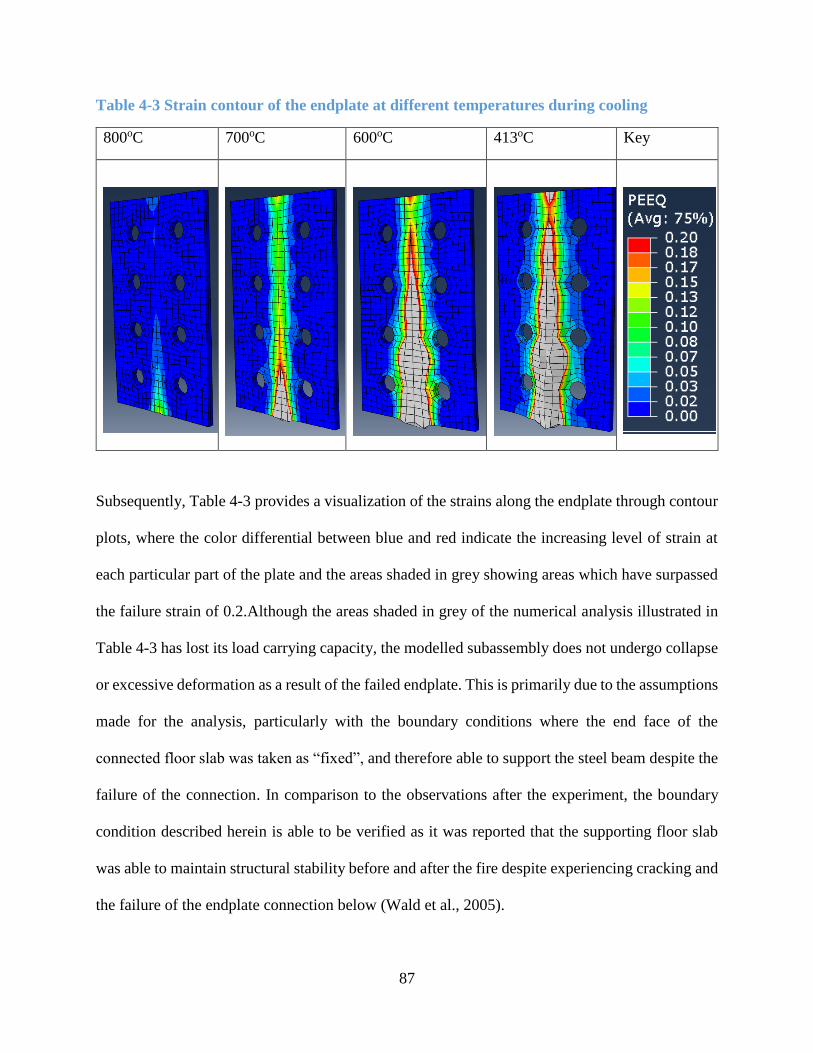
87
Table 4-3 Strain contour of the endplate at different temperatures during cooling
800oC 700oC 600oC 413oC Key
Subsequently, Table 4-3 provides a visualization of the strains along the endplate through contour
plots, where the color differential between blue and red indicate the increasing level of strain at
each particular part of the plate and the areas shaded in grey showing areas which have surpassed
the failure strain of 0.2.Although the areas shaded in grey of the numerical analysis illustrated in
Table 4-3 has lost its load carrying capacity, the modelled subassembly does not undergo collapse
or excessive deformation as a result of the failed endplate. This is primarily due to the assumptions
made for the analysis, particularly with the boundary conditions where the end face of the
connected floor slab was taken as “fixed”, and therefore able to support the steel beam despite the
failure of the connection. In comparison to the observations after the experiment, the boundary
condition described herein is able to be verified as it was reported that the supporting floor slab
was able to maintain structural stability before and after the fire despite experiencing cracking and
the failure of the endplate connection below (Wald et al., 2005).
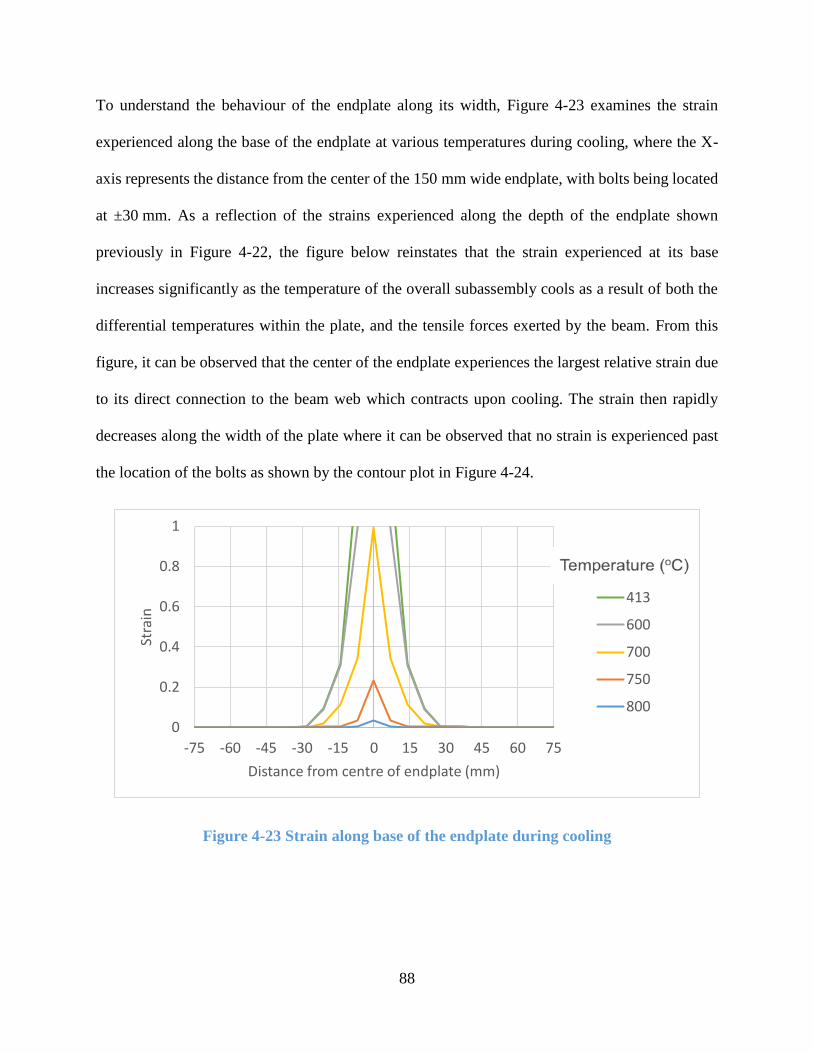
88
To understand the behaviour of the endplate along its width, Figure 4-23 examines the strain
experienced along the base of the endplate at various temperatures during cooling, where the X-
axis represents the distance from the center of the 150 mm wide endplate, with bolts being located
at ±30 mm. As a reflection of the strains experienced along the depth of the endplate shown
previously in Figure 4-22, the figure below reinstates that the strain experienced at its base
increases significantly as the temperature of the overall subassembly cools as a result of both the
differential temperatures within the plate, and the tensile forces exerted by the beam. From this
figure, it can be observed that the center of the endplate experiences the largest relative strain due
to its direct connection to the beam web which contracts upon cooling. The strain then rapidly
decreases along the width of the plate where it can be observed that no strain is experienced past
the location of the bolts as shown by the contour plot in Figure 4-24.
Figure 4-23 Strain along base of the endplate during cooling
0
0.2
0.4
0.6
0.8
1
-75 -60 -45 -30 -15 0 15 30 45 60 75
Stra
in
Distance from centre of endplate (mm)
413
600
700
750
800
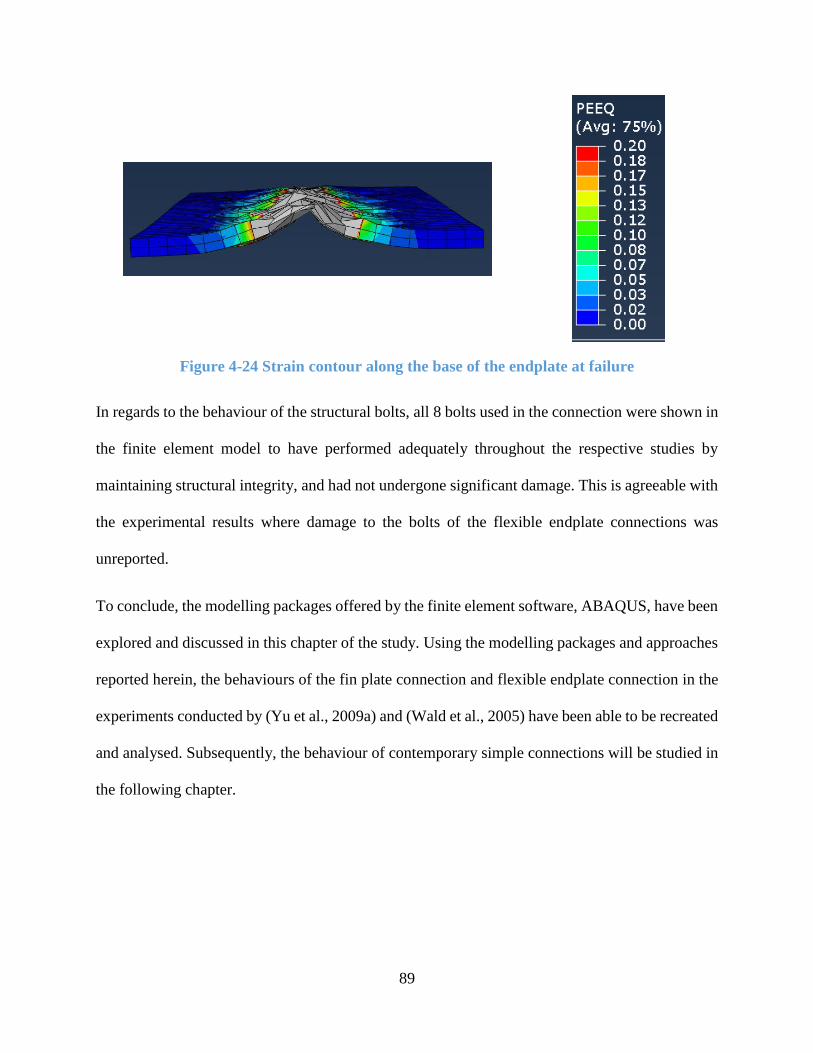
89
Figure 4-24 Strain contour along the base of the endplate at failure
In regards to the behaviour of the structural bolts, all 8 bolts used in the connection were shown in
the finite element model to have performed adequately throughout the respective studies by
maintaining structural integrity, and had not undergone significant damage. This is agreeable with
the experimental results where damage to the bolts of the flexible endplate connections was
unreported.
To conclude, the modelling packages offered by the finite element software, ABAQUS, have been
explored and discussed in this chapter of the study. Using the modelling packages and approaches
reported herein, the behaviours of the fin plate connection and flexible endplate connection in the
experiments conducted by (Yu et al., 2009a) and (Wald et al., 2005) have been able to be recreated
and analysed. Subsequently, the behaviour of contemporary simple connections will be studied in
the following chapter.
90
5 Modelling the Behaviour of New Zealand Flexible Endplate
Connections
Upon successfully validating the use of the software package ABAQUS to model the behaviour
of connections as per Sections 3 and 4, the Cardington connection was redesigned to suit current
connection design guides from New Zealand (SCNZ, 2008a), and then its behaviour was
modelled in comparison to the U.K. connections (SCI, 2014). Particularly, the connections were
designed to the loads sustained by the subassembly of the Cardington test in order to create
accurate representations of the observed behaviour of the connections in fire. This was achieved
by the inclusion of the connecting beam and the concrete slab in the connection model in
ABAQUS. As per the Cardington subassembly, the connection designs account for a 193 kN
point load at the centre of a 6 m length of beam.
The design of the connections incorporate the difference in detailing requirements between New
Zealand and the U.K. as per Section 2.4, which highlights the variability in factors such as edge
and bolt separation distances, as well as material properties which New Zealand and U.K. design
guides recommend the use of G300 and S275 type steel respectively.
In regards to the finite element analysis of the New Zealand and U.K. connections, the simulations
covered variations in structural detailing of the connections, such as: material properties and plate
thicknesses from the UK design and NZ design, respectively, in order to determine the influence
caused by the alterations in design.
5.1 Design of Flexible Endplate Connections
Upon successfully validating the use of the software package ABAQUS to model the behaviour
of connections as per Chapters 3 and 4, the Cardington Test 7 connection was redesigned to suit
91
current connection design guides from New Zealand (SCNZ, 2008a), and then its behaviour was
modelled in comparison to equivalent U.K. connections (SCI, 2014). Particularly, the
connections were designed to the loads sustained by the subassembly of the Cardington test in
order to create accurate representations of the observed behaviour of the connections in fire. This
was achieved by the inclusion of the connecting beam and the concrete slab in the connection
model in ABAQUS. As per the Cardington Test 7 subassembly, the connection designs account
for a 193 kN point load at the centre of a 6 m length of beam.
The design of the connections incorporate the difference in detailing requirements between New
Zealand and the U.K. as per Section 2.4, which highlights the variability in factors such as edge
and bolt separation distances, as well as material properties which New Zealand and U.K. design
guides recommend the use of G300 and S275 type steel respectively.
In regards to finite element analysis of New Zealand and U.K. connections, the simulations
covered variations in structural detailing of the connections such as: material properties and plate
thicknesses from the UK design and NZ design, respectively, in order to determine the influence
caused by the alterations in design.
5.2 Design of Flexible Endplate Connections
In accordance with the structural frame used in Cardington Test 7, the primary beam to column
flexible endplate connection of the subassembly studied in Chapter 4 has been redesigned using
current design guides from New Zealand and the U.K.. In particular, these rules are Section VIII
of the New Zealand Structural Steelwork Connections Guide (SCNZ, 2008a) and Chapter 4 of
Joints in Steel Construction: Simple Joints to Eurocode 3(SCI, 2014) respectively. As previously
discussed in Chapter 2 of this study, the designs were then modelled in the Cardington
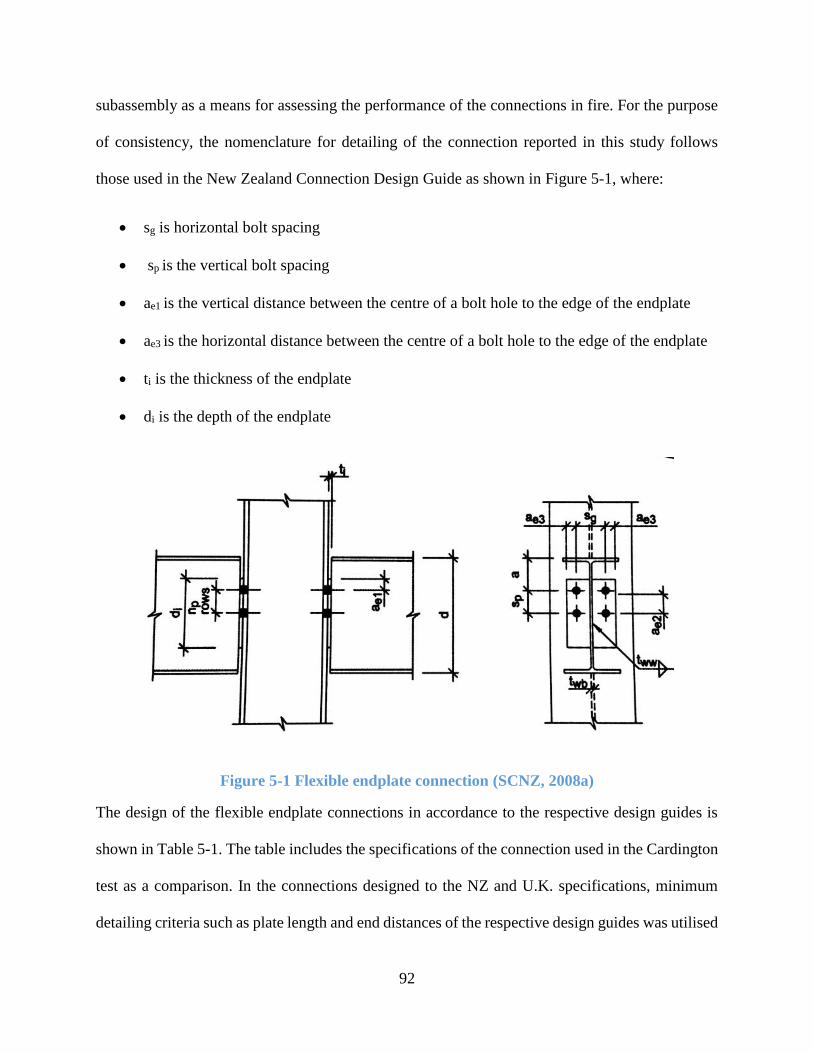
92
subassembly as a means for assessing the performance of the connections in fire. For the purpose
of consistency, the nomenclature for detailing of the connection reported in this study follows
those used in the New Zealand Connection Design Guide as shown in Figure 5-1, where:
• sg is horizontal bolt spacing
• sp is the vertical bolt spacing
• ae1 is the vertical distance between the centre of a bolt hole to the edge of the endplate
• ae3 is the horizontal distance between the centre of a bolt hole to the edge of the endplate
• ti is the thickness of the endplate
• di is the depth of the endplate
Figure 5-1 Flexible endplate connection (SCNZ, 2008a)
The design of the flexible endplate connections in accordance to the respective design guides is
shown in Table 5-1. The table includes the specifications of the connection used in the Cardington
test as a comparison. In the connections designed to the NZ and U.K. specifications, minimum
detailing criteria such as plate length and end distances of the respective design guides was utilised
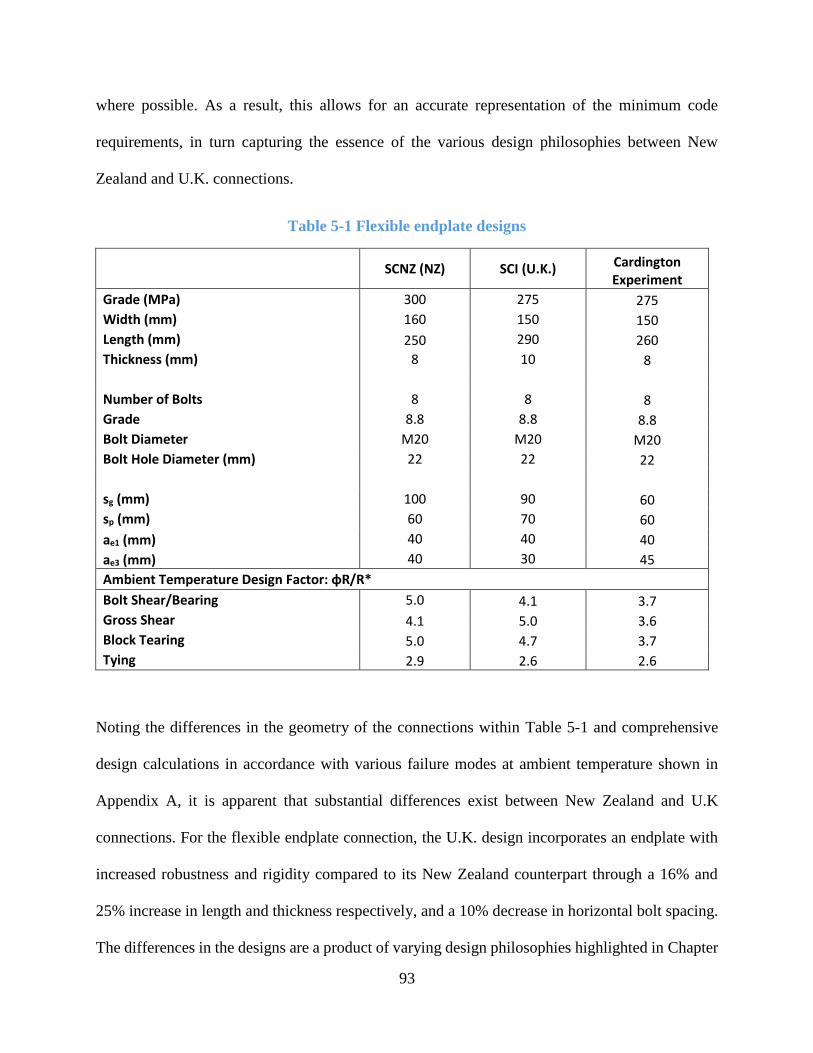
93
where possible. As a result, this allows for an accurate representation of the minimum code
requirements, in turn capturing the essence of the various design philosophies between New
Zealand and U.K. connections.
Table 5-1 Flexible endplate designs
SCNZ (NZ) SCI (U.K.) Cardington Experiment
Grade (MPa) 300 275 275
Width (mm) 160 150 150
Length (mm) 250 290 260
Thickness (mm) 8 10 8
Number of Bolts 8 8 8
Grade 8.8 8.8 8.8
Bolt Diameter M20 M20 M20
Bolt Hole Diameter (mm) 22 22 22
sg (mm) 100 90 60
sp (mm) 60 70 60
ae1 (mm) 40 40 40
ae3 (mm) 40 30 45
Ambient Temperature Design Factor: φR/R*
Bolt Shear/Bearing 5.0 4.1 3.7
Gross Shear 4.1 5.0 3.6
Block Tearing 5.0 4.7 3.7
Tying 2.9 2.6 2.6
Noting the differences in the geometry of the connections within Table 5-1 and comprehensive
design calculations in accordance with various failure modes at ambient temperature shown in
Appendix A, it is apparent that substantial differences exist between New Zealand and U.K
connections. For the flexible endplate connection, the U.K. design incorporates an endplate with
increased robustness and rigidity compared to its New Zealand counterpart through a 16% and
25% increase in length and thickness respectively, and a 10% decrease in horizontal bolt spacing.
The differences in the designs are a product of varying design philosophies highlighted in Chapter
94
2.1, where the New Zealand design places a larger emphasis on the ductility of the connection. In
this scenario for the design of flexible endplate connections, the main differences are as follows:
• SCNZ (2008a) specifies Grade 300 steel to be used in New Zealand connections compared
to S275 grade steel specified by SCI (2014) in U.K. connections.
• SCI (2014) recommends the use of 10 mm thick endplates, whereas 8 mm thick endplates
are commonly used in New Zealand for similar applications.
• Following the respective design criteria and recommendations, the horizontal bolt spacing
for the New Zealand and U.K designs at 100 mm and 90 mm are substantially higher than
60 mm spacing used in Cardington Test 7.
• Small discrepancies exist between the vertical bolt spacing and edge distances in the
specified connections as discussed in Chapter 2.
Due to the differences in geometry between the connections and variations in design philosophies
in the two countries, variations arise in the designed strength capacity of the connections as shown
at the bottom of Table 5-1, the table highlights the ambient temperature design factors for the
various failure modes of the connections. In regards to the design of bolts, the New Zealand
connection considers their strength limit to be based purely on their transverse shear capacity,
whereas Section 4 of the U.K. design guide (SCI, 2014) also considers the bearing resistance of
the supporting members under the same criteria . In turn, this extra consideration results in the
lower limiting factor for both the U.K. and Cardington bolt strength designs despite all three
connections specifying eight M20 Grade 8.8 bolts.
Regarding the gross shear strength of the connections, the U.K. connection utilises slightly a larger
endplate which provides a greater capacity for shear resistance due to its increased area as reflected
95
in Table 5-1, where the design factors for gross shear for the New Zealand and U.K. endplate are
4.1 and 5.0 respectively. However when considering the calculation of the block tearing capacities
of the connections, the New Zealand design guide (SCNZ, 2008a) offers a comparatively more
conservative approach by providing two equations for determining the area for block shear of
which the largest calculated area is taken as the limiting criteria. In turn, this consideration leads
to the placement of greater emphasis on the tying resistance of connection - a preferred failure
mode due to its ductile mechanism.
Considering the ambient temperature design factors for tying resistance between the three
connections, the calculated values indicated by Table 5-1 show that the Cardington and U.K.
possess effectively the same design factor at 2.6, while the New Zealand connection offers higher
resistance with a design factor of 2.9. In this scenario, the similarity between the Cardington and
U.K design factors is a product of the considerations within the equations provided by SCI (2014),
where the detailing of edge distances are of high influence compared to other geometric factors.
Therefore, as the connection used in the Cardington test used an edge distance of 40 mm compared
to the minimum 30 mm distance specified by SCI (2014), the two connections are shown to provide
an effectively equal design resistance for tying capacity despite the Cardington connection being
thinner and less robust. On the other hand, the formulas presented by SCNZ (2008a) follows a
different approach by placing greater influence on other geometric factors such as the length of the
plate and the bolt gauge, resulting in a higher design factor.
Therefore, the comparison between the connection geometries and ambient temperature design
factors for the flexible endplate connections designed in accordance with their respective design
guides can be observed to highlight the differences in philosophy outlined in Chapter 2, where it
96
is emphasised that the New Zealand connection design places a heavier consideration on the
ductility of the connection by allowing for an increased yield capacity of the endplate.
5.3 Flexible Endplate Modelling Scenarios
Following the modelling approach undertaken for the fin plate connection, the process of creating
models with intermediate detailing requirements is repeated for that of the flexible end plate
connection. Given the variations between the New Zealand and U.K. designs, two additional
connections incorporating the varying features were modelled in pursuance of better understanding
the performance of the connections in fire.
As shown in Table 5-2, the intermediate connection labelled FE2 utilises the connection detailing
of the New Zealand design with a 10 mm thick endplate of grade S275, whereas FE3 on the other
hand uses the detailing of the U.K. design whilst incorporating an 8 mm thick endplate graded to
300 MPa. In turn, the two intermediate connections will aid in illustrating the influence of varying
details on the behaviour of steel connections in fire.
The modelled connection designs are highlighted in Table 5-2, where the four variations are
modelled to replace that used in the Cardington Test 7 subassembly.
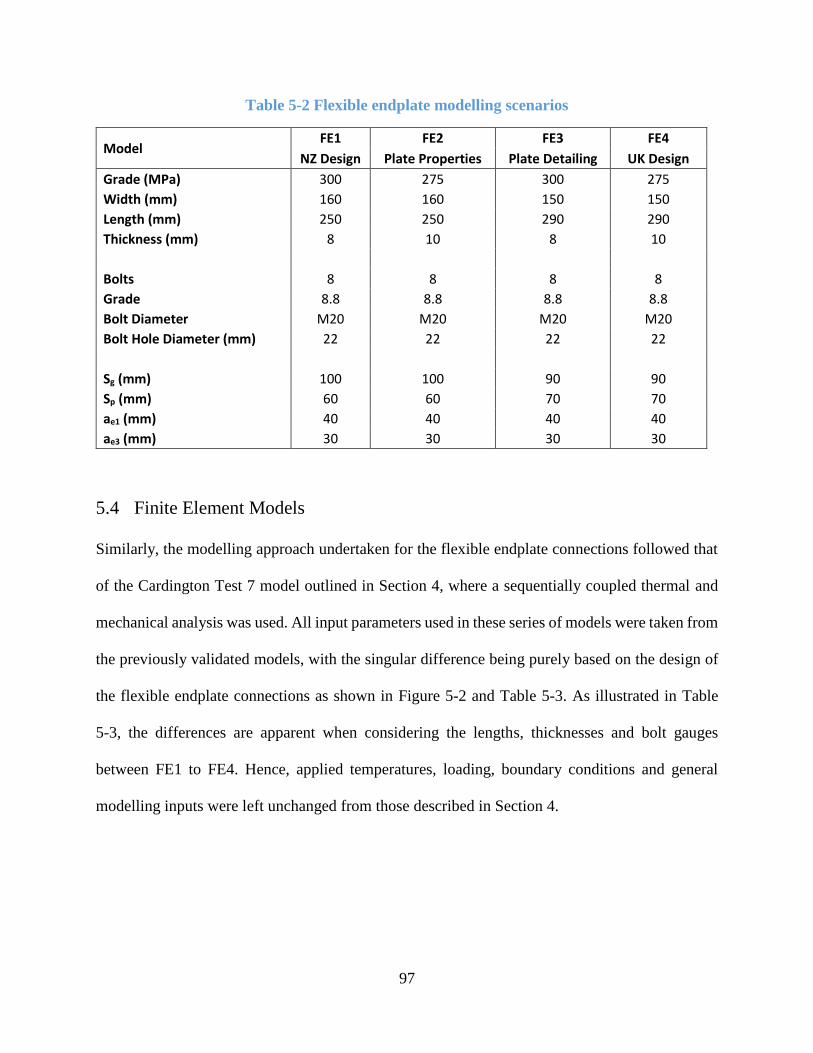
97
Table 5-2 Flexible endplate modelling scenarios
Model FE1 FE2 FE3 FE4
NZ Design Plate Properties Plate Detailing UK Design
Grade (MPa) 300 275 300 275
Width (mm) 160 160 150 150
Length (mm) 250 250 290 290
Thickness (mm) 8 10 8 10
Bolts 8 8 8 8
Grade 8.8 8.8 8.8 8.8
Bolt Diameter M20 M20 M20 M20
Bolt Hole Diameter (mm) 22 22 22 22
Sg (mm) 100 100 90 90
Sp (mm) 60 60 70 70
ae1 (mm) 40 40 40 40
ae3 (mm) 30 30 30 30
5.4 Finite Element Models
Similarly, the modelling approach undertaken for the flexible endplate connections followed that
of the Cardington Test 7 model outlined in Section 4, where a sequentially coupled thermal and
mechanical analysis was used. All input parameters used in these series of models were taken from
the previously validated models, with the singular difference being purely based on the design of
the flexible endplate connections as shown in Figure 5-2 and Table 5-3. As illustrated in Table
5-3, the differences are apparent when considering the lengths, thicknesses and bolt gauges
between FE1 to FE4. Hence, applied temperatures, loading, boundary conditions and general
modelling inputs were left unchanged from those described in Section 4.
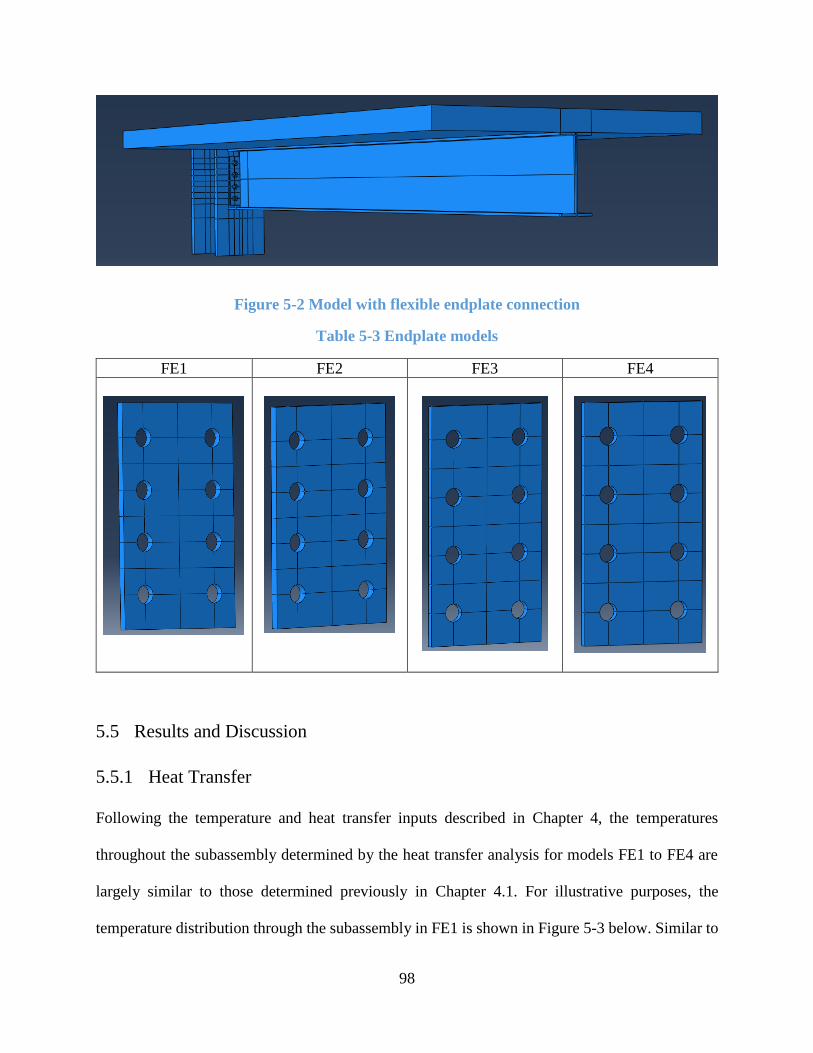
98
Figure 5-2 Model with flexible endplate connection
Table 5-3 Endplate models
FE1 FE2 FE3 FE4
5.5 Results and Discussion
5.5.1 Heat Transfer
Following the temperature and heat transfer inputs described in Chapter 4, the temperatures
throughout the subassembly determined by the heat transfer analysis for models FE1 to FE4 are
largely similar to those determined previously in Chapter 4.1. For illustrative purposes, the
temperature distribution through the subassembly in FE1 is shown in Figure 5-3 below. Similar to
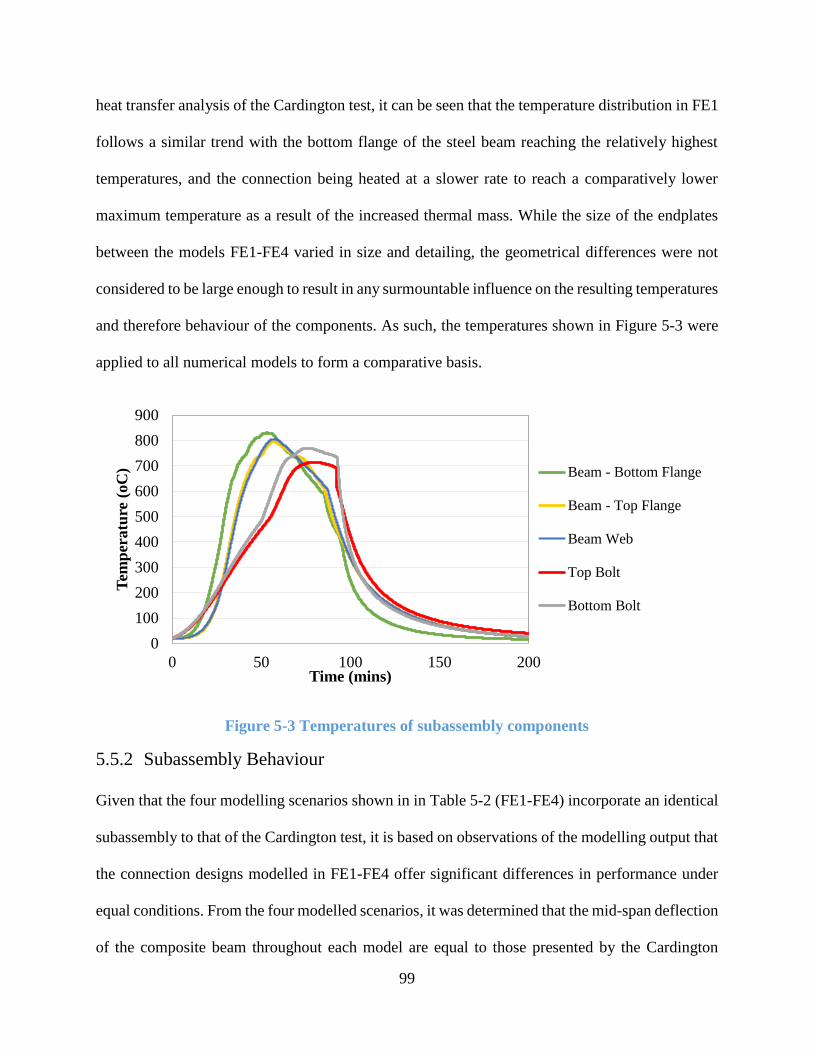
99
heat transfer analysis of the Cardington test, it can be seen that the temperature distribution in FE1
follows a similar trend with the bottom flange of the steel beam reaching the relatively highest
temperatures, and the connection being heated at a slower rate to reach a comparatively lower
maximum temperature as a result of the increased thermal mass. While the size of the endplates
between the models FE1-FE4 varied in size and detailing, the geometrical differences were not
considered to be large enough to result in any surmountable influence on the resulting temperatures
and therefore behaviour of the components. As such, the temperatures shown in Figure 5-3 were
applied to all numerical models to form a comparative basis.
Figure 5-3 Temperatures of subassembly components
5.5.2 Subassembly Behaviour
Given that the four modelling scenarios shown in in Table 5-2 (FE1-FE4) incorporate an identical
subassembly to that of the Cardington test, it is based on observations of the modelling output that
the connection designs modelled in FE1-FE4 offer significant differences in performance under
equal conditions. From the four modelled scenarios, it was determined that the mid-span deflection
of the composite beam throughout each model are equal to those presented by the Cardington
0
100
200
300
400
500
600
700
800
900
0 50 100 150 200
Tem
per
atu
re (
oC
)
Time (mins)
Beam - Bottom Flange
Beam - Top Flange
Beam Web
Top Bolt
Bottom Bolt
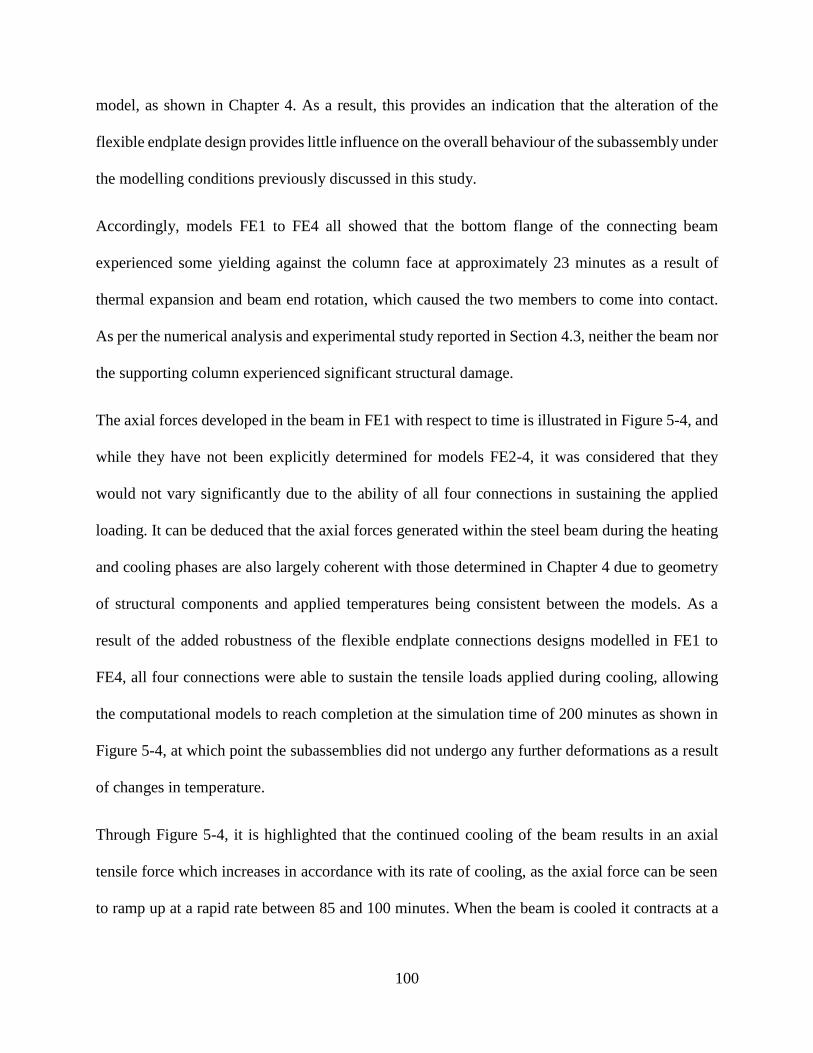
100
model, as shown in Chapter 4. As a result, this provides an indication that the alteration of the
flexible endplate design provides little influence on the overall behaviour of the subassembly under
the modelling conditions previously discussed in this study.
Accordingly, models FE1 to FE4 all showed that the bottom flange of the connecting beam
experienced some yielding against the column face at approximately 23 minutes as a result of
thermal expansion and beam end rotation, which caused the two members to come into contact.
As per the numerical analysis and experimental study reported in Section 4.3, neither the beam nor
the supporting column experienced significant structural damage.
The axial forces developed in the beam in FE1 with respect to time is illustrated in Figure 5-4, and
while they have not been explicitly determined for models FE2-4, it was considered that they
would not vary significantly due to the ability of all four connections in sustaining the applied
loading. It can be deduced that the axial forces generated within the steel beam during the heating
and cooling phases are also largely coherent with those determined in Chapter 4 due to geometry
of structural components and applied temperatures being consistent between the models. As a
result of the added robustness of the flexible endplate connections designs modelled in FE1 to
FE4, all four connections were able to sustain the tensile loads applied during cooling, allowing
the computational models to reach completion at the simulation time of 200 minutes as shown in
Figure 5-4, at which point the subassemblies did not undergo any further deformations as a result
of changes in temperature.
Through Figure 5-4, it is highlighted that the continued cooling of the beam results in an axial
tensile force which increases in accordance with its rate of cooling, as the axial force can be seen
to ramp up at a rapid rate between 85 and 100 minutes. When the beam is cooled it contracts at a
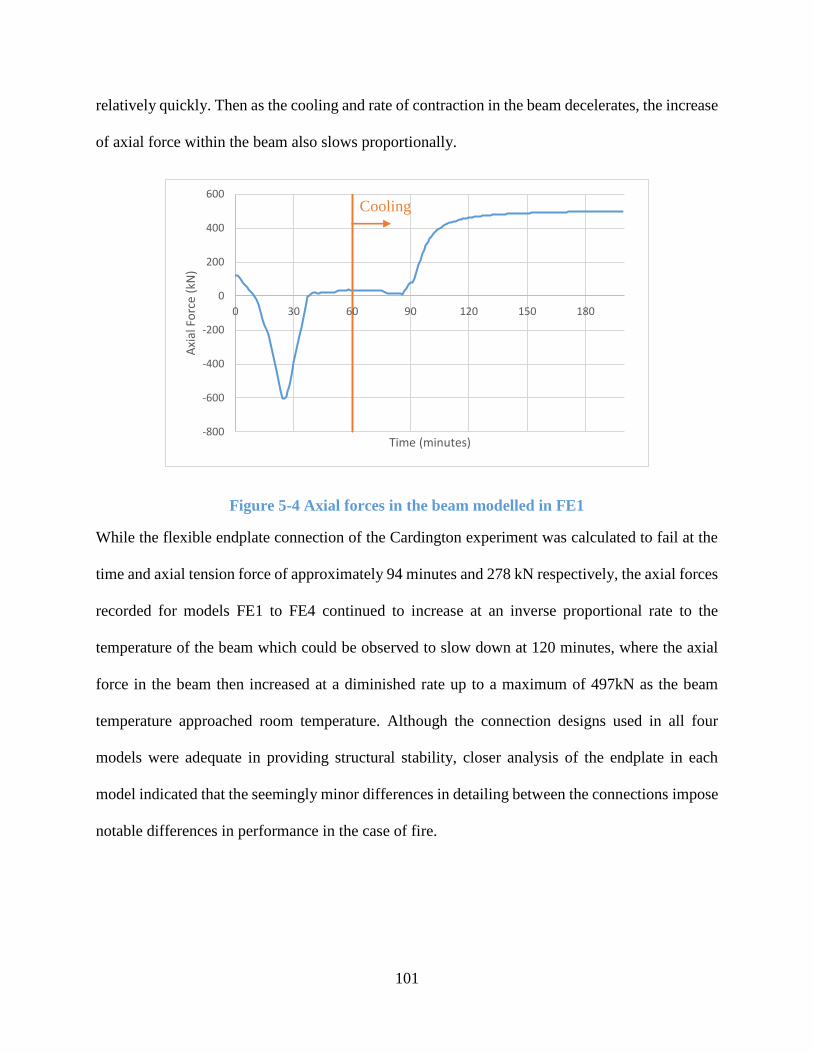
101
relatively quickly. Then as the cooling and rate of contraction in the beam decelerates, the increase
of axial force within the beam also slows proportionally.
Figure 5-4 Axial forces in the beam modelled in FE1
While the flexible endplate connection of the Cardington experiment was calculated to fail at the
time and axial tension force of approximately 94 minutes and 278 kN respectively, the axial forces
recorded for models FE1 to FE4 continued to increase at an inverse proportional rate to the
temperature of the beam which could be observed to slow down at 120 minutes, where the axial
force in the beam then increased at a diminished rate up to a maximum of 497kN as the beam
temperature approached room temperature. Although the connection designs used in all four
models were adequate in providing structural stability, closer analysis of the endplate in each
model indicated that the seemingly minor differences in detailing between the connections impose
notable differences in performance in the case of fire.
-800
-600
-400
-200
0
200
400
600
0 30 60 90 120 150 180
Axi
al F
orc
e (k
N)
Time (minutes)
Cooling
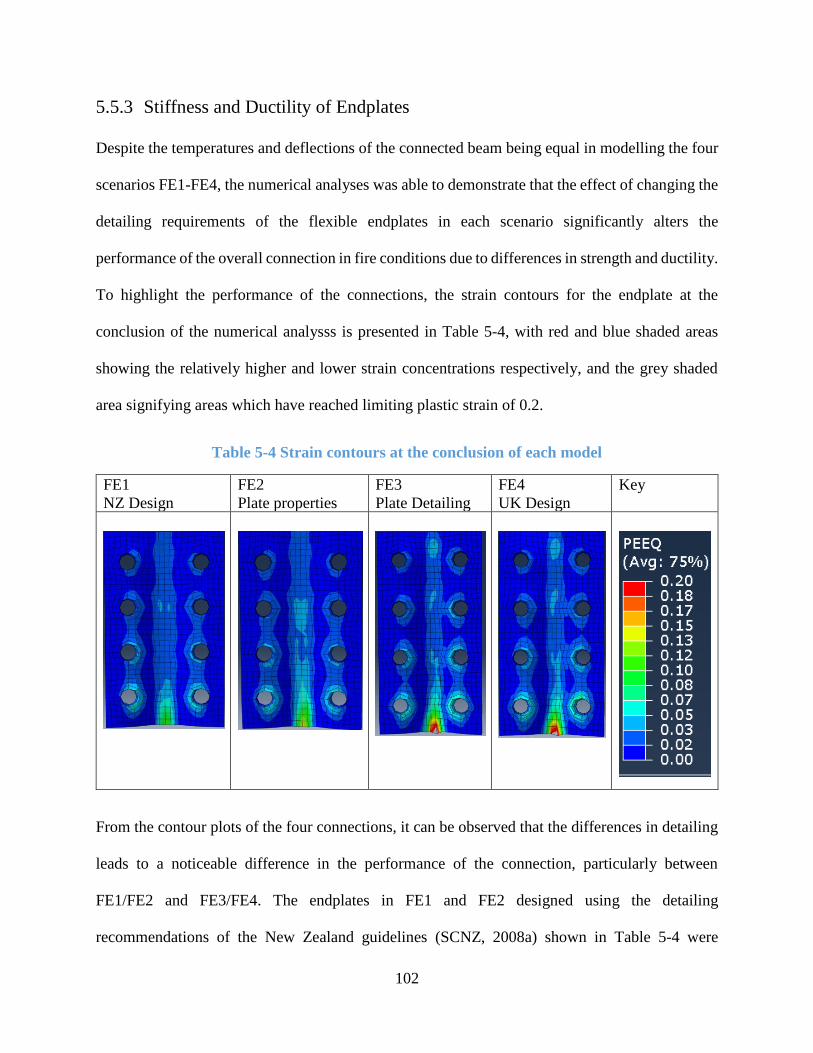
102
5.5.3 Stiffness and Ductility of Endplates
Despite the temperatures and deflections of the connected beam being equal in modelling the four
scenarios FE1-FE4, the numerical analyses was able to demonstrate that the effect of changing the
detailing requirements of the flexible endplates in each scenario significantly alters the
performance of the overall connection in fire conditions due to differences in strength and ductility.
To highlight the performance of the connections, the strain contours for the endplate at the
conclusion of the numerical analysss is presented in Table 5-4, with red and blue shaded areas
showing the relatively higher and lower strain concentrations respectively, and the grey shaded
area signifying areas which have reached limiting plastic strain of 0.2.
Table 5-4 Strain contours at the conclusion of each model
FE1
NZ Design
FE2
Plate properties
FE3
Plate Detailing
FE4
UK Design
Key
From the contour plots of the four connections, it can be observed that the differences in detailing
leads to a noticeable difference in the performance of the connection, particularly between
FE1/FE2 and FE3/FE4. The endplates in FE1 and FE2 designed using the detailing
recommendations of the New Zealand guidelines (SCNZ, 2008a) shown in Table 5-4 were
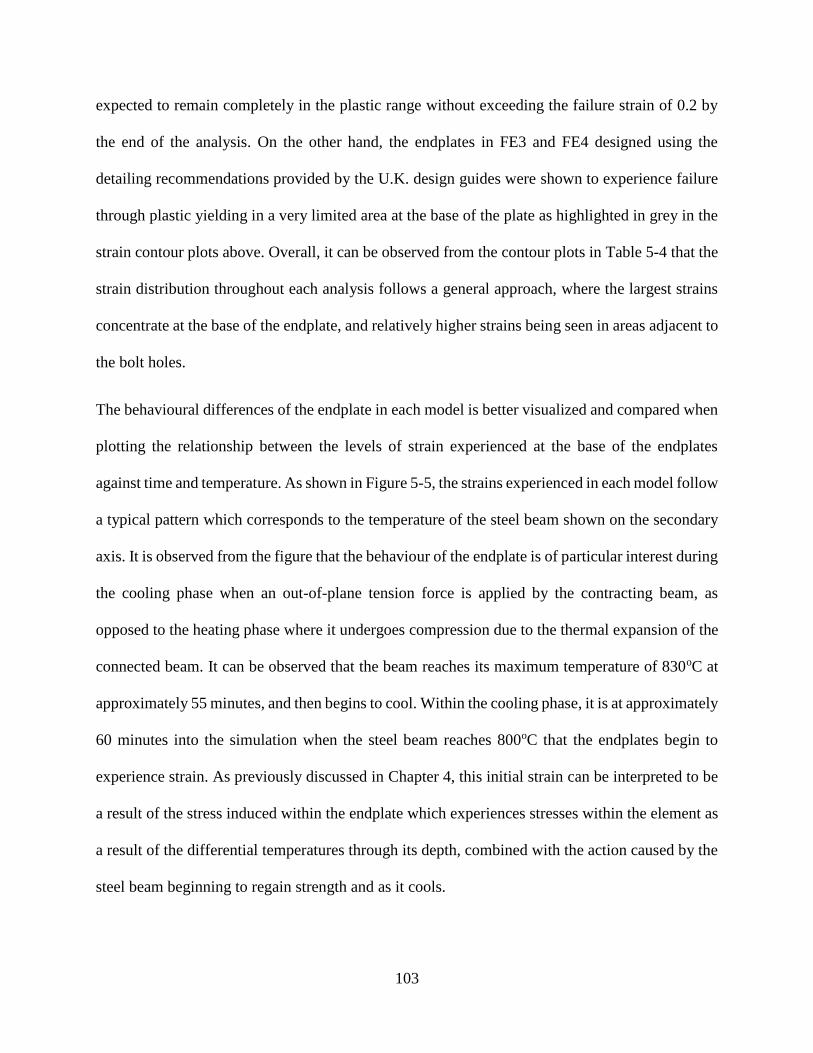
103
expected to remain completely in the plastic range without exceeding the failure strain of 0.2 by
the end of the analysis. On the other hand, the endplates in FE3 and FE4 designed using the
detailing recommendations provided by the U.K. design guides were shown to experience failure
through plastic yielding in a very limited area at the base of the plate as highlighted in grey in the
strain contour plots above. Overall, it can be observed from the contour plots in Table 5-4 that the
strain distribution throughout each analysis follows a general approach, where the largest strains
concentrate at the base of the endplate, and relatively higher strains being seen in areas adjacent to
the bolt holes.
The behavioural differences of the endplate in each model is better visualized and compared when
plotting the relationship between the levels of strain experienced at the base of the endplates
against time and temperature. As shown in Figure 5-5, the strains experienced in each model follow
a typical pattern which corresponds to the temperature of the steel beam shown on the secondary
axis. It is observed from the figure that the behaviour of the endplate is of particular interest during
the cooling phase when an out-of-plane tension force is applied by the contracting beam, as
opposed to the heating phase where it undergoes compression due to the thermal expansion of the
connected beam. It can be observed that the beam reaches its maximum temperature of 830oC at
approximately 55 minutes, and then begins to cool. Within the cooling phase, it is at approximately
60 minutes into the simulation when the steel beam reaches 800oC that the endplates begin to
experience strain. As previously discussed in Chapter 4, this initial strain can be interpreted to be
a result of the stress induced within the endplate which experiences stresses within the element as
a result of the differential temperatures through its depth, combined with the action caused by the
steel beam beginning to regain strength and as it cools.
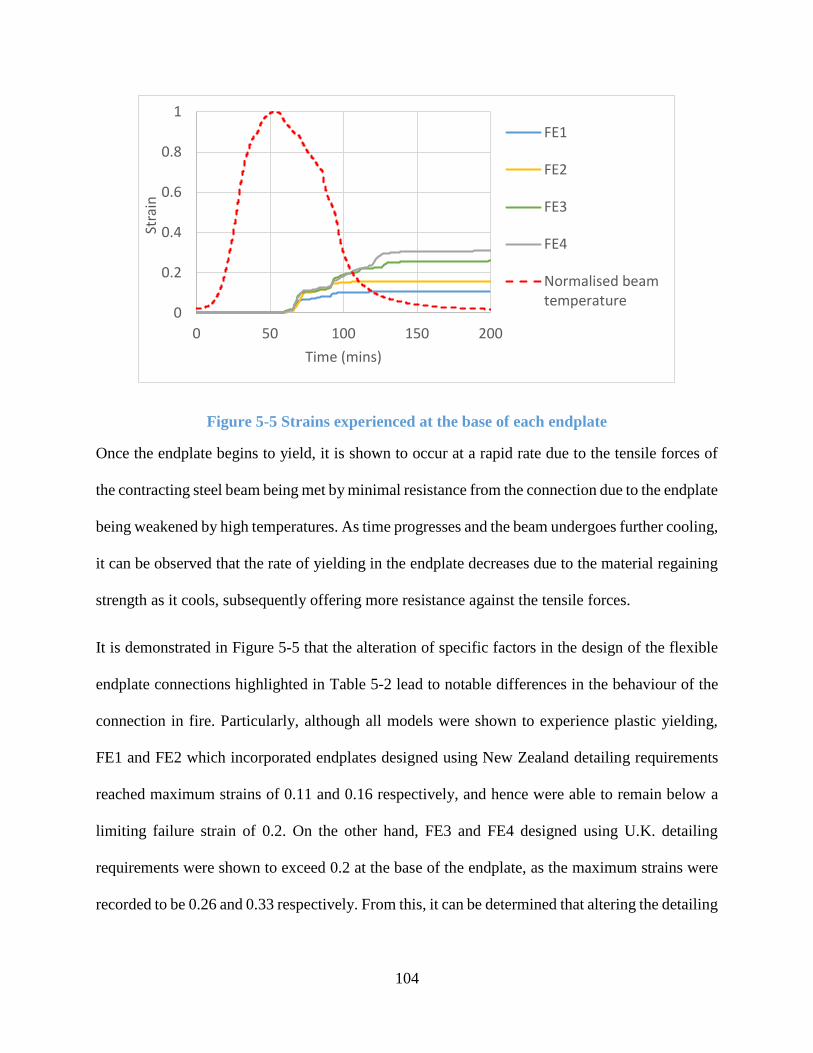
104
Figure 5-5 Strains experienced at the base of each endplate
Once the endplate begins to yield, it is shown to occur at a rapid rate due to the tensile forces of
the contracting steel beam being met by minimal resistance from the connection due to the endplate
being weakened by high temperatures. As time progresses and the beam undergoes further cooling,
it can be observed that the rate of yielding in the endplate decreases due to the material regaining
strength as it cools, subsequently offering more resistance against the tensile forces.
It is demonstrated in Figure 5-5 that the alteration of specific factors in the design of the flexible
endplate connections highlighted in Table 5-2 lead to notable differences in the behaviour of the
connection in fire. Particularly, although all models were shown to experience plastic yielding,
FE1 and FE2 which incorporated endplates designed using New Zealand detailing requirements
reached maximum strains of 0.11 and 0.16 respectively, and hence were able to remain below a
limiting failure strain of 0.2. On the other hand, FE3 and FE4 designed using U.K. detailing
requirements were shown to exceed 0.2 at the base of the endplate, as the maximum strains were
recorded to be 0.26 and 0.33 respectively. From this, it can be determined that altering the detailing
0
0.2
0.4
0.6
0.8
1
0 50 100 150 200
Stra
in
Time (mins)
FE1
FE2
FE3
FE4
Normalised beamtemperature
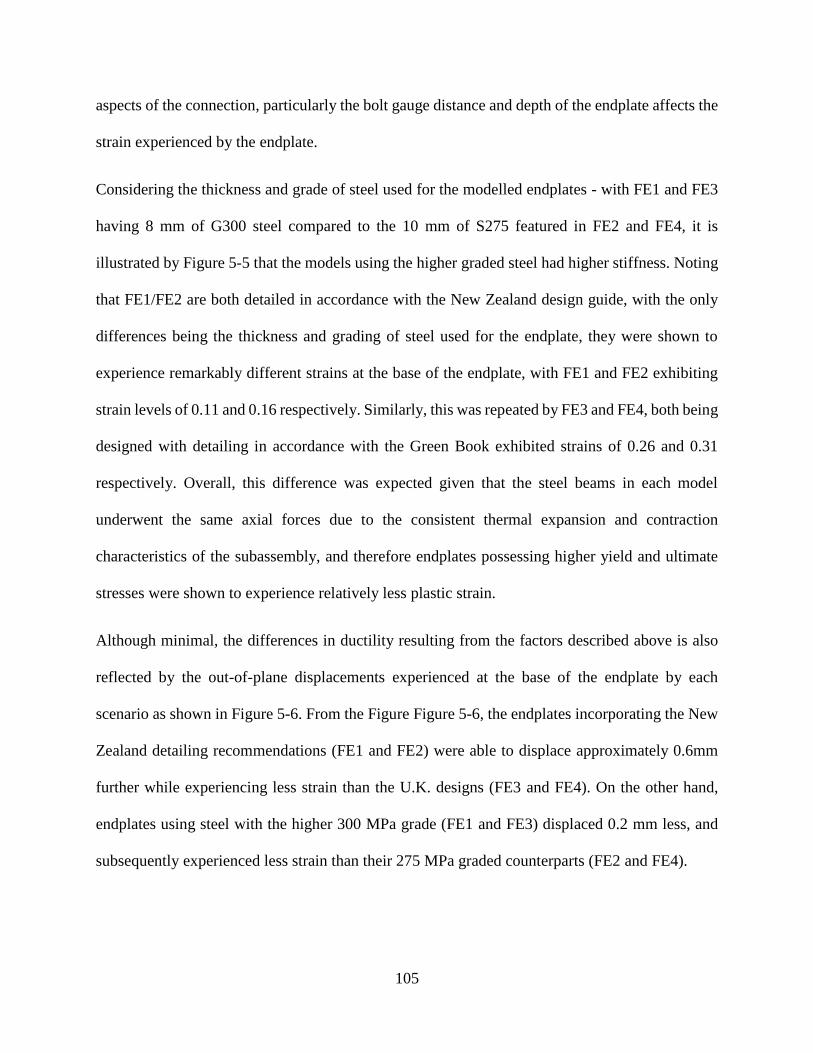
105
aspects of the connection, particularly the bolt gauge distance and depth of the endplate affects the
strain experienced by the endplate.
Considering the thickness and grade of steel used for the modelled endplates - with FE1 and FE3
having 8 mm of G300 steel compared to the 10 mm of S275 featured in FE2 and FE4, it is
illustrated by Figure 5-5 that the models using the higher graded steel had higher stiffness. Noting
that FE1/FE2 are both detailed in accordance with the New Zealand design guide, with the only
differences being the thickness and grading of steel used for the endplate, they were shown to
experience remarkably different strains at the base of the endplate, with FE1 and FE2 exhibiting
strain levels of 0.11 and 0.16 respectively. Similarly, this was repeated by FE3 and FE4, both being
designed with detailing in accordance with the Green Book exhibited strains of 0.26 and 0.31
respectively. Overall, this difference was expected given that the steel beams in each model
underwent the same axial forces due to the consistent thermal expansion and contraction
characteristics of the subassembly, and therefore endplates possessing higher yield and ultimate
stresses were shown to experience relatively less plastic strain.
Although minimal, the differences in ductility resulting from the factors described above is also
reflected by the out-of-plane displacements experienced at the base of the endplate by each
scenario as shown in Figure 5-6. From the Figure Figure 5-6, the endplates incorporating the New
Zealand detailing recommendations (FE1 and FE2) were able to displace approximately 0.6mm
further while experiencing less strain than the U.K. designs (FE3 and FE4). On the other hand,
endplates using steel with the higher 300 MPa grade (FE1 and FE3) displaced 0.2 mm less, and
subsequently experienced less strain than their 275 MPa graded counterparts (FE2 and FE4).
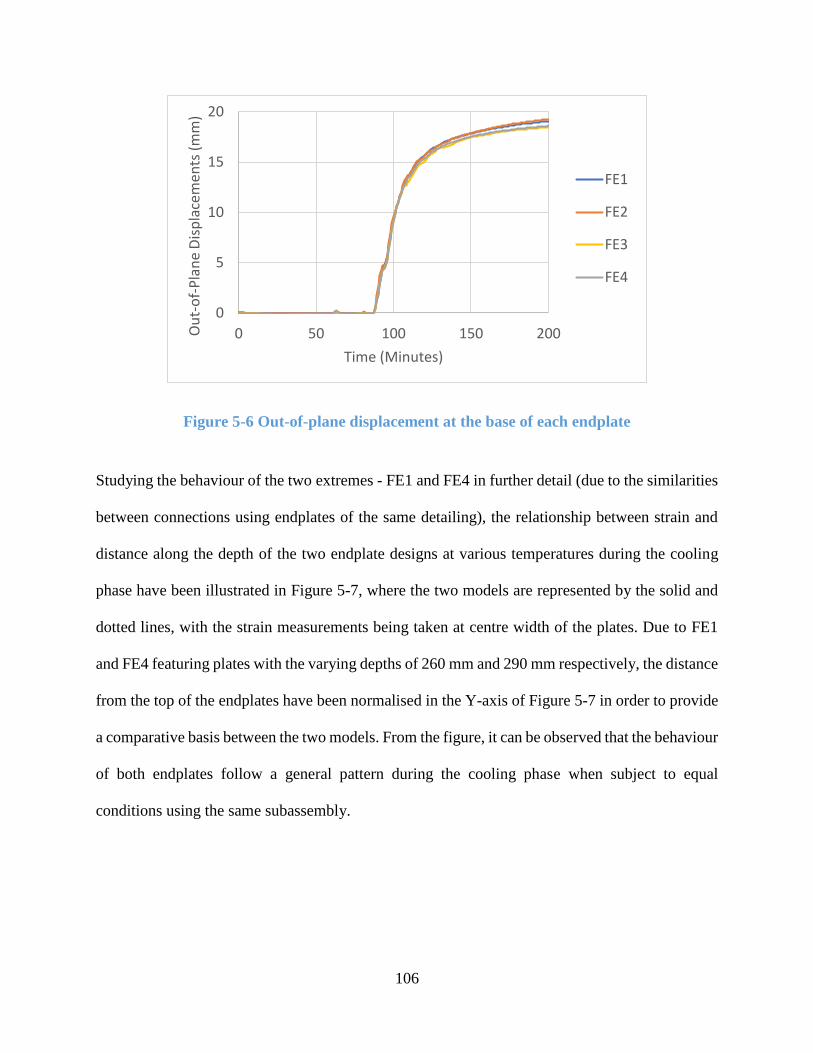
106
Figure 5-6 Out-of-plane displacement at the base of each endplate
Studying the behaviour of the two extremes - FE1 and FE4 in further detail (due to the similarities
between connections using endplates of the same detailing), the relationship between strain and
distance along the depth of the two endplate designs at various temperatures during the cooling
phase have been illustrated in Figure 5-7, where the two models are represented by the solid and
dotted lines, with the strain measurements being taken at centre width of the plates. Due to FE1
and FE4 featuring plates with the varying depths of 260 mm and 290 mm respectively, the distance
from the top of the endplates have been normalised in the Y-axis of Figure 5-7 in order to provide
a comparative basis between the two models. From the figure, it can be observed that the behaviour
of both endplates follow a general pattern during the cooling phase when subject to equal
conditions using the same subassembly.
0
5
10
15
20
0 50 100 150 200Ou
t-o
f-P
lan
e D
isp
lace
men
ts (
mm
)
Time (Minutes)
FE1
FE2
FE3
FE4
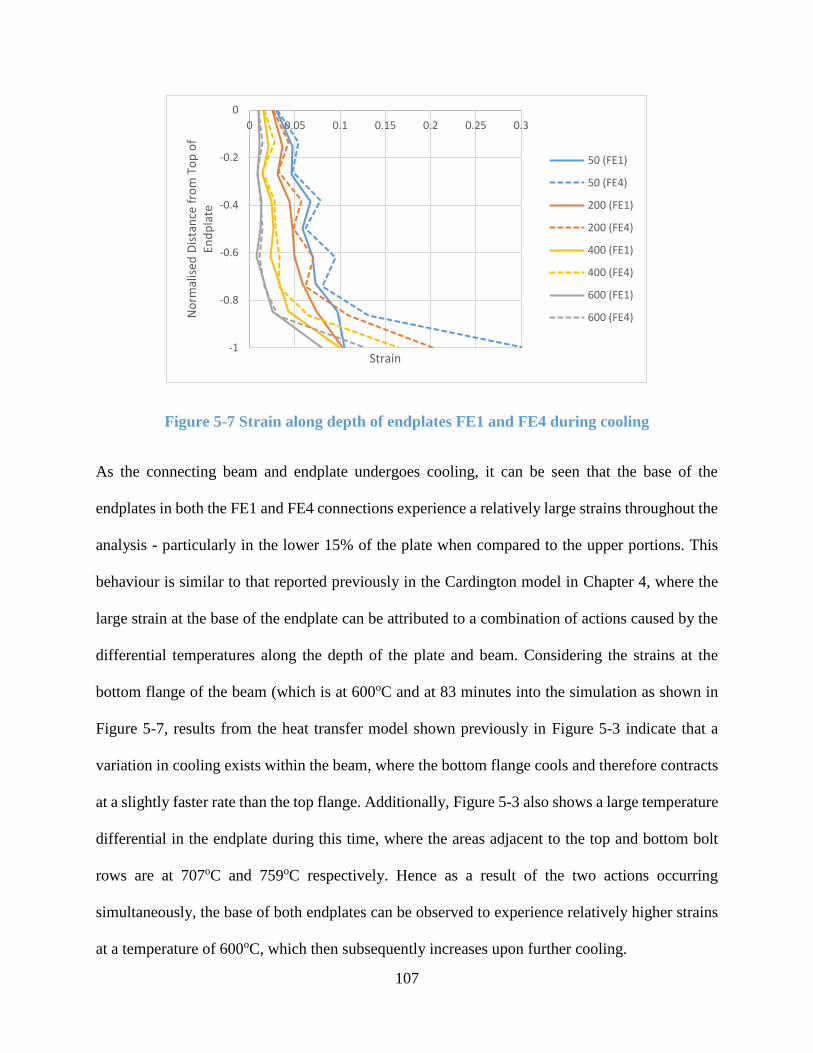
107
Figure 5-7 Strain along depth of endplates FE1 and FE4 during cooling
As the connecting beam and endplate undergoes cooling, it can be seen that the base of the
endplates in both the FE1 and FE4 connections experience a relatively large strains throughout the
analysis - particularly in the lower 15% of the plate when compared to the upper portions. This
behaviour is similar to that reported previously in the Cardington model in Chapter 4, where the
large strain at the base of the endplate can be attributed to a combination of actions caused by the
differential temperatures along the depth of the plate and beam. Considering the strains at the
bottom flange of the beam (which is at 600oC and at 83 minutes into the simulation as shown in
Figure 5-7, results from the heat transfer model shown previously in Figure 5-3 indicate that a
variation in cooling exists within the beam, where the bottom flange cools and therefore contracts
at a slightly faster rate than the top flange. Additionally, Figure 5-3 also shows a large temperature
differential in the endplate during this time, where the areas adjacent to the top and bottom bolt
rows are at 707oC and 759oC respectively. Hence as a result of the two actions occurring
simultaneously, the base of both endplates can be observed to experience relatively higher strains
at a temperature of 600oC, which then subsequently increases upon further cooling.
-1
-0.8
-0.6
-0.4
-0.2
0
0 0.05 0.1 0.15 0.2 0.25 0.3
No
rmal
ised
Dis
tan
ce f
rom
To
p o
f En
dp
late
Strain
50 (FE1)
50 (FE4)
200 (FE1)
200 (FE4)
400 (FE1)
400 (FE4)
600 (FE1)
600 (FE4)
108
Although the actions generated within the subassembly are equal in both models due to the similar
set-ups, the strain experienced by FE4 can be seen to be comparatively higher than that of FE1
throughout its depth during the cooling phase as illustrated in Figure 5-7. Firstly considering the
base of the endplate, it can be observed that the strains experienced in this area are significantly
higher in FE4 compared to FE1 at the same temperatures, where the difference can be attributed
to a combination of various factors. In addition to FE4 using a lower strength of steel, the depth of
the endplate at 290 mm is also longer than that of the 260 mm plate in FE1 which is important
when considering the strains caused by the differential temperatures in the plate and the connecting
beam.
The increased length of the endplate in FE4 results in it being more susceptible to increased strains
due to having a larger temperature differential along its length, as well as being attached to the
lower portions of the beam web which cool and contract quicker compared to higher sections,
hence further displacing the endplate. With the bolt gauge in FE4 being 10% shorter than that of
FE1, it is of lower ductility when yielded in the out-of-plane direction between the centre of the
bolts by providing closer restraints, in turn contributing to the increased strain of the endplate when
compared to FE1. As a result of the combination of these factors, it can be seen in Figure 5-7 that
the strain along the base of FE4 continues to increase as the subassembly cools, encountering the
strain of 0.2 at approximately 200oC where the material has been modelled to lose its load carrying
capacity, and therefore increases significantly upon further cooling of the connected beam.
Comparatively, although FE1 is subject to the same behaviour of the attached subassembly, the
strain at the base of the endplate can be seen in Figure 5-7 to also increase as it cools but reaches
a lower maximum strain of 0.11.
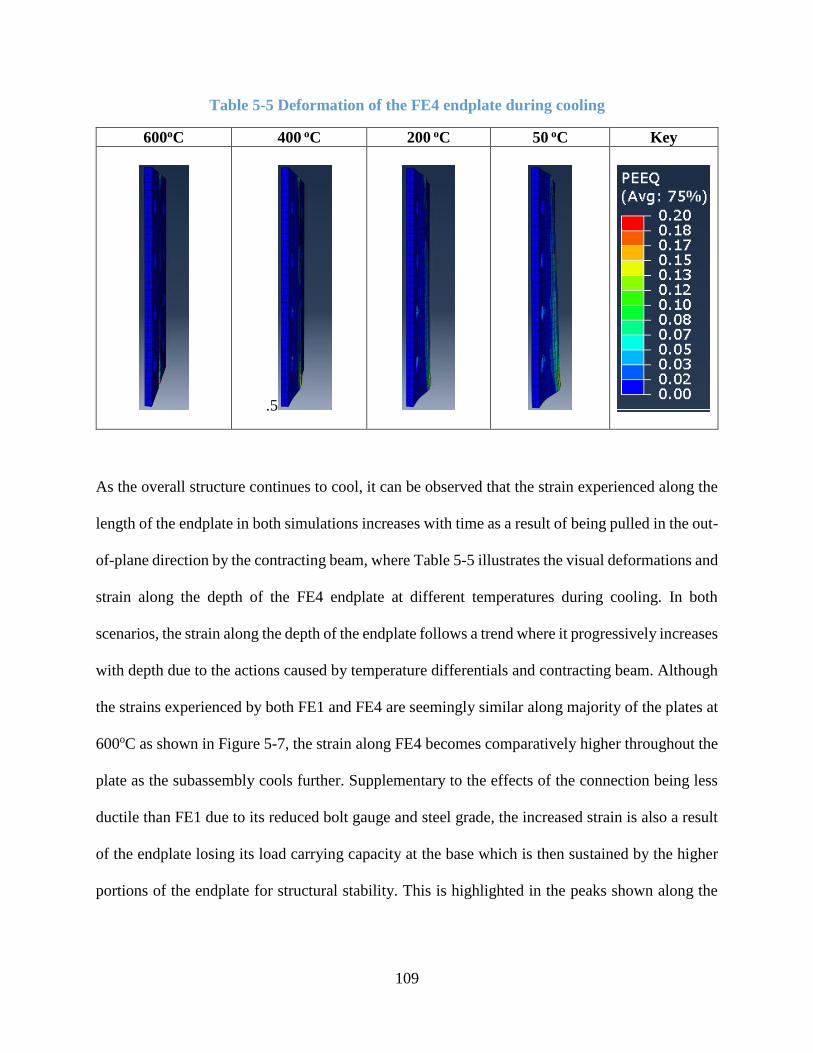
109
Table 5-5 Deformation of the FE4 endplate during cooling
600oC 400 oC 200 oC 50 oC Key
.5
As the overall structure continues to cool, it can be observed that the strain experienced along the
length of the endplate in both simulations increases with time as a result of being pulled in the out-
of-plane direction by the contracting beam, where Table 5-5 illustrates the visual deformations and
strain along the depth of the FE4 endplate at different temperatures during cooling. In both
scenarios, the strain along the depth of the endplate follows a trend where it progressively increases
with depth due to the actions caused by temperature differentials and contracting beam. Although
the strains experienced by both FE1 and FE4 are seemingly similar along majority of the plates at
600oC as shown in Figure 5-7, the strain along FE4 becomes comparatively higher throughout the
plate as the subassembly cools further. Supplementary to the effects of the connection being less
ductile than FE1 due to its reduced bolt gauge and steel grade, the increased strain is also a result
of the endplate losing its load carrying capacity at the base which is then sustained by the higher
portions of the endplate for structural stability. This is highlighted in the peaks shown along the
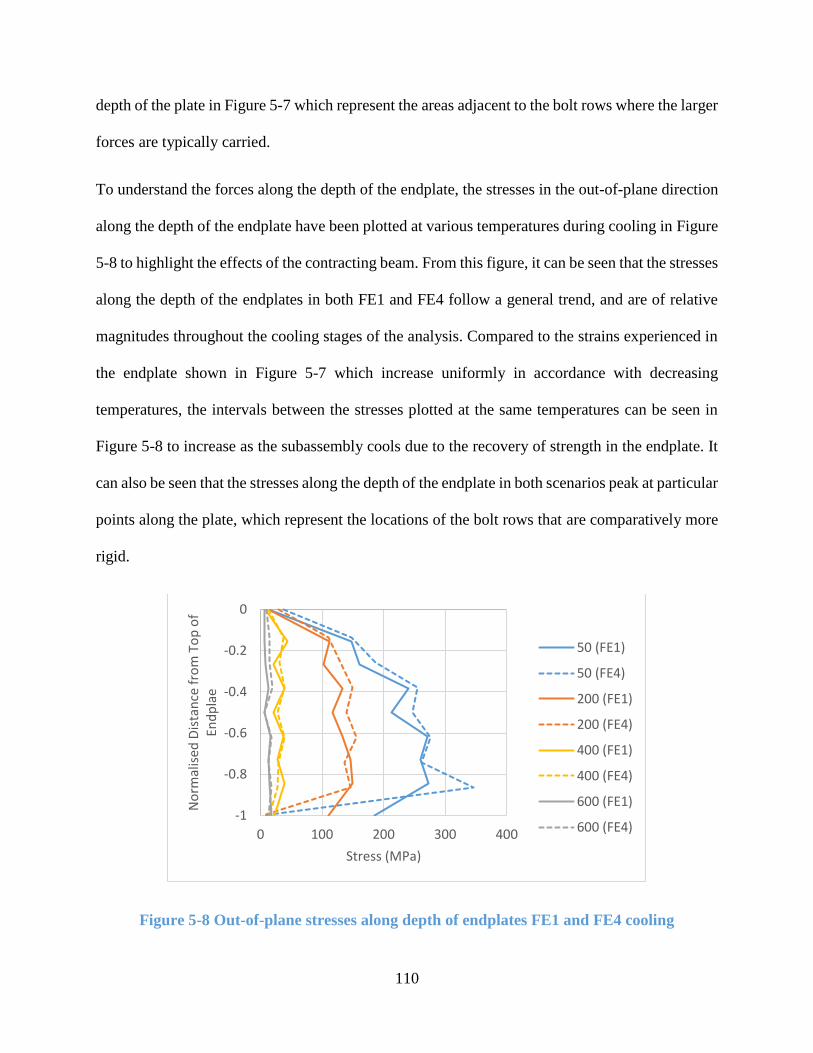
110
depth of the plate in Figure 5-7 which represent the areas adjacent to the bolt rows where the larger
forces are typically carried.
To understand the forces along the depth of the endplate, the stresses in the out-of-plane direction
along the depth of the endplate have been plotted at various temperatures during cooling in Figure
5-8 to highlight the effects of the contracting beam. From this figure, it can be seen that the stresses
along the depth of the endplates in both FE1 and FE4 follow a general trend, and are of relative
magnitudes throughout the cooling stages of the analysis. Compared to the strains experienced in
the endplate shown in Figure 5-7 which increase uniformly in accordance with decreasing
temperatures, the intervals between the stresses plotted at the same temperatures can be seen in
Figure 5-8 to increase as the subassembly cools due to the recovery of strength in the endplate. It
can also be seen that the stresses along the depth of the endplate in both scenarios peak at particular
points along the plate, which represent the locations of the bolt rows that are comparatively more
rigid.
Figure 5-8 Out-of-plane stresses along depth of endplates FE1 and FE4 cooling
-1
-0.8
-0.6
-0.4
-0.2
0
0 100 200 300 400
No
rmal
ised
Dis
tan
ce f
rom
To
p o
f En
dp
lae
Stress (MPa)
50 (FE1)
50 (FE4)
200 (FE1)
200 (FE4)
400 (FE1)
400 (FE4)
600 (FE1)
600 (FE4)
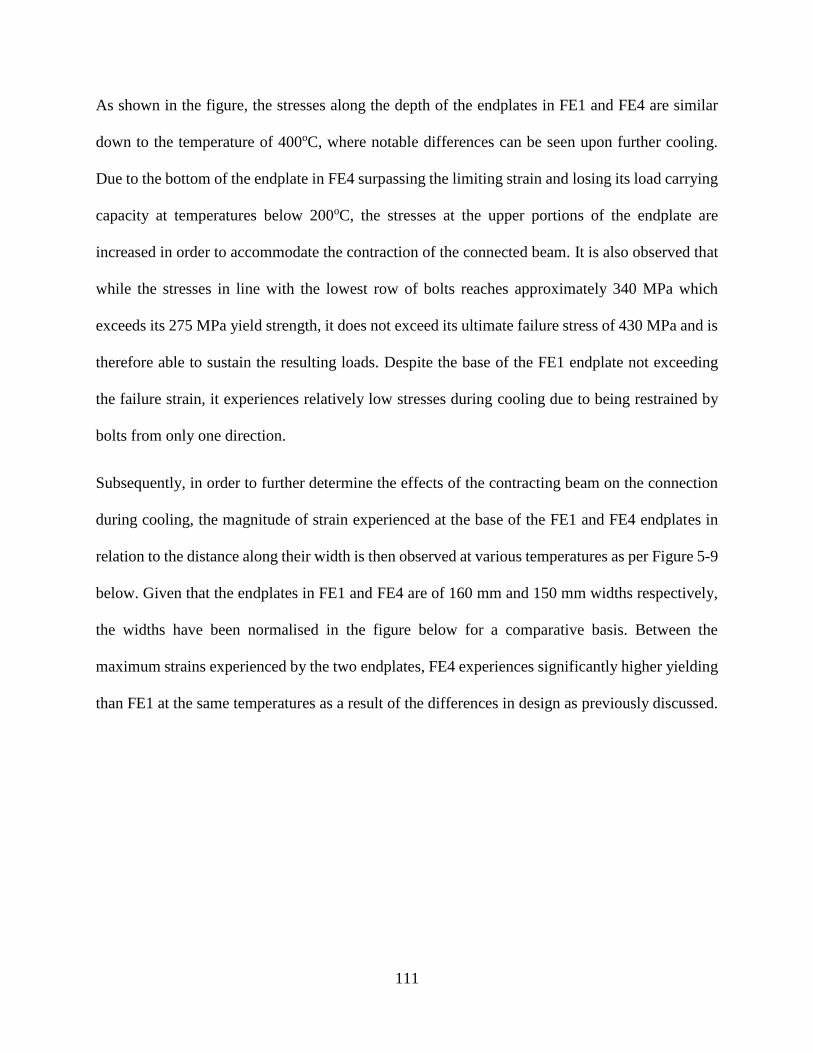
111
As shown in the figure, the stresses along the depth of the endplates in FE1 and FE4 are similar
down to the temperature of 400oC, where notable differences can be seen upon further cooling.
Due to the bottom of the endplate in FE4 surpassing the limiting strain and losing its load carrying
capacity at temperatures below 200oC, the stresses at the upper portions of the endplate are
increased in order to accommodate the contraction of the connected beam. It is also observed that
while the stresses in line with the lowest row of bolts reaches approximately 340 MPa which
exceeds its 275 MPa yield strength, it does not exceed its ultimate failure stress of 430 MPa and is
therefore able to sustain the resulting loads. Despite the base of the FE1 endplate not exceeding
the failure strain, it experiences relatively low stresses during cooling due to being restrained by
bolts from only one direction.
Subsequently, in order to further determine the effects of the contracting beam on the connection
during cooling, the magnitude of strain experienced at the base of the FE1 and FE4 endplates in
relation to the distance along their width is then observed at various temperatures as per Figure 5-9
below. Given that the endplates in FE1 and FE4 are of 160 mm and 150 mm widths respectively,
the widths have been normalised in the figure below for a comparative basis. Between the
maximum strains experienced by the two endplates, FE4 experiences significantly higher yielding
than FE1 at the same temperatures as a result of the differences in design as previously discussed.
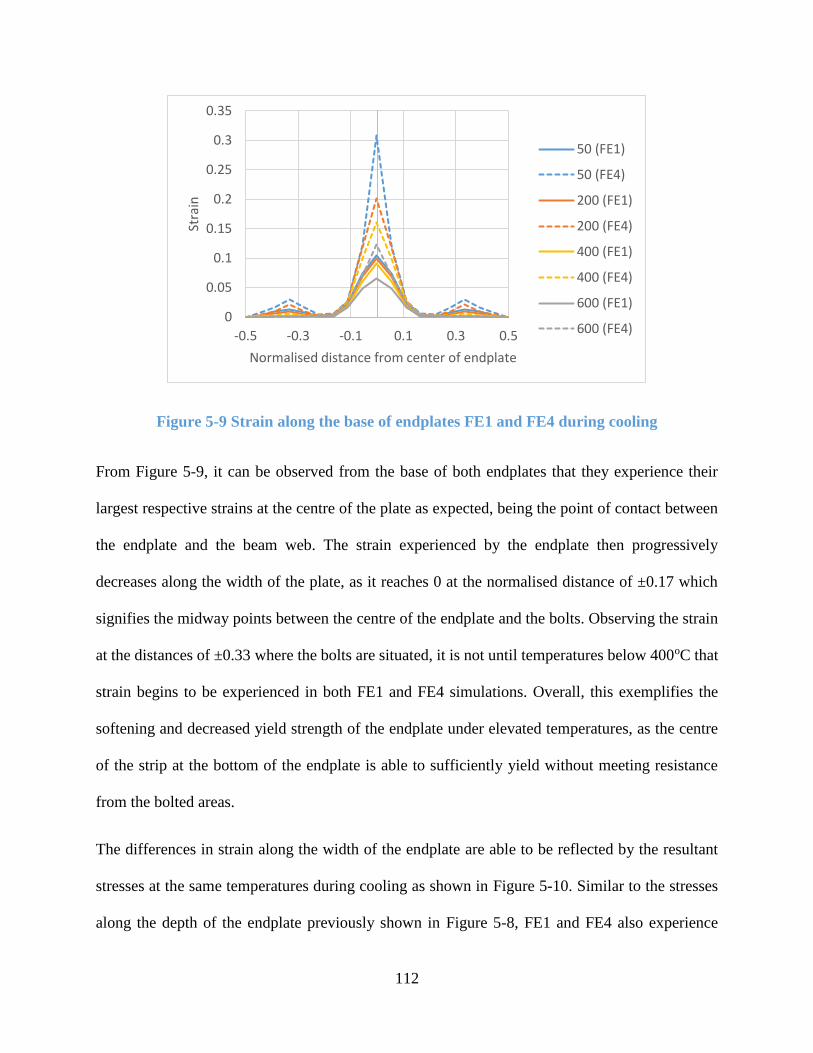
112
Figure 5-9 Strain along the base of endplates FE1 and FE4 during cooling
From Figure 5-9, it can be observed from the base of both endplates that they experience their
largest respective strains at the centre of the plate as expected, being the point of contact between
the endplate and the beam web. The strain experienced by the endplate then progressively
decreases along the width of the plate, as it reaches 0 at the normalised distance of ±0.17 which
signifies the midway points between the centre of the endplate and the bolts. Observing the strain
at the distances of ±0.33 where the bolts are situated, it is not until temperatures below 400oC that
strain begins to be experienced in both FE1 and FE4 simulations. Overall, this exemplifies the
softening and decreased yield strength of the endplate under elevated temperatures, as the centre
of the strip at the bottom of the endplate is able to sufficiently yield without meeting resistance
from the bolted areas.
The differences in strain along the width of the endplate are able to be reflected by the resultant
stresses at the same temperatures during cooling as shown in Figure 5-10. Similar to the stresses
along the depth of the endplate previously shown in Figure 5-8, FE1 and FE4 also experience
0
0.05
0.1
0.15
0.2
0.25
0.3
0.35
-0.5 -0.3 -0.1 0.1 0.3 0.5
Stra
in
Normalised distance from center of endplate
50 (FE1)
50 (FE4)
200 (FE1)
200 (FE4)
400 (FE1)
400 (FE4)
600 (FE1)
600 (FE4)
113
similar magnitudes of stress along the width of the endplate during the earlier stages of cooling at
temperatures of 600 oC and 400oC, after which the differences in stresses diverge between the two
simulations as a result of their disparity in the behaviour of the plates.
Figure 5-10 Stress along the base of endplates FE1 and FE4 during cooling
As per the stresses along the depth of the endplate shown previously, the stresses along the width
of the strip at the bottom of the endplates in Figure 5-10 also indicate a large separation between
the stresses at the temperatures of 400oC and 200oC as a result of the steel regaining its maximum
failure strength in accordance with Eurocode 3 and therefore induced higher stresses as it offers
increased resistance against further yielding, as reflected by the large increase in measured stresses
at the location of the bolts.
Regarding the stress along the width of the FE1 endplate, the stress at the centre point shows a dip
where it shows a slightly lower value in comparison to the peak stresses on either side as illustrated
in Figure 5-10. This occurs as a result of the method of which the beam web was connected to the
centre of the endplate using the “TIE” function in ABAQUS, causing the largest forces to occur
0
50
100
150
200
250
300
350
400
450
-0.5 -0.3 -0.1 0.1 0.3 0.5
Stre
ss (
MP
a)
Horizontal distance from center of endplate (mm)
50 (FE1)
50 (FE4)
200 (FE1)
200 (FE4)
400 (FE1)
400 (FE4)
600 (FE1)
600 (FE4)
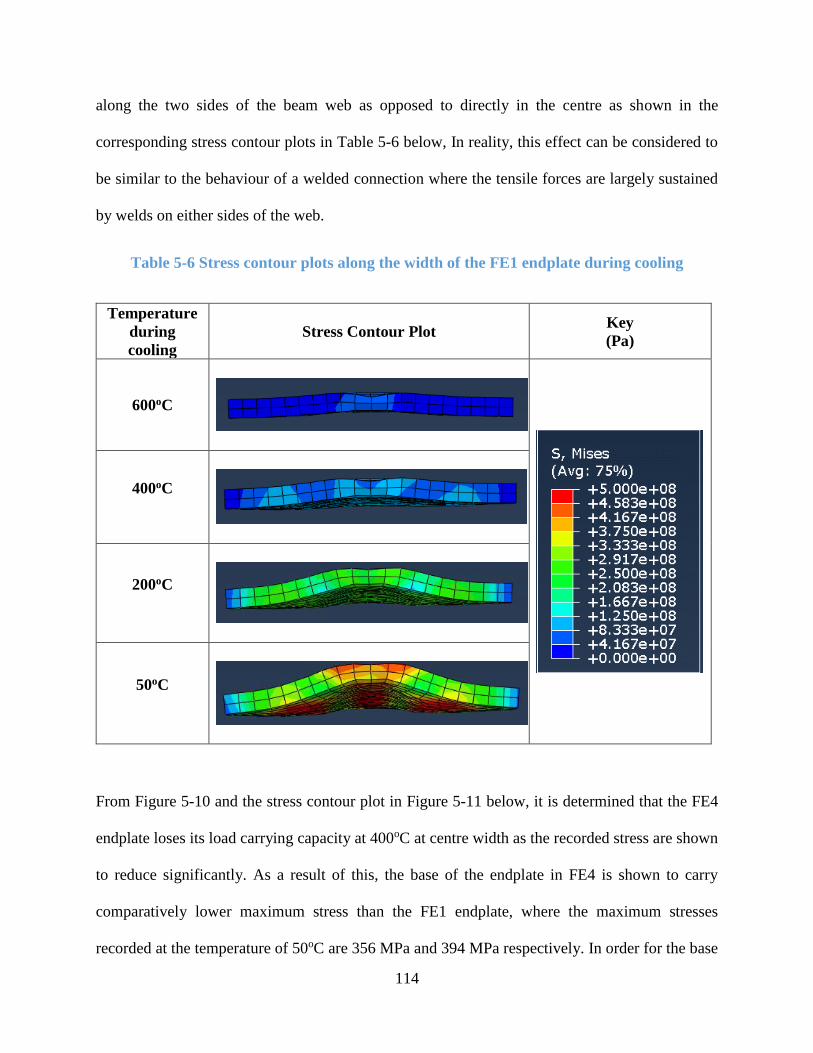
114
along the two sides of the beam web as opposed to directly in the centre as shown in the
corresponding stress contour plots in Table 5-6 below, In reality, this effect can be considered to
be similar to the behaviour of a welded connection where the tensile forces are largely sustained
by welds on either sides of the web.
Table 5-6 Stress contour plots along the width of the FE1 endplate during cooling
Temperature
during
cooling
Stress Contour Plot Key
(Pa)
600oC
400oC
200oC
50oC
From Figure 5-10 and the stress contour plot in Figure 5-11 below, it is determined that the FE4
endplate loses its load carrying capacity at 400oC at centre width as the recorded stress are shown
to reduce significantly. As a result of this, the base of the endplate in FE4 is shown to carry
comparatively lower maximum stress than the FE1 endplate, where the maximum stresses
recorded at the temperature of 50oC are 356 MPa and 394 MPa respectively. In order for the base
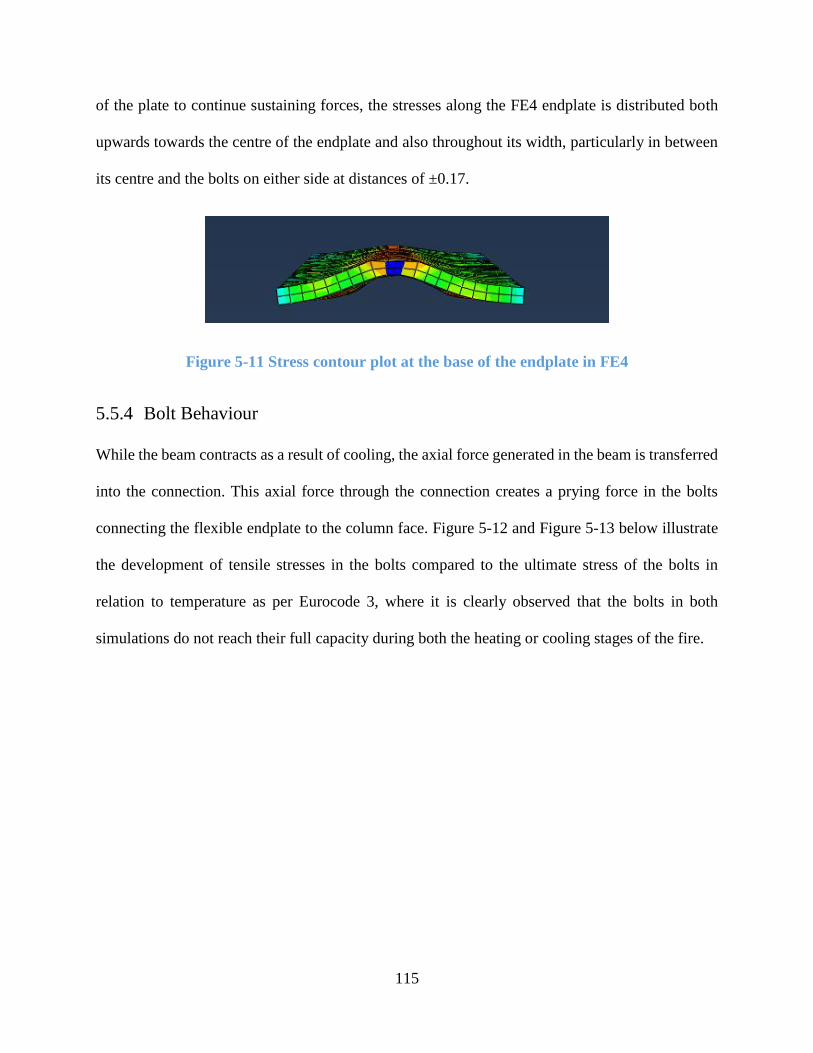
115
of the plate to continue sustaining forces, the stresses along the FE4 endplate is distributed both
upwards towards the centre of the endplate and also throughout its width, particularly in between
its centre and the bolts on either side at distances of ±0.17.
Figure 5-11 Stress contour plot at the base of the endplate in FE4
5.5.4 Bolt Behaviour
While the beam contracts as a result of cooling, the axial force generated in the beam is transferred
into the connection. This axial force through the connection creates a prying force in the bolts
connecting the flexible endplate to the column face. Figure 5-12 and Figure 5-13 below illustrate
the development of tensile stresses in the bolts compared to the ultimate stress of the bolts in
relation to temperature as per Eurocode 3, where it is clearly observed that the bolts in both
simulations do not reach their full capacity during both the heating or cooling stages of the fire.
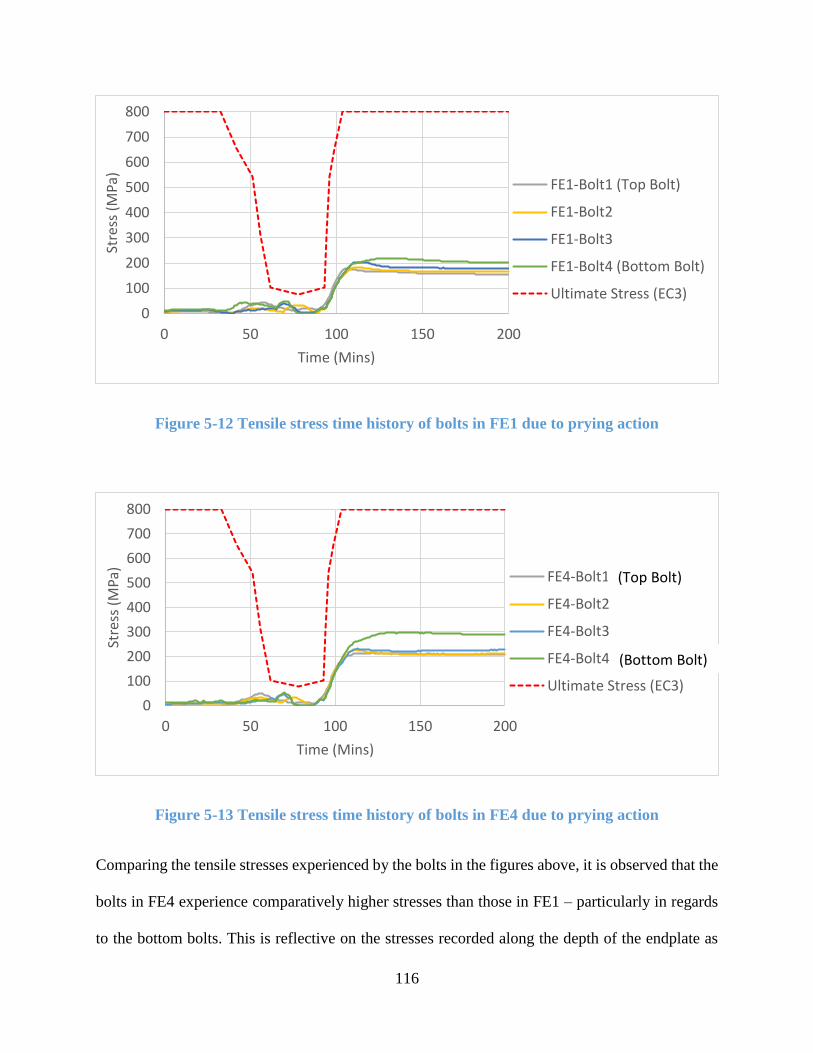
116
Figure 5-12 Tensile stress time history of bolts in FE1 due to prying action
Figure 5-13 Tensile stress time history of bolts in FE4 due to prying action
Comparing the tensile stresses experienced by the bolts in the figures above, it is observed that the
bolts in FE4 experience comparatively higher stresses than those in FE1 – particularly in regards
to the bottom bolts. This is reflective on the stresses recorded along the depth of the endplate as
0
100
200
300
400
500
600
700
800
0 50 100 150 200
Stre
ss (
MP
a)
Time (Mins)
FE1-Bolt1 (Top Bolt)
FE1-Bolt2
FE1-Bolt3
FE1-Bolt4 (Bottom Bolt)
Ultimate Stress (EC3)
0
100
200
300
400
500
600
700
800
0 50 100 150 200
Stre
ss (
MP
a)
Time (Mins)
FE4-Bolt1
FE4-Bolt2
FE4-Bolt3
FE4-Bolt4
Ultimate Stress (EC3)
(Top Bolt)
(Bottom Bolt)

117
previously shown in Figure 5-8, where the lack of ductility in FE4 leads to failure at the base of
the plate, consequently resulting in higher stresses throughout the depth of the endplate and at each
bolt.
Thus, from the analysis undertaken through this section of the study, it can be concluded that
although both flexible endplate connections designed as per the New Zealand and U.K. guidelines
performed similarly during the heating phase of a fire, the additional ductility provided by the New
Zealand design was advantageous as it allowed for comparatively less plastic yielding, particularly
in the cooling phase.
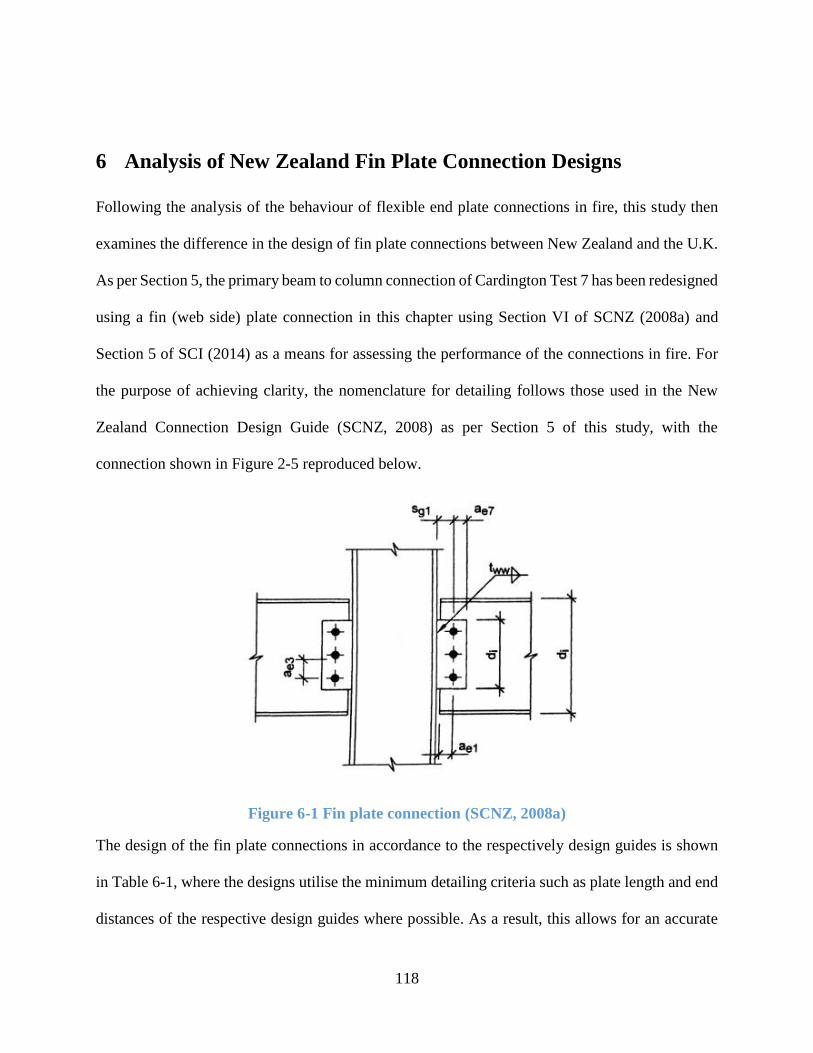
118
6 Analysis of New Zealand Fin Plate Connection Designs
Following the analysis of the behaviour of flexible end plate connections in fire, this study then
examines the difference in the design of fin plate connections between New Zealand and the U.K.
As per Section 5, the primary beam to column connection of Cardington Test 7 has been redesigned
using a fin (web side) plate connection in this chapter using Section VI of SCNZ (2008a) and
Section 5 of SCI (2014) as a means for assessing the performance of the connections in fire. For
the purpose of achieving clarity, the nomenclature for detailing follows those used in the New
Zealand Connection Design Guide (SCNZ, 2008) as per Section 5 of this study, with the
connection shown in Figure 2-5 reproduced below.
Figure 6-1 Fin plate connection (SCNZ, 2008a)
The design of the fin plate connections in accordance to the respectively design guides is shown
in Table 6-1, where the designs utilise the minimum detailing criteria such as plate length and end
distances of the respective design guides where possible. As a result, this allows for an accurate
119
representation of the minimum code requirements, in turn capturing the essence of the various
design philosophies between the regions.
With the design of the fin plate connections highlighted in Table 6-1 and comprehensive design
calculations shown in Appendix A, it is apparent that the differences in design between New
Zealand and U.K. are seemingly minor considering the similarities in the geometries of the fin
plate, size and number of bolts, and detailing requirements. Nonetheless considerable differences
are present based on the varying design philosophies highlighted in Chapter 2, where the New
Zealand design places a larger emphasis on the ductility of the connection. In this scenario for the
design of web side plate connections, the main differences in addition to those discussed previously
are as follows:
• SCI (2014) recommends the use of 10 mm thick fin plates for U.K. connections, whereas
8 mm thick fin plates are commonly used in New Zealand for similar applications.
• Following the respective design criteria and recommendations, the New Zealand
connection utilises a bolt spacing of 65 mm and edge spacing of 35 mm. On the other hand,
the U.K. design utilises a bolt spacing of 60 mm and edge spacing of 40 mm.
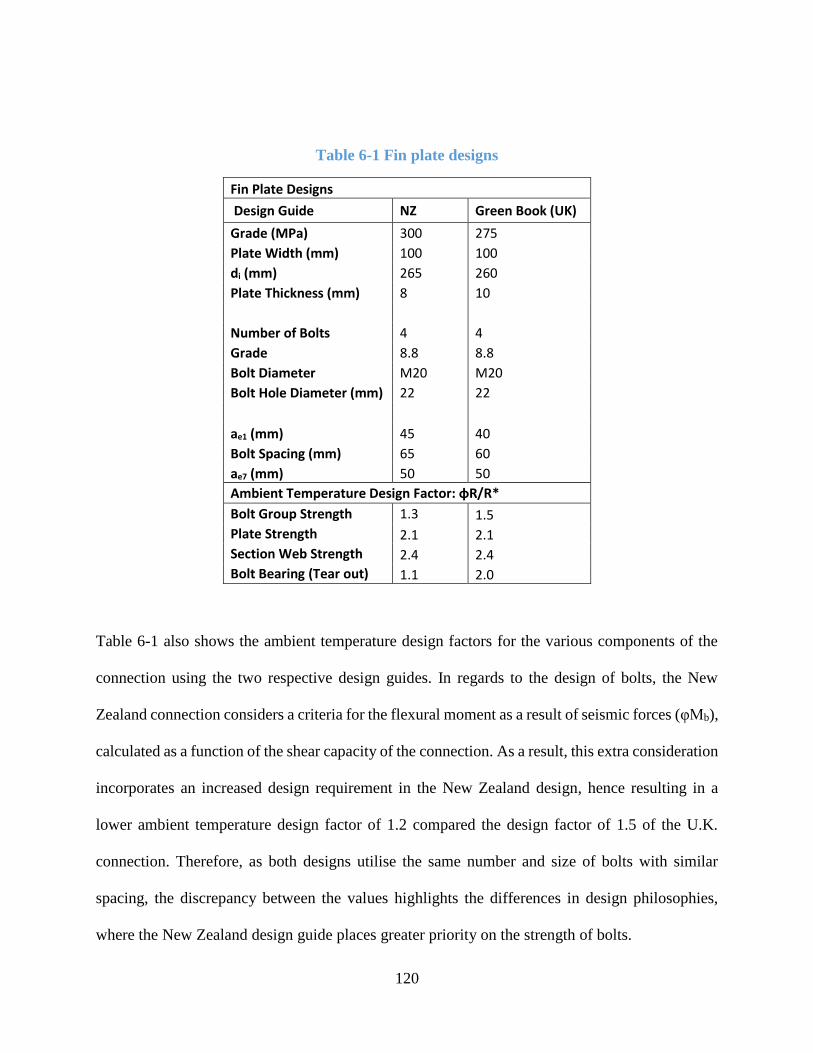
120
Table 6-1 Fin plate designs
Fin Plate Designs
Design Guide NZ Green Book (UK)
Grade (MPa) 300 275
Plate Width (mm) 100 100
di (mm) 265 260
Plate Thickness (mm) 8 10
Number of Bolts 4 4
Grade 8.8 8.8
Bolt Diameter M20 M20
Bolt Hole Diameter (mm) 22 22
ae1 (mm) 45 40
Bolt Spacing (mm) 65 60
ae7 (mm) 50 50
Ambient Temperature Design Factor: φR/R*
Bolt Group Strength 1.3 1.5
Plate Strength 2.1 2.1
Section Web Strength 2.4 2.4
Bolt Bearing (Tear out) 1.1 2.0
Table 6-1 also shows the ambient temperature design factors for the various components of the
connection using the two respective design guides. In regards to the design of bolts, the New
Zealand connection considers a criteria for the flexural moment as a result of seismic forces (φMb),
calculated as a function of the shear capacity of the connection. As a result, this extra consideration
incorporates an increased design requirement in the New Zealand design, hence resulting in a
lower ambient temperature design factor of 1.2 compared the design factor of 1.5 of the U.K.
connection. Therefore, as both designs utilise the same number and size of bolts with similar
spacing, the discrepancy between the values highlights the differences in design philosophies,
where the New Zealand design guide places greater priority on the strength of bolts.
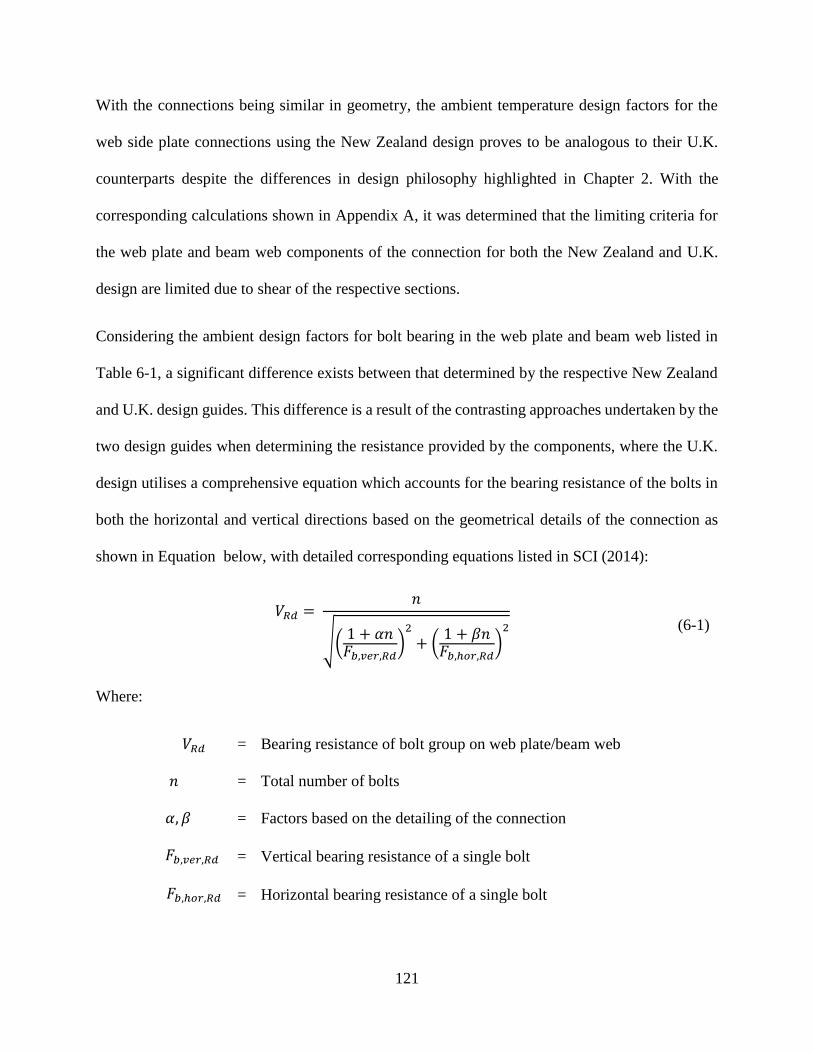
121
With the connections being similar in geometry, the ambient temperature design factors for the
web side plate connections using the New Zealand design proves to be analogous to their U.K.
counterparts despite the differences in design philosophy highlighted in Chapter 2. With the
corresponding calculations shown in Appendix A, it was determined that the limiting criteria for
the web plate and beam web components of the connection for both the New Zealand and U.K.
design are limited due to shear of the respective sections.
Considering the ambient design factors for bolt bearing in the web plate and beam web listed in
Table 6-1, a significant difference exists between that determined by the respective New Zealand
and U.K. design guides. This difference is a result of the contrasting approaches undertaken by the
two design guides when determining the resistance provided by the components, where the U.K.
design utilises a comprehensive equation which accounts for the bearing resistance of the bolts in
both the horizontal and vertical directions based on the geometrical details of the connection as
shown in Equation below, with detailed corresponding equations listed in SCI (2014):
𝑉𝑅𝑑 = 𝑛
√(1 + 𝛼𝑛
𝐹𝑏,𝑣𝑒𝑟,𝑅𝑑)
2
+ (1 + 𝛽𝑛
𝐹𝑏,ℎ𝑜𝑟,𝑅𝑑)
2
(6-1)
Where:
𝑉𝑅𝑑
=
Bearing resistance of bolt group on web plate/beam web
𝑛
=
Total number of bolts
𝛼, 𝛽
=
Factors based on the detailing of the connection
𝐹𝑏,𝑣𝑒𝑟,𝑅𝑑
=
Vertical bearing resistance of a single bolt
𝐹𝑏,ℎ𝑜𝑟,𝑅𝑑
=
Horizontal bearing resistance of a single bolt
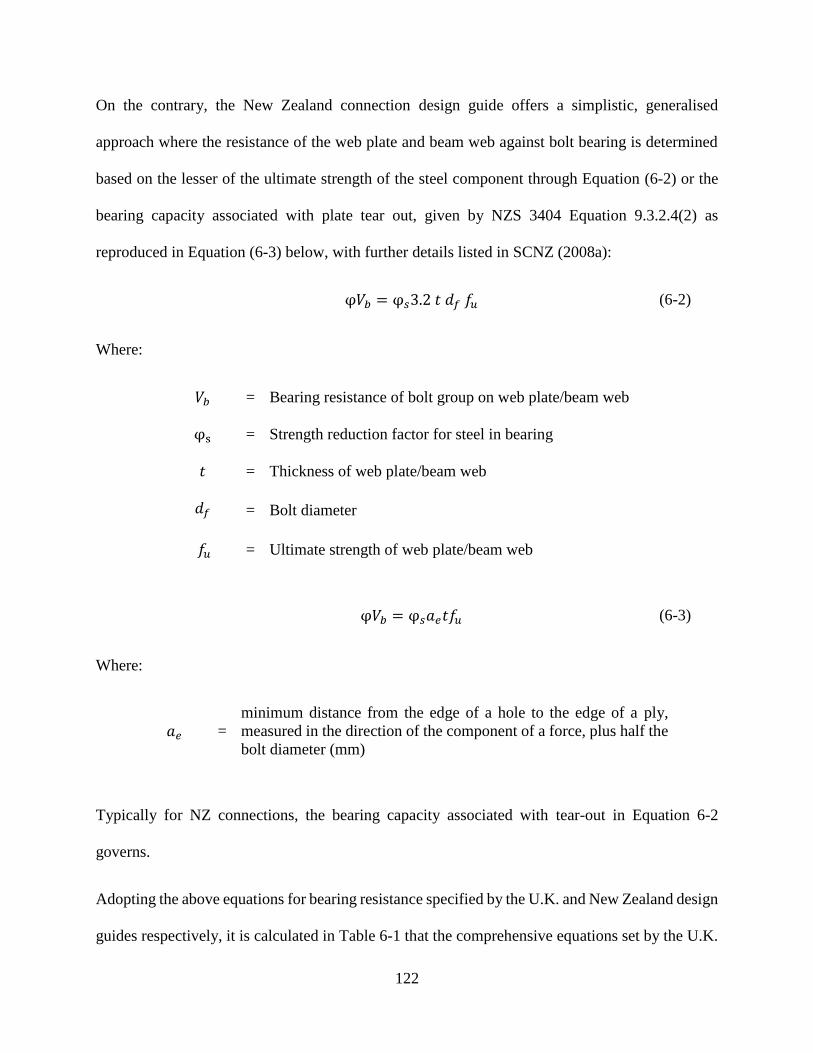
122
On the contrary, the New Zealand connection design guide offers a simplistic, generalised
approach where the resistance of the web plate and beam web against bolt bearing is determined
based on the lesser of the ultimate strength of the steel component through Equation (6-2) or the
bearing capacity associated with plate tear out, given by NZS 3404 Equation 9.3.2.4(2) as
reproduced in Equation (6-3) below, with further details listed in SCNZ (2008a):
φ𝑉𝑏 = φ𝑠3.2 𝑡 𝑑𝑓 𝑓𝑢
(6-2)
Where:
𝑉𝑏
=
Bearing resistance of bolt group on web plate/beam web
φs
=
Strength reduction factor for steel in bearing
𝑡
=
Thickness of web plate/beam web
𝑑𝑓
=
Bolt diameter
𝑓𝑢 = Ultimate strength of web plate/beam web
φ𝑉𝑏 = φ𝑠𝑎𝑒𝑡𝑓𝑢
(6-3)
Where:
𝑎𝑒 =
minimum distance from the edge of a hole to the edge of a ply,
measured in the direction of the component of a force, plus half the
bolt diameter (mm)
Typically for NZ connections, the bearing capacity associated with tear-out in Equation 6-2
governs.
Adopting the above equations for bearing resistance specified by the U.K. and New Zealand design
guides respectively, it is calculated in Table 6-1 that the comprehensive equations set by the U.K.
123
design guide provides ambient temperature design factors which are significantly less conservative
than those calculated using equations from the New Zealand design guide despite both connections
incorporating similar beam and web plate dimensions. Subsequently, this further highlights the
differences in connection design philosophies between the regions discussed in Chapter 2.4, as the
relatively high design factors calculated using the New Zealand equations allow for the connection
to experience higher stresses in bearing against the web plate and beam web – a desirable failure
mode due to its ductile behaviour.
As a result, the comparison between the ambient temperature design factors for the connections
designed in accordance with their respective design guides highlights the difference in philosophy
outlined in Chapter 2, where it is demonstrated that the New Zealand connection design places a
larger emphasis on the ductility of the connection by allowing for an increased capacity for bolt
hole deformation through bearing and limiting brittle failure through bolts, opposed to the U.K.
design which aims to allow deformation through the bolts as indicated by SCI (2014).
Notwithstanding the differences in design philosophies between the New Zealand and U.K. web
plate connections, the connections detailed in accordance with their respective design guides in
Table 6-1 indicate that the geometrical differences between the two connections are limited, with
the largest notable difference being the variation in thickness and grade of the web plate. Based on
the understanding of web plate connections as modelled in Chapter 3.1 and results previously
determined in the flexible endplate simulations in Chapter 5, it is expected that the two web plate
connections outlined in Table 6-1 would exhibit very similar behaviours when subject to the same
loads in fire, with the New Zealand design likely to exhibit a marginal increase in ductility due to
its use of a thinner web plate of higher grade. Therefore, due to the limited differences between
the detailing of the New Zealand and U.K. web plate connections, this scenario has not been

124
examined in further detail in this study but is considered a high priority topic for further study,
especially given the widespread use of this type of connection in New Zealand.
125
7 Conclusions and Recommendations
It has been established that maintaining the structural integrity of steel connections during and
after fire scenarios is paramount for the overall survivability of a building as evidenced by past
incidents. As a result, this study was undertaken with the main objective of examining the
behaviour of New Zealand steel connections in fire. New Zealand steel connections were shown
to differ from their European counterparts based on differences in design philosophies between the
regions, leading to the local requirements including considerations for design against earthquake
loads.
In particular, this study focused on the simple steel connections – flexible endplates and web side
plates, in which the finite element modelling software, ABAQUS, was used to model their
behaviour. This study first analysed and modelled the behaviour of connections undertaken in
previous experimental studies, in particular, an isolated web side plate connection and
subsequently a flexible endplate connection from a Cardington test. The connection in the
Cardington test was then redesigned using current procedures from New Zealand and the U.K. and
analysed in order to determine their relative behaviours in fire conditions.
7.1 Conclusions
From the set of analytical studies reported herein, the main findings can be summarised as follows:
• Experimental tests involving isolated connections at steady state temperatures do not
provide a realistic representation of the behaviours of the same connections in real
structures under fire scenarios, as isolated connections do not account for the large axial
forces resulting from the thermal elongation and contraction of a full length beam with end
restraints. Additionally, the material properties of steel at steady state temperatures vary
126
significantly to those at transient temperatures as a result of the large influence by the
applied strain rate.
• The flexible endplate connection of Cardington Test 7 first experienced failure at the base
of the endplate during the cooling phase, which then propagated upwards along its centre
upon further cooling of the overall assembly. The endplate is expected to have failed along
its depth at the time of approximately 94 minutes after the commencement of the
experiment.
• The contrasting design philosophies and preferred failure mechanisms in connections
between New Zealand and the U.K. leads to differences in calculated tolerances of various
failure modes and subsequently, the detailing of the connections.
• Flexible endplate connections designed to the current New Zealand and U.K.
recommendations were demonstrated to largely be able to maintain structural integrity
when exposed to the Cardington Test conditions. However, increased ductility of the New
Zealand design allowed it to perform better by remaining completely within its plastic limit
throughout the analysis compared to the U.K. connection which surpassed its limiting
plastic strain at the base of the endplate.
• The differences in ductility between the New Zealand and U.K. flexible endplate
connections are based on a combination of factors including: grade of steel, thickness and
length of the endplate, and bolt spacing.
• The geometrical differences between the web side plate connections designed in
accordance with the New Zealand and U.K. design recommendations were determined to
be relatively minimal, despite differences in allowable failure mechanisms, however the
New Zealand connections are designed and detailed to allow dependable bolt hole

127
elongation under high rotational demands at ambient temperature which may improve their
fire resistance. Detailed FEM of these connections has been beyond the scope of this study
but is recommended as a future research priority. .
7.2 Recommendations for Further Research
The following areas are recommended for furthering research on the behavior of connections in
fire conditions:
• Given that this work was limited to studying the behaviour of connections in the
Cardington test conditions, further work should implement varying structural assemblies
to determine their influence on the overall behaviour of connections.
• Model a wider library of connections to compare the advantages and disadvantages of
various designs, with a priority focus on the WP connections.
• Larger portions of the structural frame should be studied in order to consider the effects of
mechanisms such as tensile membrane action and column shortening
• The findings on the behaviour of New Zealand steel connections in fire should be validated
by experimental testing in future studies
• To facilitate the use of this information in the industry, the development of component
based models which represent the behaviour of New Zealand connections in fire should be
investigated
• Undertake finite element modelling with increased details of the subassembly, including
the influence of a full-length column and reinforcement within the concrete slab
128
8 References
ABAQUS. (2014a). Getting Started with ABAQUS, Hibbitt, Karlsson and Sorensen, Inc.
ABAQUS. (2014b). Standard user's manual. Hibbitt, Karlsson and Sorensen, Inc.
ABAQUS. (2014c). Theory Guide. Hibbitt, Karlsson and Sorensen, Inc.
Al-Jabri, K. S. (1999). The Behaviour of Steel and Composite Beam-To-Column Connections In
Fire, PhD. Thesis, Department of Civil and Structural Engineering, University of
Sheffield.
Al-Jabri, K. S., Davison, J. B., & Burgess, I. W. (2007). Performance of beam-to-column joints
in fire—A review. Fire Safety Journal, 43(1), 50-62. doi:
http://dx.doi.org/10.1016/j.firesaf.2007.01.002
Bednář, J., Wald, F., Vodička, J., & Kohoutková, A. (2012). Membrane Action of Composite
Fibre Concrete Slab in Fire. Procedia Engineering, 40(Supplement C), 498-503. doi:
https://doi.org/10.1016/j.proeng.2012.07.132
Block, F. M. (2006). Development of a Component-based Connection Element for Steel beam-
to-Column Connections at Elevated Temperatures. PhD Thesis. University of Sheffield.
Booth, E., Lane, J., Ko, R., & MacKenzie, D. (1998). Overview of Earthquake Design and
Development of UK NA for EN 1998-2 and PD 6698 Bridge Design to Eurocodes (pp.
183-191).
Borges, L. (2003). Structural Integrity Fire Test in Cardington - BRE Hanger II. Retrieved from
http://www.dec.uc.pt/~lborges/cardington/
BRE. (2004). Client Report: Results and observations from full-scale fire test at BRE
Cardington, 16 January 2003
129
British Standards Institution. (2003). Structural use of steelwork in building: code of practice for
fire resistant design. London: British Standards Institution.
British Steel. (1982). The performance of beam/column/beam connections in the BS476: Art 8
fire test
Buchanan, A. H., & Abu, A. K. (2017). Structural Design for Fire Safety (2nd ed.): Wiley.
Bursi, O. S., & Jaspart, J. P. (1998). Basic issues in the finite element simulation of extended end
plate connections. Computers & Structures, 69(3), 361-382. doi:
http://dx.doi.org/10.1016/S0045-7949(98)00136-9
Butterworth, J. W. (1995). Inelastic Rotational Capacity of Grade 300 and Grade 350 Columns,
School of Engineering Report Number 554. Department of Civil and Resource
Engineering, University of Auckland, New Zealand.
Centre Technique Industriel de la Construction Métallique. (1982). Methode de Prevision par le
Calcul du Comportement au Feu des Structures en Acier. Construction Metallique, 19(3),
39-79.
Charlier, R., & Habraken, A. M. (1990). Numerical metallisation of contact phenomena by finite
element method. Comput. Geotech, 9, 59-72.
Clifton, G. C. (1994). New Zealand Structural Steelwork Limit State Design Guides
Clifton, G. C. (1995). Lessons to be Learned for New Zealand Structural Steel Design and
Detailing Practice from the 1994 Northridge Earthquake; Proceedings of the NZNSEE
Conference, Rotorua, New Zealand. New Zealand National Society for Earthquake
Engineering.
Dai, X. H., Wang, Y. C., & Bailey, C. G. (2010). Numerical modelling of structural fire
behaviour of restrained steel beam–column assemblies using typical joint types.
130
Engineering Structures, 32(8), 2337-2351. doi:
http://dx.doi.org/10.1016/j.engstruct.2010.04.009
Dowling, J. (1997). Fire Protection Using Off-Site Applied Intumescent Coatings. Proc. Intn Civ.
Engrs Structs & Bldgs, 112, 237 - 238.
El-Rimawi, J. A. (1989). The Behaviour of Flexural Members under Fire Conditions, PhD.
Thesis, Department of Civil and Structural Engineering, University of Sheffield.
European Committee for Standardization. (2002). Eurocode 1: Actions on structures, Part 1.2:
General actions - Actions on structures exposed to fire. U.K.: British Standards
Institution.
European Committee for Standardization. (2004a). Eurocode 2: Design of concrete structures,
Part 1.2:, General rules- structural fire design. U.K.: British Standards Institution.
European Committee for Standardization. (2004b). Eurocode 3: Design of steel structures, Part
1.8:, Design of Joints. U.K.: British Standards Institution.
European Committee for Standardization. (2005a). Eurocode 3: Design of steel structures, Part
1.2:, General rules- structural fire design. U.K.: British Standards Institution.
European Committee for Standardization. (2005b). Eurocode 4: Design of composite steel and
concrete structures, Part 1.2:, General rules- structural fire design. U.K.: British
Standards Institution.
European Committee for Standardization. (2006). Eurocode 1 - Actions of structures, Part 1.7:,
General rules- Accidental actions. U.K.: British Standards Institution.
Feeney, M. J., & Clifton, G. C. (1995). Seismic Design Procedures for Steel Structures
FEMA. (2002). World Trade Center Building Performance Study: Data Collection, Prelimnary
Observations, and REcommendations
131
Franssen, J. M. (2005). A Thermal/Structural Program Modelling Structures under Fire.
Engineering Journal, A.I.S.C., 42(3), 143-158.
Gillie, M., Usmani, A., Rotter, M., & O'Connor, M. (2001). Modelling of heated composite floor
slabs with reference to the Cardington experiments. Fire Safety Journal, 36(8), 745-767.
Gillie, M., Usmani, A. S., & Rotter, J. M. (2001). A structural analysis of the first Cardington
test. Journal of Constructional Steel Research, 57(6), 581-601. doi:
http://dx.doi.org/10.1016/S0143-974X(01)00004-9
Hu, Y. (2009). Robustness of flexible endplate connections under fire conditions. University of
Sheffield, Sheffield, U.K.
Hu, Y., Burgess, I. W., Davison, B., & Plank, R. (2008). Modelling of flexible end plate
connections in fire using cohesive elements. Fifth International Workshop, Structures in
Fire.
Huang, Z., Burgess, I. W., & Plank, R. J. (1999). Nonlinear analysis of reinforced concrete slabs
subjected to fire. ACI Structural journal, 96(1), 127-135.
Huang, Z., Burgess, I. W., & Plank, R. J. (2004). Fire Resistance of Composite Floors Subject to
Compartment Fires. J. Construct. Steel Research, 60(2), 339-360.
Hyland, C. (2003). Flexible End Plate & Angle Cleat Connections. Steel Structures Seminar
2003.
Ingham, J. M., & Griffith, M. C. (2011). The Performance of Unreinforced Masonry Buildings in
the 2010/201 Canterbury Earthquake Swarm
ISO. (1975). Fire Resistance Tests – Elements of Building Construction ISO 834: International
Organisation for Standardisation.
132
IStructE. (2002). Safety in tall buildings and other buildings with large occupancy. The
Institution of Structural Engineers, London, United Kingdom.
Kirby, B. R. (1995). The behaviour of high-strength grade 8.8 bolts in fire . J. Construct. Steel
Research, 3(38).
Kirby, B. R., & Preston, R. R. (1988). High temperature properties of hot-rolled structural steels
for use in fire engineering desgin studies. Fire Safety Hournal, 13, 27-37.
Krishnamurthy, N., & Graddy, D. E. (1976). Correlation between 2- and 3-Dimensional Finite
Element Analysis of Steel Bolted End-Plate Connections. Computers and Structures, 6,
381-389.
Kruppa, J. (1976). Resistance en feu des assemblages par boulons haute resistance
Kukreti, A. R., Murray, T. M., & Abolmaali, A. (1987a). End plate connection moment-rotation
relationship. Journal of Constructional Steel Research, 8, 137-157.
Kukreti, A. R., Murray, T. M., & Abolmaali, A. (1987b). End-plate connection moment-rotation
relationship. Journal of Constructional Steel Research, 8, 137-157. doi:
http://dx.doi.org/10.1016/0143-974X(87)90057-5
LaMalva, K. J. (2007). Failure Analysis of The World Trade Center 5 Building, Masters Thesis.
Worcester Polytechnic Institute.
Lawson, R. M. (1990). Behaviour of steel-beam-to-column connections in fire. The Structural
Engineer, 68(14), 263-271.
Lennon, T., & Moore, D. (2004). Client Report: Results and Observations from Full-Scale Fire
Test at BRE Cardington, Client report number 215-741.
Lim, L., & Feeney, M. (2015). The application of advanced finite element analysis for structural
fire design.
133
Lin, S. (2014). Development of Robust Connection Models For Steel and Composite Structures
in Fire. PhD. Thesis, Department of Mechanical, Aerospace and Civil Engineering,
Brunel University.
Liu, T. C. H. (1996). Finite element modelling of behaviours of steel beams and connections in
fire. Journal of Constructional Steel Research, 36(3), 181-199. doi:
http://dx.doi.org/10.1016/0143-974X(95)00016-O
Liu, T. C. H., Fahad, M. K., & Davies, J. M. (2002). Experimental investigation of behaviour of
axially restrained steel beams in fire. Journal of Constructional Steel Research, 58(9),
1211-1230. doi: https://doi.org/10.1016/S0143-974X(01)00062-1
Mago, N., Hicks, S., & Simms, W. I. (2014). Sequentially coupled thermal-stress analysis of a
new steelconcrete composite slab under fire. 2014 SIMULIA Customer Conference
Proceedings.
MBIE. (2016). Acceptable Solutions and Verification Methods For New Zealand Building Code
Cluase B1 Structure
Moss, P. J., & Charles Clifton, G. (2004). Modelling of the Cardington LBTF steel frame
building fire tests. Fire and Materials, 28(2-4), 177-198. doi: 10.1002/fam.868
Murray, C. M., & Butterworth, J. W. (1990). Inelastic Rotational Capacity of Ductile Web Side
Plate Connections, Hera Project 88/R6. University of Auckland, New Zealand.
New Zealand Standards Institute. (1935). NZS No. 95:1935, Model building By-Law, New
Zealand Standards Institute, Wellington, New Zealand.
New Zealand Standards Institute. (1976). NZS 4203: Code of Practice for General Structural
Design and Design loadings for buildings,, New Zealand Standards Institute, Wellington,
New Zealand.
134
New Zealand Standards Institute. (1989). NZS 3404: Steel Structures Standard. New Zealand
Standards Institute, Wellington, New Zealand.
New Zealand Standards Institute. (1997). NZS 3404: Steel Structures Standard. New Zealand
Standards Institute, Wellington, New Zealand.
New Zealand Standards Institute. (2017). AS/NZS 2327:2016. Composite Structures -
Composite steel-concrete construction in buildings. New Zealand Standards Institute,
Wellington, New Zealand.
NIST. (2008). Final Report on the Collapse of World Trade Center Building 7
Priestley, M. J. N. (1993). Myths and Fallacies in Earthquake Engineering - Conflicts between
Design and Reality. Bulletin of the New Zealand National Society for Earthquake
Engineering, 26(3).
Proe, D. J., Bennetts, I. D., & Thomas, I. R. (1986). Simulation of the Fire Testing Structural
Steel Elements by Calculation-Mechanical Response. Steel Construction, 19(4), 2-18.
Renner, A. (2005). The effect of strain-rate on the elevated-temeprature behaviour of structural
steel. Research Dissertation. University of Sheffield.
Robinson, J. (1998). Fire - A Technical Challenge and A Market Opportunity. J. Construct. Steel
Res, 46(1-3).
Robinson, T. R. (2014). Assessment of coseismic landsliding from an Alpine fault earthquake
scenario, New Zealand. Doctoral Thesis, University of Canterbury.
Sabol, T. A., & Engelhardt, M. D. (1994). Steel Moment-Resisting Frame Connection Details
and Geometry - A Discussion of Fundamental Issues. Proceedings of the Invitational
Workshop on Steel Seismic Issues SAC 94-01, Los Angeles, California. Paper presented
135
at the Proceedings of the Invitational Workshop on Steel Seismic Issues SAC 94-01, Los
Angeles, California.
Sarraj, M., Burgess, I. W., Davison, J. B., & Plank, R. J. (2007). Finite element modelling of
steel fin plate connections in fire. Fire Safety Journal, 42(6–7), 408-415. doi:
http://dx.doi.org/10.1016/j.firesaf.2007.01.007
Sarraj, M. (2007). The behaviour of steel fin plate connections in fire, PhD. Thesis, Department
of Civil and Structural Engineering, University of Sheffield.
SCI. (1991). Investigation of Broadgate Phase 8 Fire
SCI. (2013). Joints in Steel Construction: Moment-Resisting Joints to Eurocode 3
SCI. (2014). Joints in Steel Construction: Simple Joints to Eurocode 3
SCNZ. (2008a). SCNZ 14.1: 2007 Structural Steelwork Connections Guide: Design Procedures
SCNZ. (2008b). SCNZ 14.2: 2007 Structural Steelwork Connections Guide: Connection Tables
Selamet, S., & Bolukbas, C. (2016). Fire resilience of shear connections in a composite floor:
Numerical investigation. Fire Safety Journal, 81, 97-108. doi:
http://dx.doi.org/10.1016/j.firesaf.2016.02.003
Selamet, S., & Garlock, M. E. (2014). Fire resistance of steel shear connections. Fire Safety
Journal, 68, 52-60. doi: http://dx.doi.org/10.1016/j.firesaf.2014.05.016
Shepherd, P. G., & Burgess, I. W. (2011). On the buckling of axially restrained steel columns in
fire. Engineering Structures, 33(10), 2832-2838. doi:
https://doi.org/10.1016/j.engstruct.2011.06.007
Simṏes da Silva, L., & Santiago, A. (2005). Behaviour of steel joints under fire loading. Steel
and Composite Structures, 5(6), 485-513.
136
Starossek, U. (2007). Typology of progressive collapse. Engineering Structures, 29(9), 2302-
2207.
Steel Construction Institute. (1991). Investigation of Broadgate Phase 8 Fire. Structural Fire
Engineering.
Sulong, N. H. R. (2005). Behaviour of Steel Connections Under Fire Conditions. Impreial
College London.
Vegte, G. J. v. d. (2004). Numerical simulations of bolted connection: The implicit versus the
explicit approach. Paper presented at the Connections in Steel Structures V, Amsterdam.
Wald, F., Simões da Silva, L., Moore, D., Lennon, T., Chladná, M., Santiago, A., Beneš, M., &
Borges, L. (2005). Experimental behaviour of steel structure under natural fire. New Steel
Construction, 13(3), 24-27.
Wang. Y., (2002). Steel and Composite Structures - Behaviour and Design for Fire Safety.
London: Spon Press.
Wang, Y., Burgess, I., Wald, F., & Gillie, M. (2013). Performance-Based Fire Engineering of
Structures. Boca Raton, Florida, U.S.A.: CRC Press.
Wang, Y., Burgess, I. W., Wald, F., & Gillie, M. (2012). Steel and composite joints
Performance-Based Fire Engineering of Structures (pp. 233-276): CRC Press.
Wang, Y., Davison, J. B., Plank, R. J., Yu, H. X. D., X.H., , & Bailey, C. G. (2010). The safety
of comon steel beam/column connectoins in fire. The Structural Engineer, 88(21).
Wang, Y. C., Dai, X. H., & Bailey, C. G. (2011). An experimental study of relative structural fire
behaviour and robustness of different types of steel joint in restrained steel frames.
Journal of Constructional Steel Research, 67(7), 1149-1163. doi:
https://doi.org/10.1016/j.jcsr.2011.02.008
137
Welch, S., Jowsey, A., Deeny, S., Morgan, R., & Torero, J. L. (2007). BRE large compartment
fire tests—Characterising post-flashover fires for model validation. Fire Safety Journal,
42(8), 548-567. doi: https://doi.org/10.1016/j.firesaf.2007.04.002
Yu, H.,, Burgess, I. W., Davison, J. B., & Plank, R. J. (2009a). Experimental investigation of the
behaviour of fin plate connections in fire. Journal of Constructional Steel Research,
65(3), 723-736. doi: http://dx.doi.org/10.1016/j.jcsr.2008.02.015
Yu, H., Burgess, I. W., Davison, J. B., & Plank, R. J. (2009b). Tying capacity of web cleat
connections in fire, Part 1: Test and finite element simulation. Engineering Structures,
31(3), 651-663. doi: http://dx.doi.org/10.1016/j.engstruct.2008.11.005
Yu, H., Burgess, I. W., Davison, J. B., & Plank, R. J. (2008). Numerical simulation of bolted
steel connections in fire using explicit dynamic analysis. Journal of Constructional Steel
Research, 64(5), 515-525. doi: http://dx.doi.org/10.1016/j.jcsr.2007.10.009
Yu, H., Burgess, I. W., Davison, J. B., & Plank, R. J. (2011). Experimental and Numerical
Investigations of the Behavior of Flush End Plate Connections at Elevated Temperatures.
Journal of Structural Engineering, 137(1), 80-87. doi: doi:10.1061/(ASCE)ST.1943-
541X.0000277
Yu, H., Burgress, I. W., Davison, J. B., & R.J., P. (2008). Experimental investigation of the
behaviour of flush endplate connections in fire. Paper presented at the Structures in Fire,
2008.

138
Appendix A – Flexible Endplate Calculations
FE1 – New Zealand Design (SCNZ, 2008a)
Design Forces: V* = 147 kN [0.3 x Shear Capacity of Connecting Beam (NZS3404)
Bolt Group Strength Limits φR/R*
φVb = 740.8 Transverse shear OK 5.0
Flexible End Plate Design Strength
Limits
φVbi = 1622.016 Bolt hole tranverse bearing OK 11.0
φVtti = 1013.76 Bolt Hold transverse tearing OK 6.9
φVgsi = 599.04 Gross shear yield OK 4.1
φVbsi (max) 728.64 Block shear of endplate OK 5.0
681.8688 4.6
Section Design Strength
Limits
φVwc = 420.146494
Web shear/Tension at top of
cleat OK 2.9
φVbsw (min) 404.1576 Block Shear in Web OK 2.7
450.34704 3.1
φVgsw = 490.50036 Gross shear yield at top notch OK 3.3
Support Design Strength
Limits
φVbsup = 1612.43136 bolt hole 1st bearing OK 11.0
φVtsup = 1234.51776 bolt hole 1st tearing OK 8.4
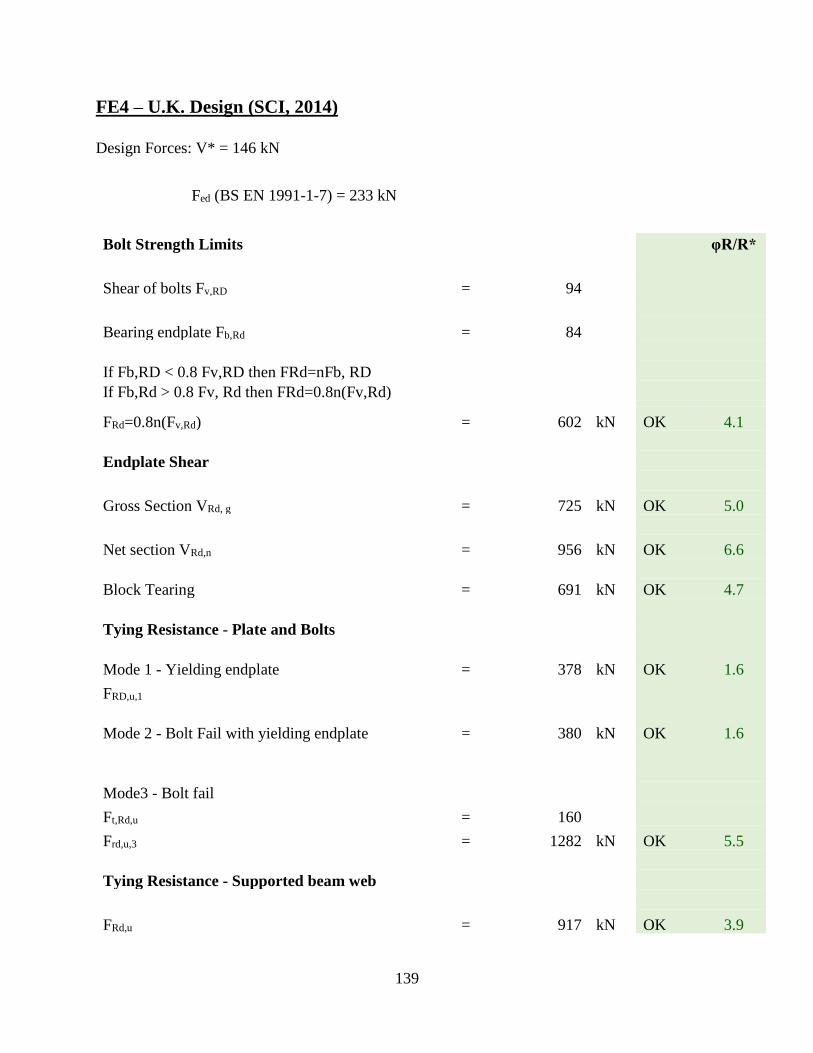
139
FE4 – U.K. Design (SCI, 2014)
Design Forces: V* = 146 kN
Fed (BS EN 1991-1-7) = 233 kN
Bolt Strength Limits φR/R*
Shear of bolts Fv,RD = 94
Bearing endplate Fb,Rd = 84
If Fb,RD < 0.8 Fv,RD then FRd=nFb, RD If Fb,Rd > 0.8 Fv, Rd then FRd=0.8n(Fv,Rd)
FRd=0.8n(Fv,Rd) = 602 kN OK 4.1
Endplate Shear
Gross Section VRd, g = 725 kN OK 5.0
Net section VRd,n = 956 kN OK 6.6
Block Tearing = 691 kN OK 4.7
Tying Resistance - Plate and Bolts
Mode 1 - Yielding endplate = 378 kN OK 1.6
FRD,u,1
Mode 2 - Bolt Fail with yielding endplate = 380 kN OK 1.6
Mode3 - Bolt fail
Ft,Rd,u = 160
Frd,u,3 = 1282 kN OK 5.5
Tying Resistance - Supported beam web
FRd,u = 917 kN OK 3.9
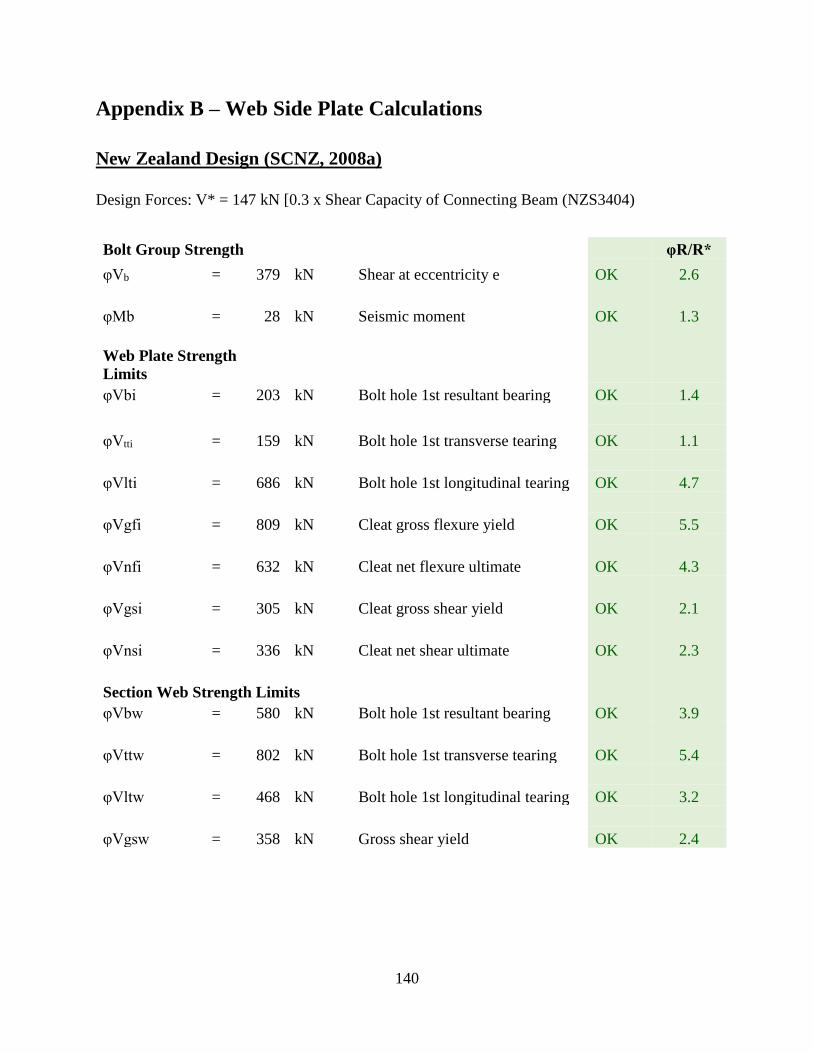
140
Appendix B – Web Side Plate Calculations
New Zealand Design (SCNZ, 2008a)
Design Forces: V* = 147 kN [0.3 x Shear Capacity of Connecting Beam (NZS3404)
Bolt Group Strength φR/R*
φVb = 379 kN Shear at eccentricity e OK 2.6
φMb = 28 kN Seismic moment OK 1.3
Web Plate Strength
Limits φVbi = 203 kN Bolt hole 1st resultant bearing OK 1.4
φVtti = 159 kN Bolt hole 1st transverse tearing OK 1.1
φVlti = 686 kN Bolt hole 1st longitudinal tearing OK 4.7
φVgfi = 809 kN Cleat gross flexure yield OK 5.5
φVnfi = 632 kN Cleat net flexure ultimate OK 4.3
φVgsi = 305 kN Cleat gross shear yield OK 2.1
φVnsi = 336 kN Cleat net shear ultimate OK 2.3
Section Web Strength Limits φVbw = 580 kN Bolt hole 1st resultant bearing OK 3.9
φVttw = 802 kN Bolt hole 1st transverse tearing OK 5.4
φVltw = 468 kN Bolt hole 1st longitudinal tearing OK 3.2
φVgsw = 358 kN Gross shear yield OK 2.4
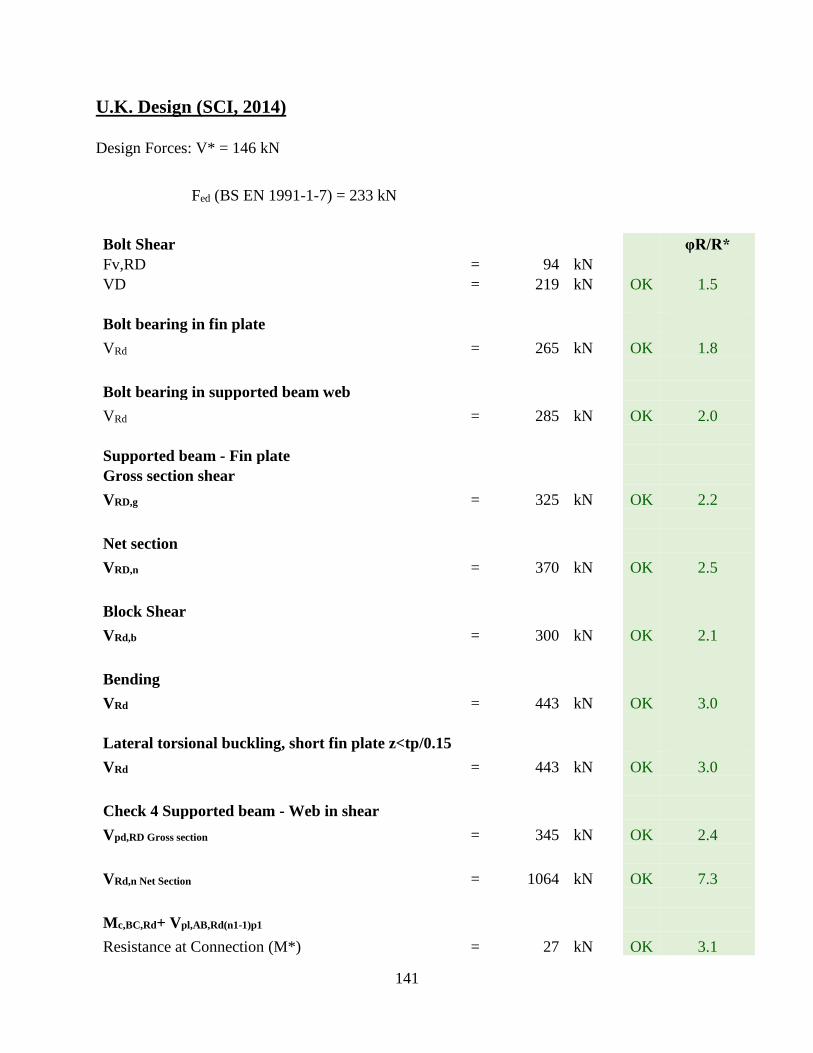
141
U.K. Design (SCI, 2014)
Design Forces: V* = 146 kN
Fed (BS EN 1991-1-7) = 233 kN
Bolt Shear φR/R*
Fv,RD = 94 kN VD = 219 kN OK 1.5
Bolt bearing in fin plate
VRd = 265 kN OK 1.8
Bolt bearing in supported beam web
VRd = 285 kN OK 2.0
Supported beam - Fin plate
Gross section shear
VRD,g = 325 kN OK 2.2
Net section
VRD,n = 370 kN OK 2.5
Block Shear
VRd,b = 300 kN OK 2.1
Bending
VRd = 443 kN OK 3.0
Lateral torsional buckling, short fin plate z<tp/0.15
VRd = 443 kN OK 3.0
Check 4 Supported beam - Web in shear
Vpd,RD Gross section = 345 kN OK 2.4
VRd,n Net Section = 1064 kN OK 7.3
Mc,BC,Rd+ Vpl,AB,Rd(n1-1)p1
Resistance at Connection (M*) = 27 kN OK 3.1
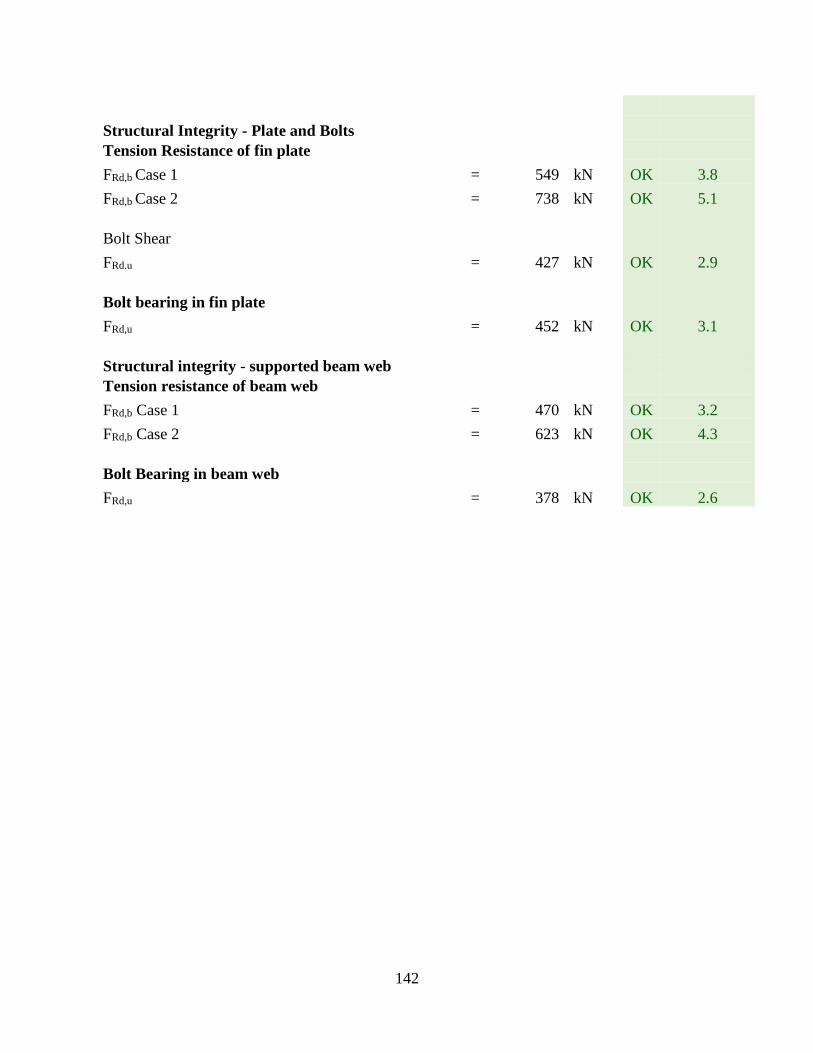
142
Structural Integrity - Plate and Bolts
Tension Resistance of fin plate
FRd,b Case 1 = 549 kN OK 3.8
FRd,b Case 2 = 738 kN OK 5.1
Bolt Shear
FRd.u = 427 kN OK 2.9
Bolt bearing in fin plate
FRd,u = 452 kN OK 3.1
Structural integrity - supported beam web
Tension resistance of beam web
FRd,b Case 1 = 470 kN OK 3.2
FRd,b Case 2 = 623 kN OK 4.3
Bolt Bearing in beam web
FRd,u = 378 kN OK 2.6