modeling the relationship between elevation, aspect and ... article modeling the relationship...
TRANSCRIPT

ORIGINAL ARTICLE
Modeling the relationship between elevation, aspect and spatialdistribution of vegetation in the Darab Mountain, Iran usingremote sensing data
Marzieh Mokarram1• Dinesh Sathyamoorthy2
Received: 13 August 2015 / Accepted: 1 October 2015 / Published online: 23 October 2015
� Springer International Publishing Switzerland 2015
Abstract The aim of this paper is to analyze topographic
and aspect effects on vegetation indices in the Darab
Mountain, Iran. Three commonly used vegetation indices,
normalized difference vegetation index (NDVI), enhanced
vegetation index (EVI) and difference vegetation index
(DVI), were computed from Landsat 8 ETM? vegetation
bands. Based on the results obtained by analyzing the
vegetation indices, it was found that vegetation growth and
vegetation indices increase with increasing elevation and
aspect. The vegetation growth is highest between the ele-
vations of 1500–3000 m, with the NDVI, EVI and DVI
values being large. The best vegetation in this zone is
distributed towards NW 300�.
Keywords Vegetation index � Landsat 8 ETM? �Elevation � Aspect � Spatial distribution
Introduction
Vegetation cover in mountain areas is very important as it
affects local and regional climate, and reduces erosion. The
economies of local communities and millions of people in
mountain areas depend on forests and plants. They also
effectively protect people against natural hazards such as
rock falls, landslides, debris flows and floods (Brang et al.
2001). Settlements and transportation corridors in alpine
regions mainly depend on the protective effect of vegetation
(Agliardi and Crosta 2003). Therefore, understanding of the
distribution and patterns of vegetation growth along with the
affecting factors in these areas is important and has been
studied by many researchers (Bai et al. 2004; Thomas et al.
2013; Gerlitz et al. 2014; Klinge et al. 2015).
Vegetation indices, defined as the arithmetic combina-
tion of two or more bands related to the spectral charac-
teristics of vegetation, has been widely used for the
phonologic monitoring, vegetation classification, and bio-
physical derivation of radiometric and structural vegetation
parameters (Huete and Justice 1999). As is well known, the
topographic effects in the visible and near infrared parts of
a surface’s solar spectrum are comparable. Therefore, the
topographic effects could be eliminated or weakened when
vegetation indices are expressed as band ratios, such as in
normalized difference vegetation index (NDVI) and ratio-
vegetation-index (RVI) (Lee and Kaufman 1986).
Topography is the principal controlling factor in vegeta-
tion growth, while the type of soils and amount of rainfalls
play secondary roles at the scale of hill slopes (Dawes and
Short 1994). Elevation, aspect and slope are the three main
topographic factors that control the distribution and patterns
of vegetation in mountain areas. Among these three factors,
elevation is the most important (Day and Monk 1974; Busing
et al. 1992). Elevation along with aspect and slope in many
respects determines the microclimate, and thus, large-scale
spatial distribution and patterns of vegetation (Allen and Peet
1990; Busing et al. 1992). Vegetation growth in high
mountains is generally restricted by temperature conditions
(Jobbagy and Jackson 2000; Klinge et al. 2003; Korner 2012;
Dulamsuren et al. 2014; Yospin et al. 2015).
& Marzieh Mokarram
Dinesh Sathyamoorthy
1 Department of Range and Watershed Management, College
of Agriculture and Natural Resources of Darab, Shiraz
University, 71946-84471 Darab, Iran
2 Science and Technology Research Institute for Defence
(STRIDE), Ministry of Defence, Kuala Lumpur, Malaysia
123
Model. Earth Syst. Environ. (2015) 1:30
DOI 10.1007/s40808-015-0038-x

Matsushita et al. (2007) analyzed differences in the
topographic effect on NDVI and enhanced vegetation
index (EVI), with two airborne-based images acquired
from a mountainous area covered by high-density Japanese
cypress plantations used as a case study. The results indi-
cate that the soil adjustment factor L in EVI makes it more
sensitive to topographic conditions as compared to NDVI.
The results obtained by analyzing NDVI data for 7 years
(2000–2006) clearly indicated that elevation is the domi-
nating factor determining the vertical distribution of veg-
etation in the area. The vegetation growth is at its best
between the elevations of 3200 and 3600 m, with the
NDVI values being larger than 0.5 and having a peak value
of more than 0.56 at 3400 m. Most studies using remote
sensing data are concentrated on two-dimensional hori-
zontal patterns, with a few focused on the effect of ele-
vation on the vertical distribution of vegetation in mountain
areas (Ustuner et al. 2014; Klinge et al. 2015).
The aim of this paper is to analyze topographic and
aspect effects on vegetation indices, taking NDVI, EVI and
DVI as three typical examples in Darab Mountain, Iran.
We show in this study that readily available NDVI, EVI
and DVI data can be used to quantify the spatial distribu-
tion of vegetation. The results represent the general con-
ditions of vegetation growth in different elevations and
aspects.
Material and method
Study area
The study area, with longitude N 29� 520 and latitude E 52�480 east, and with area of 4649 km2, is located in the north
of Iran (Fig. 1). The major land use categories of the area is
range land mainly and small part of the study area for
agriculture, farming and forests. The altitude of the study
area ranges from the lowest of 1047 m to the highest of
3003 m. The study area is located in a semi-arid region
where the amount of rain in lower than 300 mm for per
year (Fig. 2). Given the low amount of rain in the study
area, the vegetation in the area needs low amount of water
to grow.
A Shuttle Radar Topography Mission (SRTM) DEM of
the study area, with spatial resolution of 30 m was used. In
addition, in order to compute the vegetation indices, bands
1, 3 and 4 of Landsat 8 ETM? images for the year 2015
were used. Using ENVI v.5, preprocessing, including
geometric and atmospheric corrections, were performed,
and then, the vegetation indices for the study area were
calculated.
Vegetation indices
Normalized difference vegetation index (NDVI)
The one of most important vegetation indices is NDVI,
which can be used as a basis for determining other
parameters of vegetation index. The values of this index
are between -1 to ?1, with higher values indicating
increase in vegetation density. NDVI is calculated as fol-
lows (Rahmani et al. 2011):
TM4�TM3ð Þ= TM4 þ TM3ð Þ ð1Þ
where TM4 and TM3 respectively are near infra-red (band
4) and red (band 3) bands of the ETM sensor.
Enhanced vegetation index (EVI)
EVI was developed to optimize the vegetation signal with
improved sensitivity in high biomass regions and improved
Fig. 1 Digital elevation model (DEM) of the study area
Fig. 2 Rain map of the study area (Fars Meteorological Bureau)
(http://www.farsmet.ir/Default.aspx)
30 Page 2 of 6 Model. Earth Syst. Environ. (2015) 1:30
123
vegetation monitoring through de-coupling of the canopy
background signal and reduction in atmosphere influences
(Rahmani et al. 2011):
EVI ¼ G � PNIR�PREDð Þ=Lþ PNIR þ c1 � PRED�c2 � PBLUE
ð2Þ
where NIR, RED, and BLUE are atmospherically-corrected
(or partially atmospherically-corrected) surface reflec-
tances, and C1, C2, and L are coefficients to correct for
atmospheric condition (i.e., aerosol resistance). For the
standard EVI products, L = 1, C1 = 6, and C2 = 7.5.
Difference vegetation index (DVI)
DVI is probably the simplest vegetation index, and is
calculated as follows (Tucker 1979):
DVI ¼ NIR�Red ð3Þ
DVI is sensitive to the amount of vegetation, distin-
guishes between soil and vegetation, and does not deal with
the difference between reflectance and radiance caused by
the atmosphere or shadows.
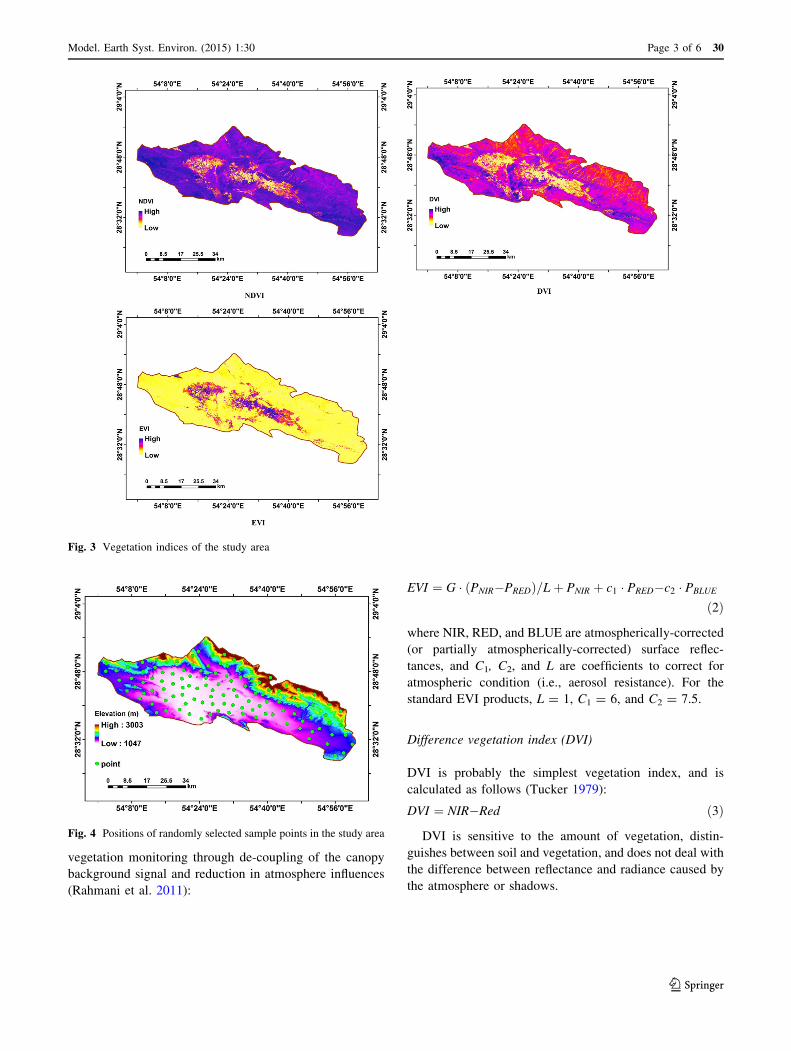
Fig. 3 Vegetation indices of the study area
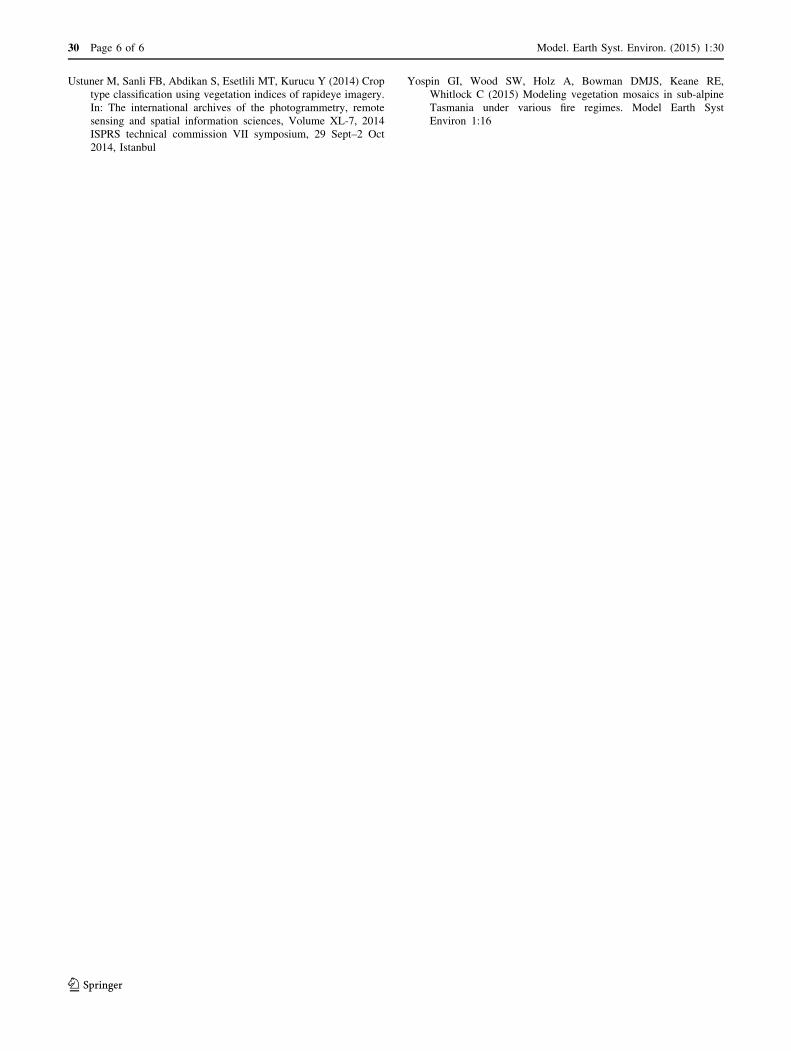
Fig. 4 Positions of randomly selected sample points in the study area
Model. Earth Syst. Environ. (2015) 1:30 Page 3 of 6 30
123

Results and discussion
Based on Fig. 3, vegetation in the Darab Mountain area is
distributed between the elevations of 1047 and 3003 m.
Several observations can be made regarding the effects of
elevation on vegetation growth in the mountain area. First
of all, it is clearly seen that elevation is the main control-
ling factor for vegetation growth. The NDVI, EVI, DVI
values increase with increasing elevation and reaches its
maximum value at 3003 m, which is the highest elevation
in the region. The NDVI, EVI and DVI values are mostly
larger than 0.30 when the elevation is 3000 m, which is the
best vertical zone in terms of vegetation growth. The
NDVI, EVI and DVI values are \0.30, and vegetation
growth is poorer when the elevation is lower than 3000 m.
For determination of the relationship between indices
and elevation, 117 randomly selected sample points were
used (Fig. 4). Figure 5 confirms that with increasing ele-
vation, vegetation indices (EVI, NDVI and DVI) increases.
Most vegetation in the northern part of Darab mountain
area is distributed between the elevations of 1500 and
3003 m, indicating that this is the best elevation range for
vegetation growth in the study area. In the elevation, the
rain is more and the condition is good for growing the
vegetation. These results demonstrate that readily available
elevation data can be used for the prediction of vegetation
indices and to quantify the spatial distribution of
vegetation.
The relationship between vegetation indices and aspect
in the study area is also studied, as shown in Fig. 6, which
indicates increasing vegetation with increasing aspect. The
best vegetation in this zone is distributed more than North
West (NW) 300�. It is also found that the best vegetation
growth is on the shady side of the mountain where much
less evapotranspiration (ET) is expected. The reduced ET
in the shaded side is important for vegetation growth in the
Darab Mountain area since it is located in a semi-arid
region.
Conclusion
The aim of this paper was to analyze topographic and
aspect effects on vegetation indices in Darab Mountain,
Iran. Three commonly used vegetation indices, NDVI, EVI
and DVI, were computed from Landsat 8 ETM? vegeta-
tion bands.
Based on the results obtained by analyzing the vegeta-
tion indices, it was found that vegetation growth and
vegetation indices increase with increasing elevation and
Fig. 5 The change of the vegetation indices values with elevation in the study area
30 Page 4 of 6 Model. Earth Syst. Environ. (2015) 1:30
123

aspect. The vegetation growth is highest between the ele-
vations of 1500 to 3000 m, with the NDVI, EVI and DVI
values being large. In addition, the best vegetation in this
zone is distributed towards NW 300�.
References
Agliardi F, Crosta GB (2003) High resolution three-dimensional
numerical modelling of rockfalls. Int J Rock Mech Min Sci
40:455–471
Allen RB, Peet RK (1990) Gradient analysis of forests of the Sangre
de Cristo Range, Colorado. Can J Bot 68:193–201
Bai Y, Broersma K, Thompson D, Ross TJ (2004) Landscape-level
dynamics of grassland–forest transitions in British Columbia.
J Range Manag 55:66–75
Brang P, Schonenberger W, Ott E, Gardner RH (2001) Forests as
protection from natural hazards. In: Evans J (ed) The forests
handbook. Blackwell Science Ltd., Oxford, pp 53–81
Busing RT, White PS, MacKende MD (1992) Gradient analysis of old
spruce-fir forest of the Great Smokey Mountains circa 1935. Can
J Bot 71:951–958
Dawes WR, Short D (1994) The significance of topology for
modelling the Surface hydrology of fluvial landscapes. Water
Resour Res 30:1045–1055
Day FP, Monk CD (1974) Vegetation patterns on a Southern
Appalachian watershed. Ecology 55:1064–1074
Dulamsuren C, Khishigjargal M, Leuschner C, Hauck M (2014)
Response of tree-ring width to climate warming and selective
logging in larch forests of the Mongolian Altai. J Plant Ecol 7:24–38
Gerlitz L, Conrad O, Thomas A, Bohner J (2014) Assessment of
warming patterns for the tibetan plateau and its adjacent
lowlands based on an elevation and bias corrected ERA-interim
data set. Clim Res 58:235–246
Huete AR, Justice C (1999) MODIS vegetation index (MOD13)
algorithm theoretical basis document. Ver. 3
Jobbagy EG, Jackson RB (2000) Global controls of forest line
elevation in the northern and southern hemispheres. Glob Ecol
Biogeogr 9:253–268
Klinge M, Bohner J, Lehmkuhl F (2003) Climate patterns, snowand
timberlines in the Altai Mountains, Central Asia. Erdkunde
57:296–308
Klinge M, Bohner J, Erasmi S (2015) Modeling forest lines and forest
distribution patterns with remote-sensing data in a mountainous
region of semiarid central Asia. Biogeosciences, 12, 2893–2905.
www.biogeosciences.net/12/2893/2015/
Korner C (2012) Alpine treelines, functional ecology of the global
high elevation tree limits. Springer, Basel 220 ppLee TY, Kaufman YJ (1986) Non-lambertian effects on remote
sensing of surface reflectance and vegetation index. IEEE Trans
Geosci Remote Sens 24:699–707
Matsushita B, Yang W, Chen J, Onda Y, Qiu G (2007) Sensitivity
of the enhanced vegetation index (EVI) and normalized
difference vegetation index (NDVI) to topographic effects: a
case study in high-density cypress forest. Sensors
2007(7):2636–2651
Rahmani N, Shahedi K, Mir yagoub Zadeh M (2011) The evaluation
vegetation index used in remote sensing (Case Study Hrysk
basin), Geomatics 2011, National Cartographic Center, Tehran
(in Persian)
Thomas J, Duff Tina L, York A (2013) Recognising fuzzy vegetation
pattern: the spatial prediction of floristically defined fuzzy
communities using species distribution modelling methods.
J Veg Sci 25:323–337. doi:10.1111/jvs.12092
Tucker CJ (1979) Red and photographic infrared linear combinations
for monitoring vegetation. Remote Sens Environ 8:127–150
Fig. 6 The change of the vegetation indices values with aspect in the study area
Model. Earth Syst. Environ. (2015) 1:30 Page 5 of 6 30
123
Ustuner M, Sanli FB, Abdikan S, Esetlili MT, Kurucu Y (2014) Crop
type classification using vegetation indices of rapideye imagery.
In: The international archives of the photogrammetry, remote
sensing and spatial information sciences, Volume XL-7, 2014
ISPRS technical commission VII symposium, 29 Sept–2 Oct
2014, Istanbul
Yospin GI, Wood SW, Holz A, Bowman DMJS, Keane RE,
Whitlock C (2015) Modeling vegetation mosaics in sub-alpine
Tasmania under various fire regimes. Model Earth Syst
Environ 1:16
30 Page 6 of 6 Model. Earth Syst. Environ. (2015) 1:30
123