formulating the relationship between temperature and elevation and evaluating the influence of major...
DESCRIPTION
The raged topography, vegetation cover, and the considerable surface water body in the highlands of Ethiopia have made the climate of the area to be dependent on various local factors. In many parts of the world, found in similar latitude, surface temperature is highly governed by altitude. Understanding the effect of altitude on the temperature of the study area helps a lot in evaluating the contribution of other land covers (local factors). In this study the relationship between surface elevation and temperature is assessed and the effect of major land covers is evaluated. Only 14 percent of the areas have near the expected temperature. The majority of the area is found to be colder than the expected. The extent of effects on surface temperature caused by water bodies, vegetation and instant cloud covers is well understood.TRANSCRIPT
1
Formulating the Relationship between
Temperature and Elevation and Evaluating the
Influence of Major Land Covers on Surface
Temperature
(a case study in part of Northern Ethiopia)
By
Yafet Birhanu Gebremariam
Addis Ababa University, Department of Earth Science
June, 2009
Abstract
The raged topography, vegetation cover, and the considerable surface water body in the highlands of
Ethiopia have made the climate of the area to be dependent on various local factors. In many parts of
the world, found in similar latitude, surface temperature is highly governed by altitude. Understanding
the effect of altitude on the temperature of the study area helps a lot in evaluating the contribution of
other land covers (local factors). In this study the relationship between surface elevation and
temperature is assessed and the effect of major land covers is evaluated. Only 14 percent of the areas
have near the expected temperature. The majority of the area is found to be colder than the expected.
The extent of effects on surface temperature caused by water bodies, vegetation and instant cloud
covers is well understood.
2
Table of Contents
1. Chapter One ............................................................................................................................... 3
1.1. Background ................................................................................................................................ 3
1.1. Objectives .................................................................................................................................. 3
1.2. Study Area ................................................................................................................................. 4
1.3. Materials and Softwares ............................................................................................................. 4
2. Chapter Two ............................................................................................................................... 5
2.1. Defining Relationship between Elevation and Temperature ......................................................... 5
2.1.1. Selecting Area for Calibration ................................................................................................... 6
2.1.2. Preparation of layers ................................................................................................................. 6
2.1.3. Correlation Analysis ................................................................................................................. 7
2.2. Expected Temperature of Study Area .......................................................................................... 8
2.2.1. Temperature Derived from Elevation Data............................................................................... 9
2.2.2 Temperature from Landsat ETM+ thermal band .................................................................... 10
2.3. Chang Detection ..................................................................................................................... 12
2.3.1. Temperature Variation Percentage by Area ........................................................................... 13
2.3.2. Comparison with Selected Land Covers .................................................................................. 14
3. Chapter Three .......................................................................................................................... 15
3.1. Discussion and conclusion ......................................................................................................... 15
3.2. Recommendations .................................................................................................................... 15
References .............................................................................................................................................. 16
List of Maps
Map 1: Location of study area ........................................................................................................ 4
Map 2: Digital elevation model of study area ................................................................................. 9
Map 3: Surface temperature prepared from DEM .......................................................................... 9
Map 4: Surface temperature from landsat thermal band ............................................................... 11
Map 5: Temperature differences from the expected value ........................................................... 12
Map 6: Shows selected land cover ................................................................................................ 14
3
1. Chapter One
1.1. Background
This study aims at analyzing the relationship between temperature and elevation in a specified area.
Elevation is not the only factor which affects temperature. The influence of other factors on temperature
should be taken in to consideration before relating temperature and elevation.
Temperature of an object or a place does not depend only on the amount of heat which it receives but
also upon the amount of heat it loses. If an object loses more heat, than the heat received from the Sun, it
gets colder; and its temperature falls and the vice-versa. A number of factors give contribution to the
temperature of an area. The most common ones are summarized below.
The Sun's rays heat the earth's surface then, the lower atmosphere is heated by conduction from the
surface of the earth. Close to the earth's surface, the layers of air are denser than at higher altitudes. An
elevated plateau received more heat than a piece of low ground because Sun's rays have crossed a lesser
thickness of atmosphere to reach it. But loss of heat is rapid from the clearer, dust-free rarefied air of the
plateau than from the low ground. In the low area the air is dense and dust particles as well as water
vapors are helping greater retention of heat. Highlands of Ethiopia have elevations exceeding 3500 meters
which makes the area subject to heat loss than retention.
Four important aspects of the surface are albedo, heat storage, moisture content, and vegetation
type. Higher and thicker vegetation lessens short wave radiation, while at the same time
increasing downward long wave radiation at the surface. Transpiration of plants cools the
surrounding air in the daytime. The net effect is that thicker and higher vegetation decreases the
magnitude of both the diurnal and the yearly temperature cycles. This case is very common in
the tropical areas.
The relative temperature variation in the part of highlands of Ethiopia is majorly caused by elevation and
local factors like vegetation and water bodies. The latitude variation in the area is not big enough to be
considered. The area is far from sea shore which makes the surface temperature least dependent on ocean
currents. The effect of wind is known to have considerable effect on temperature; however the effect of
wind is manifested with relative elevation, elevated areas are exposed to wind.
1.1. Objectives
The objectives of this work can be generalized as follows:
• To find out the relationship between surface temperature and elevation (altitude) of the study
area; and define relationship formulation.
• Identifying areas where their surface temperature is affected by factors other than altitude and
evaluating influence of vegetation and water body over surface temperature.
4
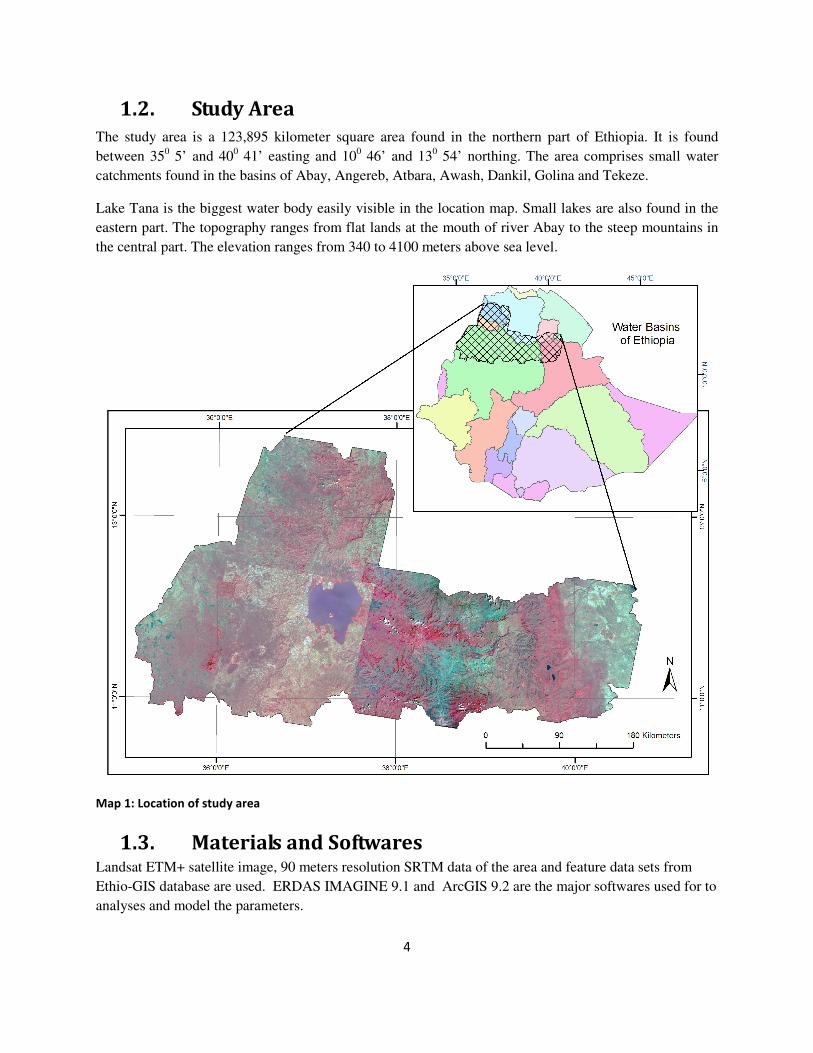
1.2. Study Area
The study area is a 123,895 kilometer square area found in the northern part of Ethiopia. It is found
between 350 5’ and 40
0 41’ easting and 10
0 46’ and 13
0 54’ northing. The area comprises small water
catchments found in the basins of Abay, Angereb, Atbara, Awash, Dankil, Golina and Tekeze.
Lake Tana is the biggest water body easily visible in the location map. Small lakes are also found in the
eastern part. The topography ranges from flat lands at the mouth of river Abay to the steep mountains in
the central part. The elevation ranges from 340 to 4100 meters above sea level.
Map 1: Location of study area
1.3. Materials and Softwares Landsat ETM+ satellite image, 90 meters resolution SRTM data of the area and feature data sets from
Ethio-GIS database are used. ERDAS IMAGINE 9.1 and ArcGIS 9.2 are the major softwares used for to
analyses and model the parameters.
5
2. Chapter Two
2.1. Defining Relationship between Elevation and
Temperature
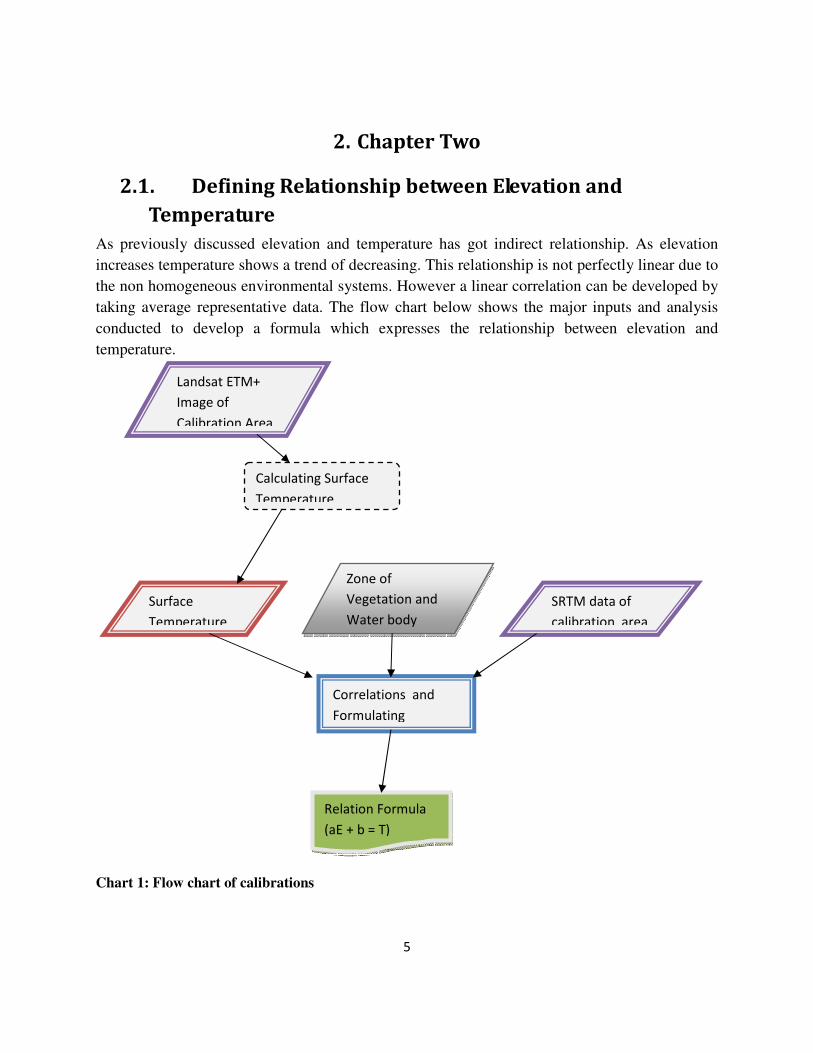
As previously discussed elevation and temperature has got indirect relationship. As elevation
increases temperature shows a trend of decreasing. This relationship is not perfectly linear due to
the non homogeneous environmental systems. However a linear correlation can be developed by
taking average representative data. The flow chart below shows the major inputs and analysis
conducted to develop a formula which expresses the relationship between elevation and
temperature.
Chart 1: Flow chart of calibrations
Landsat ETM+
Image of
Calibration Area
SRTM data of
calibration area
Correlations and
Formulating
Relation Formula
(aE + b = T)
Calculating Surface
Temperature
Surface
Temperature
Zone of
Vegetation and
Water body
6
2.1.1. Selecting Area for Calibration
The area selected to develop the relationship formula of elevation and temperature is found in the
northeastern part of Ethiopia. The landsat ETM+ images of the area are P169-R051 and P168-
R051. The wide range of temperature and elevation is the major reason which attributed for the
selection of the area for calibration. The elevation of the area ranges from -115 meters to 4472
meters above sea level. The temperature ranges from 282 to 320 degree Kelvin.
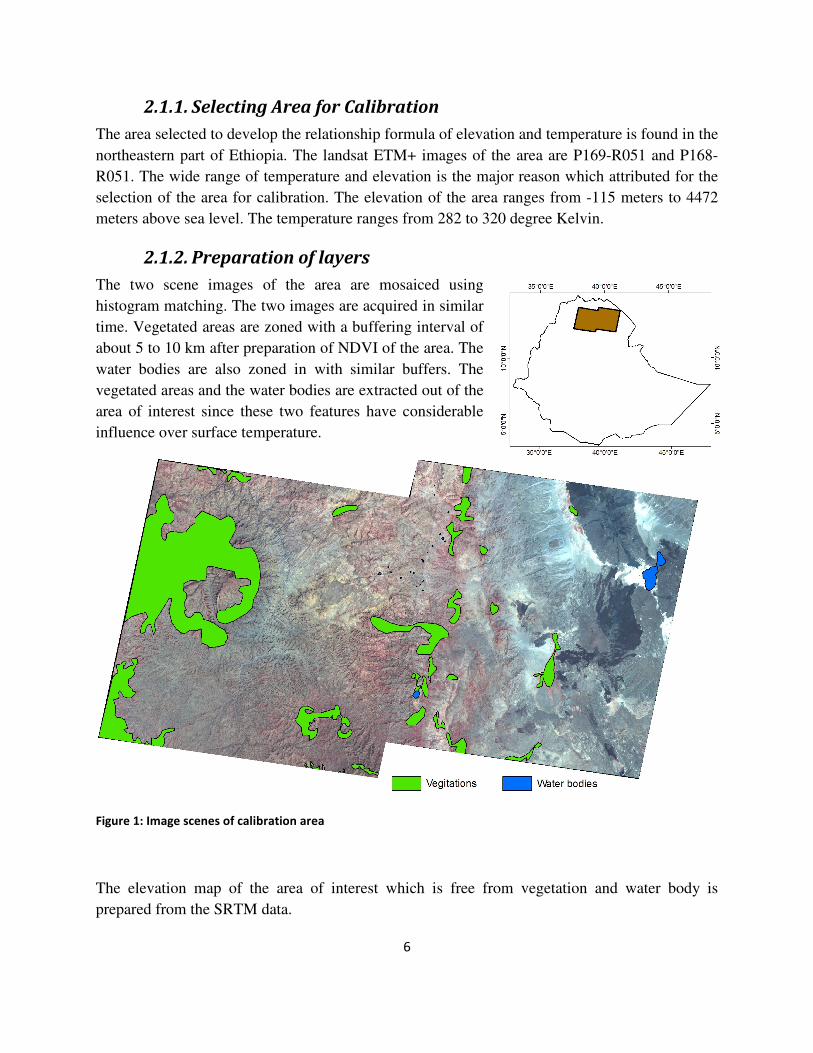
2.1.2. Preparation of layers
The two scene images of the area are mosaiced using
histogram matching. The two images are acquired in similar
time. Vegetated areas are zoned with a buffering interval of
about 5 to 10 km after preparation of NDVI of the area. The
water bodies are also zoned in with similar buffers. The
vegetated areas and the water bodies are extracted out of the
area of interest since these two features have considerable
influence over surface temperature.
Figure 1: Image scenes of calibration area
The elevation map of the area of interest which is free from vegetation and water body is
prepared from the SRTM data.

7
(-5.014/1333.286)E + 312.313 = T
2.1.3. Correlation Analysis
The basic analysis is to develop a linear relationship formula with a form:
aX + b = Y
Where: a is slope, b is constant, X and Y are variables
In this case X is elevation of the calibration area (E) and Y is the surface temperature of the area
(T). Therefore the equation will be
aE + b = T ---------------------------------------------------- (1)
Where: E and T are elevation and temperature respectively.
Elevation of the area is found from the SRTM data. It ranges from -115 to 4472 meters above sea
level.
Average elevation is 1333.286 meters ASL ------------------------------------------- (2)
Surface temperature of the area is found from the thermal bands of landsat ETM+.
Average temperature is 307.299 degree Kelvin -------------------------------------- (3)
From equation (1) it is obvious that temperature (T) is equivalent to a constant ‘b’ when
elevation is zero. Therefore areas from surface temperature layer which has elevation equal to
zero from SRTM layer are extracted out using ERDAS IMAGINE modeler. The average values
of the zero elevation temperature are calculated.
Average zero temperature is 312.313 degree Kelvin -------------------------------- (4)
Average zero temperature, 312.313 degree Kelvin, is a constant equivalent to ‘b’.
To find the slope of the correlations which is ‘a’, we use equation (1) and values of (2), (3) and
(4).
a = (T – b)/E = (307.299 – 312.313)/1333.286
a = - 5.014/1333.286 ------------------------------------------------------------ (5)
Therefore we can substitute the values of ‘a’ and ‘b’ in to equation (1) to set out the formula as:
--------
Where: E and T are Elevation and Temperature
--------------------------------- (6)
8
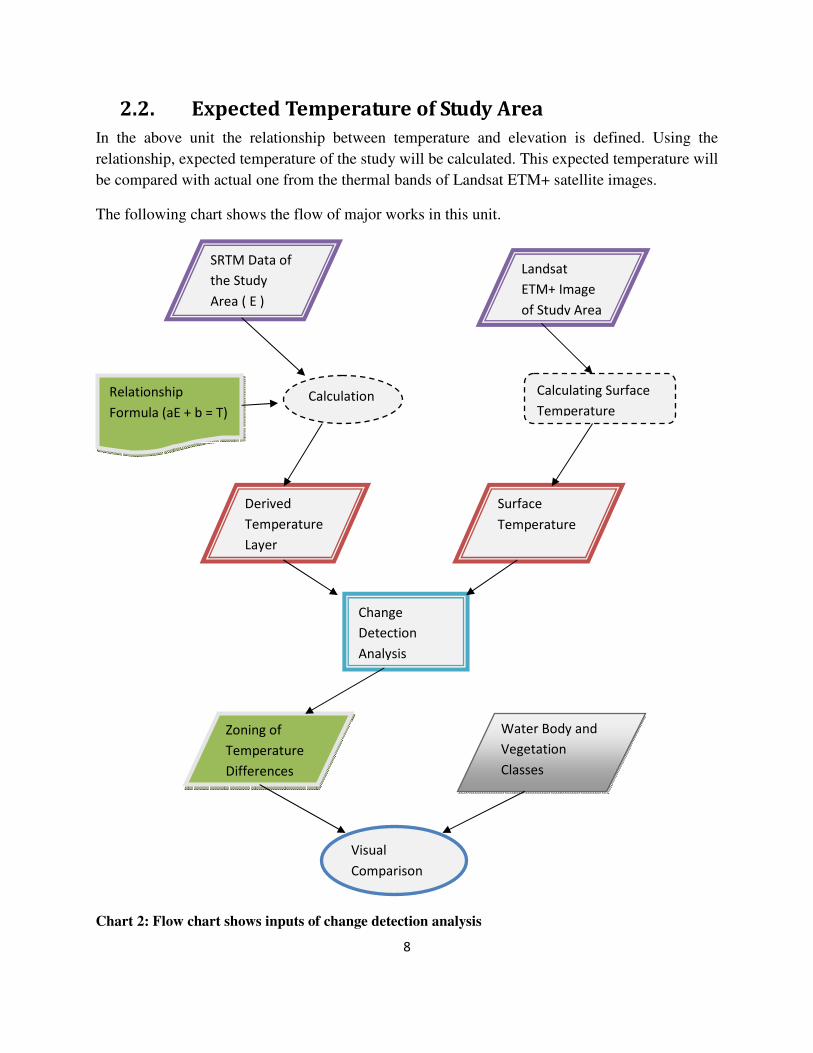
2.2. Expected Temperature of Study Area
In the above unit the relationship between temperature and elevation is defined. Using the
relationship, expected temperature of the study will be calculated. This expected temperature will
be compared with actual one from the thermal bands of Landsat ETM+ satellite images.
The following chart shows the flow of major works in this unit.
Chart 2: Flow chart shows inputs of change detection analysis
SRTM Data of
the Study
Area ( E )
Relationship
Formula (aE + b = T)
Derived
Temperature
Layer
Surface
Temperature
Change
Detection
Analysis
Zoning of
Temperature
Differences
Water Body and
Vegetation
Classes
Visual
Comparison
Landsat
ETM+ Image
of Study Area
Calculating Surface
Temperature Calculation
9
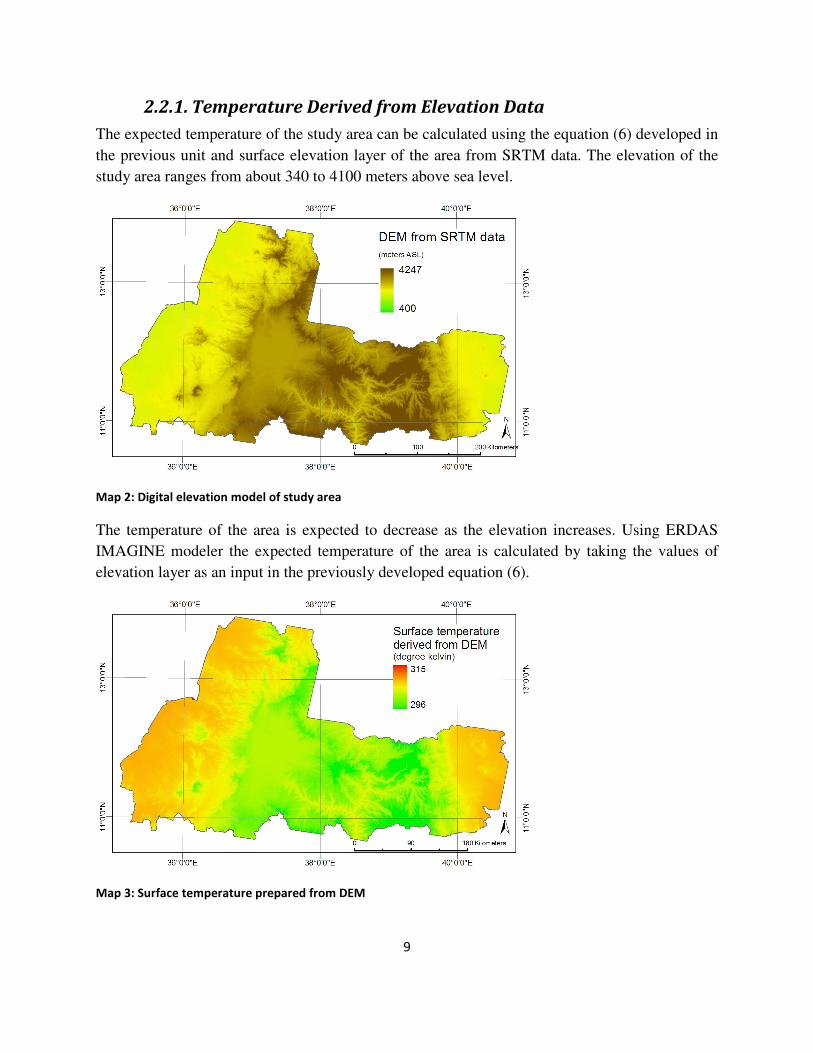
2.2.1. Temperature Derived from Elevation Data
The expected temperature of the study area can be calculated using the equation (6) developed in
the previous unit and surface elevation layer of the area from SRTM data. The elevation of the
study area ranges from about 340 to 4100 meters above sea level.
Map 2: Digital elevation model of study area
The temperature of the area is expected to decrease as the elevation increases. Using ERDAS
IMAGINE modeler the expected temperature of the area is calculated by taking the values of
elevation layer as an input in the previously developed equation (6).
Map 3: Surface temperature prepared from DEM
10
The output image seams the reciprocal of the elevation. The temperature ranges from about 296
to 315 degree Kelvin.
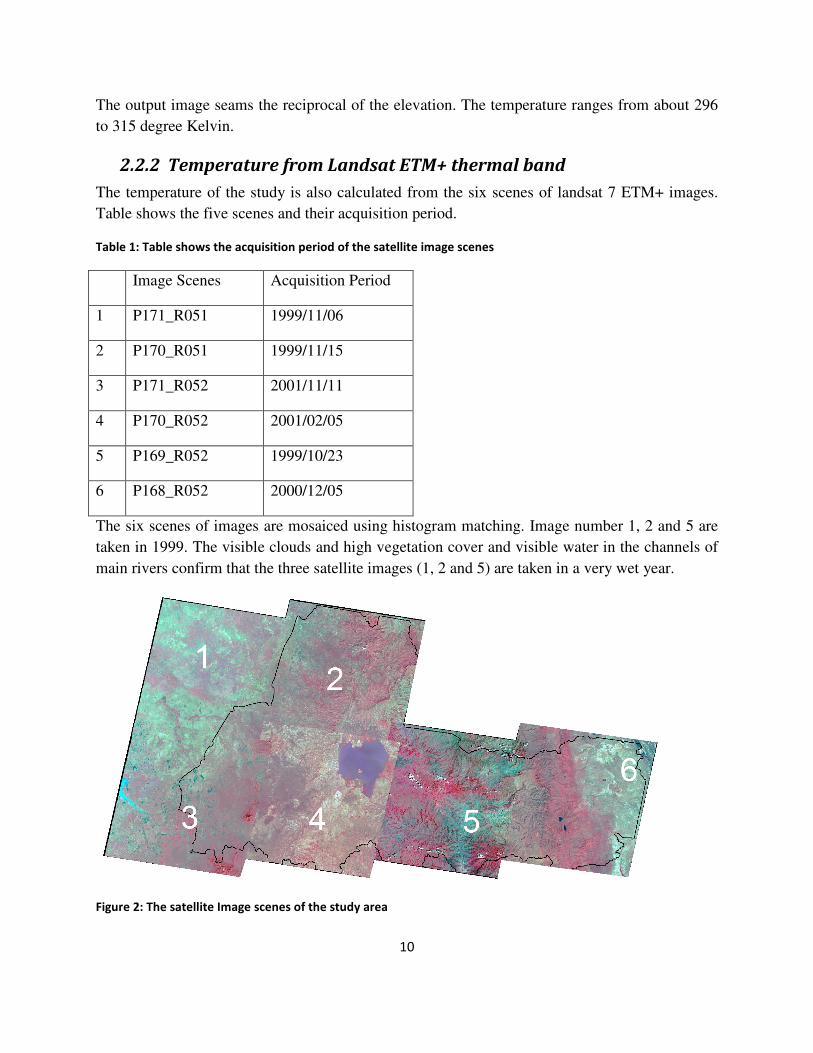
2.2.2 Temperature from Landsat ETM+ thermal band
The temperature of the study is also calculated from the six scenes of landsat 7 ETM+ images.
Table shows the five scenes and their acquisition period.
Table 1: Table shows the acquisition period of the satellite image scenes
Image Scenes Acquisition Period
1 P171_R051 1999/11/06
2 P170_R051 1999/11/15
3 P171_R052 2001/11/11
4 P170_R052 2001/02/05
5 P169_R052 1999/10/23
6 P168_R052 2000/12/05
The six scenes of images are mosaiced using histogram matching. Image number 1, 2 and 5 are
taken in 1999. The visible clouds and high vegetation cover and visible water in the channels of
main rivers confirm that the three satellite images (1, 2 and 5) are taken in a very wet year.
Figure 2: The satellite Image scenes of the study area
11
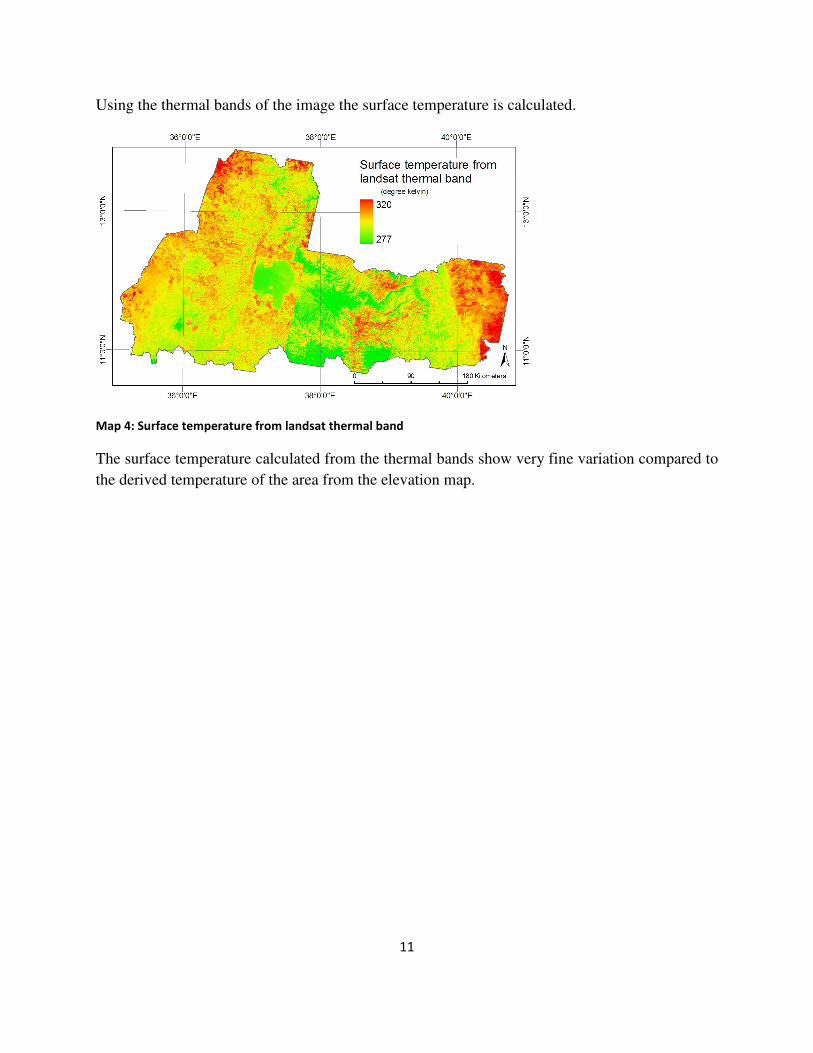
Using the thermal bands of the image the surface temperature is calculated.
Map 4: Surface temperature from landsat thermal band
The surface temperature calculated from the thermal bands show very fine variation compared to
the derived temperature of the area from the elevation map.
12
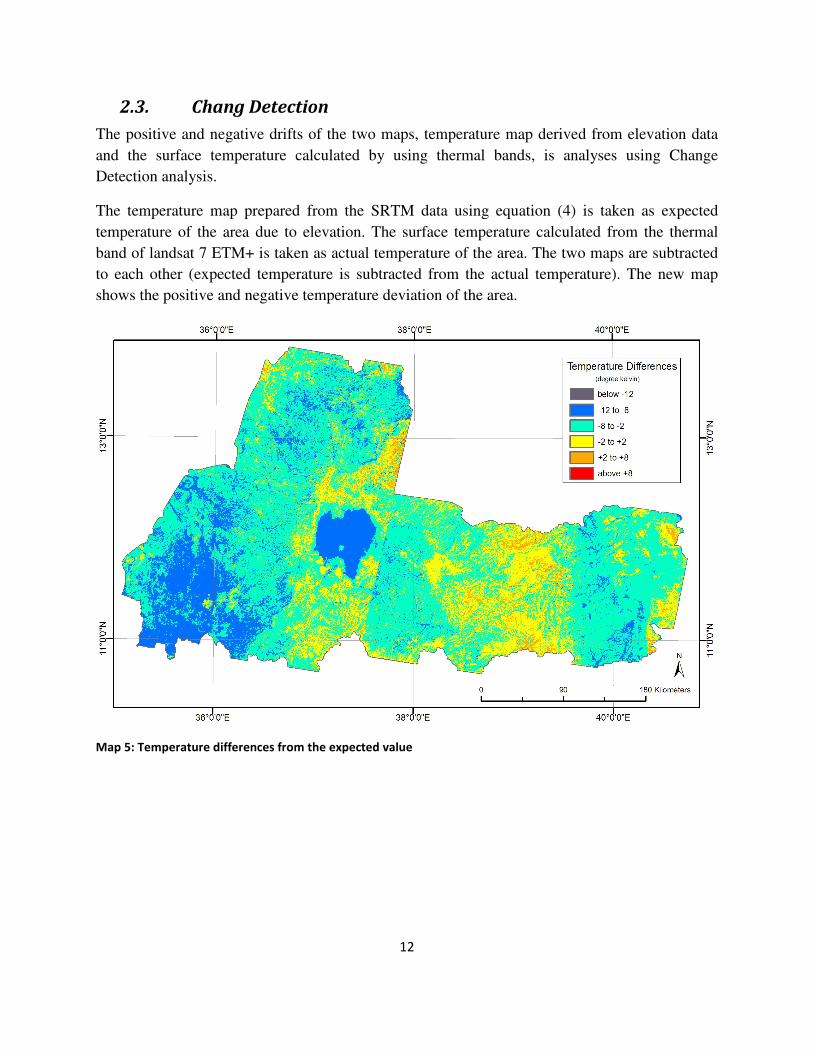
2.3. Chang Detection
The positive and negative drifts of the two maps, temperature map derived from elevation data
and the surface temperature calculated by using thermal bands, is analyses using Change
Detection analysis.
The temperature map prepared from the SRTM data using equation (4) is taken as expected
temperature of the area due to elevation. The surface temperature calculated from the thermal
band of landsat 7 ETM+ is taken as actual temperature of the area. The two maps are subtracted
to each other (expected temperature is subtracted from the actual temperature). The new map
shows the positive and negative temperature deviation of the area.
Map 5: Temperature differences from the expected value
13
In the output map it is clearly visible that Lake Tana is about 10 degree Celsius colder than the
expected. Most of the western parts of the area extending from north to south are found to be
colder than the expected by more than 8 degree Celsius. Some parts of eastern areas also show
similar trend. In the central part and some areas around Lake Tana show very slight changes
about 2 degree Celsius. Compared to the colder ones we have only few areas of positive
temperature change.
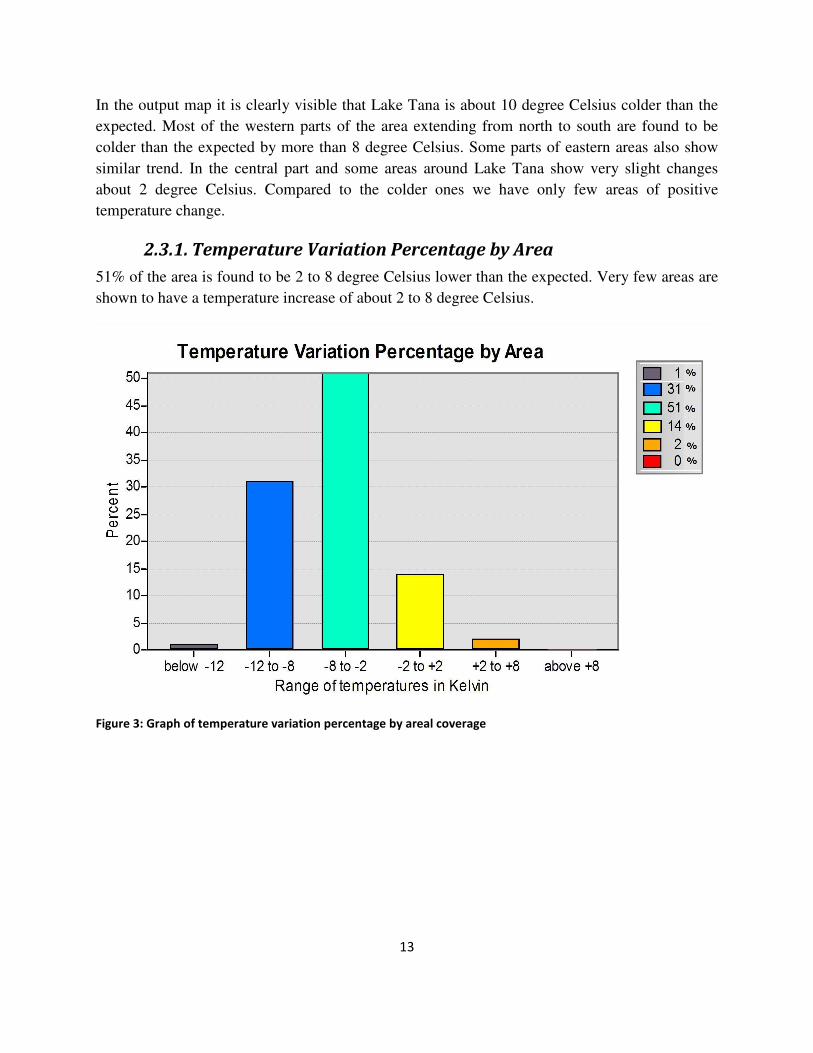
2.3.1. Temperature Variation Percentage by Area
51% of the area is found to be 2 to 8 degree Celsius lower than the expected. Very few areas are
shown to have a temperature increase of about 2 to 8 degree Celsius.
Figure 3: Graph of temperature variation percentage by areal coverage
14
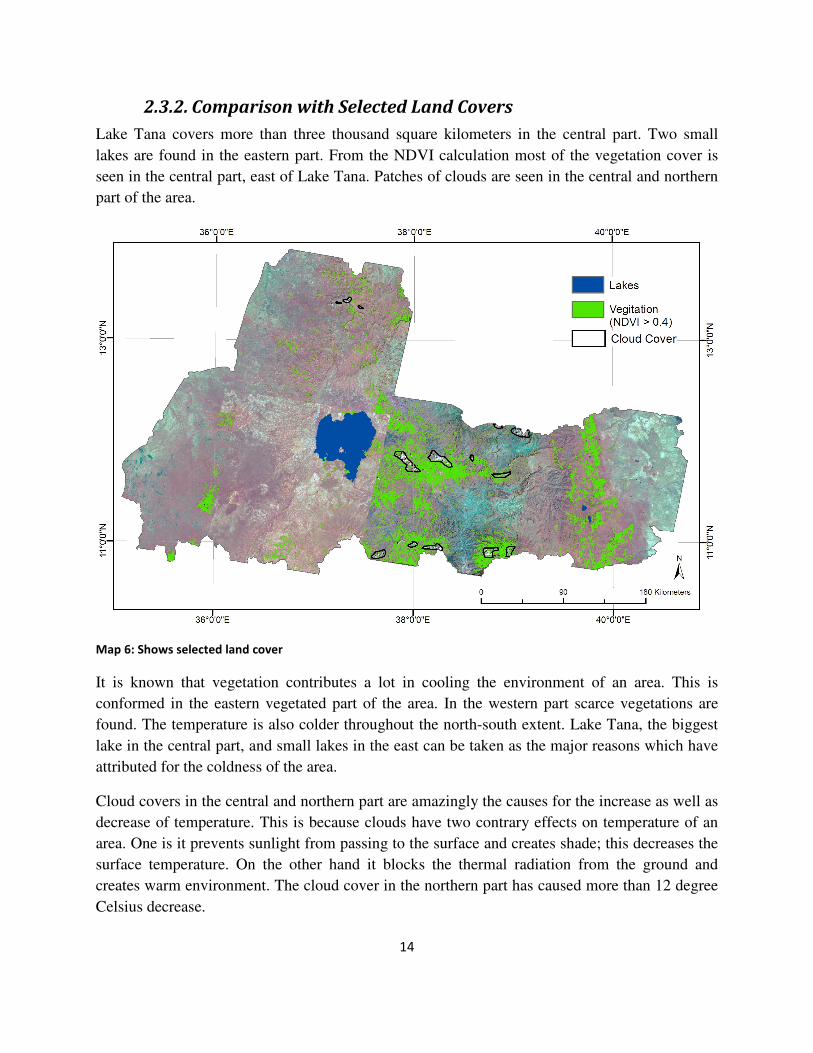
2.3.2. Comparison with Selected Land Covers
Lake Tana covers more than three thousand square kilometers in the central part. Two small
lakes are found in the eastern part. From the NDVI calculation most of the vegetation cover is
seen in the central part, east of Lake Tana. Patches of clouds are seen in the central and northern
part of the area.
Map 6: Shows selected land cover
It is known that vegetation contributes a lot in cooling the environment of an area. This is
conformed in the eastern vegetated part of the area. In the western part scarce vegetations are
found. The temperature is also colder throughout the north-south extent. Lake Tana, the biggest
lake in the central part, and small lakes in the east can be taken as the major reasons which have
attributed for the coldness of the area.
Cloud covers in the central and northern part are amazingly the causes for the increase as well as
decrease of temperature. This is because clouds have two contrary effects on temperature of an
area. One is it prevents sunlight from passing to the surface and creates shade; this decreases the
surface temperature. On the other hand it blocks the thermal radiation from the ground and
creates warm environment. The cloud cover in the northern part has caused more than 12 degree
Celsius decrease.
15
3. Chapter Three
3.1. Discussion and conclusion
As we climb up a mountain the temperature is expected to decrease. The relationship between
temperature and elevation is computed in the second chapter. Their relation can be expressed
with a linear formula:
Where E and T are elevation and temperature.
From the relation it is seen that about 1.88 degree Celsius decrease in temperature is observed
with every 500 meters elevation increase.
Using the above relation expected temperatures is calculated from SRTM data (elevation data).
Surface temperature map from thermal bands of landsat 7 is taken as actual temperature of the
area. Variations in the acquisition period of satellite image scenes have caused considerable
brightness change.
Comparison of the actual and expected temperature is evaluated using change detection analysis.
About 83% of the study area is colder than the expected temperature. About 14% of the area falls
to near the expected temperature. Only very few area are seen to be hotter than the expected.
The vegetations and water bodies in the study area are the major causes for decrease of
temperature. Cloud covers have resulted in both surface temperature increase and decrease from
the expected.
3.2. Recommendations
The metrological and hydrological nature of areas used for calibration should be well known.
The satellite image scenes used for such analysis should be on the same year and similar season.
The relationship between elevation and temperature of the areas can be better developed using
statistical data analysis software like SPSS.
Due to wide variety of environmental factors, conducting such kind of analysis in big areas leads
to unnecessary generalizations and missing of local information. Therefore subdividing the areas
into different zones is important.
(-5.014/1333.286)E + 312.313 = T
16
References
ERDAS IMAGINE Tour guide, and field guide manual, 2006 Leica Geosystems Geospatial
Imaging, LLC
Lillisand, T.M., and R.W. Keifer, 1994.Remote Sensing and Image Interpretation, 4th edition,
John Wiley and Son, New York