modeling users’ mobile app privacy preferences: … mobile app privacy notice in july 2013, aiming...
TRANSCRIPT

USENIX Association Tenth Symposium On Usable Privacy and Security 199
1
Modeling Users’ Mobile App Privacy Preferences:
Restoring Usability in a Sea of Permission Settings
Jialiu Lin Bin Liu Norman Sadeh Jason I. Hong
School of Computer Science, Carnegie Mellon University
{jialiul, bliu1, sadeh, jasonh}@cs.cmu.edu
ABSTRACT
In this paper, we investigate the feasibility of identifying a small
set of privacy profiles as a way of helping users manage their
mobile app privacy preferences. Our analysis does not limit itself
to looking at permissions people feel comfortable granting to an
app. Instead it relies on static code analysis to determine the
purpose for which an app requests each of its permissions,
distinguishing for instance between apps relying on particular
permissions to deliver their core functionality and apps requesting
these permissions to share information with advertising networks
or social networks. Using privacy preferences that reflect
people’s comfort with the purpose for which different apps
request their permissions, we use clustering techniques to identify
privacy profiles. A major contribution of this work is to show
that, while people’s mobile app privacy preferences are diverse,
it is possible to identify a small number of privacy profiles that
collectively do a good job at capturing these diverse preferences.
1. INTRODUCTION
As of December 2013, the Google Play Store offered more than
1,130,000 apps; the Apple App store offered more than 1,000,000
apps. Each store has reported more than 50 billion downloads
since its launch [1, 2]. The growth in the number mobile apps has
in part been fueled by the increasing number APIs made available
to developers, including a number of APIs to access sensitive
information such as a user’s current location or call logs. While
these new APIs open the door to exciting new applications, they
also give rise to new types of security and privacy risks. Malware
is an obvious problem [3, 4]; another danger is that users are often
unaware of how much information these apps access and for what
purpose.
Early studies in this area have shown that privacy interfaces,
whether for iOS or for Android, did not provide users with
adequate information or control [5-7]. This was quickly followed
by research exploring solutions that offered users finer grain
control over the use of these APIs [8-10]. Perhaps because of this
research, iOS and Android have now started to offer their users
somewhat finer control over mobile app permissions, enabling
them for instance to toggle permissions on and off on an app-by-
app basis (e.g. iOS5 and above, and also App Ops in Android 4.3).
However, with users having an average of over 40 apps on their
smartphone [11] and each app requiring an average of a little over
3 permissions [12], systematically configuring all these settings
places an unrealistically high burden on users.
This paper investigates the feasibility of organizing end-users into
a small set of clusters and of identifying default privacy profiles
for each such cluster as a way of both simplifying and enhancing
mobile app privacy. We use data obtained through static code
analysis and crowdsourcing, and analyze it using machine
learning techniques to highlight the limitations of today’s
interfaces as well as opportunities for significantly improving
them. Specifically, our results were obtained by collecting 21,657
preference ratings from 725 users on 837 free Android apps.
These preference ratings were collected on over 1200 app-
permission-purpose triples. Each such preference rating captures
a user’s willingness to grant a given permission to a given app for
a particular purpose. Identification of the purpose(s) associated
with a given app’s permission was inferred using static code
analysis, while distinguishing between different types of 3rd
-party
libraries responsible for requesting access to a given permission.
For example, if location data is used by an app only because of an
ad library bundled with the app, we can infer that location is used
for advertising purposes.
Our analysis indicates that a user’s willingness to grant a given
permission to a given mobile app is strongly influenced by the
purpose associated with such a permission. For instance a user’s
willingness to grant access to his or her location will vary based
on whether the request is required to support the app’s core
functionality or whether it is to share this information with an
advertising network or an analytics company. Our analysis further
shows that, as in many other privacy domains, people’s mobile
app privacy preferences are diverse and cannot adequately be
captured by one-size-fits-all default settings. Yet, we show that it
is possible to cluster users into a small number of privacy profiles,
which collectively go a long way in capturing the diverse
preferences of the entire population. This in turn offers the
prospect of empowering users to better control their mobile app
permissions without requiring them to tediously review each and
every app-purpose-permission for the apps on their smartphones.
Beyond just mobile apps, these results open the door to privacy
interfaces that could help reconcile tensions between privacy and
user burden in a variety of domains, in which explosion in
functionality and usage scenarios are stretching demands on users
(e.g. browser privacy settings, Facebook settings, and more).
The contribution of this research is threefold. First, we provide an
in-depth analysis of mobile app permissions that is not limited to
the types of sensitive resources an app requests (e.g. location,
contact lists, account information) but also includes the “purpose”
associated with these requests – with purpose identified through
static analysis of third party libraries and their API calls. Second,
we describe the results of a larger-scale version of the
crowdsourcing methodology originally introduced by Lin et. al.
[13]), collecting over 21,000 privacy preferences associated with
different permissions and purposes. This allows us to
quantitatively link users’ mobile app preferences to different
Copyright is held by the author/owner. Permission to make digital or hard
copies of all or part of this work for personal or classroom use is granted
without fee.
Symposium on Usable Privacy and Security (SOUPS) 2014, July 9-11,
2014, Menlo Park, CA.

200 Tenth Symposium On Usable Privacy and Security USENIX Association
2
types of app behaviors that involve sensitive resource usage.
Third, we present a clustering analysis of the privacy preferences
of 725 smartphone users, and show that, while these preferences
are diverse, a relatively small number of privacy profiles can go
a long way in simplifying the number of decisions users have to
make. This last contribution offers the promise of alleviating user
burden and ultimately increasing their control over their
information.
2. RELATED WORK
A great deal of past work analyzing smartphone apps has focused
on developing useful techniques and tools to detect and manage
leakage of sensitive personal information [8-10, 14-26] or
studying how users react to these usages [6, 13, 27, 28]. In this
section, we summarize the relevant mobile privacy literature,
which we organize around three themes.
2.1 Finer Grain Privacy Controls
In Android, apps can only access sensitive resources if they
declare permission requests in manifest files1
and obtain
authorization from users to access these permissions at download
time. Several studies have examined usability issues related to the
permission interface displayed to users as they download Android
apps [5-7]. The studies have shown that Android permission
screens generally lack adequate information, with most users
struggling to understand key terms and the implications
associated with the permissions they are requested to grant.
Android 4.3 saw the introduction of a hidden permission manager
referred to as a “App Ops” that allows users to review and
manipulate settings associated with the permissions of the apps
they have downloaded on their smartphones [29, 30], This feature
was later removed in Android 4.4 presumably due to usability
problems – namely the unrealistically large number of permission
decisions already mentioned in Section 1. Similar fine grain
control over permissions has also been offered by third party
privacy manager apps, such as LBE privacy guard [31], though it
is only available on rooted Android devices. Similar settings are
also available in iOS (iOS 5 and above), where users have the
ability to turn on and off access to sensitive data or functionality
(such as location, contacts, calendars, photos, etc) on an app-by-
app basis. ProtectMyPrivacy [32] offers similar settings to
jailbroken iPhone users and also provides recommendations
based on majority voting (effectively looking for popular one-
size-fits-all settings, when such settings can be identified).
A number of research prototypes have also offered used fine grain
controls over the permissions [8, 10, 32-35]. MockDroid [8] and
TISSA [10] also allow users to ibject fake information in response
to API calls made by apps. AppFence [9], a follow-up to
TaintDroid [17], also allows users to specify resources, which
should only be used locally. Apex proposed by Nauman et al. [34]
provides fine-grained control over resource usage based on
context and runtime constraints.
These proposed privacy extensions aim to provide users with
finer control over the data accessed by their apps. However, these
extensions also assume that users can correctly configure all the
resulting settings. We argue that asking users to specify such a
1
The Android manifest file of each app presents essential
information about this app to the Android system, information
the system must have before it can run any of the app's code.
large number of privacy preferences is unrealistic. In addition, we
show that controlling permissions on an app-by-app basis without
taking into account the purpose of these permissions does not
enable one to capture important differences in people’s mobile
app privacy preferences. The present paper complements prior
work in this area by identifying a small number of manageable
privacy profiles that takes into account purpose and offers the
promise of empowering users to manage their mobile app privacy
without imposing an undue burden on them.
2.2 Modeling People’s Mobile App Privacy
Preferences
A second line of research has focused on studying users’ mobile
app privacy concerns and preferences. For example, Felt et al.
[28], Chin et al. [27], and Egelman et al [36] conducted surveys
and interviews to understand mobile users’ mobile privacy
concerns as well as their over understanding of the choices they
are expected to make.
Several efforts have researched interfaces intended to improve the
way in which users are informed about mobile app data collection
and usage practices. Kelley et al. evaluated the benefits of
including privacy facts in an app’s description in the app store,
effectively enabling users to take into account privacy
considerations prior to download time [7]. Choe et al. showed that
a framing effect can be exploited to nudge people away from
privacy invasive apps [37]. The National Telecommunications
and Information Administration (NTIA) released guidelines for a
short-form mobile app privacy notice in July 2013, aiming to
provide app users with clear information about how their personal
data are collected, used and shared by apps [38, 39]. Work by
Balebako et al. [40], suggests that more work may be required for
these interfaces to become truly effective. More generally, Felt et
al. discussed the strengths and weaknesses of several permission-
granting mechanisms and provided guidelines for using each
mechanism [41].
Studies have also shown that users are often surprised when they
find out about the ways in which information collected by their
apps is being used [13, 42, 43], e.g. what type of data is requested,
how often, and for what purpose. In [13], we used crowdsourcing
to identify app-permission-purpose triples that were inconsistent
with what users expected different apps to collect. We further
showed that such deviations are often closely related with lack of
comfort granting associated permissions to an app. Our paper
builds on this earlier work by scaling up our crowdsourcing
framework and performing more advanced data analysis to allow
for the development of finer privacy preference models. Our main
contribution here is not only to show how mobile app privacy
preferences vary with the purpose of app permission pairs but also
in the form of a taxonomy of purposes, which we can later
leverage to identify clusters of like-minded users.
2.3 Privacy Preference Learning
A first data mining study of mobile app permissions was
presented by Frank et al., where they authors looked for
permission request patterns in Android apps [44]. Using matrix
factorization techniques, they identified over 30 common patterns
of permission requests. Rather than looking for patterns of

USENIX Association Tenth Symposium On Usable Privacy and Security 201
3
permission requests, our work in this area aims to identify
patterns in user privacy preferences, namely in the willingness of
users to grant permissions to mobile apps for different purposes.
This work more closely aligned with an earlier study published
by three of the co-authors, looking at patterns among the Android
permission settings of 239,000 LBE Privacy Guard [31] users for
around 12,000 apps [12]. In this earlier work, the three co-authors
showed that it was possible to define a small number of privacy
profiles that collectively captured many of the users’ privacy
settings. It further explored mixed initiative models that combine
machine learning to predict user permission settings with user
prompts when the level of confidence associated with certain
predictions appears too low. In contrast to analyzing actual user
privacy settings, our work focuses on deeper privacy models,
where we elicit people’s privacy preferences in a context where
they are not just about the permissions requested by an app but
also about the one or more purposes associated with these
requests (e.g. to enable the app’s core functionality versus to share
data with an advertising network or an analytics company).
While our results bear some similarity with those presented in
[12], they are significant because: (i) they show that the purpose
for which an app requests a certain permission has a major impact
on people’s willingness to grant that permission., and (ii) using
these more detailed preference models elicited from better-
informed users, it is possible to derive a small number of privacy
profiles with significant predictive power.
To the best of our knowledge, our work on quantifying mobile
app privacy preferences is the first of its kind. It has been
influenced by earlier work by several of the co-authors on
building somewhat similar models in the context of user location
privacy preferences. [45-52]. For example, Lin et al. [45]
suggested that people’s location-sharing privacy preferences,
though complicated, can still be modeled quantitatively. Early
work by Sadeh et al. [52] showed that it was possible to predict
people’s location sharing privacy preferences and work by
Benisch et al. explored the complexity of people’s location
privacy preferences [51]The work by Ravichandran et al. [46]
suggested that providing users with a small number of canonical
default policies can help reduce user burden when it comes to
customizing the fine-grained privacy settings. The work by
Cranshaw et al. [47] applied a classifier based on multivariate
Gaussian mixtures to incrementally learn users’ location sharing
privacy preferences. Kelley et al [49] and later Mugan et al. [48]
also introduced the notion of understandable learning into privacy
research. They used default personas and incremental suggestions
to learn users’ location privacy rules, resulting in a significant
reduction of user burden. Their results were later evaluated by
Wilson et al. [50] in a location sharing user study.
As pointed out by Wilson et al. with regard to location sharing
privacy in [50], “… the complexity and diversity of people’s
privacy preferences creates a major tension between privacy and
usability…” The present mobile app privacy research is
motivated by a similar dilemma, which extends well beyond just
location. It shows that approaches that worked well in the context
of location sharing appear to offer similar promise in the broader
context of mobile app privacy preferences, with a methodology
enhanced with the use of static analysis to identify the purpose of
mobile app permissions.
3. DATA COLLECTION
Before analyzing people’s privacy preferences of mobile apps, it
is necessary to gain a deeper understanding of mobile apps with
regard to their privacy-related behaviors as well as the implication
of these behaviors. In this section, we provide technical details of
how we leveraged static analysis to dissect apps and what we
learnt.
3.1 Downloading Android Apps and Their
Meta-data
We crawled the Google Play web pages in July 2012 to create an
index of all the 171,493 apps that were visible to the US users,
among which 108,246 of them were free apps. We obtained the
metadata of these apps, including the app name, developer name,
ratings, number of downloads, etc. We also downloaded all the
binary files of free apps through an open-source Google Play API
[3]. Note that Google has strict restrictions on app purchase
frequency and limits the number of apps that can be purchased
with a single credit card. Because of these restrictions, we opted
to only download and analyze free apps in this work. Additional
analysis using similar method of our work can be applied to paid
apps as well.
3.2 Analyzing Apps’ Privacy-Related
Behaviors
We used static analysis tools given that they are more efficient
and easier to automate. We chose Androguard [53] as our major
static analysis instrument. Androguard is a Python based tool to
decompile Android apk files and to facilitate code analysis. We
focused our analysis on the top 11 most sensitive and frequently
used permission as identified earlier [19]. They are: INTERNET,
READ_PHONE_STATES, ACCESS_COARSE_LOCATION,
ACCESS_FINE_LOCATION, CAMERA, GET_ACCOUNTS,
SEND_SMS, READ_SMS, RECORD_AUDIO, BLUE_TOOTH
and READ_CONTACT. We created our own analysis scripts
with the Androguard APIs and identified the following
information related to apps’ privacy-related behaviors: 1)
permission(s) used by each app; 2) The classes and segments of
code involved in the use of permissions; 3) All the 3rd
-party
libraries included in the app; 4) Permissions required by each 3rd
-
party library. The analysis of 3rd-party libraries provided us more
semantic information of how users’ sensitive data were used and
to whom they were shared.
We obtained permission information of each app by parsing the
manifest file of each apk file. We further scanned the entire de-
compiled source code and looked for specific Android API calls
to determine the classes and functions involved in using these
permissions. We identified 3rd
-party libraries by looking up
package structures in the de-compiled source code. It is possible
that we may have missed a few libraries, though we are pretty
confident that we were able to correctly identify the vast majority
of them and in particular the most popular ones. For the sake of
simplicity, we did not distinguish between different versions of
the same third party library in our analysis. Similar to the
permission analysis step described above, the permission usage
of each 3rd-party library was determined by scanning through all
the Android standard API calls that relate to the target permission
in the de-compiled version of the library’s source code.
We further leveraged five Amazon EC2 M1 Standard Large
Linux instances to speed up our analysis of this large quantity of

202 Tenth Symposium On Usable Privacy and Security USENIX Association
4
apps. The total analysis required 2035 instance hours, i.e.
approximately 1.23 minutes per app. Among all the 108,246 free
apps, 89,903 of them were successfully decompiled (83.05%).
Upon manual inspection of a few failure examples, we observed
that failure to de-compile was primarily attributed to code
obfuscation.
In the static analysis, we identified over a thousand 3rd-party
libraries used by various apps. We looked up the top 400 3rd-
party libraries that are most frequently used in all these apps to
understand the purpose or functionality associated with each,
based on which we organized these 3rd-party libraries into 9
categories as detailed in Table 12
. These categories include
Targeted Advertising, Customized UI Components, Content
Host, Game Engine, Social Network Sites (SNS), Mobile
Analytics, Secondary Market, Payment and other Utilities. We
also analyzed how different types of resources (permissions) were
used for various purposes. For all the apps we analyzed, we
observed an average usage of 1.59 (σ = 2.82, median=1) 3rd-party
libraries in each app. There were some extreme cases where an
app used more than 30 3rd-party APIs. For example, the app with
the package name “com.wikilibs.fan_tatoo_design_for
_women_2” used 31 3rd-party libraries, 22 of which were
targeted advertising libraries, such as adwhirl, mdotm,
millenialmedia, tapjoy, etc. In the majority of cases (91.7%), apps
are bundled with less than or equal to 5 different 3rd-party
libraries. The targeted advertising libraries are found in more than
40% of these apps. SNS libraries achieved an average penetration
2
The library uses follows a power-law distribution, therefore, the
top 400 most popular libraries covered over 90% of uses.
of 11.2% of the app market, and mobile analytics libraries had an
average penetration of 9.8% of the app market.
In additional to these nine categories of sensitive data uses by
third parties, we also used “internal use” to label sensitive data
usages caused by the application itself rather than a library. It
should be noted that, for these internal uses, we currently cannot
determine why a certain resource is used (e.g., whether it is “for
navigation”, “for setting up a ringtone”, etc.). Based on existing
practices, the fact that the API call is within the app’s code rather
than in a 3rd party library indicates a high probability that the
resource is accessed because it is required by the mobile app itself
rather than to collect data on behalf of a third party.
Our static analysis provided a systems-oriented foundation for us
to better understand mobile apps in terms of their privacy-related
behaviors, which enabled us to study users’ preferences in regard
to these app behaviors in the later part of this paper. Note that,
although we only collected users’ preferences of 837 apps among
the apps we dissected as described in the following subsection,
the static analysis of 89,000 + apps was necessary for us to
understand the bigger picture of sensitive data uses and to identify
the nine categories of 3rd
-party libraries.
3.3 Crowdsourcing Users’ Mobile App
Privacy Preferences
To link users’ privacy preferences to these app behaviors we
identified through static analysis, we leveraged Amazon
Mechanical Turk (AMT) to collect users’ subjective responses
through a study similar what Lin et al. did in [13]. Participants
were shown the app’s icon, screen shots, and description of apps.
Participants were asked if they expected this app to access certain
type of private information and were also asked how comfortable
(from “-2” very uncomfortable to “+2” very comfortable) they
felt downloading this app given the knowledge that this app
accesses their information for the given purposes. Each HIT
(Human Intelligence Task) examined one app – permission –
purpose triple that we identified as described in the previous
section. For example, in one HIT, participants were asked to
express their level of comfort in letting Angry Birds (app) access
their precise location (permission) for delivering targeted ads
(purpose). We added one qualification question in each HIT,
asking participants to select from a list of three app categories, to
test whether they had read the app’s description and whether they
were paying attention to the questions. The template of the HIT
is shown in Appendix A.
In total we published 1200 HITs on AMT, probing 837 mobile
apps that we randomly sampled from the top 5000 most popular
free apps. For each HIT, we aimed to recruit 20 unique
Table 1. Nine categories of 3rd-party libraries
Type Examples Description
Utility Xmlparser,
hamcrest
Utility java libraries, such as
parser, sql connectors, etc
Targeted Ads admob,
adwhirl,
Provided by mobile behavioral
ads company to display in-app
advertisements
Customized UI
Components
Easymock,
kankan,
Customized Android UI
components that can be inserted
into apps.
Content Host Youtube,
Flickr
Provided by content providers
to deliver relevant image, video
or audio content to mobile
devices.
Game Engine Badlogic,
cocos2dx
Game engines which provide
software framework for
developing mobile games.
SNS Facebook,
twitter,
SDKs/ APIs to enable sharing
app related content on SNSs.
Mobile Analytics Flurry,
localytics
Provided by analytics company
to collect market analysis data
for developers.
Secondary
Market
Gfan, ximad,
getjar…
Libraries provided by other
unofficial Android market to
attract users.
Payment Fortumo,
paypal,
zong…
e-payment libraries
Table 2. Participants’ demographic summary
Education % Age Group %
High School 31% Under 21 11%
Bachelor
Degree 63% 21-35 69%
Graduate
Degree 6% 36-50 16%
51-65 3%
Gender % Over 65 1%
Female 41%
Male 59%
USENIX Association Tenth Symposium On Usable Privacy and Security 203
5
participants to answer our questions. Participants were paid $0.15
per HIT. We restricted our participants to U.S. smartphone users
with previous HIT approval rate higher than 90%.
The study ran for 3 weeks starting on June 15th, 2013. After the
data collection period, we first eliminated responses that failed
the qualification questions (~7%), and then we eliminated 39
HITs because they had less than 15 responses. This yielded a
dataset of 21,657 responses contributed by 725 AMT workers.
4. DESCRIPTIVE RESULTS
4.1 Participants
We collected demographic information of our participants
including gender, age and education background to help us
analyze our data, though we did not specifically control the
gender ratio or any other demographic composition of our
participants. Among these participants, 41% of them were female;
69% of participants were between 21 and 35, 16% of them are
between 36 and 50 (see Table 2). We also observed that more than
60% of the participants were reported to have a bachelor’s degree
or equivalent and 6% had a master’s degree or PhD. The average
education level of our participants was significantly higher than
the average education level of the entire U.S. population as
reported in [54]. Compared to the demographics of crowd
workers as reported in [55], our participant pool contains more
people with bachelor’s degrees and fewer with graduate degrees.
This difference in demographics may be caused by self-selection,
since usually crowd workers would be more likely to work on
HITs that interest them. However, other data collection methods,
such as Internet surveys, often have similar sampling problems.
While this sample bias has to be taken into account when
interpreting our results, we suspect that our study is no worse than
most others in terms of the representativeness of our participant
pool.
4.2 Users’ Average Preferences and Their
Variances
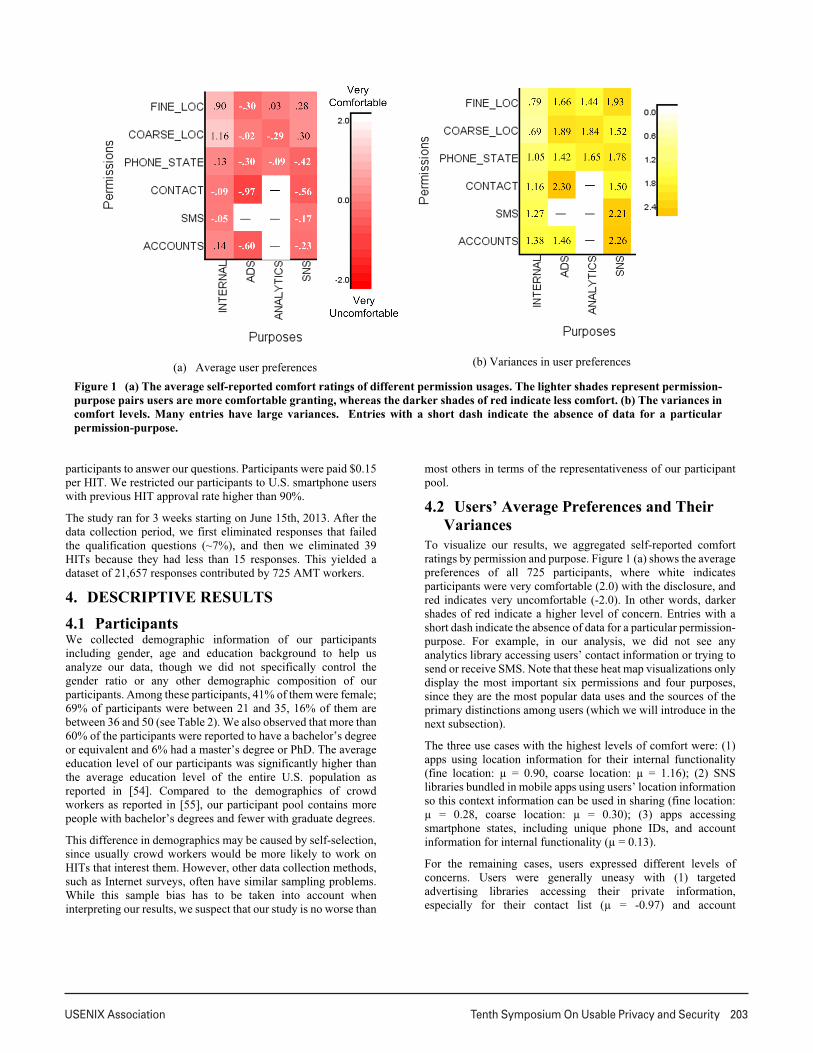
To visualize our results, we aggregated self-reported comfort
ratings by permission and purpose. Figure 1 (a) shows the average
preferences of all 725 participants, where white indicates
participants were very comfortable (2.0) with the disclosure, and
red indicates very uncomfortable (-2.0). In other words, darker
shades of red indicate a higher level of concern. Entries with a
short dash indicate the absence of data for a particular permission-
purpose. For example, in our analysis, we did not see any
analytics library accessing users’ contact information or trying to
send or receive SMS. Note that these heat map visualizations only
display the most important six permissions and four purposes,
since they are the most popular data uses and the sources of the
primary distinctions among users (which we will introduce in the
next subsection).
The three use cases with the highest levels of comfort were: (1)
apps using location information for their internal functionality
(fine location: µ = 0.90, coarse location: µ = 1.16); (2) SNS
libraries bundled in mobile apps using users’ location information
so this context information can be used in sharing (fine location:
µ = 0.28, coarse location: µ = 0.30); (3) apps accessing
smartphone states, including unique phone IDs, and account
information for internal functionality (µ = 0.13).
For the remaining cases, users expressed different levels of
concerns. Users were generally uneasy with (1) targeted
advertising libraries accessing their private information,
especially for their contact list (µ = -0.97) and account
(a) Average user preferences (b) Variances in user preferences
Figure 1 (a) The average self-reported comfort ratings of different permission usages. The lighter shades represent permission-
purpose pairs users are more comfortable granting, whereas the darker shades of red indicate less comfort. (b) The variances in
comfort levels. Many entries have large variances. Entries with a short dash indicate the absence of data for a particular
permission-purpose.

204 Tenth Symposium On Usable Privacy and Security USENIX Association
6
information3
(µ = -0.60); (2) SNS libraries that access their unique
unique phone ID (µ = -0.42), contact list (µ = -0.56), as well as
information related to their communication and web activities
such as SMS (µ = -0.17) and accounts (µ = -0.23); and (3) mobile
analytic libraries accessing their location (µ = -0.29) and phone
state4
(µ = -0.09).
This aggregation of data gave us a good starting point to spot
general trends in users’ privacy preferences. At the same time,
these are averages and, as such, they do not tell us much about the
diversity of opinions people might have. An important lesson we
learnt from previous literature of location privacy is that users’
privacy preferences are very diverse. To underscore this point, we
plotted the variances of user preferences of the same use cases, as
shown in Figure 1 (b). Here, darker shades of yellow indicate
higher variance among users’ comfort rating for different
purposes.
Figure 1 (b) shows that users’ preferences are definitely not
unified. Variances are larger than 0.6 (of a rating in a [-2, +2]
scale) in all cases. In 25% of cases, variances exceeded 1.8. Users’
disagreements were highest in the following cases, including: (1)
SNS libraries accessing users’ SMS information as well as their
accounts; (2) targeted advertising libraries accessing users’
contact list; (3) users’ location information being accessed by all
kinds of external libraries.
This high variance in users’ privacy preferences suggests that
having a single one-size-fits-all privacy setting for everyone may
not work well – at least for those settings with a high variance.
We cannot simply average the crowdsourced user preferences and
use them as default settings as suggested in [32]. This begs the
question of whether users could possibly be subdivided into a
small number of groups or clusters of like-minded individuals for
which such default settings (different settings in different groups)
could be identified. We discuss this idea in the next section.
5. LEARNING MOBILE APP PRIVACY
PREFERENCES
Given the large variances identified above, a unified default
setting evidently cannot satisfy all the users’ privacy preferences.
Therefore, we chose to investigate methods for segmenting the
entire user population into a number of subgroups that have
similar preferences within the subgroups. Then by identifying the
suitable default settings for each of these groups and the group
each user belongs to, we can suggest individual users with more
accurate default settings.
5.1 Pre-processing
To identify these groups, we need to properly encode each user’s
preferences into a vector and trim the dataset to prevent over-
fitting. More specifically, we conducted three kinds of
preprocessing before feeding the dataset into various clustering
algorithms. First, we eliminated participants who contributed less
than 5 responses to our data set, since it would be difficult to
categorize participants if we know too little about their
preferences. This step yielded a total number of 479 unique
participants with 20,825 responses. On average, each participant
3
GET_ACCOUNTS permission gives apps the ability to discover
existing accounts on managed by Android operating system without
knowing the passwords of these accounts.
contributed 43.5 responses (σ = 38.2, Median=52). Second, we
aggregated a participant’s preferences by averaging their
indicated comfort levels of letting apps use specific permissions
for specific purposes. “NA” is used if a participant did not have a
chance to indicate his/her preferences for a given permission-
purpose pair. Lastly, for each missing feature (“NA”), we found
the k (k=10) nearest neighbors that had the corresponding feature.
We then imputed the missing value by using the average of
corresponding values of their neighbor vectors.
After these preprocessing steps, we obtained a matrix of 77
columns (i.e. with regard to 77 permission-purpose pairs) and 479
rows, where each row of the matrix represented a participant.
Each entry of the matrix was a value between [-2, +2]. This
preference matrix was free of missing values.
5.2 Selection of Algorithms and Models
We opted to use hierarchical clustering with an agglomerative
approach to cluster participants’ mobile app privacy preferences.
In the general case, the time complexity of agglomerative
clustering is O(n3
) [56]. Though its time complexity is not as fast
as k-means or other flat clustering algorithms, we chose
hierarchical clustering mainly because its resulting hierarchical
structure is much more informative and more interpretable than
unstructured clustering approaches (such as k-means). More
specifically, we experimented with several distance measures
[56], including Euclidean distance, Manhattan distance [57],
Canberra Distance [58], and Binary distance [59]. We also
experimented with four agglomerative methods, including
Ward’s method [60], Centroid Linkage Method [61], Average
Linkage method [61], and McQuitty’s Similarity method [62].
We limited our exploration to the above-mentioned distance
functions and agglomerative methods, since other distance
functions or agglomerative methods either produce similar results
as the above-mentioned ones or are not appropriate for our tasks
based on the characteristics of our data. As research on clustering
techniques continues, it is possible that new techniques could
provide even better results than the ones we present. We found
however these techniques were already sufficient to isolate very
different categories of mobile apps, when it comes to their
permissions and the purposes associated with these permissions.
To select the best model, we experimented with various ways of
combining the four agglomerative methods and four distance
measures and also varied the number of clusters k from 2 to 20 by
using the R package “hclust” [63]. We conducted all the
experiments on a Linux machine which has XeonE5-2643
3.3GHz CPU (16 cores) and 32G memory. We had two selection
criteria in determining which combination of distance function
and agglomerative method to use. First, the combination should
not generate clusters with extremely skewed structures in
dendrograms. A dendrogram is a tree diagram frequently used to
illustrate the arrangement of the clusters produced by hierarchical
clustering. The tree structure in the dendrogram illustrate how
clusters merged in each iteration. We check this by heuristically
inspecting the dendrograms of each clustering result. The other
criteria is the combination of three internal measures, namely
connectivity [64], Silhouette Width [65] and Dunn Index [66].
4
READ_PHONE_STATE permission gives apps the ability to obtain
unique phone id and detect if the users is currently calling someone.

USENIX Association Tenth Symposium On Usable Privacy and Security 205
7
These three internal measures validate the clustering results based
on their connectivity, compactness and degree of separation.
5.3 Resulting Clusters
Based on the two criteria described in the previous sub-section,
we obtained the best clusters by using Canberra distance and
Average Linkage method with k=4.
Figure 2 illustrates the resulting dendrogram produced by the
above-mentioned clustering configurations, where four different
colors indicate the four clusters when k=4. Among the four
identified clusters, the largest one (colored in black in Figure 2)
includes 47.81% of instances, whereas the smallest cluster
(colored in red) includes 11.90% instances. We assigned a name
to each cluster based on its outstanding characteristics and
overlaid these names on the dendrogram as well. The explanation
of these names and the interpretation of our clustering results are
discussed in the following section.
6. RESULT INTERPRETATION
To make sense of what these clusters mean, we computed the
centroid of each cluster by averaging the feature vectors of
instances within the cluster. Note that we computed the centroid
of each cluster based on the non-imputed data points, i.e. only
averaging the entries when there were true values, since they
better estimate the true average preferences of users in each
category.
6.1 Making Sense of User Clusters
We used a heat map to visualize these clusters5
as shown in Figure
3 – Figure 6. The vertical dimension of these heat maps represents
the uses of different permissions, and the horizontal dimension
represents why a certain permission is requested. In each figure,
the left grids represent the centroid of the cluster. We use two
colors to indicate people’s preferences. White indicates that
participants feel comfortable with a given permission-purpose
whereas shades of red indicate discomfort, with darker shades of
red corresponding to greater discomfort. The right grids in each
figure show the corresponding variances within the cluster.
Compared to the variances in Figure 1, the variance of each
5
Again, in these visualizations, we only display the most important six
permissions and four purposes that strongly differentiate participants.
clusters are significantly smaller. Some of them are almost
negligible.
We have labeled each cluster with a name that attempts to
highlight its distinguishing characteristics. The labels are
(privacy) “conservatives”, “unconcerned”, “fence-sitters”, and
“advanced users”.
The (Privacy) Conservatives: Although conservatives form the
smallest group among the four clusters, they still represent 11.90%
of our participants (see Figure 3). Compared to the heat maps of
other clusters, this cluster (or “privacy profile”) has the largest area
covered in red and also the overall darkest shades of red (indicating
the lack of comfort granting permissions). In general, these
participants felt the least comfortable granting sensitive
information and functionality to third parties (e.g., location and
unique phone ID). They also felt uncomfortable with mobile apps
that want to access their unique phone ID, contacts list or SMS
functionality, even if for internal purposes only.
The Unconcerned: This group represents 23.34% of all the
participants and forms the second largest cluster in our dataset
(Figure 4). The heat map of this privacy profile has the largest
area covered in light color (indicate of comfort). In general,
participants who share this privacy profile showed a particularly
high level of comfort disclosing sensitive personal data under a
wide range of conditions, no matter who is collecting their data
and for what purpose. The only concerning (red) entry in the heat
map is when it comes to granting SNS libraries access to the
GET_ACCOUNTS permission (e.g. information connected to
accounts such as Google+, Facebook, YouTube). A closer
analysis suggests that it might even be an anomaly caused by the
lack of sufficient data points for this particular entry. Another
possible interpretation might be that a considerable portion of
participants did not understand the meaning of this permission
and mistakenly thought this permission gives apps ability to know
their passwords of all accounts
The Fence-Sitters: We labeled participants in this cluster as
"Fence-Sitters" because most of them did not appear to feel
strongly one way or the other about many of the use cases (Figure
5). This cluster represents nearly 50% of our population.
Unsurprisingly, this group of participants felt quite comfortable
letting mobile apps access sensitive personal data for internal
functionality purposes. When their information is requested by
3rd-party libraries such as for delivering targeted ads or
conducting mobile analytics, their attitude was close to neutral
(i.e. neither comfortable nor uncomfortable). This is reflected in
the heat map with large portions of it colored in light shades of
pink (close to the middle color in the legend). This group of
participants also felt consistently comfortable disclosing all types
of sensitive personal data to SNS libraries. Further research on
why so many participants behave in this way is challenging and
necessary. We suspect that this might be related to some level of
habituation or warning fatigue, namely they might have gotten
used to the idea that this type of information is being accessed by
mobile apps and they have not experienced any obvious problem
resulting from this practice.
This cluster of participants also reminds us of the privacy
pragmatist group identified by Westin in producing privacy
Figure 2. The resulting dendrogram produced by
hierarchical clustering with Canberra distance and average
linkage agglomerative method. Four different colors are
used to indicate the cluster composition when k=4. We also
overlay the cluster names on the dendrogram which will be
explained in Section 6.1.

206 Tenth Symposium On Usable Privacy and Security USENIX Association
8
indexes [67]. Westin found that while small numbers of users
would fall at both extremes of the spectrum (i.e. privacy
fundamentalist, and unconcerned), the majority of users tend to
be in-between (pragmatists). An interesting finding of our
analysis is that the preferences of these middle-of-the-road users
can generally be captured with just two profiles, namely the
“fence-sitters” and the “advanced users” (see next subsection).
The Advanced Users: The advanced user group represents
17.95% of the population (see Figure 6). This group of
participants appeared to have a more nuanced understanding of
what sorts of usage scenarios they should be concerned about. In
general, most of them felt comfortable with their sensitive data
being used for internal functionality and by SNS libraries. One
possible reason of why they felt okay with the latter scenario is
because they still have control over the disclosures, since these
SNS libraries often let people confirm sharing before transmitting
data to corresponding social network sites. In addition, this group
disliked targeted ads and mobile analytic libraries, but still felt
generally agreeable to disclosing context information at a coarser
level of granularity (i.e. coarse location). This observation again
suggests that this group of users have better insight when it comes
to assigning privacy risks to different usage scenarios.
6.2 Estimating the Predictive Power of the
Clusters
As discussed above, the clusters we have identified give rise to
significant drops in variance. Could these or somewhat similar
clusters possibly help predict many of the permission settings a
user would otherwise have to manually configure? Providing a
definite answer to this question is beyond the scope of this paper,
in part because our data captures preferences (or comfort levels)
rather than actual settings and in part also because answering such
a question would ultimately require packaging this functionality
in the form of an actual UI and evaluating actual use of the
resulting functionality. Below we limit ourselves to an initial
analysis, which suggests that the clusters we have identified have
promising predictive power and that similar clusters could likely
be developed to actually predict many permission settings – for
instance in the form of recommendations.
Figure 3. The centroid (left) and variances (right) of Privacy
Conservatives. This group of participants expressed the most
conservative preferences. They did not like their private
resources used by any external parties. Notice how much lower
the variances are relative to those in Figure 1.
Figure 4. The centroid (left) and variances (right) of the
unconcerned. This group of participants felt comfortable
disclosing their data to 3rd-parties for most cases.
Figure 5. The centroid (left) and variances (right) of the fence-
sitters. This is the largest cluster in our study. This group of
participants felt neutral to ads and mobile analytics. This group
also had the largest within-cluster variances.
Figure 6. The centroid (left) and variances (right) of advanced
users. This group of users were more selective in their privacy
preferences.

USENIX Association Tenth Symposium On Usable Privacy and Security 207
9
Specifically, as part of our analysis, we transformed the four
cluster centroids into four “privacy profiles” (i.e. sets of
recommendations) by quantizing the [-2, 2] comfort rating into
three options, namely “Accept” (average comfort rating higher
than or equal to 0.67), “Reject” (average comfort rating lower
than or equal to -0.67), and “Prompt” (average comfort rating
between -0.67 and +0.67 exclusively). In other words, in our
analysis, we assumed that “Accept” meant the corresponding
purpose-permission pair would be automatically granted.
Similarly a “Reject” value is interpreted as automatically denying
the corresponding permission-purpose pair. Cases with values
falling in between are simply assumed to result in a user prompt,
namely asking the user to decide whether to grant or deny the
corresponding permission-purpose pair. In short, under these
assumptions, a user would be assigned a profile, which in turn
would be used to automatically configure those permission-
purpose settings for which the profile has an “Accept” or “Reject”
entry, with the remaining settings having to be manually
configured by each individual user.
We now turn to our estimation of the potential benefits that could
be derived from using clusters and privacy profiles to help users
configure many of their app-permission-purpose settings. The
results presented here are based on assumptions made about how
one could possibly interpret the preferences we collected and treat
them as proxies for actual settings users would want to have.
While we acknowledge that an analysis under these assumptions
is not equivalent to one based on actual settings and that the
clusters and profiles one would likely derive from actual settings
would likely be somewhat different, we believe that the results
summarized below show promise both in terms of potential
predictive power and potential reductions in user burden.
We randomly split all the participants into 10 folds of (almost)
identical sizes. We then used each possible combination of 9 folds
of participants to compute cluster centroids and generate privacy
profiles (in terms of “Accept”, “Deny”, and “Prompt” for each
permission-purpose pair). The remaining fold of participants was
used to evaluate the benefits of the learned profiles – both in terms
of expected increase in accuracy and in terms of expected
reductions in user burden. We assumed that all testing participants
were able to choose a privacy profiles that closely captured their
preferences (which will be discussed in Subsection 6.3-6.4). We
averaged the following two metrics across all 10 runs:
(1) Accuracy: the percentage of time that the selected privacy
profile agreed with the comfort rating provided by each
individual participants in the testing group for each of the
app-permission-purpose triples available in the data set for
that user. (Figure 7).
(2) User burden: the percentage of time the participants in
testing sets would be prompted to specify their decisions,
weighted by the usages of all permission-purpose pairs
among all apps (Figure 8). These usages were measured by
calculating the percentage of apps in crowdsourcing study
(837 in total) that use a specific permission for a specific
purpose.
To evaluate the benefits of the profiles, we compare both of these
metrics, as obtained using our profiles, with identical metrics
obtained using a single one-size-fits-all grand profile for all users
(as shown in Fig. 1 (a)). This is referred to as “Grand average
profile”.
As can be seen in Figure 7, the profiles result in an overall
accuracy of nearly 80% (79.37%). In comparison predictions
based on a single one-size-fits-all model result in an accuracy of
merely 56%, which is not much better than simply prompting
users all the time. In particular, using our four profiles, accuracies
for people falling in the “unconcerned” and “conservative”
groups are higher than 85%.
Figure 8 shows how under our assumptions applying privacy
profiles as default settings could significantly reduce user burden.
In particular, when using a single- one-size-fits-all model, users
would on average have to be prompted for nearly 87% of all their
app-permission-purpose triples. In contrast, when using the four
privacy profiles, the number of prompts drops to 36.5% of the
user’s total number of app-permission-purpose triples. This
clearly represents a significant reduction in user burden. For users
falling in the “advanced” and “conservative” categories the
number of prompts drops below 20%. While we acknowledge that
further research is required, using actual permission settings
Figure 7. Compared to using a single one-size-fits-all grand
average profile to all participants, classifying participants
into four profiles can significantly increase the accuracy in
predicting if the system should grant , deny or prompt users
for a specific app-permission-purpose triple (55.82% vs.
79.37%). For two profiles (“unconcerned” and
“conservatives”) the prediction accuracies are higher than
85%. All numbers were averaged over 10 runs with different
partitions of training and testing data.
Figure 8. Choosing a good privacy profile reduces the user
configuration effort down to just 36.5% of all app-
permission-purpose triples, whereas users would need to
configure nearly 87% of the triples if one were to rely on a
single one-size-fits-all grand profile. For users in the
“advanced” and “conservative” categories, user burden
drops below 20%. All numbers were averaged over 10 runs
using different partitions of training and testing data and
were weighted by the usages of all permission-purpose pairs
among the 837 apps.
���يي
��ى��
��ي��
���ي�
��ي��
��ىي�
���� ����� ����� ����� �����و�����
DʼnĂ■ŕ !ōśʼnĂ┼ś
!▄▄ t ʼn◘ź╜▄śℓ
/◘■ℓśʼnĂĊ╜ōśℓ
Ü■ľ◘■ľśʼn■śŕ
!ŕōĂ■ľśŕ Üℓśʼnℓ
Cś■ľś�{ ╜ĊĊśʼnℓ
Accuracy
�ي���
����ى
���وو
���ىى
�و��و
�����
���� ����� ����� ����� ����� �����و
DʼnĂ■ŕ !ōśʼnĂ┼ś
!▄▄ t ʼn◘ź╜▄śℓ
/◘■ℓśʼnĂĊ╜ōśℓ
Ü■ľ◘■ľśʼn■śŕ
!ŕōĂ■ľśŕ Üℓśʼnℓ
Cś■ľś�{ ╜ĊĊśʼnℓ
User Burden

208 Tenth Symposium On Usable Privacy and Security USENIX Association
10
rather than measures of comfort levels, we believe that the results
of our analysis show great promise and warrant further work in
this area.
6.3 Do Demographics Matter?
Now we want to see how to assign users to the privacy profiles
that most closely capture their privacy preferences. Here we first
look at whether users’ demographic information – including
gender, age and education level – is sufficient to determine which
privacy profile a user should be assigned. This included looking
at the distribution of gender, age and education level in each user
cluster and also looking at variance (ANOVA) to see if there are
significant differences in these distributions.
In general, we found that in regard to the gender distribution, a
one-way analysis of variance yield NO significant differences
between groups, F(3, 475)=2.049, p=0.106. For age distribution,
we encoded the age groups as (1:= under 21, 2:= age 21-35,
3:=age 36-50, 4:=age 51-65, 5:=above 65) in our calculation. A
one-way analysis of variance reveals significant differences
between groups in regard to age distribution, F(3, 475)=4.598,
p=0.003. Post hoc analyses also reveals that the unconcerned
group on average are younger (µ = 1.69, σ = 0.57) than other
groups combined (µ = 1.91, σ = 0.76), and the advanced user
group on average are older (µ = 2.05, σ = 0.61) than other groups
combined (µ = 1.83, σ = 0.71).
We also performed a similar test on the education level of all four
groups of participants. We encoded the education levels such that
“1” stands for high school or lower level of education, “2” stands
for bachelor or equivalent level of degrees, and “3” stands for
master’s or higher level of degrees. An ANOVA test shows that
the effect of education level was strongly significant, F(3,
475)=7.52, p=6.3E-05. Post hoc analyses show that the
conservatives (µ = 1.65, σ = 0.48) and the unconcerned (µ = 1.67,
σ = 0.54) have lower education levels compared to the remaining
groups combined (µ = 1.85, σ = 0.57), and the advanced users (µ
= 2.01, σ = 0.60) are more likely to have a higher level of
education.
Although there are statistically significant effects in
demographics, a regression from demographic information to the
cluster label yields accuracy no better than directly putting every
user as Fence-Sitters. In other words, we should not directly use
gender, age, or education level to infer which privacy profile
should be applied to individual user. This does not mean however
that in combination with other factors, these attributes would not
be useful. Below, we seek more deterministic methods to assign
privacy profiles in the following sub-section.
6.4 Possible Ways to Assign Privacy Profiles
We start with a typical scenario where a privacy profile can be
assigned to a user. When a user boots up her Android device for
the first time (or possibly at a later time), the operating system
could walk her through a “wizard” and determine which privacy
profile is the best match for her. The profile could then be used to
select default privacy settings for this user. As the user downloads
apps on the smartphone, “App Ops” or some equivalent
functionality would then be able to automatically infer good
default settings for the user. The major challenge here is how we
can accurately determine which cluster this user belongs to
without any previous data about this user.
One possible way is to ask users to label a set of mobile apps. We
could present users with a small set of example apps together with
detailed descriptions such as the sensitive data collected by these
apps and for what purposes. Users could rate each app based on
its sensitive data usages. We could then classify users based on
these ratings. This would work well if we could identify a small
number of particularly popular apps that can differentiate between
users - say just asking people whether they feel comfortable
sharing their location with Angry Birds game for advertising
purpose and whether they feel comfortable posting their location
on Facebook through the Scope app. Further research on selecting
the most effective set of apps would make this process more
effective and stable.
Alternatively, we might probe users’ privacy preferences by
asking them a small set of general questions. Similar ideas have
been suggested for helping users set up their location sharing rules
[46] [48]. In particular Wilson et al. in [50] described a simple
wizard for the Locaccino system, where a small number of
questions were asked to guide users through the selection of good
default location sharing profiles. A similar method could be used
to identify a small number of questions to help determine
appropriate mobile app privacy profiles for individual users.
Given the four privacy profiles that we identified, we note several
observations that could be used to differentiate between different
groups of users. For example, the reported comfort ratings with
respect to sharing data with advertising agencies can be used to
separate the unconcerned group from the privacy conservatives
and the advanced users; we could use people’s preferences with
regard to sharing coarse location information for mobile analytics
to further differentiate between the latter two groups; or we can
isolate the privacy conservatives based on their extreme negative
comfort rating with SNS libraries. One should be able to identify
a small number of questions based on these or similar
observations. The ideal scenario would be that, based on their
answers to these questions, users could be accurately assigned to
the most appropriate cluster. For example, we can ask one
question with regard to targeted advertising, such as “How do you
feel letting mobile apps access your personal data for delivering
targeted ads?” or questions about mobile analytics, such as “How
do you feel about letting mobile apps share your approximate
location with analytics companies?” The exact wording and
expressions used in these questions would obviously need to be
refined based on user studies.
The privacy profiles we extracted are a good estimation but might
not perfectly match individual user preferences. It is necessary to
clarify that applying privacy profiles does not prevent users from
further personalizing their privacy decisions. In addition to
choosing an appropriate privacy profile as a starting point, users
could be provided with user-oriented machine learning
functionality or just interactive functionality that helps them
iteratively refine their settings [47-49].
7. DISCUSSION
7.1 Limitations of This Work
This work has several limitations. For example, our study focused
solely on free apps downloaded from the Google Play. Apps that
require purchase might exhibit slightly different privacy-related
behaviors with regard to what sensitive resources to request and
for what purpose. There are two major challenges that prevented
us to investigate paid apps: (a) the monetary cost of purchasing a
large number of paid apps would be substantial (we estimate over
$80K to get all the paid apps); (b) there is no way to
programmatically do batch purchasing on Google Play, since

USENIX Association Tenth Symposium On Usable Privacy and Security 209
11
Google limits the frequency of app purchases using a single credit
card in a single day. It should also be noted that free apps
represent the majority of app downloads, and paid apps tend to
request fewer permissions – in other words, they give rise to a
somewhat smaller number of privacy decisions. This being said,
there is no reason to believe that the models derived for free apps
could not be extended to paid apps – while people’s privacy
preferences might be different, there is no reason to believe that
similar clusters could not be identified.
In determining why certain sensitive resources are requested, our
study used a relatively coarse classification. Our static analysis
cannot give finer-grained explanations, such as requesting
location for navigation vs. requesting location for nearby search.
We acknowledge that our approach is not perfect. However,
comparing to a finer analysis relying on manual inspection, using
libraries to infer the purpose of permissions enables us to conduct
our analysis at large scale. Additional techniques could possibly
be developed over time to further increase accuracy. For example,
the tool described by Amini et al. [26] that combines
crowdsourcing and dynamic analysis might be able to provide this
level of details, through it has not been publicly available yet.
Among all the four clusters we identified, the Fence-Sitter cluster
has a relatively high variance. By using more advanced clustering
techniques better clusters could likely be generated with even
smaller intra-cluster variances. However, we consider the primary
contribution of this work is to demonstrate the feasibility of
profile-based privacy settings. As part of future work, we hope to
extend our data collection and experiments, such that we can
further refine our clusters and possibly obtain even better results.
7.2 Lessons Learned and Future Prospects
Users’ mobile app privacy preferences are not unified. This
paper quantitatively proved that mobile app users have diverse
privacy preferences. This suggested that simply crowdsourcing
people’s average preferences as suggested by Agarwal and Hall
in the PMP privacy settings [32] might not be optimal. In spite of
the diversity, we also show that there are a relatively small
number of groups of like-minded users that share many common
preferences. Using these identified groups, we derived mobile app
privacy preferences profiles, find for each user a profile that is a
close match, and use this information to automate the privacy
setting process.
Purpose is more important. Previous work in mobile app
analysis as well as on users’ privacy concerns focused more on
identifying the what sensitive information is accessed by apps
[17, 42] as well as how often sensitive information is shared with
external entities [43]. Lin et al. [13] pointed out the purpose of
why sensitive resources are used is important for users to make
privacy decision, though they did not quantitative backup this
statement. Our work provides crucial evidence to support this
statement. The clusters we identified in our participants are more
differentiated in the dimension of why these resources are
accessed. This finding also provides important implications to
privacy interface design in the sense that properly informing users
the purposes of information disclosures are at least as important
as informing them what information is disclosed. Unfortunately,
the current privacy interfaces, such as the Google Play’s
permission list, fall short in making good explanation of the
purposes. We strongly suggest mobile app market owners to
consider notifying this important information to their customers.
Make use of the naturally crowdsourced data. In our study, we
use Amazon Mechanical Turk as the major platform to collect
users’ privacy preferences. In reality, given the availability of
“App Ops” in Android 4.3, “ProtectMyPrivacy” on jailbroken
iPhone, or other similar extensions in rooted Android devices, the
operating system or the third-party privacy managers could
naturally crowdsource users’ privacy preferences without extra
effort. These valuable datasets also presumably have better user
coverage and are more representative than what we can collect
with the limited resources we have. A significant portion of the
methodologies discussed in this work can be directly applied to
these dataset to build models of mobile users in the wild. We
encourage industry to make fully uses of the findings we present
in this paper to make real impact in providing users with better
privacy controls.
In short, the findings that we present provide important lessons
about mobile app users, and also point out a way to make privacy
settings potentially usable to end users. However, there is still
much work that needs to be done to model users’ privacy
preferences. We are also aware that users’ privacy preferences
might keep on evolving and are influenced by the introduction of
new technologies and the habituation effect that formed through
interacting with the same practices for a long time. Therefore, in
addition to all the techniques we proposed, we believe other
prospects such as proper user education, improving and enforcing
laws and regulations are also crucial and need to be promoted in
the long run.
8. CONCLUSION
This paper complements existing mobile app privacy research by
quantitatively linking apps’ privacy related behaviors to users’
privacy preferences. We utilized the static analysis with specific
focus on how and why 3rd-party libraries use different sensitive
resources and leveraged crowdsourcing to collect privacy
preferences of over 700 participants with regard to over 800 apps.
Based on the collected data, we identified four distinct privacy
profiles, providing reasonable default settings to help users
configure their privacy settings. Initial results intended to
estimate the benefits of these profiles suggest that they could
probably be used to significantly alleviate user burden, by helping
predict many of a user’s mobile app privacy preferences. Under
our proposed approach, users would still be prompted when the
variance of the predictions associated with an entry in a given
profile exceeds a certain threshold. More sophisticated learning
techniques could possibly further boost the accuracy of such
predictions.
9. ACKNOWLEDGEMENTS
This research was supported in part by the National Science
Foundation under grants CNS-1012763, CNS-1330596, CNS-
1228813 and CNS-0905562, by CyLab under grants DAAD19-
02-1-0389, by Army Research Office under W911NF-09-1-0273,
by Carnegie Mellon Portugal ICTI 1030348, and by Google.

210 Tenth Symposium On Usable Privacy and Security USENIX Association
12
10. REFERENCES
[1] Wikipedia App Store (iOS). Available:
http://en.wikipedia.org/wiki/App_Store_(iOS)
[2] Wikipedia Google Play. Available:
http://en.wikipedia.org/wiki/Google_Play
[3] Burguera, I., Zurutuza, U. and Nadjm-Tehrani, S.
Crowdroid: behavior-based malware detection system for
Android. In Proc. of the SPSM, 2011.
[4] Felt, A. P., Finifter, M., Chin, E., Hanna, S. and Wagner, D.
A survey of mobile malware in the wild. In Proc. of the
SPSM, 2011.
[5] Kelley, P. G., Consolvo, S., Cranor, L. F., Jung, J., Sadeh, N.
and Wetherall, D. A Conundrum of permissions: Installing
Applications on an Android Smartphone. In Proc. of the
USEC, 2012.
[6] Felt, A. P., Ha, E., Egelman, S., Haney, A., Chin, E. and
Wagner, D. Android Permissions: User Attention,
Comprehension, and Behavior. In Proc. of the Soups, 2012.
[7] Kelley, P. G., Cranor, L. F. and Sadeh, N. Privacy as part of
the app decision-making process. In Proc. of the
Proceedings of the SIGCHI Conference on Human Factors
in Computing Systems, 2013.
[8] Beresford, A., Rice, A. and Sohan, N. MockDroid: trading
privacy for application functionality on smartphones. In
Proc. of the HotMobile, 2011.
[9] Hornyack, P., Han, S., Jung, J., Schechter, S. and Wetherall,
D. These aren't the droids you're looking for: retrofitting
android to protect data from imperious applications. In
Proc. of the CCS, 2011.
[10] Zhou, Y., Zhang, X., Jiang, X. and Freech, V. W. Taming
Information-Stealing Smartphone Applications (on
Android). In Proc. of the TRUST, 2011.
[11] Lunden, I. U.S. Consumers Avg App Downloads Up 28%
To 41; 4 Of 5 Most Popular Belong To Google. Available:
http://techcrunch.com/2012/05/16/nielsen-u-s-consumers-
app-downloads-up-28-to-41-4-of-the-5-most-popular-still-
belong-to-google/
[12] Liu, B., Lin, J. and Sadeh, N. Reconciling Mobile App
Privacy and Usability on Smartphones: Could User Privacy
Profiles Help? In Proc. of the WWW'14, 2014.
[13] Lin, J., Amini, S., Hong, J., Sadeh, N., Lindqvist, J. and Joy
Zhang. Expectation and Purpose: Understanding Users'
Mental Models of Mobile App Privacy through
Crowdsourcing. In Proc. of the Ubicomp'12, 2012.
[14] Enck, W. Defending Users against Smartphone Apps:
Techniques and Future Directions. City, 2011.
[15] Enck, W., Ongtang, M. and McDaniel, P. On lightweight
mobile phone application certification. In Proc. of the CCS,
2009.
[16] Enck, W., Octeau, D., McDaniel, P. and Chaudhuri, S. A
Study of Android Application Security. In Proc. of the
USENIX Security Symposium, 2011.
[17] Enck, W., Gilbert, P., Chun, B.-G., Cox, L., Jung, J.,
McDaniel, P. and Sheth, A. TaintDroid: An Information-
Flow Tracking System for Realtime Privacy Monitoring on
Smartphones. In Proc. of the OSDI 2010.
[18] Chin, E., Felt, A. P., Greenwood, K. and Wagner, D.
Analyzing inter-application communication in Android. In
Proc. of the MobiSys, 2011.
[19] Felt, A. P., Chin, E., Hanna, S., Song, D. and Wagner, D.
Android permissions demystified. In Proc. of the CCS,
2011.
[20] Felt, A. P., Greenwood, K. and Wagner, D. The
effectiveness of application permissions. In Proc. of the
USENIX conference on Web application development,
2011.
[21] Felt, A. P., Wang, H. J., Moshchuk, A., Hanna, S. and Chin,
E. Permission re-delegation: attacks and defenses. In Proc.
of the USENIX conference on Security, 2011.
[22] Vidas, T., Christin, N. and Cranor, L. Curbing android
permission creep. Proceedings of the Web, vol. 2, 2011.
[23] App Profiles. Available:
https://play.google.com/store/apps/details?id=com.appdescr
iber&feature=search_result#?t=W251bGwsMSwxLDEsIm
NvbS5hcHBkZXNjcmliZXIiXQ..
[24] Thurm, S. and Kane, Y. I. Your Apps are Watching You.
WSJ, 2011.
[25] Barrera, D., Kayacik, H. G., Oorschot, P. C. v. and
Somayaji, A. A methodology for empirical analysis of
permission-based security models and its application to
android. In Proc. of the CCS, 2010.
[26] Amini, S., Lin, J., Hong, J., Lindqvist, J. and Zhang, J.
Mobile Application Evaluation Using Automation and
Crowdsourcing. In Proc. of the PETools, 2013.
[27] Chin, E., Felt, A. P., Sekar, V. and Wagner, D. Measuring
user confidence in smartphone security and privacy. In
Proc. of the Proceedings of the Eighth Symposium on
Usable Privacy and Security, 2012.
[28] Felt, A. P., Egelman, S. and Wagner, D. I've Got 99
Problems, But Vibration Ain't One: A Survey of
Smartphone Users' Concerns. In Proc. of the SPSM, 2012.
[29] Verduzco, W. App Ops Brings Granular Permissions
Control to Android 4.3. Available: http://www.xda-
developers.com/android/app-ops-brings-granular-
permissions-control-to-android-4-3/
[30] Amadeo, R. App Ops: Android 4.3's Hidden App
Permission Manager, Control Permissions for Individual
Apps! . Available:
http://www.androidpolice.com/2013/07/25/app-ops-
android-4-3s-hidden-app-permission-manager-control-
permissions-for-individual-apps/
[31] LBE LBE Privacy Guard. Available:
https://play.google.com/store/apps/details?id=com.lbe.secu
rity.lite&hl=en
[32] Agarwal, Y. and Hall, M. ProtectMyPrivacy: detecting and
mitigating privacy leaks on iOS devices using
crowdsourcing. In Proc. of the Proceeding of the 11th
annual international conference on Mobile systems,
applications, and services, 2013.
[33] Jeon, J., Micinski, K. K., Vaughan, J. A., Reddy, N., Zhu,
Y., Foster, J. S. and Millstein, T. Dr. Android and Mr.
Hide: Fine-grained security policies on unmodified
Android. 2012.
[34] Nauman, M., Khan, S. and Zhang, X. Apex: extending
Android permission model and enforcement with user-
defined runtime constraints. In Proc. of the ASIACCS,
2010.
[35] Pearce, P., Felt, A. P., Nunez, G. and Wagner, D. AdDroid:
privilege separation for applications and advertisers in
Android. In Proc. of the ASIACCS, 2012.
[36] Egelman, S., Felt, A. P. and Wagner, D. Choice
Architecture and Smartphone Privacy: There's a Price for
That. In Proc. of the WEIS, 2012.

USENIX Association Tenth Symposium On Usable Privacy and Security 211
13
[37] Choe, E. K., Jung, J., Lee, B. and Fisher, K. Nudging
People Away From Privacy-Invasive Mobile Apps Through
Visual Framing. In Proc. of the Interact, 2013.
[38] HFEDERMAN NTIA User Interface Mockups. Available:
http://www.applicationprivacy.org/2013/07/25/ntia-user-
interface-mockups/
[39] NTIA Privacy Multistakeholder Process: Mobile
Application Transparency. Available:
http://www.ntia.doc.gov/other-publication/2013/privacy-
multistakeholder-process-mobile-application-transparency
[40] Balebako, R., Shay, R. and Cranor, L. F. Is Your Inseam a
Biometric? Evaluating the Understandability of Mobile
Privacy Notice Categories. CMU-CyLab-13-011, Carnegie
Mellon University, 2013.
[41] Felt, A. P., Egelman, S., Finifter, M., Akhawe, D. and
Wagner, D. How to Ask for Permission. In Proc. of the
HotSec, 2012.
[42] Jung, J., Han, S. and Wetherall, D. Short paper: enhancing
mobile application permissions with runtime feedback and
constraints. In Proc. of the SPSM, 2012.
[43] Balebako, R., Jung, J., Lu, W., Cranor, L. F. and Carolyn
Nguyen. "Little Brothers Watching You:" Raising
Awareness of Data Leaks on Smartphones. In Proc. of the
SOUPS, 2013.
[44] Frank, M., Ben, D., Felt, A. P. and Song, D. Mining
Permission Request Patterns from Android and Facebook
Applications. In Proc. of the Data Mining (ICDM), 2012
IEEE 12th International Conference on, 2012.
[45] Lin, J., Xiang, G., Hong, J. I. and Sadeh, N. Modeling
people's place naming preferences in location sharing. In
Proc. of the UbiComp, 2010.
[46] Ravichandran, R., Benisch, M., Kelley, P. G. and Sadeh, N.
Capturing Social Networking Privacy Preferences. Can
Default Policies Help Alleviate Tradeoffs between
Expresiveness and User Burden? In Proc. of the the
Privacy Enhancing Technologies Symposium, 2009.
[47] Cranshaw, J., Mugan, J. and Sadeh, N. User-Controllable
Learning of Location Privacy Policies with Gaussian
Mixture Models. In Proc. of the AAAI, 2011.
[48] Mugan, J., Sharma, T. and Sadeh, N. Understandable
Learning of Privacy Preferences Through Default Personas
and Suggestions. Carnegie Mellon University CMU-ISR-
11-112,, 2012.
[49] Kelley, P. G., Drielsma, P. H., Sadeh, N. and Cranor, L. F.
User-controllable learning of security and privacy policies.
In Proc. of the Proceedings of the 1st ACM workshop on
Workshop on AISec, 2008.
[50] Wilson, S., Cranshaw, J., Sadeh, N., Acquisti, A., Cranor,
L. F., Springfield, J., Jeong, S. Y. and Balasubramanian, A.
Privacy Manipulation and Acclimation in a Location
Sharing Application. In Proc. of the Ubicomp, 2013.
[51] Benisch, M., Kelley, P., Sadeh, N. and Cranor, L. Capturing
location-privacy preferences: quantifying accuracy and
user-burden tradeoffs. Personal and Ubiquitous
Computing, 2010.
[52] Sadeh, N., Hong, J., Cranor, L., Fette, I., Kelley, P.,
Prabaker, M. and Rao, J. Understanding and Capturing
People's Privacy Policies in a Mobile Social Networking
Application. The Journal of Personal and Ubiquitous
Computing, 2009.
[53] Androguard. Available:
http://code.google.com/p/androguard/
[54] Bereau, U. S. C. Educational Attainment. Available:
http://www.census.gov/hhes/socdemo/education/index.html
[55] Ross, J., Irani, L., Silberman, M. S., Zaldivar, A. and
Tomlinson, B. Who are the crowdworkers?: shifting
demographics in mechanical turk. In Proc. of the CHI '10
Extended Abstracts, 2010.
[56] Manning, C. D., Raghavan, P. and Schutze, H. Hierarchical
Clustering. Cambridge University Press, City, 2008.
[57] Krause, E. F. Taxicab Geometry. Dover. ISBN 0-486-
25202-7, 1987.
[58] Lance, G. N. and Williams, W. T. Computer programs for
hierarchical polythetic classification (`similarity analyses').
The Computer Journal, vol. 9, pp. 60-64, 1966.
[59] Hamming, R. Error Detecting and Error Correcting Codes.
Bell System Technical Journal, vol. 26, pp. 147-160, 1950.
[60] Ward, J. H. Hierarchical Grouping to Optimize an
Objective Function. Journal of the American Statistical
Association, vol. 58, pp. 236-244, 1963.
[61] Szekely, G. J. and Rizzo, M. L. Hierarchical Clustering via
Joint Between-Within Distances: Extending Ward's
Minimum Variance Method. Journal of Classification, vol.
22, pp. 151-183, 2005/09/01 2005.
[62] McQuitty, L. L. similarity Analysis by Reciprocal Pairs for
Discrete and Continuous Data. Educational and
Psychological Measurement, vol. 26, pp. 825-831, 1966.
[63] R Hierarchical Cluster Analaysis. Available:
http://stat.ethz.ch/R-manual/R-
patched/library/stats/html/hclust.html
[64] Handl, J., Knowles, J. and Kell, D. B. Computational
cluster validation in post-genomic data analysis.
Bioinformatics, vol. 21, pp. 3201-3212, 2005.
[65] Rousseeuw, P. Silhouettes: A graphical aid to the
interpretation and validation of cluster analysis. Journal of
Computational and Applied Mathematics, vol. 20, pp. 53-
65, 1987.
[66] Dunn, J. C. Well separated clusters and optimal fuzzy-
partitions. Journal of Cybernetics, vol. 4, pp. 95-104, 1974.
[67] Kumaragura, P. and Cranor, L. F. Privacy Indexes: A Surey
of Westin's Studies. CMU-ISRI-05-138, Carneigie Mellon
University, 2005.

212 Tenth Symposium On Usable Privacy and Security USENIX Association
14
APPENDIX A.
Template of Amazon Mechanical Turk Task
Please read the description carefully and answer the questions
below. HIT will be rejected if you just click through.
[app name][app icon]
Developer: [developer name]
Average rating: [rating] / 5.0
Rating count: [count]
Description: [description text copied from Google Play]
[App Screenshot from Google Play #1]
[App Screenshot from Google Play #2]
[App Screenshot from Google Play #3]
You must ACCEPT the HIT before you can answer questions.
Have you used this app before? (Required)
a. Yes
b. No
What category do you think this mobile app belongs to?
(Required)
a. [Candidate category #1]
b. [Candidate category #2]
c. [Candidate category #3]
Suppose you have installed [app name] on your Android device,
would you expect it to access your [describing permission in plain
English]? (Required)
a. Yes
b. No
Based on our analysis, [app name] accesses user's [describing
permission in plain English] for [explaining purpose]. Assuming
you need an app with similar function, would you feel
comfortable downloading this app and using it on your phone?
(Required)
a. Most comfortable
b. Somewhat comfortable
c. Somewhat uncomfortable
d. Very uncomfortable
Please provide any comments you may have below, we appreciate
your input!
[text box]