modeling using functions: canadian household mobile
TRANSCRIPT

Last Name: ________________ First Name: __________________ Student ID #: ____________________
Modeling using functions: Communications Services in Canadian Households – Subscriptions © Ana Duff; CC BY-NC-SA Page 1 of 9
Modeling using functions:
Canadian household mobile subscription rates: trends, models and predictions
PROJECT OVERVIEW
Objective:
The objective of this project is to apply knowledge and understanding of fundamental characteristics of basic functions and their transformations in order to create plausible models of data sets and study their behaviour. Specifically, you will investigate the data compiled by Canadian Radio-television and Telecommunications Commission on Canadian landline and mobile service subscribers per 100 households, with focus on households with a mobile subscription.
Project submission must be the result of individual work. Consultation with others, providing work to another person or using someone else’s work, in part or in whole, are not allowed in this project. All questions and requests for guidance must be directed to the course instructor during office hours or by e-mail, or the teaching assistants during their office hours.
Deliverable: This document, completed in Microsoft Word format (Equation tool must be used for mathematical expressions) with answers to questions provided sequentially as they are posed throughout the Tasks list.
Submissions must demonstrate your
• understanding of major characteristics of basic functions and their transformations, • application of mathematical analysis skills to create plausible models of data sets and study their
behavior, and • employment of communication skills in support of choices, decisions and predictions
The product must demonstrate all tasks have been completed (see next section) and must include answers to all questions posed within the tasks, justified fully using mathematical analysis techniques (algebra, functions and calculus) and supported through visual representations (relevant data tables; images of graphs created through Desmos).
Submission requirements: • Submission must be in form of a single document in PDF format, stating clearly author’s student ID
number, last name and first name at the top of every page. • The document must be submitted through Canvas by posted deadline.
IMPORTANT: Save your work and save it often. By registering with Desmos, you will be able to save your work for later. If you prefer not to register, you can save your work by creating and saving a link to the last state of your graph in Desmos through Share Graph tool.
☐ I have read and understood the information above (check the box to confirm)
Attribution: Data used in this project is provided by Government of Canada under Open Government Licence – Canada (https://open.canada.ca/en/open-government-licence-canada)

Last Name: ________________ First Name: __________________ Student ID #: ____________________
Modeling using functions: Communications Services in Canadian Households – Subscriptions © Ana Duff; CC BY-NC-SA Page 2 of 9
Last Name: ________________ First Name: __________________ Student ID #: ____________________
Modeling using functions: Communications Services in Canadian Households – Subscriptions © Ana Duff; CC BY-NC-SA Page 3 of 9
TASKS
Sourcing the data
1. Retrieving the data
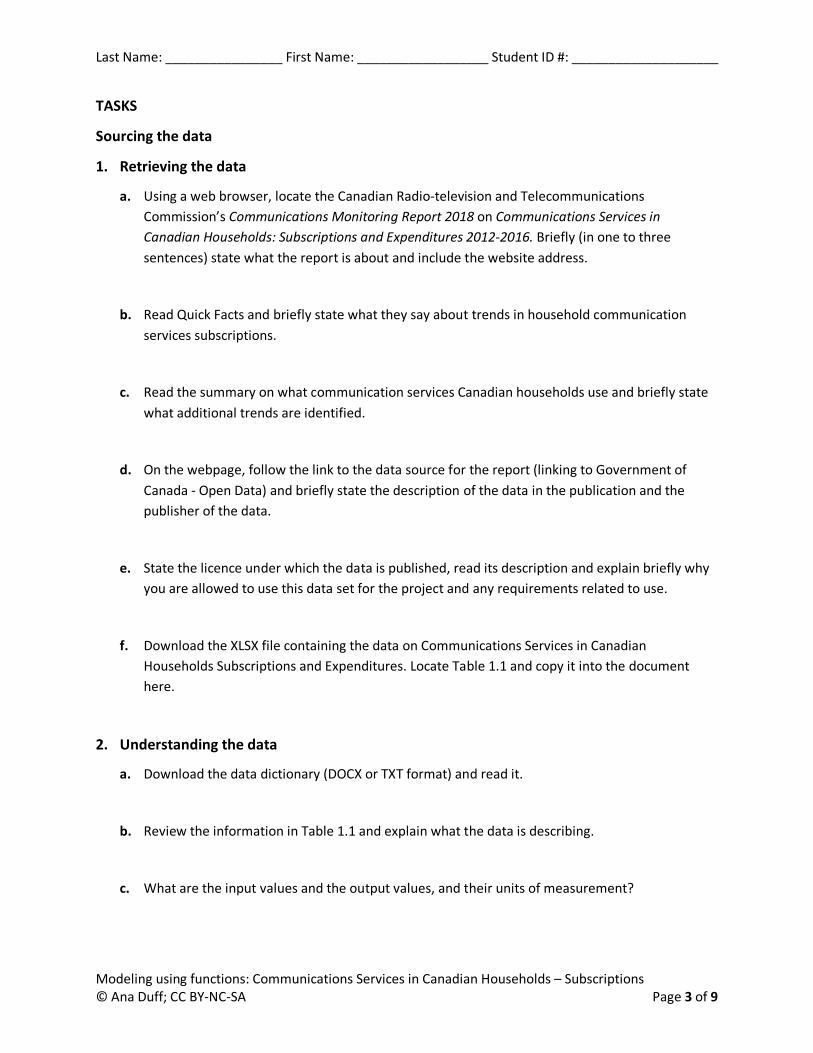
a. Using a web browser, locate the Canadian Radio-television and Telecommunications Commission’s Communications Monitoring Report 2018 on Communications Services in Canadian Households: Subscriptions and Expenditures 2012-2016. Briefly (in one to three sentences) state what the report is about and include the website address.
b. Read Quick Facts and briefly state what they say about trends in household communication services subscriptions.
c. Read the summary on what communication services Canadian households use and briefly state what additional trends are identified.
d. On the webpage, follow the link to the data source for the report (linking to Government of Canada - Open Data) and briefly state the description of the data in the publication and the publisher of the data.
e. State the licence under which the data is published, read its description and explain briefly why you are allowed to use this data set for the project and any requirements related to use.
f. Download the XLSX file containing the data on Communications Services in Canadian Households Subscriptions and Expenditures. Locate Table 1.1 and copy it into the document here.
2. Understanding the data
a. Download the data dictionary (DOCX or TXT format) and read it.
b. Review the information in Table 1.1 and explain what the data is describing.
c. What are the input values and the output values, and their units of measurement?

Last Name: ________________ First Name: __________________ Student ID #: ____________________
Modeling using functions: Communications Services in Canadian Households – Subscriptions © Ana Duff; CC BY-NC-SA Page 4 of 9
d. What appear to be trends in the data, if any? Are there any holes or inconsistencies in the data and, if yes, how can they be explained?
e. Select the rows and columns containing the data (including the headings) and use the Excel Charts tool to create a scatter plot of the data. Give it a title, add axis titles and copy it here.
f. Briefly provide your prediction for each of the categories as many years pass. Which mathematical concept describes this process?
Modeling the data for household mobile subscription rates
3. Choosing the model
a. Create a new Excel spreadsheet containing the Mobile subscription data from Table 1.1. Change the Year column heading to Years since 2004 and update the data in the column accordingly.
b. Open a new graph in the Desmos Graphing Calculator and copy the data into the first line. Rename the independent and dependent variable in the Desmos table to 𝑡" and 𝑀", respectively. Using the Graph Settings tool (wrench icon in top right corner), add arrows and label the axes appropriately. Using the Share Graph tool (top right corner), export and insert the image of the resulting graph below. Reduce its dimensions to 2’’ in height.
c. What type of function do you think might model the data reasonably well and why? Describe the characteristics of that function type that match the apparent behavior of the data.
d. Which transformations you expect must be applied to the basic type of that function to obtain the function that models the data reasonably well?
e. State the general form of the function 𝑀(𝑡) for the household mobile subscription rate 𝑡 years from 2004 that you believe would best model the data.
4. Creating the model function using regression
a. Go to Help tool (? icon) and run the Regression Tour. If needed, go to Video Tutorials and watch a video on Regressions.
☐ I completed the Regression Tour (check the box to confirm)

Last Name: ________________ First Name: __________________ Student ID #: ____________________
Modeling using functions: Communications Services in Canadian Households – Subscriptions © Ana Duff; CC BY-NC-SA Page 5 of 9
b. Using what you learned about creating the regression models using Desmos, create the regression model using the type of function you chose above. Using the Share Graph tool (top right corner), export and insert the image of the resulting graph below, resizing it to 2’’ in height.
c. Using the regression function parameters given by Desmos, write below the function 𝑀(𝑡) represented by that regression model.
d. Does this model provide a reasonable model for the data and why?
e. Using the Share Graph tool (top right corner), copy below the link to your graph.
5. Adjusting the model as necessary by considering context
a. Do you think that, over time, all of the Canadian households will have a mobile subscription, and why? Make a prediction for % of households that will have a mobile subscription as years pass.
b. Looking at the regression function 𝑀(𝑡) that models the rate of household mobile subscriptions data over time since 2004, how does that model match with your prediction, both by looking at the graph of the function and by analyzing the function using mathematical analysis techniques (hint: limits)?
c. Which parameter would have to change in the function 𝑀(𝑡) to match it with your prediction, why, and to what value?
d. Recreate the model using Desmos with this change. Using the Share Graph tool (top right corner), export and insert the image of the resulting graph below, resizing it to 2’’ in height.
e. Does the new regression function appear to model well the known data, while agreeing with your prediction? Briefly explain your reasoning.
f. If applicable, change the parameters in 𝑀(𝑡) to reflect the revised regression model and write the new formula for 𝑀(𝑡) below.

Last Name: ________________ First Name: __________________ Student ID #: ____________________
Modeling using functions: Communications Services in Canadian Households – Subscriptions © Ana Duff; CC BY-NC-SA Page 6 of 9
g. Using the Share Graph tool (top right corner), copy below the link to your graph.
6. Adjusting the model as necessary by considering additional information
a. Consider the data on household mobile subscriptions prior to 2004. Download the data from the 1997 – 2009 Survey of household spending on household equipment from Open Canada. Open the CSV file and use the following filters (Data – Filter Excel tool) to retrieve the data on Canadian household mobile subscription rates:
• GEO: Canada
• Household equipment: Households having a cellular telephone
• UOM: Percent
Copy the resulting table below.
b. Does this data match the data you already have on household mobile subscription rates for years 2004 to 2016? Briefly state what might explain the discrepancies, if any.
c. Add the data for 1997 to 2003 to your table containing household mobile subscription rates for 2004 to 2016, making sure that you enter the appropriate values in the Years since 2004 column. Copy the new data table below.
d. Copy the new data set to a new line in the existing Desmos graph containing your work on household mobile subscription rates. Using the Share Graph tool (top right corner), export and insert the image of the resulting graph below, resizing it to 2’’ in height.
e. Does the regression function 𝑀(𝑡) you used to model household subscription rates appear to model well the expanded data set? Briefly explain your reasoning.
f. Create a new regression model that incorporates the expanded data set and models your prediction for mobile subscription rates as years pass. Using the Share Graph tool (top right corner), export and insert the image of the resulting graph below, resizing it to 2’’ in height.
g. Consider the history of cellular phone use, particularly in Canada, by reading Complete Visual History of Cellphones and Cellphones mark 30 years in Canada. Which of the two models you created would be a better reflection of the trends since the introduction of mobile phones to Canadian society, and why?

Last Name: ________________ First Name: __________________ Student ID #: ____________________
Modeling using functions: Communications Services in Canadian Households – Subscriptions © Ana Duff; CC BY-NC-SA Page 7 of 9
h. If applicable, change the parameters in 𝑀(𝑡) to reflect the revised regression model and your long term predictions, and write the new formula for 𝑀(𝑡) below.
i. Using the Share Graph tool (top right corner), copy below the link to your graph.
Making predictions
7. Household mobile subscription rates
a. Using the model you developed for household mobile subscription rates, predict the percentage of households that will have a mobile subscription in year 2025, in 2030 and in 2050. Show your calculations.
b. What are the projected rates of change in the household mobile subscription rates in 2025, in 2030 and in 2050? Show your calculations and interpret the results.
c. Considering the impact the development of cell phones had on landline subscriptions starting 30 years ago, how likely is that your model’s prediction for household mobile subscription rates and their growth in 2050 and beyond is accurate, and why?
8. Modeling the number of households with mobile subscriptions
a. To obtain the data on number of Canadian households over years since 2004, follow the link to the Statistics Canada data on Distributions of household economic accounts, number of households, by income quintile and by socio-demographic characteristic. Click on Add/Remove reference period and change the reference period to years 2004 to 2016. Click on Apply, then Download options, then CSV Download as displayed (excluding accompanying symbols).
Change the text in the Income Quintile cell to Years since 2004 and fill the rest of the cells in the row accordingly. In the row below, enter Number of Canadian households (in millions) and fill the row for each year since 2004 using the data in the All quintiles row, dividing it by a million. Select the two rows and create the scatter chart representing the number of Canadian households (in millions) in the years since 2004. Add the horizontal axis title and copy the chart below.
b. Looking at the data, what type of function would best model the trend in the number of Canadian households since 2004? Describe the characteristics of that function type that match the apparent behavior of the data.

Last Name: ________________ First Name: __________________ Student ID #: ____________________
Modeling using functions: Communications Services in Canadian Households – Subscriptions © Ana Duff; CC BY-NC-SA Page 8 of 9
c. State the general form of the function 𝐻(𝑡) for the number of Canadian households 𝑡 years from 2004 that you believe would best model the data.
d. Add a trendline to the chart in Excel that reflects your choice of the model type and display the equation for 𝐻(𝑡) on the chart. Write below this equation.
e. What does 𝐻(𝑡) tell you about the rate of change in the number of Canadian households?
f. Using your models 𝑀(𝑡) and 𝐻(𝑡) for the household mobile subscription rates and the number of Canadian households, determine the function 𝐻'(𝑡) modeling the number of Canadian households with a mobile subscription 𝑡 years from 2004. Write 𝐻'(𝑡) below.
g. Using the model 𝐻'(𝑡) for the number of Canadian households with mobile subscriptions 𝑡 years from 2004, predict the number of households that will have a mobile subscription in years 2025 and 2030. Show your calculations.
h. What are the projected rates of change in the number of households that will have a mobile subscription in 2025 and 2030? Show your calculations and interpret the results.
i. Suppose that, due to new technology developments in communications, the household mobile subscription rate in 2050 is 95% and is decreasing at the rate of 5% per year. Suppose further that the number of Canadian households continues to grow at the same rate as today. Find the rate of change in the number of households with a mobile subscription in 2050. Show your calculations and interpret the result.
REPORT
9. Summary of findings
Write a short summary of your findings (up to one page in length), including a brief description of the overall task, information found and conclusions made. You may use the three task subsections as a guide, writing a paragraph (or two, if necessary), on each (Sourcing the data, Modeling the data for household mobile subscription rates, Making predictions).
THE END
IMPORTANT: BEFORE SUBMITTING, READ AGAIN THE SUBMISSION REQUIREMENTS ON PAGE 1 AND ENSURE ALL REQUIREMENTS ARE MET.

Last Name: ________________ First Name: __________________ Student ID #: ____________________
Modeling using functions: Communications Services in Canadian Households – Subscriptions © Ana Duff; CC BY-NC-SA Page 9 of 9
Sources:
Canadian Radio-television and Telecommunications Commission. Communications Services in Canadian Households: Subscriptions and Expenditures 2012-2016. Published under the Open Government Licence – Canada. Retrieved from https://crtc.gc.ca/eng/publications/reports/policymonitoring/2018/cmr1.htm on February 29, 2020.
Canadian Radio-television and Telecommunications Commission. Communications Services in Canadian Households Subscriptions and Expenditures. Published under the Open Government Licence – Canada. Retrieved from https://open.canada.ca/data/en/dataset/f7aea609-4a2c-4e20-ba1a-08e0ad2789d1 on February 29, 2020.
Statistics Canada. Table 36-10-0101-01 Distributions of household economic accounts, number of households, by income quintile and by socio-demographic characteristic. Retrieved from https://doi.org/10.25318/3610010101-eng on February 29, 2020.
Watch The Incredible 70-Year Evolution Of The Cell Phone. Justin Meyers, WonderHowTo. Published by Business Insider on May 6, 2011, 10:47 AM. Retrieved from https://www.businessinsider.com/complete-visual-history-of-cell-phones-2011-5 on February 29, 2020.
Cellphones mark 30 years in Canada. Peter Henderson, The Canadian Press. Published by the Canadian Broadcasting Corporation on Jun 29, 2015 1:44 PM ET (last updated: June 29, 2015). Retrieved from https://www.cbc.ca/news/technology/cellphones-mark-30-years-in-canada-1.3132058 on March 1, 2020.

Student work sample (1)
Modeling using functions: Communications Services in Canadian Households – Subscriptions Author: Ana Duff, Ontario Tech University, [email protected] Page 1 of 21
Modeling using functions:
Canadian household mobile subscription rates: trends, models and predictions
PROJECT OVERVIEW
Objective:
The objective of this project is to apply knowledge and understanding of fundamental characteristics of
basic functions and their transformations in order to create plausible models of data sets and study their
behavior. Specifically, you will investigate the data compiled by Canadian Radio-television and
Telecommunications Commission on Canadian landline and mobile service subscribers per 100
households, with focus on households with a mobile subscription.
Project submission must be the result of individual work. Consultation with others, providing work to
another person or using someone else’s work, in part or in whole, are not allowed in this project. All
questions and requests for guidance must be directed to the course instructor during office hours or by
e-mail, or the teaching assistants during their office hours.
Deliverable: This document, completed in Microsoft Word format (Equation tool must be used for
mathematical expressions) with answers to questions provided sequentially as they are posed
throughout the Tasks list [5% bonus mark if completed to the highest level of quality]
Submissions must demonstrate your
• understanding of major characteristics of basic functions and their transformations,
• application of mathematical analysis skills to create plausible models of data sets and study their
behavior, and
• employment of communication skills in support of choices, decisions and predictions
The product must demonstrate all tasks have been completed (see next section) and must include
answers to all questions posed within the tasks, justified fully using mathematical analysis techniques
(algebra, functions and calculus) and supported through visual representations (relevant data tables;
images of graphs created through Desmos).
Submission requirements:
• Submission must be in form of a single document in PDF format, stating clearly author’s student ID
number, last name and first name at the top of every page.
• The document must be submitted through Blackboard (see Course Content – Bonus Project) by
posted deadline.
IMPORTANT: Save your work and save it often. By registering with Desmos, you will be able to save
your work for later. If you prefer not to register, you can save your work by creating and saving a link to
the last state of your graph in Desmos through Share Graph tool.
☒ I have read and understood the information above (check the box to confirm)

Student work sample (1)
Modeling using functions: Communications Services in Canadian Households – Subscriptions Author: Ana Duff, Ontario Tech University, [email protected] Page 2 of 21
TASKS
Sourcing the data
1. Retrieving the data
a. Using a web browser, locate the Canadian Radio-television and Telecommunications
Commission’s report on Communications Services in Canadian Households: Subscriptions and
Expenditures 2012-2016. Briefly (in one to three sentences) state what the report is about and
include the website address.
This report is based on the “adoption of communications technologies by Canadian
households from 2012-2016, and illustrates household communication expenditure trends”
(Gov Canada, https://crtc.gc.ca/eng/publications/reports/policymonitoring/2018/cmr1.htm).
The report is taking into account how many Canadians adopt communication technology into
their household each year and noticing a trend, if it exist.
b. Read Quick Facts and briefly state what they say about trends in household communication
services subscriptions.
In the quick facts section, there is plenty if interesting information. Overall, there is a decline
in landline services, as well as the cost, which is getting replaced by cellphones. However, the
cost of the cellular planes is also increasing, at 5.5% from 2015-2016. Furthermore, the decline
of Television is also apparent, but not as drastic as landlines (3.9% decline for TV vs 7.1%
decline for Landlines). Interest services are slowly increasing at 0.6%, replacing Television. The
average Canadian household spent an average of $222.83 per month on communications
services, which when compared to 2015, is a 2.02% increase. The overall trend is that
Canadians are ditching Landline and Television services for internet and cellphones.
c. Read the summary on what communication services Canadian households use and briefly state
what additional trends are identified.
The most notable trend that can be identified would be the trend between cellphones and
landline. Ever since 2004, landline services have been on the decline, while mobile services
have been on the increase. In 2012, the percentage of subscriptions to landline and mobile
services intersected, which marked the end of landline service being more popular in
households than mobile. Since 2012, landline has been on a sharp decline, dropping down to
≈66%, while mobile subscriptions have been increasing steadily with an average rate of 15.2%
from 2012-2016, and currently at its maxima of ≈87% in 2016.

Student work sample (1)
Modeling using functions: Communications Services in Canadian Households – Subscriptions Author: Ana Duff, Ontario Tech University, [email protected] Page 3 of 21
d. On the webpage, follow the link to the data source for the report (on Government of Canada -
Open Data) and briefly state the description of the data in the publication and the publisher of
the data.
This data is gathered from Statistics Canada’s Survey of Household Spending 2016, Media
Technology Monitor, and CRTC sources and is published by the Canadian Radio-Television and
Telecommunications Commission. The data is based on the communications services
subscription rates and expenditure data, sorted by region and age group within the past 5
years. The types of data included are landline, Internet, Mobile and Television.
e. State the license under which the data is published, read its description and explain briefly why
you are allowed to use this data set for the project and any requirements related to use.
This data is under the open Government license. This license allows me to freely use this data
for this project, however, I must acknowledge the source of my information by providing a
link to the license and citing where I got this information. I am not allowed to use any
personal information, third party rights of the information provider is not authorized to
license, any names, crests, logos or official symbols of the Information Provider, and patents,
trade-marks and official marks.
f. Download the XLSX file containing the data on Communications Services in Canadian
Households Subscriptions and Expenditures. Locate Table 1.1 and copy it into the document
here.
Table 1.1
Canadian landline and mobile service subscribers per 100 households
Year Landline Mobile Landline and/or mobile Landline only
Mobile only
2004 96.2 58.9 98.9 40.0 2.7
2005 94.0 62.9 98.8 36.0 4.8
2006 93.6 66.8 98.6 31.8 5.0
2007 92.5 71.9 98.8 26.9 6.3
2008 91.1 74.3 99.1 24.8 8.0
2009 89.3 77.2 99.3 22.1 10.0
2010 89.3 78.1 99.4 21.3 10.1
2011 86.6 79.1 99.3 20.2 12.7
2012 83.8 81.3 99.2 17.9 15.4
2013 79.1 84.7 99.3 14.6 20.2
2014 75.5 85.6 99.2 13.6 23.7
2015 71.9 86.1 99.3 13.2 27.5
2016 66.8 87.9 99.3 11.4 32.5

Student work sample (1)
Modeling using functions: Communications Services in Canadian Households – Subscriptions Author: Ana Duff, Ontario Tech University, [email protected] Page 4 of 21
2. Understanding the data
a. Download the data dictionary (DOCX or TXT format) and read it.
b. Review the information in Table 1.1 and explain what the data is describing.
The data is describing the percent of 100 households that have either Landline, Mobile,
landline and/or mobile, landline only, and mobile only services per year from 2004 to 2016.
c. What are the input values and the output values, and their units of measurement?
The input values would be the years and the output values would be the percent. The unit of
measurement is percentage per 100 households.
d. What appear to be trends in the data, if any? Are there any holes or inconsistencies in the data
and, if yes, how can they be explained?
There is a very clear trend that the number of landline subscriptions is decreasing at a steady
rate while the number of mobile services is increasing at a steady rate. The percentage per
100 households that owns landline and/or mobile has increased slightly, but overall its rate of
change in minimal.
e. Select the rows and columns containing the data (including the headings) and use the Excel
Charts tool to create a scatter plot of the data. Give it a title, add axis titles and copy it here.
0.0
50.0
100.0
2004 2006 2008 2010 2012 2014 2016
Per
cen
t p
er 1
00
ho
use
ho
lds
Year
Canadian landline and mobile service subscribers per 100 households
Landline Mobile
Landline and/or mobile Landline only
Mobile only

Student work sample (1)
Modeling using functions: Communications Services in Canadian Households – Subscriptions Author: Ana Duff, Ontario Tech University, [email protected] Page 5 of 21
f. Briefly provide your prediction for each of the categories as many years pass. What
mathematical concept describes this process?
I predict that Landline and/or mobile is a linear function, mobile is an inverse decaying
exponential function, mobile only is also an inverse decaying function, while both landline and
landline only to be a linear function
Modeling the data for household mobile subscription rates
3. Choosing the model
a. Create a new Excel spreadsheet containing the Mobile subscription data from Table 1.1. Change
the Year column heading to Years since 2004 and update the data in the column accordingly.
b. Open a new graph in the Desmos Graphing Calculator and copy the data into the first line.
Rename the independent and dependent variable in the Desmos table to 𝑡1 and 𝑀1,
respectively. Using the Graph Settings tool (wrench icon in top right corner), add arrows and
label the axes appropriately. Using the Share Graph tool (top right corner), export and insert the
image of the resulting graph below. Reduce its dimensions to 2’’ in height.
c. What type of function do you think might model the data reasonably well and why? Describe
the characteristics of that function type that match the apparent behavior of the data.
The function has a horizontal asymptote of 100, because it is impossible for the percentage to
be above 100. Because of this, it rules out certain functions such as polynomials and linear.
The function’s behavior resembles an inverse exponential decay function with a vertical shift

Student work sample (1)
Modeling using functions: Communications Services in Canadian Households – Subscriptions Author: Ana Duff, Ontario Tech University, [email protected] Page 6 of 21
upwards.
d. Which transformations you expect must be applied to the basic type of that function to obtain
the function that models the data reasonably well?
A horizontal reflection and a vertical shift upwards must be applied to get the function to exist
in the first sector to resemble the data.
e. State the general form of the function 𝑀(𝑡) for the household mobile subscription rate 𝑡 years
from 2004 that you believe would best model the data.
M(t) = 𝟏𝟎𝟎 − 𝒂𝒃𝒕
HOWEVER: 0 < B < 1
Data Domain = [0, 12]
Model Domain = [0, ∞)
4. Creating the model function using regression
a. Go to Help tool (? icon) and run the Regression Tour. If needed, go to Video Tutorials and watch
a video on Regressions.
☒ I completed the Regression Tour (check the box to confirm)
b. Using what you learned about creating the regression models using Desmos, create the
regression model using the type of function you chose above. Using the Share Graph tool (top
right corner), export and insert the image of the resulting graph below, resizing it to 2’’ in
height.

Student work sample (1)
Modeling using functions: Communications Services in Canadian Households – Subscriptions Author: Ana Duff, Ontario Tech University, [email protected] Page 7 of 21
c. Using the regression function parameters given by Desmos, write below the function 𝑀(𝑡)
represented by that regression model.
M(t) = 100-41.1(𝟎. 𝟐𝟗𝟒𝟒)𝒕
𝟏𝟐
The math behind it:
M(t) = 100 – abt
M(0) = 58.9 (in 2004, the y value is 58.9 according to the excel spreadsheet)
58.9 = 100-ab0
58.9 = 100-a(1)
A = 100-58.9
A = 41.1
M(t) = 100-41.1(b)t
M(12) = 87.9 (in 2016, the y value is 87.9 according to the excel spreadsheet)
87.9 = 100-41b12
B12 = 𝟏𝟎𝟎−𝟖𝟕.𝟗
𝟒𝟏.𝟏
B = √𝟎. 𝟐𝟗𝟒𝟒𝟏𝟐
M(t) = 100-41.1(𝟎. 𝟐𝟗𝟒𝟒)𝒕
𝟏𝟐
d. Does this model provide a reasonable model for the data and why?
Yes, I believe this model provides a reasonable model for the data. Looking at the graph, it
closely lines up with the data points. Furthermore, it has a horizontal asymptote of 100, which
makes sense as how could more than 100% of houses have a cell plan?
Mathematical proof:
M(0) = 100-41.1(𝟎. 𝟐𝟗𝟒𝟒)𝟎
𝟏𝟐
M(0) = 58.9 (This lines up with the excel spreadsheet data)
M(8) = 100-41.1(𝟎. 𝟐𝟗𝟒𝟒)𝟒
𝟏𝟐
M(8) = 81.811

Student work sample (1)
Modeling using functions: Communications Services in Canadian Households – Subscriptions Author: Ana Duff, Ontario Tech University, [email protected] Page 8 of 21
Actual Data from spread at 2012 = 81.3
𝟖𝟏.𝟗𝟏𝟏−𝟖𝟏.𝟑
𝟖𝟏.𝟑* 100 = 0.75%
Therefore, the error percentage rate is 0.75%, which is a reasonable amount.
e. Using the Share Graph tool (top right corner), copy below the link to your graph.
https://www.desmos.com/calculator/rptrkixcln
5. Adjusting the model as necessary by considering context
a. Do you think that, over time, all of the Canadian households will have a mobile subscription, and
why? Make a prediction for % of households that will have a mobile subscription as years pass.
No, I do not think every Canadian household will have a mobile subscription, that is
unrealistic. Some people will live in areas where its impossible to get service, or others will
refuse to buy one. There will always be a small percent of Canadians that will not subscribe. I
predict that theoretical maximum of 95% Canadian households will have a cellphone
subscription.
b. Looking at the regression function 𝑀(𝑡) that models the rate of household mobile subscriptions
data over time since 2004, how does that model match with your prediction, both by looking at
the graph of the function and by analyzing the function using mathematical analysis techniques
(hint: limits)?
This falls in closely with my function. My function approaches 95% at approximately 2024, and
increases but never reaches 100%, due to their being a horizontal asymptote of 100
c. Which parameter would have to change in the function 𝑀(𝑡) to match it with your prediction,
why, and to what value?
In my function of M(t) = 100-41.1(𝟎. 𝟐𝟗𝟒𝟒)𝒕
𝟏𝟐, I would have to change the value of 100 to 95.
The 100 in the equation is the horizontal asymptote and prevents any value from increasing
about it. If I wanted to change the horizontal asymptote to 95%, I would simply change the
value of 100 to 95 and rewrite the equation again.
M(t) = 95-41.1(𝟎. 𝟐𝟗𝟒𝟒)𝒕
𝟏𝟐,
d. Recreate the model using Desmos with this change. Using the Share Graph tool (top right
corner), export and insert the image of the resulting graph below, resizing it to 2’’ in height.

Student work sample (1)
Modeling using functions: Communications Services in Canadian Households – Subscriptions Author: Ana Duff, Ontario Tech University, [email protected] Page 9 of 21
*the new function is black
e. Does the new regression function appear to model well the known data, while agreeing with
your prediction? Briefly explain your reasoning.
While the new regression function agrees with my prediction of a limit of 95%, it does not line
up with the existing data, so I will have to change the function around mathematically.
f. If applicable, change the parameters in 𝑀(𝑡) to reflect the revised regression model and write
the new formula for 𝑀(𝑡) below.
M(t) = 95-36.1(𝟎. 𝟏𝟗𝟔𝟔𝟕𝟓𝟗)𝒕
𝟏𝟐
Math behind it:
M(t) = 100 – abt
M(0) = 58.9 (in 2004, the y value is 58.9 according to the excel spreadsheet)
58.9 = 95-ab0
58.9 = 95-a(1)
A = 95-58.9
A = 36.1
M(t) = 95-36.1(b)t
M(12) = 87.9 (in 2016, the y value is 87.9 according to the excel spreadsheet)
87.9 = 95-36.1b12
B12 = 𝟗𝟓−𝟖𝟕.𝟗
𝟑𝟔.𝟏
B = √𝟎. 𝟏𝟗𝟔𝟔𝟕𝟓𝟗𝟏𝟐
M(t) = 95-36.1(𝟎. 𝟏𝟗𝟔𝟔𝟕𝟓𝟗)𝒕
𝟏𝟐

Student work sample (1)
Modeling using functions: Communications Services in Canadian Households – Subscriptions Author: Ana Duff, Ontario Tech University, [email protected] Page 10 of 21
g. Using the Share Graph tool (top right corner), copy below the link to your graph.
*new function is red
6. Adjusting the model as necessary by considering additional information
a. Consider the data on household mobile subscriptions prior to 2004. Download the data from the
1997 – 2009 Survey of household spending on household equipment from Open Canada. Open
the CSV file and use the following filters (Data – Filter Excel tool) to retrieve the data on
Canadian household mobile subscription rates:
• GEO: Canada
• Household equipment: Households having a cellular telephone
• UOM: Percent
Copy the resulting table below.
b. Does this data match the data you already have on household mobile subscription rates for
years 2004 to 2016? Briefly state what might explain the discrepancies, if any.
REF_DATE GEO DGUID Statistics Household equipment UOM UOM_ID SCALAR_FACTORSCALAR_IDVECTOR COORDINATEVALUE STATUS SYMBOL TERMINATEDDECIMALS
1997 Canada Percent of households reportingHouseholds having a cellular telephone Percent 239 units 0 v284695891.1.17 22 1
1998 Canada Percent of households reportingHouseholds having a cellular telephone Percent 239 units 0 v284695891.1.17 26.5 1
1999 Canada Percent of households reportingHouseholds having a cellular telephone Percent 239 units 0 v284695891.1.17 32.5 1
2000 Canada Percent of households reportingHouseholds having a cellular telephone Percent 239 units 0 v284695891.1.17 42 1
2001 Canada Percent of households reportingHouseholds having a cellular telephone Percent 239 units 0 v284695891.1.17 47.6 1
2002 Canada Percent of households reportingHouseholds having a cellular telephone Percent 239 units 0 v284695891.1.17 51.7 1
2003 Canada Percent of households reportingHouseholds having a cellular telephone Percent 239 units 0 v284695891.1.17 54 1
2004 Canada Percent of households reportingHouseholds having a cellular telephone Percent 239 units 0 v284695891.1.17 58.9 1
2005 Canada Percent of households reportingHouseholds having a cellular telephone Percent 239 units 0 v284695891.1.17 64.2 1
2006 Canada Percent of households reportingHouseholds having a cellular telephone Percent 239 units 0 v284695891.1.17 67.7 1
2007 Canada Percent of households reportingHouseholds having a cellular telephone Percent 239 units 0 v284695891.1.17 71.4 1
2008 Canada Percent of households reportingHouseholds having a cellular telephone Percent 239 units 0 v284695891.1.17 73.2 1
2009 Canada Percent of households reportingHouseholds having a cellular telephone Percent 239 units 0 v284695891.1.17 77.2 1

Student work sample (1)
Modeling using functions: Communications Services in Canadian Households – Subscriptions Author: Ana Duff, Ontario Tech University, [email protected] Page 11 of 21
Some of the data matches, but overall there is some discrepancies. There may occur because
each institution has different ways of counting each household.
c. Add the data for 1997 to 2003 to your table containing household mobile subscription rates for
2004 to 2016, making sure that you enter the appropriate values in the Years since 2004
column. Copy the new data table below.
Years since 2004 Mobile
-7 22
-6 26.5
-5 32.5
-4 42
-3 47.6
-2 51.7
-1 54
0 58.9
1 64.2
2 67.7
3 71.4
4 73.2
5 77.2
6 78.1
7 79.1
8 81.3
9 84.7
10 85.6
11 86.1
12 87.9
d. Copy the new data set to a new line in the existing Desmos graph containing your work on
household mobile subscription rates. Using the Share Graph tool (top right corner), export and
insert the image of the resulting graph below, resizing it to 2’’ in height.

Student work sample (1)
Modeling using functions: Communications Services in Canadian Households – Subscriptions Author: Ana Duff, Ontario Tech University, [email protected] Page 12 of 21
*the red dots are the new data sets
e. Does the regression function 𝑀(𝑡) you used to model household subscription rates appear to
model well the expanded data set? Briefly explain your reasoning.
My regression function moderately resembles the new data set. In the more negative
numbers, like -7 (1997), it is more noticeable, but overall it does closely resemble similar data.
New data set 2003 (or -1) = 54%
M(t) = 100-41.1(𝟎. 𝟐𝟗𝟒𝟒)𝒕
𝟏𝟐
M(-1) = 100-41.1(𝟎. 𝟐𝟗𝟒𝟒)−𝟏
𝟏𝟐 = 54.491%
𝟓𝟒.𝟒𝟗𝟏−𝟓𝟒
𝟓𝟒* 100 = 0.909%
Therefore, there is a 0.909% error percentage rate, which is reasonable.
f. Create a new regression model that incorporates the expanded data set and models your
prediction for mobile subscription rates as years pass. Using the Share Graph tool (top right
corner), export and insert the image of the resulting graph below, resizing it to 2’’ in height.
To make a new regression model in a more simple way, I will create a new table where
instead of starting at 2004, I will start at 1997, but will add a horizontal translation of 7 to the
left so it makes sense with the other data.

Student work sample (1)
Modeling using functions: Communications Services in Canadian Households – Subscriptions Author: Ana Duff, Ontario Tech University, [email protected] Page 13 of 21
Got rid of the other lines due to getting too cluttered. There will be an image at the end of this
document with every function.
M(t) = 100-78(𝟎. 𝟏𝟓𝟓𝟏𝟐𝟖)𝒕+𝟕
𝟏𝟗
Math behind it:
M(t) = 100 – abt
M(0) = 22 (in 1997, the y value is 58.9 according to the excel spreadsheet)
22 = 100-ab0
22 = 100-a(1)
A = 100-22
A = 78
M(t) = 100-78(b)t
M(19) = 87.9 (in 2016, the y value is 87.9 according to the excel spreadsheet)
87.9 = 100-78b12
B19 = 𝟗𝟓−𝟖𝟕.𝟗
𝟕𝟖
B = √𝟎. 𝟏𝟓𝟓𝟏𝟐𝟖𝟏𝟗
M(t) = 100-78(𝟎. 𝟏𝟗𝟔𝟔𝟕𝟓𝟗)𝒕
𝟏𝟗
M(t) = 100-78(𝟎. 𝟏𝟗𝟔𝟔𝟕𝟓𝟗)𝒕+𝟕
𝟏𝟗 (Horizontal translation to the left by 7, so it lines up with the
other data.)
g. Consider the history of cellular phone use, particularly in Canada, by reading Complete Visual
History of Cellphones and Cellphones mark 30 years in Canada. Which of the two models you
created would be a better reflection of the trends since the introduction of mobile phones to
Canadian society, and why?
Both of my modules have their strengths and weaknesses. Function M(t) = 100-41.1(𝟎. 𝟐𝟗𝟒𝟒)𝒕
𝟏𝟐,
which I will call Purple Function, is stronger in the years 2004 to 2016. Its plot is much closer to the
actual data than Green Function (M(t) = 100-78(𝟎. 𝟏𝟓𝟓𝟏𝟐𝟖)𝒕+𝟕
𝟏𝟗 However, in the years before 2004,
Purple function is less precise than Green Function. Overall, I would have to say that green
function would be a better reflection, as while its not as strong in the more current data (2004 to
2016), it is significantly more accurate from 1997 to 2004 than Purple Function is. In conclusion,
it’s more consistent with its data, so Green Function is a better reflection.

Student work sample (1)
Modeling using functions: Communications Services in Canadian Households – Subscriptions Author: Ana Duff, Ontario Tech University, [email protected] Page 14 of 21
h. If applicable, change the parameters in 𝑀(𝑡) to reflect the revised regression model and your
long term predictions, and write the new formula for 𝑀(𝑡) below.
To change Green function M(t) = 100-78(𝟎. 𝟏𝟓𝟓𝟏𝟐𝟖)𝒕+𝟕
𝟏𝟗 to my long term predictions, I will
have to change the horizontal asymptote from 100 to 95.
M(t) = 95-73(𝟎. 𝟎𝟗𝟕𝟐𝟔𝟎𝟐𝟕𝟑)𝒕+𝟕
𝟏𝟗
Math behind it:
M(t) = 95 – abt
M(0) = 22 (in 1997, the y value is 22 according to the excel spreadsheet)
22 = 95-ab0
22 = 95-a(1)
A = 95-22
A = 73
M(t) = 95-73(b)t
M(19) = 87.9 (in 2016, the y value is 87.9 according to the excel spreadsheet)
87.9 = 95-73b19
B19 = 𝟗𝟓−𝟖𝟕.𝟗
𝟕𝟑
B = √𝟎. 𝟎𝟗𝟕𝟐𝟔𝟎𝟐𝟕𝟑𝟏𝟗
M(t) = 95-73(𝟎. 𝟎𝟗𝟕𝟐𝟔𝟎𝟐𝟕𝟑)𝒕+𝟕
𝟏𝟗
i. Using the Share Graph tool (top right corner), copy below the link to your graph.

Student work sample (1)
Modeling using functions: Communications Services in Canadian Households – Subscriptions Author: Ana Duff, Ontario Tech University, [email protected] Page 15 of 21
Making predictions
7. Household mobile subscription rates
a. Using the model you developed for household mobile subscription rates, predict the percentage
of households that will have a mobile subscription in year 2025, in 2030 and in 2050. Show your
calculations.
M(t) = 100-78(𝟎. 𝟏𝟓𝟓𝟏𝟐𝟖)𝒕+𝟕
𝟏𝟗
Year 2025:
2025 – 2004 = 21
M(t) = 100-78(𝟎. 𝟏𝟓𝟓𝟏𝟐𝟖)𝟐𝟏+𝟕
𝟏𝟗 = 94.9947%
Year 2030:
2030 – 2004 = 26
M(t) = 100-78(𝟎. 𝟏𝟓𝟓𝟏𝟐𝟖)𝟐𝟔+𝟕
𝟏𝟗 = 96.9348%
Year 2050:
2050 – 2004 = 46
M(t) = 100-78(𝟎. 𝟏𝟓𝟓𝟏𝟐𝟖)𝟒𝟔+𝟕
𝟏𝟗 = 99.5689%
b. What are the projected rates of change in the household mobile subscription rates in 2025, in
2030 and in 2050? Show your calculations and interpret the results.
M(t) = 100-78(𝟎. 𝟏𝟓𝟓𝟏𝟐𝟖)𝒕+𝟕
𝟏𝟗
M’(t) = 0.78(𝟎. 𝟏𝟓𝟓𝟏𝟐𝟖)𝒕+𝟕
𝟏𝟗 ln(0.155128)𝟏
𝟏𝟗
Year 2025:
2025 – 2004 = 21
M’(21) = 0.78(𝟎. 𝟏𝟓𝟓𝟏𝟐𝟖)𝟐𝟏+𝟕
𝟏𝟗 ln(0.155128)𝟏
𝟏𝟗
M’(21) = 0.490913
The rate of change is very low, which makes sense, as in 2025, the suggested percentage of
households with cell phones would be approximately 95%, which is close to the limit of 100%,
which means the rate of change will begin to decrease drastically.

Student work sample (1)
Modeling using functions: Communications Services in Canadian Households – Subscriptions Author: Ana Duff, Ontario Tech University, [email protected] Page 16 of 21
Year 2030:
2030-2004 = 26
M’(26) = 0.78(𝟎. 𝟏𝟓𝟓𝟏𝟐𝟖)𝟐𝟔+𝟕
𝟏𝟗 ln(0.155128)𝟏
𝟏𝟗
M’(26) = 0.300627
The rate of change is even lower, which makes sense as in 2030, the suggested percentage of
households with cellphones would be approximately 97%, which is even closer to the limit of
100%, which means the rate of change will begin to decrease even more drastically.
Year 2050:
2050 – 2004: 46
M’(46) = 0.78(𝟎. 𝟏𝟓𝟓𝟏𝟐𝟖)𝟒𝟔+𝟕
𝟏𝟗 ln(0.155128)𝟏
𝟏𝟗
M’(46) = 0.042279
The rate of change is even lower, which makes sense as in 2050, the suggested percentage of
households with cellphones would be approximately 99.5%, which is extremely close to the
limit of 100%, which means the rate of change will be close to zero.
c. Considering the impact the development of cell phones had on landline subscriptions starting 30
years ago, how likely is that your model’s prediction for household mobile subscription rates
and their growth in 2050 and beyond is accurate, and why?
My models prediction for household subscription rates beyond 2050 is fairly accurate. At
2050, over 99% of households will have cellphones, so of course the rate of change will be a
very small number. The only error that I can see is that the horizontal asymptote, or limit,
should not be 100, but 95%. It is highly unlikely that 99% of all Canadians will have access to
purchasing a cellular plan, due to location, cost or beliefs. Because of this, it will be impossible
to reach 100%, and a limit of 95% would be more reasonable.
8. Modeling the number of households with mobile subscriptions
a. To obtain the data on number of Canadian households over years since 2004, follow the link to
the Statistics Canada data on Distributions of household economic accounts, number of
households, by income quintile and by socio-demographic characteristic. Click on Add/Remove
reference period and change the reference period to years 2004 to 2016. Click on Apply, then
Download options, then CSV Download as displayed (excluding accompanying symbols).
Change the text in the Income Quintile cell to Years since 2004 and fill the rest of the cells in the
row accordingly. In the row below, enter Number of Canadian households (in millions) and fill
the row for each year since 2004 using the data in the All quintiles row, dividing it by a million.
Select the two rows and create the scatter chart representing the number of Canadian

Student work sample (1)
Modeling using functions: Communications Services in Canadian Households – Subscriptions Author: Ana Duff, Ontario Tech University, [email protected] Page 17 of 21
households (in millions) in the years since 2004. Add the horizontal axis title and copy the chart
below.
b. Looking at the data, what type of function would best model the trend in the number of
Canadian households since 2004? Describe the characteristics of that function type that match
the apparent behavior of the data.
I believe that the best type of function that would describe the trend of this data would be
linear. It is increasing at approximately 160,000 each year each year, and because the rate of
change is so steady, that suggest its linear.
c. State the general form of the function 𝐻(𝑡) for the number of Canadian households 𝑡 years
from 2004 that you believe would best model the data.
𝑯(𝒕) = 𝒎 𝒕 + 𝒃
d. Add a trendline to the chart in Excel that reflects your choice of the model type and display the
equation for 𝐻(𝑡) on the chart. Write below this equation.
𝑯(𝒕) = 𝟎. 𝟏𝟖𝟔𝟖𝒕 + 𝟏𝟐. 𝟕𝟒
e. What does 𝐻(𝑡) tell you about the rate of change in the number of Canadian households?
The derivative of H(t) is H’(t) = 0.1868, which means the Instantaneous rate of change will
always be a static 0.1868 million.
H(t) = 0.1868x + 12.74
12.5
13
13.5
14
14.5
15
15.5
0 2 4 6 8 10 12nu
mb
er o
f C
anad
ian
ho
use
ho
lds
(Mili
on
s)
Years Since 2004
Number of Canadian households ( In millions) vs Year

Student work sample (1)
Modeling using functions: Communications Services in Canadian Households – Subscriptions Author: Ana Duff, Ontario Tech University, [email protected] Page 18 of 21
f. Using your models 𝑀(𝑡) and 𝐻(𝑡) for the household mobile subscription rates and the number
of Canadian households, determine the function 𝐻𝑀(𝑡) modeling the number of Canadian
households with a mobile subscription 𝑡 years from 2004. Write 𝐻𝑀(𝑡) below.
*note I will use the older M(t) function that does not include the 1997 to 2007 values.
HM(t) = (M(t)/100)*(H(t)*1000000)
Hm(t)=((100-41.1(𝟎. 𝟐𝟗𝟒𝟒)𝒕
𝟏𝟐)/𝟏𝟎𝟎) * ((𝟎. 𝟏𝟖𝟔𝟖(𝒕) + 𝟏𝟐. 𝟕𝟒) ∗ 𝟏𝟎𝟎𝟎𝟎𝟎𝟎)
This will equal the total amount of households with cellular phone services.
g. Using the model 𝐻𝑀(𝑡) for the number of Canadian households with mobile subscriptions 𝑡
years from 2004, predict the number of households that will have a mobile subscription in years
2025 and 2030. Show your calculations.
Hm(t)=((100-41.1(𝟎. 𝟐𝟗𝟒𝟒)𝒕
𝟏𝟐)/𝟏𝟎𝟎) * ((𝟎. 𝟏𝟖𝟔𝟖(𝒕) + 𝟏𝟐. 𝟕𝟒) ∗ 𝟏𝟎𝟎𝟎𝟎𝟎𝟎)
Year 2025:
2025 – 2004 = 21
Hm(21)=((100-41.1(𝟎. 𝟐𝟗𝟒𝟒)𝟐𝟏
𝟏𝟐)/𝟏𝟎𝟎) * ((𝟎. 𝟏𝟖𝟔𝟖(𝟐𝟏) + 𝟏𝟐. 𝟕𝟒) ∗ 𝟏𝟎𝟎𝟎𝟎𝟎𝟎)
Hm(21)=15856993
Therefore, in 2025, there will be 15,856,933 households will mobile subscriptions.
Year 2030:
2025 – 2004 = 26
Hm(26)=((100-41.1(𝟎. 𝟐𝟗𝟒𝟒)𝟐𝟔
𝟏𝟐)/𝟏𝟎𝟎) * ((𝟎. 𝟏𝟖𝟔𝟖(𝟐𝟔) + 𝟏𝟐. 𝟕𝟒) ∗ 𝟏𝟎𝟎𝟎𝟎𝟎𝟎)
Hm(26)=17085541
Therefore, in 2030, there will be 17,085,541 households will mobile subscriptions.

Student work sample (1)
Modeling using functions: Communications Services in Canadian Households – Subscriptions Author: Ana Duff, Ontario Tech University, [email protected] Page 19 of 21
h. What are the projected rates of change in the number of households that will have a mobile
subscription in 2025 and 2030? Show your calculations and interpret the results.
Product rule.
This is a very messy derivative and I probably did this wrong.
Hm’(t) = M’(t)*H(t) + M(t)*H’(t)
Hm’(t)=((0-41.1(𝟎. 𝟐𝟗𝟒𝟒)𝒕
𝟏𝟐)𝒍𝒏(𝟎. 𝟐𝟗𝟒𝟒)(𝟏
𝟏𝟐))) * ((𝟎. 𝟏𝟖𝟔𝟖(𝒕) + 𝟏𝟐. 𝟕𝟒)) + ((100-
41.1(𝟎. 𝟐𝟗𝟒𝟒)𝒕
𝟏𝟐)) * 0.1868
Year 2025:
2025 – 2004 = 21
Hm’(21)=((0-41.1(𝟎. 𝟐𝟗𝟒𝟒)𝟐𝟏
𝟏𝟐)𝒍𝒏(𝟎. 𝟐𝟗𝟒𝟒)(𝟏
𝟏𝟐))) * ((𝟎. 𝟏𝟖𝟔𝟖(𝟐𝟏) + 𝟏𝟐. 𝟕𝟒)) + ((100-
41.1(𝟎. 𝟐𝟗𝟒𝟒)𝟐𝟏
𝟏𝟐)) * 0.1868
Hm’(21) = 25.98792
Year 2030:
2030 – 2004 = 26
Hm’(26)=((0-41.1(𝟎. 𝟐𝟗𝟒𝟒)𝟐𝟔
𝟏𝟐)𝒍𝒏(𝟎. 𝟐𝟗𝟒𝟒)(𝟏
𝟏𝟐))) * ((𝟎. 𝟏𝟖𝟔𝟖(𝟐𝟏) + 𝟏𝟐. 𝟕𝟒)) + ((100-
41.1(𝟎. 𝟐𝟗𝟒𝟒)𝟐𝟔
𝟏𝟐)) * 0.1868
Hm’(26) = 23.34706

Student work sample (1)
Modeling using functions: Communications Services in Canadian Households – Subscriptions Author: Ana Duff, Ontario Tech University, [email protected] Page 20 of 21
i. Suppose that, due to new technology developments in communications, the household mobile
subscription rate in 2050 is 95% and is decreasing at the rate of 5% per year. Suppose further
that the number of Canadian households continues to grow at the same rate as today. Find the
rate of change in the number of households with a mobile subscription in 2050. Show your
calculations and interpret the result.
THE END
IMPORTANT: BEFORE SUBMITTING, READ AGAIN THE SUBMISSION REQUIREMENTS ON PAGE
1 AND ENSURE ALL REQUIREMENTS ARE MET.

Student work sample (1)
Modeling using functions: Communications Services in Canadian Households – Subscriptions Author: Ana Duff, Ontario Tech University, [email protected] Page 21 of 21
Sources:
Canadian Radio-television and Telecommunications Commission. Communications Services in Canadian
Households: Subscriptions and Expenditures 2012-2016. Published under the Open Government Licence
– Canada. Retrieved from https://crtc.gc.ca/eng/publications/reports/policymonitoring/2018/cmr1.htm
on February 29, 2020.
Canadian Radio-television and Telecommunications Commission. Communications Services in Canadian
Households Subscriptions and Expenditures. Published under the Open Government Licence – Canada.
Retrieved from https://open.canada.ca/data/en/dataset/f7aea609-4a2c-4e20-ba1a-08e0ad2789d1 on
February 29, 2020.
Statistics Canada. Table 36-10-0101-01 Distributions of household economic accounts, number of
households, by income quintile and by socio-demographic characteristic. Retrieved from
https://doi.org/10.25318/3610010101-eng on February 29, 2020.
Watch The Incredible 70-Year Evolution Of The Cell Phone. Justin Meyers, WonderHowTo. Published by
Business Insider on May 6, 2011, 10:47 AM. Retrieved from
https://www.businessinsider.com/complete-visual-history-of-cell-phones-2011-5 on February 29, 2020.
Cellphones mark 30 years in Canada. Peter Henderson, The Canadian Press. Published by the Canadian
Broadcasting Corporation on Jun 29, 2015 1:44 PM ET (last updated: June 29, 2015). Retrieved from
https://www.cbc.ca/news/technology/cellphones-mark-30-years-in-canada-1.3132058 on March 1,
2020.

Student work sample (2)
Modeling using functions: Communications Services in Canadian Households – Subscriptions Author: Ana Duff, Ontario Tech University, [email protected] Page 1 of 19
Modeling using functions:
Canadian household mobile subscription rates: trends, models and predictions
PROJECT OVERVIEW
Objective:
The objective of this project is to apply knowledge and understanding of fundamental characteristics of
basic functions and their transformations in order to create plausible models of data sets and study their
behaviour. Specifically, you will investigate the data compiled by Canadian Radio-television and
Telecommunications Commission on Canadian landline and mobile service subscribers per 100
households, with focus on households with a mobile subscription.
Project submission must be the result of individual work. Consultation with others, providing work to
another person or using someone else’s work, in part or in whole, are not allowed in this project. All
questions and requests for guidance must be directed to the course instructor during office hours or by
e-mail, or the teaching assistants during their office hours.
Deliverable: This document, completed in Microsoft Word format (Equation tool must be used for
mathematical expressions) with answers to questions provided sequentially as they are posed
throughout the Tasks list [5% bonus mark if completed to the highest level of quality]
Submissions must demonstrate your
• understanding of major characteristics of basic functions and their transformations,
• application of mathematical analysis skills to create plausible models of data sets and study their
behavior, and
• employment of communication skills in support of choices, decisions and predictions
The product must demonstrate all tasks have been completed (see next section) and must include
answers to all questions posed within the tasks, justified fully using mathematical analysis techniques
(algebra, functions and calculus) and supported through visual representations (relevant data tables;
images of graphs created through Desmos).
Submission requirements:
• Submission must be in form of a single document in PDF format, stating clearly author’s student ID
number, last name and first name at the top of every page.
• The document must be submitted through Blackboard (see Course Content – Bonus Project) by
posted deadline.
IMPORTANT: Save your work and save it often. By registering with Desmos, you will be able to save
your work for later. If you prefer not to register, you can save your work by creating and saving a link to
the last state of your graph in Desmos through Share Graph tool.
☒ I have read and understood the information above (check the box to confirm)

Student work sample (2)
Modeling using functions: Communications Services in Canadian Households – Subscriptions Author: Ana Duff, Ontario Tech University, [email protected] Page 2 of 19
TASKS
Sourcing the data
1. Retrieving the data
a. Using a web browser, locate the Canadian Radio-television and Telecommunications
Commission’s report on Communications Services in Canadian Households: Subscriptions and
Expenditures 2012-2016. Briefly (in one to three sentences) state what the report is about and
include the website address.
The Canadian Radio-television and Telecommunications Commission’s report on
Communications Services in Canadian Households : Subscriptions and Expenditures 2012-2016
investigates Canadian households and their spending on services such as that of television,
mobile and landline services and overall examine how such Canadian households are adapting
to industry changes by looking through various aspects of telecommunication in Canada.
https://crtc.gc.ca/eng/publications/reports/policymonitoring/2018/index.htm
b. Read Quick Facts and briefly state what they say about trends in household communication
services subscriptions.
The image of implies that throughout the years of 2015-2016 that 67% of the total households
in Canada used landline services however through those years the landline service has gone
down 7.1%. On the related note the image above shows that 88% of total Canadian households
use mobile services with an increase of 2.1% through out 2015-2016. This image also above
captures the growth of Internet services from 2015-2016 as increase of 0.6% with a 87% of total
Canadian households using internet services. However, the imagine above also displays the
decrease of conventional TV service with a 3.9% decline from 2015-2016 with only 75% of total
Canadian household using Television distribution services.

Student work sample (2)
Modeling using functions: Communications Services in Canadian Households – Subscriptions Author: Ana Duff, Ontario Tech University, [email protected] Page 3 of 19
The imagine above shows that through out the years of 2015-2016 both mobile and internet
services have seen an increase in monthly spending, mobile services saw a growth of 5.5% with
a spending of $95.08 dollars Canadian a month while internet services saw a growth of 6.5%
with a monthly spending of $49.50 dollars Canadian.
The above facts show a trend in household communication service subscriptions which shows
that Canadian Households are moving away from past services such that of TV distribution
(cable) and land lines to that of newer services such that of internet and mobile.
Attribution Statement: contains information licenced under the Open Government licence –
Canada
c. Read the summary on what communication services Canadian households use and briefly state
what additional trends are identified.
d. On the webpage, follow the link to the data source for the report (on Government of Canada -
Open Data) and briefly state the description of the data in the publication and the publisher of
the data.
The data set is published by Canadian Radio-Television and Telecommunications Commission
and displays the communications services subscription such as landline, mobile, internet, and
television distribution rates and expenditure data by region and by age for the past 5 years,
from 2012-2016.
e. State the licence under which the data is published, read its description and explain briefly why
you are allowed to use this data set for the project and any requirements related to use.
The licence under which the data on “Canadian Radio-television and Telecommunications
Commission’s report on Communications Services in Canadian Households: Subscriptions and
Expenditures 2012-2016” is published under the Open Government Licence – Canada. This
author is allowed to use this data set for this project because the provider of the data grants

Student work sample (2)
Modeling using functions: Communications Services in Canadian Households – Subscriptions Author: Ana Duff, Ontario Tech University, [email protected] Page 4 of 19
worldwide, royalty-free, perpetual non-exclusive licence to use the information, including for
commercial purposes, with requirements based on the this author acknowledging the source of
the Information by including any attribution statement specified by the information provider(s)
and, where possible provide a link to the licence. Also, if the information does not provide a
specific attribution statement or if this author is using information from several providers and its
not practical for this authors product application this author must use the following attribution
statement: “contains information licenced under the Open Government licence – Canada”.
f. Download the XLSX file containing the data on Communications Services in Canadian
Households Subscriptions and Expenditures. Locate Table 1.1 and copy it into the document
here.
Table 1.1
Canadian landline and mobile service subscribers per 100 households
Year Landline Mobile Landline and/or mobile Landline only
Mobile only
2004 96.2 58.9 98.9 40.0 2.7
2005 94.0 62.9 98.8 36.0 4.8
2006 93.6 66.8 98.6 31.8 5.0
2007 92.5 71.9 98.8 26.9 6.3
2008 91.1 74.3 99.1 24.8 8.0
2009 89.3 77.2 99.3 22.1 10.0
2010 89.3 78.1 99.4 21.3 10.1
2011 86.6 79.1 99.3 20.2 12.7
2012 83.8 81.3 99.2 17.9 15.4
2013 79.1 84.7 99.3 14.6 20.2
2014 75.5 85.6 99.2 13.6 23.7
2015 71.9 86.1 99.3 13.2 27.5
2016 66.8 87.9 99.3 11.4 32.5
Source: Statistics Canada’s Affordability Study (2004-2007) and Survey of Household Spending, custom breakdown of Table 11-10-0223-01 (2008-2016)
2. Understanding the data
a. Download the data dictionary (DOCX or TXT format) and read it.
This author has read the above data dictionary mentioned.
b. Review the information in Table 1.1 and explain what the data is describing.

Student work sample (2)
Modeling using functions: Communications Services in Canadian Households – Subscriptions Author: Ana Duff, Ontario Tech University, [email protected] Page 5 of 19
The data in table 1.1 is describing the relationship between the years from 2004-2016 and
subscribers per 100 households subscribed to landline, mobile, landline and/or mobile, landline
only, ot mobile only. For example, in 2004 96.2 subscribers per 100 households had landline,
58.9 subscribers per 100 households had mobile, 98.9 subscribers per 100 households had
landline and/or mobile, 40% per 100 households had landline only, and 2.7% per 100
households had mobile only.
c. What are the input values and the output values, and their units of measurement?
The Input Value is the years, from 2004 to 2016, and output value is % of mobile subs per 100
households, and the measurement is the % of subs per 100 households
d. What appear to be trends in the data, if any? Are there any holes or inconsistencies in the data
and, if yes, how can they be explained?
There are indeed holes or inconsistences in the data, this can be explained as households that
do not part take in services that are provided, either due to expenses, religion, or due to lifestyle
choices.
e. Select the rows and columns containing the data (including the headings) and use the Excel
Charts tool to create a scatter plot of the data. Give it a title, add axis titles and copy it here.
f. Briefly provide your prediction for each of the categories as many years pass. What
mathematical concept describes this process?
This authors predictions as years pass for this set of data is that Landline will gradually keep decreasing,
while mobiles will steadily increase, landline and/or mobile will stay relatively constant, landline only
will see a rapid decrease, and mobile only will see a rapidly increase. The mathematical concept that
describes this process is called a Function. A function is a relation for which each value from the set of
58.9 62.9 66.871.9 74.3 77.2 78.1 79.1 81.3 84.7 85.6 86.1 87.9
0.0
20.0
40.0
60.0
80.0
100.0
0 2 4 6 8 10 12 14
# o
f su
bsc
rib
ers
pe
r 1
00 H
ou
seh
old
s in
C
anad
a
Years
Canada Landline and Mobile Service Subscribers per 100 Hosueholds
Mobile

Student work sample (2)
Modeling using functions: Communications Services in Canadian Households – Subscriptions Author: Ana Duff, Ontario Tech University, [email protected] Page 6 of 19
the first component is associated with exactly one value from the set of the second components of the
ordered pair.
Modeling the data for household mobile subscription rates
3. Choosing the model
a. Create a new Excel spreadsheet containing the Mobile subscription data from Table 1.1. Change
the Year column heading to Years since 2004 and update the data in the column accordingly.
This Author has done that.
b. Open a new graph in the Desmos Graphing Calculator and copy the data into the first line.
Rename the independent and dependent variable in the Desmos table to 𝑡1 and 𝑀1,
respectively. Using the Graph Settings tool (wrench icon in top right corner), add arrows and
label the axes appropriately. Using the Share Graph tool (top right corner), export and insert the
image of the resulting graph below. Reduce its dimensions to 2’’ in height.

Student work sample (2)
Modeling using functions: Communications Services in Canadian Households – Subscriptions Author: Ana Duff, Ontario Tech University, [email protected] Page 7 of 19
c. What type of function do you think might model the data reasonably well and why? Describe
the characteristics of that function type that match the apparent behavior of the data.
This Author believes that a liner function would model this data reasonably well because as you
can see from the above the graph the data set is increasing at a nearly a constant rate, with no
significant curve such as local minimum or maximum, concavity or inconsistency that would
make this author believe otherwise. The characteristics of a linear function can be classified as
line, a constant slope. A positive slope means the linear function is increasing from left to right,
if negative the linear function is left or right, and if the slope is 0 then the linear function is
constant on the x axis.

Student work sample (2)
Modeling using functions: Communications Services in Canadian Households – Subscriptions Author: Ana Duff, Ontario Tech University, [email protected] Page 8 of 19
d. Which transformations you expect must be applied to the basic type of that function to obtain
the function that models the data reasonably well?
This author expects a vertical translation upwards and a horizontal stretch must be applied to
the linear function in order it to model the data reasonably well.
e. State the general form of the function 𝑀(𝑡) for the household mobile subscription rate 𝑡 years
from 2004 that you believe would best model the data.
M(t) = mt + b
4. Creating the model function using regression
a. Go to Help tool (? icon) and run the Regression Tour. If needed, go to Video Tutorials and watch
a video on Regressions.
☒ I completed the Regression Tour (check the box to confirm)
b. Using what you learned about creating the regression models using Desmos, create the
regression model using the type of function you chose above. Using the Share Graph tool (top
right corner), export and insert the image of the resulting graph below, resizing it to 2’’ in
height.
Student work sample (2)
Modeling using functions: Communications Services in Canadian Households – Subscriptions Author: Ana Duff, Ontario Tech University, [email protected] Page 9 of 19
c. Using the regression function parameters given by Desmos, write below the function 𝑀(𝑡)
represented by that regression model.
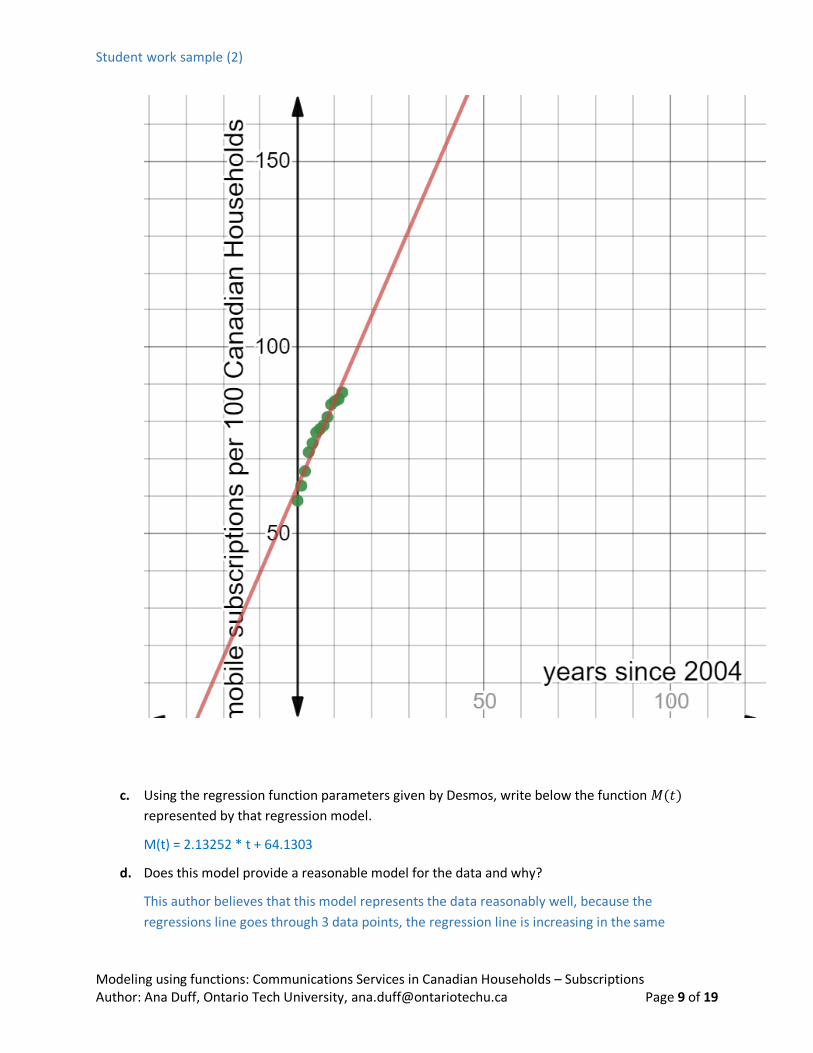
M(t) = 2.13252 * t + 64.1303
d. Does this model provide a reasonable model for the data and why?
This author believes that this model represents the data reasonably well, because the
regressions line goes through 3 data points, the regression line is increasing in the same

Student work sample (2)
Modeling using functions: Communications Services in Canadian Households – Subscriptions Author: Ana Duff, Ontario Tech University, [email protected] Page 10 of 19
direction as the data points, the regression points also stars at nearly the same spot as the data.
Not only that but the regression line shape nearly identically matches the of the data points.
e. Using the Share Graph tool (top right corner), copy below the link to your graph.
https://www.desmos.com/calculator/zgbo4sriex
5. Adjusting the model as necessary by considering context
a. Do you think that, over time, all of the Canadian households will have a mobile subscription, and
why? Make a prediction for % of households that will have a mobile subscription as years pass.
No, not all households will have a mobile subscription, there are certain households that do not
partake in technology due to expenses, religion, region, or lifestyle. This author predicts that
95% of households will have a mobile subscription as years pass.
b. Looking at the regression function 𝑀(𝑡) that models the rate of household mobile subscriptions
data over time since 2004, how does that model match with your prediction, both by looking at
the graph of the function and by analyzing the function using mathematical analysis techniques
(hint: limits)?
This Author realizes that the model does not match up with this authors prediction for the
model, the model continues increasing in the positive direction approaching infinity. This
authors prediction where that 95% of subscribers per 100 households would have a mobile
service as years pass, which meant that eventually the function would indeed have an horizontal
asymptote.
M(t) = -k*m^(-t) + b
lim𝑡→∞
−35.5749 + 94.4542
1.14441𝑡
lim𝑡→∞
= 94.4542
The limit goes to a small number over a very big number with 94.4542 remaining, this concludes
that this authors predictions are not accurate to the model, as the years pass the % of mobile
subscribers per 100 households will go to 94.4542, however this author chose 95% as a
prediction which is impossible according to the limit
c. Which parameter would have to change in the function 𝑀(𝑡) to match it with your prediction,
why, and to what value?

Last Name: Chattha First Name: Muhammad Student ID #: 100748669
Modeling using functions: Communications Services in Canadian Households – Subscriptions Author: Ana Duff, Ontario Tech University, [email protected] Page 11 of 19
This author would change the “c” parameter because it represents the horizontal asymptote
where the model of the function will approach but will never reach, this author would change
the value to 95.0 to match this authors predictions for the model
d. Recreate the model using Desmos with this change. Using the Share Graph tool (top right
corner), export and insert the image of the resulting graph below, resizing it to 2’’ in height.
e. Does the new regression function appear to model well the known data, while agreeing with
your prediction? Briefly explain your reasoning.

Student work sample (2)
Modeling using functions: Communications Services in Canadian Households – Subscriptions Author: Ana Duff, Ontario Tech University, [email protected] Page 12 of 19
The regression model does appear to model the data well while agreeing with this authors
prediction. While analyzing the model the reader can observe that the model starts at a relative
point of 60, it goes through several of the data points, and approaches but never truly reaches
the horizontal asymptote predicted by this author
f. If applicable, change the parameters in 𝑀(𝑡) to reflect the revised regression model and write
the new formula for 𝑀(𝑡) below.
𝑀(𝑡) = −𝑘 ∗ 𝑚−𝑡 + 95
𝑀(𝑡) = −36.0373 ∗ 1.13987−𝑡 + 95
g. Using the Share Graph tool (top right corner), copy below the link to your graph.
https://www.desmos.com/calculator/nx9e2blvoz
6. Adjusting the model as necessary by considering additional information
a. Consider the data on household mobile subscriptions prior to 2004. Download the data from the
1997 – 2009 Survey of household spending on household equipment from Open Canada. Open
the CSV file and use the following filters (Data – Filter Excel tool) to retrieve the data on
Canadian household mobile subscription rates:
• GEO: Canada
• Household equipment: Households having a cellular telephone
• UOM: Percent
Copy the resulting table below.
b. Does this data match the data you already have on household mobile subscription rates for
years 2004 to 2016? Briefly state what might explain the discrepancies, if any.
The data above does not fully match the data on household mobile subscription rates for the
years from 2004 to 2016, for example from 2005 to 2009 the data is off by a percent or two. This
Student work sample (2)
Modeling using functions: Communications Services in Canadian Households – Subscriptions Author: Ana Duff, Ontario Tech University, [email protected] Page 13 of 19
author believes that these discrepancies are from data gathering between 100 households to
239.
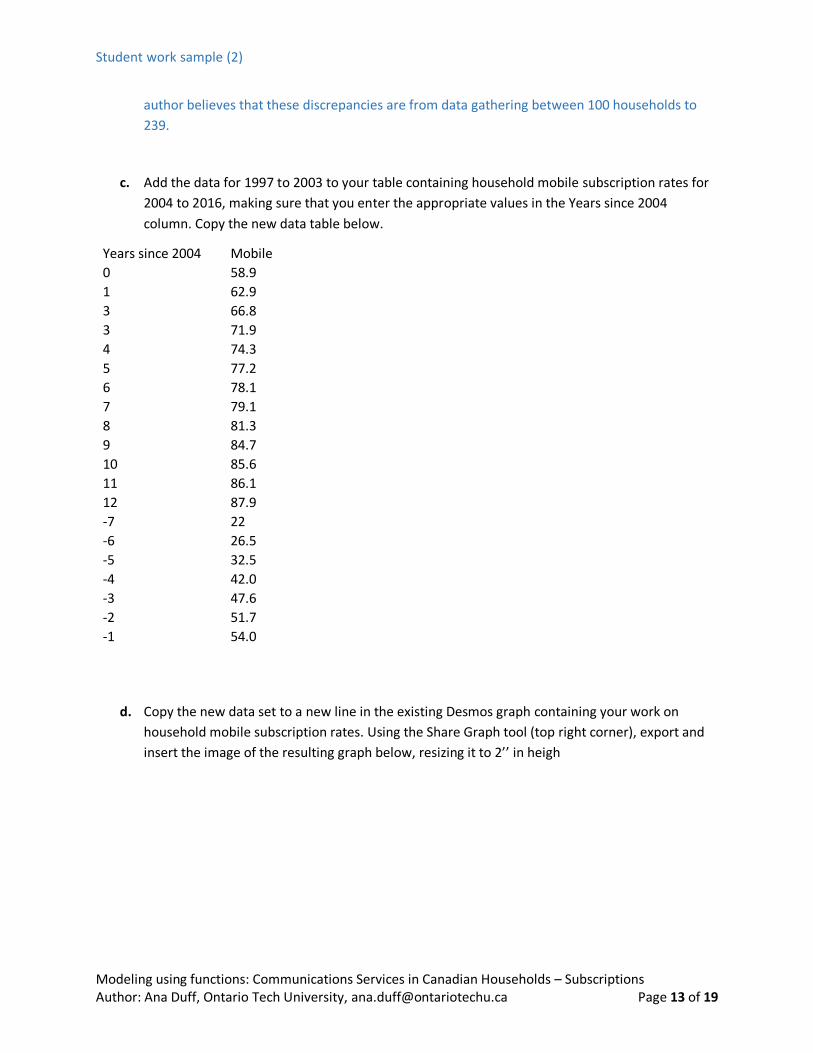
c. Add the data for 1997 to 2003 to your table containing household mobile subscription rates for
2004 to 2016, making sure that you enter the appropriate values in the Years since 2004
column. Copy the new data table below.
Years since 2004 Mobile
0 58.9
1 62.9
3 66.8
3 71.9
4 74.3
5 77.2
6 78.1
7 79.1
8 81.3
9 84.7
10 85.6
11 86.1
12 87.9
-7 22
-6 26.5
-5 32.5
-4 42.0
-3 47.6
-2 51.7
-1 54.0
d. Copy the new data set to a new line in the existing Desmos graph containing your work on
household mobile subscription rates. Using the Share Graph tool (top right corner), export and
insert the image of the resulting graph below, resizing it to 2’’ in heigh

Student work sample (2)
Modeling using functions: Communications Services in Canadian Households – Subscriptions Author: Ana Duff, Ontario Tech University, [email protected] Page 14 of 19
e. Does the regression function 𝑀(𝑡) you used to model household subscription rates appear to
model well the expanded data set? Briefly explain your reasoning.
No, the regression function M(t) that this author used to model the household subscription
rates appears to not model the data set well, this is because regression model does not follow
the data trend exactly and appears have the horizontal asymptote at a lower value on the y axis.
f. Create a new regression model that incorporates the expanded data set and models your
prediction for mobile subscription rates as years pass. Using the Share Graph tool (top right
corner), export and insert the image of the resulting graph below, resizing it to 2’’ in height.

Student work sample (2)
Modeling using functions: Communications Services in Canadian Households – Subscriptions Author: Ana Duff, Ontario Tech University, [email protected] Page 15 of 19
g. Consider the history of cellular phone use, particularly in Canada, by reading Complete Visual
History of Cellphones and Cellphones mark 30 years in Canada. Which of the two models you
created would be a better reflection of the trends since the introduction of mobile phones to
Canadian society, and why?
The second model created by this author would be a better representation of trends since the
introduction of mobile to Canadian society, because according to Rogers Wireless executive
during 1989 believed "The market growth potential was basically the whole of the Canadian
population". The second models population goes towards almost all of Canada having a mobile
service device which is reasonable with the executives prediction because as new cellphones
come out, they are more efficient, portable, and they are more easily accessible and affordable.

Student work sample (2)
Modeling using functions: Communications Services in Canadian Households – Subscriptions Author: Ana Duff, Ontario Tech University, [email protected] Page 16 of 19
h. If applicable, change the parameters in 𝑀(𝑡) to reflect the revised regression model and your
long term predictions, and write the new formula for 𝑀(𝑡) below.
𝑀(𝑡) = −41.261 ∗ 1.10076𝑡 + 101.218
i. Using the Share Graph tool (top right corner), copy below the link to your graph.
https://www.desmos.com/calculator/iodvn09wtp
Making predictions
7. Household mobile subscription rates
a. Using the model you developed for household mobile subscription rates, predict the percentage
of households that will have a mobile subscription in year 2025, in 2030 and in 2050. Show your
calculations.
𝑀(𝑡) = −41.261 ∗ 1.10076𝑡 + 101.218
2025 = 21
𝑀(𝑡) = −41.261 ∗ 1.1007621 + 101.218
𝑀(𝑡) =
𝑀(𝑡) = −38.7415 ∗ 1.10724𝑡 + 99
2030 = 26
𝑀(𝑡) = −38.7415 ∗ 1.1072426 + 99
𝑀(𝑡) = −448.6
2050 = 46
𝑀(𝑡) = −38.7415 ∗ 1.1072446 + 99
𝑀(𝑡) = −848.8

Student work sample (2)
Modeling using functions: Communications Services in Canadian Households – Subscriptions Author: Ana Duff, Ontario Tech University, [email protected] Page 17 of 19
b. What are the projected rates of change in the household mobile subscription rates in 2025, in
2030 and in 2050? Show your calculations and interpret the results.
𝑀′(𝑡) = 𝑡(−38.7415 ∗ 1.10724)𝑡−1
𝑀′(𝑡) = 21(−38.7415 ∗ 1.10724)21−1
Type equation here.
c. Considering the impact the development of cell phones had on landline subscriptions starting 30
years ago, how likely is that your model’s prediction for household mobile subscription rates
and their growth in 2050 and beyond is accurate, and why?
8. Modeling the number of households with mobile subscriptions
a. To obtain the data on number of Canadian households over years since 2004, follow the link to
the Statistics Canada data on Distributions of household economic accounts, number of
households, by income quintile and by socio-demographic characteristic. Click on Add/Remove
reference period and change the reference period to years 2004 to 2016. Click on Apply, then
Download options, then CSV Download as displayed (excluding accompanying symbols).
Change the text in the Income Quintile cell to Years since 2004 and fill the rest of the cells in the
row accordingly. In the row below, enter Number of Canadian households (in millions) and fill
the row for each year since 2004 using the data in the All quintiles row, dividing it by a million.
Select the two rows and create the scatter chart representing the number of Canadian
households (in millions) in the years since 2004. Add the horizontal axis title and copy the chart
below.
b. Looking at the data, what type of function would best model the trend in the number of
Canadian households since 2004? Describe the characteristics of that function type that match
the apparent behavior of the data.
c. State the general form of the function 𝐻(𝑡) for the number of Canadian households 𝑡 years
from 2004 that you believe would best model the data.
d. Add a trendline to the chart in Excel that reflects your choice of the model type and display the
equation for 𝐻(𝑡) on the chart. Write below this equation.

Student work sample (2)
Modeling using functions: Communications Services in Canadian Households – Subscriptions Author: Ana Duff, Ontario Tech University, [email protected] Page 18 of 19
e. What does 𝐻(𝑡) tell you about the rate of change in the number of Canadian households?
f. Using your models 𝑀(𝑡) and 𝐻(𝑡) for the household mobile subscription rates and the number
of Canadian households, determine the function 𝐻𝑀(𝑡) modeling the number of Canadian
households with a mobile subscription 𝑡 years from 2004. Write 𝐻𝑀(𝑡) below.
g. Using the model 𝐻𝑀(𝑡) for the number of Canadian households with mobile subscriptions 𝑡
years from 2004, predict the number of households that will have a mobile subscription in years
2025 and 2030. Show your calculations.
h. What are the projected rates of change in the number of households that will have a mobile
subscription in 2025 and 2030? Show your calculations and interpret the results.
i. Suppose that, due to new technology developments in communications, the household mobile
subscription rate in 2050 is 95% and is decreasing at the rate of 5% per year. Suppose further
that the number of Canadian households continues to grow at the same rate as today. Find the
rate of change in the number of households with a mobile subscription in 2050. Show your
calculations and interpret the result.
THE END
IMPORTANT: BEFORE SUBMITTING, READ AGAIN THE SUBMISSION REQUIREMENTS ON PAGE
1 AND ENSURE ALL REQUIREMENTS ARE MET.

Student work sample (2)
Modeling using functions: Communications Services in Canadian Households – Subscriptions Author: Ana Duff, Ontario Tech University, [email protected] Page 19 of 19
Sources:
Canadian Radio-television and Telecommunications Commission. Communications Services in Canadian
Households: Subscriptions and Expenditures 2012-2016. Published under the Open Government Licence
– Canada. Retrieved from https://crtc.gc.ca/eng/publications/reports/policymonitoring/2018/cmr1.htm
on February 29, 2020.
Canadian Radio-television and Telecommunications Commission. Communications Services in Canadian
Households Subscriptions and Expenditures. Published under the Open Government Licence – Canada.
Retrieved from https://open.canada.ca/data/en/dataset/f7aea609-4a2c-4e20-ba1a-08e0ad2789d1 on
February 29, 2020.
Statistics Canada. Table 36-10-0101-01 Distributions of household economic accounts, number of
households, by income quintile and by socio-demographic characteristic. Retrieved from
https://doi.org/10.25318/3610010101-eng on February 29, 2020.
Watch The Incredible 70-Year Evolution Of The Cell Phone. Justin Meyers, WonderHowTo. Published by
Business Insider on May 6, 2011, 10:47 AM. Retrieved from
https://www.businessinsider.com/complete-visual-history-of-cell-phones-2011-5 on February 29, 2020.
Cellphones mark 30 years in Canada. Peter Henderson, The Canadian Press. Published by the Canadian
Broadcasting Corporation on Jun 29, 2015 1:44 PM ET (last updated: June 29, 2015). Retrieved from
https://www.cbc.ca/news/technology/cellphones-mark-30-years-in-canada-1.3132058 on March 1,
2020.