modelling railway signal asset management
TRANSCRIPT
PhD Student: Raphaelle Barbier Saint Hilaire
Supervisors: Professor John Andrews and Doctor Darren Prescott
Modelling Railway Signal
Asset Management
The aim is to produce an asset management model for the signalling system developing the safety and service disruption level outputs.
Objectives:
Research Aim and Objectives
The Signalling on the railway network is a complex system consisting of many different interdependent devices.
• Signalling (Semaphore signals, Electrical signal with bulbs or LED)
• Track Occupancy Detection (axle counters, track circuits)
• Interlocking and traffic control centre
• Control system (AWS, TSS, OSS)
• Power supply
• Level crossing
• Vehicles (Trains, cars)
The current Asset Management system study the system structure, the operation
of the line, the failure data and the maintenance process to calculate the Asset
Management Cost. However the importance of safety on the Railways isn’t to be
proved anymore, as is the customer satisfaction. The next generation of Asset
management will therefore have to include safety and delay management.
• Convert the model into a C program.
• Decouple the signalling system models from the traffic flows (trains + cars).
• Modularise the signalling system features with a view to longer term putting them in a library for the optimisation.
The signalling system of the part of the East Sussex Coast Line has been modelled using a Coloured Petri Nets software called “CPN Tools”. The part of the line
studied runs from Pevensey & Westham to Bexhill. Then, incidents and their risk to happen have been implemented in the model.
System Structure
Failure Data
Operation
Maintenance
Safety
Service Disruption
Asset Management CostsThe Next Generation of Asset Management
The Railway Signalling System
A Timed Coloured Petri Net Model
IncidentsLine
Delay recorder
High risk recorder
Accident recorder
OUTPUTS MODEL INPUTS
Train & Timetable
Incident distribution
Repairs
Next Steps
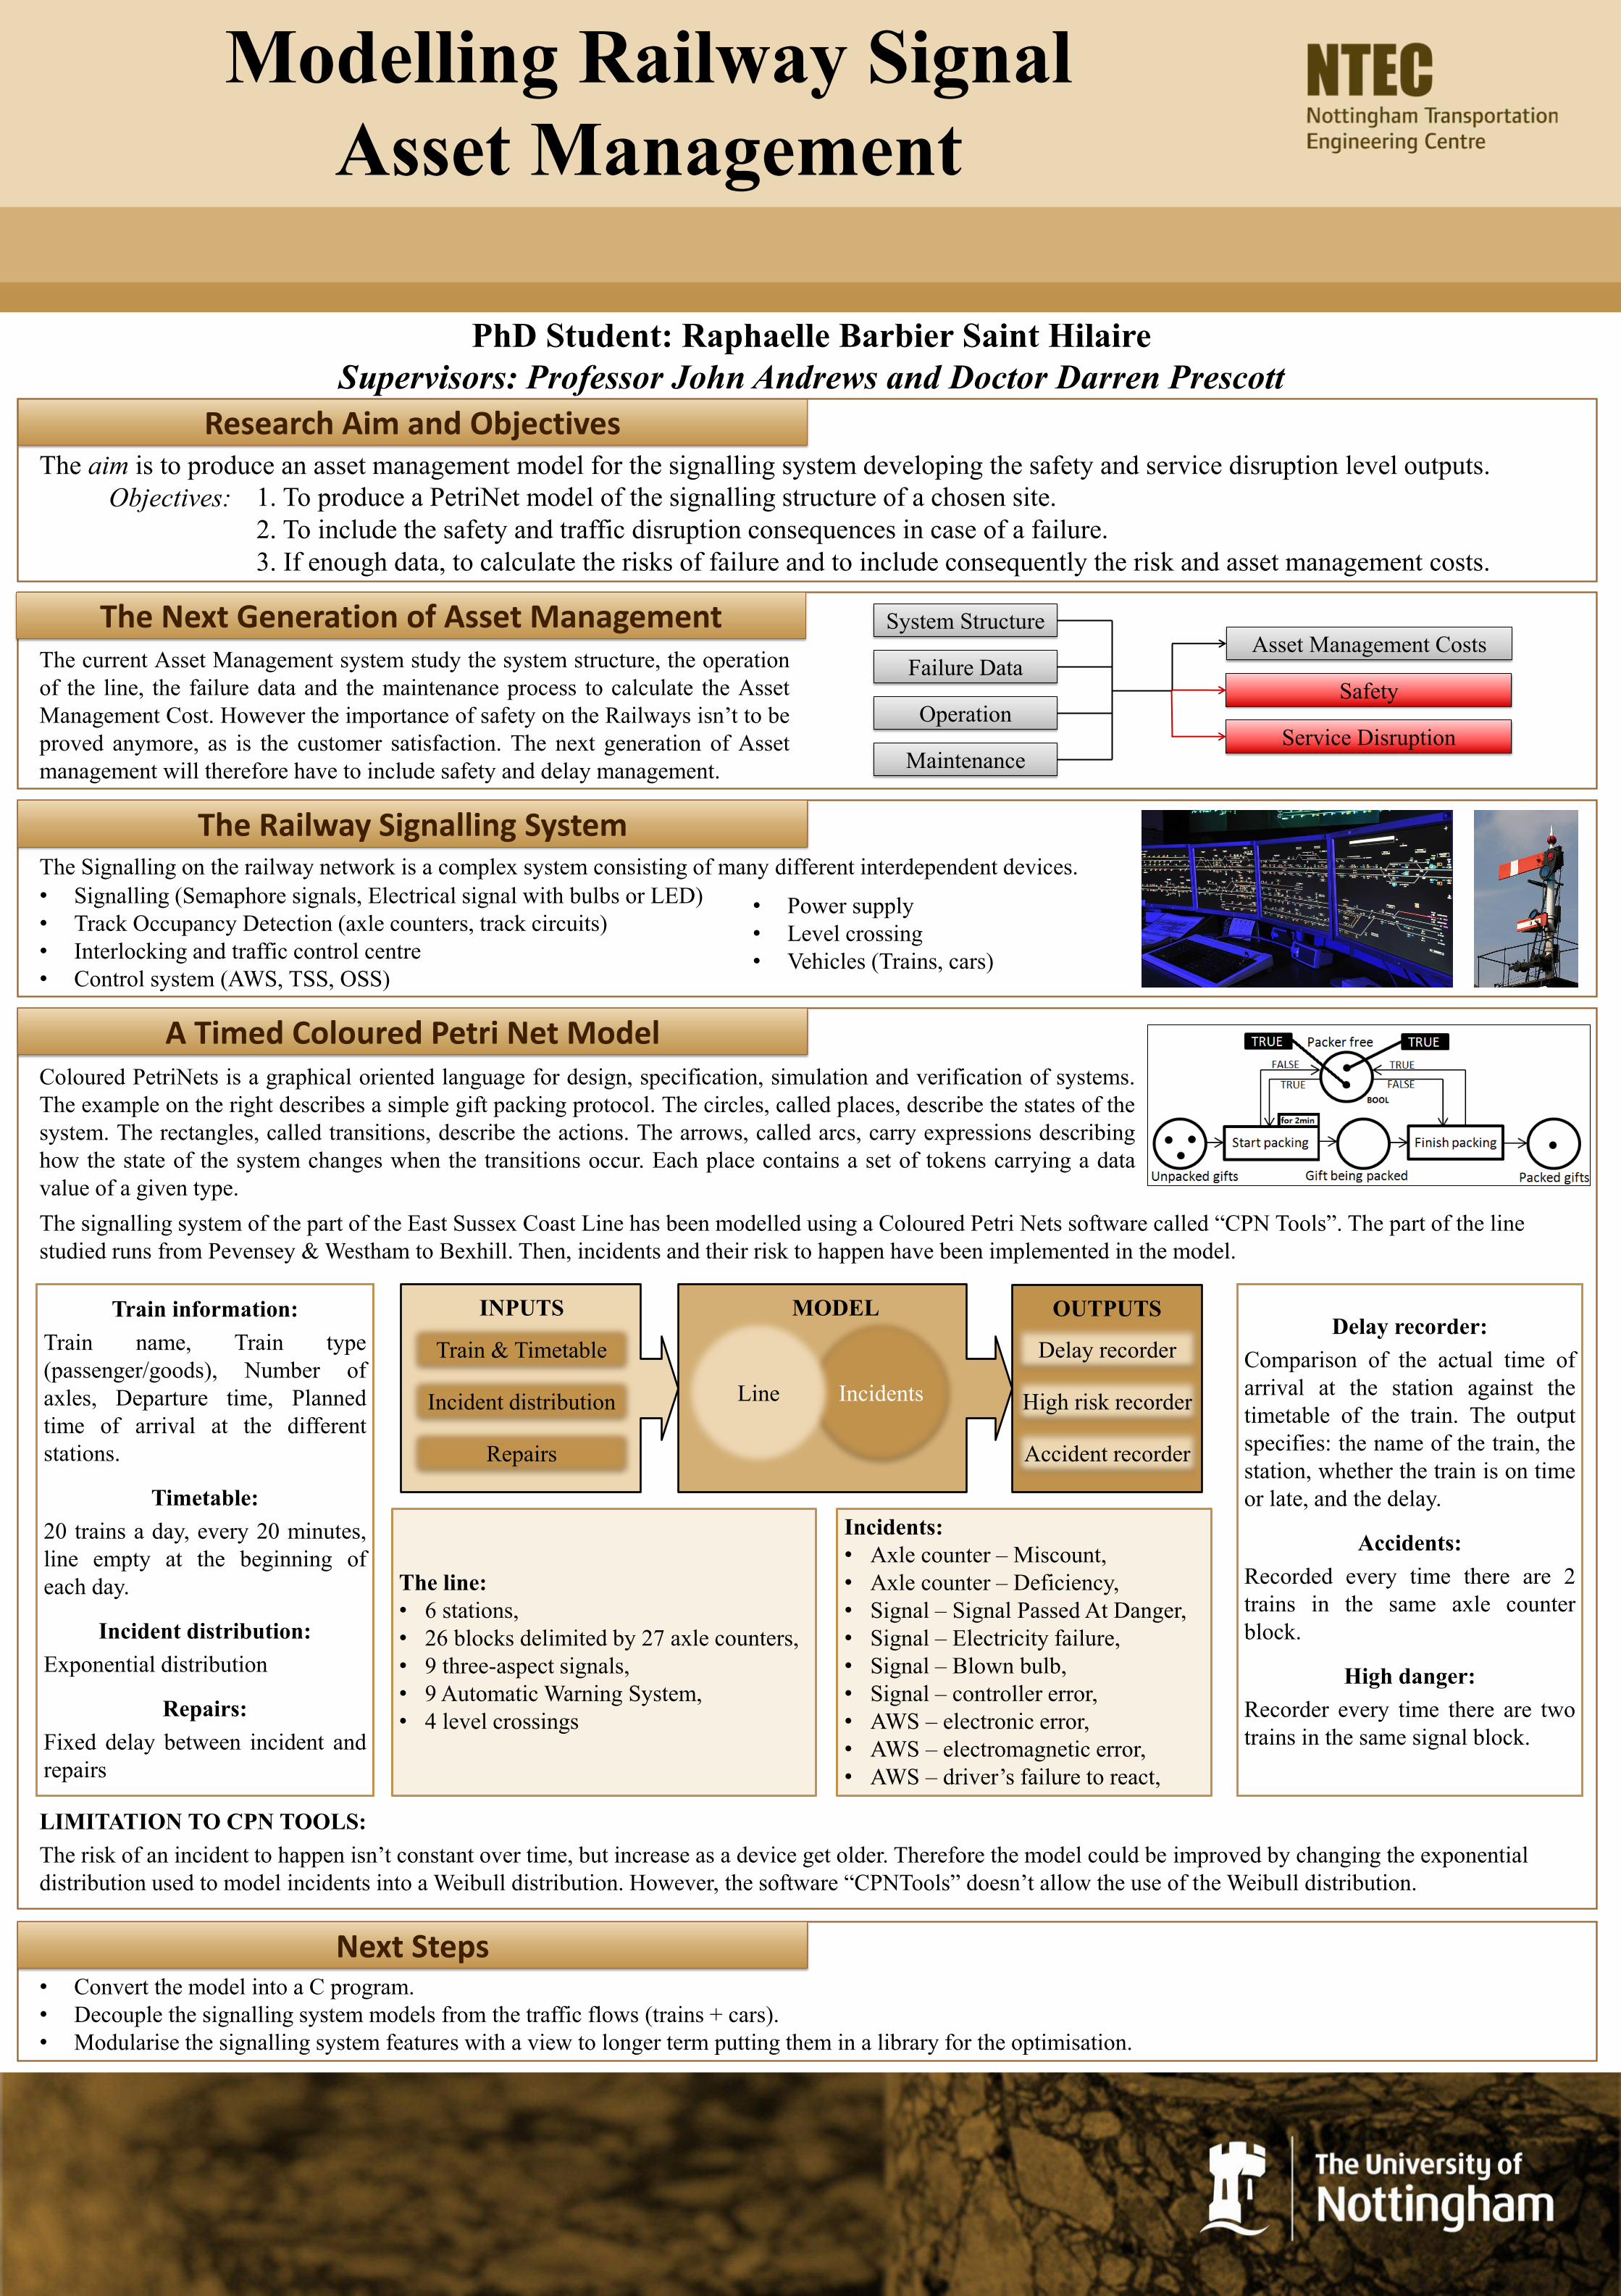
Coloured PetriNets is a graphical oriented language for design, specification, simulation and verification of systems.
The example on the right describes a simple gift packing protocol. The circles, called places, describe the states of the
system. The rectangles, called transitions, describe the actions. The arrows, called arcs, carry expressions describing
how the state of the system changes when the transitions occur. Each place contains a set of tokens carrying a data
value of a given type.
1. To produce a PetriNet model of the signalling structure of a chosen site.
2. To include the safety and traffic disruption consequences in case of a failure.
3. If enough data, to calculate the risks of failure and to include consequently the risk and asset management costs.
Train information:
Train name, Train type
(passenger/goods), Number of
axles, Departure time, Planned
time of arrival at the different
stations.
Timetable:
20 trains a day, every 20 minutes,
line empty at the beginning of
each day.
Incident distribution:
Exponential distribution
Repairs:
Fixed delay between incident and
repairs
Delay recorder:
Comparison of the actual time of
arrival at the station against the
timetable of the train. The output
specifies: the name of the train, the
station, whether the train is on time
or late, and the delay.
Accidents:
Recorded every time there are 2
trains in the same axle counter
block.
High danger:
Recorder every time there are two
trains in the same signal block.
The line:
• 6 stations,
• 26 blocks delimited by 27 axle counters,
• 9 three-aspect signals,
• 9 Automatic Warning System,
• 4 level crossings
Incidents:
• Axle counter – Miscount,
• Axle counter – Deficiency,
• Signal – Signal Passed At Danger,
• Signal – Electricity failure,
• Signal – Blown bulb,
• Signal – controller error,
• AWS – electronic error,
• AWS – electromagnetic error,
• AWS – driver’s failure to react,
LIMITATION TO CPN TOOLS:
The risk of an incident to happen isn’t constant over time, but increase as a device get older. Therefore the model could be improved by changing the exponential
distribution used to model incidents into a Weibull distribution. However, the software “CPNTools” doesn’t allow the use of the Weibull distribution.