modification chimique de la cellulose nanofibrillée par
TRANSCRIPT

HAL Id: tel-00952026https://tel.archives-ouvertes.fr/tel-00952026
Submitted on 26 Feb 2014
HAL is a multi-disciplinary open accessarchive for the deposit and dissemination of sci-entific research documents, whether they are pub-lished or not. The documents may come fromteaching and research institutions in France orabroad, or from public or private research centers.
L’archive ouverte pluridisciplinaire HAL, estdestinée au dépôt et à la diffusion de documentsscientifiques de niveau recherche, publiés ou non,émanant des établissements d’enseignement et derecherche français ou étrangers, des laboratoirespublics ou privés.
Modification chimique de la cellulose nanofibrillée parles alcoxysilanes : application à l’élaboration de
composites et moussesZheng Zhang
To cite this version:Zheng Zhang. Modification chimique de la cellulose nanofibrillée par les alcoxysilanes : applicationà l’élaboration de composites et mousses. Other. Université Sciences et Technologies - Bordeaux I,2013. English. �NNT : 2013BOR14888�. �tel-00952026�

N° d'ordre : 4888
THESE
présentée à
L'UNIVERSITÉ BORDEAUX 1
ÉCOLE DOCTORALE DES SCIENCES CHIMIQUES
par
ZHENG ZHANG
POUR OBTENIR LE GRADE DE
DOCTEUR
SPÉCIALITÉ: POLYMÈRES
CHEMICAL FUNCTIONALIZATION OF NANOFIBRILLATED CELLULOSE BY ALKOXYSILANES: APPLICATION TO THE
ELABORATION OF COMPOSITES AND FOAMS
Soutenue le 12 Novembre 2013 Après avis de : MM. N. Belgacem, Professeur, INP-Pagora, Grenoble Rapporteur P. Navard, Directeur de recherche, CEMEF, Nice Rapporteur Devant la commission d'examen formée de: MM. B. De Jéso, Professeur, Université Bordeaux, Bordeaux Président N. Belgacem, Professeur, INP-Pagora, Grenoble Rapporteur P. Navard, Directeur de recherche, CEMEF, Nice Rapporteur T. Zimmermann, Dr., EMPA, Dübendorf Examinateur P. Tingaut, Dr., EMPA, Dübendorf Examinateur G. Sèbe, Maître de Conférences, Université Bordeaux, Bordeaux Examinateur
- 2013 -


Acknowledgements
I wish to express my most sincere gratitude to my supervisors, Dr. Gilles Sèbe of University
Bordeaux and Dr. Philippe Tingaut of EMPA. Dr Gilles Sèbe gave me the most valuable
advice, to guide me on the right way. Despite the distance between Bordeaux and Zurich, the
communication with Dr. Sèbe and his feedbacks were always very fast, which I really
appreciated. Dr. Philippe Tingaut has spent countless time and work in this project, and I
deeply thank him for the discussions, helps, suggestions and feedbacks at any time. He was
not only a great supervisor, but also a good colleague during my entire PhD study.
I would also like to express my special gratitude to our head of the lab, Dr. Tanja
Zimmermann, who has greatly supported me, helped me during some difficult periods and
shared her experience with me, as an experienced scientist, as well as a friend.
This work would not be possible without helps from many people and my few words of
gratefulness could not be compared with the help and support these people gave me. I would
like to thank my great and supportive colleagues, Margrit Conradin, Esther Strub, Dr.
Houssine Sehaqui, Paola Orsolini, Franziska Grüneberger, Uxua Pérez de Larraya, Dr.
Sebastien Josset, Anja Huch, Robert Widmann, Robert Jockwer and my students Julia Weiss,
Vincent and Christoph. Many other people of the institute have also contributed very
important parts to this book: Beatrice Fischer, Dr. Daniel Rentsch, Marcel Rees and Dr.
James Eilertsen.
In the end, I wish to avail myself of this opportunity, to express a sense of appreciation and
love to my mother and my deceased father for their unconditional love and support. Last but
not least, my beloved husband deserves my most heartily thanks for his support,
encouragement and understanding.


Ce travail de thèse s’inscrit dans le cadre d’un projet financé par la Commission pour la
Technologie et l’Innovation (CTI) Suisse (projet « SICEPO », contrat CTI N° 9725.1) visant à
développer une méthode de silylation de la Cellulose Nanofibrillée (CNF) en milieu aqueux
afin d’améliorer ses propriétés intrinsèques et étendre son champs d’applications. Ce projet a
été réalisé au Swiss Federal Laboratories for Materials Science and Technology (EMPA,
Dübendorf, Suisse) en collaboration avec le Laboratoire de Chimie des Polymères Organiques
(LCPO, Université de Bordeaux, France) et deux partenaires industriels : Falcone Chemical
Specialities Ltd. (Siebnen, Suisse) et Jelu-Werk Josef Ehrler GmbH & Co. KG (Rosenberg,
Allemagne).
Au cours de ce travail, la cellulose nanofibrillée (CNF) a été isolée à partir de fibres de
paille d’avoine puis modifiée chimiquement par des alcoxysilanes en milieu aqueux. La CNF
silylée a ensuite été utilisée pour élaborer de nouveaux matériaux composites et mousses bio-
sourcés.
Après une introduction générale situant le contexte de cette thèse, une première partie
bibliographique (Chapitre I) présente la composition chimique des plantes, les différentes mé-
thodes de synthèse des nanocelluloses, et décrit les propriétés principales de la CNF (Figure
1) ainsi que ses applications dans le domaine des composites, aérogels et mousses. La CNF
présentant certains inconvénients liés à sa structure chimique (en particulier son caractère hy-
drophile), un état de l’art des différentes approches de fonctionnalisation chimique permettant
de limiter ses inconvénients est présenté. Au regard de cette étude bibliographique, il apparaît
que la majorité des méthodes de modification chimique envisagées jusqu’à présent nécessitent
des conditions anhydres et l’utilisation de solvants organiques. Il existe cependant une mé-
thode à base d’alcoxysilanes, permettant de fonctionnaliser les substrats hydroxylés en milieu
aqueux et dans des conditions douces. Cette méthode de silylation ayant été très peu appliquée
à la CNF, il nous est apparu nécessaire de poursuivre et amplifier les recherches dans ce do-
maine, afin de mieux caractériser le matériau silylé et de bien maîtriser le procédé.

Figure 1 Photomicrographie de NFC isolée à partir de paille d’avoine, utilisée lors de
ce travail de thèse.
Le chapitre II est consacré à la fonctionnalisation de la CNF par le méthyltriméthoxysi-
lane (MTMS) – choisi comme alcoxysilane modèle – ainsi qu’à la caractérisation du matériau
silylé. Plusieurs paramètres réactionnels (pH, temps de réaction, concentration initiale en
MTMS) ont été étudiés et optimisés, à partir de deux protocoles expérimentaux distincts,
nommés Protocole 1 et Protocole 2. Les modifications ont été caractérisées à l’échelle molé-
culaire par différentes techniques physico-chimiques, en utilisant notamment la spectroscopie
infra-rouge à transformée de Fourier (IRTF) et la Résonnance Magnétique Nucléaire en phase
solide (RMN CP-MAS du 13C et du 29Si). Afin d’étudier de façon systématique l’impact des
paramètres réactionnels sur la silylation de la CNF, une méthode rapide et efficace pour suivre
l’évolution du taux de silane dans le matériau a d’abord été développée. A partir d’un nombre
limité d’échantillons, une droite de calibration permettant de déterminer le pourcentage de si-
licum à l’intérieur des échantillons, directement à partir des spectre IRTF, a ainsi été élaborée.
Les résultats présentés dans ce chapitre ont montré qu’il était possible de silyler la CNF
avec le MTMS en milieu aqueux. Les deux protocoles envisagés ont conduit à des matériaux
très différents, tout en préservant la structure cristalline originale de la CNF. Le Protocole 1 à
conduit à un matériau constitué de particules de polysiloxane dispersées dans le réseau de
CNF (Figure 2a), alors qu’avec le Protocole 2 des nanofibrilles recouvertes d’une couche de
polysiloxane ont été obtenues (Figure 2b). La taille des particules et l’épaisseur des couches
de polysiloxanes ont pu être contrôlées en ajustant la concentration initiale en MTMS. Les
tests de lessivages ont montré que seul le Protocole 2 permettait une fixation durable du poly-
siloxane à la surface de la CNF. Des différences ont également été notées en termes de mouil-
labilité et de stabilité thermique. La CNF silylée issue du Protocole 1 s’est avérée hydrophile,

Les flèches blanches pointent les particules de polysiloxane
alors que le Protocole 2 a conduit à un matériau très hydrophobe. Une augmentation significa-
tive de la stabilité thermique a également été notée dans ce dernier cas.
Figure 2 Photomicrographies de CNF traitée avec le MTMS selon le Protocole 1 (a) ou le Protocole 2 (b) (barre d’échelle : 10 µm). La distribution du silicium obtenue par analyse dis-persive en longueur d’onde (WDX) est également reportée (barre d’échelle : 100 µm).
Dans le chapitre III, l’impact de la silylation sur les propriétés de composites à matrice
acide poly(lactique) (PLA) ou polydiméthylsiloxane (PDMS) chargée en CNF a été évalué.
Les propriétés mécaniques, la stabilité thermique et l’hygroscopicité des composites ont parti-
culièrement été étudiées. Des résultats différents ont été obtenus en fonction de la matrice po-
lymère utilisée.
Pour les composites à matrice PDMS chargés avec 1% de CNF, une augmentation du module
de cisaillement (G’), du module d’Young (E) et de la résistance en traction ont été obtenues
après silylation à partir du Protocole 2 dans certaines conditions. Par contre, une diminution
a
WDX
b WDX

de la déformation à la rupture a systématiquement été mesurée et le matériau s’est avéré plus
hygroscopique que le PDMS seul (mais la prise en eau reste faible).
Pour les composites à matrice PLA chargés avec 10% de CNF, aucune amélioration notable
des propriétés mécaniques a été notée après silylation, voire une détérioration. Une augmenta-
tion de l’hygroscopicité a été mesurée en présence de CNF (mais la silylation tend à réduire
la prise en eau).
Une augmentation de la stabilité thermique des composites (PDMS et PLA) a été mise en évi-
dence en présence de CNF silylée, mais aucune tendance n’a pu être établie ou corrélée avec
le taux de silylation ou le type de protocole utilisé.
Dans le chapitre IV, la CNF silylée à partir du Protocole 2 a été utilisée pour produire
de nouveaux matériaux moussés hydrophobes et oléophiles. Des mousses ultra-légères (≤ 17.3
Kg/m3), poreuses (≥ 99%) et possédant une faible surface spécifique (≤ 20 m2/g) ont été syn-
thétisées. L’analyse microscopique a montré que la structure interne des matériaux étant ma-
joritairement composée d’un réseau 3D de feuillets et nanofilaments interconnectés.
Les propriétés mécaniques des mousses ont été évaluées sous compression. Une augmentation
du module d’élasticité et de la résistance à 50% de déformation ont été notées avec
l’augmentation du niveau de silylation. De façon remarquable, les mousses silylées ont pré-
senté une très grande élasticité par rapport au matériau de référence non modifié, la déforma-
tion sous compression étant quasi réversible à partir d’un certain taux de silylation (Figure 3).
Figure 3 Schéma présentant la reprise en épaisseur (S) des mousses silylées après un test de compression réalisé à 50% de déformation (ε = 50%).
61% 72% 76% 75%
82% 78% 86%
96%
0 2.1 3.5 4.4 6.8 9.1 18.9 38.1CNF non modifiée Elasticité augmente avec Si %
100%
ε = 50
%
S [%] = 100 - εfinal
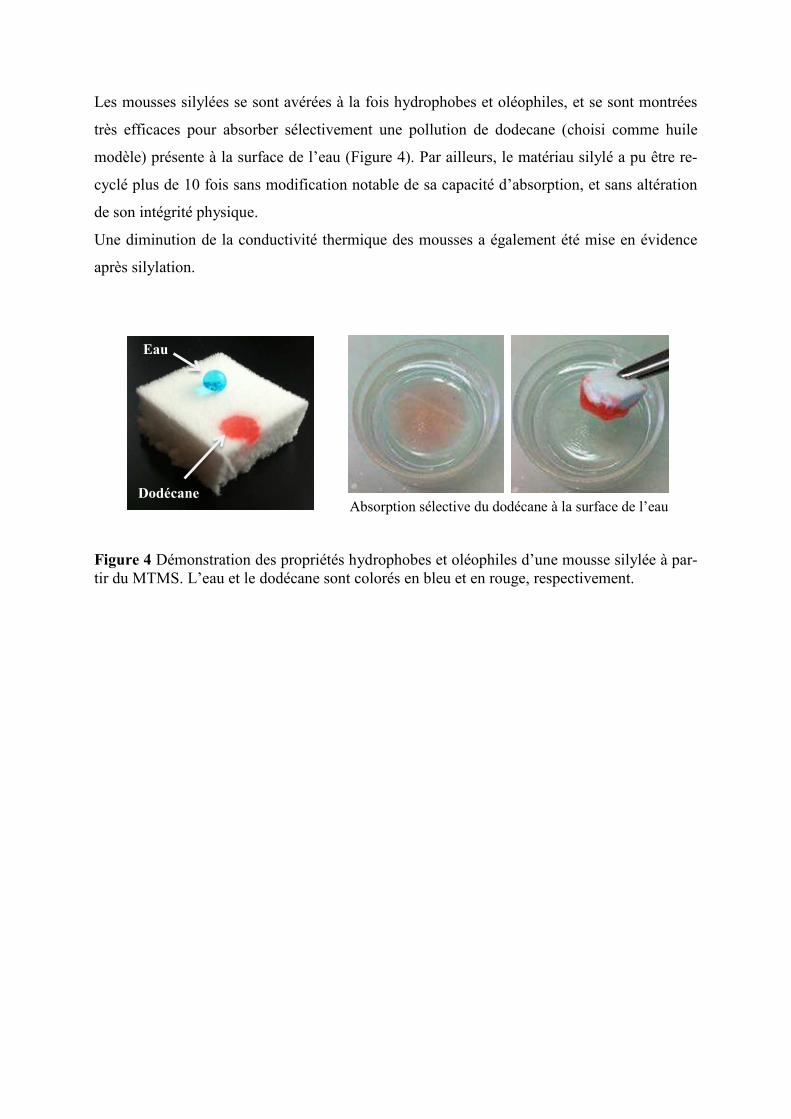
Les mousses silylées se sont avérées à la fois hydrophobes et oléophiles, et se sont montrées
très efficaces pour absorber sélectivement une pollution de dodecane (choisi comme huile
modèle) présente à la surface de l’eau (Figure 4). Par ailleurs, le matériau silylé a pu être re-
cyclé plus de 10 fois sans modification notable de sa capacité d’absorption, et sans altération
de son intégrité physique.
Une diminution de la conductivité thermique des mousses a également été mise en évidence
après silylation.
Figure 4 Démonstration des propriétés hydrophobes et oléophiles d’une mousse silylée à par-tir du MTMS. L’eau et le dodécane sont colorés en bleu et en rouge, respectivement.
Eau
Dodécane Absorption sélective du dodécane à la surface de l’eau

Table of content
General introduction ____________________________________________ 1
I. Generalities ________________________________________________ 3
I.1. Chemical composition of plant fibres __________________________________ 3
I.1.1. Macromolecular substances _______________________________________ 3
I.1.2. Low molecular weight substances ___________________________________ 6
I.1.3. Chemical composition of oat straw __________________________________ 7
I.2. Structure of plant cell walls __________________________________________ 7
I.2.1. Middle lamella and primary wall ___________________________________ 8
I.2.2. Secondary wall (S) ______________________________________________ 8
I.3. Nanofibrillated cellulose (NFC): isolation and morphological characteristics _ 9
I.3.1. Nomenclature __________________________________________________ 9
I.3.2. Isolation methods _______________________________________________ 9
I.3.3. Properties of NFC ______________________________________________ 11
I.4. Applications of NFC _______________________________________________ 12
I.4.1. NFC as reinforcing agents in composites ____________________________ 13
I.4.2. NFC as matrix for the elaboration of aerogels or foams _________________ 16
I.5. Chemical functionalization of NFC ___________________________________ 20
I.5.1. Context ______________________________________________________ 20
I.5.2. Oxidation _____________________________________________________ 21
I.5.3. Esterification __________________________________________________ 22
I.5.4. Etherification __________________________________________________ 23
I.5.5. Carbamylation reactions _________________________________________ 25
I.5.6. Silylation _____________________________________________________ 26
I.5.7. Other reactions ________________________________________________ 28
I.5.8. Concluding remarks and objectives of the thesis ______________________ 30
II. Silylation of NFC with methyltrimethoxysilane: optimization of the
treatment and characterization of the silylated material ________________ 33

II.1. Preliminary investigations __________________________________________ 33
II.1.1. Brief overview on the reactivity of trialkoxysilanes ____________________ 33
II.1.2. Calibration chart for the evaluation of the Si content from IR spectra ______ 37
II.2. Impact of reaction parameters _______________________________________ 39
II.2.1. Experimental protocols __________________________________________ 40
II.2.2. Impact of pH (Protocol 1) ________________________________________ 40
II.2.3. Impact of reaction time (Protocol 1 & 2) ____________________________ 47
II.2.4. Impact of initial silane concentration (Protocol 1 & 2) _________________ 53
II.3. Properties of silylated NFC _________________________________________ 58
II.3.1. Resistance to leaching ___________________________________________ 59
II.3.2. Crystallinity ___________________________________________________ 61
II.3.3. Wettability and hygroscopicity ____________________________________ 63
II.3.4. Thermal stability _______________________________________________ 66
II.4. Concluding remarks _______________________________________________ 69
III. Silylated NFC as reinforcing agents in composites _______________ 71
III.1. Objectives and methodology ______________________________________ 71
III.2. PDMS composites _______________________________________________ 71
III.2.1. Viscoelastic properties __________________________________________ 72
III.2.2. Tensile properties ______________________________________________ 75
III.2.3. Thermal stability _______________________________________________ 77
III.2.4. Hygroscopicity ________________________________________________ 79
III.3. PLA composites _________________________________________________ 80
III.3.1. Crystallinity of PLA in composites _________________________________ 80
III.3.2. Viscoelastic properties __________________________________________ 81
III.3.3. Tensile properties ______________________________________________ 83
III.3.4. Thermal stability _______________________________________________ 85
III.3.5. Hygroscopicity ________________________________________________ 87
III.4. Concluding remarks ________________________________________________ 88
IV. Utilisation of silylated NFC for the elaboration of foams __________ 89
IV.1. Objectives and methodology ______________________________________ 89

IV.2. Silylation of NFC foams __________________________________________ 90
IV.2.1. Evolution of Si content __________________________________________ 90
IV.2.2. Solid-state NMR characterization __________________________________ 90
IV.2.3. Microscopy ___________________________________________________ 90
IV.3. Properties of silylated NFC foams __________________________________ 94
IV.3.1. Density, porosity and specific surface area ___________________________ 94
IV.3.2. Compressive properties __________________________________________ 95
IV.3.3. Wettability and hygroscopicity ____________________________________ 97
IV.3.4. Oleophilic properties ____________________________________________ 99
IV.3.5. Thermal conductivity __________________________________________ 103
IV.4 Concluding remarks ________________________________________________ 104
V. General conclusion ________________________________________ 107
VI. Materials and Methods____________________________________ 111
VI.1. Materials _____________________________________________________ 111
VI.1.1. Chemicals ___________________________________________________ 111
VI.1.2. Laboratory equipment __________________________________________ 111
VI.2. Production of nanofibrillated cellulose _____________________________ 112
VI.3. Silylation of NFC’s _____________________________________________ 113
VI.3.1. Protocol 1 ___________________________________________________ 113
VI.3.2. Protocol 2 ___________________________________________________ 114
VI.3.3. Protocol 2’ ___________________________________________________ 115
VI.4. Elaboration of composite films and silylated foams ___________________ 115
VI.4.1. Elaboration of PDMS-composites _________________________________ 116
VI.4.2. Elaboration of PLA-composites __________________________________ 116
VI.4.3. Elaboration of unmodified and silylated NFC foams __________________ 116
VI.5. Characterization methods _______________________________________ 117
VI.5.1. Characterization of NFC ________________________________________ 117
VI.5.2. Characterizations of composites __________________________________ 120
VI.5.3. Characterizations of NFC foams __________________________________ 122
References __________________________________________________ 127


1
General introduction
This research project was founded by the Commission for Technology and Innovation (CTI)
of Switzerland and was initiated in cooperation between the Swiss Federal Laboratories for
Materials Science and Technology (Dübendorf, Switzerland), the University of Bordeaux 1
(Bordeaux, France) and two industrial partners, namely: Falcone Chemical Specialities Ltd.
(Siebnen, Switzerland) and Jelu-Werk Josef Ehrler GmbH & Co. KG (Rosenberg, Germany).
In the context of petroleum resources depletion, new environmental regulations and spread of
sustainability concerns, cellulose has increasingly drawn attention over the last three
decades.1 Cellulose is the most abundant polymer on the earth, representing about 1.5 x 10¹²
tons of the total annual biomass production,2 and it presents very attractive properties.
Cellulose fibres have low cost, are renewable, biodegradable, have high specific strength and
modulus, low density,3, 4 and can replace conventional inorganic or petroleum-based materials
in composites applications.5, 6
In recent years, interest has been increasingly focused on nanocelluloses extracted from wood
or plants, as exemplified by the increasing number of scientific publications and patents
published since the beginning of the 21st century.7 Nanocelluloses such as cellulose
nanocrystals, nanofibrillated cellulose or electro-spinned cellulose nanofibres, possess highly
interesting properties related to their high aspect ratio and specific surface area, as well as
good mechanical properties.8, 9 Hence, they have the potential to serve as building blocks for
the elaboration of novel functional materials.7, 10-12
In particular, nanofibrillated cellulose (NFC) has been extensively considered as reinforcing
agent in polymer matrices for composites application.7, 12-14 More recently, promising
lightweight, flexible and robust cellulosic foams have been successfully prepared using NFC
as starting material.10 However, the hydroxylated surface of these nanofibrils is often pointed
out as a limiting factor for its use in commercial applications. In particular, NFC undergoes
irreversible aggregation upon drying (hornification), which precludes any dry processes.
Additionally, NFC fibrils cannot be ideally dispersed in non-polar solvents, monomers or
polymers since the hydrophilic surface of the NFC is incompatible with hydrophobic
environments (the NFC tends to aggregate by hydrogen bonding). Furthermore, the strong

2
tendency of NFC to absorb water is often undesirable in many composites and foams
applications.
As most of these drawbacks and limitations are related to the chemical nature of the NFC
surface, they can be suppressed or limited by chemical functionalization. For instance,
hydrophobic functions can be grafted at the NFC surface to decrease the interfacial energy
and increase their interaction with hydrophobic environments (physical or chemical
interactions). A decrease in the hydrophilicity of the NFC composites and foams can also be
obtained by this method.
As hydroxyl groups are the most reactive sites at the NFC surface, reactions based on alcohol
chemistry have mostly been explored in the literature. The reactants conditions must be mild
enough to limit cellulose degradation. A broad range of catalysts and solvents have been
tested (in particular DMSO, DMF, toluene and hexane), but due to environmental concerns,
green solvents are increasingly investigated (i.e. scCO2, ionic liquids, and water). Energy
saving procedures, such as microwave-assisted reaction,15, 16 are also increasingly considered.
In this context, we envisaged monitoring the surface of NFC produced from oat straw, by
developing an environmentally friendly method based on alkoxysilanes, which can be
processed in water. Because a large variety of functional groups is available within
commercial alkoxysilanes, it is anticipated that the method will open up opportunities to
broaden the spectrum of application of NFC. In the current thesis, the potential of silylated
NFC as reinforcing agents in composites and as building block for the elaboration of foams
was particularly investigated.
The thesis is divided in six chapters:
Chapter I presents some general aspects about nanocelluloses – in particular NFC - and their
use in composite materials and foams.
Chapter II is dedicated to the functionalization of NFC by methyltrimethoxysilane – chosen as
a model silane – and to the comprehensive examination of the silylated materials. Reaction
conditions such as pH, reaction time and initial silane concentration have been particularly
investigated and optimized using two distinct experiment protocols. The modifications have
been characterized at the molecular level by various physicochemical techniques. The

3
properties of the silylated nanofibres, i.e. the morphology, crystallinity, wettability,
hygroscopicity and thermal stability have been subsequently examined.
Chapter III investigates the impact of silylation on the mechanical, thermal and hygroscopic
properties of NFC-reinforced composites prepared with two distinct polymeric matrices:
polydimethylsiloxane (PDMS) and poly(lactic acid) (PLA).
Chapter IV examines the impact of silylation on the properties of NFC-foams prepared by
freeze drying, in particular the porosity, compressive properties, wettability, hygroscopicity,
oleophilicity and thermal conductivity
A general conclusion is drawn in Chapter V and some outlooks are proposed.
Finally, the materials and methods that have been employed throughout this thesis are
described in Chapter VI.
I. Generalities
I.1. Chemical composition of plant fibres
I.1.1. Macromolecular substances
I.1.1.1. Cellulose
Cellulose can be extracted from different plants and animals, for example, wood, cotton,
bamboo, cereal straw (wheat, oat, rice etc.), algae, bacteria, animal tunicates, etc.17, 18 This
linear polymer is composed of D-anhydroglucopyranose units (AGU) which are linked by β-
1,4-glucosidic linkages. The polymer chain contains one hemiacetal reducing end, and a non-
reducing end with a hydroxyl group in the C4 position (Figure 1).19, 20
Figure 1: Molecular structure of cellulose highlighting the non-reducing end (free hydroxyl at the C4 position) and the reducing end with a hemiacetal group.

4
The degree of polymerization (DP) depends on the source and treatment used to isolate the
polymer. In general, the DP of cellulose obtained from cotton fibres is 8,000-14,000, cotton
linters 1,000-6,500, bagasse 700-900 and wood fibres 8,000-9,000.21 To our knowledge, the
value of DP of cellulose from oat straw (used in the present thesis) is not available in the
literature.
In plant fibres, cellulose chains interact with each other through hydrogen bonds, forming
bundles of fibrils (or microfibrillar aggregates), in which highly ordered regions (i.e.
crystalline phases) alternate with disordered domains (i.e., amorphous phases).4 The
formation of intra- and intermolecular hydrogen bonds have been the subject of many
studies.22-24 While there is only one possibility of hydrogen bonding between O3-H▪▪▪O5,
there are different possibilities for O2-H and O6-H. An example of such hydrogen bonds
network between two cellulose chains in Cellulose I is presented in Figure 2.23
Figure 2: Schematic representation of hydrogen bonds in cellulose Iβ.23 Black: Carbon, red: Oxygen, white: hydrogen of methyl group, green: hydrogen of hydroxyl group; dotted line: hydrogen bonds. Only the oxygen atoms involved in hydrogen bonding are labelled.
The crystallinity degree depends on the source and treatment of the materials. For example,
the crystallinity degree of natural fibres such as cotton, ramie, flax, sisal, and banana is about
65%, while that of regenerated cellulose is about 35%. Four polymorphs of cellulose have
been characterized so far in the literature.25, 26 Cellulose I is the structure of native cellulose,
while other polymorphs are obtained by different chemical treatments of Cellulose I.
Cellulose II is usually obtained after regeneration of native cellulose, or by the mercerization
process (treatment with sodium hydroxide). Cellulose III is formed when Cellulose I or II is

5
modified with organic amines or liquid ammonia, while Cellulose IV is obtained after a
thermal treatment of Cellulose III.19 Each polymorph is defined by its unit cell parameters.25
Cellulose I has two polymorphs, Iα and Iβ, which coexist in different proportions depending
on the sources – Iα is dominant in bacterial and algal celluloses, whereas Iβ is dominant in
plants and tunicates.27, 28 In the present study the cellulose source was oat straw, therefore the
term “cellulose” refers to native cellulose, namely Cellulose I.
I.1.1.2. Hemicelluloses
Hemicelluloses are a heterogeneous group of branched matrix polymers of relatively low
molecular weight. Whereas cellulose contains only glucose, hemicellulose contains a variety
of sugars such as glucose, mannose, xylose, arabinose etc.19 Hemicellulose molecules are
tightly hydrogen bonded to the cellulose microfibrils, acting as a cross-linking matrix between
cellulose and lignin.17 The main monomers constitutive of hemicelluloses are presented in
Figure 3.
Figure 3: The main monomers constitutive of hemicelluloses.20
I.1.1.3. Lignin
Lignin is a very complex polymer composed of highly branched aromatic-aliphatic
moieties.20 In the plant, lignin is synthesized through dehydrogenative polymerization of three
monolignol precursors: p-coumaryl alcohol, coniferyl alcohol and sinapyl alcohol. An
example of lignin structure is presented in Figure 4.29

6
Figure 4: The three fundamental lignin monomer precursors20 (left) and a model of lignin structure29 (right).
Cellulose and hemicelluloses are closely bound by lignin, which provides rigidity and
cohesion to the cell wall, and acts as barrier against moisture or microbial attacks.30
Figure 5: Representation of lignocellulose structure31
I.1.2. Low molecular weight substances
I.1.2.1. Extractives
The term extractives is related to a heterogeneous group of substances, which can be extracted
from wood or plants using solvents like methanol, ethanol, acetone, toluene or
dichloromethane.32 Extractives in oat straw are mainly free fatty acids, resin, sterols and
waxes.32
I.1.2.2. Mineral substances
Minerals are essential for the growth of plants.32 They remain in the form of ash, after
combustion of the lignocellulosic material. The main mineral in oat straw is SiO2, which
7
represents 65-70% of the total mineral content. It has been reported to contribute to the plant
growth and antimicrobial resistance,32 as well as to the rigidity of the stem.33 The other
minerals are macro- and micronutrients, such as N, P, S, Ca, and Fe, Mn, Zn, Cu etc.32
I.1.3. Chemical composition of oat straw
The chemical composition of oat straw has been reported by different authors, with some
variations (Table 1).
Table 1: Chemical composition of oat straw in literature (in w/w %):
Ref. Water solubles Cellulose Hemicelluloses Lignin Wax Ash
Sun34 4.6 38.5 31.7 16.8 2.2 6.1
Theander35 Proteins Cellulose Hemicelluloses Lignin Extractives Ash
4.5 33 31 18 7.4 6.0
Adapa36 Cellulose Hemicelluloses Lignin
25.4±1.0 21.7±0.9 19.6±0.6
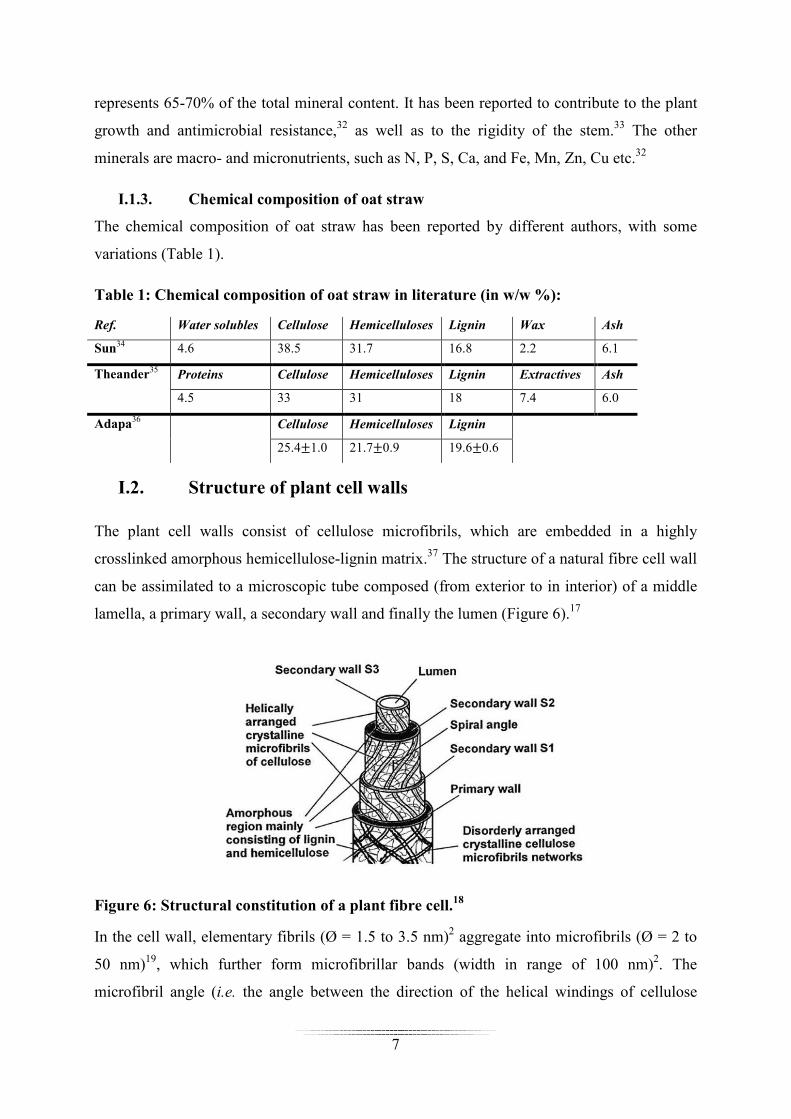
I.2. Structure of plant cell walls
The plant cell walls consist of cellulose microfibrils, which are embedded in a highly
crosslinked amorphous hemicellulose-lignin matrix.37 The structure of a natural fibre cell wall
can be assimilated to a microscopic tube composed (from exterior to in interior) of a middle
lamella, a primary wall, a secondary wall and finally the lumen (Figure 6).17
Figure 6: Structural constitution of a plant fibre cell.18
In the cell wall, elementary fibrils (Ø = 1.5 to 3.5 nm)2 aggregate into microfibrils (Ø = 2 to
50 nm)19, which further form microfibrillar bands (width in range of 100 nm)2. The
microfibril angle (i.e. the angle between the direction of the helical windings of cellulose
8
microfibrils and the long axis of cell) plays a central role in determining the mechanical
behaviour of the plant.38
I.2.1. Middle lamella and primary wall
The middle lamella is a thin layer composed of hemicellulose and lignin, which glues the
cells together.30 It has primary walls on both sides.
The primary wall is a thin layer of about 0.1-0.2 µm, consisting of cellulose, hemicellulose,
pectin and protein, all embedded in lignin. In the primary wall, the microfibrils orient in
random manner, building a netlike texture.38
The term “compound middle lamella” (CML) generally refers to the middle lamella plus
adjacent primary walls.30
I.2.2. Secondary wall (S)
I.2.2.1. S1
The outer layer (S1) is thin (0.2-0.3 µm) and forms 10-20% of the total cell wall.38 In the S1
layer, microfibrils are arranged in tightly wound helices, at a nearly transverse orientation
(60-80° to the cell axis).19
I.2.2.2. S2
The middle layer (S2) is thick (1-5 µm) and forms 70-90% of the total cell wall.38 In the S2
layer, the microfibrils are densely packed and orient helically at a relatively small angle (5-
30°) to the cell axis.19
I.2.2.3. S3
The inner layer (S3) is the thinnest layer (about 0.1 µm), forming 2-8% of the total cell wall.38
In the S3 layer, the microfibrils are arranged again in tightly wound helices, at a nearly
perpendicular orientation (60-90° to the cell axis).19
9
I.3. Nanofibrillated cellulose (NFC): isolation and morphological
characteristics
I.3.1. Nomenclature
The nomenclature concerning micro- and nanomaterials from natural resources has not been
standardized yet. Different terms are used according to recent review papers:7, 39
• “Microcrystalline cellulose (MCC)” refers to commercial cellulose materials, applied
mainly in pharmaceutical and food industry. The diameter of this material is generally
greater than 1 µm;7, 39
• “Microfibril” refers to fibrous cellulose structures formed during the biosynthesis in
higher plants. Synonyms which can be found in the literature are nanofibril, nanofibre;7
• “Microfibrillated cellulose (MFC)” or “Nanofibrillated cellulose (NFC)” refers to
microfibril aggregates produced by mechanical refining of plant fibres.39 In the present
work, only the term “nanofibrillated cellulose (NFC)” was used;
• “Cellulose nanocrystals (CNC)” refers to rod-like shaped cellulose nanoparticles obtained
after acid hydrolysis of pulp, MCC or NFC. Synonyms which can be found are cellulose
whiskers, nanowhiskers, rod-like cellulose crystals.7, 39
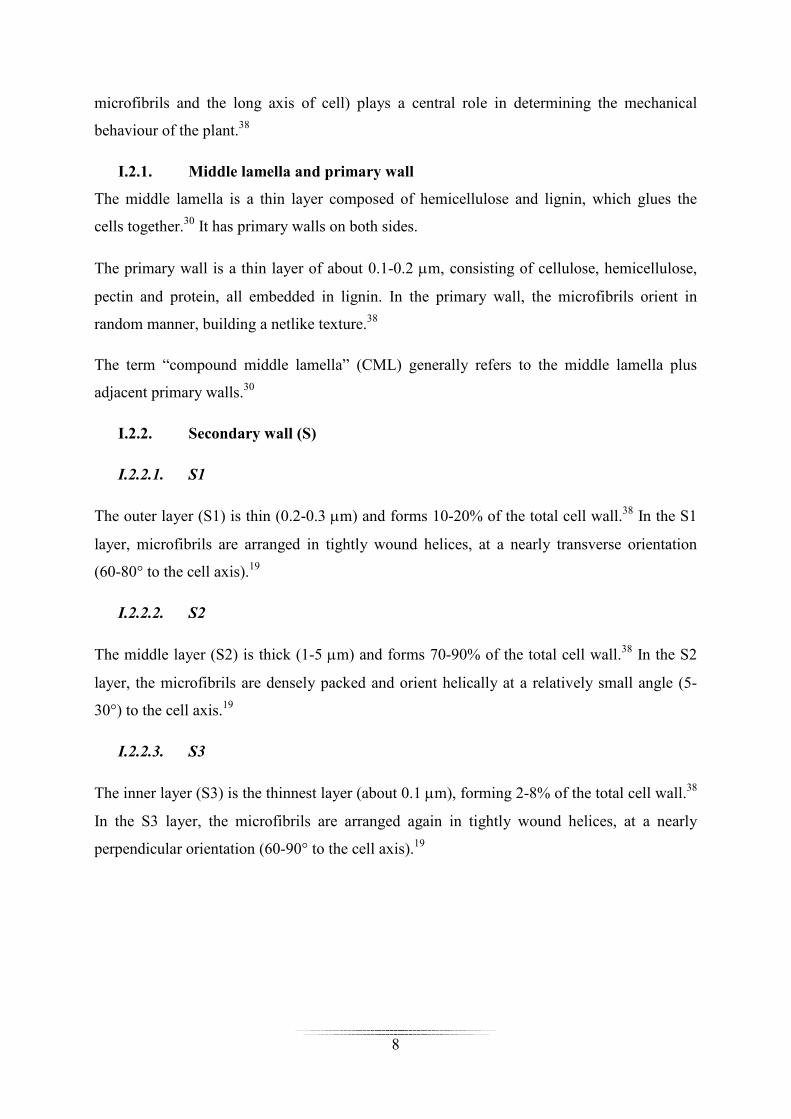
The average dimensions that have been reported for each type of cellulosic material are
presented in Table 2:
Table 2: Dimensions of the micro- and nano-scaled cellulose materials, isolated from natural fibres
Type Diameter d [nm] Length L [µm] Aspect ratio (L/d)
MCC7 >1,000 >1 ~1
Microfibril7 2-10 >10 >1,000
MFC/NFC7, 39 4-40 5-10’s 100-150
CNC7, 39 3-5 0.1-0.6 10-100
I.3.2. Isolation methods
The processes for the isolation of nano-celluloses have been reviewed comprehensively by
Moon et al.39 They are produced from purified fibres, after elimination of hemicelluloses,
lignin, etc. Different approaches have been used separately, in sequence or in combination.

10
I.3.2.1. Isolation of cellulose nanocrystals (CNC)
CNC can be produced by acidic hydrolysis of the starting cellulosic material. This simple
process usually involves a partial acid hydrolysis of cellulose using concentrated sulfuric acid
(H2SO4), which removes disordered or paracrystalline regions of cellulose and leaves
crystalline regions intact. After this treatment, rod-like shaped cellulose nanocrystals bearing
anionic sulfate ester groups at their surface are produced. Their geometrical dimensions
generally depend on the starting cellulose source, resulting in values varying from 5 to 20 nm
in width, and from 100 nm to 1-2 µm in length (Figure 7).40, 41
Figure 7: TEM micrographs of CNC obtained by sulfuric acid hydrolysis of cotton (a), and MCC (b).40
I.3.2.2. Isolation of nanofibrillated cellulose (NFC)
Nanofibrillated cellulose (NFC) is generally produced by mechanical disintegration. This
process generally involves a refining step followed by a high-pressure homogenization step,42,
43 but cryocrushing and grinding methods have been also reported.44, 45 The mechanical
treatments produce a network of interconnected cellulose microfibrils, with diameters from 10
to 100 nm and aspect ratios from 50 to 10046-48 (Figure 8).

11
Figure 8: SEM micrograph of NFC, mechanically isolated from oat straw cellulose powder12
In order to decrease the high energy consumption associated with these processes, chemical
pre-treatments of the cellulose raw material have been also envisaged: TEMPO,49-53
carboxymethylation,54-56 periodate oxidation,57 and enzymatic58-60 modifications.
I.3.3. Properties of NFC
I.3.3.1. Mechanical properties of isolated NFC
The mechanical properties of isolated NFC cannot be easily evaluated because of the
variability of the NFC material. Only information about single plant fibers or crystalline
regions could be found in the literature. For single plant fibres, E modulus in the range of 5-
45 GPa and tensile strength in the range of 0.3-0.8 GPa have been reported, based on Raman
techniques.14, 61, 62 For the crystalline regions, E modulus between 124 and 155 GPa63 and
tensile strength up to 7 GPa39 have been reported (evaluated experimentally or using
modelling).
I.3.3.2. Properties of NFC films
One of the most interesting features of NFC stems from its excellent film forming properties.
NFC films are mainly obtained through solution casting, a process during which the solvent
(mostly water) is removed by evaporation, vacuum filtration, pressing, or a combination of
these processes.59, 64 The nanofibrils in the dried films cannot be re-dispersed in water, due to
the irreversible agglomeration of cellulose nanofibres upon drying. This phenomenon is
12
called hornification and is explained by the formation of additional hydrogen bonds between
amorphous parts of the cellulose fibrils during drying.65, 66
a) Mechanical properties
Excellent mechanical properties in tension mode have been reported in the literature for NFC
films, with values in the range of 1-17.5 GPa and of 20-240 MPa for E-modulus and tensile
strength, respectively.39 These values are lower than those obtained for crystalline cellulose,
because of the presence of amorphous regions in NFC and because of the random in-plane
nanofibril orientation within the film.39 Nevertheless, if the density of cellulose (1500
kg/m3)67 is taken into consideration, the mechanical properties of NFC films are comparable
with metals and ceramics.39
b) Optical properties
NFC films are generally characterized by their medium to low transparency, which is
associated to the light scattering caused by different phenomena: high fraction of air in the
films (porosity ~20-40%); difference of refractive index between air and cellulose (air: ~1.0;
NFC: 1.618 along the fibril, 1.544 in the transverse direction68), nanofibrils sizes, film
thickness and surface roughness.39
c) Barrier properties
Concerning barrier properties, significant water sorption (15 % at 90 % RH)59 and water
permeability values (321 ± 46 g m-2 day-1)69 have been measured, because of the highly
hydrophilic nature of cellulose. But excellent barrier properties towards oxygen have been
often reported, with oxygen transmission rate (OTR) values down to 17.8 ml m-2 day-1
measured for NFC films with a thickness of 20-30 µm.70
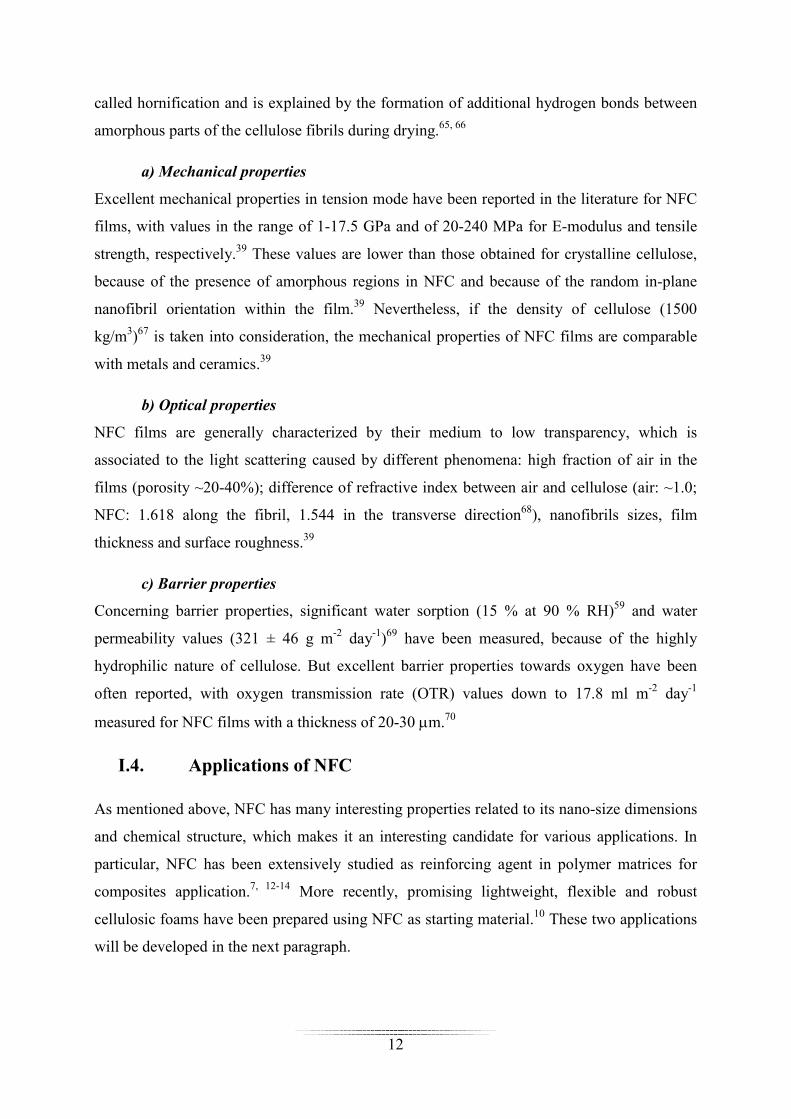
I.4. Applications of NFC
As mentioned above, NFC has many interesting properties related to its nano-size dimensions
and chemical structure, which makes it an interesting candidate for various applications. In
particular, NFC has been extensively studied as reinforcing agent in polymer matrices for
composites application.7, 12-14 More recently, promising lightweight, flexible and robust
cellulosic foams have been prepared using NFC as starting material.10 These two applications
will be developed in the next paragraph.
13
I.4.1. NFC as reinforcing agents in composites
A wide range of polymer matrices have been reinforced with NFC, but the majority of the
studies involved hydrophilic matrices, because of the good compatibility with the hydrophilic
NFC. An overview of the most popular matrices reinforced with NFC can be found in the
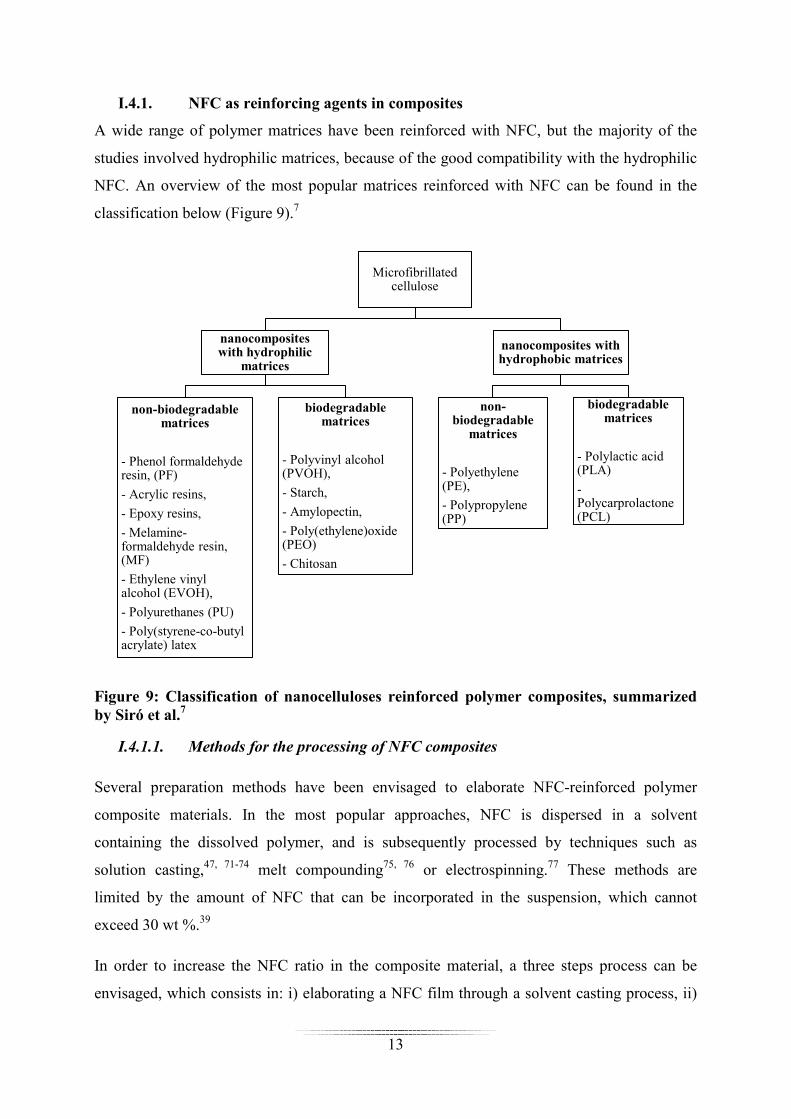
classification below (Figure 9).7
Figure 9: Classification of nanocelluloses reinforced polymer composites, summarized by Siró et al.7
I.4.1.1. Methods for the processing of NFC composites
Several preparation methods have been envisaged to elaborate NFC-reinforced polymer
composite materials. In the most popular approaches, NFC is dispersed in a solvent
containing the dissolved polymer, and is subsequently processed by techniques such as
solution casting,47, 71-74 melt compounding75, 76 or electrospinning.77 These methods are
limited by the amount of NFC that can be incorporated in the suspension, which cannot
exceed 30 wt %.39
In order to increase the NFC ratio in the composite material, a three steps process can be
envisaged, which consists in: i) elaborating a NFC film through a solvent casting process, ii)
Microfibrillated cellulose
nanocomposites with hydrophilic
matrices
non-biodegradable matrices
- Phenol formaldehyde resin, (PF)
- Acrylic resins,
- Epoxy resins,
- Melamine-formaldehyde resin, (MF)
- Ethylene vinyl alcohol (EVOH),
- Polyurethanes (PU)
- Poly(styrene-co-butyl acrylate) latex
biodegradable matrices
- Polyvinyl alcohol (PVOH),
- Starch,
- Amylopectin,
- Poly(ethylene)oxide (PEO)
- Chitosan
nanocomposites with hydrophobic matrices
non-biodegradable
matrices
- Polyethylene (PE),
- Polypropylene (PP)
biodegradable matrices
- Polylactic acid (PLA)
- Polycarprolactone (PCL)

14
impregnating the dried film with the desired resin and iii) oven drying the film with or
without hot pressing.59, 64 Composite materials with NFC contents above 70 wt % have been
reported with this technique.39
Another technique based on a wet-laid process (papermaking-like) has been also reported, and
allowed the preparation of NFC/PLA composites with NFC weight fraction up to 90 %.78
The incorporation of NFC in the polymer melt73 or the polymerization of the monomer “in-
situ”79 have been also proposed in two recent studies.
I.4.1.2. Mechanical properties of NFC composites
As compared with neat polymer matrices, an increase of both E modulus and tensile strength,
with a concomitant decrease of the strain at break, have been reported with composites
prepared from hydrophilic polymers such as PVOH47, HPC47, PF80, MF59, poly(styrene-co-
butyl acrylate)latex81 and PU.82
The reinforcing effect of NFC in composites with hydrophobic matrices has shown mixed
results. Wang and Sain,83, 84 incorporated NFC into molten PE and PP, using acrylic
oligomers as dispersant, but the mechanical properties of these composites did not show
significant improvement. The most studied hydrophobic matrix is PLA, because of its 100 %
renewable nature.7 PLA has some shortcomings, such as brittleness and low thermal stability.7
Several attempts have been made to reinforce PLA by NFC using different processing
methods, such as solution casting72, 85, extrusion86, 87 or wet-laid processing78. A slight
increase in modulus and tensile strength has been noted,78, 85, 86 but aggregation occurs during
processing and poor mechanical properties are still displayed by the composite.87
I.4.1.3. Optical properties of NFC composites
Optically transparent NFC composites were prepared by Iwamoto et al.44, 64 by impregnating a
dry NFC film with acrylic resins, followed by UV curing. Light transmittance between 70 and
85 % was obtained, with up to 70 wt % NFC dispersed in the matrix. The transmittance in
such composites depends on refractive index match, film thickness, nanocelluloses
dimensions and volume fraction (Figure 10).39

15
Figure 10: Factors impacting the light transmittance of CN/resin composites.39 (CN refers to different types of nanocelluloses, such as NFC and CNC)
I.4.1.4. Thermal properties of NFC composites
In general, the thermal stability of the NFC-reinforced composites tend to increase with
increasing weight fraction of NFC, as demonstrated with matrices such as PLA,74, 88, 89
cellulose acetate,90 melamine formaldehyde resin59 or amylopectin.91 This is particularly the
case in the temperature range higher than glass-transition temperature (Tg).39
The coefficient of thermal expansion (CTE) is another important parameter for applications
such as flexible transparent displays.92 Iwamoto et al.44, 64 found that a significant decrease in
CTE could be obtained when NFC were incorporated into acrylic matrices. The CTE tended
to decrease with increasing crystallinity of NFC.93
I.4.1.5. Barrier properties of NFC composites
The barrier properties to oxygen have been improved by addition of NFC in amylopectin
films.94 The oxygen transmission rate (OTR) was found to decrease with increasing NFC
content.
Water sorption is regarded as one of the major issues that limits the application of NFC-
polymer composites, due to the hydrophilic nature of cellulose. Hence, when hydrophobic
polymer matrices are used, the water sorption of the composites is generally higher than that
of the neat polymer.72 Water sorption has been shown to decrease in some rare cases, as

16
demonstrated by Henriksson et al. with melamine formaldehyde matrices.59 But if hydrophilic
matrices such as starch are used, a reduction in water sorption can be measured.95-97
To obtain better barrier properties, some authors have envisaged incorporating nanoclays in
combination with NFC and obtained a reduction in both water sorption and oxygen
permeability.98, 99
I.4.2. NFC as matrix for the elaboration of aerogels or foams
I.4.2.1. Definitions
Aerogels and foams are ultra-light weight and highly porous materials that are prepared by the
replacement of a liquid solvent in a gel by air. The term “aerogels” is generally employed to
name materials in which the typical structure of the pores and the network is mostly
maintained, i.e. the gel structure does not change after replacement of the liquid by air
(shrinkage phenomena are minimized).100 If the network structure has changed, the more
general term “foam” is preferred. In present study, the term “foam” will be used for any
porous material prepared from NFC.
Brought to light in 1931,101 these porous materials are mostly elaborated through the Sol-gel®
polymerisation of inorganic metal oxides, such as silica, alumina, titania, zirconia or tin
oxides.100, 102 The interest in such materials lies in their low density (typically between 0.004
and 0.500 g/cm3), high porosity (typically greater than 80%), high specific surface area, low
thermal conductivity, excellent shock absorption and low dielectric permittivity.100, 102, 103
Hence, aerogel materials have been used in various applications including thermal and
acoustic insulation, paints, electrical applications, life science, catalysis or optical
applications.102
But these materials generally suffer from their brittleness. To overcome this problem,
alternative lightweight, flexible and robust cellulosic aerogels or foams have been proposed
using NFC as starting material.104-106 Since aqueous NFC suspensions have gel-like properties,
due to the presence of long and interconnected hydrophilic cellulose nanofibrils, replacing
water with air results in an aerogel or foam with long entangled cellulose nanofibres.
I.4.2.2. Methods for the processing of NFC foams
NFC foams can be prepared by freeze-drying or supercritical CO2 drying:

17
- With the freeze-drying method, the NFC suspension is frozen in a mould and water is
eliminated by sublimation (Figure 11).106-109 Alternatives consist in first solvent-
exchanging water with t-butanol, and then freeze-drying the alcoholic suspension.104,
108 In that case, the foam obtained is more homogeneous and displays a higher specific
surface area.
- The supercritical CO2 drying method (scCO2 drying) is performed in two steps: i)
water is solvent exchanged with organic solvents miscible with CO2, such as ethanol
or acetone; ii) the organic solvent is solvent-exchange with CO2. The disadvantage of
this process is that it is time consuming.110
Figure 11: Image of NFC foam prepared by the freeze-drying method.104
I.4.2.3. Morphology of NFC foam
With the freeze-drying method, different morphologies can be obtained depending on the
speed with which the freezing step is performed. If the NFC suspension forms a thin layer in
the mould (1-3mm), the freezing is so fast that that a porous structure composed mostly of
nanofilaments is obtained (Figure 12a).108, 109, 111 When the thickness of the NFC gel exceeds
this range, aggregation of nanofibrils starts to occur and two types layers are formed: i) the
bottom layer, which freezes quickly, is composed of nanofilaments (Figure 12c); ii) the layer
above, which freezes slowly, is composed of cell wall sheet structures (Figure 12b), resulting
from the agglomeration of cellulose nanofibres during freezing.104, 108 This phenomenon arises
because the ice crystals formed during slow freezing tend to push the cellulose nanofibres into
the interstitial regions of the crystals.112

18
Figure 12: SEM images of NFC foams obtained by freeze-drying: a) Fast freezing (bottom layer); b-c) Slow freezing (layer > 3 mm).111
With both the t-butanol freeze-drying and scCO2 drying methods, a porous structure
composed mainly of nanofilaments is obtained (Figure 13).104, 113 As t-butanol has a much
lower expansion coefficient than water, the cellulose nanofibrils are not squeezed during
freezing.100 In the case of the scCO2 method, no freezing step is involved.
Figure 13: SEM micrographs of NFC aerogels prepared by t-butanol freeze drying (a and b)104 and supercritical CO2 drying (c)113
I.4.2.4. Density, porosity and specific surface area
The density, porosity and specific surface area are directly impacted by the method of
processing (i.e. the nature of the fibrillar network) and the concentration of NFC in the
original suspension, as demonstrated by the data presented in Table 3:
c: cell wall sheet structure
c b a
a

19
Table 3: Density (ρ), porosity and BET surface area of various NFC foams produced by different methods
Ref. Drying process NFC
concentration [wt%]
ρ [kg/m3]
porosity
[%]
BET surface
area [m2/g]
Pääkkö109
Vacuum pumping
freeze drying
2 30 95-98 20
Cryogenic freeze
drying
2 20 98 66
Sehaqui113
t-BuOH freeze
drying
~15 380 74 117
scCO2 drying ~15 205 86 304
Sehaqui106
Cryogenic freeze
drying
0.7 7 99.5 44
6.0 61 95.9 ~15
10 103 93.1 15
I.4.2.5. Mechanical properties of NFC foams
Besides the high porosity and specific surface area, NFC foams provide interesting
mechanical characteristics compared with other foams. The E modulus and compressive yield
strength of the foams increases with increasing density, which can be controlled by varying
the concentration of NFC in the original suspension.106 The energy of absorption in
compression of NFC foams is generally higher than that of polymer foams such as expanded
polystyrene foams.111 Nevertheless, NFC foams have been reported to have limited shape
recovery after compression.105 Table 4 presents the mechanical properties of some NFC
foams prepared with the freeze-drying method:
Table 4: Mechanical properties of NFC foams prepared with the freeze drying method111
NFC concentration [wt%] 0.7 2.2 4.2 10
Density [kg/m3] 7 22 43 103
Porosity [%] 99.5 98.5 97.2 93.1
E Modulus [kPa] 56 435 1510 5310
Yield stress [kPa] 7.8 31.9 135.1 515.6
Energy absorption [kJ/m3] 8.4 55.5 210 927.7

20
I.4.2.6. Application of NFC foams
For the time being, NFC foams have been mostly tested as reinforcing agents in composites
or as porous templates. Amylopectin and PVOH reinforced NFC foams have been shown to
display an increase in E modulus of up to 40%.97, 112. Conducting foams have been prepared
by dipping the NFC foams in a solution of polyaniline.109 Photoswitchable or magnetic NFC
aerogels have been produced by chemical vapour deposition of TiO2,114 or precipitation of
magnetic nanoparticles,115 respectively.
I.5. Chemical functionalization of NFC
I.5.1. Context
NFC possesses many interesting properties, but its hydroxylated surface is often pointed out
as a limiting factor for its use in commercial applications. In particular, NFC undergoes
irreversible aggregation upon drying (hornification), which precludes any dry processes.
Hence, NFC is generally processed in the form of water suspensions (max. solid content
30 %), which causes high transport and storage costs, and favours microbial degradation.
Additionally, NFC fibrils cannot be ideally dispersed in non-polar solvents, monomers or
polymers since the hydrophilic surface of the NFC is incompatible with hydrophobic
environments (the NFC tends to aggregate by hydrogen bonding). Furthermore, the strong
tendency of NFC to absorb water is often undesirable in many composites and foams
applications.
As most of these drawbacks and limitations are related to the chemical nature of the NFC
surface, they can be suppressed or limited by chemical functionalization. For instance, the
introduction of surface charge by oxidation can be a successful pathway to limit the
aggregation of the nanofibres upon drying and subsequently reduce the shipping cost of NFC.
In another approach, hydrophobic functions can be grafted at the NFC surface to decrease the
interfacial energy and improve their interaction with hydrophobic environments (physical or
chemical interactions). A decrease in the hydrophilicity of the NFC composites and foams can
be also obtained by this method.
As hydroxyl group is the most reactive sites at the NFC surface, reactions based on alcohol
chemistry have mostly been explored in the literature. A broad range of catalysts and solvents
have been tested (in particular DMSO, DMF, Toluene and hexane), but due to environmental
concerns, green solvents are increasingly investigated (i.e. scCO2, ionic liquids, and water).

21
Energy saving procedures, such as microwave-assisted reaction,15, 16 are also increasingly
considered.
A broad range of chemical modifications have been reported with microcrystalline cellulose,
pulp or paper,116, 117 but we will focus here on literature related to NFC.
I.5.2. Oxidation
I.5.2.1. TEMPO-oxidation
2,2,6,6-tetramethylpiperidine-1-oxyl (TEMPO) mediated oxidation is used to produce
negatively charged NFC at the surface. The reaction is selective to the primary alcohol at the
C6 position of the anhydroglucose unit (Scheme 1).51 This reaction was performed in aqueous
system.
O
CH2OH
OH
OH
O
O
N
O
NaClO
NaBr
H2O, pH=10-11
O
OH
OH
O
O
OO Na
n n
Scheme 1: TEMPO oxidation of NFC surface
The utilisation of this method as a pre-treatment before mechanical disintegration of cellulose
pulp proved to be very efficient in reducing the energy consumption associated with the
production of NFC.49-53
In addition, TEMPO-oxidation of NFC led to films displaying high light transmittance, good
mechanical properties, low thermal expansion and excellent oxygen barrier property.50, 113, 118
But the thermal stability was poor and the film was very hydrophilic.50
Recently, TEMPO-oxidized NFC has been used as template to prepare hybrid organic-
ceramic aerogels with TiO2 or TiO2/SiO2, which showed high adsorption towards organic
molecules and photocatalytic activity.119
22
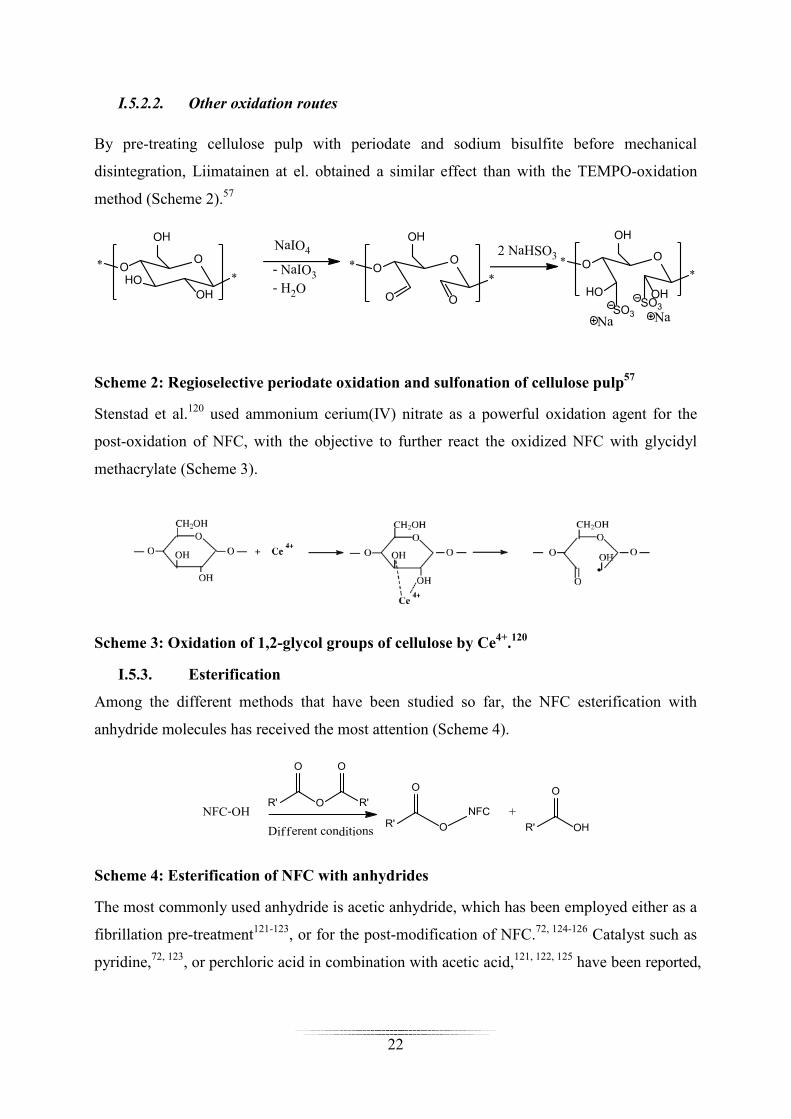
I.5.2.2. Other oxidation routes
By pre-treating cellulose pulp with periodate and sodium bisulfite before mechanical
disintegration, Liimatainen at el. obtained a similar effect than with the TEMPO-oxidation
method (Scheme 2).57
O
HO
O
OH
OH
**
NaIO4
- NaIO3- H2O
OO
OH
O
**
O
2 NaHSO3 OO
OH
OH
**
HO
SO3
SO3
Na Na
Scheme 2: Regioselective periodate oxidation and sulfonation of cellulose pulp57
Stenstad et al.120 used ammonium cerium(IV) nitrate as a powerful oxidation agent for the
post-oxidation of NFC, with the objective to further react the oxidized NFC with glycidyl
methacrylate (Scheme 3).
Scheme 3: Oxidation of 1,2-glycol groups of cellulose by Ce4+.120
I.5.3. Esterification
Among the different methods that have been studied so far, the NFC esterification with
anhydride molecules has received the most attention (Scheme 4).
R' O R'
O O
R'
O
Different conditions
+R' OH
O
NFC-OHO
NFC
Scheme 4: Esterification of NFC with anhydrides
The most commonly used anhydride is acetic anhydride, which has been employed either as a
fibrillation pre-treatment121-123, or for the post-modification of NFC.72, 124-126 Catalyst such as
pyridine,72, 123, or perchloric acid in combination with acetic acid,121, 122, 125 have been reported,

23
but the reaction could be also performed without catalyst.124, 126 Other anhydrides, such as
trifluoroacetic anhydride, have been also envisaged.127
In comparison with neat NFC, acetylated NFC (ac-NFC) can be more easily dispersed in
organic solvents of low polarity such as chloroform.72 It is also more hydrophobic123, 127 and
displays a low coefficient of thermal expansions (CTE).124, 125 But slightly poorer mechanical
properties have been also noted in film124 or aerogels,126 probably because of weaker fibre-
fibre interactions. Regarding the barrier properties, oxygen permeation was found to increase
after acetylation, but water sorption decreased.72, 124, 126
Ac-NFC has been incorporated in polymer matrices, such as PLA72, 122, 123 or acrylic resins121,
124, 125, but mixed results were found regarding the mechanical performances. In some studies,
a reinforcing effect was measured,72, 121 but in other ones, no significant improvement was
noted.123 Thermomechanical properties72, 122, 123 and transmittance 121, 122, 124, 125 were generally
improved after acetylation.
I.5.4. Etherification
Etherification is an important method for the industrial production of cellulose derivatives.
Since the first production of methylcellulose at the beginning of last century, cellulose ethers
such as methylcellulose, carboxymethylcellulose and hydroxyethylcellulose have become one
of the most important commercial cellulose derivatives.116
The etherification of NFC has been mostly conducted using halogenated or epoxy-based
reactants, through nucleophilic substitutions and ring-opening reactions, respectively.
I.5.4.1. Reaction with halogenated molecules
The carboxymethylation reaction has been used to introduce negative charges at the NFC
surface (Scheme 5).54-56 In contrast to TEMPO oxidation, this reaction is not selective to
primary alcohols.
Scheme 5: Carboxymethylation of NFC with chloroacetic acid sodium salt
O
Cl
O
Na
EtOH/IsopropanolNaOH (aq.)
NFC-OH O
O
O
Na + HClNFC

24
Similarly to TEMPO oxidation, this reaction has been applied as a pre-treatment before
mechanical disintegration, to decrease the energy consumption in NFC production.54-56 The
post-carboxymethylation of NFC has been also envisaged in some papers.56, 128
Films prepared from carboxymethylated NFC (cm-NFC) displayed a high transparency,55, 129
improved mechanical properties130 and excellent oxygen barrier properties129. The dried cm-
NFC can be easily re-dispersed in water, indicating that the treatment prevents fiber
hornification.56 But like in the case of TEMPO-oxidized NFC, the thermal-stability of NFC
decreases after carboxymethylation,56 while the hydrophilicity increases.129
Different application fields have been reported for cm-NFC. They have been shown to
reinforce hydroxypropyl cellulose matrices.128 They have been also used to prepare
polyelectrolyte multilayers for sensor applications, taking advantage of the strong interactions
existing between the negatively charged cm-NFC and positively charged polyelectrolytes.54, 55
Aerogels of cm-NFC have been investigated, with the objective to prepare porous materials
with tuneable oleophobicity.131 By coating paper with cm-NFC, an increase in oil resistance
and air permeability was also obtained.129
Etherification can be also used to introduce positive charges at the NFC surface, by reacting
NFC with choline chloride (Scheme 6):132
Cl
N Cl
O
N
NaOH/DMSO
/DMSONFC-OH
NFC+ HCl
Scheme 6: Cationic functionalization of NFC with choline chloride.132
These cationic nanofibres have been used in combination with anionic clays to produce
functional films with oxygen and water barrier properties, for packaging applications.69, 98, 99
I.5.4.2. Reaction with epoxides
Pei et al.133 used another etherification route to prepare cationic NFC: they first modified
cellulose pulp with glycidyltrimethylammonium chloride (Scheme 7), then subsequently
passed the etherified material in a microfluidizor. The quaternized NFC obtained was able to
adsorb anionic dyes from aqueous systems.

25
O
N Cl
NNaOH
Cl OHNFC-OH
O
NFC
Scheme 7: Etherification of NFC with glycidyltrimethylammonium chloride
In another study, ring-opening etherification was used to introduce azidealkyne groups
(Scheme 8), which were further grafted by click chemistry (Scheme 12).134
O
N3
NaOHi-PrOH/H2O
NFC-OHNFC
O
Cl
Cl
OH
N3
NaN3
AcOH
NaNO2
HNO3
NaOH
ON3
OH
Scheme 8: Etherification of NFC with 1-azido-2,3-epoxypropane.134
I.5.5. Carbamylation reactions
Carbamylation with isocyantes is another route to covalently bond organic functions on the
surface of NFC (Scheme 9).
NFC-OHO C N R
Water-free conditions
OHN
O
R NFC
Scheme 9: Carbamylation of NFC with isocyanates
Siqueira et al.135, 136 have used this functionalization pathway to introduce hydrophobic n-
octadecyl chains at the NFC surface and to reinforce poly(ε-caprolactone) matrices. This
carbamylation process was further studied by Missoum et al.,137 to better understand the
influence of degree of substitution on final properties. Stenstad et al.120 grafted hexamethylene
diisocyanate at the NFC surface, which they further cross-linked into a hydrophobic polymer
layer, or reacted with amines to introduce positive charge at the NFC surface.

26
I.5.6. Silylation
I.5.6.1. Reaction with chlorosilane
Chlorosilanes can react with NFC hydroxyl groups according to Scheme 10. This reaction
liberates HCl as a by-product, which is generally trapped by amine-based molecules.138
+ Cl Si
CH3
CH3
Si
CH3
CH3
+ HCldry tolueneimidazole
RT, 16hNFC-OH NFC-O
Scheme 10: Silylation of NFC with isopropyldimethyl-chlorosilane138
The reaction with isopropyldimethylchlorosilane (IPDMSiCl) in anhydrous toluene allowed
producing highly hydrophobic nanofibres, which could be dispersed in THF, toluene, diethyl
ether, chloroform, dichlormethane and rapeseed oil.138, 139 The silylated NFC were shown to
be very effective at stabilizing water-in-toluene emulsions, via a “Pickering” process.140, 141
Chemical vapour deposition (CDV) has been also envisaged, to graft various chlorosilanes on
NFC foams.131, 142-144 The main purpose and achievement of these works was to create super-
hydrophobic materials with tunable oleophilicity/oleophobicity, which could float on the
water surface and show selective absorption of non-polar solvents and oil.
I.5.6.2. Reactions with trialkoxysilanes
Alkoxysilanes react with hydroxylated substrates such as cellulose, according to the sol-gel
process presented in Scheme 11. Compared with the chlorosilane silylation, the grafted silane
structure is rather complex and depends on reaction conditions. Alcohol/water mixtures are
generally used as solvent.

27
Scheme 11: Silylation of NFC with trialkoxysilanes145
With this method, Andresen et al.146 prepared silylated NFC films which showed antibacterial
activity on the surface, using octadecyldimethyl(3-trimethoxysilylpropyl)ammoniumchloride
(ODDMAC) in methanol/water (90/10).
Tingaut et al.147 performed silylation with vinyltrimethoxysilane (MeOSiVi) or 3-
mercaptopropyltrimethoxysilane (MeOSiSH) to introduce vinyl or thiol group at the NFC
surface for further thiol-ene coupling with click chemistry (Scheme 14).
Qu et al.145 performed the mechanical disintegration of cellulose pulp in ethanol to produce an
NFC suspension which was further modified with 3-methacryloxypropyltrimethoxysilane
(MEMO). Polylactic acid (PLA) nanocomposites reinforced with the MEMO-modified NFC
displayed improved mechanical properties, but the thermal stability of the NFC decreased
after silylation.
Lu et al.148 modified NFC with (3-aminopropyl)triethoxysilane (APS) and 3-glycidoxypropyl-
trimethoxysilane (GLYMO) in acetone, and incorporated the silylated NFC in epoxy resins.
They observed an increase in storage modulus of the epoxide composites when NFC was
modified with the aminosilane.
Frone et al.149 modified NFC with APS in ethanol/water mixture prepared PLA composites
which displayed better interfacial adhesion after silylation.
Qua et al.150 performed the GLYMO silylation during the disintegration process, when
preparing the NFC. This is the only work reporting silylation in a 100% water system. The
nanofibrils obtained were thinner, as the silylation treatment prevented the re-agglomeration

28
of nanofibrils. The GLYMO-modified NFC was also found to be more thermally stable than
the unmodified one.
I.5.7. Other reactions
I.5.7.1. “Click” reactions
The “Click chemistry” concept was firstly introduced by Kolb et al.,151 who defined a set of
criteria that a process must fulfil, such as very high yields, inoffensive by-products, simple
reaction conditions, the use of easily removable solvents, or water or no solvent. This concept
has been applied to the functionalization of NFC by a few authors. A preliminary
functionalization of the substrate is usually required in order to introduce a reactive site (azide,
alkene, alkyne group, etc.) that will be later reacted with appropriate molecules.
The Copper-Catalyzed Azide Alkyne Cycloaddition (CuAAC) “click” reaction has been
recently used by Pahimanolis et al. to graft 1,2,3-triazole-4-methanamine (route A) or 5-
(dimethylamino)-N-(2-propyl)-1-naphthalenesulfonamide (route B) at the NFC surface, in
water medium (Scheme 12).134 The functionalized nanofibrils obtained were pH-responsive
and fluorescent, respectively.
O
N3
NaOHi-PrOH/H2O NFC
O
N3
HO A
B
NH2
NFC
O
N
HO
N
N
NH2
N
SO2
HN
NFC
O
N
HO
N
N
HN
SO2
N
NFC-OH
O
Cl
Cl
OH
N3
NaN3
AcOH
NaNO2
HNO3
NaOH
Scheme 12: Functionalization of NFC by Copper-Catalyzed Azide Alkyne Cycloaddition.134
Thiol-Ene coupling reactions have also been recently envisaged as an alternative to the azide-
alkyne method. These reactions can be catalysed by acids or bases, or photochemically.147

29
Nielsen et al.152 used methacrylic acid to introduce ene entities at the surface of cellulose
nanocrystals, which further underwent thiol-ene reaction with cysteamine (Scheme 13). The
objective was to prepare fluorescent labelled nanocelluloses.
Scheme 13: Fluorescent labelling of cellulose nanocrystals by thiol-ene reaction152
In the work of Tingaut et al.,147 ene or thiol groups were first introduced at the surface of the
NFC films by silylation with MeOSiVi or MeOSiSH, respectively (Scheme 14, routes 1 and 2,
respectively). The resulting films were subsequently coupled with thiol or ene-functionalized
molecules, under UV irradiation and at room temperature, leading to materials with tuneable
surface properties.
+ H3CO Si
OCH3
OCH3
EtOH/H2O
pH=3.5O Si
O
O
Si
Si
HSO
O
hv, RT O Si
O
O
Si
Si
S
O
O
1.
+ H3CO Si
OCH3
OCH3
EtOH/H2O
pH=3.5O Si
O
O
Si
Si
hv, RT
O Si
O
O
Si
Si
2.
SH SHO
O
S O
O
NFC-OH
NFC-OH
NFC
NFC
NFC
NFC
Scheme 14: Functionalization of NFC by silylation and subsequent thiol-ene coupling.147
30
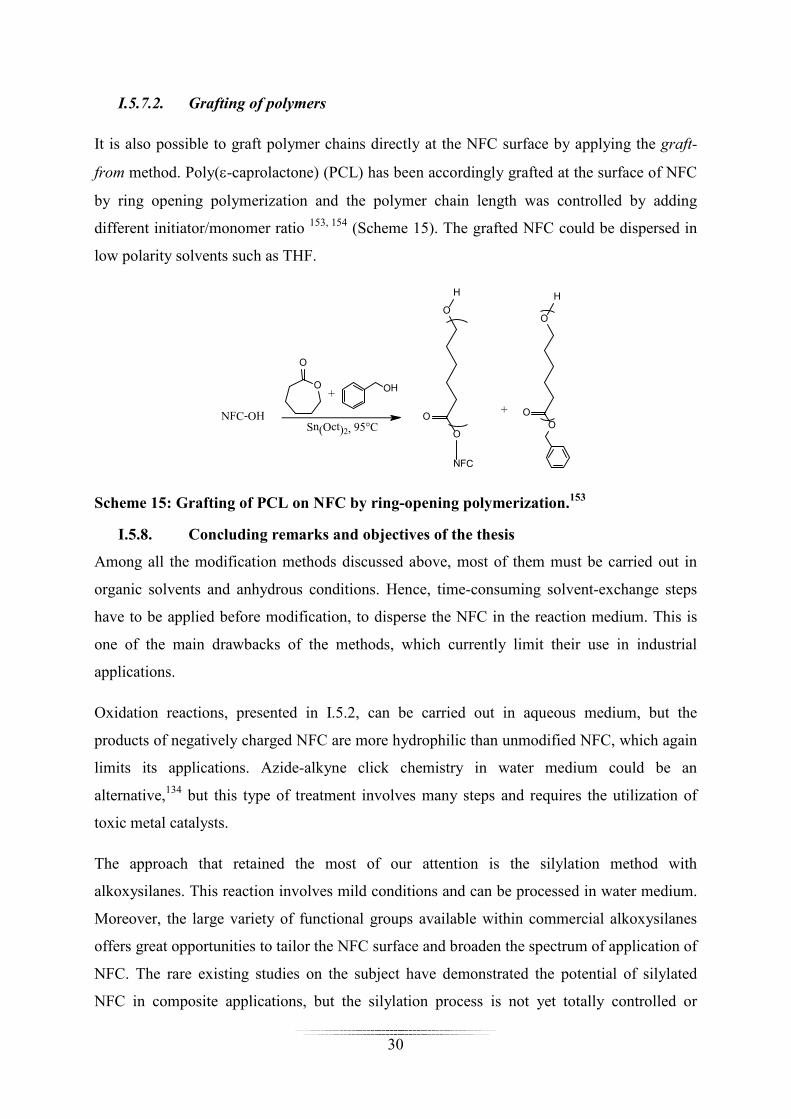
I.5.7.2. Grafting of polymers
It is also possible to graft polymer chains directly at the NFC surface by applying the graft-
from method. Poly(ε-caprolactone) (PCL) has been accordingly grafted at the surface of NFC
by ring opening polymerization and the polymer chain length was controlled by adding
different initiator/monomer ratio 153, 154 (Scheme 15). The grafted NFC could be dispersed in
low polarity solvents such as THF.
O
O
+ OH
Sn(Oct)2, 95°C
+O
O
O
H
NFC-OH
O
O
O
H
NFC
Scheme 15: Grafting of PCL on NFC by ring-opening polymerization.153
I.5.8. Concluding remarks and objectives of the thesis
Among all the modification methods discussed above, most of them must be carried out in
organic solvents and anhydrous conditions. Hence, time-consuming solvent-exchange steps
have to be applied before modification, to disperse the NFC in the reaction medium. This is
one of the main drawbacks of the methods, which currently limit their use in industrial
applications.
Oxidation reactions, presented in I.5.2, can be carried out in aqueous medium, but the
products of negatively charged NFC are more hydrophilic than unmodified NFC, which again
limits its applications. Azide-alkyne click chemistry in water medium could be an
alternative,134 but this type of treatment involves many steps and requires the utilization of
toxic metal catalysts.
The approach that retained the most of our attention is the silylation method with
alkoxysilanes. This reaction involves mild conditions and can be processed in water medium.
Moreover, the large variety of functional groups available within commercial alkoxysilanes
offers great opportunities to tailor the NFC surface and broaden the spectrum of application of
NFC. The rare existing studies on the subject have demonstrated the potential of silylated
NFC in composite applications, but the silylation process is not yet totally controlled or

31
optimized. Moreover, the characterization of the silylated material at the molecular level has
not been thoroughly performed. So far, six types of alkoxysilane molecules have been
investigated and most of the experimental works involved organic solvents (the only
treatment in 100% water was performed during the disintegration process150).
In theory, existing knowledge on reactions involving trialkoxysilanes and cellulose (pulp,
paper, natural fibres, etc.155-159) could be directly applied to the functionalization of NFC.
However, preliminary studies performed at the beginning of this thesis highlighted the
difficulty to chemically modify the nanofibers when published experimental conditions were
adapted to our material. NFC has much higher surface area than macrofibres, which means
that more OH groups are accessible at the NFC surface. As a consequence, NFC suffers from
irreversible aggregation upon drying, which is not critical for macrofibres. Moreover,
interfibrillar interactions must be avoided during silylation, to preserve the nanostructure of
the NFC.
In this context, the objective of this thesis was to develop a method based on alkoxysilanes
allowing the efficient silylation of NFC in water, while keeping intact the nanofibre structure
during modification. The potential of silylated NFC as reinforcing agents in composites or as
building block for the elaboration of foams was subsequently investigated.

32

33
II. Silylation of NFC with methyltrimethoxysilane:
optimization of the treatment and characterization of the
silylated material
As introduced in Chapter I, the silylation method with trialkoxysilanes has diverse advantages
such as mild reaction conditions, the possibility of using water as reaction medium and the
large variety of available functional silanes. Despite the promising potential of this reaction
route, studies on the functionalization of NFC with alkoxysilanes are rare, particularly in
water. And when this method is envisaged, there is generally a lack of control in the reaction
process and in the characterization at the molecular level.
In this chapter, the chemical functionalization of NFC with alkoxysilanes in water medium
has been envisaged. Methyltrimethoxysilane (MTMS) has been selected as a model
trialkoxysilane molecule for the whole study. The reaction parameters (pH, reaction time and
initial silane concentration) have been comprehensively studied and optimized, using two
different protocols (Protocols 1 & 2 described in paragraphs VI.3.1 and VI.3.2, respectively).
Furthermore, the modifications have been characterized at the molecular level using
appropriate physicochemical techniques.
Before the results are presented and discussed, a brief overview of the main parameters
influencing the hydrolysis and condensation of trialkoxysilane is given in the first paragraph.
II.1. Preliminary investigations
II.1.1. Brief overview on the reactivity of trialkoxysilanes
II.1.1.1. Hydrolysis and condensation reactions
Alkoxysilanes are silicon based molecules with the general formula R’nSi(OR)4-n, where n=0,
1, 2 or 3. Due to their hydrolysable Si-OR functions, these molecules have been widely used
for the modification of hydroxylated substrates (mostly inorganic), via the Sol-gel®
process.160 This process involves i) the hydrolysis of alkoxysilanes into silanols, ii) the
polycondensation of silanols into polysiloxanes and iii) the condensation of polysiloxanes

34
with the hydroxylated substrate (see Scheme 11 in I.5.6.2). Although studies on di-and
monoalkoxysilanes also exist,161-163 trialkoxysilanes are the most used molecules.164
The hydrolysis of trialkoxysilanes proceeds step-wise, and the first step is generally slower
than subsequent steps (Scheme 16).165
OR
Si
RO OR
R'
H2OOR
Si
HO OR
R'-ROH
H2OOR
Si
HO OH
R'-ROH
H2OOH
Si
HO OH
R'-ROH
Silane Silanol Silanediol Silanetriol
Scheme 16: Step-wise hydrolysis of trialkoxysilanes.166
It is a reversible process, but in large excess of water, the equilibrium is shifted towards the
silanol formation.160
The condensation process is more complex due to numerous sequential and parallel
competing reactions.164 Nevertheless, the formation of siloxane linkages is also a reversible
process and can be either obtained through the condensation of two silanol groups (Scheme
17a), or the condensation of an alkoxy group and a silanol function (Scheme 17b).160
+ H2OSi OH SiHO+ Si O Si
(a)
Si OR SiHO + ROH+ Si O Si(b)
Scheme 17: Formation of siloxane linkages by condensation reactions160
In practice, condensation can start before the hydrolysis is completed (Scheme 18a).167 As
products, a series of species can be formed, such as cage-like structures,168, 169 ledder
structures,170 less organized structures,169 etc. Some examples are shown in Scheme 18b.

35
OR
Si
ROOR
R'
OH
Si
ROOR
R'
OH
Si
ROOH
R'
OH
Si
HOOH
R'
OR
Si
ROO
R' Si
OR
OR
R'OR
Si
HOO
R' Si
O
OR
R'
Si
OH
R'OR
n
OH
Si
HOO
R' Si
O
OR
R'
Si
OH
R'OH
n
Si
HOOH
R'
MonosilaneSilandiol
Silantriol
M-structuredimer
D-structurechains, rings
T-structure3D oligomer
Scheme 18: (a) Oligomers formed during hydrolysis and condensation.167 (b) Examples of oligomer structures: cage-like structures (upper)168, 169 and various amorphous species (lower) 169
II.1.1.2. Impact of pH
a) Hydrolysis
The hydrolysis of alkoxysilane molecules can be catalyzed by both acids and bases, such as
HCl, H2SO4, acetic acid, ammonia, organotin esters, tirethylamine, KOH, KF, KH, etc.160, 171,
172 A relationship exists between the rate of hydrolysis and pH: the reaction is slow at pH 7,164,
165, 173 but each unit change in pH (in both directions), causes at least a 10-fold acceleration of
the hydrolysis rate.164
a
b
36
b) Condensation
Condensation reactions are catalysed by both acids and bases, but also by neutral salts or
metal alkoxydes.160 A pH dependance profile has been highlighted by many researchers:160, 165,
167, 171, 174, 175 condensation is fast at high and low pH, but the rate is minimum at pH 4,
considered as isoelectric point of trialkoxysilanes.160, 174
In acidic conditions, hydrolysis is much faster than condensation, whereas in basic conditions,
condensation occurs before all the alkoxy groups are hydrolysed.164
II.1.1.3. Impact of silane-to-water ratio
Silane-to-water ratio has been shown to play an important role in the kinetics of hydrolysis
and condensation of trialkoxysilanes molecules. In agreement with the reversible mechanisms
of the hydrolysis and condensation reactions, an increase in silane concentration has been
shown to provoke a decrease in hydrolysis rate,171 while the concentration of polymerized
species increased.160, 167, 171
II.1.1.4. Impact of steric and inductive effects
The steric hindrance of alkoxyl groups (OR) tend to retard the kinetics of hydrolysis and
condensation reactions.160 Accordingly, hydrolysis and condensation reactions are generally
faster for methoxysilanes. The reaction rates decrease in the order:
methoxysilane>ethoxysilane>n-propoxysilane>n-butoxysilane>i-butoxysilane.166, 176
The steric hindrance of the alkyl substituent (R’) also impacts both hydrolysis and
condensation reactions. It has been shown that the rate constant of hydrolysis decreased
several orders, when the chain length of R’ increased form methyl to propyl.177 In the same
way, a decrease in the condensation rate is usually noted when the length and branching of the
alkyl chain increase.178
Concerning the inductive effects, differences are noted depending on the pH. The hydrolysis
rate increases with the electron-providing capacity of the alkyl substituent (R’) in acidic
medium, while it is the opposite under basic conditions (electron-withdrawing groups
accelerate the reaction).160
Condensation is also impacted by inductive effects since OSi is more electron-withdrawing
than OR, but steric effects are increasingly dominant as the reaction proceeds.160

37
II.1.1.5. Impact of reaction time
The structure of the species formed during the hydrolysis/condensation process depends
strongly on the reaction time. In general, hydrolysis occurs very rapidly in acidic conditions
(within minutes).179 For condensation, an increase in reaction time generally leads to the
formation of oligomers of higher molecular weight,176 while di- and tri-condensed structures
are favoured.179
II.1.2. Calibration chart for the evaluation of the Si content from IR spectra
To comprehensively study the impact of reaction parameters on NFC silylation, we needed a
method to follow the evolution of silane content as a function of pH, reaction time or silane
concentration. One method was to measure the silicon content in silylated NFC by elemental
analysis (EA), as already reported by several authors for silylated cellulose fibres.158, 159, 180, 181
But this characterization method turned out to be very expensive and could not be used to
characterize all our samples. In this context, we decided to build a calibration chart based on a
limited number of samples (15 samples), which we analysed by both EA and FTIR
spectroscopy. In the chart, the Si wt% was correlated with a ratio measured by FTIR
spectroscopy and characteristic of the grafted silane. This chart was later used to deduce the
Si wt% based only on FTIR spectra.
II.1.2.1. FT-IR characterization of silylated NFC
15 samples of silylated NFC were characterized by both EA and FTIR spectroscopy. For a
given sample, three spectra were recorded and averaged. An example of spectra obtained
before and after silylation is presented in Figure 14.

38
Figure 14: Example of FTIR spectra obtained after analysis of unmodified and MTMS-treated NFC (Protocol 1) samples. ν, stretching vibration; δ, in-plane bending, γ, out-of-plane bending.
In the spectrum of unmodified NFC, the characteristic vibrations of cellulose emerge at 3300
cm-1 (νOH), 2870cm-1 (νCH), 1426cm-1 (δCH), 1367cm-1 (δCH), 1332 cm-1 (δOH), 1317 cm-1
(δCH ), 1200 cm-1 (δCH and δOH ), 1157-893 cm-1 (νC-O and νC-C) and 651 cm-1 (γO-H).182
After modification with MTMS, the vibrations of the grafted groups were easily identified at
2970 cm-1 (νC-H of the methyl group), 1270 cm-1 (δ C-H of the methyl group),183 and between
830 and 730 cm-1 (νSi-C and/or νSi–O).184
II.1.2.2. Calibration chart
In preliminary experiments, we observed that the C-H in-plane bending vibration at 1270 cm-1
seemed to increase linearly with increasing silane content. Accordingly, this vibration was
chosen to estimate the silane content from the IR spectra. The vibration at 1270 cm-1 was
normalized to the intensity of the C-H in-plane bending of cellulose at 1317cm-1, through the
calculation of the H1270/H1317 peak heights ratio. The vibration of cellulose at 1317 cm-1 was
selected as an internal standard because it was not affected by the modification with MTMS.
The calibration chart was then obtained by plotting the Si percentage determined by elemental
600110016002100260031003600
Ab
sorb
ance
Wavenumbers (cm-1)
silylated NFC
unmodified NFC
2970
νS(C-H)
1270
δs(C-H)
830-730
ν(Si-O-Si) ν(Si-C)

39
analysis as a function of the H1270/H1317 ratio (Figure 15). The correlation coefficient of the
calibration curve was 0.96. The scattering of the experimental points was assigned to
inhomogeneity in the distribution of silane within the NFC network, leading to samples with
slightly varying Si content. Although this calibration chart is not suitable for an exact
evaluation of the Si content at the NFC surface, it turned out to be accurate enough to follow
the evolution of Si content in our various experiments. For a given silylated sample, the Si
content was accordingly estimated from its FTIR spectrum, by simply calculating the
H1270/H1317 ratio and reporting the value on the calibration chart.
Figure 15: Calibration chart for the estimation of silane content from FTIR data.
II.2. Impact of reaction parameters
Three reaction parameters have been comprehensively studied and optimized: pH, reaction
time and silane concentration. The evolution of Si content in the silylated material was
estimated from the calibration chart in Figure 15. All the samples were characterized by solid-
state NMR spectroscopy (13C and 29Si), SEM and WDX microscopy.
y = 2.26x - 0.38 R² = 0.96
0.00
1.00
2.00
3.00
4.00
5.00
6.00
7.00
8.00
9.00
10.00
0.0 0.5 1.0 1.5 2.0 2.5 3.0 3.5 4.0 4.5
Si%
H1272/H1317
calibration chart
H1317
H1272

40
II.2.1. Experimental protocols
Two different protocols were envisaged depending on the experiments (Protocols 1 & 2
described in paragraphs VI.3.1 and VI.3.2, respectively).
With Protocol 1, reactions were performed by i) stirring the NFC silane solution for a given
reaction time, ii) washing the cellulosic substrate with water, iii) eliminating water by freeze-
drying. Hence, with this protocol, any excess of acid or base, which may detrimentally impact
the cellulose chains, was concurrently eliminated. This protocol was selected when studying
the impact of pH on NFC silylation, because it could limit cellulose degradation, when high
or low pH was investigated. We reasoned any silane that was bonded to the cellulosic
substrate during the stirring step would remain attached during the washing step.
The same conditions were used with Protocol 2 except that the silylated material was not
washed before freeze-drying. As a consequence, all chemicals introduced in the reaction
vessel, i.e. the silane (bonded or not) and the catalyst, remained in the dry material after
freeze-drying. To favour the condensation between the hydrolysed MTMS and cellulose, the
silane solution was adjusted to a single pH of 4, since the silanol concentration is expected to
be maximal at this pH (see Chapter II.1.1.2). High and low pH were avoided to limit cellulose
degradation.
II.2.2. Impact of pH (Protocol 1)
Reactions were performed at room temperature, for 2h, using an initial MTMS concentration
of 7.4 mmol/gNFC. The pH was varied between 0 and 11 by adding hydrochloride acid for the
acidic range and sodium hydroxide for the basic range.
II.2.2.1. Evolution of Si content
The evolution of Si content as function of pH is presented in Figure 16. No silane was found
in the material at pH above 2, but below this value, the silane content tended to increase with
decreasing pH. The sample treated at pH 0.2 displayed an unexpected low Si wt% value
(0.8%), which was assigned to inhomogeneities in the distribution of silane within the NFC
network, and also to the low resolution of the calibration chart method used to evaluate the Si
content.
After hydrolysis of MTMS, the silanols formed can homopolymerize by polycondensation
and/or condense with the NFC surface (Scheme 11 in I.5.6.2). Both reactions are in

41
competition, and there was no guaranty at this stage of the study that the silane found in the
samples (when pH < 2) was covalently bonded to the cellulosic substrate. In general, the rate
of condensation decreases with increasing pH and is minimal at pH 4, where silanol
concentration is maximal (see Chapter II.1.1.2).160, 174 Hence, high molecular weight
polysiloxanes with low solubility in water could be favored at low pH, while low molecular
weight species with high silanol content may prevail at pH above 2. The decrease in silane
content with pH could then be explained by an increasing solubilisation of the polar silanol
species in water during the washing step. The remaining high molecular weight species may
then be bonded or not to the cellulosic substrate.
At basic pH, the hydrolysis of alkoxysilanes is generally much slower (see II.1.1.2),164 and 2h
may not be sufficient to hydrolyse the silane in our experimental conditions (reaction time =
2h; [MTMS] = 7.4 mmol/gNFC). Additionally, the reverse reaction of condensation is favoured
under basic conditions, leading to formation of more soluble species,160 which could be
removed as well by the washing step.
Figure 16: Evolution of the Si content as function of pH for NFC treated with MTMS according to Protocol 1. The insert plot presents the pH range 0-1.
0.0
0.5
1.0
1.5
2.0
2.5
3.0
0 2 4 6 8 10 12 14
Si w
t%
pH
1.5
0.8
0.9
0.7
0.5 0.4 0.0
0.5
1.0
1.5
2.0
2.5
3.0
0 0.2 0.4 0.6 0.8 1 1.2
Si w
t%
pH

42
II.2.2.2. Solid State NMR spectroscopy
The silylated samples were further characterized by 13C and 29Si CP-MAS NMR spectroscopy.
Only the samples for which the Si wt% was significant were analysed (i.e. pH below 0.6).
a) 13
C CP-MAS NMR
The 13C CP-MAS NMR spectra of unmodified and silylated NFC are presented in Figure 17.
The spectrum of unmodified NFC displayed typical signals from cellulose that were assigned
as follows: C1 (105 ppm), C4 crystalline (89 ppm), C4 amorphous (83 ppm), C2/C3/C5 (75 and
73 ppm), C6 crystalline (65 ppm).27
After silylation with MTMS, the signal characteristic of the grafted methyl group emerged at
around -3 ppm (Cα in Figure 17), confirming the presence of silane in the samples. The
intensity of this peak was quite low for samples with Si content below 0.9 wt %, but it
increased significantly at higher silylation level. No additional peak corresponding to the
carbons of methoxyl groups were detected at 50 ppm, indicating that most of these groups
were hydrolyzed during the treatment.
O
Si
CH3
O O
α
Figure 17: 13C CP-MAS NMR spectra of unmodified and MTMS-modified NFC prepared at different pH
O
OO
OH
HO
OH
OH
OH
OHO
12
3
4
5
6
12
3
4
5
6
n
pH = 0.0, Si%=1.6%
pH = 0.2, Si%=0.8%
pH = 0.4, Si%=0.9%
pH = 0.6, Si%=0.7%
Unmodified NFC

43
b) 29
Si solid state NMR
The chemical shift of 29Si is sensitive to its local electronic environment and chemical
changes about the silicon have been shown to provide significant shifts in the 29Si NMR
spectrum.185, 186 In the following discussion, each silicon signal was assigned according to its
chemical environment and was noted Ti or Tij, where T is the trifunctional alkoxysilane; i the
number of siloxane bridges (–OSi) attached to the site; j the number of hydroxyl groups (–
OH) attached to the site. In this conventional nomenclature system, the –Si(OSi)1(OMe)2
moety is a T10 site, –Si(OSi)2(OMe) a T20 site, –Si(OSi)2(OH) a T21 site, etc..
The 29Si CP-MAS NMR spectra of silylated NFC in Figure 18, confirm the presence of
polysiloxane at the NFC surface. After silylation, two different environments were found for
the silicon atom at -56 and -65 ppm. Before hydrolysis/condensation, the signal of silicon in
MTMS is expected at -40 ppm, as was confirmed by liquid-state 29Si NMR analysis (results
not shown). It has been reported that the condensation of Si-OR into Si-OSi linkage results in
an upfield shift of about 8-9 ppm for the silicon, when hydrolysis of the Si-OR linkage to Si-
OH results in a downfield shift of 1-2 ppm.186 Accordingly, the chemical shifts at -56 and -65
can be assigned to T2 and T30 sites respectively, which can form after the di- and tri-
condensation of MTMS. These assignments are in agreement with literature data.169 The high
intensity noted for the T30 signal indicates that significant homopolymerisation occurred
during the treatment. T30 sites have no available functions, which can potentially covalent or
hydrogen bond with the cellulosic substrate. As a consequence, the polysiloxane detected by
NMR spectroscopy can be attached (if attached) only via the di-condensed species (i.e. T2
sites). T2 sites can carry alkoxyl groups (T20) and/or silanol functions (T21), which cannot be
differentiated by the 29Si CP-MAS technique. If T20 sites are present, a covalent bond with
cellulose can be proposed (cellulose-O-Si) since most methoxyl groups have been cleaved
during the hydrolysis process (the signal of methoxyl is expected at 50 ppm in the 13C and at -
40 ppm in the 29Si CP-MAS spectrum). If uncondensed T21 sites subsist, the polysiloxane
could be bonded to the cellulosic substrate by hydrogen bonding. But the absence of bonding
at the cellulose surface cannot be ruled out, and the siloxane polymer could be simply
adsorbed or entangled in the cellulose network (as will be demonstrated later, in Chapter
II.3.1).

44
Figure 18: 29Si CP-MAS NMR spectra of MTMS-treated NFC prepared at different pH. The signals at -28 and -104 ppm correspond to the spinning side bands of T30 at -65 ppm.
In order to evaluate the evolution of di- and tri-condensed structures in the modified NFC,
each spectrum was deconvoluted and the ratio of the peaks area at -56 and -65 ppm (T2/T3
ratio) was calculated and plotted as a function of pH (Figure 19).
Figure 19: Evolution of the ratio of the peaks area at -56 and -65 ppm (T2/T3 ratio), as a function of pH.
0.0
0.1
0.2
0.3
0.4
0.5
0 0.2 0.4 0.6 0.8
T2/
T3
rati
o [%
]
pH
pH = 0.0
pH = 0.2
pH = 0.4
pH = 0.6

45
The T2/T3 ratio was almost constant in all samples, indicating that the pH variations in the
conditions used (reaction time = 2 h; [MTMS]i = 7.4 mmol/gNFC) did not impact the structure
of the polysiloxane on the NFC surface. Only the polymer content was impacted.
II.2.2.3. SEM and WDX Microscopy
The evolution of the NFC morphology upon silylation was examined using Scanning Electron
Microscopy (SEM) and the resulting micrographs are presented in (Figure 20).
Unmodified NFC pH = 1.0
(0.4 wt% Si)
pH = 0.8
(0.5 wt% Si)
pH = 0.6
(0.7 wt% Si)
pH = 0.4
(0.9 wt% Si)
pH = 0.2
(0.8 wt% Si)
pH = 0.0
(1.5 wt% Si)
Figure 20: SEM micrographs of unmodified NFC (a) and NFC treated with MTMS (Protocol 1) in the pH range 1-0 (b-g). (Scale bar is 10 µm).
The SEM image of unmodified MFC (Figure 20-a) confirmed the presence of a 3-D network
of nanofibrils with diameters in the range of 50 to 200 nm, with few visible aggregates. This
result is in agreement with the literature and confirms that the freeze-drying process used in
Protocol 1 (fast freezing) maintained the nanofibrillar structure of NFC upon drying.
After silylation, the nanofibrillar structure prevailed in all samples, regardless of the pH
(Figure 20- b-g). The presence of silane was detected in the form of white particles or clusters
within the cellulose substrate (see arrows in Figure 20), which are most probably constituted
of homopolymerized MTMS. Their number tended to increase with decreasing pH, i.e. when
the Si content increased in the sample.
a b c d
e f g

46
In order to validate this assumption, the various cellulosic substrates were further analysed by
WDX (Wavelength Dispersive X-ray) microscopy (Figure 21). The micrographs provide a
mapping of the Si element on flat surfaces, and give information about the presence and size
of eventual clusters. A scale bar with arbitrary units is presented next to the map and the
quantity of Si detected by X-ray is materialized with a colour. The images have to be
compared with caution, because the morphology, surface roughness and sample
inhomogeneity can impact the colour of the mapping.
The unmodified and silylated NFC samples produced in the pH range 1-0 were accordingly
compressed to flat films and analysed with this technique. The results are presented in Figure
21.
Unmodified NFC pH = 1.0 (0.4 wt% Si) pH = 0.8 (0.5 wt% Si) pH = 0.6 (0.7 wt% Si)
pH = 0.4 (0.9 wt% Si) pH = 0.2 (0.8 wt% Si) pH = 0.0 (1.5 wt% Si)
Figure 21: WDX Si mapping of unmodified NFC (a) and NFC treated with MTMS in the pH range 1-0. (Scale bar is 100 µm).
The silicon mapping of unmodified NFC displayed a dark and uniform blue color with few
white spots, which were associated with impurities in the sample. In the starting cellulose
pulp material, traces of Si have been confirmed. After silylation, the brightness of the image
as well as the proportion of Si aggregates tended to increase with increasing polysiloxane
content, confirming the SEM results. But the polysiloxane is not homogeneously dispersed
within the NFC material, since more Si is detected in Figure 21d (0.7 wt% Si), compared with
Figures 25e (0.9 wt% Si) or 25f (0.8 wt% Si).
a b c d
e f g

47
When Protocol 1 was used in further experiments, pH 0.4 was selected, to limit cellulose
degradation as much as possible.
II.2.3. Impact of reaction time (Protocol 1 & 2)
Both Protocol 1 (with washing step, pH 0.4) and Protocol 2 (without washing step, pH 4)
were investigaed. Reactions were performed at room temperature, using an initial MTMS
concentration of 7.4 mmol/gNFC. The reaction time was varied from 0.5 to 72 h.
II.2.3.1. Evolution of Si content
The evolution of Si content as function of reaction time is presented in Figure 22, for samples
treated according to Protocol 1 or Protocol 2.
Figure 22: Evolution of Si content as function of reaction time for NFC treated with MTMS according to Protocol 1 (pH 0.4) or Protocol 2 (pH 4).
With Protocol 1, a gradual increase in Si content was noted with increasing reaction time.
Since the washing step removed all non-bonded water-soluble compounds, this increase could
be explained by the formation of an increasing number of oligomers or polymers insoluble in
water. Another possibility would be that silane condensation at the NFC surface increased
with reaction time, but leaching experiments performed in Chapter II.3.1 seem to contradict
this interpretation.
0.4 0.9
2.2
3.0 4.2
6.9
9.3 9.2 9.9 9.3
8.7 8.0
0.0
2.0
4.0
6.0
8.0
10.0
12.0
0 10 20 30 40 50 60 70 80
Si w
t%
reaction time [h]
Protocol 1 Protocol 2

48
With Protocol 2, the silylated material was not washed during the process and all the silane
introduced in the reaction vessel remained in the dry material after freeze-drying.
Consequently, the Si content in the samples remained constant with time, as observed in
Figure 22.
II.2.3.2. Solid State NMR spectroscopy
a) 13
C CP-MAS NMR
The 13C CP-MAS NMR spectra of NFC silylated at different reaction times are presented in
Figure 23. Regardless of the protocol, the carbon of the MTMS methyl moiety was detected at
-3 ppm in most of the spectra (carbons α according to the nomenclature in Figure 17). The
intensity of the Cα peak increased steadily with reaction time in the case of Protocol 1, while
it remained quasi constant with Protocol 2, confirming further the results of Figure 22.
Si wt% Protocol 1 t (h) Protocol 2 Si wt%
Figure 23: 13C solid state NMR spectra of unmodified and MTMS-treated NFC prepared at different reaction times (Protocol 1 & 2).
b) 29
Si solid state NMR
The 29Si CP-MAS NMR spectra of NFC silylated at different reaction times are presented in
Figure 24.
6.9
4.2
3.0
2.2
0.9
0.4
8.0
8.7
9.3
9.9
9.2
9.3
72
48
24
12
2
0.5
unmodified

49
Si wt% Protocol 1 t (h) Protocol 2 Si wt%
Figure 24: 29Si CP-MAS solid state NMR spectra of MTMS-treated NFC prepared at different reaction times (Protocol 1 & 2).
Once again, two different signals were detected at -56 and -65 ppm, regardless of the protocol,
but the relative intensity of the peaks was significantly different depending on the method.
These two signals were again assigned to di-condensed (T20 and/or T21) and tri-condensed
(T30) structures, respectively, which can form after hydrolysis and condensation of MTMS.
As previously argued (II.2.2.2b), the polysiloxane detected could be attached via the di-
condensed sites, or could be also simply adsorbed or entangled in the cellulose network. With
Protocol 2, a small additional signal was detected at -46 ppm and was assigned to residual T1
structures bearing Si-OH moieties (T11 or T12). These moieties may arise from the chain ends
or from monocondensed species present in the substrate.168 Since this signal was not observed
in the spectra of samples prepared according to Protocol 1, they are probably eliminated in
water during the washing step.
After deconvolution of the spectra, the ratio of the peaks area at -56 and -65 ppm (T2/T3 ratio)
was calculated and plotted as a function of reaction time (Figure 25). The T1 structures
detected -46 ppm (Protocol 2) were not taken into consideration due to their negligible
contribution.
6.9
4.2
3.0
2.2
0.9
0.4
8.0
8.7
9.3
9.9
9.2
9.3
72
48
24
12
2
0.5
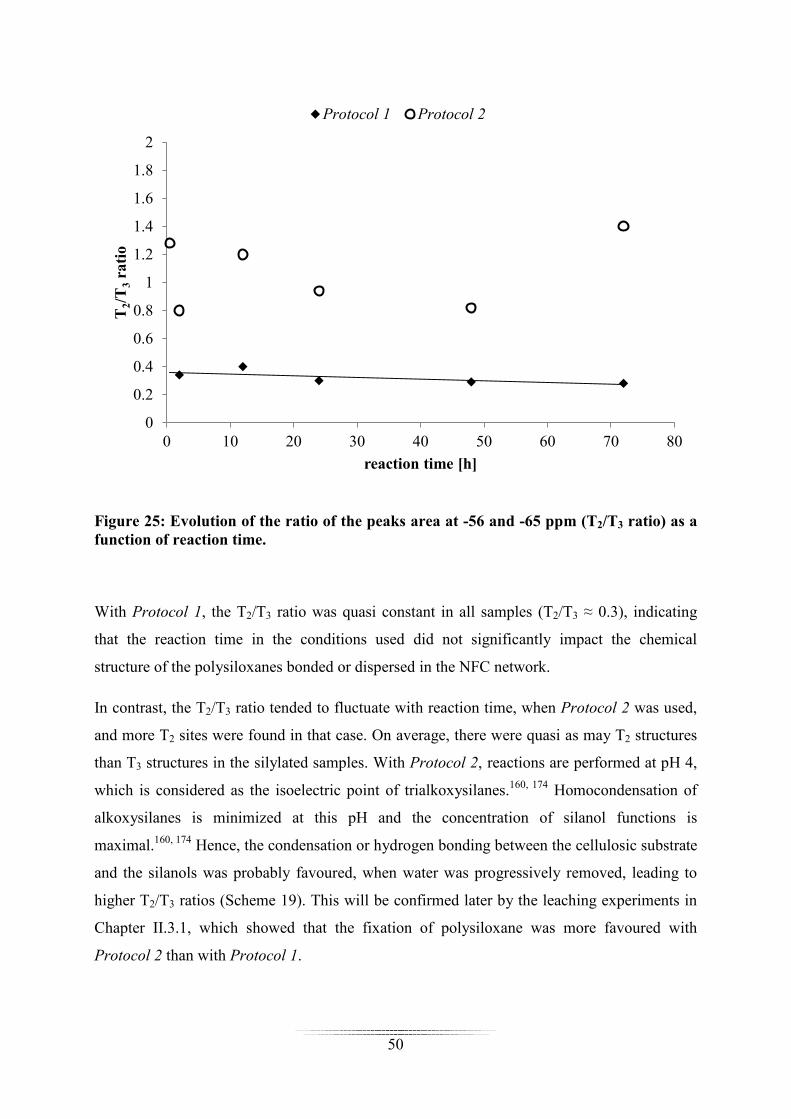
50
Figure 25: Evolution of the ratio of the peaks area at -56 and -65 ppm (T2/T3 ratio) as a function of reaction time.
With Protocol 1, the T2/T3 ratio was quasi constant in all samples (T2/T3 ≈ 0.3), indicating
that the reaction time in the conditions used did not significantly impact the chemical
structure of the polysiloxanes bonded or dispersed in the NFC network.
In contrast, the T2/T3 ratio tended to fluctuate with reaction time, when Protocol 2 was used,
and more T2 sites were found in that case. On average, there were quasi as may T2 structures
than T3 structures in the silylated samples. With Protocol 2, reactions are performed at pH 4,
which is considered as the isoelectric point of trialkoxysilanes.160, 174 Homocondensation of
alkoxysilanes is minimized at this pH and the concentration of silanol functions is
maximal.160, 174 Hence, the condensation or hydrogen bonding between the cellulosic substrate
and the silanols was probably favoured, when water was progressively removed, leading to
higher T2/T3 ratios (Scheme 19). This will be confirmed later by the leaching experiments in
Chapter II.3.1, which showed that the fixation of polysiloxane was more favoured with
Protocol 2 than with Protocol 1.
0
0.2
0.4
0.6
0.8
1
1.2
1.4
1.6
1.8
2
0 10 20 30 40 50 60 70 80
T2/
T3
rati
o
reaction time [h]
Protocol 1 Protocol 2

51
Scheme 19: Hypothesis for the bonding of polysiloxane at the NFC surface after silylation with Protocol 2
II.2.3.3. Microscopy
The evolution of the NFC morphology upon silylation was examined by SEM, and the
resulting micrographs are presented in Figure 26.
Unmodified NFC t = 0.5 h (Protocol 1) t= 2h (Protocol 1) t = 12h (Protocol 1)
t = 24h (Protocol 1) t = 48h (Protocol 1) t = 72h (Protocol 1) t = 12h (Protocol 2)
Figure 26: SEM micrographs of unmodified NFC (a) and NFC treated with MTMS according to Protocol 1 (b-g) or Protocol 2 (h) (Scale bar is 10 µm). Results with various reaction times are presented.
With Protocol 1, a 3D network of nanofilaments prevailed in all the samples, regardless of the
reaction time. Above 2 h reaction, the presence of silane was detected in the form of white
particles or clusters within the cellulosic substrate. These particles were constituted of
homopolymerized MTMS, as will be later confirmed by WDX. Their number tended to
increase with increasing reaction time, which was consistent with the results of Figure 22.
a b c d
e f g h

52
The morphology of NFC silylated according to Protocol 2 was quite different, and did not
vary significantly with reaction time (therefore, only 1 micrograph is present in Figure 26h).
In this case, the fibrillar network was composed of filaments of increased diameters, which
were connected to sheet structures. This sheet like morphology may be attributed to either
hornified NFC covered with silane or to polysiloxane films. The increase in the filaments
thickness was attributed to a full coverage of the nanofibres by the polysiloxane.
The WDX Si mapping of the samples compressed to flat films is presented in Figure 27.
Unmodified NFC t = 0.5h (Protocol 1) t= 2h (Protocol 1) t = 12h (Protocol 1)
t = 24h (Protocol 1) t = 48h (Protocol 1) t = 72h (Protocol 1) t = 12h (Protocol 2)
Figure 27: WDX Si mapping of unmodified NFC (a) and MTMS-treated NFC obtained according to Protocol 1 (b-g) or Protocol 2 (h) (Scale bar is 100 µm).
After silylation with Protocol 1, the brightness of the image as well as the proportion of Si
aggregates progressively increased with reaction time, indicating that the NFC surface was
increasingly covered by silane molecules, and also that polysiloxane particles were
increasingly produced. These polymers, detected as white dots in the SEM micrographs,
could be bonded or not to the substrate.
After silylation with Protocol 2, all the samples presented similar Si mappings, so only one
example was presented (Figure 27h). In this case, a much brighter and more uniform colour
was measured as compared with Protocol 1, confirming the full coverage of NFC by the
polysiloxane.
a b c d
e f g h

53
II.2.4. Impact of initial silane concentration (Protocol 1 & 2)
Once again, both Protocol 1 (with washing step, pH 0.4) and Protocol 2 (without washing step,
pH 4) were investigated. Reactions were performed for 2h at room temperature, using various
concentrations of MTMS ([MTMS]i) (Table 5).
Table 5: Initial concentrations of MTMS investigated
[MTMS]i [mmol/g] Protocol 1 Protocol 2
1.2
2.5
3.7
4.9
7.4
9.9
12.4
14.8
II.2.4.1. Evolution of Si content
The evolution of Si content as function of [MTMS]i is presented in Figure 28.
Figure 28: Evolution of Si content as a function of [MTMS]i for NFC treated with MTMS according to Protocol 1 (pH 0.4) or Protocol 2 (pH 4).
0.3 0.4 0.9
2.6 4.0
4.8
1.6 3.5
4.4
5.9
9.2
17.4
0.0
2.0
4.0
6.0
8.0
10.0
12.0
14.0
16.0
18.0
20.0
0.0 2.0 4.0 6.0 8.0 10.0 12.0 14.0 16.0
Si w
t%
[MTMS]i [mmol/g]
Protocol 1 Protocol 2

54
Regardless of the protocol used, a gradual increase in Si content was noted with increasing
silane concentration. This increase is logical in the case of Protocol 2, since all the silane
introduced remains within the NFC substrate after freeze-drying. With Protocol 1, the
presence of silane was detected only when [MTMS]i was above 7.4 mmol/g. It is likely that
below this concentration, most of the silane was leached out during the washing step with
water. By increasing the silane concentration, homocondensation is increasingly favoured,
and more insoluble polymers are probably produced. But the silane content remained low
compared with the unwashed samples, which meant the major part of the silane introduced
was leached out during the washing step.
II.2.4.2. Solid State NMR spectroscopy
a) 13
C CP-MAS NMR
The presence of silane at the NFC surface was confirmed by 13C CP-MAS NMR (Figure 29).
The carbon of the MTMS methyl moiety was detected at -3 ppm (Cα) in all spectra, except in
the case of samples with low Si content (Protocol 1: [MTMS]i < 7.4 mmol/g). Regardless of
the protocol, the intensity of the Cα peak increased gradually with [MTMS]i, in agreement
with the results of Figure 28.
Si wt%
Protocol 1 Protocol 2 Si wt%
Figure 29: 13C CP-MAS NMR spectra of MTMS-treated NFC prepared at different [MTMS]i (Protocol 1 & 2).
4.8
4.0
2.6
0.9
0.4
unmod.
increasing [MT
MS
]i
17.4
9.2
5.9
4.4
3.5
1.6
unmod.

55
b) 29
Si CP-MAS NMR
The 29Si CP-MAS NMR spectra of NFC treated at different [MTMS]i are presented in Figure
30.
Si wt % Protocol 1 Protocol 2 Si wt %
Figure 30: 29Si CP-MAS solid state NMR spectra of MTMS-treated NFC prepared at different [MTMS]i (Protocol 1 & 2).
The two signals at -56 and -65 ppm were again detected, but the relative intensity of the peaks
differed significantly depending on the method used and also on [MTMS]i in the case of
Protocol 2. These two signals were again assigned to di-condensed (T20 and/or T21) and tri-
condensed (T30) structures, respectively. A small additional signal, assigned to T11 and/or T12
structures, was again detected at -46 ppm in the case of Protocol 2.
After deconvolution of the spectra, the ratio of the peaks area at -56 and -65 ppm (T2/T3 ratio)
was calculated and plotted as a function of [MTMS]i (Figure 31). The T1 structures at -46
ppm were not taken into consideration due to their negligible contribution.
increasing [MT
MS
]i
17.4
9.2
5.9
4.4
3.5
1.6
4.8
4.0
2.6
0.9
0.4

56
Figure 31: Evolution of the ratio of the peaks area at -56 and -65 ppm (T2/T3 ratio) as a function of [MTMS]i.
With Protocol 1, the T2/T3 was quite stable when [MTMS]i was varied (T2/T3 ≈ 0.5), as was
already observed when pH and reaction time were varied (Figure 19 and Figure 25,
respectively). Hence, the silane concentration did not significantly impact the structure of the
polysiloxanes bonded or dispersed within the NFC network.
The samples prepared with Protocol 2 contained more T2 structures than the ones prepared
with Protocol 1 and the T2/T3 ratio fluctuated more, like in Figure 25. As was hypothesized in
II.2.3.2.b, we believe that Protocol 2 favoured the condensation between NFC and hydrolysed
MTMS during freeze-drying, via T2 sites (Scheme 19). It should be noted that the T2/T3 ratio
obtained with 1.9 mmol/g MTMS/gNFC was unexpectedly higher than the ratios obtained with
other [MTMS]i. Maybe at this concentration, the respective rates of hydrolysis and
condensation were in such a ratio that homocondensation was minimized. But additional work
is required to clarify this point.
0
0.2
0.4
0.6
0.8
1
1.2
1.4
1.6
1.8
2
0 2 4 6 8 10 12 14 16
T2/
T3
rati
o
[MTMS]i [mmol/gNFC]
Protocol 1 Protocol 2

57
II.2.4.3. Microscopy
The evolution of the NFC morphology upon silylation was assessed using SEM and the
resulting micrographs are presented in (Figure 32).
Unmodified NFC 4.9mmol/g (Protocol 1) 7.4 mmol/g (Protocol 1) 12.4 mmol/g (Protocol 1)
14.8 mmol/g (Protocol 1) 4.9 mmol/g (Protocol 2)
7.4 mmol/g (Protocol 2) 14.8 mmol/g (Protocol 2)
Figure 32: SEM micrographs of unmodified NFC (a) and NFC treated with MTMS, according to Protocol 1 (b-e) or Protocol 2 (f-h) (Scale bar is 10 µm). Results with various [MTMS]i are presented.
With Protocol 1, a 3D network of nanofilaments prevailed in all the samples, regardless of the
reaction time. When [MTMS]i was 7.4 mmol/gNFC or above, the presence of
homopolymerized MTMS was detected in the form of white particles or clusters within the
cellulose substrate (marked with arrows). Polysiloxane particles with diameters in the
nanometer range (Φ ~ 200 - 400 nm) were observed when [MTMS]i was 7.4 mmol/gNFC
(Figure 32c), but aggregates consisting of both small particles (Φ ~ 0.5 µm, see circles with
arrows in Figure 32e) and big particles (Φ ~ 6 µm, see arrows in Figure 32e) could be spotted
above this concentration. This result is in agreement with our hypothesis that polymers of
increasing molecular weight were formed when [MTMS]i was increased.
a b c d
f e
h g
big
small

58
NFC silylated according to Protocol 2 were composed of filaments which diameter tended to
increase with increasing MTMS concentration (Figure 32f-h), suggesting an increasing
decoration of the NFC surface by the polysiloxanes. Similar as what was observed in Figure
26h, sheet structures were also detected in these samples (marked with arrows in Figure 32f-
h), which may correspond to hornified NFC covered with silane or to polysiloxane films.
The WDX Si mapping of the samples prepared according to Protocol 1 confirmed the
presence of polysiloxane particles of increasing size and number, when [MTMS]i was
increased (Figure 33). An increase in overall image brightness was also noted with both
Protocol 1 and Protocol 2, indicating that the NFC surface was increasingly covered by the
polysiloxane. But a brighter and more uniform colour was measured with Protocol 2,
suggesting that the NFC were fully covered by the polymer in that case.
Unmodified NFC 4.9mmol/g (Protocol 1) 7.4 mmol/g (Protocol 1) 12.4 mmol/g (Protocol 1)
14.8 mmol/g (Protocol 1) 4.9mmol/g (Protocol 2) 7.4 mmol/g (Protocol 2) 14.8 mmol/g (Protocol 2)
Figure 33: WDX Si mapping of unmodified NFC (a) and NFC treated at different [MTMS]i, with Protocol 1 (b-e) and Protocol 2 (f-h). (Scale bar is 100 µm.)
II.3. Properties of silylated NFC
The properties of NFC produced according to Protocol 1 or Protocol 2, were investigated and
compared. Four different properties were investigated: resistance to leaching, crystallinity,
wettability and thermal properties.
a b c d
e f g h

59
II.3.1. Resistance to leaching
The stability of the silylation adducts with regards to hydrolysis and leaching was evaluated
by Soxhlet-extraction of the treated samples using different solvents. Only the samples
prepared by varying the initial MTMS concentrations were tested (Protocols 1 & 2 in II.2.4).
Three solvents of different polarities were investigated, namely water (dielectric constant ε =
80 and dipole moment µ = 1.85 D), ethanol (ε = 25 and µ = 1.85 D) and chloroform (ε = 4.8
and µ = 1.04 D). Water was selected to test the stability to hydrolysis of the silane possibly
condensed at the cellulose surface. Ethanol has been shown to be particularly efficient in
removing any physically adsorbed silane species from the cellulose surface.152, 153, 155
Chloroform is known to be a good solvent for polysiloxanes.184
After 20 h of soxhlet extraction with each solvent, the Si content of the samples was re-
evaluated by FTIR spectroscopy using the calibration chart of Figure 15.
For samples prepared with Protocol 1, the Si content tended to decrease after soxhlet
extraction and the leaching occurred in the order: water < chloroform < ethanol (Figure 34).
Figure 34: Evolution of the Si content in MTMS-treated NFC prepared at different [MTMS]i (Protocol 1), before and after extraction with water, chloroform and ethanol.
0.0
1.0
2.0
3.0
4.0
5.0
6.0
7.0
3.7 4.9 7.4 9.9 12.4 14.8
Si w
t%
[MTMS]i [mmol/g]
Protocol 1
Before extraction
20h extraction with water
20h extraction with chloroform
20h extraction with ethanol
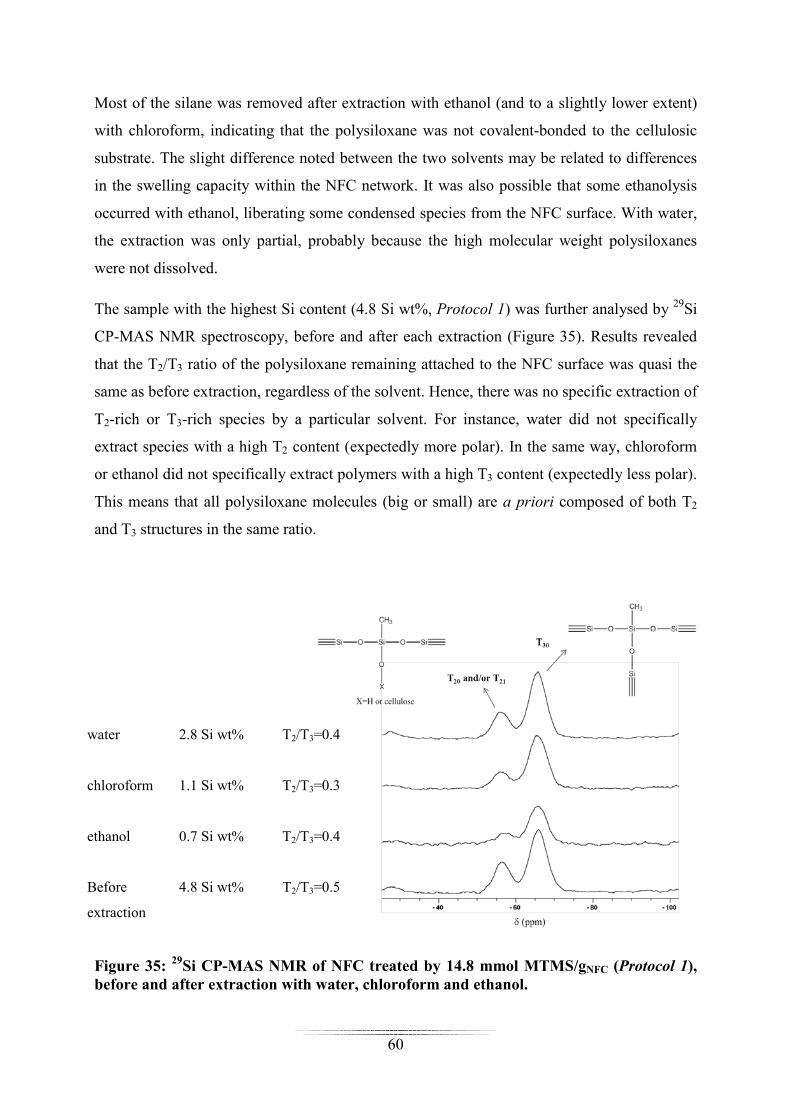
60
Most of the silane was removed after extraction with ethanol (and to a slightly lower extent)
with chloroform, indicating that the polysiloxane was not covalent-bonded to the cellulosic
substrate. The slight difference noted between the two solvents may be related to differences
in the swelling capacity within the NFC network. It was also possible that some ethanolysis
occurred with ethanol, liberating some condensed species from the NFC surface. With water,
the extraction was only partial, probably because the high molecular weight polysiloxanes
were not dissolved.
The sample with the highest Si content (4.8 Si wt%, Protocol 1) was further analysed by 29Si
CP-MAS NMR spectroscopy, before and after each extraction (Figure 35). Results revealed
that the T2/T3 ratio of the polysiloxane remaining attached to the NFC surface was quasi the
same as before extraction, regardless of the solvent. Hence, there was no specific extraction of
T2-rich or T3-rich species by a particular solvent. For instance, water did not specifically
extract species with a high T2 content (expectedly more polar). In the same way, chloroform
or ethanol did not specifically extract polymers with a high T3 content (expectedly less polar).
This means that all polysiloxane molecules (big or small) are a priori composed of both T2
and T3 structures in the same ratio.
Figure 35: 29Si CP-MAS NMR of NFC treated by 14.8 mmol MTMS/gNFC (Protocol 1), before and after extraction with water, chloroform and ethanol.
water 2.8 Si wt% T2/T3=0.4
chloroform 1.1 Si wt% T2/T3=0.3
ethanol 0.7 Si wt% T2/T3=0.4
Before
extraction
4.8 Si wt% T2/T3=0.5

61
In contrast, samples prepared with Protocol 2 exhibited a high resistance to leaching by any
of the solvents investigated (Figure 35). This result tends to confirm what was hypothesized
in Chapter II.2.3, i.e. the condensation or hydrogen bonding between the cellulosic substrate
and the polysiloxane was highly favoured in the case of Protocol 2.
Figure 36: Evolution of the Si content in MTMS-treated NFC prepared at different [MTMS]i (Protocol 2), before and after extraction with water, chloroform and ethanol.
Generally, a heat treatment is required (110 °C - 120 °C), to ensure the covalent bonding
between cellulose and alkoxysilanes, because the process is too slow at room temperature.155,
156, 158 In view of our results with Protocol 2, it seems possible to ensure an appropriate
covalent bonding between polysiloxane and NFC without heating.
II.3.2. Crystallinity
The impact of silylation on the NFC crystal structure was evaluated by X-ray diffraction
(XRD) analysis. Since strong acidic conditions may have an impact on the cellulose
crystallinity,187, 188 the samples prepared at different pH were investigated. Reactions were
performed at room temperature, for 2 h, using an initial MTMS concentration of 7.4
mmol/gNFC. Protocol 1 (pH = 0 - 1; cf. chapter II.2.2) and Protocol 2 (pH = 4; cf chapter
0.0
5.0
10.0
15.0
20.0
25.0
1.2 2.5 3.7 4.9 7.4 14.8
Si w
t%
[MTMS]i [mmol/g]
Protocol 2
Before extraction
20h extraction with water
20h extraction with chloroform
20h extraction with ethanol

62
II.2.3) were compared. The diffraction profiles obtained after XRD analysis are presented in
Figure 37.
Figure 37: XRD profiles of unmodified NFC and NFC treated with MTMS at different pH with Protocol 1 (pH = 0 - 1 )or Protocol 2 (pH = 4).
Unmodified NFC displayed the typical X-ray diffraction pattern of native cellulose (cellulose
I), with characteristics diffraction peaks at 2Θ angles of 14.8, 16.6, 22.3 and 34.4° ( 011 , 110,
200 and 004 lattices, respectively).189 After silylation, all samples still displayed the cellulose
I pattern, indicating that the original cellulose structure was preserved, regardless of the pH.
The crystallinity index (CI), which represents the percentage of crystalline material, did not
vary much between the samples, confirming that the silylation treatment did not significantly
affect the crystal structure of NFC. This is definitely an advantage of our method compared
with reported methods such as carboxymethylation,56 periodate-oxidation57 and acetylation,123
for which a decrease in crystallinity of NFC was noted, even at low modification rates.
10 20 30 40Angle [°]
CI pH
64% 0.0
Protocol 1
67% 0.2
67% 0.4
68% 0.6
63% 0.8
63% 1.0
63% 4.0 Protocol 2
65% Unmodified NFC

63
II.3.3. Wettability and hygroscopicity
Only the samples prepared by varying the initial silane concentration were tested (Protocol 1
and Protocol 2 in paragraph II.2.4).
II.3.3.1. Wettability
The wettability at the NFC surface was evaluated by measuring the contact angle of a water
droplet deposited on the freeze-dried silylated material.
All samples treated according to Protocol 1 – even the sample with the highest Si content -
were quite hydrophilic since in all cases, the water droplet was instantaneously absorbed by
the substrate (no water contact angle (WCA) could be measured). With Protocol 1,
polysiloxane particles are randomly dispersed within the NFC network, but the nanofibrils are
not fully covered by the silane. Accordingly, a large amount of hydroxyl groups remained
accessible to water at the NFC surface, resulting in hydrophilic properties.155, 156, 158
In contrast, all NFC treated according to Protocol 2 were quite hydrophobic, since WCA
above 100° were measured, even when the Si content was as low as 1.6 wt% (Figure 38). The
WCA progressively increased with the amount of grafted polysiloxane, up to a maximum of
147° when the Si content was 9.2 wt%. The WCA reported here are higher than those
generally reported when cellulosic fibers are modified by trialkoxysilanes (between 60° and
100°).155, 190 This behaviour has been associated with a progressive covering of the nanofibres
by the polysiloxane when the MTMS concentration was increased (cf II.2.4). Above 9.2 wt%
Si ([MTMS]i = 7.4 mmol/gNFC), a plateau was reached and no more modification of the WCA
was observed, probably because the amount of MTMS introduced was sufficient to fully
cover the NFC surface. Interestingly, the WCA values obtained here are similar to the values
reported for NFC modified with chlorodimethylisopropylsilane,140 a very hydrophobic
silylating agent. But the MTMS-silylation in water is an easier and much more
environmentally friendly route.

64
Figure 38: Water contact angle (WCA) values at the surface of NFC treated at different [MTMS]i with Protocol 2.
II.3.3.2. Hygroscopicity
The hygroscopic properties of silylated NFC were evaluated by Dynamic Vapour Sorption
(DVS). The water sorption isotherms obtained are presented in Figure 39 and Figure 40
(Protocol 1 and Protocol 2, respectively).
The moisture sorption isotherm pattern was similar in all samples, and was divided into three
regions correlated with the three types of water generally co-existing in the material:191 i) in
the RH range 0-20 %, sorption of monomolecular water is involved; ii) in the RH range 20-
80 %, sorption of multimolecular water occurs; iii) above 80 % RH, capillary water forms in
the material. Whereas the mobility of the mono- and multimolecular water is limited, the
capillary water can move easily inside the cellulosic materials.191
1.6 wt% Si
3.5 wt% Si
4.4 wt% Si 5.9 wt% Si
9.2 wt% Si 17.4 wt% Si
0
20
40
60
80
100
120
140
160
0 1 2 3 4 5 6 7 8 9 10 11 12 13 14 15 16
Wat
er c
onta
ct a
ngl
e [°
]
[MTMS]i [mmol/gNFC]
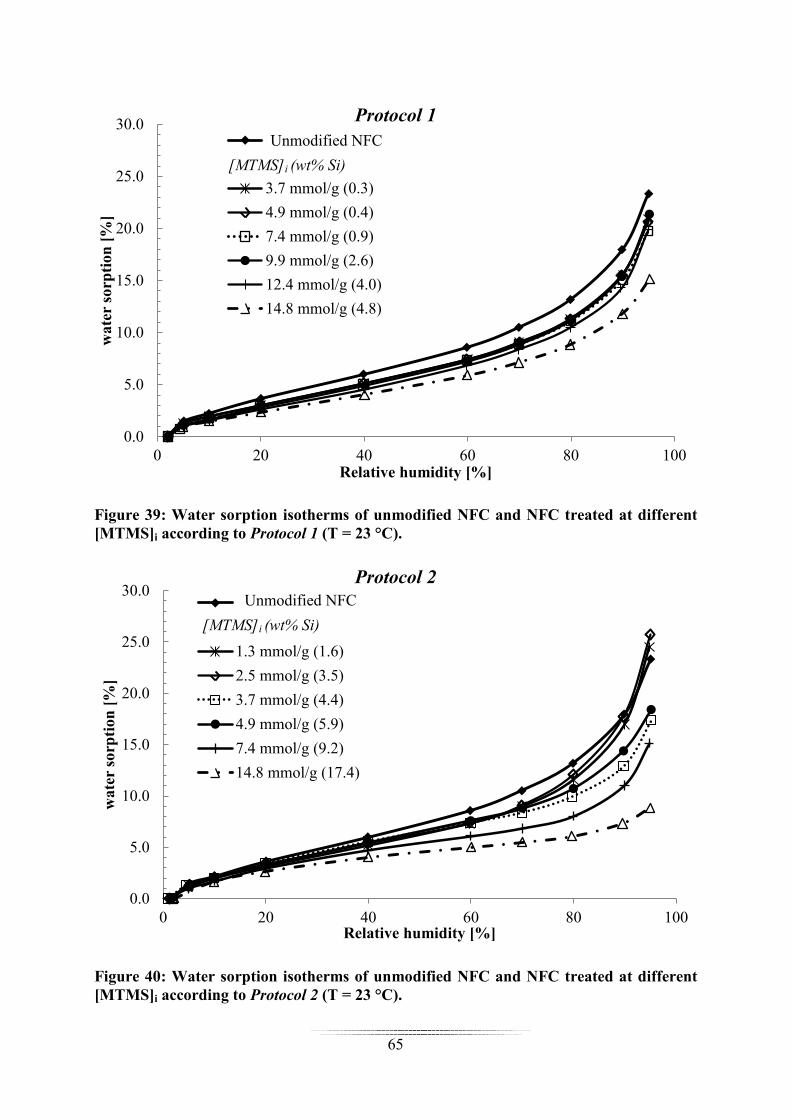
65
Figure 39: Water sorption isotherms of unmodified NFC and NFC treated at different [MTMS]i according to Protocol 1 (T = 23 °C).
Figure 40: Water sorption isotherms of unmodified NFC and NFC treated at different [MTMS]i according to Protocol 2 (T = 23 °C).
0.0
5.0
10.0
15.0
20.0
25.0
30.0
0 20 40 60 80 100
wat
er s
orp
tion
[%
]
Relative humidity [%]
Protocol 1
Untreated NFC
[MTMS]i (wt% Si)
3.7 mmol/g (0.3)
4.9 mmol/g (0.4)
7.4 mmol/g (0.9)
9.9 mmol/g (2.6)
12.4 mmol/g (4.0)
14.8 mmol/g (4.8)
0.0
5.0
10.0
15.0
20.0
25.0
30.0
0 20 40 60 80 100
wat
er s
orp
tion
[%
]
Relative humidity [%]
Protocol 2
Untreated NFC
[MTMS]i (wt% Si)
1.3 mmol/g (1.6)
2.5 mmol/g (3.5)
3.7 mmol/g (4.4)
4.9 mmol/g (5.9)
7.4 mmol/g (9.2)
14.8 mmol/g (17.4)
[MTMS]i (wt% Si)
Unmodified NFC
[MTMS]i (wt% Si)
Unmodified NFC

66
Regardless of [MTMS]i, NFC treated according to Protocol 1 or Protocol 2 presented lower
water sorption capacity compared with unmodified NFC, in particular at high silylation level.
Some hydroxyl groups might become inaccessible to water after silylation, but this decrease
might be simply due to the fact for a given weight, the silylated samples contained less
cellulosic material (there is less cellulose in 1 g silylated NFC than in 1 g unmodified NFC).
Differences were noted between the two protocols at lower Si content. Samples treated
according to Protocol 2 were more hydrophilic above 90 % RH, when Si content was 3.5
wt % or lower. Since capillary water was involved in this range of RH,191 some water
condensation may have occurred in that case.
II.3.4. Thermal stability
The impact of silylation on the thermal stability of NFC was evaluated by thermogravimetric
analysis (TGA), under inert atmosphere. Only the samples prepared by varying the initial
silane concentration were analysed (cf. II.2.4). The thermograms of samples silylated
according to Protocol 1 and Protocol 2 are presented in Figure 41 and Figure 42, respectively.
The degradation data, i.e. temperatures associated with a 5 % weight loss (T5 %), maximum
degradation temperatures (Td) and weight percentage residue at 900 °C, are reported in Table
6.

67
Table 6: Degradation data obtained from TGA analysis of unmodified NFC and NFC treated at different [MTMS]i. T5 %: temperature associated with a 5 % weight loss; Td: maximum degradation temperature; W900 °C: weight percentage residue at 900 °C.
Samples [MTMS]i
[mmol/gNFC] Si wt % T5% (°C) Td (°C) W900 °C (%)
Unmodified - - 257 382 0.5
Silylation with
Protocol 1
3.7 0.3 293 385 2.5
4.9 0.4 299 393 3.1
7.4 0.9 294 394 3.8
9.9 2.6 169 390 4.2
12.4 4.0 141 377 6.6
14.8 4.8 142 374 10.3
Silylation with
Protocol 2
1.2 1.6 278 393 8.3
2.5 3.5 288 392 13.9
3.7 4.4 278 381 17.3
4.9 5.9 292 396 23.5
7.4 9.2 306 400 29.7
14.8 17.4 318 404 42.0
Figure 41: Thermograms of unmodified NFC and NFC treated at different [MTMS]i with Protocol 1.
0
10
20
30
40
50
60
70
80
90
100
0 200 400 600 800
Wei
ght
[%]
Temperature [°C]
Protocol 1
Untreated NFC
Silylated NFC
0.3 wt% Si
0.4 wt% Si
0.9 wt% Si
2.6 wt% Si
4.0 wt% Si
4.8 wt% Si
Silylated NFC
Unmodified NFC

68
All the samples displayed a weight loss between 50 and 100 °C, which was associated with
the loss of residual moisture.192 The most important mass loss occurred between 300 and
400 °C in all samples, which was correlated with the degradation of cellulose.193, 194 The
maximum degradation temperatures (Td) of unmodified and silylated NFC were in the range
between 374 and 394 °C. This is higher than the values generally reported for unmodified
NFC (~350 °C),153, 195 but any comparison is tricky since degradation depends on cellulose
source, heating rate, gas environment, fibrillation process and drying process.195
With Protocol 1, a significant weight loss was noted between 120 °C and 300 °C, with
samples contained 2.6 wt % Si or more. The T5 % was also lower in that case (Table 6),
indicating that degradation occurred earlier. Since with Protocol 1, polysiloxane particles are
not covalent-bonded to the NFC surface (cf. II.3.1), the weight loss measured in this
temperature range was associated with the elimination of adsorbed low molecular weight
polysiloxanes.
At low Si content (below 0.9 wt %), a slight improvement in thermal stability was noted as
T5 % was higher than the one of unmodified NFC (Table 6).
Figure 42: Thermograms of unmodified NFC and NFC treated at different [MTMS]i with Protocol 2.
0
10
20
30
40
50
60
70
80
90
100
0 100 200 300 400 500 600 700 800 900
Wei
ght
[%]
Temperature [°C]
Protocol 2 Untreated NFCSilylated NFC1.6 wt% Si3.5 wt% Si4.4 wt% Si5.9 wt% Si9.2 wt% Si17.4 wt% Si
Silylated NFC
Unmodified NFC

69
However, the best improvements in thermal stability were obtained with Protocol 2. There
was no weight loss between 120 °C and 300 °C, confirming that the polysiloxanes were
strongly bonded to the substrate in that case. T5 % was found to increase with increasing Si
content, indicating that silylation improved the thermal stability. This was further confirmed
in the temperature range between 300 and 400 °C since a significant increase in Td was also
noted (except for sample with 4.4 wt % Si, probably because of inhomogeneities in the silane
distribution within the treated sample). Silylation with alkoxysilanes has already been
reported to have a positive influence on the thermal stability of cellulosic fibres.150, 196 Our
results indicate that the surface covering of NFC by a homogeneous silane layer is a
prerequisite to obtain an efficient improvement.
After each experiment, the process left a residue, which percentage increased with increasing
silylation level (W900 °C in Table 6). This increase was assigned to the silica remaining after
thermal degradation of high molecular weight polysiloxanes.197-199
II.4. Concluding remarks
The results presented in the present chapter have shown that NFC could be silylated with
MTMS in aqueous medium. Two different types of silylated NFC were produced, without
modification of the original crystalline structure. The first type consisted in a cellulose
nanofibrils network, in which polysiloxane particles were dispersed (Protocol 1), while the
second type consisted in nanofibrils covered by a homogeneous polysiloxane layer (Protocol
2). The size of the particles or the thickness of the polysiloxane layers could be controlled by
monitoring the initial silane concentration.
Leaching experiments have shown that the polysiloxane particles produced with Protocol 1
were not firmly anchored to the cellulosic substrate, whereas the polysiloxane layer covering
the NFC treated according to Protocol 2 was strongly bonded.
Differences were also noted in terms of wettability and thermal stability. While NFC treated
with Protocol 1 remained hydrophilic, very hydrophobic nanofibrils were produced with
Protocol 2. The thermal stability was also significantly improved in that case, due to the
efficient covering of the NFC surface by the silane polymer.

70

71
III. Silylated NFC as reinforcing agents in composites
III.1. Objectives and methodology
The fundamental work presented in Chapter II has highlighted the possibility to silylate NFC
in water, in a controlled manner. Results have shown that the nanofibres surface could be
tailored to some extent by varying the experimental protocol and adjusting the silylation level.
In the current chapter, the potential of silylated NFC as reinforcing agent in composites has
been investigated. NFC’s with different silylation level were produced by varying the initial
silane concentration ([MTMS]i), using Protocol 1 and Protocol 2. The impact of silylation on
the composites properties was subsequently studied. Two distinctive polymer matrices were
selected for these experiments, namely polydimethylsiloxane (PDMS) and poly(lactic acid)
(PLA). A solvent casting process in chloroform was used with both polymers (Scheme 20).
The resulting composite materials were compared with regards to their mechanical, thermal
and hygroscopic properties.
Scheme 20: Solvent casting process used for the preparation of NFC composites based on PDMS and PLA.
III.2. PDMS composites
All composites samples were prepared by solvent casting, using suspensions containing 1
wt % of unmodified or MTMS-treated NFC in chloroform. Higher concentrations were
avoided, due to an excessive increase in the viscosity of the chloroform suspension.
Composites were prepared based on a formulation already described in the literature, with
tetrapropylorthosilicate as cross-linker and tin(II) 2-ethylhexanoate as catalyst.200

72
III.2.1. Viscoelastic properties
The viscoelastic properties (shear modulus G’) of the composites were evaluated using the
torsion pendulum experiment, during which the deformation of the samples is measured at
different temperatures and constant applied shear stress.201, 202 Dynamic Mechanical Analysis
in tension mode was attempted but led to unreliable results due to a lack of sensitivity of the
equipment in the whole temperature range.
According to theory, the relation between shear modulus G’ and modulus of elasticity E’ is
given by the equation:203 �′ =�′2(1+�)
(1),
in which ν is the Poisson’s ratio. For elastomer such as silicone, the Poisson’s ratio is ~0.5.204
The evolution of shear modulus (G’) and damping factor (tan δ) for PDMS composites
reinforced with 1 % NFC treated at different [MTMS]i (Protocol 1 and Protocol 2), are
presented in Figure 43 and Figure 44. The evolution for neat PDMS is also reported.
Figure 43: Temperature-dependant shear modulus and damping factor (tanδ) of composites containing 1 % NFC treated at different [MTMS]i (Protocol 1)
0.00
0.05
0.10
0.15
0.20
0.25
0.30
0.35
0
1
10
100
1'000
10'000
-180.0 -130.0 -80.0 -30.0 20.0 70.0
tan
δ
G' [
MP
a]
Temperature [°C]
Protocol 1 Neat PDMSPDMS + untreated NFCPDMS + silylated NFC0.3 wt% Si0.4 wt% Si0.9 wt% Si2.6 wt% Si4.0 wt% Si4.8 wt% Si
PDMS + silylated NFC
PDMS + unmod. NFC

73
Figure 44: Temperature-dependant shear modulus and damping factor (tanδ) of PDMS composites containing 1 % NFC treated at different [MTMS]i (Protocol 2).
Spanning from low to high temperatures, three different regions could be identified for neat
PDMS: the glassy state (below -110 °C), the rubbery state (approx. between -110 and -40ºC)
and finally the melting plateau (above -40 °C). The neat PDMS exhibited a glass transition
(Tg) of – 110 ºC and a melting temperature of – 42 °C according to the tan δ curve. These
results are in agreement with the literature.205
The presence of unmodified or silylated NFC had quasi no influence on the viscoelastic
response of the resulting nanocomposites, except in the higher temperature region, above -
40 °C.
The G’ values obtained at 40 °C for neat PDMS and its composites have been reported in
Figure 45.
0.00
0.05
0.10
0.15
0.20
0.25
0.30
0
1
10
100
1'000
10'000
-180.0 -130.0 -80.0 -30.0 20.0 70.0
tan
δ
G' [
MP
a]
Temperature [°C]
Protocol 2 Neat PDMSPDMS + untreated NFCPDMS + silylated NFC1.6 wt% Si3.5 wt% Si4.4 wt% Si5.9 wt% Si9.2 wt% Si17.4 wt% Si
PDMS + silylated NFC PDMS + unmod. NFC

74
Figure 45: Shear moduli of the different PDMS composites at 40 °C.
The incorporation of 1 % unmodified NFC in the PDMS polymer led to an increase in G’ by a
factor of ~ 2. A further increase was noted after silylation, depending on the protocol used and
the silylation level. The best results were obtained with Protocol 2, when the NFC surface
was only slightly silylated (Si wt% = 1.6 %), of which the shear modulus was increased by a
factor of ~ 6 in that case. This was attributed to an improved compatibility at the fibre-matrix
interface, which was believed to be optimal at this level of modification. By increasing further
the silane content, a progressive decrease in G’ was observed, confirming the importance of
controlling the silylation level at the NFC surface. Although the improvement was less when
Protocol 1 was used, an increase in G’ by a factor of ~ 5 was still noted with NFC containing
4 % Si. Unlike in the case of Protocol 2, G’ was lower at low Si content, but a different
behaviour was expected since the coverage and distribution of polymerized MTMS at the
NFC surface was significantly different (see Chapter II.2.4). A better interfacial adhesion was
obviously obtained when the NFC surface was uniformly covered by the silane (Protocol 2),
0.00
0.50
1.00
1.50
2.00
2.50
3.00
3.50
4.00
4.50
Nea
t PD
MS
PD
MS
+un
trea
ted
NF
C
0.3
wt%
Si
0.4
wt%
Si
0.9
wt%
Si
2.6
wt%
Si
4.0
wt%
Si
4.8
wt%
Si
1.6
wt%
Si
3.5
wt%
Si
4.4
wt%
Si
5.9
wt%
Si
9.2
wt%
Si
17.4
wt%
Si
PDMS + silylated NFC (Pr.1) PDMS + silylated NFC (Pr.2)
G' a
t 40
°C [
MP
a]
Shear moduli at 40°C [MPa]
PDMS + silylated NFC (Pr. 1) PDMS + silylated NFC (Pr. 2)
PD
MS
+ u
nmod
. NF
C

75
rather than simply decorated with dispersed particles (Protocol 1). But an excessive coverage
can also have a detrimental effect.
The very low G’ obtained with NFC containing 4.8 % Si (Protocol 1) may be related to the
presence of large polysiloxane particles in the NFC sample (see Figure 32 in Chapter II.2.4.3),
which might impact negatively the interfacial properties.
No clear modification of tan δ intensity could be detected in the composite materials
compared with neat PDMS. Probably the NFC content (1 %) wass not sufficient to
significantly alter the mobility of the PDMS chains.
III.2.2. Tensile properties
The tensile properties of PDMS composites were evaluated by performing tensile tests
experiments. The elastic modulus (E), tensile strength (σ) and strain at break (ε) of the
composites are presented in Figure 46.
Different parameters can influence the mechanical properties of fiber-reinforced composites,
such as fiber/matrix interfacial adhesion, fiber aspect ratio, fiber orientation etc.206

76
Figure 46: Elastic modulus (E), tensile strength (σ) and strain of break (ε) of PDMS composites containing 1 % NFC treated at different [MTMS]i according to Protocol 1 or Protocol 2.
A slight increase in E modulus was noted after 1% of unmodified NFC was incorporated into
the PDMS polymer, but after silylation, the increase was more significant. The E modulus
increased by a factor of ~ 3 after NFC was treated with MTMS, regardless of the protocol and
or the silylation level, indicating that the compatibility between the silylated NFC and the
PDMS matrix was improved to some extent.
For tensile strength, significant improvement was obtained only when NFC was silylated
according to Protocol 2, and when the Si content was not excessively high (1.6 and 3.5 %),
which is in consistency with viscoelastic results (see Figure 45). All other silylated samples
displayed σ values in the same order of magnitude than PDMS or lower when the Si content
was low. A 30 % decrease in σ was noted with unmodified NFC, or when the Si content was
below 0.4 %, confirming the poor compatibility between the hydrophobic PDMS and the
hydrophilic NFC.
0
50
100
150
200
250
300
350
400
0
0.5
1
1.5
2
2.5
3
3.5
4
4.5
5
Nea
t PD
MS
PD
MS
+un
trea
ted
NF
C
0.3
wt%
Si
0.4
wt%
Si
0.9
wt%
Si
2.6
wt%
Si
4.0
wt%
Si
4.8
wt%
Si
1.6
wt%
Si
3.5
wt%
Si
4.4
wt%
Si
5.9
wt%
Si
9.2
wt%
Si
17.4
wt%
Si
PDMS + silylated NFC
Str
ain
at
bre
ak [
%]
E m
odu
lus
[MP
a] /
Ten
sile
str
engt
h [
MP
a]
E modulus [MPa] Tensile strength [MPa] Strain at break [%]
Protocol 1 Protocol 2
PD
MS
+ u
nmod
. NF
C

77
The strain at break was significantly decreased after the addition of 1 wt % unmodified NFC
into the PDMS matrix, indicating that the material became more brittle. To our knowledge, no
other studies on PDMS composites containing NFC have been reported. But this result is not
surprising, since the introduction of NFC in other polymers often leads to a reduction in ε, as
mentioned in I.4.1.2. ε decreased further after silylation, but no significant difference was
noted between the composites prepared with the different types of silylated materials.
III.2.3. Thermal stability
The thermal stability of neat PDMS and its composites was evaluated by thermogravimetric
analysis (TGA), under inert atmosphere. The thermograms are presented in Figure 47a and
47b (Protocol 1 & 2, respectively). The degradation data, i.e. temperatures associated with a
5 % weight loss (T5 %), maximum degradation temperatures (Td) and weight percentage
residue at 900 °C (W900 °C), are reported in Table 7.
Table 7: Degradation data obtained from TGA analysis of PDMS composites containing 1 % unmodified or MTMS-treated NFC. T5 %: temperature associated with a 5 % weight loss; Td: maximum degradation temperature; W900 °C: weight percentage residue at 900 °C.
Filler Si wt % T5 % [°C] Td [°C] W900 °C [%]
No - 392 426 1.1
1 wt % unmodified
NFC
0 396 435 1.9
1 wt % MTMS-treated
NFC (Protocol 1)
0.3 374 444 1.6
0.4 389 451 2.0
0.9 407 467 1.8
2.6 374 433 2.2
4.0 377 432 2.1
4.8 397 449 2.1
1 wt % MTMS-treated
NFC (Protocol 2)
1.6 377 432 2.5
3.5 376 428 3.0
4.4 403 462 2.0
5.9 387 428 2.3
9.2 398 452 2.3
17.4 373 432 2.2

78
Figure 47: Thermograms of PDMS composites containing 1 wt % unmodified or MTMS-treated NFC (a: Protocol 1 and b: Protocol 2).
All samples were thermally stable up to 300 °C, followed by a major weight loss in the
temperature range between 300 °C and 750 °C, assigned to the decomposition of PDMS. Its
maximum degradation temperature (Td) was recorded at 426 °C, in agreement with literature
data.200 The incorporation of unmodified NFC improved the thermal stability of the
composites, as illustrated by the higher T5 % and Td values measured in that case (Table 7).
After silylation, further improvement was noted in some cases (increase in T5 % and Td),
degradations in others (decrease in T5 %), but no clear trend could be neither established nor
correlated with the viscoelastic and mechanical properties measured in previous chapter.
0
20
40
60
80
100
0 200 400 600 800
Wei
ght
[%]
T [°C]
Protocol 1
Neat PDMS
PDMS + untreated NFC
PDMS + silylated NFC
0.3 wt% Si
0.4 wt% Si
0.9 wt% Si
2.6 wt% Si
4.0 wt% Si
4.8 wt% Si
0
20
40
60
80
100
0 200 400 600 800
Wei
ght
[%]
T [°C]
Protocol 2
Neat PDMS
PDMS + untreated NFC
PDMS + silylated NFC
1.6 wt% Si
3.5 wt% Si
4.4 wt% Si
5.9 wt% Si
9.2 wt% Si
17.4 wt% Si
a
b
PDMS + silylated NFC
PDMS + silylated NFC
PDMS + unmodified NFC
PDMS + unmodified NFC

79
The introduction of unmodified or silylated NFC increased the weight percentage residue
obtained at 900 °C (W900 °C), but once again, no clear trend could be established when
comparing the samples.
III.2.4. Hygroscopicity
PDMS is a highly hydrophobic polymer,207, 208 while cellulose is hydrophilic. It was thus
important to investigate the impact of NFC on the hygroscopic properties of PDMS
composites.
These properties were evaluated using Dynamic Vapour Sorption (DVS) experiments. The
water sorption isotherms of the composites are presented in Figure 48a and 48b (Protocols 1
& 2, respectively).
In all cases, a continuous increase in water sorption was measured, when RH was increased
from 5 to 95 %. With neat PDMS, the maximum moisture uptake was low (0.1 %),
confirming the hydrophobic character of this material. The incorporation of NFC in the
PDMS matrix slightly increased the hygroscopicity of the material, but the maximum
moisture uptake remained low in all cases (below 0.3 %). Water uptake tended to be more
limited when NFC was highly silylated.

80
Figure 48: Water sorption isotherms of PDMS composites containing 1 wt % unmodified or MTMS-treated NFC (a: Protocol 1 and b: Protocol 2).
III.3. PLA composites
All composites samples were prepared by solvent casting, using suspensions containing 10
wt % of unmodified or MTMS-treated NFC in chloroform. Composites were prepared based
on a formulation already described in the literature.72
III.3.1. Crystallinity of PLA in composites
The mechanical properties of PLA and its composites are highly impacted by the crystallinity
of the polymer.74, 209 The crystallinity (Xc) of the neat PLA and its composites was
accordingly evaluated from the melting enthalpies (∆Hm) measured by DSC (Table 8).
All PLA composites presented a higher crystallinity compared with neat PLA (Xc = 34 %),
which can be assigned to the nucleation effect of NFC.149, 210 A crystallinity of about 40 %
was measured in all cases, regardless of the protocol used and the silylation level.
The glass transition temperature (Tg) of PLA measured by DSC, did not show any significant
modification after incorporation of unmodified or silylated NFC (Tg ≈ 60 °C in all cases).
0.0
0.1
0.2
0.3
0.4
0.5
0 20 40 60 80 100
wat
er s
orp
tion
[%
]
Relative humidity [%]
Protocol 1
Neat PDMS
PDMS + untreated NFC
PDMS + silylated NFC
0.3 wt% Si
0.4 wt% Si
0.9 wt% Si
2.6 wt% Si
4.0 wt% Si
4.8 wt% Si
0.0
0.1
0.2
0.3
0.4
0.5
0 20 40 60 80 100
wat
er s
orp
tion
[%
]
Relative humidity [%]
Protocol 2
Neat PDMS
PDMS + untreated NFC
PDMS + silylated NFC
1.6 wt% Si
3.5 wt% Si
4.4 wt% Si
5.9 wt% Si
9.2 wt% Si
17.4 wt% Si
a b
PDMS + silylated NFC PDMS + silylated NFC
PDMS + unmodified NFC PDMS + unmodified NFC

81
Hence, the chains mobility in PLA was not significantly impacted by the nanofibres dispered
within the material.149
Table 8: DSC and DMA data obtained after analysis of PLA composites containing 10% of unmodified or MTMS-treated NFC.
Filler Si wt %
(of NFC)
DSC DMA
Tgb
[°C]
∆Hmc
[J/g]
Xc [%] E’ at 33 °C
[GPa]
E’ at 100 °C
[GPa]
Tga
[°C]
no 0 60 31.6 34.0 2.9 ± 0.39 0.15 ± 0.02 64
10 wt %
unmodified NFC
0 59 33.7 40.2 3.0 ± 0.10 0.34 ± 0.02 62
10 wt % MTMS-
treated NFC
(Protocol 1)
0.3 60 33.1 39.6 2.8 ± 0.08 0.32 ± 0.01 61
0.4 60 33.3 39.8 2.4 ± 0.11 0.28 ± 0.02 61
0.9 60 32.4 38.7 3.2 ± 0.14 0.34 ± 0.02 61
2.6 59 33.6 40.1 2.8 ± 0.15 0.33 ± 0.02 59
4.0 59 35.3 42.2 3.0 ± 0.10 0.33 ± 0.02 60
4.8 59 32.3 38.6 2.9 ± 0.14 0.27 ± 0.01 62
10 wt % MTMS-
treated NFC
(Protocol 2)
1.6 60 32.2 38.5 2.4 ± 0.32 0.24 ± 0.06 62
3.5 59 34.0 40.6 2.7 ± 0.13 0.31 ± 0.01 61
4.4 60 33.0 39.4 2.3 ± 0.07 0.26 ± 0.01 64
5.9 61 31.2 37.3 2.6 ± 0.11 0.26 ± 0.01 63
9.2 59 31.4 37.5 2.2 ± 0.18 0.23 ± 0.01 62
17.4 61 32.4 38.7 2.0 ± 0.05 0.14 ± 0.01 64
a Tg evaluated by DMA (tanδ); b Tg evaluated by DSC during the second heating run; c ∆Hm
determined by DSC during the first heating run.
III.3.2. Viscoelastic properties
The viscoelastic properties of the PLA composites were evaluated by Dynamic Mechanical
Analysis (DMA) in tension mode. The evolution of storage modulus (E’) and damping factor
(tan δ) of neat PLA and PLA reinforced with NFC treated at different [MTMS]i (Protocol 1
or Protocol 2), are presented in Figure 49 and Figure 50. The E’ values measured at 33 °C
and 100 °C are reported in Table 8, along with the Tg extracted from the tan δ curves.
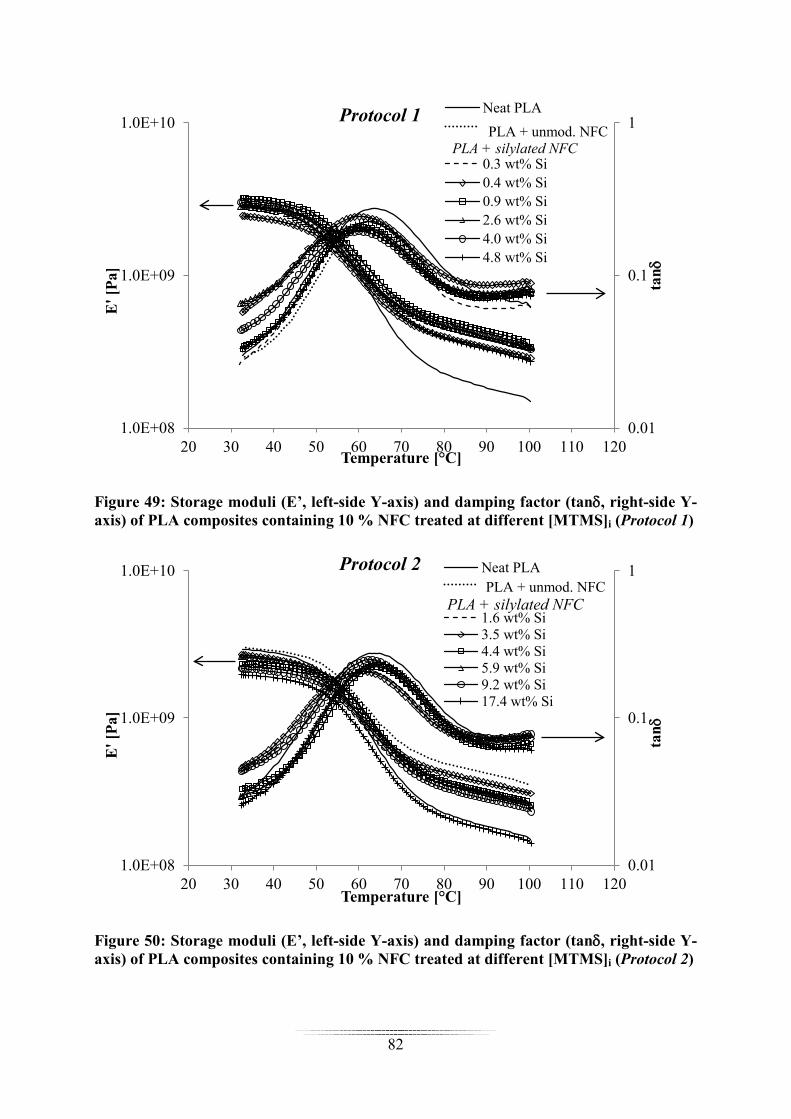
82
Figure 49: Storage moduli (E’, left-side Y-axis) and damping factor (tanδ, right-side Y-axis) of PLA composites containing 10 % NFC treated at different [MTMS]i (Protocol 1)
Figure 50: Storage moduli (E’, left-side Y-axis) and damping factor (tanδ, right-side Y-axis) of PLA composites containing 10 % NFC treated at different [MTMS]i (Protocol 2)
0.01
0.1
1
1.0E+08
1.0E+09
1.0E+10
20 30 40 50 60 70 80 90 100 110 120
tan
δ
E' [
Pa]
Temperature [°C]
Protocol 1 Neat PLAPLA + untreated NFCPLA + silylated NFC0.3 wt% Si0.4 wt% Si0.9 wt% Si2.6 wt% Si4.0 wt% Si4.8 wt% Si
0.01
0.1
1
1.0E+08
1.0E+09
1.0E+10
20 30 40 50 60 70 80 90 100 110 120
tan
δ
E' [
Pa]
Temperature [°C]
Protocol 2 Neat PLAPLA + untreated NFCPLA + silylated NFC1.6 wt% Si3.5 wt% Si4.4 wt% Si5.9 wt% Si9.2 wt% Si17.4 wt% Si
PLA + silylated NFC
PLA + silylated NFC
PLA + unmod. NFC
PLA + unmod. NFC

83
The reproducibility of the response was very good, as demonstrated by the low standard
deviations measured (Table 8).
Spanning from low to high temperatures, three different regions could be identified: the
glassy state (below 45ºC), the glass transition (approx. between 45 and 80ºC) and the rubbery
plateau (approx. between 80 and 100ºC). The neat PLA exhibited a Tg of 64 ºC, in agreement
with the literature data.72
The presence of unmodified or silylated NFC had quasi no influence on the viscoelastic
response in the glassy region. In the glass transition region, the damping intensity (tan δ) was
not significantly modified, in the presence of fillers, regardless of the type of NFC used. This
confirms that the mobility of PLA chains was not significantly impacted by the nanofibres.
In the rubbery region, a significant reinforcing effect was generally observed in presence of
unmodified NFC, but silylation did not improve further the performances of the composites.
With Protocol 1, performances were often similar to the ones obtained without the treatment,
but with Protocol 2, the reinforcement effect was systematically lower. With this method, the
NFC surface was increasingly covered by the polysiloxane when [MTMS]i was increased (see
Figure 32g-l). This increasingly prevents the formation of hydrogen bonds between
nanofibrils. As a consequence, it is more difficult for silylated NFC to create a percolation
network within the PLA matrix, which is known to participate to the reinforcing effect in
composites.73, 74, 135, 209, 211 With Protocol 1, NFC was simply decorated by polysiloxane
particles (see Figure 32b-f) and hydroxyl groups are still available for hydrogen bonding. This
may explain why the properties were less degraded in that case.
As a comparison, significant improvement were noted when 10 wt% acetylated NFC were
dispersed in PLA.72, 122, 123
III.3.3. Tensile properties
The tensile properties of the PLA composites were evaluated by performing tensile test
experiments. The elastic modulus (E), tensile strength (σ) and strain at break (ε) are presented
in Figure 51.

84
Figure 51: Elastic modulus (E), tensile strength (σ) and strain of break (ε) of PLA composites containing 10 % NFC treated at different [MTMS]i according to Protocol 1 or Protocol 2.
Neat PLA displayed E modulus and tensile strength values of 2.7 ± 0.5 GPa and 54 ± 3.8 MPa,
respectively, in good agreement with literature data.212, 213
The presence of 10 % unmodified NFC increased the E modulus by a factor of ~ 1.5, but
tensile strength was not modified and strain at break decreased. The increase in E was
correlated with the nucleating effect of NFC, which significantly increased the crystallinity of
PLA (see chapter II.3.2). No improvement or rather a degradation of the composites
performances was noted after silylation, in consistency with DMA results. Obviously, the
compatibility between PLA and NFC was not improved by the MTMS treatment and/or the
Nea
t PL
A
PL
A+
untr
eate
d N
FC
0.3
wt%
Si
0.4
wt%
Si
0.9
wt%
Si
2.6
wt%
Si
4.0
wt%
Si
4.8
wt%
Si
1.6
wt%
Si
3.5
wt%
Si
4.4
wt%
Si
5.9
wt%
Si
9.2
wt%
Si
17.4
wt%
Si0
1
2
3
4
5
E m
odul
us [
GP
a] /
Str
ain
at b
reak
[%
]E Modulus [GPa]
0
10
20
30
40
50
60
Ten
sile
str
engt
h [M
Pa]
Tensile strength [MPa] Strain at break [%]
Protocol 2Protocol 1
PLA + silylated NFC
PL
A +
unm
od. N
FC

85
possibility for hydrogen bonding was decreased (especially with Protocol 2). In addition, the
silylated NFC could be badly dispersed within the PLA matrix and agglomerates might have
formed.
III.3.4. Thermal stability
The thermal stability of neat PLA and its composites was evaluated by TGA under inert
atmosphere. The thermograms are presented in Figure 52a and 52b (Protocol 1 & 2,
respectively). The degradation data, i.e. T5 %, Td and W600°C are reported in Table 9.
Table 9: Degradation data obtained from TGA analysis of neat PLA and PLA composites containing 10 wt% unmodified NFC or MTMS-treated NFC. T5 %: temperature associated with a 5 % weight loss; Td: maximum decomposition temperature; W600 °C: weight percentage residue at 600 °C.
Filler Si wt% T5 % [°C] Td [°C] W600 °C [%]
no 0 353 396 0.7
10 wt % unmodified
NFC
0 316 391 1.1
10 wt % MTMS-
treated NFC
(Protocol 1)
0.3 336 394 1.7
0.4 336 393 1.6
0.9 336 395 1.6
2.6 276 389 1.7
4.0 234 392 1.8
4.8 334 397 2.1
10 wt % MTMS-
treated NFC
(Protocol 2)
1.6 313 389 2.0
3.5 315 384 2.6
4.4 331 394 3.4
5.9 335 394 3.8
9.2 339 397 4.3
17.4 339 397 4.3
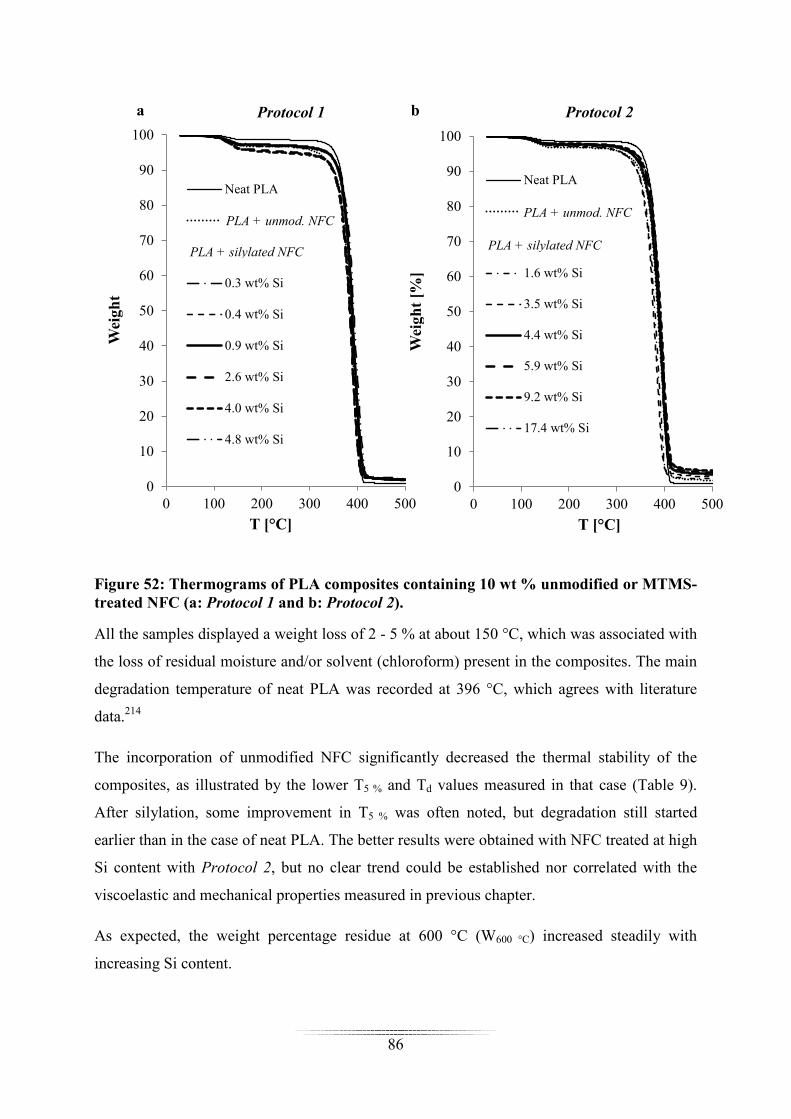
86
Figure 52: Thermograms of PLA composites containing 10 wt % unmodified or MTMS-treated NFC (a: Protocol 1 and b: Protocol 2).
All the samples displayed a weight loss of 2 - 5 % at about 150 °C, which was associated with
the loss of residual moisture and/or solvent (chloroform) present in the composites. The main
degradation temperature of neat PLA was recorded at 396 °C, which agrees with literature
data.214
The incorporation of unmodified NFC significantly decreased the thermal stability of the
composites, as illustrated by the lower T5 % and Td values measured in that case (Table 9).
After silylation, some improvement in T5 % was often noted, but degradation still started
earlier than in the case of neat PLA. The better results were obtained with NFC treated at high
Si content with Protocol 2, but no clear trend could be established nor correlated with the
viscoelastic and mechanical properties measured in previous chapter.
As expected, the weight percentage residue at 600 °C (W600 °C) increased steadily with
increasing Si content.
0
10
20
30
40
50
60
70
80
90
100
0 100 200 300 400 500
Protocol 1
Neat PLA
PLA + untreated NFC
PLA + silylated NFC
0.3 wt% Si
0.4 wt% Si
0.9 wt% Si
2.6 wt% Si
4.0 wt% Si
4.8 wt% Si
PLA + silylated NFC
T [°C]
Wei
ght
PLA + unmod. NFC
0
10
20
30
40
50
60
70
80
90
100
0 100 200 300 400 500
Protocol 2
Neat PLA
PLA + untreatedNFCPLA + silylatedNFC1.6 wt% Si
3.5 wt% Si
4.4 wt% Si
5.9 wt% Si
9.2 wt% Si
17.4 wt% Si
PLA + silylated NFC
PLA + unmod. NFC
T [°C]
Wei
ght
[%]
b a

87
III.3.5. Hygroscopicity
Despite its hydrophobic character, PLA is sensitive to moisture, which can in certain
conditions result in polymer hydrolysis, self-catalysed by the carboxylic acid end groups of
PLA chains.215 In this context, the hygroscopic properties of PLA composites towards water
vapour were evaluated by DVS. The water sorption isotherms of the composites are presented
in Figure 53a and 53b (Protocol 1 & 2, respectively).
In all cases, a continuous increase in water sorption was measured, when RH was increased
from 5 to 95 %. With neat PLA, the maximum moisture uptake remained low (0.8 %),
confirming the hydrophobic character of this material. The incorporation of 10 % unmodified
or silylated NFC in the PLA matrix increased significantly the hygroscopicity of the film,
although the water uptake tended to be more limited when NFC was silylated.
Figure 53: Water sorption isotherms of PLA composites containing 10 wt % unmodified or MTMS-treated NFC (a: Protocol 1 and b: Protocol 2).
0.0
0.5
1.0
1.5
2.0
2.5
0 20 40 60 80 100
wat
er s
orp
tion
[%
]
Relative humidity [%]
Protocol 1
Neat PLA
PLA + untreated NFC
PLA + silylated NFC
0.3 wt% Si
0.4 wt% Si
0.9 wt% Si
2.6 wt% Si
4.0 wt% Si
4.8 wt% Si
0.0
0.5
1.0
1.5
2.0
2.5
0 20 40 60 80 100
wat
er s
orp
tion
[%
]
Relative humidity [%]
Protocol 2
Neat PLA
PLA + untreated NFC
PLA + silylated NFC
1.6 wt% Si
3.5 wt% Si
4.4 wt% Si
5.9 wt% Si
9.2 wt% Si
17.4 wt% Si
a b
PLA + silylated NFC PLA + silylated NFC
PLA + unmodified NFC PLA + unmodified NFC

88
III.4. Concluding remarks
The results presented in the present chapter have shown that silylation had a different impact
on the properties of NFC composites, depending on the matrix used.
With PDMS composites (1 wt% NFC), the shear modulus (G’), E modulus and tensile
strength could be all improved after silylation with Protocol 2, as long as the experimental
conditions were correctly controlled. But the strain at break systematically decreased after
silylation, regardless of the method and silane content. The incorporation of NFC in the
PDMS matrix slightly increased the hygroscopicity of the material, but the maximum
moisture uptake remained low in all cases.
With PLA composites (10 wt% NFC), no significant improvement of the mechanical
performances was noted after silylation, in the conditions investigated. The water uptake
tended to be more limited at higher silylation level, but all NFC composites were more
hydrophilic than neat PLA.
The thermal stability of both types of composites was improved in some cases, deteriorated in
others, but no clear trend could be established or correlated with the silylation level or
protocol used.

89
IV. Utilisation of silylated NFC for the elaboration of foams
IV.1. Objectives and methodology
As stated in Chapter I, cellulose nanofibres are increasingly being considered as building
blocks for the elaboration of aerogels and foams, in replacement of already existing materials
prepared from inorganic or non-renewable resources. Since aqueous NFC suspensions are
characterized by the presence of long and interconnected hydrophilic cellulose nanofibrils, the
subsequent replacement of water with air results in an aerogel or foam with long entangled
cellulose nanofibres. Using the freeze-drying process, different morphologies can be obtained
depending on the speed with which the freezing step is performed, from porous structures
composted of nanofilaments to cellular structures (cf. Chapter I.4.2.3).
Despite the promising potential of cellulosic foams from NFC, several challenges must be
addressed for these materials to compete with already existing technologies. While recent
studies have shown that the stiffness and morphological structure of NFC foams can be
adjusted with the concentration of the nanofibres in the gel (i.e., increase in foam density), the
shape recovery properties of the material are generally limited. Moreover, the hydrophilicity
of cellulosic foams is detrimental to some applications, such as thermal insulation or oil-water
separation.
In this chapter, silylated NFC foams have been investigated, with the aim to produce porous
cellulosic materials with improved properties. Since Protocol 2 was the only method allowing
the grafting of a homogeneous polysiloxane layer at the NFC surface, it was selected as the
silylation treatment, with slight modification of the freezing method. Instead of freezing
quickly the NFC suspension to obtain thin films, a significant volume of the suspension was
frozen slowly to favour the formation of cell wall sheet structures during freeze-drying (Cf.
Scheme 23 in Chapter VI.4.3). This protocol, labelled as Protocol 2’ in following paragraphs,
allowed preparing silylated specimen that could be tested with regards to some basic
properties, such as porosity, compressive properties, wettability, hygroscopicity, oleophilicity
and thermal conductivity.

90
IV.2. Silylation of NFC foams
IV.2.1. Evolution of Si content
NFC foams with different silylation level were produced by varying the initial silane
concentration (Table 10), using Protocol 2’ (cf. Chapter VI.3.3). The evolution of Si content
was again estimated from the calibration chart of Figure 15 (II.1.2.2). A linear increase in Si
content was again noted with increasing [MTMS]i, as was observed when NFC was silylated
according to Protocol 2 (cf. Chapter II.2.4.1).
Table 10: Si content in modified NFC foams prepared at different [MTMS]i according to
Protocol 2’
[MTMS]i [mmol/gNFC] 0 1.2 2.5 3.7 4.9 7.4 14.8 30.9
Si wt % - 2.1 3.5 4.4 6.8 9.1 18.9 38.1
Reaction at room temperature, for 2 h and at pH 4
IV.2.2. Solid-state NMR characterization
The silylated NFC foams were characterized by 13C and 29Si CP-MAS NMR spectroscopy but
since no significant difference was noted compared with former experiments with Protocol 2
(cf. Chapter II.2.4.2), results were not included in the thesis.
The modification of the freezing method in Protocol 2’ did not significantly impact the
molecular structure of the polysiloxane species bonded to the cellulosic substrate. The
presence of silane at the NFC surface was again confirmed by 13C CP-MAS NMR, the
intensity of the MTMS methyl moiety increasing gradually with increasing [MTMS]i. In the 29Si CP-MAS NMR spectra, the two signals corresponding to the di-condensed (T20 and/or
T21) and tri-condensed (T30) structures were again detected at -56 and -65 ppm, respectively
(T2/T3 ~ 1).
IV.2.3. Microscopy
The silylated NFC foams were analyzed by SEM microscopy. In general, differences are
expected between the surface and the core of the foam when the freezing step is slow as in
Protocol 2’ (Figure 12 in I.4.2.3): the bottom layer, which freezes quickly, is generally
composed of nanofilaments, while the core layer, which freezes slowly, is composed of cell
wall sheet structures.

91
Accordingly, micrographs were taken at the top, bottom and core of each sample, when
analyzing the foams by SEM (Scheme 21).
Scheme 21: Sketch of a foam prepared according to Protocol 2’. “Top” refers to the surface in contact with air during freezing; “bottom” refers to the surface which was in contact with the copper mold.
Three samples with low, medium and high Si content were analysed by SEM (Figure 54).
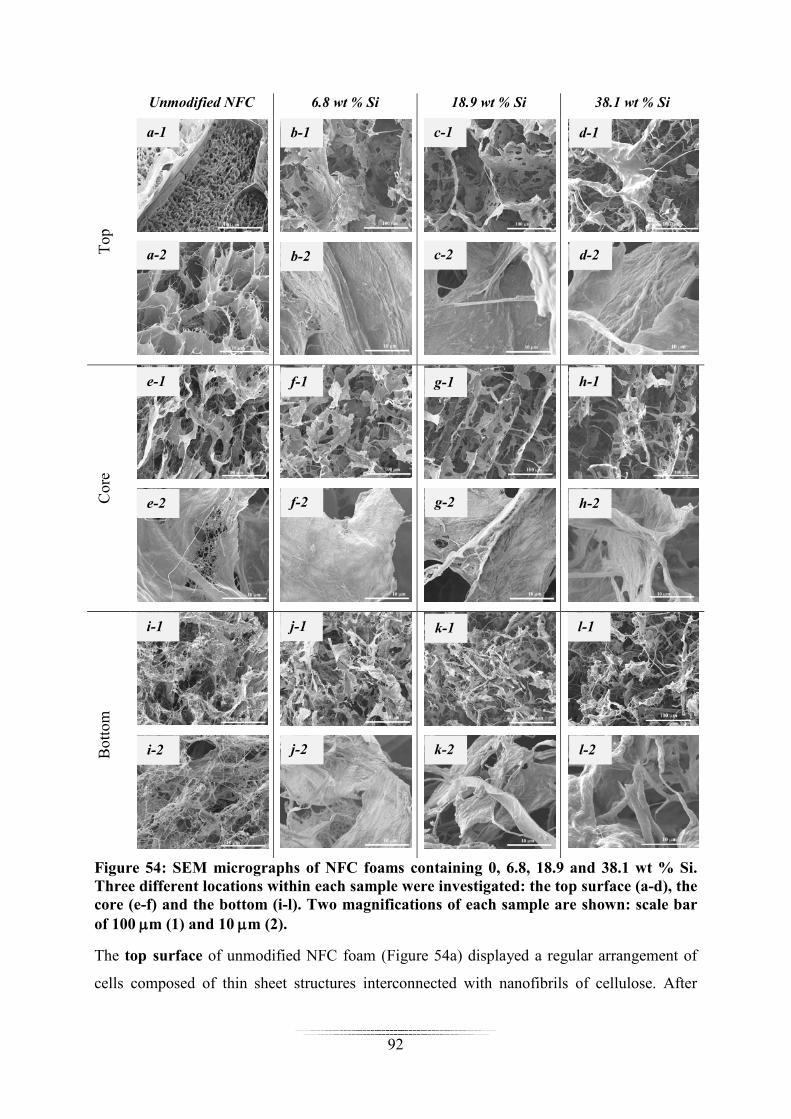
92
Unmodified NFC 6.8 wt % Si 18.9 wt % Si 38.1 wt % Si T
op
Cor
e
Bot
tom
Figure 54: SEM micrographs of NFC foams containing 0, 6.8, 18.9 and 38.1 wt % Si. Three different locations within each sample were investigated: the top surface (a-d), the core (e-f) and the bottom (i-l). Two magnifications of each sample are shown: scale bar of 100 µm (1) and 10 µm (2).
The top surface of unmodified NFC foam (Figure 54a) displayed a regular arrangement of
cells composed of thin sheet structures interconnected with nanofibrils of cellulose. After
a-1 b-1
a-2 b-2 d-2 c-2
d-1 c-1
e-1 f-1
e-2 f-2 h-2 g-2
h-1 g-1
i-1 j-1
i-2 j-2 l-2 k-2
l-1 k-1
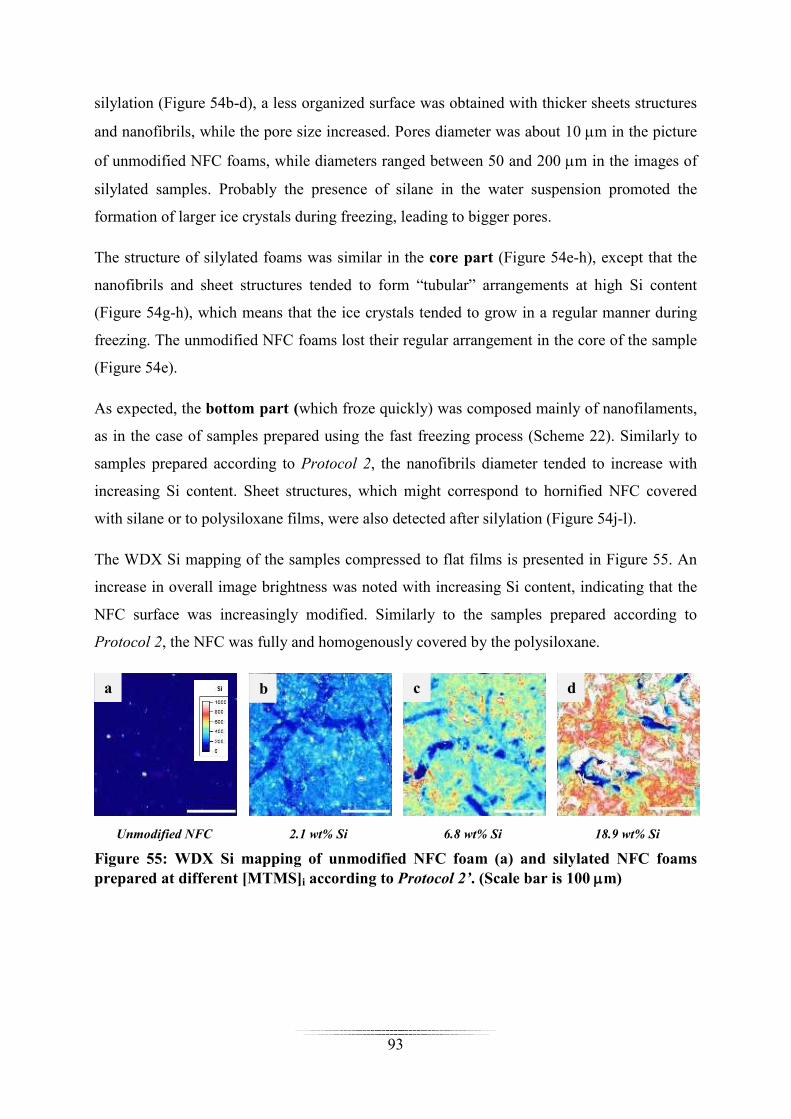
93
silylation (Figure 54b-d), a less organized surface was obtained with thicker sheets structures
and nanofibrils, while the pore size increased. Pores diameter was about 10 µm in the picture
of unmodified NFC foams, while diameters ranged between 50 and 200 µm in the images of
silylated samples. Probably the presence of silane in the water suspension promoted the
formation of larger ice crystals during freezing, leading to bigger pores.
The structure of silylated foams was similar in the core part (Figure 54e-h), except that the
nanofibrils and sheet structures tended to form “tubular” arrangements at high Si content
(Figure 54g-h), which means that the ice crystals tended to grow in a regular manner during
freezing. The unmodified NFC foams lost their regular arrangement in the core of the sample
(Figure 54e).
As expected, the bottom part (which froze quickly) was composed mainly of nanofilaments,
as in the case of samples prepared using the fast freezing process (Scheme 22). Similarly to
samples prepared according to Protocol 2, the nanofibrils diameter tended to increase with
increasing Si content. Sheet structures, which might correspond to hornified NFC covered
with silane or to polysiloxane films, were also detected after silylation (Figure 54j-l).
The WDX Si mapping of the samples compressed to flat films is presented in Figure 55. An
increase in overall image brightness was noted with increasing Si content, indicating that the
NFC surface was increasingly modified. Similarly to the samples prepared according to
Protocol 2, the NFC was fully and homogenously covered by the polysiloxane.
Unmodified NFC 2.1 wt% Si 6.8 wt% Si 18.9 wt% Si
Figure 55: WDX Si mapping of unmodified NFC foam (a) and silylated NFC foams prepared at different [MTMS]i according to Protocol 2’. (Scale bar is 100 µm)
a b c d
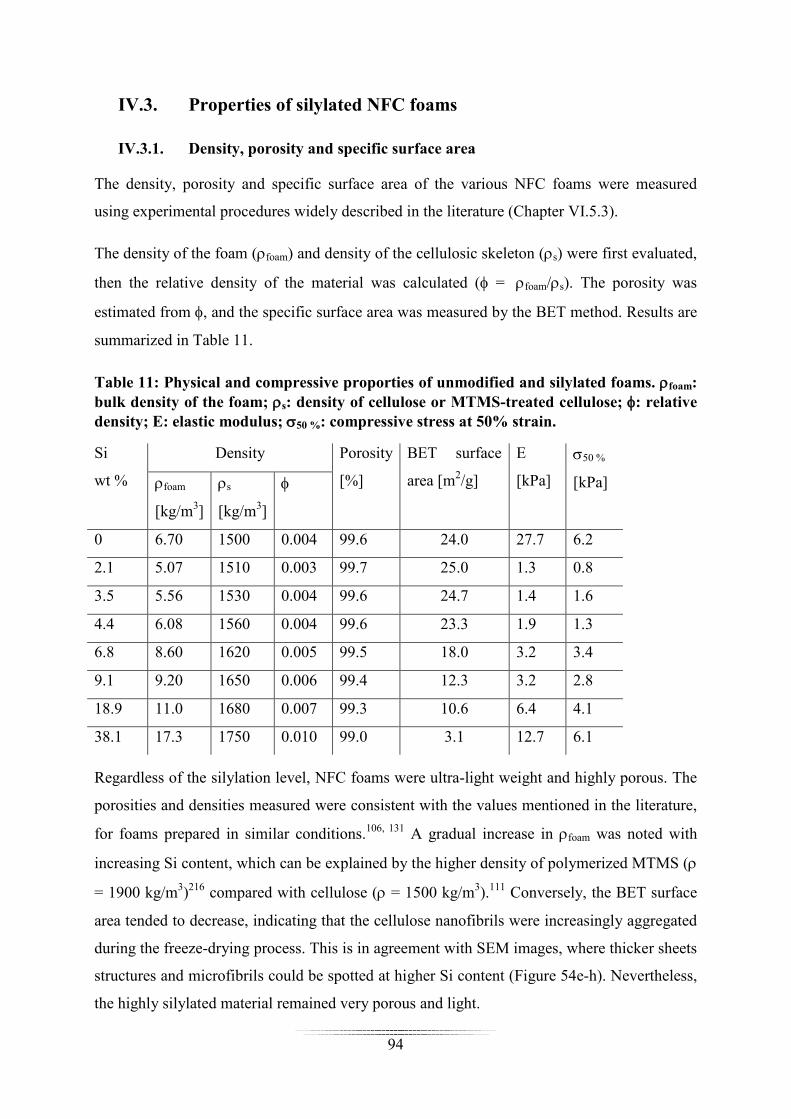
94
IV.3. Properties of silylated NFC foams
IV.3.1. Density, porosity and specific surface area
The density, porosity and specific surface area of the various NFC foams were measured
using experimental procedures widely described in the literature (Chapter VI.5.3).
The density of the foam (ρfoam) and density of the cellulosic skeleton (ρs) were first evaluated,
then the relative density of the material was calculated (φ = ρfoam/ρs). The porosity was
estimated from φ, and the specific surface area was measured by the BET method. Results are
summarized in Table 11.
Table 11: Physical and compressive proporties of unmodified and silylated foams. ρfoam: bulk density of the foam; ρs: density of cellulose or MTMS-treated cellulose; φ: relative density; E: elastic modulus; σ50 %: compressive stress at 50% strain.
Si
wt %
Density Porosity
[%]
BET surface
area [m2/g]
E
[kPa]
σ50 %
[kPa] ρfoam
[kg/m3] ρs
[kg/m3] φ
0 6.70 1500 0.004 99.6 24.0 27.7 6.2
2.1 5.07 1510 0.003 99.7 25.0 1.3 0.8
3.5 5.56 1530 0.004 99.6 24.7 1.4 1.6
4.4 6.08 1560 0.004 99.6 23.3 1.9 1.3
6.8 8.60 1620 0.005 99.5 18.0 3.2 3.4
9.1 9.20 1650 0.006 99.4 12.3 3.2 2.8
18.9 11.0 1680 0.007 99.3 10.6 6.4 4.1
38.1 17.3 1750 0.010 99.0 3.1 12.7 6.1
Regardless of the silylation level, NFC foams were ultra-light weight and highly porous. The
porosities and densities measured were consistent with the values mentioned in the literature,
for foams prepared in similar conditions.106, 131 A gradual increase in ρfoam was noted with
increasing Si content, which can be explained by the higher density of polymerized MTMS (ρ
= 1900 kg/m3)216 compared with cellulose (ρ = 1500 kg/m3).111 Conversely, the BET surface
area tended to decrease, indicating that the cellulose nanofibrils were increasingly aggregated
during the freeze-drying process. This is in agreement with SEM images, where thicker sheets
structures and microfibrils could be spotted at higher Si content (Figure 54e-h). Nevertheless,
the highly silylated material remained very porous and light.

95
IV.3.2. Compressive properties
During our experiments, we noted that unmodified NFC foams were very fragile, while
silylated NFC foams could be manipulated without breaking and showed high flexibility.
Accordingly, the mechanical and shape recovery properties of the foams were evaluated by
compression tests.
IV.3.2.1. Compressive stress-strain curves
Compressive stress-strain curves of NFC foams, with various Si content, compressed to 50 %
of their original thickness, are presented in Figure 56.
Figure 56: Compressive stress-strain curves of unmodified NFC foam and silylated NFC foams, prepared at different [MTMS]i according to Protocol 2’.
With unmodified NFC foam, a linear stress-strain behaviour was observed below 3 % initial
strain, which was associated with elastic cell wall bending.106 The Young’s modulus (E) (27.7
kPa), extracted from this part of the curve, was lower than that already reported for NFC
foams of similar density (i.e. 56 kPa).106 But comparison is tricky since E depends on many
factors, such as strain-rate, temperature, anisotropy and multiaxial loading.67 In the range
between 3 and 50 % strain, the transition from linear to non-linear behaviour was gradual, in a
region where cell collapse takes place.105, 106, 109 The substantial plastic deformation noted on
0.00
1.00
2.00
3.00
4.00
5.00
6.00
7.00
0% 10% 20% 30% 40% 50% 60%
Str
ess
[kP
a]
Strain [%]
Unmodified NFCMTMS-treated NFC4.4 wt% Si9.1 wt% Si18.9 wt% Si38.1 wt% Si
MTMS-treated NFC

96
unloading the sample was assigned to irreversible collapsing of the cells and eventual
hydrogen bonds formed during compression.
After silylation, the Young’s modulus and stress at 50 % deformation (σ50 %) were generally
lower than for unmodified NFC foams, indicating that different deformation mechanisms
occurred under compression. This is consistent with SEM results, which showed that the
original cellular structure was significantly modified by the presence of MTMS during freeze-
drying (Cf. Chapter IV.2.3). Both E modulus and σ50 % were quite low at low silylation level,
but their value increased significantly with increasing Si content. Notably, the σ50 % value of
the foam with the highest Si content (38.1 wt % Si) was in the same range for the unmodified
material.
IV.3.2.2. Shape recovery experiments
The shape recovery properties of the foams were evaluated by unloading the specimens at
50 % strain and recording the residual strain (εfinal). The thickness recovery S, expressed in
percentage of original thickness, was calculated according to Equation 6 (Chapter VI.5.3.4).
The results obtained are plotted in Figure 57.
Figure 57: Thickness recovery (S) of unmodified and silylated NFC foams upon unloading at 50 % strain.
100%
61%
72% 76% 75%
82% 78%
86%
96%
0 2.1 3.5 4.4 6.8 9.1 18.9 38.1
S [
%]
Si wt%
ε = 50
%

97
While unmodified NFC foam could recover only 59 % of its original thickness, S values
between 70 and 96 % were obtained with the silylated material. Shape recovery was
particularly important at high Si content, since 96 % of the original thickness could be
recovered when the sample contained 38.1 wt % Si. To our knowledge, this is the first time
that such flexibility is obtained with NFC-based foams, but flexible silica aerogels based on
MTMS have been reported.216, 217 These materials displayed a thickness recovery of 100 % on
unloading the specimens at 60 % compression strain, which was explained by the repulsive
interactions existing between methyl groups and the decrease in crosslinking density within
the material. Accordingly, similar mechanisms could be considered for silylated NFC foams,
since NFC was covered by a polysiloxane layer, and the interactions between neighbouring
hydroxyl groups were limited.
IV.3.3. Wettability and hygroscopicity
IV.3.3.1. Wettability
The wettability of the foam surfaces was evaluated by measuring the contact angle of a water
droplet deposited directly on the silylated materials. Top and bottom surfaces were evaluated
since different morphological structures were observed by SEM (see Figure 54). The water
contact angle (WCA) values obtained are presented in Figure 58.
As expected, the unmodified NFC foam displayed a strong hydrophilic character, as the water
droplet was instantaneously absorbed by the substrate (no WCA could be recorded in that
case on both surfaces).
The silylated NFC foams, on the other hand, were quite hydrophobic, since WCA values
above 105° were always measured.

98
Figure 58: Water contact angle values (WCA) measured at the surface of NFC foams treated at different [MTMS]i according to Protocol 2’.
Nevertheless, differences were noted between the top and the bottom surfaces. The WCA on
the bottom surface increased with the extent of silylation up to a maximum of 136° when the
Si content was 18.9 wt %. These results correlated well with the wettability’s measured at the
surface of NFC modified according to Protocol 2 in Chapter II.3.3.1 (Figure 38). This was
expected since both of these surfaces underwent the same fast-freezing step, which led to
nanofilaments of similar structure and morphology. The WCA values obtained at high
silylation level were close to those already reported for NFC foams modified with
chlorosilanes131, 142, 143 or TiO2 nanoparticles.114, 144
The WCA at the top surface did not show any specific trend with Si content, indicating that
the surface morphology was more heterogeneous. It is well established that wettability is not
only influenced by surface chemistry, but also by surface morphology and structure.218 Unlike
the bottom surface, the top surface underwent a slow-freezing step, which led to a porous
structure composed of cell wall sheets interconnected with nanofibrils (see Chapter IV.2.3).
The size of the pores and the structure of the NFC network at the surface were shown to vary
depending on the silylation level (see Chapter IV.2.3).
90
100
110
120
130
140
150
0% 5% 10% 15% 20% 25% 30% 35% 40% 45%
WC
A [
°]
Si wt%
top side bottom side

99
IV.3.3.2. Hygroscopicity
The hygroscopicity of the foams was evaluated by Dynamic Vapour Sorption (DVS). The
water sorption isotherms obtained are presented in Figure 59.
Figure 59: Water sorption isotherm of unmodified NFC foam and NFC foams prepared at different [MTMS]i according to Protocol 2’ (T = 23 °C).
The silylated NFC foams presented water sorption values, which tended to decrease with
increasing Si content. The accessibility to water of NFC hydroxyl groups most probably
decreased after decoration of the surface by polysiloxane molecules, but the analysed silylated
samples contained also less cellulosic material compared with the unmodified control. In any
case, the hygroscopicity of NFC foam containing 38.1 wt % Si was particularly low.
IV.3.4. Oleophilic properties
The silylated foams were further characterized with regards to their oleophilic properties, to
verify their potential as absorbent for oil removal.
For these experiments, the silylated foam sample containing 18.9 wt % Si was used and
compared with an unmodified sample having the same density and porosity (Table 12).
0
5
10
15
20
25
30
0 10 20 30 40 50 60 70 80 90 100
wat
er s
orp
tion
[%
]
Relative humidity [%]
Untreated NFCMTMS-treated NFC2.1 wt% Si3.5 wt% Si4.4 wt% Si6.8 wt% Si9.1 wt% Si18.9 wt% Si38.1 wt% Si
MTMS-modified NFC
Unmodified NFC

100
Table 12: Physical and compressive properties of unmodified and silylated foams prepared at different NFC concentration (CNFC). ρs: density of cellulosic skeleton; φ: relative density; BET: BET surface area; E: elastic modulus; σ50 %: compressive stress at 50 % strain.
Si wt % CNFC
wt % ρfoam [kg/m3]
ρs
[kg/m3] φ
Porosity [%]
BET [m2/g]
E [kPa]
σ50 % [kPa]
0 1.0 10.6 150067 0.007 99.3 14.6 79.6 21.6 18.9
0.5 11.0 1680 0.007 99.3 10.6 6.4 4.1
Dodecane was used as model oil and was coloured in red using the Sudan III dye. Water was
coloured in blue using the Neolan Blau dye.
IV.3.4.1. Absorption test
Drops of water and dodecane were deposited at the surface of unmodified and silylated foams
(Figure 60). As expected, dodecane was instantaneously absorbed by the silylated sample,
while the water drop remained at the surface, confirming the combined
hydrophobicity/oleophilicity properties of the material. The unmodified sample, on the other
hand, absorbed both dodecane and water, demonstrating its amphiphilic character in line with
literature data.219-221
Figure 60: Demonstration of the combined hydrophobic/oleophilic properties of MTMS-treated NFC foam, compared with unmodified foam.
The oil absorption capacity (Cm), expressed as the weight gain ratio of absorbed dodecane
compared with the initial to dry foam (Equation 10 in Chapter VI.5.3.8), was calculated for
both unmodified and silylated foam and compared with literature data (Table 13).
water
dodecane
water
dodecane
Unmodified foam Silylated foam (18.9 wt% Si)

101
Table 13: Oil absorption capacity (Cm) of unmodified and silylated NFC foams. Some literature data are also reported for comparison.
Sample ρfoam
[kg/m3]
oil ρoil
[g/ml]
Cm
(initial)
Cm
(recycled)
unmodified NFC 11 dodecane 0.75 44 16
MTMS-NFC 11 dodecane 0.75 53 52
TiO2-NFC144 20-30 paraffin oil 0.87 30 30
dodecane 0.75 24 -
Carbon nanotube
sponges222
5-10 hexane 0.66 89 -
diesel oil 0.84 142 -
vegetable oil 0.90 109 -
chloroform 1.48 ~ 180 -
PDMS sponge223 180-750 transformer oil 0.89 4-5 4-5
The unmodified NFC foam absorbed a significant amount of dodecane, but the silylated
material gave better results. Both foams displayed better Cm values compared with TiO2-NFC
foams and PDMS sponges, but lower ones compared with carbon nanotube sponges. This was
assigned to differences in the materials density, as Cm is obviously correlated with the density
of the foams or sponges. In addition, higher Cm values are expected when the density of the
oil increases.144, 222
IV.3.4.2. Oil removal properties
The combined hydrophobic/oleophilic properties displayed by the silylated foam allowed
envisaging its utilisation as selective absorbent for the removal of oil or other organic
molecules from polluted water. This was demonstrated by realising an experiment in which
0.2 g of dodecane was spilled at the surface of 15 mL water in a beaker, and subsequently
removed by the silylated foam (Figure 61b). For comparison purpose, the unmodified foam
was also tested (Figure 61a).

102
Figure 61: Removal of dodecane (in red) from water surface by unmodified (a) or silylated (b) NFC foam.
When 0.02 g of unmodified NFC foams was brought in contact with dodecane, both water
and dodecane were absorbed, and the saturated material sunk at the bottom of the beaker
(Figure 61a). Moreover, a significant amount of dodecane remained at the surface after
removing the foam.
When the same weight of silylated material was used, only dodecane was absorbed, and the
organic compound was completely removed from the water surface. The silylated foam kept
floating on the water surface during the experiment, and its mechanical integrity was not
altered. Moreover, the silylated foam was not saturated and could remove an additional
amount of dodecane.
IV.3.4.3. Recyclability
The recyclability of the foams was evaluated by rinsing the unmodified and silylated foams
with toluene, and then drying the material at 65 °C under vacuum. The absence of dodecane
after rinsing was inferred by observing the vanishing of the red colour and the recovering of
the initial weight of the foams (Figure 62).
a
water
dodecane
b
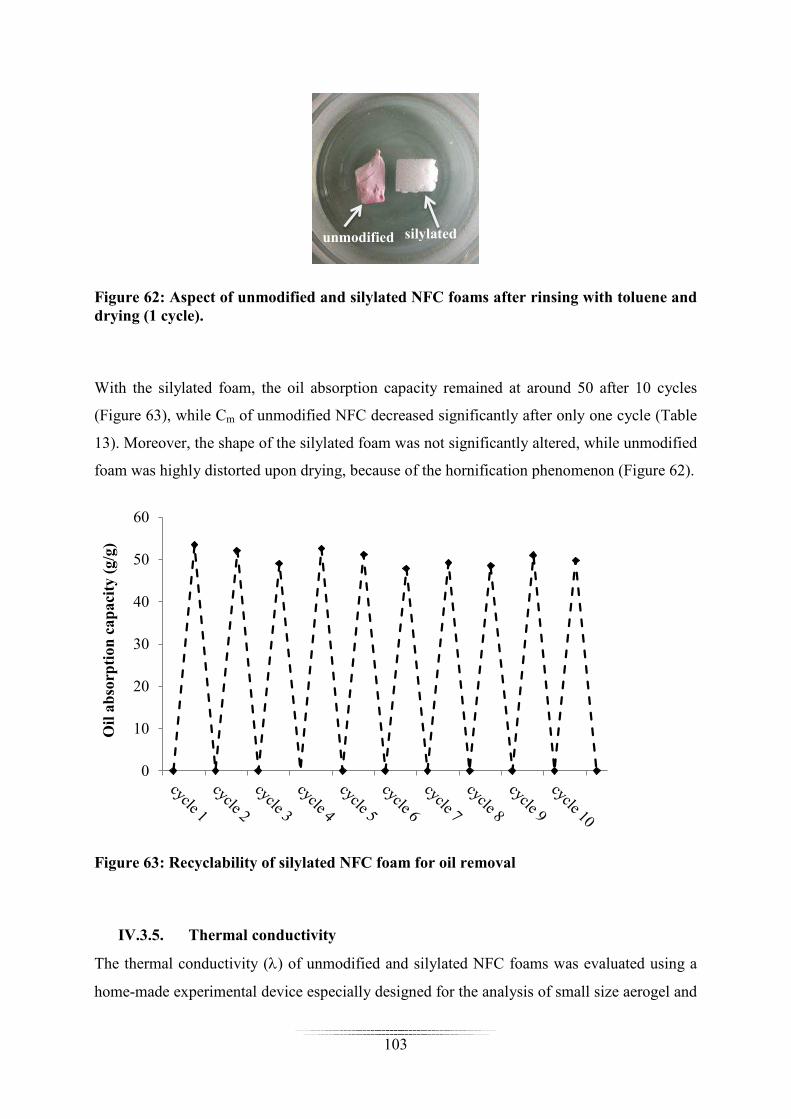
103
Figure 62: Aspect of unmodified and silylated NFC foams after rinsing with toluene and drying (1 cycle).
With the silylated foam, the oil absorption capacity remained at around 50 after 10 cycles
(Figure 63), while Cm of unmodified NFC decreased significantly after only one cycle (Table
13). Moreover, the shape of the silylated foam was not significantly altered, while unmodified
foam was highly distorted upon drying, because of the hornification phenomenon (Figure 62).
Figure 63: Recyclability of silylated NFC foam for oil removal
IV.3.5. Thermal conductivity
The thermal conductivity (λ) of unmodified and silylated NFC foams was evaluated using a
home-made experimental device especially designed for the analysis of small size aerogel and
0
10
20
30
40
50
60
Oil
ab
sorp
tion
cap
acit
y (g
/g)
silylated unmodified

104
foam samples (see Figure 68 in Chapter VI.5.3.5). λ was reported as a function of silylation
level in Figure 64.
The thermal conductivity of the NFC foams decreased after silylation, regardless of the
silylation level and the relative density (φ) of the material. Moreover, λ tended to decrease
with increasing Si content.
Figure 64: Evolution of the thermal conductivity (λ) with the Si content in NFC foams. The relative density of the foam is given in bracket.
IV.4 Concluding remarks
The experiments relevant to this chapter have shown that our silylation process could have a
positive impact on the properties of NFC foams.
Ultra-light weight and porous silylated NFC foams composed of sheet structures
interconnected with nanofibrils were produced base on Protocol 2’, using a controlled freeze-
drying process.
(0.004)
(0.003) (0.004)
(0.004) (0.005)
(0.006)
(0.007) (0.01)
20
25
30
35
40
45
50
0 5 10 15 20 25 30 35 40 45
Th
erm
al c
ond
uct
ivit
y [m
W/(
(m▪K
)]
Si wt%
Untreated NFC MTMS-treated NFCunmodified NFC MTMS-modified NFC

105
Under compression, the Young’s modulus and stress at 50 % deformation of the samples was
found to increase with increasing silylation level. Notably, the shape recovery of the NFC
foams was significantly improved after silylation and was as high as 96 % at high silylation
level. To our knowledge, this is the first time that such flexibility was obtained with NFC-
based foams.
Silylated NFC foams were highly hydrophobic in contact with liquid water, and their oil
absorption capacity was significantly improved compared with the unmodified material.
These combined hydrophobic/oleophilic properties benefited to the foam, which proved to be
very efficient in selectively removing dodecane spills from water surface. In addition, the
silylated material could be recycled more than 10 times without modification of its oil
absorption capacity, and without alteration of its mechanical integrity.
The thermal conductivity of the NFC foams also decreased after silylation, which could have
applications in the area of insulation materials.

106

107
V. General conclusion
The objectives of this research project were i) to develop an environmentally friendly method
based on alkoxysilanes, allowing the chemical functionalization of nanofibrillated cellulose
(NFC) in water and ii) to investigate the impact of silylation on the properties of composites
and foams.
In this context, the surface of NFC produced from oat straw was modified in water by
methyltrimethoxysilane (MTMS) - chosen as a model trialkoxysilane - using different
reaction parameters and experimental protocols (Protocols 1 & 2). Two different types of
silylated NFC were produced, without modification of the original crystalline structure. The
first type consisted in a cellulose nanofibrils network, in which polysiloxane particles were
dispersed (Protocol 1), while the second type consisted in a nanofibrils covered by a
homogeneous polysiloxane layer (Protocol 2). The size of the particles or the thickness of the
polysiloxane layers could be controlled by monitoring the initial silane concentration.
Leaching experiments have shown that the polysiloxane particles produced with Protocol 1
were not firmly anchored to the cellulosic substrate, whereas the polysiloxane layer covering
the NFC modified according to Protocol 2 was strongly bonded.
Differences were also noted in terms of wettability and thermal stability. While NFC
modified with Protocol 1 remained hydrophilic, very hydrophobic nanofibrils were produced
with Protocol 2. The thermal stability was also significantly improved in the latter case, due
to the efficient covering of the NFC surface by the silane polymer.
Following this comprehensive study, we investigated the impact of the silylation treatment on
the properties of composites prepared by solvent casting, using polydimethylsiloxane (PDMS)
and poly(lactic acid) (PLA) as matrices. Different results were obtained, depending on the
matrix employed.
With PDMS composites (1 wt% NFC), the shear modulus (G’), E modulus and tensile
strength could be all improved after silylation with Protocol 2, as long as the experimental
conditions were correctly controlled. But the strain at break systematically decreased after
silylation, regardless of the method and silane content. The incorporation of NFC in the
PDMS matrix slightly increased the hygroscopicity of the material, but the maximum
moisture uptake remained low in all cases.

108
With PLA composites (10 wt% NFC), no significant improvement of the mechanical
performances was noted after silylation, in the conditions investigated. The water uptake
tended to be more limited, but all NFC composites were more hydrophilic than neat PLA.
The thermal stability of both types of composites was improved in some cases, deteriorated in
others, but no clear trend could be established or correlated with the silylation level or
protocol used.
Cellulose nanofibrils are increasingly considered for the elaboration of foams, hence, we also
envisaged studying the impact of silylation on the properties of NFC foams prepared using a
controlled freeze-drying process. Ultra-light weight and porous silylated NFC foams
composed of sheet structures interconnected with nanofibrils were accordingly produced,
based on Protocol 2’.
Under compression, the Young’s modulus and stress at 50 % deformation of the samples was
found to increase with increasing silylation level. Notably, the shape recovery of the NFC
foams was significantly improved after silylation and was as high as 96 % at high silylation
level. To our knowledge, this is the first time that such flexibility is obtained with NFC-based
foams.
Silylated NFC foams were highly hydrophobic in contact with liquid water, and their oil
absorption capacity was significantly improved compared with the unmodified material.
These combined oleophilic/hydrophobic properties benefited to the foam, which proved to be
very efficient in selectively removing dodecane spills from water surface, the cellulosic
material being able of absorbing 50 times its own weight in dodecane. In addition, the
silylated material could be recycled more than 10 times without modification of its oil
absorption capacity, and without alteration of its mechanical integrity.
The thermal conductivity of the NFC foams also decreased after silylation, which could have
applications in the area of insulation materials.
This research work has highlighted the potential of alkoxysilanes to serve as functionalization
agents for the control of NFC surface in water. Experiments performed with
methyltrimethoxysilane have shown that different types of value-added composites or foams
could be produced, provided that the reaction conditions and process are properly tailored.
The results presented here are definitely encouraging, but further research is still required to

109
realize the full potential of the method. In particular, the fine-tuning of the NFC surface by
alkoxysilanes with various functional groups should be investigated to optimize further the
properties of the composites and foams, and also to widen the spectrum of application. Other
polymer matrices could be also tested when examining the reinforcing effect of silylated NFC.
Finally, additional characterisations could be performed, to explore further the potential of the
silylated material in other application fields (acoustic, electrical insulating material, etc.).

110

111
VI. Materials and Methods
VI.1. Materials
VI.1.1. Chemicals
Cellulose pulp powder from oat straw (Jelucel OF300) was provided by Jelu (Rosenberg,
Germany). Its chemical composition was determined by sugar analysis (Table 14).
Table 14: Sugar analysis of Jelucel OF 300 and NFC after isolation
Glucose Xylose Rhamnose Mannose Arabinose Galaktose Others
pulp 73.9% 25.06% 0.08% 0.19% 0.51% 0.07% 0.2%
NFC 75.3% 23.57% 0.08% 0.19% 0.46% 0.10% 0.3%
Methyltrimethoxysilane (Dynasylan® MTMS) and poly(dimethylsiloxane) (PDMS)
(Mn=80000 g/mol) were purchased from Evonik Industries (Rheinfelden, Germany) and
kindly sponsored by Falcone Chemical Specialities Ltd. (Siebnen, Switzerland).
Polydimethylsiloxane (PDMS) hydroxyl terminated (Mn = 550 g/mol), tin(II) 2-
ethylhexanoate (~ 95 %), tetrapropyl orthosilicate (TPOS) (≥ 98 %) and dodecane (≥ 99 %, ρ
= 0.75 g/ml) were purchased from Sigma Aldrich (Switzerland). Trichloromethane (≥ 99 %)
and sodium hydroxide (NaOH, ≥ 99 %) were purchased from ROTH (Switzerland).
Hydrochloric acid (HCl) fuming (EMPROVE® exp, 37 %) was purchased from Merck
(Germany). Sudan III (Standard Fluka) was purchased from Fluka AG (Switzerland). Neolan
Blau (E-A 235 %) was purchased from CIBA GEIGY (Switzerland). Diluted HCl (10 wt%)
was prepared with HCl fuming (37 %) by adding deionized water. Poly(lactic acid), Ingeo
PLA 2002D (Tm = 145-160 °C, Tg = 55 - 60 °C, ρ = 1240 kg/m3, Mw ~ 120900 g/mol,
melting flow rate of 5-7 g/mol (210 °C/2.16 kg), NatureWorks, USA) was supplied by
Polykemi (Sweden). All chemicals and solvents were used as received without further
purification.
VI.1.2. Laboratory equipment
- Mechanical stirrer, Eurostar power control visc, IKA®-Werke, Staufen, Germany
- Magnetic stirrer, MR 3001K, Heidolph Instruments Switzerland, Solothurn,
Switzerland
- Homogenizer, inline Ultra-Turrax system, Megatron MT 3000, Kinematica AG,
Lucern, Switzerland

112
- Higher-shear homogenizer, Microfluidizer, type M-110Y, Microfluidics Corporation,
USA
- Homogenizer, Ultra-Turrax system, T25 basic, IKA-Werke, Staufen, Germany
- Centrifuge, Rotina 380, Hettich Laborapparate, Bäch, Switzerland
- Freeze dryer, LYO GT2, SRK System Technik GmbH, Germany
VI.2. Production of nanofibrillated cellulose
8 L of 1.5 wt % aqueous suspension of cellulose pulp in deionized water was prepared in a
reactor and allowed to swell for one week at 10 °C, under mechanical stirring. Subsequently,
the suspension was homogenized with an inline Ultra-Turrax (UT) system at 20000 rpm for
2h. The fibrillation was performed with a high-shear homogenizer, by first pumping the
suspension through two consecutive chambers of 400 and 200 µm (i.e., H230Z400µm and
H30Z200µm, respectively) for 12 passes, and second through two consecutive chambers of 200
and 75 µm (i.e., H30Z200µm and F20Y75µm chambers, respectively) for 16 passes. Pressure up
to 100 MPa was applied to generate high stress on the cellulose fibres. After the mechanical
disintegration, the NFC gel-like suspension was concentrated by centrifugation (5000 rpm,
25 °C, three times for 15 min.) to obtain a paste-like material with a solid content of about 8
wt %. The process is presented in Figure 65.
Figure 65: Demonstration of NFC production process: 1. Swelling of cellulose suspension in 10L reactor. 2. Pretreatment with homogenizer (inline Ultra-Turrax system). 3. Inside Ultra-Turrax system. 4. After pretreatment, cellulose suspension was

113
transferred in the container. The process is a closed loop. 5. High pressure pump. 6. Interaction chambers Y- and Z-type.
As can be seen in Figure 66, the starting material contained fibres with diameter in µm-range,
while the product NFC presented a network of fibrils with diameter in nanometer range.
Figure 66: Micrographs of oat straw cellulose pulp powder (a) and NFC (b).
VI.3. Silylation of NFC’s
During this thesis, three different protocols were investigated.
VI.3.1. Protocol 1
VI.3.1.1. Reaction
The NFC paste (8 wt %) was diluted with deionised water to obtain a 1 wt % NFC suspension
and homogenized with an Ultra-Turrax system at 11000 rpm for 30 s. The NFC suspension
was adjusted to different pHs with HCl (37 wt % or 10 wt %) or NaOH (10 wt %) solutions.
In each experiment, the water-based silane solution was prepared separately. The required
mass of deionised water was first introduced in a beaker and the solution was adjusted to the
same pH as in the NFC suspension. Different amounts of silane were added into the solution
and stirred for 5 min at 500 rpm with magnetic stirrer. This solution was then added drop wise
to the NFC suspension in order to reach a final NFC concentration of 0.5 wt %. The final
suspension was stirred at room temperature for different reaction times (between 30 min and
72 h).
a b

114
VI.3.1.2. Washing
The modified material was subsequently washed three times with deionised water in order to
remove all non-bonded water-soluble chemicals, and any excess of acid or base. Each
washing step included one homogenization (UT, 11000 rpm, 30 s)/centrifugation step (4000
rpm, 8 min) step.
VI.3.1.3. Freeze-drying
To obtain dried silylated NFC, the wet cake after washing was diluted with deionised water to
an NFC-concentration of 0.5 wt % and freeze-dried using a “fast freezing process” (FFP)
adapted from the method of Jin et al.108 (Scheme 22).
Scheme 22: Freeze-drying of NFC using the fast freezing process (FFP)
A 15 x 15 cm copper box was placed in a polystyrene box filled with liquid nitrogen. After
the temperature of the copper box reached equilibrium, the suspension was introduced
dropwise into of the copper box. Subsequently, the copper box was transferred into a freeze
dryer. The drying was complete after 48 h as observed by the non-fluctuation of the pressure
inside the freeze-dryer (final pressure inside the freeze dryer was approximately 3.5 x 10⁻²
mbar).
With this method, the NFC suspension formed a very thin layer in the mould and the freezing
was very fast. As a consequence, a porous structure composed mostly of nanofilaments was
obtained (cf. Figure 12a).
VI.3.2. Protocol 2
Silylation and freeze-drying were performed as in Protocol 1, except that the NFC suspension
and silane solution were adjusted to a single pH of 4 (with a 10 wt % HCl solution), and no
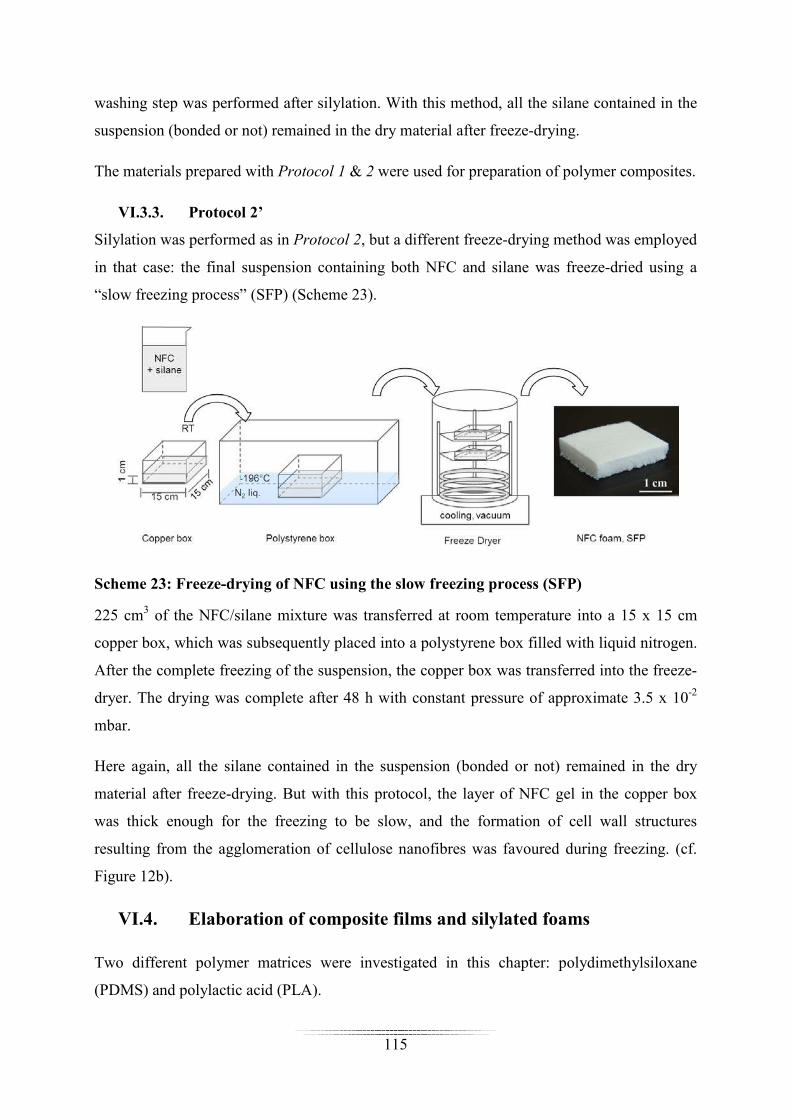
115
washing step was performed after silylation. With this method, all the silane contained in the
suspension (bonded or not) remained in the dry material after freeze-drying.
The materials prepared with Protocol 1 & 2 were used for preparation of polymer composites.
VI.3.3. Protocol 2’
Silylation was performed as in Protocol 2, but a different freeze-drying method was employed
in that case: the final suspension containing both NFC and silane was freeze-dried using a
“slow freezing process” (SFP) (Scheme 23).
Scheme 23: Freeze-drying of NFC using the slow freezing process (SFP)
225 cm3 of the NFC/silane mixture was transferred at room temperature into a 15 x 15 cm
copper box, which was subsequently placed into a polystyrene box filled with liquid nitrogen.
After the complete freezing of the suspension, the copper box was transferred into the freeze-
dryer. The drying was complete after 48 h with constant pressure of approximate 3.5 x 10⁻²
mbar.
Here again, all the silane contained in the suspension (bonded or not) remained in the dry
material after freeze-drying. But with this protocol, the layer of NFC gel in the copper box
was thick enough for the freezing to be slow, and the formation of cell wall structures
resulting from the agglomeration of cellulose nanofibres was favoured during freezing. (cf.
Figure 12b).
VI.4. Elaboration of composite films and silylated foams
Two different polymer matrices were investigated in this chapter: polydimethylsiloxane
(PDMS) and polylactic acid (PLA).

116
VI.4.1. Elaboration of PDMS-composites
14 g PDMS (Mn~80000 g/mol) and 6 g PDMS (Mn ~ 550 g/mol) were introduced in a 150
mL PE cup and mixed with a mechanical stirrer for 5 min at room temperature. Concurrently,
0.2 g of unmodified or silylated NFC (prepared according to Protocol 1 & 2), and 75 g of
chloroform were introduced in a beaker and the suspension was homogenized with an UT at
11000 rpm for 5 min. This suspension was incorporated into the PDMS mixture and stirred
for 20 min with a mechanical stirrer. 1.75 g tetrapropylorthosilicate (TPOS) and 0.13 g tin(II)
2-ethylhexanoate were then added under stirring and the suspension was cooled down to 2 °C.
After the final mixture was stirred for 2 min, composite films were obtained by casting 20 g
of the suspension in a Polypropylene (PP) mould. Four films were obtained and dried at room
temperature in a fumed hood for 24 h. In order to remove any traces of solvent, the films were
finally heated at 60 °C for 20 h and subsequently stored in a desiccator containing silica gel
until being analysed. The thickness of the composite films ranged between 500 µm and 800
µm.
VI.4.2. Elaboration of PLA-composites
3 g of PLA pellets and 127g chloroform were added into a round flask, and the mixture was
stirred with a magnetic stirrer, at 500 rpm for 14 h. Concurrently, 0.33 g of unmodified or
silylated NFC (prepared according to Protocol 1 or 2) were dispersed in 69.1 g chloroform
using a blender (Ultra-Turrax) at 11000 rpm for 5 min. This suspension was incorporated into
the PLA solution and the resulting mixture was homogenized with an UT at 11000 rpm for 2
min, followed by three degasing cycles (i.e., vacuum/atmospheric pressure cycles) to degas
the suspension. The composites films were obtained by casting the NFC/PLA mixture in a
Teflon mould. After drying at room temperature for 7 days in a fumed hood, the films were
removed from the mould and heated at 100 °C for 10 min. to remove the residual solvent. The
thickness of the composite films ranged between 120 µm and 170 µm.
VI.4.3. Elaboration of unmodified and silylated NFC foams
NFC foams were prepared according to Protocol 2’, using both unmodified and silylated NFC.

117
VI.5. Characterization methods
VI.5.1. Characterization of NFC
VI.5.1.1. Elemental analysis
The Si content in silylated NFC samples was evaluated by elemental analysis. Samples were
calcinated at 800 °C followed by mineralization at 1050 °C in the presence of lithium
tetraborate. The Si content was then determined by Plasma Emission Spectrometry.
This analysis was subcontracted to SGS MULTILIAB.
VI.5.1.2. Infrared spectroscopy (FTIR-ATR)
Infrared spectra of the dried modified and unmodified NFC were recorded using a Tensor 27
FT-IR spectrometer (Bruker, Switzerland). For each sample, the diamond crystal of an
Attenuated Total Reflectance (ATR) accessory was brought into contact with the area to be
analyzed. The contact area was a circle of about 1.5 mm in diameter. All spectra were
recorded between 4000 and 600 cm-1 with a resolution of 4 cm-1 and 32 scans per sample. For
comparison purpose, spectra were adjusted to the same baseline and were normalized to the
C-H in-plane bending of cellulose at about 1317 cm-1,182 which is not affected by the
modification with MTMS. The peak heights ratio of 1272 cm-1 to 1317 cm-1, vibrations (ISi-
C/IC-H), in each spectrum was calculated using a baseline constructed between 1518 cm-1 and
1217 cm-1.
VI.5.1.3. 13
C and 29
Si CP-MAS NMR Spectroscopy
Solid state 13C and 29Si CP-MAS (Cross Polarization - Magic Angle Spinning) NMR spectra
of dried unmodified and silylated NFC were performed at room temperature on a Bruker
Avance 400 NMR spectrometer (Bruker BioSpin AG, Fällanden, Switzerland). 200 mg of
dried unmodified or silylated NFC were cryo-ground to a fine powder and packed in a 7 mm
CP/MAS probe using zirconia.
The 13C and 29Si CP-MAS NMR spectra were recorded at 100.61 MHz and 79.49 MHz,
respectively, using the following parameters: 7.5 µs π/4 excitation pulse on 1H channel; 3 ms
contact time with a ramp from 100 to 50 % of power level; 3000 Hz spinning speed; 4 s
relaxation delays and an appropriate number of scans to yield reasonable signal to noise ratios.
118
During acquisition, 33 kHz TPPM15 proton decoupling was applied and the raw data were
processed using an exponential function of 50 Hz.
The alkoxysilanes used in the silylation treatments were analysed by solution state NMR
spectroscopy. Spectra were recorded on the spectrometer presented above, using an inverse
probe equipped with z-gradient. The 1D 1H and 13C NMR spectra and the 1H, 29Si 2D
correlation experiments were recorded with the Bruker standard pulse programs and
parameter sets. The 1H/13C chemical shifts were referenced internally using the resonance
signals of chloroform at 7.26 and 77.0 ppm for 1H and 13C experiments, respectively. The 29Si
chemical shifts were referenced externally to tetramethylsilane.
The software used for treatment of NMR spectra was TopSpin 3.0 (Bruker). All 13C spectra
were normalized to the peak of C1 of cellulose at 105 ppm.
VI.5.1.4. Scanning electron microscopy (SEM)
SEM analysis was performed using a Jeol 6300F scanning electron microscope (Jeol Ltd.
Tokyo Japan) with an acceleration voltage of 5 kV, a working distance of 16 mm and a probe
current of 6x10-11 A.
The starting NFC suspension was analysed as followed: one drop of a 0.1 wt % NFC
suspension was deposited on the mica plate surface of the sample holder and vacuumed (< 10-
2 mbar) for 15 min to remove water. Subsequently, the sample was coated with 7.5 nm
platinum.
The dried unmodified or silylated NFC samples were analysed by sticking the sample on the
holder with a carbon pad, and then coated with 7.5 nm platinum.
VI.5.1.5. Wavelength dispersive X-ray spectroscopy (WDX)
The WDX measurements were carried out with a scanning electron microscope (JEOL, JXA-
8800RL), equipped with a wave-dispersive X-ray detector. The dried unmodified or silylated
NFC samples were pressed for 30 sec. under a pressure of 12 bars (with a Perkin-Elmer
hydraulic press), to produce samples with flat and smooth surfaces. The films with sizes of
~0.5 cm2, were stuck on a holder using a carbon pad, and were coated with carbon. The
detection of silicon was obtained at an accelerating voltage of 15 kV and illuminating current
of 2x10⁻⁸ A. The mapping of Si was performed on a surface area 300 x 300 µm, with steps of
2 µm.

119
VI.5.1.6. X-ray diffraction (XRD)
X-ray diffraction patterns were obtained using a PANalytical X´Pert PRO θ-2θ scan system
equipped with a Johansson monochromator (Cu-Kα1 radiation, 1.5406 Å) and an X'Celerator
linear detector. The diffraction patterns were recorded between 10° and 60° (2θ). ~50 mg
unmodified or silylated NFC materials were pressed to form pellets with diameter of 1cm and
the surface was analysed.
The crystallinity index of unmodified and silylated NFC’s was calculated by using the XRD
peak height method (Equation 2):224
%100200
200 ×−=I
IICI AM (2)
where I200 is the peak intensity of the highest peak (200) and IAM is the peak intensity of the
minimum position between the 200 and 110 peaks.
VI.5.1.7. Thermogravimetric analysis (TGA)
Thermogravimetric analyses of freeze-dried unmodified and silylated NFC (sample weight
~2mg) were performed with a TGA7 apparatus (Perkin-Elmer, USA), under helium
atmosphere, within the temperature range between 30 °C and 900 °C and at a heating rate of
20 °C/min.
VI.5.1.8. Water sorption tests
The sorption of water by unmodified and silylated NFC was evaluated using a vapour
sorption analyser (VTI-SA+, TA Instruments). Prior to measurement, the freeze-dried NFC
sample (~15 mg) was further dried at 105 °C for 60 min. The weight of the sample was then
measured as a function of relative humidity, which was increased from 0 % to 95 %, with
increments of 5 %. The sample weight was recorded at equilibrium, i.e. when a weight change
lower than 0.01 % was noted within 5 min. The maximum measurement time for each RH
was 5 h.
VI.5.1.9. Contact angle measurements
The wettability of freeze-dried unmodified and silylated NFC was evaluated by contact angle
measurement, using a Contact Angle System OCA (Dataphysics), combined with a high

120
speed camera. The volume of the water droplet was 5 µL and the tip used was a precision
stainless steel tip (Gauge 32, EFD, USA).
VI.5.1.10. Resistance tests towards solvents
Silylated NFC samples after freeze drying were washed by Soxhlet extraction for 20 h. Three
solvents, water, ethanol and chloroform, were tested separately. After the extraction, the
samples were dried firstly 8 h at 60 °C and then 14 h at 105 °C.
VI.5.2. Characterizations of composites
VI.5.2.1. Thermogravimetric analysis (TGA)
Thermogravimetric analysis of NFC composites was performed using the same protocol used
for NFC characterization, which was detailed in previous paragraph (c.f. VI.5.1.7). The
sample weight was ~ 2 mg.
VI.5.2.2. Differential scanning calorimetry (DSC)
The DSC measurement of NFC/PLA composite films was performed with a DSC 8000
(Perkin-Elmer, USA). 5 mg of each sample was heated from 30 °C to 200 °C, at a heating rate
of 20 °C/min, under dry nitrogen gas. The glass transition temperature (Tg) was measured at
half-height of the specific heat increment at the glass-rubber transition, while the melting
point (Tm) was taken as the peak temperature of the melting endotherm. Each sample was
analysed twice.
The degree of crystallinity (Χc) was calculated as followed (Equation 3):
%100×∆×∆=Χ
om
mc
Hw
H (3),
where mH∆ is the melting enthalpy of PLA composites; omH∆ is the melting enthalpy of
100 % crystalline PLA (taken as 93 J/g), and w is the weight fraction of PLA in the
composites.72 The cristallinity values were determined during the second heating run, as the
Tg determined by the first run could be influence by several factors such as residue of solvent,
impurity or inhomogenity in the samples.225
121
VI.5.2.3. Water sorption tests
The sorption of water by NFC composites was evaluated using the same protocol used for
NFC characterization, which is detailed in previous chapter (c.f. VI.5.1.8). The specimens
were composites films of about 0.3 cm2 with a dry weight of 15-30 mg.
VI.5.2.4. Tensile tests
PLA and PDMS composite films were cut into dog-bone-shaped specimens with an overall
length of 50 mm, a width of 8.5 mm at the clamping zone and a width of 4 mm at the
stretching zone. Prior to the measurement, the specimens were conditioned for at least 1 week
at 50 % RH and 23 °C. The modulus of elasticity (MOE), nominal tensile strength (σmax) and
strain at break (ε), were recorded with a Universal Testing System Z010 (Zwick, Germany),
in a conditioned room (50 % RH and 23 °C). For each sample, at least 5 specimens were
tested.
The characterization of the PLA composite films was conducted using the following
parameters: 100 N loading cell, preforce 0.1 N, testing speed 5 mm/min. The strain at break
was detected by a Multisense system combined with the testing machine.
The characterization of the PDMS composite films was conducted using the following
parameters: 20 N loading cell, perforce 0.1 N, testing speed 100 mm/min. The strain was
detected by crosshead travel.
VI.5.2.5. Dynamic mechanical analysis (DMA)
The PLA composite films were cut into rectangular specimens having the following
dimensions: 6mm in width and 45 mm in length. The viscoelastic properties of the composite
films were studied using a RS III Rheometrics System Analyzer (TA Instruments) in tension
mode. The sample was first heated from 30 °C to 100 °C, at 10 °C/min, 1 Hz of frequency,
and 0.01 % of strain, to remove any trace of solvent. The temperature was maintained at
100 °C for 10 min and the sample was measured with dynamic cooling scans from 100 °C to
30 °C, at 2 °C/min, 1 Hz of frequency and 0.1 % of strain. During the DMA experiment, the
static load was kept at 15 % of the dynamic load. For each sample, three replicates were
tested.

122
VI.5.2.6. Torsion pendulum analysis
The PDMS composite films were cut into rectangular specimens having 10 mm width and 60
mm length. The viscoelastic properties of the composites were measured with the torsion
pendulum test (ATM 3, Myrenne, Germany), following the norm DIN EN ISO 6721-2.
Measurements were performed in the temperature range between -150 °C and 50 °C, and the
data were recorded every 4 °C. The vibration frequency was 1 Hz.
VI.5.3. Characterizations of NFC foams
VI.5.3.1. Determination of the density
The bulk density of dried unmodified and silylated NFC foams was calculated using the
following formula: ����� =�� (4),
where m and V are for the weight and the volume of the foams, respectively.
VI.5.3.2. Determination of the porosity
To calculate the porosity of unmodified and silylated foams, the following equation was used:
%100)1([%] ×−=s
foamporosity ρ
ρ (5),67
where ρ foam and ρs are for the density of the foam and density of cellulosic skeleton
respectively.
The relative density (ϕ) is one of the characteristics of foam materials, and is calculated as
followed:67
s
foamρρφ = (6).
MTMS-modified NFC foams were regarded as composites of two solids: cellulose and
polymerized MTMS (i.e. polymethylsiloxane). Therefore, the density of MTMS-modified
cellulose was calculated by using equation 7:226
)(
)()(
)(
)( 111
MTMSpoly
MTMSpoly
cellulose
MTMSpoly
MTMSpoly
MTMSpoly
cellulose
cellulose
s wwww
ρρρρρ
+−=+
= (7),

123
where wcellulose and wpoly(MTMS) are the weight fractions of cellulose and polymerized MTMS
within the foams, respectively. A density of 1500 kg/m3 was used for the cellulose111 and a
density of 1900 kg/m3 was used for polymethylsiloxane.216 wpoly(MTMS) was estimated based
on the weight gain measured after silylation of NFC accoding to Protocol 2’:
%100)( ×−=foam
NFCfoam
MTMSpolym
mmw (8),
where wNFC and wfoam are the mass of the freeze-dried cellulosic material, before and after
silylation.
VI.5.3.3. Evaluation of Brunauer-Emmett-Teller (BET) specific surface area
The surface area of unmodified and silylated NFC foams was determined by nitrogen
adsorption, using a surface area and pore size analyser SA 3100 (Beckmann Coulter, USA).
About 30 mg of cellulosic material was dried under synthetic gas flow at 105 °C for 18 h. The
nitrogen adsorption was measured in a range of relative vapour pressure of 0.05-0.2, at -
196 °C. BET specific surface area was evaluated from the obtained adsorption isotherm.
VI.5.3.4. Compression tests
Unmodified and silylated NFC foams were cut into rectangular specimens with dimensions of
30 mm in length, 30 mm in width and ~ 10 mm in height. Prior to measurement, the
specimens were conditioned at least 24 h in the testing room (50 % RH, 23 °C). The
compression tests were performed by using a Universal Testing System Z010 (Zwick,
Germany) equipped with a loading cell of 200 N. Each sample, placed between two round
testing plates with diameter of 40 mm (Figure 67, step 1), was compressed to 50 % of its
original thickness and this position was kept for 10 sec (Figure 67, step 2). Afterward, the
testing plates moved in the inversed direction, until the detected force turned to zero (Figure
67, step 3). The testing speed was 1 mm/min. Three replicates were measured for each sample.

124
Figure 67: Experimental set-up used for compression tests. The testing plates movement is symbolized by arrows.
After unloading the specimens at 50 % strain, the thickness recovery was calculated according
to the following formula: � [%] = 100 % − ������ (9),
where the εfinal is strain at the final position when the force detected reached 0 N.
VI.5.3.5. Thermal conductivity measurement
Unmodified and silylated NFC foams were cut into specimens with dimensions of 50 mm in
length, 50 mm in width and ~10 mm in height. The thermal conductivity of the foams was
measured by a home-made (EMPA, Switzerland) special hot plate device designed for the
analysis of small low conductivity materials.227 The instrument is presented in Figure 68. The
upper part consists of heating elements (light red) surrounded by a guarding zone (red), which
ensures that the heat flow from heating elements to cold side is nearly vertical, controlled by
Peltier’s element (black). The bottom side of the foam is in touch with the cold side. The
temperatures of both warm and cold sides are recorded and the thermal conductivity is
accordingly calculated as a function of temperature difference and sample size.

125
Figure 68: Home-made (EMPA) experimental device used for the evaluation of thermal conductivity of foams.227
VI.5.3.6. Water sorption tests
The sorption of water by NFC foams was evaluated using the same protocol used for NFC
characterization, which is detailed in previous chapter (c.f. VI.5.1.8). The sample weight was
of 15-30 mg.
VI.5.3.7. Contact angle measurements
The sorption of water by NFC foams was evaluated using the same protocol used for NFC
characterization, which is detailed in previous chapter (c.f. VI.5.1.9). Measurements were
performed on both sides of the foams, i.e. on bottom side, in contact with the copper box
during freezing and on top side in contact with the air.
VI.5.3.8. Oil-water separation experiments
Silylated or unmodified NFC foams were immersed into dodecane. For visual demonstration,
water was colourless or coloured to blue with Neolan Blau and dodecane was labelled red
with Sudan III. For recycling of the foams after absorption of dodecane, the foams were
immersed in toluene. After 10 min, toluene was removed and clean toluene was added. After
this procedure was repeated for three times, toluene was removed and the foam was dried in
vacuum oven for 8 h at 65 °C. The weight of the foams, before and after soaking oil, as well
as after regeneration was determined. The mass absorption capacity (Cm) (w/w) was
calculated as followed: ��(�/�) = �1−�0�0 (10),
where m0 is the original mass of the foam and m1 is the mass of the foam after soaking oil.
Warm side
Cold side
Sample

126
127
References
1. Thomas, S.; Paul, S. A.; Pothan, L. A.; Deepa, B., Natrual Fibres: Structure, Properties and Applications. In Cellulose Fibers: Bio- and Nano-Polymer Composites, Kalia, S.; Kaith, B. S.; Kur, I., Eds. Springer-Verlag: 2011.
2. Klemm, D.; Heublein, B.; Fink, H.-P.; Bohn, A., Cellulose: Fascinating Biopolymer and Sustainable Raw Material. Angewandte Chemie International Edition 2005, 44, (22), 3358-3393.
3. Bledzki, A. K.; Gassan, J., Composites reinforced with cellulose based fibres. Prog.
Polym. Sci. 1999, 24, (2), 221-274. 4. Samir, M.; Alloin, F.; Dufresne, A., Review of recent research into cellulosic whiskers,
their properties and their application in nanocomposite field. Biomacromolecules 2005, 6, (2), 612-626.
5. Eichhorn, S. J., Useful insights into cellulose nanocomposites using Raman spectroscopy. In Acs Sym Ser, Amer Chemical Soc: Washington, 2006; Vol. 938, pp 63-77.
6. Pandey, J. K.; Kumar, A. P.; Misra, M.; Mohanty, A. K.; Drzal, L. T.; Singh, R. P., Recent advances in biodegradable nanocomposites. J. Nanosci. Nanotechno. 2005, 5, (4), 497-526.
7. Siro, I.; Plackett, D., Microfibrillated cellulose and new nanocomposite materials: a review. Cellulose 2010, 17, (3), 459-494.
8. Azizi Samir, M. A. S.; Alloin, F.; Dufresne, A., Review of recent research into cellulosic whiskers, their properties and their application in nanocomposite field. Biomacromolecules 2005, 6, (2), 612-626.
9. Bledzki, A. K.; Gassan, J., Composites reinforced with cellulose based fibres. Progress in Polymer Science (Oxford) 1999, 24, (2), 221-274.
10. Tingaut, P.; Zimmermann, T.; Sebe, G., Cellulose nanocrystals and microfibrillated cellulose as building blocks for the design of hierarchical functional materials. Journal
of Materials Chemistry 2012, 22, (38), 20105-20111. 11. Lavoine, N.; Desloges, I.; Dufresne, A.; Bras, J., Microfibrillated cellulose - Its barrier
properties and applications in cellulosic materials: A review. Carbohydrate Polymers
2012, 90, (2), 735-764. 12. Tingaut, P.; Eyholzer, C.; Zimmermann, T., Functional Polymer Nanocomposite
Materials from Microfibrillated Cellulose. In Advances in Nanocomposite Technology, Hashim, A., Ed. InTech: 2011; pp 319-334.
13. Hubbe, M. A.; Rojas, O. J.; Lucia, L. A.; Sain, M., Cellulosic Nanocomposites: A Review. BioRes. 2008, 3, (3), 929-980.
14. Eichhorn, S. J.; Dufresne, A.; Aranguren, M.; Marcovich, N. E.; Capadona, J. R.; Rowan, S. J.; Weder, C.; Thielemans, W.; Roman, M.; Renneckar, S.; Gindl, W.; Veigel, S.; Keckes, J.; Yano, H.; Abe, K.; Nogi, M.; Nakagaito, A. N.; Mangalam, A.; Simonsen, J.; Benight, A. S.; Bismarck, A.; Berglund, L. A.; Peijs, T., Review: current international research into cellulose nanofibres and nanocomposites. J. Mater. Sci.
2010, 45, (1), 1-33. 15. Satgé, C.; Granet, R.; Verneuil, B.; Branland, P.; Krausz, P., Synthesis and properties
of biodegradable plastic films obtained by microwave-assisted cellulose acylation in homogeneous phase. Comptes Rendus Chimie 2004, 7, (2), 135-142.
16. Matahwa, H.; Ramiah, V.; Jarrett, W. L.; McLeary, J. B.; Sanderson, R. D., Microwave assisted graft copolymerization of N-isopropyl acrylamide and methyl

128
acrylate on cellulose: Solid state NMR analysis and CaCO 3 crystallization. Macromolecular Symposia 2007, 255, 50-56.
17. Kalia S., K. B. S., Kur I., Cellulose Fibers: Bio- and Nano-Polymer Composites. Springer-Verlag: 2011.
18. Rong, M. Z.; Zhang, M. Q.; Liu, Y.; Yang, G. C.; Zeng, H. M., The effect of fiber treatment on the mechanical properties of unidirectional sisal-reinforced epoxy composites. Composites Science and Technology 2001, 61, (10), 1437-1447.
19. Wertz J-L., B. O., Mercier J.P.. Cellulose science and technology. EPFL Press: 2010. 20. Gandini, A., The irruption of polymers from renewable resources on the scene of
macromolecular science and technology. Green Chemistry 2011, 13, (5), 1061-1083. 21. Hon, D. N. S., Chemical modification of lignocellulosic materials. Marcel Dekker:
New York, 1996. 22. Nishiyama, Y.; Johnson, G. P.; French, A. D.; Forsyth, V. T.; Langan, P., Neutron
crystallography, molecular dynamics, and quantum mechanics studies of the nature of hydrogen bonding in cellulose Iβ. Biomacromolecules 2008, 9, (11), 3133-3140.
23. Nishiyama, Y.; Langan, P.; Chanzy, H., Crystal structure and hydrogen-bonding system in cellulose Iβ from synchrotron X-ray and neutron fiber diffraction. Journal of
the American Chemical Society 2002, 124, (31), 9074-9082. 24. Nishiyama, Y.; Sugiyama, J.; Chanzy, H.; Langan, P., Crystal Structure and Hydrogen
Bonding System in Cellulose Iα from Synchrotron X-ray and Neutron Fiber Diffraction. Journal of the American Chemical Society 2003, 125, (47), 14300-14306.
25. Nevell T.P., Z. S. H., Cellulose Chemistry and its applications. Ellis Horwood Ltd, Chichester: 1985.
26. O'Sullivan, A. C., Cellulose: The structure slowly unravels. Cellulose 1997, 4, (3), 173-207.
27. Atalla, R. H.; VanderHart, D. L., Native cellulose: A composite of two distinct crystalline forms. Science 1984, 223, (4633), 283-285.
28. VanderHart, D. L.; Atalla, R. H., Studies of microstructure in native celluloses using solid-state 13C NMR. Macromolecules 1984, 17, (8), 1465-1472.
29. Adler, E., Lignin Chemistry-Past, Present and Future. Wood Sci. Technol. 1977, 11, 169-218.
30. Fengel, D.; Wegener, G., Wood - Chemistry, Ultrastructure, Reactions. Walter de Gruyter: Berlin, New York, 1989; p 613.
31. Mussatto, S. I.; Teixeira, J. A., Lignocellulose as raw material in fermentation processes. In Current Research, Technology and Education Topics in Applied
Microbiology and Microbial Biotechnology, Méndes-Vilas, A., Ed. Formatex Research Center: 2010.
32. Xu, F., Structure, Ultrastructure, and Chemical Composition. In Cereal straw as a
resource for sustainable biomaterials and biofuels : chemistry, extractives, lignins,
hemicelluloses and cellulose, Sun, R. C., Ed. Elsevier B.V.: Amsterdam, 2010. 33. Jones, L. H. P., Mineral components of plant cell walls. American Journal of Clinical
Nutrition 1978, 31, (10 ,SUPPL.), S94-S98. 34. Sun, R. C.; Tomkinson, T., Essential guides for isolation/purification of
polysaccharides. In Encyclopedia of Separation Science, Wilson, I. D.; Adlard, T. R.; Poole, C. F.; Cook, M., Eds. Academic Press: Lond, 2000.
35. Theander, O., Review of straw carbohydrate research. In New Approaches to Research
on Cereal Carbohydrates, Hill, R. D.; Munck, L., Eds. Elsevier Science Publishers B. V.: Amsterdam, 1985.
36. Adapa, P.; Schonenau, L.; Canam, T.; Dumonceaux, T., Quantitative Analysis of Lignocellulosic Components of Non-Treated and Steam Exploded Barley, Canola, Oat

129
and Wheat Straw using Fourier Transform Infrared Spectroscopy. Journal of
Agricultural Science and Technology 2011, 1, 177-188. 37. Alberts B., J. A., Lewis J., Raff M., Roberts K. and Walter P., Molecular Biology of
the Cell. 4th Edition ed.; Garland Publishing: New York, 2002. 38. Barnett, J. R.; Bonham, V. A., Cellulose microfibril angle in the cell wall of wood
fibres. Biological Reviews of the Cambridge Philosophical Society 2004, 79, (2), 461-472.
39. Moon, R. J.; Martini, A.; Nairn, J.; Simonsen, J.; Youngblood, J., Cellulose nanomaterials review: Structure, properties and nanocomposites. Chemical Society
Reviews 2011, 40, (7), 3941-3994. 40. Elazzouzi-Hafraoui, S.; Nishiyama, Y.; Putaux, J. L.; Heux, L.; Dubreuil, F.; Rochas,
C., The shape and size distribution of crystalline nanoparticles prepared by acid hydrolysis of native cellulose. Biomacromolecules 2008, 9, (1), 57-65.
41. Dong, X. M.; Revol, J. F.; Gray, D. G., Effect of microcrystallite preparation conditions on the formation of colloid crystals of cellulose. Cellulose 1998, 5, (1), 19-32.
42. Zimmermann T.; Bordeanu N.; Strub E., Properties of nanofibrillated cellulose from different raw materials and its reinforcement potential. Carbohydrate Polymers 2010, 79.
43. Dufresne, A.; Cavail̀lé, J. Y.; Vignon, M. R., Mechanical behavior of sheets prepared from sugar beet cellulose microfibrils. Journal of Applied Polymer Science 1997, 64, (6), 1185-1194.
44. Iwamoto, S.; Nakagaito, A. N.; Yano, H., Nano-fibrillation of pulp fibers for the processing of transparent nanocomposites. Applied Physics A 2007, 89.
45. Alemdar, A.; Sain, M., Isolation and characterization of nanofibers from agricultural residues – Wheat straw and soy hulls. Bioresource Technology 2008, 99, (6), 1664-1671.
46. Turbak, A. F.; Snyder, F. W.; Sandberg, K. R., Microfibrillated Cellulose, A New Cellulose Product: Properties, Uses and Commercial Potential. J. Appl. Polym. Sci. :
Appl. Polym. Symp. 1983, 37, 815-827. 47. Zimmermann, T.; Pöhler, E.; Geiger, T., Cellulose Fibrils for Polymer Reinforcement.
Advanced Engineering Materials 2004, 6. 48. Gardner, D. J.; Oporto, G. S.; Mills, R.; Samir, M. A. S. A., Adhesion and surface
issues in cellulose and nanocellulose. Journal of Adhesion Science and Technology
2008, 22, (5-6), 545-567. 49. Saito, T.; Kimura, S.; Nishiyama, Y.; Isogai, A., Cellulose nanofibers prepared by
TEMPO-mediated oxidation of native cellulose. Biomacromolecules 2007, 8, (8), 2485-2491.
50. Fukuzumi, H.; Saito, T.; Iwata, T.; Kumamoto, Y.; Isogai, A., Transparent and high gas barrier films of cellulose nanofibers prepared by TEMPO-mediated oxidation. Biomacromolecules 2009, 10, (1), 162-165.
51. Montanari, S.; Roumani, M.; Heux, L.; Vignon, M. R., Topochemistry of carboxylated cellulose nanocrystals resulting from TEMPO-mediated oxidation. Macromolecules
2005, 38, (5), 1665-1671. 52. Lasseuguette, E.; Roux, D.; Nishiyama, Y., Rheological properties of microfibrillar
suspension of TEMPO-oxidized pulp. Cellulose 2008, 15, (3), 425-433. 53. Saito, T.; Hirota, M.; Tamura, N.; Kimura, S.; Fukuzumi, H.; Heux, L.; Isogai, A.,
Individualization of nano-sized plant cellulose fibrils by direct surface carboxylation using TEMPO catalyst under neutral conditions. Biomacromolecules 2009, 10, (7), 1992-1996.

130
54. Aulin, C.; Varga, I.; Claesson, P. M.; Wagberg, L.; Lindstrom, T., Buildup of Polyelectrolyte Multilayers of Polyethyleneimine and Microfibrillated Cellulose Studied by in Situ Dual-Polarization Interferometry and Quartz Crystal Microbalance with Dissipation. Langmuir 2008, 24, (6), 2509-2518.
55. Wagberg, L.; Decher, G.; Norgren, M.; Lindstrom, T.; Ankerfors, M.; Axnas, K., The Build-Up of Polyelectrolyte Multilayers of Microfibrillated Cellulose and Cationic Polyelectrolytes. Langmuir 2008, 24, (3), 784-795.
56. Eyholzer, C.; Bordeanu, N.; Lopez-Suevos, F.; Rentsch, D.; Zimmermann, T.; Oksman, K., Preparation and characterization of water-redispersible nanofibrillated cellulose in powder form. Cellulose 2010, 17, (1), 19-30.
57. Liimatainen, H.; Visanko, M.; Sirviö, J.; Hormi, O.; Niinimäki, J., Sulfonated cellulose nanofibrils obtained from wood pulp through regioselective oxidative bisulfite pre-treatment. Cellulose 2013, 20, (2), 741-749.
58. Paakko, M.; Ankerfors, M.; Kosonen, H.; Nykanen, A.; Ahola, S.; Osterberg, M.; Ruokolainen, J.; Laine, J.; Larsson, P. T.; Ikkala, O.; Lindstrom, T., Enzymatic hydrolysis combined with mechanical shearing and high-pressure homogenization for nanoscale cellulose fibrils and strong gels. Biomacromolecules 2007, 8, (6), 1934-1941.
59. Henriksson, M.; Berglund, L. A., Structure and properties of cellulose nanocomposite films containing melamine formaldehyde. J. Appl. Polym. Sci. 2007, 106, (4), 2817-2824.
60. Janardhnan, S.; Sain, M., Isolation of cellulose microfibrils - an enzymatic approach. BioRes. 2006, 1, (2), 176-188.
61. Eichhorn, S. J.; Baillie, C. A.; Zafeiropoulos, N.; Mwaikambo, L. Y.; Ansell, M. P.; Dufresne, A.; Entwistle, K. M.; Herrera-Franco, P. J.; Escamilla, G. C.; Groom, L.; Hughes, M.; Hill, C.; Rials, T. G.; Wild, P. M., Review: Current international research into cellulosic fibres and composites. J. Mater. Sci. 2001, 36, (9), 2107-2131.
62. Bledzki, A. K.; Gassan, J., Composites reinforced with cellulose based fibres. Prog. in
Polym. Sci. 1999, 24, (2), 221-274. 63. Tanaka, F.; Iwata, T., Estimation of the elastic modulus of cellulose crystal by
molecular mechanics simulation. Cellulose 2006, 13, (5), 509-517. 64. Iwamoto, S.; Nakagaito, A. N.; Yano, H.; Nogi, M., Optically transparent composites
reinforced with plant fiber-based nanofibers. Applied Physics A 2005, 81. 65. Young, R. A., Comparison of the Properties of Chemical Cellulose Pulps. Cellulose
1994, 1, (2), 107-130. 66. Hult, E. L.; Larsson, P. T.; Iversen, T., Cellulose fibril aggregation - an inherent
property of kraft pulps. Polymer 2001, 42, (8), 3309-3314. 67. Gibson L.J., A. M. F., Cellular Solids: Structure and Properties. 2 nd ed.; Cambridge
Uni. Press: Cambridge, 1997. 68. Yano, H.; Sugiyama, J.; Nakagaito, A. N.; Nogi, M.; Matsuura, T.; Hikita, M.; Handa,
K., Optically transparent composites reinforced with networks of bacterial nanofibers. Adv. Mater. 2005, 17, (2), 153-155.
69. Ho, T. T. T.; Zimmermann, T.; Ohr, S.; Caseri, W., Composites of Cationic Nanofibrillated Cellulose and Layered Silicates: Water Vapor Barrier and Mechanical Properties. ACS Applied Materials & Interfaces 2012, 4, (9), 4832-4840.
70. Syverud, K.; Stenius, P., Strength and barrier properties of MFC films. Cellulose 2009, 16, (1), 75-85.
71. Zimmermann, T.; Pöhler, E.; Schwaller, P., Mechanical and Morphological Properties of Cellulose Fibril Reinforced Nanocomposites. Advanced Engineering Materials
2005, 7.
131
72. Tingaut, P.; Zimmermann, T.; Lopez-Suevos, F., Synthesis and Characterization of Bionanocomposites with Tunable Properties from Poly(lactic acid) and Acetylated Microfibrillated Cellulose. Biomacromolecules 2010, 11, (2), 454-464.
73. Iwatake, A.; Nogi, M.; Yano, H., Cellulose nanofiber-reinforced polylactic acid. Compos. Sci. Technol. 2008, 68, (9), 2103-2106.
74. Suryanegara, L.; Nakagaito, A. N.; Yano, H., The effect of crystallization of PLA on the thermal and mechanical properties of microfibrillated cellulose-reinforced PLA composites. Compos. Sci. Technol. 2009, 69, (7-8), 1187-1192.
75. Berglund, L. A.; Peijs, T., Cellulose biocomposites - From bulk moldings to nanostructured systems. MRS Bulletin 2010, 35, (3), 201-207.
76. Frone, A. N.; Berlioz, S.; Chailan, J. F.; Panaitescu, D. M.; Donescu, D., Cellulose fiber-reinforced polylactic acid. Polymer Composites 2011, 32, (6), 976-985.
77. Park, W. I.; Kang, M.; Kim, H. S.; Jin, H. J., Electrospinning of poly(ethylene oxide) with bacterial cellulose whiskers. Macromolecular Symposia 2007, 249-250, 289-294.
78. Nakagaito, A. N.; Fujimura, A.; Sakai, T.; Hama, Y.; Yano, H., Production of microfibrillated cellulose (MFC)-reinforced polylactic acid (PLA) nanocomposites from sheets obtained by a papermaking-like process. Compos. Sci. Technol. 2009, 69, (7-8), 1293-1297.
79. Nyström, G.; Mihranyan, A.; Razaq, A.; Lindström, T.; Nyholm, L.; Strømme, M., A nanocellulose polypyrrole composite based on microfibrillated cellulose from wood. The Journal of Physical Chemistry B 2010, 114, (12), 4178-4182.
80. Nakagaito, A. N.; Yano, H., Novel high-strength biocomposites based on microfibrillated cellulose having nano-order-unit web-like network structure. Appl.
Phys. A: Mater.Sci. Process. 2005, 80, (1), 155-159. 81. Malainine, M. E.; Mahrouz, M.; Dufresne, A., Thermoplastic nanocomposites based
on cellulose microfibrils from Opuntia ficus-indica parenchyma cell. Compos. Sci.
Technol. 2005, 65, (10), 1520-1526. 82. Özgür Seydibeyoğlu, M.; Oksman, K., Novel nanocomposites based on polyurethane
and micro fibrillated cellulose. Compos. Sci. Technol. 2008, 68, (3–4), 908-914. 83. Wang, B.; Sain, M., Dispersion of soybean stock-based nanofiber in a plastic matrix.
Polym Int 2007, 56, (4), 538-546. 84. Wang, B.; Sain, M., Isolation of nanofibers from soybean source and their reinforcing
capability on synthetic polymers. Composites Science and Technology 2007, 67, (11-12), 2521-2527.
85. Okubo, K.; Fujii, T.; Yamashita, N., Improvement of interfacial adhesion in bamboo polymer composite enhanced with micro-fibrillated cellulose. JSME International
Journal, Series A: Solid Mechanics and Material Engineering 2006, 48, (4), 199-204. 86. Chakraborty, A.; Sain, M.; Kortschot, M.; Cutler, S., Dispersion of Wood Microfibers
in a Matrix of Thermoplastic Starch and StarchPolylactic Acid Blend. Journal of
Biobased Materials and Bioenergy 2007, 1, (1), 71-77. 87. Mathew, A. P.; Chakraborty, A.; Oksman, K.; Sain, M., The structure and mechanical
properties of cellulose nanocomposites prepared by twin screw extrusion. In Acs Sym
Ser, Amer Chemical Soc: Washington, 2006; Vol. 938, pp 114-131. 88. Larsson, K.; Berglund, L. A.; Ankerfors, M.; Lindström, T., Polylactide
latex/nanofibrillated cellulose bionanocomposites of high nanofibrillated cellulose content and nanopaper network structure prepared by a papermaking route. Journal of
Applied Polymer Science 2012, 125, (3), 2460-2466. 89. Suryanegara, L.; Nakagaito, A. N.; Yano, H., The effect of crystallization of PLA on
the thermal and mechanical properties of microfibrillated cellulose-reinforced PLA composites. Composites Science and Technology 2009, 69.

132
90. Lu, J.; Drzal, L. T., Microfibrillated cellulose/cellulose acetate composites: Effect of surface treatment. Journal of Polymer Science Part B: Polymer Physics 2010, 48, (2), 153-161.
91. Svagan, A. J.; Azizi Samir, M. A. S.; Berglund, L. A., Biomimetic polysaccharide nanocomposites of high cellulose content and high toughness. Biomacromolecules
2007, 8, (8), 2556-2563. 92. Nakagaito, A. N.; Nogi, M.; Yano, H., Displays from transparent films of natural
nanofibers. MRS Bulletin 2010, 35, (03), 214-218. 93. Rampinelli, G.; Di Landro, L.; Fujii, T., Characterization of biomaterials based on
microfibrillated cellulose with different modifications. Journal of Reinforced Plastics
and Composites 2010, 29, (12), 1793-1803. 94. Plackett, D.; Anturi, H.; Hedenqvist, M.; Ankerfors, M.; Gällstedt, M.; Lindström, T.;
Siró, I., Physical properties and morphology of films prepared from microfibrillated cellulose and microfibrillated cellulose in combination with amylopectin. Journal of
Applied Polymer Science 2010, 117, (6), 3601-3609. 95. Svagan, A. J.; Hedenqvist, M. S.; Berglund, L., Reduced water vapour sorption in
cellulose nanocomposites with starch matrix. Compos. Sci. Technol. 2009, 69, (3-4), 500-506.
96. Dufresne, A.; Dupeyre, D.; Vignon, M. R., Cellulose microfibrils from potato tuber cells: Processing and characterization of starch-cellulose microfibril composites. J.
Appl. Polym. Sci. 2000, 76, (14), 2080-2092. 97. Avella, M.; Cocca, M.; Errico, M. E.; Gentile, G., Polyvinyl alcohol biodegradable
foams containing cellulose fibres. J Cell Plast 2012, 48, (5), 459-470. 98. Liu, A.; Walther, A.; Ikkala, O.; Belova, L.; Berglund, L. A., Clay Nanopaper with
Tough Cellulose Nanofiber Matrix for Fire Retardancy and Gas Barrier Functions. Biomacromolecules 2011, 12, (3), 633-641.
99. Spence, K. L.; Venditti, R. A.; Rojas, O. J.; Pawlak, J. J.; Hubbe, M. A., Water vapor barrier properties of coated and filled microfibrillated cellulose composite films. BioResources 2011, 6, (4), 4370-4388.
100. Hüsing, N.; Schubert, U., Aerogels—Airy Materials: Chemistry, Structure, and Properties. Angewandte Chemie International Edition 1998, 37, (1-2), 22-45.
101. Kistler, S. S., Coherent expanded aerogels and jellies. Nature 1931, 127, (3211), 741. 102. Pierre, A. C.; Pajonk, G. M., Chemistry of Aerogels and Their Applications. Chem.
Rev. 2002, 102, (11), 4243-4266. 103. Gesser, H. D.; Goswami, P. C., Aerogels and related porous materials. Chem. Rev.
1989, 89, (4), 765-788. 104. Sehaqui, H.; Zhou, Q.; Berglund, L. A., High-porosity aerogels of high specific
surface area prepared from nanofibrillated cellulose (NFC). Compos. Sci. Technol.
2011, 71, (13), 1593-1599. 105. Ali, Z. M.; Gibson, L. J., The structure and mechanics of nanofibrillar cellulose foams.
Soft Matter 2013, 9, (5), 1580-1588. 106. Sehaqui, H.; Salajková, M.; Zhou, Q.; Berglund, L. A., Mechanical performance
tailoring of tough ultra-high porosity foams prepared from cellulose i nanofiber suspensions. Soft Matter 2010, 6, (8), 1824-1832.
107. Gebald, C.; Wurzbacher, J. A.; Tingaut, P.; Zimmermann, T.; Steinfeld, A., Amine-based nanofibrillated cellulose as adsorbent for CO2 capture from air. Environmental
Science and Technology 2011, 45, (20), 9101-9108. 108. Jin, H.; Nishiyama, Y.; Wada, M.; Kuga, S., Nanofibrillar cellulose aerogels. Colloids
and Surfaces A: Physicochemical and Engineering Aspects 2004, 240, (1-3), 63-67.

133
109. Paakko, M.; Vapaavuori, J.; Silvennoinen, R.; Kosonen, H.; Ankerfors, M.; Lindstrom, T.; Berglund, L. A.; Ikkala, O., Long and entangled native cellulose I nanofibers allow flexible aerogels and hierarchically porous templates for functionalities. Soft Matter
2008, 4, (12), 2492-2499. 110. Korhonen, J. T.; Hiekkataipale, P.; Malm, J.; Karppinen, M.; Ikkala, O.; Ras, R. H. A.,
Inorganic Hollow Nanotube Aerogels by Atomic Layer Deposition onto Native Nanocellulose Templates. ACS Nano 2011, 5, (3), 1967-1974.
111. Sehaqui, H.; Salajkova, M.; Zhou, Q.; Berglund, L. A., Mechanical performance tailoring of tough ultra-high porosity foams prepared from cellulose I nanofiber suspensions. Soft Matter 2010, 6, (8), 1824-1832.
112. Svagan, A. J.; Samir, M. A. S. A.; Berglund, L. A., Biomimetic foams of high mechanical performance based on nanostructured cell walls reinforced by native cellulose nanofibrils. Advanced Materials 2008, 20, (7), 1263-1269.
113. Sehaqui, H.; Zhou, Q.; Ikkala, O.; Berglund, L. A., Strong and tough cellulose nanopaper with high specific surface area and porosity. Biomacromolecules 2011, 12, (10), 3638-3644.
114. Kettunen, M.; Silvennoinen, R. J.; Houbenov, N.; Nykänen, A.; Ruokolainen, J.; Sainio, J.; Pore, V.; Kemell, M.; Ankerfors, M.; Lindström, T.; Ritala, M.; Ras, R. H. A.; Ikkala, O., Photoswitchable superabsorbency based on nanocellulose aerogels. Adv.
Funct. Mater. 2011, 21, (3), 510-517. 115. Olsson, R. T.; Azizi Samir, M. A. S.; Salazar-Alvarez, G.; Belova, L.; Ström, V.;
Berglund, L. A.; Ikkala, O.; Nogués, J.; Gedde, U. W., Making flexible magnetic aerogels and stiff magnetic nanopaper using cellulose nanofibrils as templates. Nature
Nanotechnology 2010, 5, (8), 584-588. 116. Klemm, D.; Heublein, B.; Fink, H. P.; Bohn, A., Cellulose: Fascinating Biopolymer
and Sustainable Raw Material. Angewandte Chemie International Edition 2005, 44, (22), 3358-3393.
117. Fox, S.; Li, B.; Xu, D.; Edgar, K., Regioselective esterification and etherification of cellulose: a review. Biomacromolecules 2011, 12, (6), 1956-1972.
118. Saito, T.; Uematsu, T.; Kimura, S.; Enomae, T.; Isogai, A., Self-aligned integration of native cellulose nanofibrils towards producing diverse bulk materials. Soft Matter
2011, 7, (19), 8804-8809. 119. Melone, L.; Altomare, L.; Alfieri, I.; Lorenzi, A.; De Nardo, L.; Punta, C., Ceramic
aerogels from TEMPO-oxidized cellulose nanofibre templates. Synthesis, characterization, and photocatalytic properties. Journal of Photochemistry and
Photobiology A: Chemistry, (0). 120. Stenstad, P.; Andresen, M.; Tanem, B. S.; Stenius, P., Chemical surface modifications
of microfibrillated cellulose. Cellulose 2008, 15, (1), 35-45. 121. Okahisa, Y.; Yoshida, A.; Miyaguchi, S.; Yano, H., Optically transparent wood-
cellulose nanocomposite as a base substrate for flexible organic light-emitting diode displays. Composites Science and Technology 2009, 69, (11-12), 1958-1961.
122. Dlouhá, J.; Suryanegara, L.; Yano, H., The role of cellulose nanofibres in supercritical foaming of polylactic acid and their effect on the foam morphology. Soft Matter 2012, 8, (33), 8704-8713.
123. Jonoobi, M.; Mathew, A.; Abdi, M.; Makinejad, M. D.; Oksman, K., A Comparison of Modified and Unmodified Cellulose Nanofiber Reinforced Polylactic Acid (PLA) Prepared by Twin Screw Extrusion. Journal of Polymers and the Environment 2012, 1-7.

134
124. Nogi, M.; Abe, K.; Handa, K.; Nakatsubo, F.; Ifuku, S.; Yano, H., Property enhancement of optically transparent bionanofiber composites by acetylation. Appl.
Phys. Lett. 2006, 89, (23). 125. Ifuku, S.; Nogi, M.; Abe, K.; Handa, K.; Nakatsubo, F.; Yano, H., Surface
Modification of Bacterial Cellulose Nanofibers for Property Enhancement of Optically Transparent Composites: Dependence on Acetyl-Group DS. Biomacromolecules 2007, 8, (6), 1973-1978.
126. Rodionova, G.; Lenes, M.; Eriksen, Ø.; Gregersen, Ø., Surface chemical modification of microfibrillated cellulose: Improvement of barrier properties for packaging applications. Cellulose 2011, 18, (1), 127-134.
127. Rodionova, G.; Hoff, B.; Lenes, M.; Eriksen, O.; Gregersen, O., Gas-phase esterification of microfibrillated cellulose (MFC) films. Cellulose 2013, 1-8.
128. Eyholzer, C.; Lopez-Suevos, F.; Tingaut, P.; Zimmermann, T.; Oksman, K., Reinforcing effect of carboxymethylated nanofibrillated cellulose powder on hydroxypropyl cellulose. Cellulose 2010, 17, (4), 793-802.
129. Aulin, C.; Gällstedt, M.; Lindström, T., Oxygen and oil barrier properties of microfibrillated cellulose films and coatings. Cellulose 2010, 17, (3), 559-574.
130. Henriksson, M.; Berglund, L. A.; Isaksson, P.; Lindstrom, T.; Nishino, T., Cellulose nanopaper structures of high toughness. Biomacromolecules 2008, 9, (6), 1579-1585.
131. Aulin C.; Netrval J.; Wågberg, L.; Lindström T., Aerogels from nanofibrillated cellulose with tunable oleophobicity. Soft Matter 2010, 6.
132. Ho, T. T. T.; Zimmermann, T.; Hauert, R.; Caseri, W., Preparation and characterization of cationic nanofibrillated cellulose from etherification and high-shear disintegration processes. Cellulose 2011, 18, (6), 1391-1406.
133. Pei, A.; Butchosa, N.; Berglund, L. A.; Zhou, Q., Surface quaternized cellulose nanofibrils with high water absorbency and adsorption capacity for anionic dyes. Soft
Matter 2013, 9, (6), 2047-2055. 134. Pahimanolis, N.; Hippi, U.; Johansson, L. S.; Saarinen, T.; Houbenov, N.;
Ruokolainen, J.; Seppälä, J., Surface functionalization of nanofibrillated cellulose using click-chemistry approach in aqueous media. Cellulose 2011, 18, (5), 1201-1212.
135. Siqueira, G.; Bras, J.; Dufresne, A., Cellulose Whiskers versus Microfibrils: Influence of the Nature of the Nanoparticle and its Surface Functionalization on the Thermal and Mechanical Properties of Nanocomposites. Biomacromolecules 2009, 10, (2), 425-432.
136. Siqueira, G.; Bras, J.; Dufresne, A., New process of chemical grafting of cellulose nanoparticles with a long chain isocyanate. Langmuir 2010, 26, (1), 402-411.
137. Missoum, K.; Bras, J.; Belgacem, M. N., Organization of aliphatic chains grafted on nanofibrillated cellulose and influence on final properties. Cellulose 2012, 19, (6), 1957-1973.
138. Gousse, C.; Chanzy, H.; Cerrada, M. L.; Fleury, E., Surface silylation of cellulose microfibrils: preparation and rheological properties. Polymer 2004, 45, (5), 1569-1575.
139. Ladouce, L.; Fleury, E.; Gousse, C.; Cantiani, R.; Chanzy, H.; Excoffier, G. Cellulose microfibrils with modified surface, preparation method and use therof. 2004.
140. Andresen, M.; Johansson, L. S.; Tanem, B. S.; Stenius, P., Properties and characterization of hydrophobized microfibrillated cellulose. Cellulose 2006, 13, (6), 665-677.
141. Andresen, M.; Stenius, P., Water-in-oil emulsions stabilized by hydrophobized microfibrillated cellulose. Journal of Dispersion Science and Technology 2007, 28, (6), 837-844.

135
142. Cervin, N. T.; Aulin, C.; Larsson, P. T.; Wågberg, L., Ultra porous nanocellulose aerogels as separation medium for mixtures of oil/water liquids. Cellulose 2011, 19, (2), 1-10.
143. Jin, H.; Kettunen, M.; Laiho, A.; Pynnönen, H.; Paltakari, J.; Marmur, A.; Ikkala, O.; Ras, R. H. A., Superhydrophobic and superoleophobic nanocellulose aerogel membranes as bioinspired cargo carriers on water and oil. Langmuir 2011, 27, (5), 1930-1934.
144. Korhonen, J. T.; Kettunen, M.; Ras, R. H.; Ikkala, O., Hydrophobic nanocellulose aerogels as floating, sustainable, reusable, and recyclable oil absorbents. ACS Appl.
Mater. Interfaces 2011, 3, (6), 1813-1816. 145. Qu, P.; Zhou, Y.; Zhang, X.; Yao, S.; Zhang, L., Surface modification of cellulose
nanofibrils for poly(lactic acid) composite application. Journal of Applied Polymer
Science 2012, 125, (4), 3084-3091. 146. Andresen, M.; Stenstad, P.; Moretro, T.; Langsrud, S.; Syverud, K.; Johansson, L. S.;
Stenius, P., Nonleaching antimicrobial films prepared from surface-modified microfibrillated cellulose. Biomacromolecules 2007, 8, (7), 2149-2155.
147. Tingaut, P.; Hauert, R.; Zimmermann, T., Highly efficient and straightforward functionalization of cellulose films with thiol-ene click chemistry. J. Mater. Chem.
2011, 21, (40), 16066-16076. 148. Lu, J.; Askeland, P.; Drzal, L. T., Surface modification of microfibrillated cellulose
for epoxy composite applications. Polymer 2008, 49, (5), 1285-1296. 149. Frone, A. N.; Berlioz, S.; Chailan, J. F.; Panaitescu, D. M., Morphology and thermal
properties of PLA–cellulose nanofibers composites. Carbohydrate Polymers 2013, 91, (1), 377-384.
150. Qua, E. H.; Hornsby, P. R.; Sharma, H. S. S.; Lyons, G., Preparation and characterisation of cellulose nanofibres. Journal of Materials Science 2011, 46, (18), 6029-6045.
151. Kolb, H. C.; Finn, M. G.; Sharpless, K. B., Click chemistry: Diverse chemical function from a few good reactions. Angew. Chem.-Int. Edit. 2001, 40, (11), 2004-2021.
152. Nielsen, L. J.; Eyley, S.; Thielemans, W.; Aylott, J. W., Dual fluorescent labelling of cellulose nanocrystals for pH sensing. Chem. Commun. 2010, 46, (47), 8929-8931.
153. Lönnberg, H.; Fogelström, L.; Berglund, L.; Malmström, E.; Hult, A., Surface grafting of microfibrillated cellulose with poly(ε-caprolactone) - Synthesis and characterization. European Polymer Journal 2008, 44, (9), 2991-2997.
154. Lönnberg, H.; Fogelström, L.; Zhou, Q.; Hult, A.; Berglund, L.; Malmström, E., Investigation of the graft length impact on the interfacial toughness in a cellulose/poly(ε-caprolactone) bilayer laminate. Composites Science and Technology
2011, 71, (1), 9-12. 155. Abdelmouleh, M.; Boufi, S.; Belgacem, M. N.; Duarte, A. P.; Ben Salah, A.; Gandini,
A., Modification of cellulosic fibres with functionalised silanes: development of surface properties. International Journal of Adhesion and Adhesives 2004, 24.
156. Abdelmouleh, M.; Boufi, S.; ben Salah, A.; Belgacem, M.; Gandini, A., Interaction of silane coupling agents with cellulose. Langmuir 2002.
157. Brochier Salon, M. C.; Abdelmouleh, M.; Boufi, S.; Belgacem, M.; Gandini, A., Silane adsorption onto cellulose fibers: hydrolysis and condensation reactions. Journal
of colloid and interface science 2005, 289, (1), 249-261. 158. Castellano, M.; Gandini, A.; Fabbri, P.; Belgacem, M. N., Modification of cellulose
fibres with organosilanes: Under what conditions does coupling occur? J. Colloid
Interface Sci. 2004, 273, (2), 505-511.

136
159. Ly, B.; Thielemans, W.; Dufresne, A.; Chaussy, D.; Belgacem, M. N., Surface functionalization of cellulose fibres and their incorporation in renewable polymeric matrices. Compos. Sci. Technol. 2008, 68, (15-16), 3193-3201.
160. Brinker C. Jeffrey , S. G. W., Sol-gel science: the physics and chemistry of sol-gel
processing. Academic Press, Inc.: 1990; p 141. 161. White, L. D.; Tripp, C. P., An infrared study of the amine-catalyzed reaction of
methoxymethyasilanes with silica. Journal of Colloid and Interface Science 2000, 227, (1), 237-243.
162. White, L. D.; Tripp, C. P., A low-frequency infrared study of the reaction of methoxymethylsilanes with silica. Journal of Colloid and Interface Science 2000, 224, (2), 417-424.
163. White, L. D.; Tripp, C. P., Reaction of (3-aminopropyl)dimethylethoxysilane with amine catalysts on silica surfaces. Journal of Colloid and Interface Science 2000, 232, (2), 400-407.
164. Osterholtz, F. D.; Pohl, E. R., Kinetics of the hydrolysis and condensation of organofunctional alkoxysilanes: a review. Journal of Adhesion Science and
Technology 1992, 6, (1), 127-149. 165. Pohl, E. R.; Osterholtz, F. D., Kinetics and mechanism of aqueous hydrolysis and
condensation of alkyltrialkoxysilanes. Plenum New York: 1985; p 157-170. 166. Brand, M.; Frings, A.; Jenkner, P.; Lehnert, R.; Metternich, H. J.; Monkiewicz, J.;
Schram, J., NMR-spectroscopic investigations on the hydrolysis of functional trialkoxysilanes. Zeitung für Naturforschung 1999, 54b, (2), 155-164.
167. Beari, F.; Brand, M.; Jenkner, P.; Lehnert, R.; Metternich, H. J.; Monkiewicz, J.; Siesler, H. W., Organofunctional alkoxysilanes in dilute aqueous solution: new accounts on the dynamic structural mutability. Journal of Organometallic Chemistry
2001, 625, (2), 208-216. 168. Brochier Salon, M. C.; Gerbaud, G.; Abdelmouleh, M.; Bruzzese, C.; Boufi, S.;
Belgacem, M. N., Studies of interactions between silane coupling agents and cellulose fibers with liquid and solid-state NMR. Magnetic Resonance in Chemistry 2007, 45, (6), 473-483.
169. Loy, D. A.; Baugher, B. M.; Baugher, C. R.; Schneider, D. A.; Rahimian, K., Substituent effects on the sol-gel chemistry of organotrialkoxysilanes. Chem. Mat.
2000, 12, (12), 3624-3632. 170. Li, G.; Wang, L.; Ni, H.; Pittman Jr, C. U., Polyhedral oligomeric silsesquioxane
(POSS) polymers and copolymers: A review. Journal of Inorganic and
Organometallic Polymers 2001, 11, (3), 123-154. 171. Torry, S. A.; Campbell, A.; Cunliffe, A. V.; Tod, D. A., Kinetic analysis of
organosilane hydrolysis and condensation. International Journal of Adhesion and
Adhesives 2006, 26, (1-2), 40-49. 172. Brochier Salon, M. C.; Bayle, P. A.; Abdelmouleh, M.; Boufi, S.; Belgacem, M. N.,
Kinetics of hydrolysis and self condensation reactions of silanes by NMR spectroscopy. Colloids and Surfaces A: Physicochemical and Engineering Aspects
2008, 312, (2-3), 83-91. 173. Smith, K. A., A study of the hydrolysis of methoxysilanes in a two-phase system.
Journal of Organic Chemistry 1986, 51, (20), 3827-3830. 174. Tan, B.; Rankin, S., Study of the effects of progressive changes in alkoxysilane
structure on sol-gel reactivity. The journal of physical chemistry. B 2006, 110, (45), 22353-22364.

137
175. Arkles, B.; Steinmetz, J. R.; Zazyczny, J.; Mehta, P., Factors contributing to the stability of alkoxysilanes in aqueous solution. Journal of Adhesion Science and
Technology 1992, 6, (1), 193-206. 176. Jitianu, A.; Britchi, A.; Badescu, V.; Deleanu, C.; Zaharescu, M., Influence of the
alkoxy group of the Si-alkoxides on the sol-gel process and on the structure of the obtained gels. Revue Roumaine de Chimie 2007, 52, (1-2), 93-99.
177. Pohl, E. R., Kinetics and Mechanisms of Acid and Base-Catalyzed Hydrolysis of Alkyltrialkoxysilanes in Aqueous Solution. In Proc. 38th Annu. Tech. Conf.,
Reinforced Plastics/Composites Inst. Section 4-B, 1983. 178. G., V. M.; Mileshkevich, V. P.; Yuzhelevskii, Y. A., The Siloxane Bond. Consultants
Bureau: New York and London, 1978. 179. Smith, K. A., Polycondensation of methyltrimethoxysilane. Macromolecules 1987, 20. 180. Ly, B.; Belgacem, M. N.; Bras, J.; Brochier Salon, M. C., Grafting of cellulose by
fluorine-bearing silane coupling agents. Materials Science and Engineering: C 2010, 30, (3), 343-347.
181. Hassan, C. M.; Peppas, N. A., Structure and applications of poly(vinyl alcohol) hydrogels produced by conventional crosslinking or by freezing/thawing methods. In 2000; Vol. 153, pp 37-65.
182. Tsuboi, M., Infrared spectrum and crystal structure of cellulose. J. Polym. Sci. 1957, 25, (109), 159-171.
183. Casserly, T. B.; Gleason, K. K., Chemical vapor deposition of organosilicon thin films from methylmethoxysilanes. Plasma Process. Polym. 2005, 2, (9), 679-687.
184. Tingaut, P.; Weigenand, O.; Militz, H.; Jéso, B.; Sèbe, G., Functionalisation of wood by reaction with 3-isocyanatopropyltriethoxysilane: Grafting and hydrolysis of the triethoxysilane end groups. Holzforschung 2005, 59, (4), 397-404.
185. Hook, R. J., A 29Si NMR study of the sol-gel polymerisation rates of substituted ethoxysilanes. Journal of Non-Crystalline Solids 1996, 195, (1-2), 1-15.
186. Douskey, M. C.; Gebhard, M. S.; McCormick, A. V.; Lange, B. C.; Whitman, D. W.; Schure, M. R.; Beshah, K., Spectroscopic studies of a novel cyclic oligomer with pendant alkoxysilane groups. Progress in Organic Coatings 2002, 45, (2-3), 145-157.
187. Heuzer, T., The chemistry of cellulose. John Wiley & Sons: New York, 1944; p 133-135.
188. Rånby, B. G., The Mercerisation of Cellulose. II. A Phase Transition Study with X-Ray Diffraction. Acta Chemica Scandinavica 1952, 6, 116-127.
189. Sèbe, G.; Ham-Pichavant, F.; Ibarboure, E.; Koffi, A. L. C.; Tingaut, P., Supramolecular structure characterization of cellulose II nanowhiskers produced by acid hydrolysis of cellulose i substrates. Biomacromolecules 2012, 13, (2), 570-578.
190. Bel-Hassen, R.; S., B.; Brochier Salon, M. C.; Abdelmouleh, M.; Belgacem, M. N., Adsorption of silane onto cellulose fibers. II. The effect of pH on silane hydrolysis, condensation, and adsorption behavior. Journal of Applied Polymer Science 2008, 108.
191. Banik, G.; Brückle, I., Principles of water absorption and desorption in cellulosic materials. Restaurator 2010, 31, (3-4), 164-177.
192. Corrêa, A.; de Morais Teixeira, E.; Pessan, L.; Mattoso, L., Cellulose nanofibers from curaua fibers. Cellulose 2010, 17, (6), 1183-1192.
193. Yang, H.; Yan, R.; Chen, H.; Lee, D. H.; Zheng, C., Characteristics of hemicellulose, cellulose and lignin pyrolysis. Fuel 2007, 86, (12–13), 1781-1788.
194. Morán, J. I.; Alvarez, V. A.; Cyras, V. P.; Vázquez, A., Extraction of cellulose and preparation of nanocellulose from sisal fibers. Cellulose 2008, 15, (1), 149-159.

138
195. Quiévy, N.; Jacquet, N.; Sclavons, M.; Deroanne, C.; Paquot, M.; Devaux, J., Influence of homogenization and drying on the thermal stability of microfibrillated cellulose. Polymer Degradation and Stability 2010, 95, (3), 306-314.
196. Rachini, A.; Le Troedec, M.; Peyratout, C.; Smith, A., Comparison of the thermal degradation of natural, alkali-treated and silane-treated hemp fibers under air and an inert atmosphere. Journal of Applied Polymer Science 2009, 112, (1), 226-234.
197. Bhagat, S. D.; Oh, C. S.; Kim, Y. H.; Ahn, Y. S.; Yeo, J. G., Methyltrimethoxysilane based monolithic silica aerogels via ambient pressure drying. Microporous and
Mesoporous Materials 2007, 100, (1–3), 350-355. 198. Rao, A. V.; Kulkarni, M. M.; Amalnerkar, D. P.; Seth, T., Superhydrophobic silica
aerogels based on methyltrimethoxysilane precursor. Journal of Non-Crystalline
Solids 2003, 330, (1–3), 187-195. 199. Ma, W. S.; Zhang, D. Q.; Duan, Y.; Wan, Z. R.; Wang, H.; Xu, Y. B., Preparation and
characterization of polysilsesquioxane microspheres with different organofunctional groups. Gongneng Cailiao/Journal of Functional Materials 2012, 43, (18), 2568-2572.
200. Lewicki, J. P.; Liggat, J. J.; Patel, M., The thermal degradation behaviour of polydimethylsiloxane/montmorillonite nanocomposites. Polymer Degradation and
Stability 2009, 94, (9), 1548-1557. 201. Plastics - Determination of dynamic mechanical properties - Part 2: Torsion-pendulum
method In 1996-12; Vol. DIN EN ISO 6721-2. 202. Davis, W. M.; Macosko, C. W., A forced torsional oscillator for dynamic mechanical
measurements. Polymer Engineering & Science 1977, 17, (1), 32-37. 203. Boiko, A. V.; Kulik, V. M.; Seoudi, B. M.; Chun, H. H.; Lee, I., Measurement method
of complex viscoelastic material properties. International Journal of Solids and
Structures 2010, 47, (3–4), 374-382. 204. Wolf, A. T.; Descamps, P. In Determination of Poisson's ratio of silicone sealants
from ultrasonic and tensile measurements, 2002; 2002; pp 132-142. 205. Alexandru, M.; Cristea, M.; Cazacu, M.; Ioanid, A.; Simionescu, B. C., Composite
materials based on polydimethylsiloxane and in situ generated silica by using the sol–gel technique. Polymer Composites 2009, 30, (6), 751-759.
206. Herrera-Franco, P. J.; Valadez-González, A., A study of the mechanical properties of short natural-fiber reinforced composites. Composites Part B: Engineering 2005, 36, (8), 597-608.
207. Alexandru, M.; Cazacu, M.; Nistor, A.; Musteata, V. E.; Stoica, I.; Grigoras, C.; Simionescu, B. C., Polydimethylsiloxane/silica/titania composites prepared by solvent-free sol–gel technique. Journal of Sol-Gel Science and Technology 2010, 56, (3), 310-319.
208. Panou, A. I.; Papadokostaki, K. G.; Tarantili, P. A.; Sanopoulou, M., Effect of hydrophilic inclusions on PDMS crosslinking reaction and its interrelation with mechanical and water sorption properties of cured films. European Polymer Journal
2013, 49, (7), 1803-1810. 209. Suryanegara, L.; Nakagaito, A. N.; Yano, H., Thermo-mechanical properties of
microfibrillated cellulose-reinforced partially crystallized PLA composites. Cellulose
2010, 17, (4), 771-778. 210. Tokoro, R.; Vu, D. M.; Okubo, K.; Tanaka, T.; Fujii, T.; Fujiura, T., How to improve
mechanical properties of polylactic acid with bamboo fibers. Journal of Materials
Science 2008, 43, (2), 775-787. 211. Dufresne, A.; Vignon, M. R., Improvement of starch film performances using
cellulose microfibrils. Macromolecules 1998, 31, (8), 2693-2696.

139
212. Huda, M. S.; Drzal, L. T.; Misra, M.; Mohanty, A. K.; Williams, K.; Mielewski, D. F., A study on biocomposites from recycled newspaper fiber and poly(lactic acid). Industrial and Engineering Chemistry Research 2005, 44, (15), 5593-5601.
213. Pandey, J. K.; Lee, C. S.; Ahn, S. H., Preparation and properties of bio-nanoreinforced composites from biodegradable polymer matrix and cellulose whiskers. Journal of
Applied Polymer Science 2010, 115, (4), 2493-2501. 214. Huda, M.; Drzal, L.; Mohanty, A.; Misra, M., Chopped glass and recycled newspaper
as reinforcement fibers in injection molded poly(lactic acid) (PLA) composites: A comparative study. Composites Science and Technology 2006, 66, (11-12), 1813-1824.
215. Ho, K. L. G.; Pometto, A. L.; Hinz, P. N., Effects of temperature and relative humidity on polylactic acid plastic degradation. J. Environ. Polym. Degrad. 1999, 7, (2), 83-92.
216. Rao, A. V.; Bhagat, S. D.; Hirashima, H.; Pajonk, G. M., Synthesis of flexible silica aerogels using methyltrimethoxysilane (MTMS) precursor. Journal of Colloid and
Interface Science 2006, 300, (1), 279-285. 217. Kanamori, K.; Aizawa, M.; Nakanishi, K.; Hanada, T., New Transparent
Methylsilsesquioxane Aerogels and Xerogels with Improved Mechanical Properties. Adv. Mater. 2007, 19, (12), 1589-1593.
218. Xia, F.; Jiang, L., Bio-inspired, smart, multiscale interfacial materials. Adv. Mater.
2008, 20, (15), 2842-2858. 219. Yamane, C.; Aoyagi, T.; Ago, M.; Sato, K.; Okajima, K.; Takahashi, T., Two different
surface properties of regenerated cellulose due to structural anisotropy. Polym. J. 2006, 38, (8), 819-826.
220. Lindman, B.; Karlström, G.; Stigsson, L., On the mechanism of dissolution of cellulose. Journal of Molecular Liquids 2010, 156, (1), 76-81.
221. Rein, D. M.; Khalfin, R.; Cohen, Y., Cellulose as a novel amphiphilic coating for oil-in-water and water-in-oil dispersions. Journal of Colloid and Interface Science 2012, 386, (1), 456-463.
222. Gui, X.; Wei, J.; Wang, K.; Cao, A.; Zhu, H.; Jia, Y.; Shu, Q.; Wu, D., Carbon nanotube sponges. Advanced Materials 2010, 22, (5), 617-621.
223. Choi, S. J.; Kwon, T. H.; Im, H.; Moon, D. I.; Baek, D. J.; Seol, M. L.; Duarte, J. P.; Choi, Y. K., A polydimethylsiloxane (PDMS) sponge for the selective absorption of oil from water. ACS Applied Materials and Interfaces 2011, 3, (12), 4552-4556.
224. Terinte, N.; Ibbett, R.; Schuster, K. C., Overview on native cellulose and microcrystalline cellulose I structure studied by X-ray diffraction (WAXD): Comparison between measurement techniques. Lenzinger Berichte 2011, 89, 118-131.
225. Sichina, W. J., Measurement of Tg by DSC. In PerkinElmer, Application note. 226. Sehaqui, H.; Zhou, Q.; Berglund, L. A., Nanostructured biocomposites of high
toughness - A wood cellulose nanofiber network in ductile hydroxyethylcellulose matrix. Soft Matter 2011, 7, (16), 7342-7350.
227. Stahl, T.; Brunner, S.; Zimmermann, M.; Ghazi Wakili, K., Thermo-hygric properties of a newly developed aerogel based insulation rendering for both exterior and interior applications. Energy and Buildings 2012, 44, (0), 114-117.

RESUMÉ :
Au cours de ce travail de thèse, la cellulose nanofibrillée (CNF) a été isolée à partir de fibres de paille d’avoine puis modifiée chimiquement par des alcoxysilanes en milieu aqueux. La CNF silylée a ensuite été utilisée pour élaborer de nouveaux matériaux composites et mousses biosourcés.
Le chapitre I présente quelques aspects généraux concernant les nanocelluloses, en par-ticulier la NFC et ses applications dans le domaine des matériaux composites et des mousses. Le chapitre II est consacré à la fonctionnalisation de la CNF par le méthyltriméthoxysilane - choisi comme alcoxysilane modèle - ainsi qu’à la caractérisation du matériau silylé. Plusieurs paramètres réactionnels (pH, temps de réaction, concentration initiale en silane) ont été étu-diés et optimisés, à partir de deux protocoles expérimentaux distincts. Les modifications ont été caractérisées à l’échelle moléculaire par différentes techniques physico-chimiques. Les propriétés des nanofibrilles silylées, comme la morphologie, cristallinité, mouillabilité, hygro-copicité et stabilité thermique, ont ensuite été évaluées. Dans le chapitre III, l’impact de la silylation sur les propriétés mécaniques et hygroscopiques de composites à matrice acide poly(lactique) ou matrice polydiméthylsiloxane chargés en NFC a été évalué. Pour finir, l’impact de la silylation sur les propriétés de mousses élaborées à partir de NFC lyophilisées a été étudié dans le chapitre IV (porosité, propriétés en compression, conductivité thermique, mouillabilité, hygroscopicité et oléophilicité).
Mots-clé : Cellulose nanofibrillée, alcoxysilanes, composites, mousses.
ABSTRACT:
In this thesis, nanofibrillated cellulse (NFC) has been isolated from oat straw and chemically modified by alkoxysilanes in water medium. Silylated NFC has been subsequently used to elaborate novel biobased composite materials and foams
Chapter I presents some general aspects about nanocelluloses, in particular NFC and its use in composite materials and foams. Chapter II is dedicated to the functionalization of NFC by methyltrimethoxysilane - chosen as a model silane - and to the comprehensive examination of the silylated material. Reaction conditions such as pH, reaction time and initial silane concentration have been particularly in-vestigated and optimized using two distinct experimental protocols. The modifications have been characterized at the molecular level by various physicochemical techniques. The proper-ties of the silylated nanofibrils i.e. the morphology, crystallinity, wettability, hygroscopicity and thermal stability, have been subsequently examined. Chapter III investigates the impact of silylation on the mechanical and hygroscopic properties of NFC-reinforced composites prepared with two distinct polymeric matrices: poly(lactic ac-id) (PLA) and polydimethylsiloxane (PDMS). Chapter IV examines the impact of silylation on the properties of NFC-foams prepared by freeze drying, in particular on the porosity, compressive properties, thermal conductivity, wet-tability, hygroscopicity and oleophilicity.
Keywords: Nanofibrillated cellulose, alkoxysilanes, composites, foams.