modification of biologically active compounds from
TRANSCRIPT

I An-Najah National University Faculty of Graduate Studies
Modification of Biologically Active Compounds from
Selected Medicinal Plants in Palestine
By Ahmad Ibrahim Ahmad Husein
Supervisors
Prof. Mohammed Saleem Ali-Shtayeh
Dr. Nidal Zater Dr. Waheed Jondi
This thesis is Submitted in Partial Fulfillment of the Requirements for the Degree of Ph.D. of Science in Chemistry, Faculty of Graduate Studies, An-Najah National University, Nablus, Palestine.
2010


III
Dedicated
This thesis is especially dedicated to all people who are interested in science.
IVAcknowledgements
This study was carried out at the Department of Chemistry and Department of
Biology and Biotechnology, at An-Najah National University, Nablus,
Palestine. I wish to express my deepest gratitude to my principal supervisor,
Prof. Dr. Mohammed S. Ali-Shtayeh, for his encouragement to start and
complete this work and for the opportunity to be a member of the inspiring
research group. His endless support and constructive criticism has been precious
during these years. I am greatly indebted to my other supervisors, Dr. Nidal
Zatar and Dr. Waheed Jondi for their continuous support and valuable advice
during my Ph.D. studies. I thank them for their professional experience, advice
and patience during these years. Contributions of them all were vital to the
success of the study. I owe my thanks to Dr. Shukri Khalaf for providing the
facilities for my work in the department and for his support. I wish to thank Prof.
Dr. Hikmat Hillal for his support and advice during my studies as a Ph.D.
student. My thanks go to Dr. Mohamed Faraj and Mr. Shady Al-Refaay in the
Department of Microbiology at Bir-Zeit University for providing the facilities to
carry out anticancer tests in their laboratories. Special thanks to Dr. Malik Al-
Zehluf in Jordan University for his assistance in carrying out anticancer tests.
I am grateful to all technicians in the chemistry laboratories for technical
assistance in carrying out part or this study. My colleagues and friends in the
Departments of Chemistry and Biology deserve warm thanks, for making my
Vwork easier during these years, for giving hand in solving problems, and for
providing a pleasant working atmosphere. Special thanks for Ahmad Othman
for doing statistical analysis. My warm thanks go to my colleague Dr. Ahed
Zyoud for inspiring discussions and sharing good moments during this program.
Special thanks are also due to my colleagues in Tulkarm Directorate of
Education for their patience and interest during the time of study. My brother,
my uncle Musleh deserve special thanks for their friendship, advice and
continuous encouragement during my academic study. Finally, my dearest
thanks are addressed to my family, my wife for her love and endless support,
and our wonderful and active sons for being the sunshine of my life.

VI
ـــــرارقـــإ
: ــــة الرسالة التي تحمل العنوان /ـــة أدناه ، مقدم/أنا الموقع
. زيادة فعالية وتعديل على مركبات لھا فعالية حيوية من نباتات مختارة في فلسطين
الرسالة انما ھي نتاج جھدي الخاص، باستثناء ما تم الاشارة اليه حيثما اقر بأن ما اشتملت عليه ھذهن ھذه الرسالة ككل، او اي جزء منھا لم يقدم من قبل لنيل اية درجة او لقب علمي أو بحثي إورد، و
. لدى أية مؤسسة تعليمية او بحثية اخرى
Declaration The work provided in this thesis, unless otherwise referenced, is the researcher’s own work, and has not been submitted elsewhere for any other degree or qualification.
Student’s Name: Ahmad I. A. Huseinإبراهيم أحمد حسين أحمد: اسم الطالب Signature : التوقيع:
: Date:التاريخ

VII
Contents Chapter One: General Introduction 1
1.1 Traditional medicine 2
1.2 Modern phytochemistry 3
1.3 Main chemical constituents in medicinal plants 4
1.3.1 Phenolic compounds 4
1.3.2 Flavonoids 6
1.3.3 Overview of flavonoid and phenolic biosynthesis pathways 8
1.4 Methods of isolation and quantitative determination 12
1.4.1 Extraction 12
1.4.2 Chromatographic types and techniques 13
1. 5 Importance of medicinal plants 16
1.6 Medicinal plants in Palestine 16
1.7 Aims of study 20
1.8 References. 21
Chapter Two: Biological Activities of Selected Plants in
Palestine
32
2.1 Antioxidants 33
2.1.1Introduction 33
2.1.2 Materials and methods 36
2.1.3 Results and discussion 38
2.2 Antimicrobial activity of selected plants in Palestine 43
2.2.1 Introduction 43
2.2.2 Material and methods 45
2.2.3 Results and discussion 47
2.3 Anticancer activity of selected plants in Palestine 52
2.3.1 Introduction 52

VIII2.3.2 Materials and methods 54
2.3.3 Results and discussion 55
2.4 References 57
Chapter Three: Phytochemistry 65
3.1 Introduction 66
3.2 Materials and methods 67
3.2.1 Identification of some constituents from the selected plants 67
3.2.2 Determination of total phenolic compounds 81
3.2.3 Determination of total flavonoid compounds 82
3.2.4 Determination of total phenolics and flavonoids using HPLC 83
3.2.5 Identification of phenolic compounds and flavonoid
compounds using HPLC analysis
84
3.2.6 Modification of some biological active compounds 92
3.2.7 Biological activity of modified compounds 109
3. 3 Results and discussion 109
3.4 References 119
Chapter Four General Discussion and Conclusion 123
4.1 General Discussion 124
4.2 References 129
4.3 Suggestions for further studies 132

IXList of Tables
Table (2.1) Antimicrobial activity of plant extracts against bacteria
48
Table (2.2) Cross tabulation means of percent inhibition due to plant type and concentration level
49
Table (2.3) Complete inhibition range of the plant extracts 50
Table (2.4) Two way ANOVA analysis of percent inhibition due to plant type concentration level
51
Table (2.5a) Duncan Post Hoc tests of percent inhibition to determine the most homogeneous subsets of plant type in different concentration levels.
51
Table (2.5b) Duncan Post Hoc tests of percent inhibition to determine the most homogeneous subsets of concentration level
51
Table (2.6) Percent inhibition and percent viability of cancer cells for tested plants
55
Table (3.1) Compounds identified from the selected plants by GS-MS
68
Table (3.2) Total flavonoid and phenolic compounds in the ethanolic extracts
83
Table (3.3) Phenolic compounds and flavonoids detected by HPLC according to the Retention time
84
Table (3.4) Retention time of separated compounds from A. palaestinum
86
Table (3.5) Retention time of separated compounds from U. pilulifera
87
Table (3.6) Retention time of separated compounds from C. capitatus
88
Table (3.7) Retention time of separated compounds from M. syriaca
89
Table (3.8) Retention time of separated compounds from T. creticum
90
Table (3.9) Retention time of separated compounds from T. polium
91
Table (3.10) Percent inhibition of phenolic acid esters at different concentration
110

XTable (3.11) Absorbance of phenolic acid esters using β-carotene
assay 113
Table (3.12) Antibacterial activity of modified compounds 116
Table (3.13) Antifungal activity of modified compounds on M. canis
117
Table (3.14) Antifungal activity of modified compounds on T. rubrum
118
Table (3.15) Percent viability of cancer cells 118

XIList of Figures
Figure (1.1) Common hydroxybenzoic acids 5 Figure (1.2) Chemical structures of (a) salicylic acid ,(b) gallic acid,
(c) ellagic acid 5
Figure (1.3) Structures of hydroxycinnamic acids 6 Figure (1.4 ) Chemical structure of (a) flavanone skeleton and (b)
flavone 6
Figure (1.5) Structures of the main flavonoid subgroups 7 Figure (1.6) Schematic diagram of stilbene and flavonoids
biosynthetic pathway 9
Figure (1.7) Schematic diagram of phenolic biothensis pathway accompanied by the key enzymes involved.
11
Figure (1.8) Schematic diagram of curcumin formation 12 Figure (2.1) Structures of some antioxidants 35 Figure (2.2) Percent inhibition of selected plants at different
concentrations 39
Figure (2.3) Free radical scavenging capacities IC 50 of ethanolic extracts
40
Figure (2.4) Structural formulas of β-carotene and linoleic acid 41 Figure (2.5) Antioxidant activities of ethanolic extracts of the
plants. 42
Figure (2.6) Percent inhibition of plant extracts 56 Figure (3.1 a) TIC values for Diisobutyl phthalate 69 Figure (3.1 b) Mass spectrum of Diisobutyl phthalate 70 Figure (3.2 a) TIC values for Methyl 3-hydroxy benzoate 71 Figure (3.2 b) Mass spectrum of Methyl 3-hydroxy benzoate 72 Figure (3.3 a) TIC values for Di-n-octyl phthalate 73 Figure (3.3 b) Mass spectrum of Di-n-octyl phthalate 74 Figure (3.4 a) TIC values for 4H-pyran-4-one 2,3 dihydro-3,5-
dyhydroxy -6-methyl 75
Figure (3.4 b) Mass spectrum of 4H-pyran-4-one 2,3 dihydro-3,5-dyhydroxy -6-methyl
76
Figure (3.5 a) TIC values for 2- phenoxy ethanol 77 Figure (3.5 b) Mass spectrum of 2- phenoxy ethanol 78 Figure (3.6 a) TIC values for Thymol 79

XIIFigure (3.6 b) Mass spectrum of Thymol 80 Figure (3.7) Standard pyrocatechol graph 81 Figure (3.8) Standard quercetin graph 82 Figure (3.9) Chromatogram of A. palaestinum 86 Figure (3.10) Chromatogram of U. pilulifera 87 Figure (3.11) Chromatogram of C. capitatus 88 Figure (3.12) M. syriaca
Chromatogram of 89
Figure (3.13) Chromatogram of T. creticum 90 Figure (3.14) Chromatogram of T. polium 91 Figure (3.15) U.V spectrum for 2-phenoxyethyl benzoate 93 Figure (3.16) IR spectrum for 2-phenoxyethyl benzoate 93 Figure (3.17) UV spectrum for 2-phenoxyethyl 2-
hydroxybenzoate 95
Figure (3.18) IR spectrum for 2-phenoxyethyl 2-hydroxybenzoate 95 Figure (3.19) UV spectrum for 2-phenoxyethyl 3-
hydroxybenzoate 97
Figure (3.20) IR spectrum for 2-phenoxyethyl 3-hydroxybenzoate 97 Figure (3.21) UV spectrum for 2-phenoxyethyl 4-
hydroxybenzoate 99
Figure (3.22) IR spectrum for 2-phenoxyethyl 4-hydroxybenzoate 99 Figure (3.23) UV spectrum for 2-phenoxyethyl toluate 101 Figure (3.24) IR spectrum for 2-phenoxyethyl toluate 101 Figure (3.25) UV spectrum for 2-phenoxyethyl acetate 103 Figure (3.26) IR spectrum for 2-phenoxyethyl acetate 103 Figure (3.27) UV spectrum for 2-phenoxyethyl propionate 105 Figure (3.28) IR spectrum for 2-phenoxyethyl propionate 105 Figure (3.29) IR spectrum for diisobutyl phthalate 106 Figure (3.30) IR spectrum for dibutyl phthalate 107 Figure (3.31) IR spectrum for dipropyl phthalate 108 Figure (3.32) Percent inhibition of phenolic acid esters at different
concentrations 111
Figure (3.33) Antioxidant activities of phenolic acid esters as assessed by β-carotene-linoleic acid assay.
114
Figure (3.34) General formulas of acid esters 117

XIII
List of Schemes
Scheme (3.1) Preparation of 2-phenoxyethyl benzoate 92 Scheme (3.2) Preparation of 2-phenoxyethyl 2-hydroxybenzoate 94 Scheme (3.3) Preparation of 2-phenoxyethyl 3-hydroxybenzoate 96 Scheme (3.4) Preparation of 2-phenoxyethyl 4-hydroxybenzoate 98 Scheme (3.5) Preparation of 2-phenoxyethyl toluate 100 Scheme (3.6) Preparation of 2-phenoxyethyl acetate 102 Scheme (3.7) Preparation of 2-phenoxyethyl propionate 104 Scheme (3.8) Preparation of diisobutyl phthalate 106 Scheme (3.9) Preparation of dibutyl phthalate 107 Scheme (3.10) Preparation of dipropyl phthalate 108

XIVModification of Biologically Active Compounds from Selected
Medicinal Plants in Palestine By
Ahmad Ibrahim Ahmad Husein
Supervisors
Prof. Mohammed Saleem Ali-Shtayeh
Dr. Nidal Zater Dr. Waheed Jondi
Abstract Six plants used in traditional medicine in Palestine were tested for their
biological activity. They were collected from Nablus region. These plants
include four families namely Araceae (Arum palaestinum), Urticaceae
(Urtica pilulifera), Labiatae (Coridothymus capitatus, Majorana syriaca)
and Lamiaceae (Teucrium creticum, Teucrium polium). The ethanolic
extracts of those plants were tested for their antioxidant activity through
DPPH assay and β-Carotene-linoleic acid assay. The concentrations of
Phenolic compounds and Flavonoids were determined as µg/mg equivalent
of quercetin and pyrocatechol. The extracts of the plants were tested also
for their antifungal activity against four pathogenic fungi: Trichophyton
tonsurans, Microsporum canis, Trichophyton rubrum and Trichophyton
violaceum, compared with the activity of econazole. The extracts were also
tested for their anticancer activity against prostate PC3 human carcinoma.
All of the extracts showed different potential biological activities in all
tests. Phytochemical screening indicated the presence of Flavonoids and
phenolics in all extracts. T. creticum and C. capitatus were the most
efficient antioxidants in DPPH assay, while U. pilulifera and C. capitatus
XV
were the most efficient as antioxidants in β-Carotene-linoleic acid assay. C.
capitatus and M. syriaca were the active against fungi between the six
plants. U. pilulifera and A. palaestinum showed the highest potent
antiproliferative activity. Some constituents were detected from plants
extracts using GC-MS spectrophotometer and separated by flash
chromatography. These constituents were tested for their biological
activity. Many reactions were done to modify the activity of these
constituents. Four phenolic acid esters were synthesized and tested for their
biological activity in the same methodology used in testing the extracts. All
of the synthesized compounds showed significant biological activity in all
tests.

1
Chapter One
General Introduction

2
1.1 Traditional medicine
Thousands of years ago herbs and plant products were used in folk medicine in
treating a wide spectrum of ailments and diseases. Folk remedies are prepared as
powders, poultices, ointments, baths, decoctions, infusions and teas. The interest
in studying the biological effects of traditional medicinal plants or isolating their
active components for treatment of illness has been increasing all over the world
and comprehensive screening programs have been established [1]. Floristic
analysis showed that there are about 500,000 plant species on our planet. Out of
these about 120,000 plant species can be used to create biologically active
products, which are used in disease treatment [2]. Today a great number of
different medicinal teas and other plant products are available on market
including cosmetics and pharmaceuticals, which contain biologically active
substances [3].
Recently some products of plant origin were shown to be effective sources of
chemotherapeutic agents without undesirable side effects and with strong
biological activity. This attracted the attention of many scientists and
encouraged them to screen plants to study the biological activity of their
constituents from chemical and pharmacological investigations to therapeutic
aspects [4]. New systematic methods for separation, identification and
determination of chemical constituents are applied, in addition to different
biological activity tests carried out on plant extracts and their chemical
constituents. Most of the new phytochemical studies follow similar
methodologies such as plant collection, plant extraction, biological tests,
chemical analysis and statistical analysis [5].

3
1.2 Modern Phytochemistry
Natural products have been a source of drugs and drug leads. It is estimated that
61 percent of the 877 small molecule new chemical entities introduced as drugs
worldwide during 1981–2002 can be traced back to or were developed from
natural products [6]. In some therapeutic areas, the contribution of natural
products is even greater, e.g. about 78 percent of antibacterial and 74 percent of
anticancer drug candidates are natural products or structural analogues of natural
products. In 2000, approximately 60 percent of all drugs in clinical trials for the
multiplicity of cancers were of natural origin. Modern drug discovery
approaches applying full automation and robotics, hundreds of molecules can be
screened using several assays within a short time, and with very small amounts
of compounds. A number of associated techniques are used for identification
and analysis of chemical constituents e.g. LC-PDA (liquid chromatography–
photo-diode-array detector), LC-MS (liquid chromatography–mass
spectrometry detector) and LC-NMR (liquid chromatography– nuclear magnetic
resonance spectroscopy). While in the recent past it was extremely difficult, time
consuming and labor intensive to build such a library from purified natural
products, with the advent of newer and improved technologies related to
separation, isolation and identification of natural products the situation has
improved remarkably. Natural products libraries have been established to
preserve crude extracts, chromatographic fractions or semi-purified compounds.
However, the best result can be obtained from a fully identified pure natural
product library as it provides scientists with the opportunity to handle the ‘lead’

4
rapidly for further developmental work, e.g. total or partial synthesis, dealing
with formulation factors, in vivo assays and clinical trials [6].
1.3 Main chemical constituents in medicinal plants
Plants have an almost limitless ability to synthesize chemical substances mainly
secondary metabolites, of which at least 12000 have been isolated, a number
estimated less than 10% of the total [7]. Chemical analysis of plant extracts
showed the existence of many chemical compounds related to different classes
such as alkaloids, quinines, sugar alcohols, terpenes, polyphenols, flavonoids,
phenolics and many others. Flavonoids and phenolics and their derivatives are
found in most plants. Such compounds are very important for both humans and
plants [7]. They act as cell wall support materials [8] and as colorful attractants
for birds and insects helping seed dispersal and pollination [9]. Flavonoids and
phenolic acids also have antioxidative [10] and anticarcinogenic effects [11].
1.3.1 Phenolic compounds: Phenolic acids are large and heterogeneous group
of biologically active non-nutrients. They are present in plants as hydroxylated
derivatives of benzoic and cinnamic acids [12, 13]. Phenolic compounds are
important in the defense mechanisms of plants under different environmental
stress conditions such as wounding, infection, and excessive light or UV
irradiation [14]. Phenolics are not only unsavory or poisonous, but also of
possible pharmacological value [15]. The main two groups of phenolic
compounds are:
1. Hydroxybenzoic acids: They have a general structure derived directly from
benzoic acid and variations in the structures of individual hydroxybenzoic acids
lie in the hydroxylations and methylations of the aromatic ring [16]. Four acids

5
occur commonly: protocatechuic acid, vanillic acid, hydroxybenzoic acid and
syringic acid, (Figure 1.1).
OH
HOOC
OH
OCH3
HOOC
OCH3
OH
OCH3
OH
Protocatechuic acid Vanillic acid Syringic acidHydroxy benzoic acid
HOOC HOOC
OH
(Figure: 1.1) Chemical structures for common hydroxybenzoic acids.
Other common hydroxybenzoic acids are also salicylic acid (2-hydroxybenzoic
acid), and gallic acid (trihydroxyl derivative) which participate in the formation
of hydrolysable gallotannins [17]. Its dimeric condensation product
hexahydroxydiphenic acid related to dilactone, and ellagic acid are common
plant metabolites (Figure 1.2) [18].
a) HOOC
OH
b) HOOC
OH
OH
OH c)
O
O
O
O
OH
OH
HO
HO
d)
HO
OH
HO
OH
COOH
OH
HOOC
HO
(Figure 1.2) Chemical structures of (a) salicylic acid, (b) gallic acid, (c) ellagic acid,
(d) hexahydroxydiphenic acid
They may be present in soluble form or conjugated with sugars or organic acids
as well as bound to cell wall fractions such as lignin [19].
2. Hydroxycinnamic acids: The four most widely distributed hydroxycinnamic
acids in many plants are p-coumaric acid, caffeic acid, ferulic acid and sinapic

6
acids shown in (Figure 1.3) [16]. OH
HOOC p-coumaric acid
OH
HOOCCaffeic acid
OH OH
HOOC Ferulic acid
OH
HOOCSinapic acid
OCH3OCH3
OCH3
(Figure: 1.3) Chemical structures of hydroxycinnamic acids
Hydroxycinnamic acids usually occur in various conjugated forms, the free
forms being artifacts from chemical or enzymatic hydrolysis during tissue
extraction in the cis-forms. The conjugated forms are esters of hydroxy acids or
sugar derivatives [20].
1.3.2 Flavonoids: Flavonoids are naturally occurring polyphenolic compounds
containing two benzene rings linked together with a pyrone ring in the case of
flavones or a dihydropyrone ring in the case of flavanones [21] as shown in
(Figure 1.4) and subgroups (Figure 1.5).
a)
O
O b)
O
O
(Figure: 1.4) Chemical structures of (a) flavone skeleton, and (b) flavanone
Flavonoids are normal constituents of the human diet and are responsible for a
variety of biological activities. Some of these act as enzyme inhibitors and
antioxidants, and have been reported to have anti-inflammatory properties [22].
However, the molecular mechanisms explaining how flavonoids suppress the
inflammatory response are not known in detail [23].

7
O
O
O
O
O
OO
A
O
O
O
O
Flavonol
OH
Flavone
Isoflavone
AnthocyanidinFlavanone
Flavan-3-ol
OH
C
B
OH
OH
HO
OH
(Figure: 1.5) Chemical structures of the main flavonoid subgroups.
A few studies have shown that certain flavonoids down-regulate NO2 mediators
of inflammation production in response to inflammatory stimuli [24, 25] but no
more precise mechanisms of action are known yet.
Flavonoids have long been recognized to possess antiallergenic, anti-
inflammatory, antiviral, antiproliferative and antioxidative activities [26].
Epidemiological studies have shown inverse relationships between the intake of
flavonoids specially flavonols and flavones and the risk of coronary heart
disease [27], stroke, [28] lung cancer [29], and stomach cancer [30]. Other
epidemiological studies have, on the other hand, found no association between

8
the intake of flavonoids and the risk of heart disease [31] or cancer [32].
Although the role of flavonoids and phenolic acids in the maintenance of health
and prevention of diseases seems positive, the evidence is still limited and
conflicting. Moreover, the bioavailability of flavonoids and phenolic acids from
various foods, and the extent and mechanism of absorption in the human body
are poorly known.
1.3.3 Overview of flavonoid and phenolic biosynthesis pathways
The biosynthesis of flavonoids, hydroxycinnamates, and phenolic acids
involves a complex network of routes based principally on the Shikimate,
phenylpropanoid, and flavonoid pathways. These biosynthetic pathways
constitute a complex biological regulatory network that has evolved in
vascular plants during their successful transition on land and that
eventually is essential for their growth, development, and survival [33].
From the 1970s to the 1990s, there was a rapid and substantial progress in
the research on the phenylpropanoid pathway, focusing mainly on a broad
understanding of the metabolic pathway [34]. However, in more recent
years, new information is also emerging regarding the regulation of the
phenylpropanoid pathway. In the last few years, a great deal has been
learned from studies in a variety of plant species, primarily about
transcriptional regulation. A number of these studies were carried out using
flavonoid mutants generated by activation tagging [35]. Characterization of
flavonoid mutants in a variety of plant species has led to the identification
of a number of novel regulatory proteins that are beginning to fill in the

9
void between signals that induce the pathway and well-known flavonoid
regulators (Figures 1.6) [36]. OH
SCoA
Op-Comaroyl-CoA+Malonyl-CoA (x3)
HOOCSCoA
O
O
OH
HO
OH
HO OH OH
OHOH
HOHO
O
OH
O O
trans-Resverratol Naringenen-chalcon Isoliquintigenen Liquiritigenin
SS CHSCHS
CHR
OO O OHO
OH
OH
HO
OH
OH
OH OH OH
OHOH
OO OO
Apigenin Naringenin Genistein Daidzein
FNS IFS
CHIIFS
OO
O
OHOH
HOOH
O O
HO
OH
OH
OH
Kaempferol Dihydrokaempferol
F3H
FLS
DFR
Dihydroquercetin
OH
OHOH
OHO
OH
(Figure: 1.6) Schematic diagram of the stilbene and flavonoid biosynthetic pathway. Enzyme abbreviations: SS, stilbene synthase; CHS, chalcone synthase; CHR, chalcone reductase; CHI, chalcone isomerase; IFS, isoflavone synthase; FNS, flavone synthase; F3H,flavanone 3-hydroxylase; FLS, flavonol synthase; F3uH, flavonoid 3u-hydroxylase; DFR,dihydroflavonol 4-reductase; LAR, leucoanthocyanidin 4-reductase; LDOX, leucocyanidindeoxygenase; ANR, anthocyanidin reductase; EU, extension units; TU, terminal unit.

10
In addition, increasing evidence is being generated demonstrating that as
well as inducing the phenylpropanoid pathway, these transcriptional
regulators also influence the modification, transport, and deposition of
metabolites in the vacuole [37]. In addition to the molecular techniques,
technical advances both in chromatographic techniques and in
identification tools, particularly the diverse forms of mass spectrometry,
has allowed successful challenges to the separation and characterization of
compounds of increasing complexity, poor stability, and low abundance
[38]. Information generated utilizing these techniques has resulted in
characterization of excess of complex secondary metabolites that, in
conjunction with the characterization of the enzymatic steps, has permitted
the complete or partial clarification of the flavonoid and the phenolic
pathways present in many plants (Figure 1.7).
Nonetheless, the complete analysis of phenolic metabolic pathway is far
from being complete. For example, recent reports underline those important
questions still remain to be answered in the field of protoanthocyanidins
and tannins [39], and that the exact nature of the biosynthetic pathway(s)
leading to lignin monomers has not been fully elucidated [40]. An example
of the phenolic pathway, which produces secondary metabolites that have
health benefiting effects, is the biosynthesis of curcuminoids. The initial
investigations into the biosynthesis of curcuminoids were carried over 25
years ago [41], although little has been done subsequently to elucidate fully
the routes involved.

11
OHHO
COOH
OH
Gallic acid
OHO HO
HO HOO O
OH
OHHO
B-Glucogallin
Penta-O-galloyl-glucose
HO
OHO
COOH
3-dehydra -shikimic acid
Carbohydrate
NH2HOOC
Phenylalanine
HOOCCinnamic acid Benzoic acid Salicylic acid
HOOCHOOC
OH
HOOC
OH
P-coumaric acid
OH
OHOH
OCH3
HOOC
Caffeic acidHOOC
Ferulic acid
PAL
C4H
COMT-1
HOOC
F5H
OH
OH
OCH3
5-Hydroxy-ferulic acid
OCH3
OH
OCH3
HOOCSinapic acid
GT
BA2H
COMT-1
(Figure: 1.7) Schematic diagram of phenolic biosynthesis pathway accompined by the key enzymes involved. Enzyme abbreviations: PAL, phenylalanine ammonia-lyase; BA2H, benzoic acid 2-hydroxylase; C4H, cinnamate 4-hydroxylase; COMT-1, caffeic/5-hydroxyferulic acid O-methyltransferase; 4CL, p-coumarate:CoA ligase; F5H, ferulate 5-hydroxylase; GT, galloyltransferase
The curcuminoids are thought to be formed from condensation of two
molecules of p-coumaroyl-CoA with one molecule of malonyl-CoA via the
action of possibly a polyketide synthase. The resulting product would then
be transformed through demethoxycurcumin into curcumin via two

12
sequential rounds of hydroxylation followed by O-methylation (Figure
1.8).
O
CoAS+
HOOCSCoA
O
HO
OCH3
OH
OCH3O OH
p-coumaroyl-CoA Malonyl CoACurcumin
2
(Figure: 1.8) Schematic diagram of curcumin formation
Alternatively, it is possible that the curcuminoid synthase enzyme may
utilize the CoA esters of both p-coumaric acid and ferulic acid as substrates
[42].
1.4 Methods of isolation and quantitative determination
1.4.1 Extraction
Extraction is the second step in the criteria of studying medicinal plants after
plant collection. There are many methods used in extracting plant materials.
Many factors may affect the extract such as, pH for the extracting medium,
stability of the constituents, and hence biological activity of the chemical
constituents of the plants. Type of solvents used in those methods may be
organic or aqueous depending on the study needs. The following are the most
popular methods used for extraction [43].
a. Decoction: It is one of the traditional extraction techniques where the extract
is prepared by placing the plant in cold water, bringing it to boil for fifteen
minutes, then the extract is decanted or filtered when required.

13
b. Infusion: It is carried out by pouring boiling water or organic solvent on a
specific quantity of plant martial and allowing the mixture to stand for 10-15
minutes or more, then the extract is dried and kept for further studies.
c. Soaking: The plant martial is soaked in organic or aqueous solvent for 72
hours; the extract is decanted and dried, kept for further studies.
d. Soxhlet extraction: The plant martial is grounded and soaked in a solvent
for 72 hours and then refluxed for 24 hours using soxhlet extractor.
e. Steam distillation: It is an ingenious method for isolation of slightly
volatile, water insoluble compounds from plants. The plant material is
grounded and boiled in water through distillation. The distillate is collected and
separated by a separatory funnel.
1.4.2 Chromatographic types and techniques
Chromatography was discovered and named in 1906 by Michael Tswett, a
Russian botanist while he was attempting to separate colored leaf pigments.
Among all types of separation methods it has the unique position of being
applicable to all types of problems in all areas of science. It is used for the
separation of a mixture that contains a large number of organic compounds.
Chromatography is a physical method that helps to avoid any reaction that may
change the structure of the original compounds in the plant [44].
1- Liquid Chromatography (LC): In this method the mobile phase is a liquid
whereas in gas Chromatography (GC) it is a gas. In Gas-liquid
Chromatography (GLC) the stationary phase is a liquid spread over the surface
of a solid support.
14
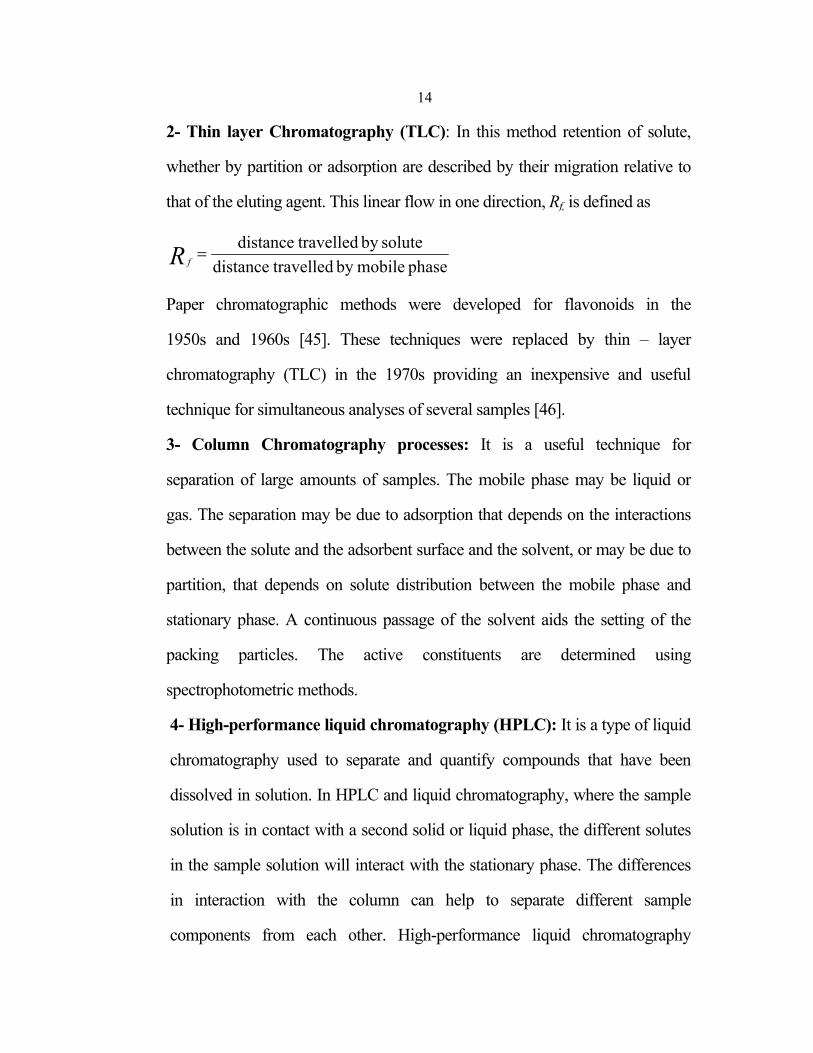
2- Thin layer Chromatography (TLC): In this method retention of solute,
whether by partition or adsorption are described by their migration relative to
that of the eluting agent. This linear flow in one direction, Rf, is defined as
phase mobileby travelleddistancesoluteby travelleddistance
=R f
Paper chromatographic methods were developed for flavonoids in the
1950s and 1960s [45]. These techniques were replaced by thin – layer
chromatography (TLC) in the 1970s providing an inexpensive and useful
technique for simultaneous analyses of several samples [46].
3- Column Chromatography processes: It is a useful technique for
separation of large amounts of samples. The mobile phase may be liquid or
gas. The separation may be due to adsorption that depends on the interactions
between the solute and the adsorbent surface and the solvent, or may be due to
partition, that depends on solute distribution between the mobile phase and
stationary phase. A continuous passage of the solvent aids the setting of the
packing particles. The active constituents are determined using
spectrophotometric methods.
4- High-performance liquid chromatography (HPLC): It is a type of liquid
chromatography used to separate and quantify compounds that have been
dissolved in solution. In HPLC and liquid chromatography, where the sample
solution is in contact with a second solid or liquid phase, the different solutes
in the sample solution will interact with the stationary phase. The differences
in interaction with the column can help to separate different sample
components from each other. High-performance liquid chromatography

15
(HPLC) has been the most widely employed chromatographic technique in
flavonoid analysis during the past 20 years [47, 48]. It has been added a new
dimension to the investigation of flavonoids in plant and food extracts.
Particular advantages are the improved resolution of flavonoid mixtures
compared to other chromatographic techniques, the ability to obtain both
qualitative and accurate quantitative data in one operation, and the great speed
of analysis [49, 50].
5- Gas Chromatography: The concept of GC was announced in 1941 by
Martin and Synge. Chromatography is one of the most important and efficient
methods of separation and identification of constituents of plants extracts. In
this method the separation of constituents depend on the variety of their
polarities through two phases, mobile phase and stationary phase. This is the
role in all types of chromatography such as thin layer chromatography, column
chromatography, flash chromatography and gas chromatography. Gas
chromatography (GC) has only a limited applicability in the analysis of
flavonoids and other phenolics due to their limited volatility, the main
disadvantage is an extra step required to ensure the volatility of phenolics
[36]. However, GC analysis with mass spectrometric (MS) detection has
been applied for the analysis of flavonols in black tea [51] and cabbage
[52]. Advantages of GC analysis include an improved separation of
closely related isomers and simple coupling to MS detectors for
identification through the fragmentation pattern [53, 54].

16
1. 5 Importance of medicinal plants
Many people believe that medicinal plants are more natural and more accessible
than manufactured drugs [55] .In addition to nutritional components, medicinal
plants were used in treating a wide spectrum of ailments and diseases, and they
have been screened for their potential uses as alternative remedies and the
preservation of foods from toxic effects of oxidants [56]. A large number of
plants have been found to contain ingredients that have antibacterial, antifungal,
and anticancer activities. Other plants are used in traditional medicine due to
their antioxidant properties [57, 58]. Recently some products of higher plant
origin have been shown to be effective sources of chemotherapeutic agents
without undesirable side effects and strong biological activity. Natural-product-
like compounds are an attempt to enhance the productivity of synthetic chemical
constituents used in preparing cosmetics and pharmaceuticals, which contain
biologically active substances.
1. 6 Medicinal plants in Palestine
In Palestine, the screening of flora for pharmacological active compounds
started in the late sixties [59]. The abundance of more than 2900 species
condensed on a very small geographical area is a major advantage of studying
the Palestinian flora. This richness is due to the diversity of the soil and climatic
conditions [60]. Six of these plants used in Arab Tradition Palestinian Medicine
were used in this study: Arum palaestinum (Araceae), Urtica pilulifera
(Urticaceae), Coridothymus capitatus (Labiatae), Majorana syriaca (Labiatae),
Teucrium creticum (Lamiaceae) and Teucrium polium, (Lamiaceae) [43].

17
1- Arum palaestinum: It is one of about 26 species of the arum genus which are
flowering plants belonging to Araceae.This family includes many species
distributed in different regions. Many species are used as traditional remedies or
food. In Palestine the aerial parts of A. Palaestinum are considered edible after
being soaked in salty water or drying. It is also used as animal fodder. The plant
is also used in folk medicine to cure several chronic diseases such as stomach
acidity, atherosclerosis, cancer, and diabetes and food toxicity [60]. Previous
studies on the characteristics of secondary metabolites of the Araceae family
showed that it has a simple profile of polyphenols and alkaloids with flavone c-
glycosides, flavanols, flavones, proanthocyanidins and polyhydroxy alkaloids as
main classes [61]. Another study was attempted to analyze the ethyl acetate
fraction of the plant and led to the isolation and identification of a new
polyhydroxy alkaloid compound C4H5NO4 [62]. Few phytochemical and
biological investigations have been reported on this plant [63]. One of them
reported the inhibitory effect of an A. Palaestinum extract on the muscle
contraction of rat and guinea-pig uteri [64]. And also, the isolation and structural
elucidation of a novel pyrrole alkaloid, was investigated and showed anticancer
activity [62]. Moreover, the ethyl acetate fraction of this plant was examined
and found to possess antioxidant activity via evaluation of its scavenging of
DPPH free radicals, in addition to its anti-cancer activity against
hepatocarcinoma (Hep G2) ,breast carcinoma cells (MCF-7) and lymphoplastic
leukemia (1301) using the 3-[4,5-dimethyl-2-thiazolyl)-2,5- diphenyl-2H-
tetrazolium bromide (MTT) cytotoxicity assay [62].

18
2- Urtica pilulifera: It is commonly known in Roman as Nettle and in Palestine
as (Qurraus), has been long used in many countries around the world as a
traditional medicine for curing sore joints by mixing the plant juice with oil. The
contents of the stinging hair provide a cure for rheumatism, hemorrhage.
Decoction of the summits of the plant is diuretic, depurative. Seeds are used for
renal stones and inflammation of the bladder, diuretic and aphrodisiac. It is used
in the treatment of various diseases including Diabetes Mellitus and other
ailments [65, 66]. Also the effect of methanol extract of the plant was studied on
diabetes include male rat’s reproductive structures and functions, such as sperm
motility and count and testosterone secretion [67]. The oil of nettle showed a
potent and completely inhibitory effect on the radial growth of a fungus called
A. alternaria at 1500 ppm. [68].
3- Coridothymus capitatus: It is an aromatic plant found in Palestine and locally
known under the common name (Zaa’tman). The essential oils of the plant were
reported to have antimicrobial activities most of which are mediated by thymol
and carvacrol [69]. Various species of thymus have been credited with a long list
of pharmacological properties. The plant is also important as a source of
perfume, cosmetics, flavoring and pharmaceutical industries [70]. In traditional
food the plant has been used for its flavors as refreshing drink or in cooking. It’s
used in folk medicine against cold, influenza and throat infection [61], later on
the plant was found to contain antiseptic and antimicrobial agents [71].
4- Majorana syriaca: It is one of the most popular herbs among Palestinian
people The green leaves of the herb are rich in essential oil, which is responsible
for its characteristics of flavor and fragrance. Oil of cultivated thyme is an

19
important commercial product and is obtained mainly by steam distillation of
the fresh leaves. Plant extract is also found to have strong biological activity, and
this may due to the presence of phenols, thymol and carvacrol as major
constituents of thyme oil in the plant [72].
5- Teucrium creticum is found in Palestine and locally known under the
common name Ja’adh. The plant is used traditionally to cure from diabetes in
Nablus region. No phytochemical studies were found on this plant, and this may
be attributed to its limited distribution in Palestine [61].
6- Teucrium polium is found in Palestine and locally known under the common
name Ja’adhat al-sibian. The plant is well known for its diuretic, antipyretic,
diaphoretic, antispasmodic, tonic, anti-inflammatory, antihypertensive, anorexic,
analgesic [73, 74], antibacterial [75] and antidiabetic effects [76]. Hot infusion
of tender parts of plant is taken for stomach and intestinal troubles, plant used in
a steam bath for colds and fevers, useful against smallpox and itch, stimulant,
depurative, for feminine sterility, colds and tonic, astringent, vulnerary.
Recently, it has been reported that the extract of T. polium reduces NADPH-
initiated lipid peroxidation in rat liver microsomes in vitro [77]. The aqueous
extract possesses a hypoglycaemic effect. Flowers and leaves of the plant
possess conduolonic effect. It also stimulates the neuromotor centers for uterine
and intestinal musculature. The plant shows antimicrobial activity against
Bacillus subtilis and Staphylococcus aureus [78]. Plants belonging to the genus
Teucrium have been shown to contain different classes of compounds such as
fatty acid esters [79], terpenes [80], flavonoids and polyphenolics [81, 82].

20
1.7 Aims of study
The aims of our study were to:
1- Study the biological activity for six plants used in traditional medicine
in Palestine: Arum palaestinum, Urtica pilulifera, Coridothymus
capitatus, Majorana syriaca, Teucrium creticum and Teucrium polium.
a- Antioxidant activity
b- Antimicrobial activity
c- Anticancer activity
2- Separation, identification and determination of active constituents
from those plants.
3- Modify some of the separated constituents to improve their biological
activity.
21
1.8 References
1- Azzam M. S. (1984). Phytochemical investigation of certain plants
used in Egyptian folk medicine as antidiabetic drugs. Ph.D. thesis,
Faculty of Pharmacy, Cairo University, Cairo, Egypt.
2- Tivy J. (1995). Biogeography, a study of plants in the ecosphere.
Essex, England: Longman House Burnt Mill, Halow, 12.
3- Nahrstedt A. (2000). Active constituents of traditional European
medical plants-new developments. Natural products research in the
new millennium, Int. Congr. and Ann. Meeting of the Soc. for Med.
Plant Res. (GA), September 3-7, 2000 Zurich, Switzerland.
4- Panizzi L., Flamini G., Cioni L.P., Moreli I. (1993). Composition and
antimicrobial properties of essential oils of four Mediterranean
Lamiaceae. J. Ethnopharm. , 39, 163-170.
5- Buchbauer G. (2000). The detailed analysis of essential oils leads to
the understanding of their properties. Perfumer & Flavorist., 25, 64-
67.
6- Satyajit D. S., Lutfun N. (2007). Chemistry for Pharmacy Students
General, Organic and Natural Product Chemistry, The Atrium,
Southern Gate, Chichester, West Sussex, England : John Wiley & Sons
Ltd,
7- Rafael C. D., Magda N. L., Nadia R. (2008). Quantification of phenolic
constituents and antioxidant activity of pterodon emarginatys vogel
seeds. Int. J. Mol. Sci., 9, 606-614.

22
8-Wallace G., Fry S.C. (1994). Phenolic components of the plant cell
wall. Int. Rev. Cytol., 151, 229–267.
9- Harborne J. B. (1994). The Flavonoids: Advances in Research Since
1986. London, UK: Chapman & Hall.
10- Robards K., Prenzler P. D., Tucker G., Swatsitang P., Glover W.
(1999). Phenolic compounds and their role in oxidative processes in
fruits. Food Chem. ,66, 401–436.
11- Stavric B. (1994). Quercetin in our diet: from potent mutagen to
probable anticarcinogen. Clin. Biochem., 27, 245–248.
12- Shahidi F., Naczk M. (1995). Food Phenolics, Sources, Chemistry,
Effects, Applications. Lancaster, USA: Technomic Publishing
Company, Inc.
13- Havsteen B. (1983). Flavonoids, a class of natural products of high
pharmacological potency. Biochem. Pharmacol., 32, 1141–1148.
14- Dixon R. A., Paiva N. L. (1995). Stress-induced phenylpropanoid
metabolism. Plant Cell., 7, 1085–1097.
15- Strack D. (1997). Phenolic metabolism. In: Dey P. M., Harborne J.
B., eds. Plant Biochemistry. London, UK: Academic Press, 387–416.
16- Macheix J-J., Fleuriet A., Billot J. (1990) Fruit Phenolics. Boca
Raton, USA: CRC Press.
17- Haddock E., Gupta R., Al-Shafi S., Layden K., Haslam E., Magnolato
D. (1982). The metabolism of gallic acid and hexahydroxydiphenic
acid in plants: biogenetic and molecular taxonomic considerations.
Phytochem. , 21, 1049–1062.

23
18 - Maas J. L. , Galletta G. , Wang S. (1992). Ellagic acid enhancement
in strawberries. In: Bills D., Kung S., eds. Biotechnology and
Nutrition. Storeham, USA: Butteworth-Heinemann, 345–362.
19- Herrmann K. (1989). Occurrence and content of hydroxycinnamic
and hydroxybenzoic acid compounds in food. Crit. Rev. Food Sci.
Nutr., 28, 315–347.
20- Schuster B., Herrmann K. (1985). Hydroxybenzoic and
hydroxycinnamic acid derivatives in soft fruits. Phytochem., 24, 2761–
2764.
21- Giuseppe G., Barreca D., Gargiulli C., Leuzzi U., Caristi C. (2007).
Flavonoids composition of citrus juice. Molecules, 12, 1641-1673.
22- Middleton E., Kandaswami C., Theoharides T. (2000). The effects of
plant flavonoids on mammalian cells: implications for inflammation,
heart disease, and cancer, Pharmacological Reviews, 52, 673–751.
23- Havsteen B. H. ( 2002). The biochemistry and medical significance
of the flavonoids, Pharmacology and Therapeutics, 96, 67–202.
24- Liang Y. C, Huang Y. T., Tsai S. H., Lin-Shiau S. Y., Chen C. F., ,Lin
J. K. (1999). Suppression of inducible cyclooxygenase and inducible
nitric oxide synthesis by apigenin and related flavonoids in mouse
macrophages, Carcinogenesis , 20, 1945–1952.
25- Kim H., Kim Y. S., Kim S. Y., Suk K. (2001). The plant flavonoid
wogonin suppresses death of activated C6 rat glial cells by inhibiting
nitric oxide production, Neuroscience Letters, 309, 67–71.

24
26- Robards K., Prenzler PD., Tucker G., Swatsitang P., Glover W. (1999).
Phenolic compounds and their role in oxidative processes in fruits.
Food Chem., 66, 401–436.
27- Knekt P., Järvinen R., Reunanen A, Maatela J. (1996). Flavonoid
intake and coronary mortality in Finland: a cohort study, Br. Med. J.,
312, 478–481.
28 - Keli S. O., Hertog M. G. L., Feskens E. J. M., Kromhout D. ( 1996).
Dietary flavonoids, antioxidant vitamins, and incidence of stroke:
The Zutphen study, Arch. Int. Med., 156, 637–642.
29 - Knekt P., Järvinen R., Seppänen R. (1997). Dietary flavonoids and
the risk of lung cancer and other malignant neoplasms, Am. J.
Epidemiol., 146, 223–230.
30 - Garcia-Closas R., Gonzales C. A., Agudo A, Riboli E. (1999). Intake
of specific carotenoids and flavonoids and the risk of gastric cancer in
Spain. Cancer Causes Cont., 10, 71–75.
31 - Rimm E. B., Katan M. B., Ascherio A., Stampfer M. J., Willet W. C.
(1996). Relation between intake of flavonoids and risk for coronary
heart disease in male health professionals, Ann. Intern. Med., 125,
384–389.
32 - Hertog M. G. L., Sweetnam P. M., Fehily A. M., Elwood P. C.,
Kromhout D. (1997). Antioxidant flavonols and ischemic heart disease
in a Welsh population of men: the Caerphilly Study, Am. J. Clin.
Nutr. , 65, 1489–1494.

25
33- Costa M. A., Collins R. E., Anterola A. M., Cochrane F. C., Davin L.
B. (2003). An in silico assessment of gene function and organization of
the phenylpropanoid pathway metabolic networks in Arabidopsis
thaliana and limitations thereof, Phytochem., 64, 1097–112
34- Heller W., Forkmann G. (1994). Biosynthesis of flavonoids. In:
Harborne J. B, Ed. The Flavonoids. London: Chapman and Hall, 499–
536.
35-Mathews H., Clendennen S. K., Caldwell C. G., Liu X. L., Connors K.,
Matheis N., Schuster D. K., Menasco D. J., Wagoner W., Lightner J.,
Wagner D. R. (2003). Activation tagging in tomato identifies a
transcriptional regulator of anthocyanin biosynthesis, modification,
and transport, Plant Cell., 15, 1689–1703.
36- Winkel-Shirley B., (2001). Flavonoid biosynthesis. A colorful model
for genetics, biochemistry, cell biology, and biotechnology, Plant
Physiol., 126, 485–493.
37- Broun P. (2004). Transcription factors as tools for metabolic
engineering in plants, Current Opinion Plant Biol.,7 , 202–209.
38- Whiting D. A., (2001). Natural phenolic compounds 1900–2000: A
bird’s eye view of a century’s chemistry, Nat. Prod. Rep., 18, 583–606.
39- Xie D. Y., Dixon R. A. (2005). Proanthocyanidin biosynthesis still
more questions than answers, Phytochem., 66 , 2127–2144.
40- Boudet A. M. (2007). Evolution and current status of research in
phenolic compounds, Phytochem., 68, 2722–2735.

26
41- Ramirez-Ahumada Mdel C., Timmermann B. N., Gang D. R. (2006).
Biosynthesis of curcuminoids and gingerols in turmeric Curcuma
longa and ginger Zingiber officinale: identification of curcuminoid
synthase and hydroxycinnamoyl-CoA thioesterases, Phytochem. , 67,
2017-29.
42- Harvey D. J. (1981). Gas chromatographic and mass spectrometric
studies of ginger constituents : Identification of gingerdiones and new
hexahydrocurcumin analogues, Journal of Chromatography, 212,
Issue 1 ,75-84.
43- Ali-Shatyeh M. S., Jamous R. M. (2008). Traditional Arabic
Palestinian Herbal Medicine. (1st ed.), Nablus: Biodiversity and
Environmental Research Center.
44- Skoog A., Hollar F., Nieman A., (1998). Principles of instrumental
analysis. (5th ed). USA: Thomson learning Inc.
45- Markham K. R. (1982). Techniques of Flavonoid Identification.
New York, USA: Academic Press.
46- Robards K., Antolovich M. (1997). Analytical chemistry of fruit
bioflavonoid: a review, Analys., 122, 11R– 34R.
47- Harborne JB. (1998). Phytochemical Methods: A Guide to Modern
Techniques of Plant Analysis. London, UK: Chapman & Hall.
48- Merken H. M., Beecher G. R. (2000). Measurement of food
flavonoids by high-performance liquid chromatography: A review, J.
Agric. Food Chem., 48, 577–599.

27
49- Harborne J. B. (1988). The flavonoids: recent advances. In: Goodwin
TW, ed. Plant Pigments. London, England: Academic Press. 299–343.
50- Markham K. R. , Bloor S. J. (1998). Analysis and identification of
flavonoids in practice. In: Rice-Evans CA, Packer L, eds. Flavonoids in
Health and Disease. New York, USA: Marcel Dekker Inc., 1– 33.
51- Finger A., Engelhardt U. H., Wray V. (1991). Flavonol glycosides in tea
- kaempferol and quercetin rhamnodiglucosides, J. Sci. Food Agric., 55,
313–321.
52- Nielsen J. K., Olsen C. E., Petersen M. K., (1993). Acylated flavonol
glycosides from cabbage leaves, Phytochem., 34, 539–544.
53- Mouly P., Gaydou E. M., Estienne J. (1993). Column liquid
chromatographic determination of flavanone in Citrus, J.
Chromatogr., 634, 129–134.
54- Schmidt T. J., Merfort I., Willuhn G. (1994). Gas chromatography-mass
spectrometry of flavonoid aglycones II. Structure-retention relationships
and a possibility of differentiation between isomeric 6- and 8-
methoxyflavones, J. Chromatogr. A., 669, 236–240.
55-Jennifer K. (2000). Medicinal plants for livestock beneficial or toxic.
http://WWW.ansci.cornell.edu/plants/inedicmal/index.html.
56- Huang G., Jiang J., Dai D. (2008). Antioxidative and antibacterial
activity of the methanol extract of artemisia anomala S. Moore, African
J. Biotech. , 7 (9), 1335-1338

28
57- Schinella G. R., Tournier H. A., Prieto J. M., Mordujovich de
Buschiazzo P., Ríos J. L. (2002). Antioxidant activity of anti-
inflammatory plant extracts, Life Sci., 70, 1023-1033.
58- VanderJagt T. J., Ghattas R., VanderJagt D. J., Crossey M., Glew R.
H. (2002). Comparison of the total antioxidant content of 30 widely
used medicinal plants of New Mexico, Life Sci. ,70, 1035-1040.
59- Silva, F., & Abraham, A. (1981). The potentiality of the Israeli flora
for medicinal purposes, Fitoterapia , 52, 195-200.
60- Ali-Shtayeh M. S., Yaghmour R. M., Faidi Y. R., Salem Kh., Al-Nuri
M. A. (1998). Antimicrobial activity of 20 plants used in Folkloric
Medicine in Palestinian Area, Journal of Ethnopharmacol., 60, 265-
271.
61- Kite G. C., Sharp H. J., Hill P. S., Boyce P. C., (1997).
Polyhydroxyalkaloids in the aroid tribes nephthytideae and
aglaonemateae: Phytochemical support for an intertribal relationship.
Biochm. Syst. Ecol., 25, 757- 766.
62- El-Desouky S. K., Kim K. H., Ryu S.Y., Eweas A. F., Gamal –Eldeen
A. M., Kim Y. K. (2007). A new pyrrol alkaloide isolated from Arum
palaestinum Boiss. and its biological activities, Arch. Pharm. Res., 30,
927-931
63- Saad B., Azaizeh H., Said O. (2005). Tradition and Perspectives of
Arab Herbal Medicine, eCAM , 4 , 475–479.

29
64- Afifi F. U., Abdalla S. (1999). Effect of isoorientin isolated from
Arum palaestinum on uterine smooth muscles of rats and guinea pigs,
J. Ethnopharmacol., 65, 173-177.
65- Kavalali G., Tuncel H., Goksel S. , Hatemi H. H. (2003).
Hypoglycemic activity of Urtica pilulifera in streptozotocin-diabetic
rats, J. Ethnopharmacol., 84, 241-245.
66- Lopatkin, N. , Sivkov, A. Walther, C. Schlafke, S. Medvedev, A.
Avdeichuk, J. Golubev, G. Melnik, K. Elenberger N. & Engelmann, U.
(2005). Long-term efficacy and safety of a combination of sabal and
Urtica pilulifera extract for lower urinary tract symptoms: A placebo-
controlled, double-blind, multi-center trial. World, J. Urol. , 12, 742-
749.
67- Irshaid F., Mansi K. (2009). Effects of leaf extract of Artica
Pilulifera L. on male reproductive system of streptozotocin-diabetic
rats. American J. of Pharmacol. and Toxicol., 2 (4), 22-28.
68- Hadizadeh, I. ,Peivastegan B. , Hamzehzarghani H. (2009). Antifungal
activity of essential oils from some medicinal plants of Iran against
Alternaria alternate, Am. J. of Appl. sci., 5(6), 857-861.
69- Bhaskara M. V. Angers, P. Gosseline A., Arul, J. (1998).
Characterization and use of essential oil from Thymus vulgaris against
botrytis camera and rhizopus stolonnifer in strawberry fruits,
Phytochem., 47, 1515- 1520.

30
70- Tabata M. , Honda G., Sezik E. (1988). A report on traditional
medicine and medicinal plants in Turkey, Faculty of pharma. ceutical
sciences, Kyoto University.
71- Bremnes L. H. (2002). Eyewitness-Handbooks, New York, USA:
DK Publishing.
72- Abu-Lafi S., Odeh I. , Dewik Q., Imam A. ,Dembitsky M., Lumir O.
(2007). Natural compounds Of Palestine flora. Comparison analysis by
static headspace and steam distillation GC-MS of semi volatile
secondary metabolites from leaves of cultivated Palestinian M. syriaca,
Biomed. Pap. Med. Fac. Univ. Palacky Olomouc Czech Repub,
1(151).21–29.
73- Suleiman M. S., Abdul-Ghani A. S., Al-Khali S., Amin R. (1998).
Effect of Teucrium polium boiled leaf extract on intestinal motility
and blood pressure, J. Ethnopharmacol., 22, 111–116
74- Tariq M., Ageel A. M., al-Yahya M. A. , al-Said M. S. (1989).
Anti-inflammatory activity of Teucrium polium, Int. J. Tissue React.,
11,185–188,
75- Mansouri S. (1999). Inhibition of Staphylococcus aureus mediated
by extracts of Iranianplants, Pharmac. Biol., 37, 375–377.
76- Esmaeili M. A., Yazdanparast R. (2004). Hypoglycaemic effect of
Teucrium polium: studies with rat pancreatic islets, J.
Ethnopharmacol., 95, 27–30.

31
77- Panovska T. K. , Kulevanova S. (2005). Effect of some Teucrium
species (Lamiaceae) on lipid peroxidation in rat liver microsomes,
Fresenius Environ. Bull., 14, 957– 959
78- Lemordant D., Boukef K. , Bensalem M. (1997). Plantes utiles et
toxiques de Tunisie, Fitoterapia, 48, 191-214.
79- Fonta G., Savona G., Redriguez, B. (1999). Usual 6’-fatty acid esters
of (24S-24-ethyl- cholesta-5, 25- dien-3b-yl-b-D-Glucopyranoside)
from Teucrium polium, J. Ethnopharmacol. , 24, 93–99
80- Mini D. A., Zhang P., Zhao X., Wang Chong S., Zheno Q. (1991).
A neo chlordane deterrence from Teucrium japonicum, Phytochem.,
30, 4175–4177.
81- Harborne J. B., Tomas B., Williams G. A., Gil. M. I. (1986). A
chemotaxonomic study of flavonoids from European teucrium species,
Phytochem., 25, 2811– 2816.
82- Rizk A. M., Hammouda F. M. , Rimpler H., Kamel A. ( 1986).
Iridoids and flavonoids of Teucrium polium herb, Planta. Medica., 2,
87–88.

32
Chapter Two
Biological Activities of Selected Plants in Palestine

33
2.1 Antioxidants
2.1.1 Introduction
Antioxidants neutralize the toxic and ‘volatile’ free radicals by giving
hydrogen atoms or scavenging them scheme 2.1 [1].
Unsaturated organic compounds → RO˙2 +ArOH → ROOH +ArO˙
RO˙2 + ArO˙ → non-radical products
(Scheme 2.1) Scavenging radicals by antioxidants
In biological systems free radicals and other reactive species like ‘reactive
oxygen species’ (ROS), nitrogen (RNS) and chlorine (RCS), are normal
by- products of metabolism and they are introduced into the body from
outside sources of harmful chemicals in the environment, unhealthy foods,
certain drugs, smoke and many other sources. In a normal healthy human,
taking antioxidants neutralize the generation of those species and protect
the body from cell damage [2]. However, when the humans get exposed to
unfavorable physiochemical, environmental or pathological agents
oxidative stress results from the imbalance between the extent of ROS
formation and the oxidative defense mechanisms. Cellular damage induced
by oxidative stress has been caught up in the etiology of a large number of
human diseases (>100) such as pathology of cancer, atherosclerosis,
malaria and rheumatoid arthritis as well as the process of ageing [3]. In
recent years, there is a remarkable interest in the possible task of nutrition
in prevention of disease. In this context, antioxidants especially derived
from natural sources such as medicinal plants and herbal drugs derived
from them require special attention. Antioxidants have many potential

34
applications, especially in relation to human health, both in terms of
prevention of disease and therapy [4, 5]. Various antioxidants may prevent
and/or improve diseased states [6]. These include the intracellular different
levels of protection such as prevention, interception antioxidant enzymes
and the dietary or oral supplements in the form of vitamin C, vitamin E, β-
carotene, zinc and selenium [7, 8]. Antioxidants are also of particular
importance because they might serve as leads for the development of novel
drugs. Several plants used as neuroprotective, anti-inflammatory, digestive,
antinecrotic, and hepatoprotective properties have recently been shown to
have antioxidant and/or antiradical scavenging mechanism as part of their
activity [9, 10].
A review of literature shows that there are many plants in Palestine
showing antioxidant abilities at various levels of protection need to be
examined for their potential therapeutic and beneficial properties [11].
More recent assays also should be included to study the antioxidant
properties of medicinal plants or their chemical constituents. This will
greatly help in identifying more potent compounds with potential
applications in prevention.
There has been considerable interest in the field of antioxidants in recent
years and these efforts have led to a better understanding of the mechanism
involved and in the application areas of food and non-food commodities as
well as in biological systems and as a dietary supplements. The early work
by scientists was concentrated on synthetic antioxidants and currently
butylated hydroxyanisol (BHA), butylated hydroxytoluene (BHT), propyl

35
gallate (PG) and tert-butylhydroquinone (TBHQ) are most widely used in
foods (Figure 2.1).
CH3
OH
BHT
O
OH
BHA
OH
OH OH
HO
C OOOH
TBHQ PG
(Figure: 2.1) Structures of some antioxidants
Unfortunately some reports have indicated that certain synthetic
antioxidants may possess weak carcinogenic effects in some animals at
high levels. However natural sources of antioxidants such as tocopherols,
ascorbic acid, erythrobic acid or their salts or derivatives have found
extensive applications in the food industry [12]. There are many techniques
and methodologies to evaluate the antioxidant activity; one should use
several methods to provide complementary assessment that consider
different mechanisms involved in rendering the effects. These included
radical scavenging activity, metal chelation and reducing power among
others [13].
Objective of study was to:
Evaluate the antioxidant activity of six medicinal plants: Arum
palaestinum, Urtica pilulifera, Coridothymus capitatus, Majorana
syriaca, Teucrium creticum and T. polium, using DPPH and β -carotene-
linoleic acid assays.
2.1.2 Materials and methods

36
1- Chemicals
β-Carotene, linoleic acid, 1,1–Diphenyl-2-picrylhydrazyl (DPPH),
buthylated hydroxytoluene (BHT), buthylated hydroxyanisol (BHA), and
α-tocopherol were purchased from Sigma,( Sigma, Aldrich GmbH,
Sternhheim, Germany). While pyrocatechol, quercetin, Tween-40,
Folinciocalteus phenol reagent (FCR), sodium carbonate, ethanol,
chloroform and other chemicals and reagents were purchased from Merck
(Darmstat, Germany). All other chemicals and reagents were of analytical
grade.
2- Plant Collection
The medicinal plant species screened in this study were collected in April –
June 2008 from Nablus region and were identified by Prof. M. S. Ali-
Shtayeh in the Department of Biological Sciences at An-Najah University.
Voucher specimens are preserved in BERC /Til Village.
3- Extracts preparation
The aerial parts of the plants were dried in the shadow at 30°C and grinded
using a Molenix (Mooele Depose type 241) for a minute. 50g sample from
each dried plant was extracted by continuous stirring with 500 ml ethanol
at 24°C for 72 h and filtering through Whatman No. 4 filter paper. The
residue was then washed with additional 200 ml ethanol. The combined
ethanolic extracts were dried using freeze drying and stored at -20 °C for
future use.
4 - DPPH assay
37
The hydrogen atom or electron donation abilities of the corresponding
extracts and some pure compounds were measured from the bleaching of
the purple-colored methanolic solution of 1,1-diphenly-2-picrylhydrazyl-
hydrate (DPPH). This spectrophotometric assay uses the stable radical
DPPH as a reagent [14, 15]. One milliter of various concentrations of the
extracts in ethanol was added to 4 ml of 0.004% methanol solution of
DPPH. After 30 minutes, incubation period at room temperature, the
absorbance was read against a blank at 517 nm. The percent Inhibition I
(%) of free radical by DPPH was calculated as follows:
I (%) = ((Ablank – Asample)/ Ablank) x 100
Where Ablank is the absorbance of the control reaction (containing all
reagents except the test compound), and Asample is the absorbance of the test
compound. Extract concentrations providing 50% inhibition (IC50) are
calculated from the plot of inhibition (%) against extract concentration.
Tests were carried out in triplicates.
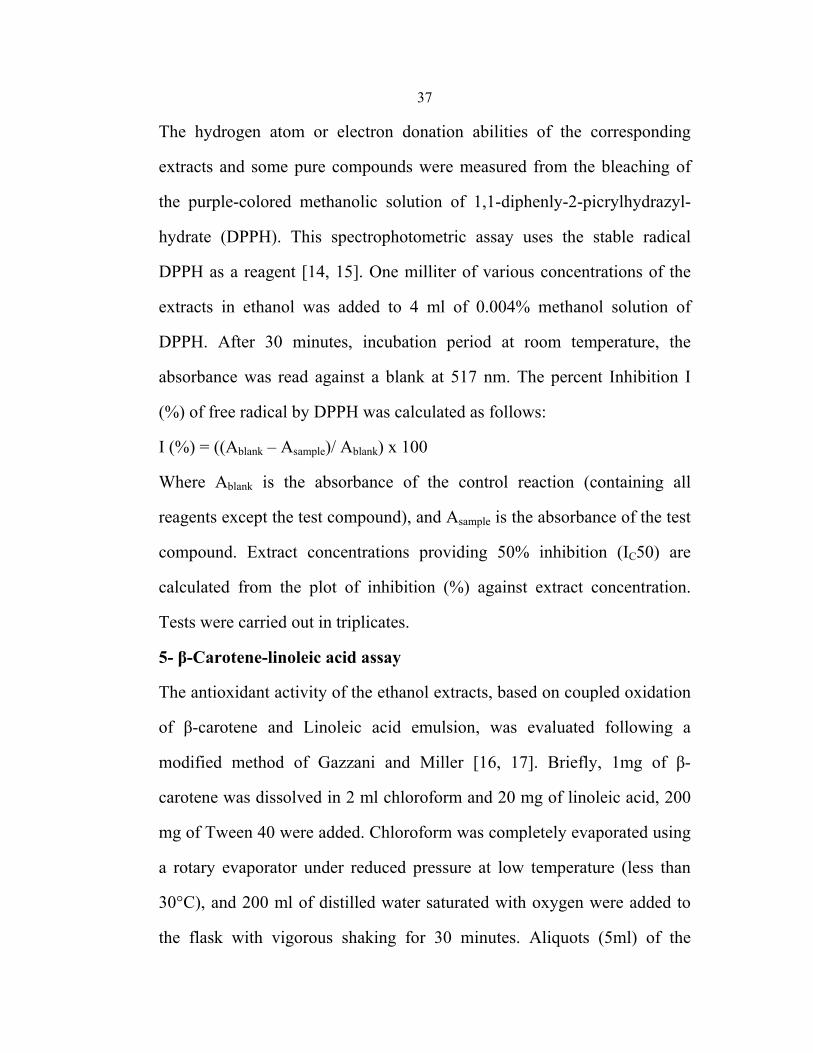
5- β-Carotene-linoleic acid assay
The antioxidant activity of the ethanol extracts, based on coupled oxidation
of β-carotene and Linoleic acid emulsion, was evaluated following a
modified method of Gazzani and Miller [16, 17]. Briefly, 1mg of β-
carotene was dissolved in 2 ml chloroform and 20 mg of linoleic acid, 200
mg of Tween 40 were added. Chloroform was completely evaporated using
a rotary evaporator under reduced pressure at low temperature (less than
30°C), and 200 ml of distilled water saturated with oxygen were added to
the flask with vigorous shaking for 30 minutes. Aliquots (5ml) of the
38
prepared emulsion were transferred to a series of tubes each containing
0.1ml of extract or tocopherol (2mg/ml). A control sample was prepared
exactly as before but without adding antioxidants. Each type of sample was
prepared in triplicate. The test systems were placed in a water bath at 50°C
for 2 hours. The absorbance of each sample was read
spectrophotometrically at 470 nm, immediately after sample preparation
and at 15-min intervals until the end (t = 120 min) of the experiment.
Antioxidant activities in β-carotene-linoleic acid model were measured by
the changes in the absorbance at 470 nm.
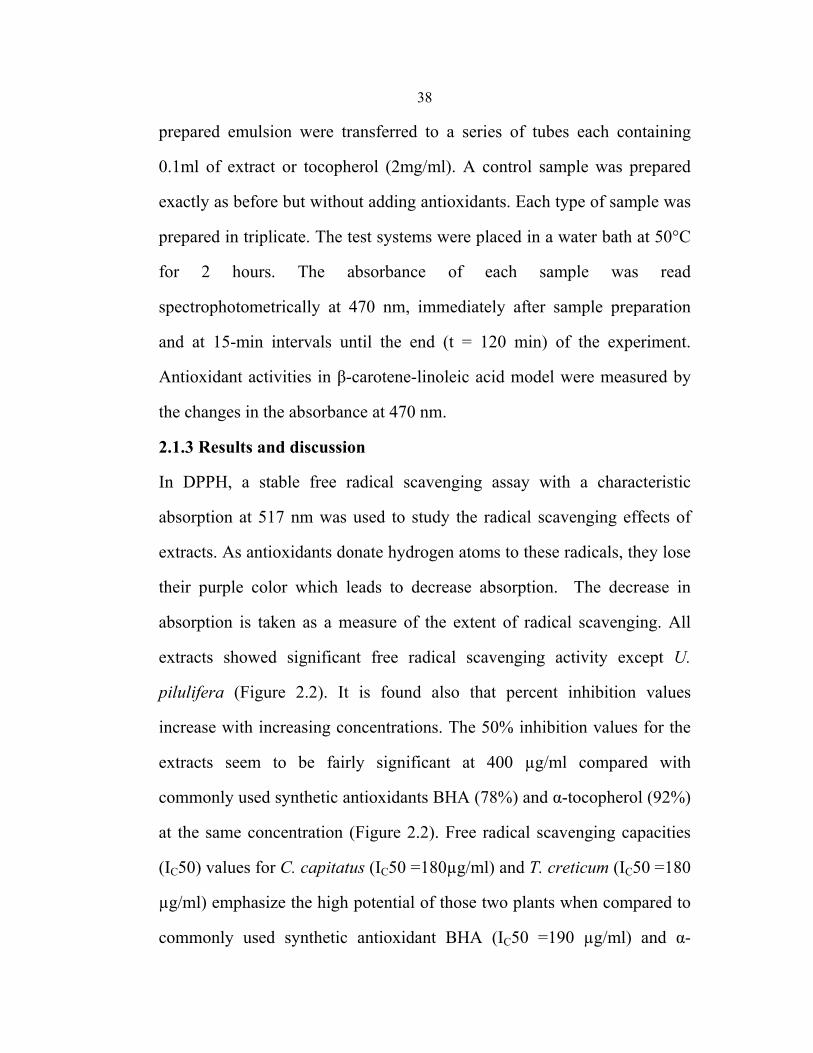
2.1.3 Results and discussion
In DPPH, a stable free radical scavenging assay with a characteristic
absorption at 517 nm was used to study the radical scavenging effects of
extracts. As antioxidants donate hydrogen atoms to these radicals, they lose
their purple color which leads to decrease absorption. The decrease in
absorption is taken as a measure of the extent of radical scavenging. All
extracts showed significant free radical scavenging activity except U.
pilulifera (Figure 2.2). It is found also that percent inhibition values
increase with increasing concentrations. The 50% inhibition values for the
extracts seem to be fairly significant at 400 µg/ml compared with
commonly used synthetic antioxidants BHA (78%) and α-tocopherol (92%)
at the same concentration (Figure 2.2). Free radical scavenging capacities
(IC50) values for C. capitatus (IC50 =180µg/ml) and T. creticum (IC50 =180
µg/ml) emphasize the high potential of those two plants when compared to
commonly used synthetic antioxidant BHA (IC50 =190 µg/ml) and α-

39
tocopherol (IC50 =80 µg/ml) (Figure 2.3). The 50% inhibition values for
the other plants are (M. syriaca =180 µg/ml), (A. palaestinum =380 µg/ml),
(T. polium =390 µg/ml), showed a desirable antioxidant activities except
(U. pilulifera =0.0µg/ml) that justify the usage of them in folk medicine.
% Inhibition of DPPH assay
0
10
20
30
40
50
60
70
80
90
100
0 200 400 600 800 1000
Concentration ug/ml
% In
hibi
tion
α-tocopherol
BHT
U. pilulifera
A. palaestinum
C. capitatus
M. syriaca
BHA
T. critecum
T. polium
(Figure: 2.2) Percent inhibition of selected plants at different concentrations

40
0 100 200 300 400
tocopherol
BHA
BHT
A. palaestinum
U. pilulifera
C. capitatus
M. syriaca
T. critecum
T. polium
IC50 µg/ml
(Figure: 2.3) Free radical scavenging capacities IC50of ethanolic extracts
Heat-induced oxidation of an aqueous emulsion system of β-carotene-
linoleic acid was employed as another antioxidant test reaction. The test is
based on the fact that β-carotene loses its color in the absence of
antioxidant [17]. During oxidation, an atom of hydrogen is abstracted from
the active methylene group of linoleic acid located on carbon-11 between
two double bonds [18]. The pentadienyl free radical so formed then attacks
highly unsaturated β-carotene molecules in an effort to reacquire a
hydrogen atom. As the β-carotene molecules lose their conjugation, the
carotenoids lose their characteristic orange color. This process can be
monitored spectrophotometrically (Figure 2.4).

41
B-carotene
COOH12
35
6
7
48
9
1012
13
14
15
16
17
18
H
11 Lenoleic acid
(Figure: 2.4) Structural formulas of β-carotene and linoleic acid
All ethanolic extracts of the selected plants revealed higher antioxidant
efficiency compared with water (control) and the synthetic antioxidant α-
tocopherol which gave the highest β-carotene color degradation (i.e. least
antioxidant efficiency). U. pilulifera is the most efficient extract of them
which is justified by the presence of 2-phenoxyethanol as one of the
constituents of the plant. The compound gave the least β-carotene
discoloration (i.e. highest antioxidant efficiency). The second extract is for
C. capitatus, and the third is for A. palaestinum (Figure 2.5). The
efficiency of those plants as antioxidants may be attributed to the presence
of many different chemical compounds such as phenolics and flavonoids.
The total phenolic amounts were calculated using pyrocatechol equivalent
and total flavonoids were calculated using quercetin equivalent (see chapter
3). The presence of phenolic antioxidant can hinder the extent of β-
carotene degradation by "neutralizing" the linoleate free radical and any
other free radicals formed within the system. Hence, this forms the basis by
which plant extracts can be screened for their antioxidant potential. In
conclusion, the present study indicated that the use of these plants in
Palestine either in traditional medicine or as edible plants is justified since
they are promising sources of natural antioxidants.

42
β- Carotene Assay
0.4
0.5
0.6
0.7
0.8
0.9
1
1.1
1.2
1.3
1.4
0 15 30 45 60 75 90 105 120Time( min)
Abs
orba
nce
water
C. capitatus
U. pilulifera
Tocopherol
A. palaestinum
T. critecum
T. polium
M. syriaca
(Figure: 2.5) Antioxidant activities of ethanolic extracts of the plants (A. palaestinum, U. pilulifera, C. capitatus, M. syriaca, T. creticum, T. polium), and α-tocopherol, as assessed by β-carotene-linoleic acid assay over 120 minute.
2.2 Antimicrobial activity of selected plants in Palestine
2.2.1 Introduction
43
The development of natural products used as medicines represents a way to
rescue valuable aspects of traditional culture. Despite their unproven safety,
some plant products are used as drugs or food supplements and they are
sold without prescription. Natural phytochemicals derived from fruits,
vegetables and herbs have been reported to posses a wide range of biological
effects including antioxidant, antimicrobial and ant-inflammatory actions [19].
There are more than 35000 plant species being used in various cultures around
the world for medicinal purpose [20, 21]. A wide range of medicinal plant
parts are extracted and used as raw drugs and they possess varied medicinal
properties. The different parts used include root, stem, flower, fruit, twigs
exudates and modified plant. While some of these raw drugs are collected
in smaller quantities by the local communities and folk healers for local
use, many other raw drugs are collected in larger quantities and traded in
the market as the raw material for many herbal industries [22]. Although
hundreds of plant species have been tested for antimicrobial properties, the
vast majority of them have not been adequately evaluated [23]. Considering
the vast potentiality of plants as sources for antimicrobial drugs with
reference to antibacterial and antifungal agents, the present work is a
systematic investigation was undertaken to screen six medicinal plants used
in traditional medicine in Palestine.
The use of medicinal herbs in the treatment of skin diseases including mycotic
infections is an old-age practice in many parts of the world. Fungal infections
remain a therapeutic problem despite the availability of a number of treatments.
Being largely synthetic and non-biodegradable, these agents used in treating

44
fungal infections can cause adverse effects and may have residual toxicity [24].
In Palestine, the screening of flora for pharmacological active compounds
started in the late sixties [25]. The literature review and ethanobotanical surveys
revealed that there is a list of 47 plant species used for treatment of skin diseases
suggestive of dermatophyte infections [26]. Few studies of antifungal activity
of those plants were performed. The oil of nettle showed a potent and
completely inhibitory effect on the radial growth of A. alternate at 1500
ppm [27]. C. capitatus is an aromatic plant found in Palestine and locally
known under the common name (zaatar). It is used in folk medicine against
cold, influenza, throat infection [28] and also is important for the perfume,
cosmetics, flavoring and pharmaceutical industries [29] .The essential oils
of the plant were reported to have antimicrobial activities most of which
are mediated by thymol and carvacrol [30]. Various species of thyme have
been credited with a long list of pharmacological properties. They have
been used in folk medicine as antiseptic and as antimicrobial agents [31].
There are no reported studies on antifungal activity of C. capitatus and M.
syriaca in special case, but there are reports on the antifungal activities of
the essential oils for other thymus species and their main components
against soil-borne pathogens, food storage fungi, pathogens and
opportunistic human pathogens [32]. T. polium is a medicinal plant which
has been used for over 2000 years in traditional medicine due to its
diuretic, diaphoretic, tonic, antipyretic and antispasmodic properties. Many
bioinvestigations were done on the plant, but none of those on the
antifungal activity of the plant [33]. Unlike bacterial diseases, fungal

45
diseases are more difficult to treat. Often topical and oral treatments are
long term and may only be partially successful in controlling the fungus, if
they work at all. Many infections will be chronic and if you are fortunate
enough to rid the infection from your body, there is always the possibility
of recurrence of the disease. This is why there is a difficulty in treating
fungal diseases. Many serious bacterial diseases have been successfully
treated and usually without side affects from the drugs used. This usually is
not the case with treatment of fungal diseases.
Natural products including plants, animals and minerals have been the basis
of treatment of human diseases. Traditional medical traditions can offer a
more holistic approach to drug design and myriad possible targets for
scientific analysis. For traditional medicines, newer guidelines of
standardization, manufacture and quality control and scientifically rigorous
research on the scientific basis for traditional treatments will be required.
Numerous drugs have entered the international pharmacopoeia via the
study of ethno pharmacology and traditional medicine. Even during the
early part of this century, plants were a vital source of raw material for
medicines.
2.2.2 Materials and methods
1. Chemicals: chloramphenicol, peptone, agar, dextrose, ethanol, Muller–
Hinton agar, gentamicin, ampicilline and econazole, all chemicals and
reagents were of analytical grade.
2. Extracts preparation

46
The aerial parts of the plants were dried in the shadow at 30°C and grinded
using a Molenix (Mooele Depose type 241) for a minute. 50g sample from
each dried plant was extracted by continuous stirring with 500 ml ethanol
at 24°C for 72 h and filtering through Whatman No. 4 filter paper. The
residue was then washed with additional 200 ml ethanol. The combined
ethanolic extracts were dried using freeze drying and stored at -20 °C for
further use.
3. Microorganisms
Bacteria:
The bacteria used included: Staphylococcus aureus (ATCC 25923),
Escherichia coli (ATCC 25922), Klebsiella pneumoniae (ATCC 13883),
Proteus vulgaris (ATCC 13315), Pseudomonas aeruginosa (ATCC 27853)
and Escherichia coli (JM109).
Fungi:
While the fungi used in this study were T. tonsurans, M. canis, T. rubrum and
T. violaceum. The isolates have been maintained on SDA media at room
temperature. Experimental cultures were kept on SDA media and
subculture monthly (Murray et al., 1995; Yaghmour, 1997).
4. Antibacterial testing
The dried plant extracts were dissolved in ethanol to a final concentration
of 100 mg/ml and sterilized by filtration through a 0.45 mm membrane
filter. Antibacterial tests were then carried out by the disc diffusion method
(Murray et al., 1995) using an inoculum containing 106 bacterial cells/ml
spread on Muller–Hinton agar plates (1 ml inoculum/plate). The discs

47
(diameter= 6 mm) were impregnated with 2 ml of extract (10 mg/disc) at a
concentration of 100 mg/ml and placed on the inoculated agar and
incubated at 37°C for 24 h.
5. Antifungal testing:
The plants extracts were tested at different concentrations for their
antifungal activity against the test pathogens using a modified poisoned
food technique. Different amounts of each extract were incorporated in pre-
sterilized SDA medium to prepare a series of concentrations of the extract
(12.5, 25, 37.5, 50, 62.5 µg/ml). A mycelial agar disk of 5 mm diameter
was cut out of 12 days old culture of the test fungus and inoculated on to
the freshly prepared agar plates. In controls, sterile distilled water was used
in place of the tested sample. Three replicate plates were used for each
treatment (concentration).The inoculated plates were incubated in the dark
at 24˚C and the observations were recorded after 10 days. Percentage of
mycelial inhibition was calculated using the following formula:
% mycelial inhibition = (dc-ds/dc) x100%
dc: colony diameter of the control
ds: colony diameter of the sample
2.2.3 Results and discussion
a- Antibacterial activity
Six selected plants in Palestine used in folk medicine were tested in vitro
against six bacterial species which are known to cause dermic and mucosal
infections. Table 2.1 shows the effect of extracts on six kinds of bacteria at
200 µg/ml concentration. The best between the plants was M. syriaca

48
extract, and C. capitatus. They showed significant antibacterial activity
against all kinds of tested bacteria. E. coli was the most type of bacteria
that by affected by C. capitatus extract. The inhibition zone for was (37.8
mm) and K. pneumoniae was the most type affected by M. syriaca,
inhibition zone (31.0 mm) compared to the control (6 mm) in diameter.
(Table: 2.1) Antimicrobial activity of plant extracts against bacteria
* Values of inhibition zone diameter in mm
b- Antifungal activity
Only a few antifungal substances are known or available in the market as
compared to antibacterial substances. Antimycotic substances are also
relatively unsatisfactory in the control of dermatophytes. The discovery of
active components exhibiting a broad spectrum antifungal activity may
prove useful for the development of antifungal agents. Laboratory
assessment showed the nature of fungi static activity encountered in plant
extracts. Table 2.2 shows cross tabulation means of percent inhibition due
to plant type and concentration level. The values of the means increase with
increasing concentration of each plant. (Table: 2.2) Cross tabulation means of percent inhibition due to plant type and concentration level. Plant Type Concentration Mean Std. Error 95% Confidence Interval
No Plant extracts (concentration)
Micro-organisms P. vulgaris E. coli.
JM109 E. coli P.
aerugino-sa
Staphylococcus aureus
K. pneumoniae
1 A. palaestinum * 6.0 6.0 6.0 6.0 8.8± 0.7 6.0 2 U. pilulifera 6.0 6.0 6.0 6.0 6.0 6.0 3 C. capitatus 11.8± 0.8 13.0±0.6 19.4±1.5 20.8±0.8 22.0±0.8 31.0±0.6 4 M. syriaca 33.75±0.8 16.5±0.5 37.8±1.4 22.6±0.8 29.0±0.6 33.6±1.0 5 T. creticum 6.0 6.0 6.0 6.0 6.0 6.0 6 T. polium 6.0 6.0 6.0 6.0 6.0 10.2± 1.37 control 6.0 6.0 6.0 6.0 6.0 6.0

49Level Lower Bound Upper Bound
A. Palaestinum 12.5 28.000 4.980 18.106 37.894 25.0 46.875 4.980 36.981 56.769 37.5 66.000 4.980 56.106 75.894 50.0 89.625 4.980 79.731 99.519 62.5 100.000 4.980 90.106 109.894
U. Pilulifera 12.5 28.225 4.980 18.331 38.119 25.0 66.875 4.980 56.981 76.769 37.5 82.225 4.980 72.331 92.119 50.0 95.475 4.980 85.581 105.369 62.5 100.000 4.980 90.106 109.894
C. capitatus 12.5 71.550 4.980 61.656 81.444 25.0 90.325 4.980 80.431 100.219 37.5 100.000 4.980 90.106 109.894 50.0 100.000 4.980 90.106 109.894 62.5 100.000 4.980 90.106 109.894
M. syriaca 12.5 45.800 4.980 35.906 55.694 25.0 72.550 4.980 62.656 82.444 37.5 92.300 4.980 82.406 102.194 50.0 100.000 4.980 90.106 109.894 62.5 100.000 4.980 90.106 109.894
T. creticum 12.5 18.125 4.980 8.231 28.019 25.0 43.625 4.980 33.731 53.519 37.5 70.200 4.980 60.306 80.094 50.0 87.125 4.980 77.231 97.019 62.5 100.000 4.980 90.106 109.894
T. polium 12.5 48.525 4.980 38.631 58.419 25.0 72.200 4.980 62.306 82.094 37.5 90.300 4.980 80.406 100.194 50.0 98.150 4.980 88.256 108.044 62.5 100.000 4.980 90.106 109.894
All tested plants revealed antimycotic activity against all tested fungi, with
C. capitatus extract showing the highest activity. Complete inhibition range
for this plant was 12.5-25 µg/ml which is nearly 1/5 activity of econazole
against T. violaceum, 1/6 and 1/7 of the activity for other tested fungi. M.
syriaca extract have also showed considerable antimycotic activity against
the same tested fungi (Table 2.3). This result is consistent with the value of
those obtained by Sokovic, (2009) who also demonstrated significant
antimicotic activity of two thymus spp. against T. violaceum. They showed
complete inhibition range (0.25-1 µl/ml). Comparing the previous data with

50
the chemical composition of the oils, it becomes evident that there is a
relationship between the high activities of the thyme species and the
presence of phenol components, such as thymol and carvacrol. In addition
to these plants A. palaestinum showed significant activity against T.
tonsurans, complete inhibition range is (37.5 - 50 µg/ml). From those
results we can suggest that plant extracts investigated here could find
practical application in the introduction of highly active and safe fungi
toxicants in addition to the limited commercial antifungal drugs.
(Table: 2.3) Complete inhibition range of the plant extracts Concentration range of µg/ml
plant Fungi T. tonsurans M. canis T. rubrum T. violaceum
Arum palaestinum 37.5-50 50-62.5 50-62.5 50-62.5 Urtica pilulifera 50-62.5 50-62.5 50-62.5 37.5-50 Coridothymus capitatus
37.5-50 25-37.5 25-37.5 12.5-25
Majorana syriaca 37.5-50 37.5-50 37.5-50 25-37.5 Teucrium creticum 50-62.5 50-62.5 50-62.5 37.5-50 Teucrium polium 50-62.5 50-62.5 37.5-50 37.5-50 Econazole 2.5-5 2.5-5 2.5-5 2.5-5
Two ways ANOVA carried out on percent inhibition data showed a
significant (P ≤ 0.05) effect for plant type and concentration on the percent
inhibition. Results of Duncan Post Hoc test (Tables 2.5a, 2.5b) carried out
on the same data showed that there is no significant (P ≤ 0.05) effect
between the plants in the same subset. (Table: 2.4) Two way ANOVA analysis of percent inhibition due to plant type and concentration level.
Source Type III Sum of Squares Df Mean Square F Sig.
Corrected Model 75281.837(a) 29 2595.925 26.164 .000

51
a R Squared = .894 (Adjusted R Squared = .860) (Table: 2.5a) Duncan Post Hoc tests of percent inhibition to determine the most homogeneous subsets of Plant Type in different concentration levels. Plant Type N Subset
1 2 3 4 T. creticum 20 63.815 A. palaestinum 20 66.100 U. pilulifera 20 74.560 T. polium 20 81.835 M. syriaca 20 82.130 C. capitatus 20 92.375 Sig. .470 1.000 .926 1.000
Means for groups in homogeneous subsets are displayed. Based on Type III Sum of Squares The error term is Mean Square(Error) = 99.217. a Uses Harmonic Mean Sample Size = 20.000. , b Alpha = .05. (Table: 2.5 b) Duncan Post Hoc tests of percent inhibition to determine the most homogeneous subsets of Concentration Level
Means for groups in homogeneous subsets are displayed. a Uses Harmonic Mean Sample Size = 24.000.
2.3 Anticancer activity of selected plants in Palestine
2.3.1 Introduction
Intercept 707834.881 1 707834.881 7134.208 .000
Plant Type 11689.171 5 2337.834 23.563 .000
Concentration 57550.949 4 14387.737 145.013 .000
Plant Type * Concentration 6041.717 20 302.086 3.045 .000
Error 8929.533 90 99.217
Total 792046.250 120
Corrected Total 84211.369 119
Concentration Level N Subset for alpha = .05 1 2 3 4 12.5 24 40.037 25.0 24 65.408 37.5 24 83.504 50.0 24 95.063 62.5 24 100.000 Sig. 1.000 1.000 1.000 .264

52
Cancer is a major health problem in the world. In many countries, cancer is
the second leading cause of death after heart disease. The estimated
worldwide incidence of different carcinomas is about 10 millions, half of
these in developed countries [34, 35]. Approximately five decades of
systemic drug discovery and development have established a respectable
accumulation of useful chemotherapeutic agents [36, 37], as well as a
number of important successes in the treatment and management of human
cancer [38]. Populations with a high level of natural herbal product use
have a reduced incidence of gastric cancer [39, 40], as exemplified by the
low incidence of colon cancer in Asian countries with a high consumption
of soybean products [41]. In the scientific literature numerous citations
reference epidemiological studies that support significant differences in the
occurrence of carcinoma between oriental and occidental populations [42,
43]. Soybeans are the major dietary source of saponins, which have been
suggested as possible anticarcinogens [44]. Increased consumption of
vegetables reduces the risk of colorectal cancer mortality [45]. From its
very beginnings almost half a century ago cancer chemotherapy has faced
dramatic problems. Lack of selectivity of conventional anticancer agents
which damage not only malignant but also normal cells, in particular blood
cells has made scientists aware of the need for more specifically selective
drugs [46]. Another drawback, which arose just after cancer chemotherapy
was started, was the appearance of drug-resistant cancer cells [47]. This in
turn justifies the interest in search of possible anticancer agents from the
flora of different countries, which are found in the market as "natural

53
products" [48]. Since there are no efficient synthetic drugs available in the
pharmacopeias. For this reason, there is a great interest in screening plants
used in traditional medicine. Various medicinal plant extracts claimed to be
effective as anticancer agents, have been used since ancient times. However,
often objective and scientific efficacy has not been shown [49]. Recently, the
ability of medicinal plant extracts to control the proliferation of prostate cancer
cells was reported [50, 51]. The extract of Cernilton pollen was found to be
highly active in inhibiting the growth of DU145 cells, a prostate cancer cell line.
One of the active constituents of this plant was later identified using HPLC as
cyclic hydroxamic acid [52]. Oenothein B was identified as the active compound
of Epilbium parvijlorum, a plant used for the treatment of prostate disorders,
inhibits 5-oc reductase , also the 5-α reductase which converts testosterone to the
more potent androgen, dihydroxytestosteron (DHT) in the prostate, was
identified as the molecular target for many plant extracts [53].
Aims of study
The current study reports a screening program of six selected medicinal plants in
Palestine, used in traditional medicine .Some of them have anticancer activity
against prostate cancer (PC3) human carcinoma and breast cancer MCF-7
human carcinoma. These plants include four families namely Araceae (A.
palaestinum), Urticaceae (U. pilulifera), Labiatae (C. capitatus, M. syriaca) and
Lamiaceae (T. polium, T. creticum).
2.3.2 Materials and methods

54
1- Chemicals: Trypsin, RPMI 1640 culture medium, fatal calf serum,
glutamine, amphotricine B, Hank’s balanced solution, Trypan blue solution,
penicillin and gentamicin. All other reagents are of analytical grade.
2- Types of cancer cell lines
There many different types of cancer known by the position of infection or
by the mechanism of action [57].
1- Breast cancer cell lines: MCF-7 human carcinoma .This test was done in
Jordan University.
2- Prostate cell line: The cell line under investigation was Prostate cell line:
resistant PC3 human carcinoma. The cell line was obtained from the
laboratory cell culture of Bir-Zeit University.
3- Cell culture
The cells were cultured in RPMI 1640 medium supplement with 10% heated
fetal bovine serum, 1% of 2 mM l-glutamine, 50 IU/ml penicillin, 50 µg/ml
amphotricine B. After checking for the absence of mycoplasms and bacteria,
cell grown at 35°C as monolayer confluent cells in RPMI 1640 medium
supplemented with 10% calf serum. To avoid cell membrane sensitization, no
antibiotics were used. For the assay, cells were washed three times with
phosphate buffer saline (PBS). PBS was decanted, cells detached with 0.025%
Trypsin – EDTA and RPMI 1640 medium was added to make up a volume of
10 ml. The cell suspension was centrifuged at 1000xg for 10 minutes and the
pellet was re-suspended in 10 ml medium to make a single cell suspension.
Viability of cells was determined by Trypan blue exclusion and it exceeds 96%
as counted in a haemocytometer. Stock cultures were duplicate weekly after

55
inoculation. The cell line was cultured in 6-well tissue culture plates (9.8 cm2)
and incubated at 35 °C in a humidified atmosphere containing 5% CO2. After 24
hours the cells were treated with extracts or pure compounds. 0.1 ml of each
extract or pure compound was diluted to a serial dilutions (500, 250, 125, 62.5
µg/ml).
2.3.3 Results and discussion
Laboratory experiments show the effect of the ethanolic extracts on breast
cancer cells (MCF-7). Table 2.6 shows the percent inhibition and percent
viability of each plant at different concentrations.
(Table: 2.6) Percent inhibition and percent viability of cancer cells for
tested plants
No. plant Conc. µg/ml Absorbance % inhibition %viability 1 A. palaestinum 62.5 0.52 -16 115
125 0.42 7 93 250 0.30 33 67 500 0.25 44 56
2 U. pilulifera 62.5 0.23 49 51 125 0.20 56 44 250 0.12 73 27 500 0.07 85 15
3 C.capitatus 62.5 0.36 20 80 125 0.13 71 29 250 0.11 76 24 500 0.09 80 20
4 M. syriaca 62.5 0.58 -29 128 125 0.56 -24 124 250 0.48 -7 106 500 0.26 42 58
5 T. polium 62.5 1.05 -80 200 125 1.08 -85 190 250 1.0 -71 180 500 0.97 -65 175
control 0.45 100
U. pilulifera showed the highest cytotoxicity plant against breast cancer,
85% of the cells are dead at the concentration of 500 µg/ml then C.
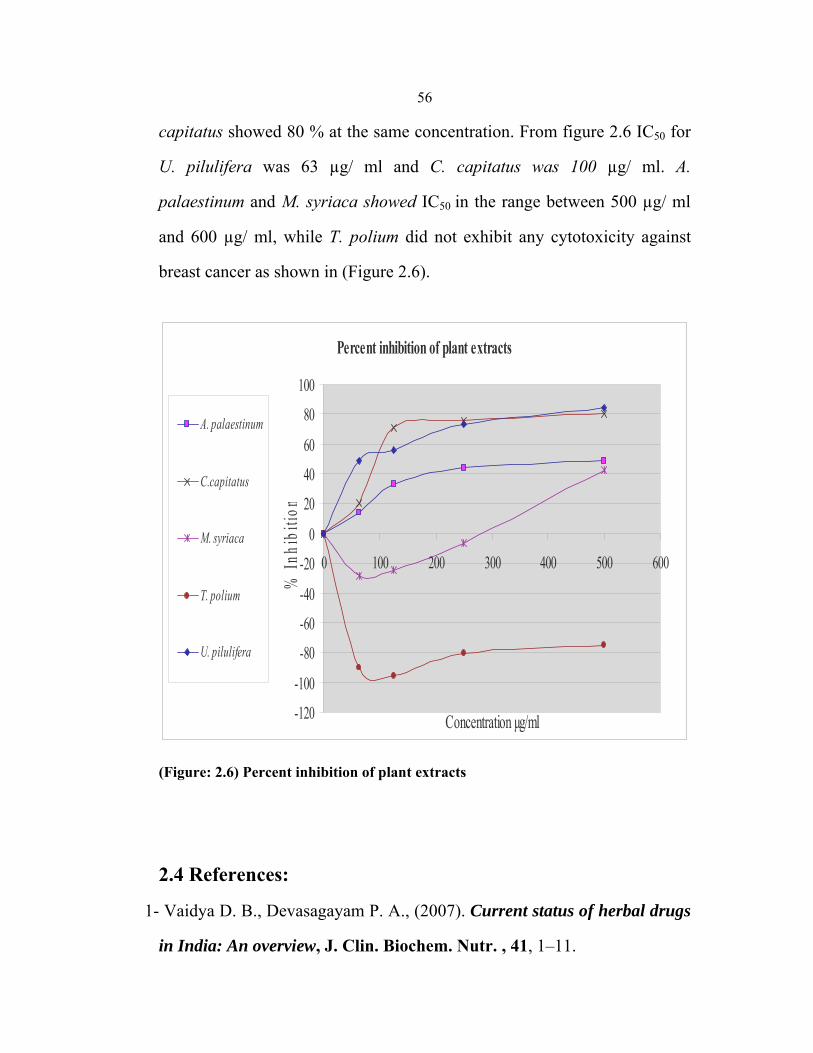
56
capitatus showed 80 % at the same concentration. From figure 2.6 IC50 for
U. pilulifera was 63 µg/ ml and C. capitatus was 100 µg/ ml. A.
palaestinum and M. syriaca showed IC50 in the range between 500 µg/ ml
and 600 µg/ ml, while T. polium did not exhibit any cytotoxicity against
breast cancer as shown in (Figure 2.6).
Percent inhibition of plant extracts
-120
-100
-80
-60
-40
-20
0
20
40
60
80
100
0 100 200 300 400 500 600
Concentration µg/ml
% In
hibi
tion
A. palaestinum
C.capitatus
M. syriaca
T. polium
U. pilulifera
(Figure: 2.6) Percent inhibition of plant extracts
2.4 References:
1- Vaidya D. B., Devasagayam P. A., (2007). Current status of herbal drugs
in India: An overview, J. Clin. Biochem. Nutr. , 41, 1–11.

57
2- Ranjbar A., Khorami S., Safarabadi M., Shahmoradi A. , Malekirad A.
Vakilian K., Mandegary A. , Abdolla M. (2006). Antioxidant activity of
Iranian Echium amoenum Fisch & C. A. Mey flower decoction in
humans: a cross sectional before / after clinical trial, eCAM , 3(4), 469-
473.
3- Ruiz-Terán F. , Medrano-Martínez A., Navarro-Ocaña A. (2008).
Antioxidant and free radical scavenging activities of plant extracts used
in traditional medicine, Mexico African Journal of Biotech. , 7 (12),
1886-1893.
4- Sies H., (1996). Antioxidants in Disease, Mechanisms and Therapy,
New York: Academic Press.
5- Kelly S. A., Havrilla C. M., Brady T. C., Abramo K. H., Levin E. D.
(1998). Oxidative stress in toxicology: established mammalian and
emerging Piscine Model systems, Env. Hlth. Persp, 106, 375–384.
6- Devasagayam T. P., Tilak J. C. , Boloor K. K., Sane K. S., Ghaskadbi S.
S., Lele R. D. (2004). Free radicals and antioxidants in human health:
Current status and future prospects, J. Assoc. Physicians India, 52, 794–
804.
7- Knight J. A. (2000). Review: Free radicals, antioxidants, and the
immune system, Ann. Clin. Lab. Sci., 30, 145–158.
8- De La Fuente M. , Victor V. M. (2007) . Antioxidants as modulators
status of herbal drugs in India, J. Clin. Biochem. Nutr. , 41(1), 1–11.
58
9- Perry E. K., Pickering A. T., Wang W. W., Houghton P. J., Perru N. S.
(1999). Medicinal plants and alzheimer’s disease: from ethnobotany to
phytotherapy, J. Pharm. Pharmacol., 51, 527-534.
10- Lin C. C., Huang P. C. (2002). Antioxidant and hepatoprotective
effects of acanthopanax senticosus, Phytother. Res., 14, 489-494
11- Ali-Shatyeh M. S., Jamous R. M. (2008). Traditional Arabic
Palestinian Herbal Medicine. Til, Nablus: Biodiversity &Environmental
Research Center.
12- Shahidi F. (2008). Antioxidants: Extraction, identification, application
and efficacy measurement, EJEAF Che., 7(8), 3325-3330.
13- Shahidi F., Ho C.T. (2007). Antioxidants measurement and
applications, American Chem. Soci., Symposium series ,956, 2-7.
14- Burits M., Bucar F. (2000). Antioxidant activity of Nigella sativa
essential oil. Phytother. Res., 14, 323–328.
15- Cuendet M., Hostettmann K., Potterat O. (1997). Iridoid glucosides with
free radical scavenging properties from Fagraea blumei, Helv. Chem.
Ac., 80, 1144-1152.
16- Gazzani G. A. ,Papetti G. M., Daglia M. (1998). Antioxidant and
prooxidant activity of water soluble components of some common diet
vegetables and the effect of thermal treatment, J. Agric. Food Chem., 46,
4118-22.
17- Miller H. E. (1971). A simplified method for the evaluation of
antioxidants, J. Am. Oil Chem. Soc. ,48 , 92-97.

59
18- Frankel E. N. (1998). Hydroperoxide formation. In Lipid oxidation.
Dundee:The Oily Press. (23-41)
19- Hussin N. M. , Muse R., Ahmad S. , Ramli J., Mahmood M. (2009).
Antifungal activity of extracts and phenolic compounds from
Barringtonia racemmosa L. (Lecythidaceace), African Journal of
biotechnology, 8(12), 2835-2842.
20 –Koshy P., Nurestri A., Wirakaranain S., Sim K., Saravana K.(2009).
Antimicrobial activity of some medicinal plants from Malaysia, Am. J.
Appl. Sci., 6 (8), 1613-1617.
21- Martinez-Valverde I., Periago M. J., Provan G., Chesson A. (2002).
Phenolic compounds, lycopene and antioxidant activity in commercial
varieties of tomato (Lycopersicum esculentum), J. Sci. Food Agr. , 82,
323–330;
22- El-Desouky S. K., Kim Ki Hun , Ryu Shi Young, Eweas A. F., Gamal –
Eldeen A. M. (2007) A new pyrrol alkaloide isolated from Arum
Palaestinum Boiss and its biological activities, Arch. Pharm. Res. , 30,
927-931.
23- Ali-Shtayeh M. S., Yaniv Z. , Mahajna J. (2000). Ethanobotinical
survey in the Palestinian area: Aclassification of the healing potential of
medicinal plants, J. Ethanopharmacol. ,73, 221-232.
24- Soković D., Vukojević J., Marin P., Brkić D., Vajs V. (2009). Chemical
composition of essential oils of thymus and mentha species and their
antifungal activities, Molecules, 14, 238-249

60
25- Silva F., Abraham A. (1981). The potentiality of the Israeli flora for
medicinal purposes, Fitoterapia, 52, 195-200.
26- Ali-Shtayeh M. S., Yaghmour R. M., Faidi Y. R., Salem Kh. , Al-Nuri
M. A. (1998). Antimicrobial activity of twenty plants used in Folkloric
Medicine in Palestinian area, Journal of Ethnopharma, 60, 265-271.
27 - Irshaid F., Mansi K. (2009). Effects of leaf extract of Artica Pilulifera
on male reproductive system of streptozotocin-diabetic rats, American J.
Pharma. Toxic., 4, 22-28.
28- Hadizadeh I., Peivastegan B., Hamzehzarghani H. (2009). Antifungal
activity of essential oils from some medicinal plants of Iran against
Alternaria alternate, Am. J. Appl. sci., 6, 857-861.
29- Ali-Shtayeh M. S., Jamous R. M, Al-Shafie J. H., Elgharabah W. A.
(2008) Traditional knowledge of wild edible plants used in Palestine
(Northern West Bank): A comparative study, J. Ethnobio. Ethnomed.,
4,13.
30- Bhaskara M. V., Angers P., Gosseline A., Arul J. (1998).
Characterization and use of essential oil from Thymus vulgaris against
Botrytis cinerea and Rhizopus stolonnifer in strawberry fruits,
Phytochem., 47, 1515- 1520.
31- Tabata M., Honda G., Sezik E. (1988). A report on traditional
medicine and medicinal plants in Turkey. Faculty of harmaceutical
ciences, Kyoto University.
32- Derwich E., Benziane Z., Taouil R., Senhaji O. ,Touzani M. (2010).
Comparative Essential oil Composition of Leaves of Mentha rotundifolia

61
and Mentha pulegium, a Traditional Herbal Medicine in Morocco, Amn-
Euras. J. Sust. Agric., 4(1), 47-54.
33- Ljubuncic P., Dakwar S., Portnaya I., Cogan U., Azaizeh H., Bomazen A.
(2006). Aqueous extract of Teucrium polium possess remarkable
antioxidant activity in vetro, eCAM, 3(3), 329-338.
34- Abu-Dahab R. , Afifi, F. (2007). Antiproliferative activity of selected
medicinal plants of Jordan against breast adenocarcinoma cell line
(MCF7), Scientia Pharmaceutica. (Sci. Pharm.) ,75, 121-136.
35- Figueroa-Hernández1 J. L., Sandoval González1 G., Jayme Ascencio V.,
Figueroa-Espitia J. L. , Fernández Saavedra G. (2005). Plant products with
anti-cancer properties employed in the treatment of Bowel Cancer:
Literature review 1985 and 2004, Proc. West. Pharmacol. Soc., 48, 77-83
36- Dennis R.A. , Darocha A. B. , Schwartsmann G. (2000). Anti-Cancer
drug discovery and development in Brazil: Targeted plant collection as a
rational strategy to acquire candidate anti-cancer compounds, The
Oncologist , 5, 185-189
37- Chabner B. A. (1991). Anti-cancer drugs, In: DeVita VT Jr, Hellman S,
Rosenberg AS,eds. Cancer, Principles and Practice, Philadelphia:
Lippincott, 325-417.
38- Jessup J. M., McGinnis L. S., Winchester D. P. (1996). Clinical
highlights from the National Cancer Database, CA Cancer J. Clin., 46,
185-187.

62
39- Frantz D. J., Hughes B. G., Nelson D. R., Murria B. K. Christensen
M. J. (2000). Cell cycle arrest and differential gene expression in HT-29
cells exposed to an aqueous garlic extract, Nutr. Cancer, 38(2), 255.
40- Deenehy C. E. ,Tsourounis C. Botánicos (“hierbas medicinales”) y
suplementos nutrimentales, (ed) Katzung, BG. (2002). Farmacología
básica y clínica. México, D.F.
41- Zhu Q., Meisinger J., Van Thiel D. H., Zhang Y. , Mobarhan S.
(2002). Effects of soybean extract on morphology and survival of Caco-2,
SW620, and HT-29 cells, Nutr. Cancer ,42, 131.
42- Hudson E. A., Dinh P. A., Kokubun T., Simmonds M. S., Gescher A.
(2000). Cancer Epidemiol. , Biomarkers Prev., 9(11) , 63.
43- Siergers C. P., Steffen B., Robke A., Pentz R. (1999). Phytomedicine
6(1), 7.
44- Oh Y. J. , Sung M. K. (2001). Soybean saponins inhibit cell
proliferation by suppressing PKC activation and induce differentiation of
HT-29 human colon adenocarcinoma cells, Nutr. Cancer, 39(1), 132
45- Rijken P. J., Timmer W.G., van de Kooij A. J., Van Benschop I. M.,
Wiseman S. A., Meijers M., Tijburg L.B. (1999). Carcinogenesis
20(12), 2267.
46-Pisha E., Chai H., Lee I. S., Chagwedera T. E., Farnsworth N. R.,
(1995). Discovery of betulinic acid as a selective inhibitor of human
melanoma that functions by induction of apoptosis, Nat. Med., 1, 1046-
1051

63
47- Gottesman M. M. (1993). How cancer cells evade chemotherapy:
sixteenth Richard and Hinda Rosenthal Foundation award lecture,
Cancer Res., 53, 747-754.
48- Madhuri S., Pandey G.,(2009). Some anticancer medicinal plants of
foreign origin, Current Sci., 96 (6), 779-783.
49- Bauer B. A. (2000). Mayo Clin. Proc. ,75 (8), 835.
50- Hryb D. J., Khan M., Romas N., Rosner W. (1995). The effect of
extracts of the roots of the stinging nettle (Jrtica dioicd) on the inter
action of SHBG with its receptor on human prostatic membranes,
Planta. Med., 61, 32.
51- Hiremath S., Badami S., Swamy H., Patil S., Londonkar R. (1997).
Anti-androgenic effect of Striga orobanchioides. Journal of
Ethnopharma., 56, 55-60.
52- Habib F., Ross M., Lewenstein A., Zhang X., Jaton J. (1995).
Identification of a prostate inhibitory substance in pollen extract,
Prostate, 26, 133-139.
53- Evans B., Griffiths K., Morton M. (1995). Inhibition of 5 alpha-
reductase in genital skin fibroblasts and prostate tissue bydietary lignans
and isoflavonoids, Journal of Ethnopharma., 747, 295-302.
54-Medscape (2000). Prostate cancer. WWW.CBSHealthWatch.com.
55- Barinaga M. (1997). From bench to bedside, Sci., 278, 1036-
1039.www.sciencemag.org.

64
56- Riss T., Moravec R. (1993). Comparison of MTT, XTT, and a novel
tetrazolium compound MTS for in vitro proliferation and
chemosensitivity assays, Biomedical Products, 1 8, 66-68.
57- Beljanski M. (2000). The anticancer agent PB-l00, selectively on
malignant cells, inhibits multiplication of sixteen active
malignant cell lines, even multidrug resistant, Genetics and
Molecular Biology, 23, 1, 29-33.

65
Chapter Three
Phytochemistry

66
3.1 Introduction
Phenols and polyphenols, existing ubiquitously in nature, are commonly
used as food additives and folk medicine in many countries. Interest in
phenols and polyphenols has increased because many of them exhibit a
broad spectrum of biological activities including anti-inflammatory,
antiviral, antiatherogenic, antibacterial, as well as anticancer
effects[1].These activities are associated, to a great extent, to their
antioxidant properties, though different mechanisms may be involved.
Derivatives of hydroxybenzoic acids such as salicylic acid and phenyl
esters have been identified as one of the major active components of many
plants. It has been shown that the antioxidative activity of phenolic
compounds is determined by their molecular structure, and the position of
hydroxyl group [2, 3] for instance, the ability of the delocalization of
unpaired electrons to stabilize the formed radical after reaction with the
initiator radical will be influenced [4]. Previous studies by many research
groups demonstrated that the catechol moiety, with the 3, 4-dihydroxyl
configuration, is important for the free radical scavenging activity for this
type of phenolic compounds [5, 6]. Contrary to this, other studies suggest
that the structure is not required for the activity [7]. Thus, it is worthy to
compare the biological activities of four synthesized phenolic acid esters
with different hydroxyl positions on the benzoic acid moiety beginning
with the constituents separated from the selected medicinal plants as
starting materials. Phenolic compounds absorb in the UV region and the
most commonly used detector for HPLC is a variable-wavelength UV or

67
UV-vis detector [8, 9]. No single wavelength is ideal for monitoring all
classes of phenolics since they display absorbance maxima at different
wavelengths [10]. Most benzoic acid derivatives display their maxima at
246–262 nm, except for gallic acid and syringic acid which have absorption
maxima at 271 and 275 nm, respectively [11]. Hydroxycinnamic acids
absorb in two UV regions, one maximum being in the range of 225–235
nm and the other in the range of 290–330 nm [12]. At 320 nm, cinnamic
acid derivatives can be detected without any interference from benzoic acid
derivatives, which have a higher absorptivity at 254 nm. However,
detection at 280 nm is the best alternative for the determination of both
classes of phenolic compounds [13].
Objectives of study
1- Evaluate the amounts of phenolics and flavonoids in the ethanolic
extracts of the selected plants as micrograms equivalent to quercetin and
pyrocatechol.
2- Identify some of the constituents in plant’s extracts using HPLC.
3- Modify some of the constituents separated from those plants.
4- Determine the biological activity of the modified compounds.
3.2 Materials and methods
3.2.1 Identification of some constituents from the selected plants.
Sampling:
Diluted samples (10 µl) of the ethanolic extracts of each plant were injected
in the GC-MS spectrophotometer.

68
Apparatus:
The device “Perkin Elmer clarus 500 Gas chromatography” and “Perkin
Elmer clarus 560D mass spectrometer” were used in the analysis.
Conditions:
He gas, temperature of the injector = 280 ºC, carrier was 1ml/ min and total
flow was 60ml/min. Column was Elite – 5MS, 30 meter 0.25 µm df. Max
projection at temperature 360 ºC, and minimum bleed at 320 ºC.
The experiment was done as follows:
Temperature (ºC) Time (min.) Rate (10/min.)
60 (beginning) 15 10
110 5 10
200 5 10
280 5
A few compounds were identified by GC-MS as shown in (Table 3.1),
depending on the total ionic concentration values (TIC) and mass spectrum
for each, in addition to many compounds were detected but not identified.
(Table: 3.1) Compounds identified from the selected plants by GC-MS
No Plant name Compound Figure no.1 A. palaestinum diisobutyl phthalate 3.1a, 3.1b2 A. palaestinum Methyl 3-hydroxy benzoate 3.2a, 3.2b3 A. palaestinum Di-n-octyl phthalate 3.3a, 3.3b4 A. palaestinum 4H-pyran-4-one 2,3 dihydro-3,5-
dihydroxy -6-methyl3.4a, 3.4b
5 U. pilulifera 2-phenoxy ethanol 3.5a, 3.5b6 C. capitatus Thymol 3.6a, 3.6b7 M. syriaca Thymol 3.6a, 3.6b

69
(Figure: 3.1a) TIC values for diisobutyl phthalate

70
(Figure: 3.1 b) Mass spectrum of diisobutyl phthalate.

71
(Figure: 3.2 a) TIC values for Methyl 3-hydroxy benzoate
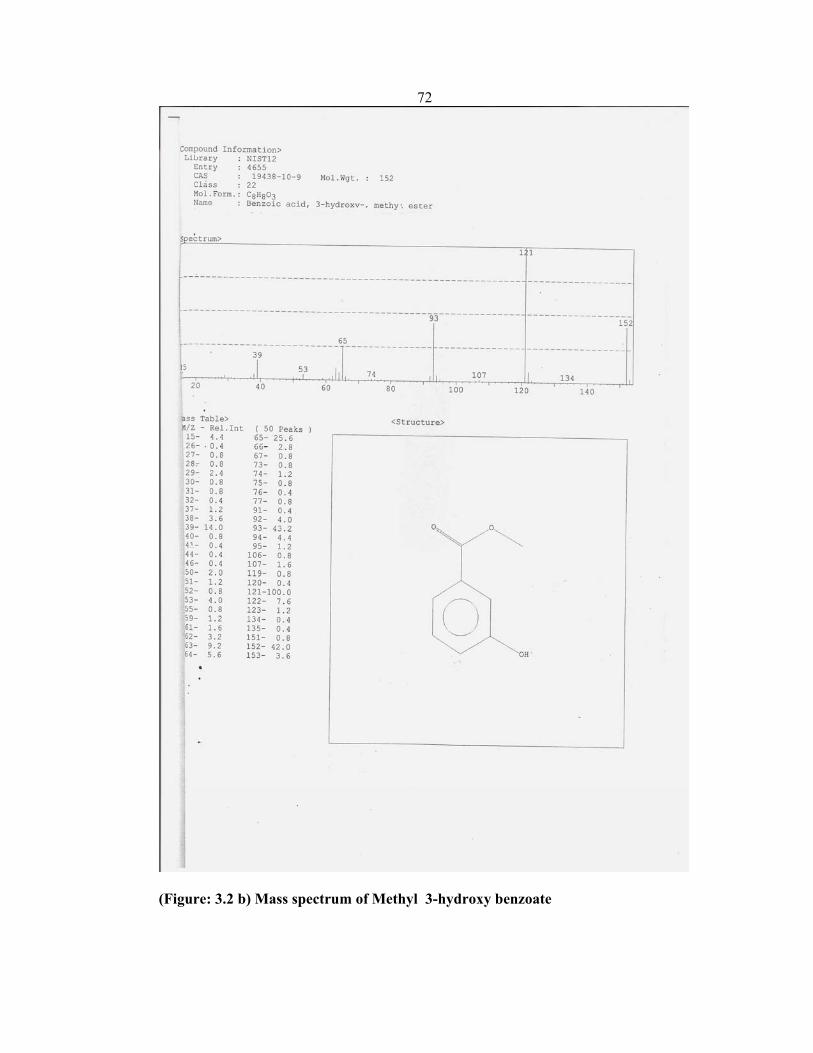
72
(Figure: 3.2 b) Mass spectrum of Methyl 3-hydroxy benzoate
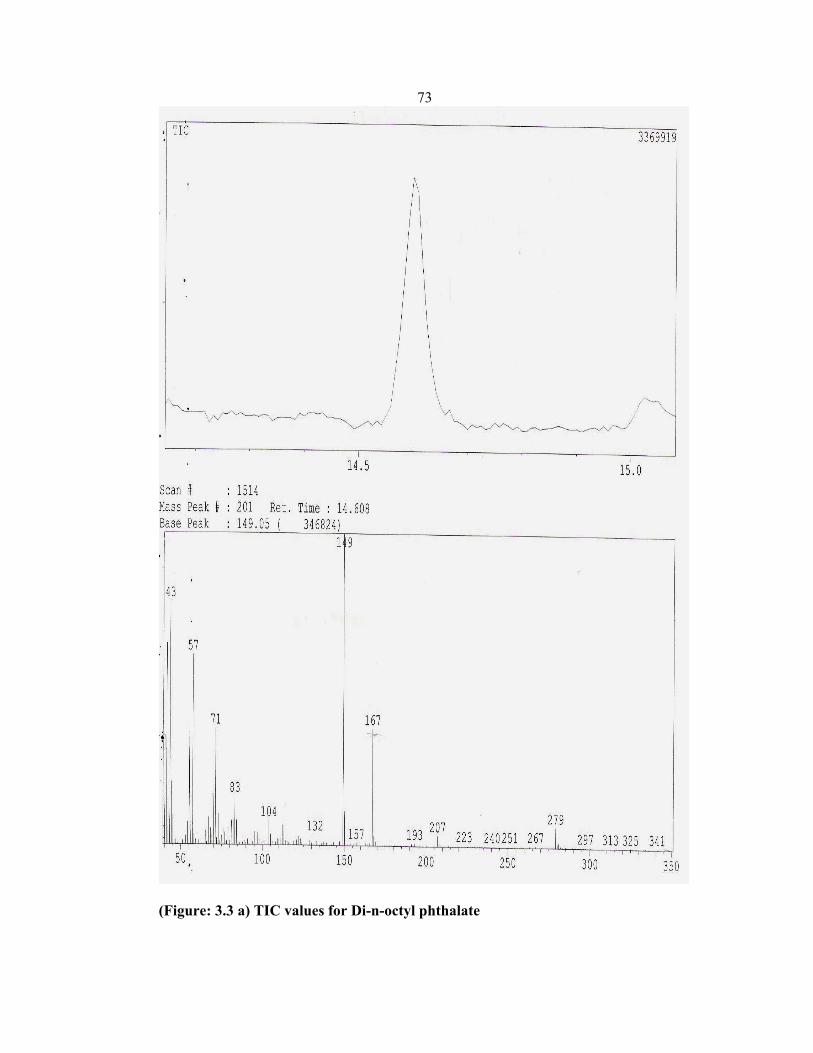
73
(Figure: 3.3 a) TIC values for Di-n-octyl phthalate

74
(Figure: 3.3 b) Mass spectrum of Di-n-octyl phthalate

75
(Figure: 3.4 a) TIC values for 4H-pyran-4-one 2, 3 dihydro-3, 5-dihydroxy -6-methyl
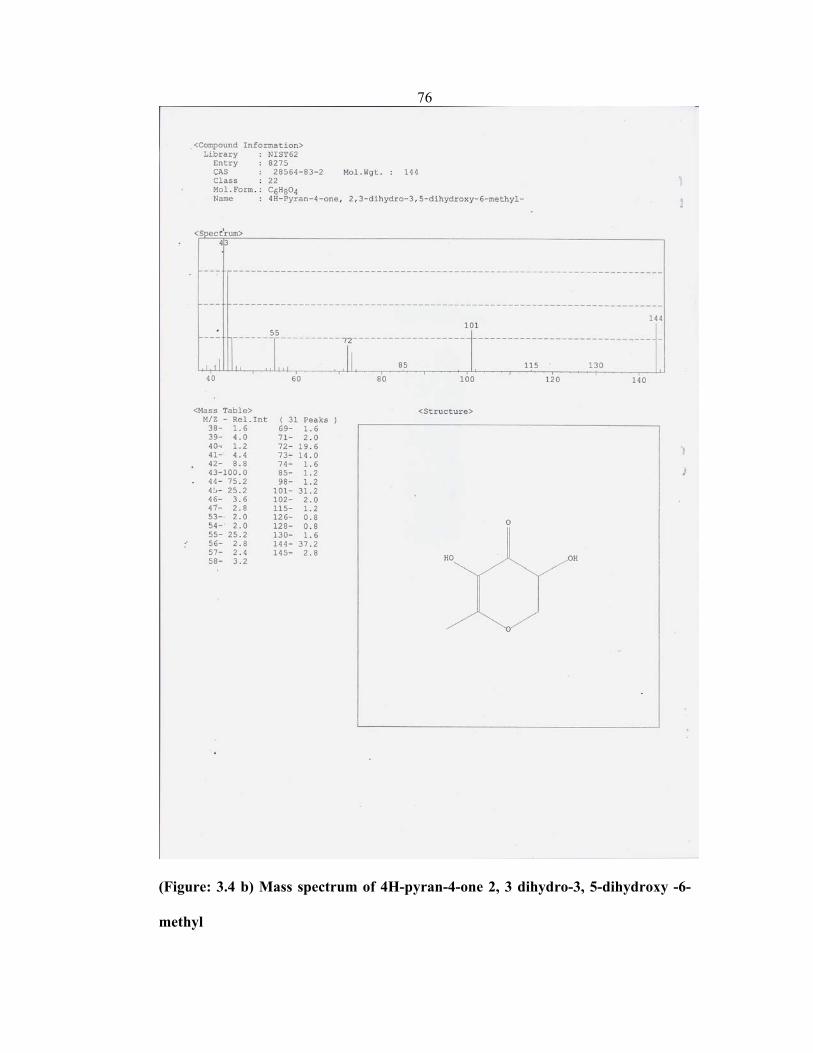
76
(Figure: 3.4 b) Mass spectrum of 4H-pyran-4-one 2, 3 dihydro-3, 5-dihydroxy -6-
methyl

77
(Figure: 3.5 a) TIC values for 2-Phenoxyethanol.
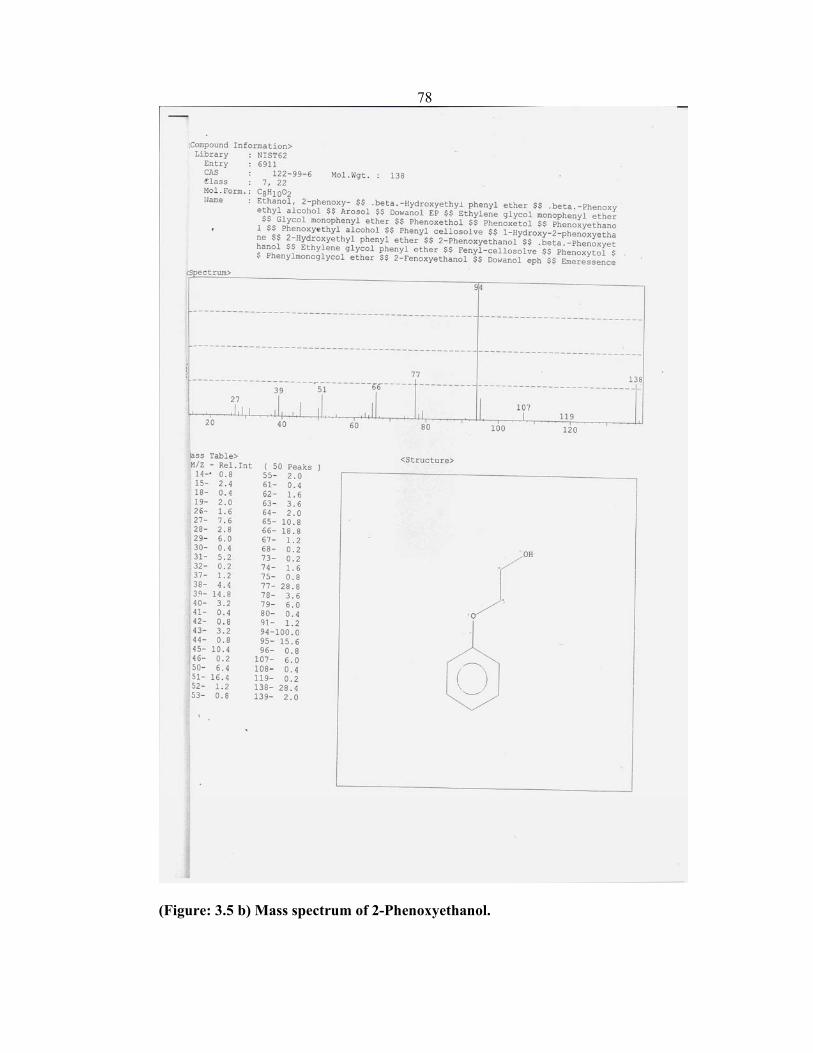
78
(Figure: 3.5 b) Mass spectrum of 2-Phenoxyethanol.

79
(Figure: 3.6 a) TIC values for Thymol

80
(Figure 3.6 b) Mass spectrum of Thymol
3.2.2 Determination of total phenolic compounds

81
Total soluble phenolics in the ethanolic extracts were determined with
Folin-Ciocalteu reagent according to the method of Slinkard using
pyrocatechol as a standard [14, 15]. Briefly, 1 ml from extract solution (2
mg/ml) was transferred into a volumetric flask of 50 ml, and made up to 46
ml with distilled water. Folin-Ciocalteu reagent (1 ml) was added and the
contents of flask were mixed thoroughly. After 3 min, 3 ml of 2% aqueous
solution of sodium carbonate (Na2CO3) was added, then the mixture was
allowed to stand for 2h with intermittent shaking. The absorbance was
measured at 760 nm (Figure 3.7). The concentration of total phenolic
compounds in the ethanolic extracts was determined as microgram of
pyrocatechol equivalent by using an equation that was obtained from
standard pyrocatechol calibration curve is given as:
Absorbance = 0.00 4757 µg pyrocatechol + 0.0022 (R2: 0.9997)
Pyrocatechol calibration Curve
y = 2.4757x + 0.0022
0
0.1
0.2
0.3
0.4
0.5
0.6
0 0.05 0.1 0.15 0.2 0.25Concentration(mg/ml)
Abs
orba
nce
(Figure: 3.7) standard pyrocatechol calibration graph
3.2.3 Determination of total flavonoid compounds

82
Flavonoid concentration was determined as follows: From each ethanolic
extract solution (1 milliter) was diluted with 4.3 ml of 80% aqueous ethanol
and to the test tubes were added 0.1 ml of 10% aluminum nitrate Al(NO3)3
and 0.1 ml of 1 M aqueous potassium acetate (CH3COOK). After 40 min at
room temperature, the absorbance was determined spectrophotometerically
at 415 nm (Figure 3.8) .Total flavonoid concentration was calculated using
quercetin as standard [16].
Absorbance = 0.005358 µg quercetin – 0.0984 (R2: 0.9994)
(Figure: 3.8) Standard quercetin graph.
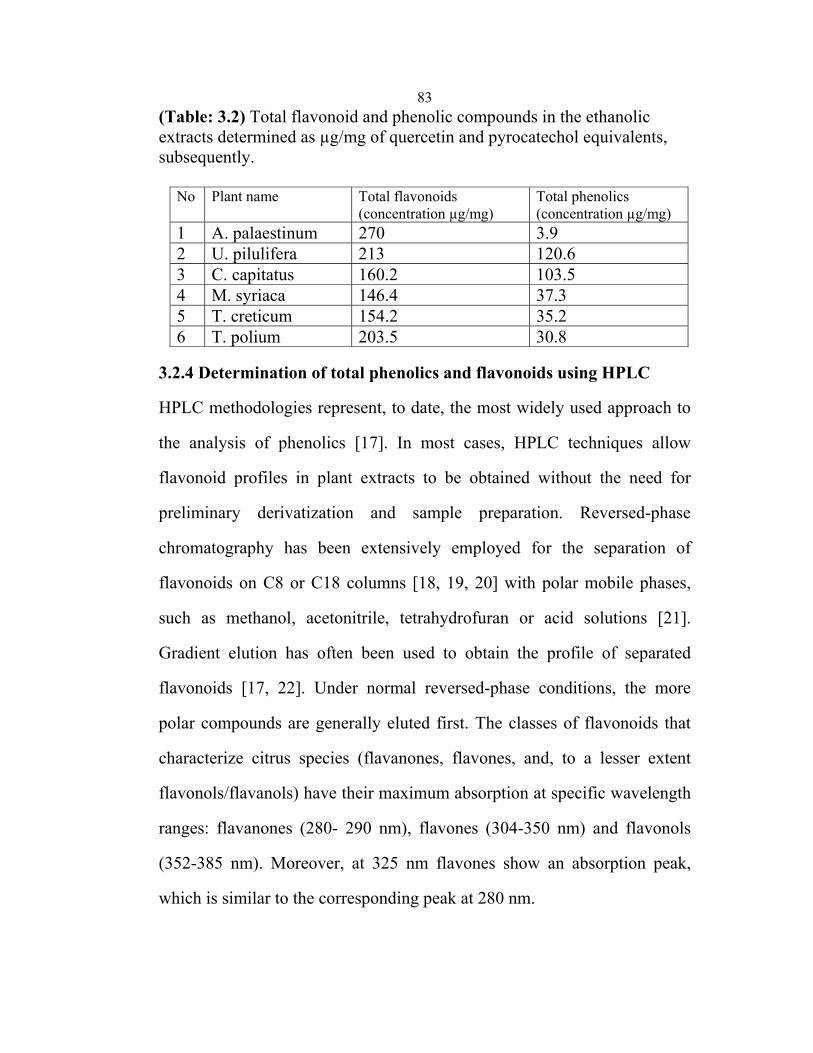
83(Table: 3.2) Total flavonoid and phenolic compounds in the ethanolic extracts determined as µg/mg of quercetin and pyrocatechol equivalents, subsequently.
No Plant name Total flavonoids (concentration µg/mg)
Total phenolics (concentration µg/mg)
1 A. palaestinum 270 3.9 2 U. pilulifera 213 120.6 3 C. capitatus 160.2 103.5 4 M. syriaca 146.4 37.3 5 T. creticum 154.2 35.2 6 T. polium 203.5 30.8
3.2.4 Determination of total phenolics and flavonoids using HPLC
HPLC methodologies represent, to date, the most widely used approach to
the analysis of phenolics [17]. In most cases, HPLC techniques allow
flavonoid profiles in plant extracts to be obtained without the need for
preliminary derivatization and sample preparation. Reversed-phase
chromatography has been extensively employed for the separation of
flavonoids on C8 or C18 columns [18, 19, 20] with polar mobile phases,
such as methanol, acetonitrile, tetrahydrofuran or acid solutions [21].
Gradient elution has often been used to obtain the profile of separated
flavonoids [17, 22]. Under normal reversed-phase conditions, the more
polar compounds are generally eluted first. The classes of flavonoids that
characterize citrus species (flavanones, flavones, and, to a lesser extent
flavonols/flavanols) have their maximum absorption at specific wavelength
ranges: flavanones (280- 290 nm), flavones (304-350 nm) and flavonols
(352-385 nm). Moreover, at 325 nm flavones show an absorption peak,
which is similar to the corresponding peak at 280 nm.

84
3.2.5 Identification of phenolic compounds and flavonoid compounds
using HPLC analysis
Plant extracts used in this study were tested for the presence of phenolic
compounds and flavonoids according to the retention time of calibration
curve standards (Table 3.3).
(Table:3.3) Phenolic compounds and flavonoids detected by HPLC
according to the Retention time
*Not determined
No Ret.
Time
(min)
Plants
A. palaestinum
U. pilulifera
C. capitatus
M. syriaca
T. creticum
T. polium
1 Benzoic acid 10.5 present
2 Salicylic acid 2.9 present present Present present
3 Cinnamic acid 18.8 present
4 Quercetin 22.8
5 Pyrocatechol 4.4 Present present
6 Diisobutyl
phthalate
3.5 present
7 Ascorbic acid *N.D
8 Resorcinol 3.1
9 Thymol 9.8 present Present
10 Phthalic acid 3.3 present present
11 Sorbic acid 1.8 present
12 2-Phenoxy
ethanol
21.1 present
13 Methyl 3-
hydroxy
benzoate
19

85
Apparatus and reagents
a- Liquid chromatography: Equipped with suitable injection device
(Shimadzu SPD-M 10AVP HPLC), solvent delivery system, UV detector,
electronic integrator and µBondapak C18 column, 300x3.9 (id) mm
waters/Millipore. Flow rate 2mL/min, injection volume 10 µL, detector
wavelength 254 nm, temperature ambient.* Mobile phase: 20% aqueous
CH3COOH (volume/ volume) buffered to pH 3.0 with saturated sodium
acetate solution.
b- Standard solutions: Fifty mg of each standard was dissolved in 5ml
ethanol and diluted to 100 ppm. The final solution was filtered through a
0.45 membrane filter.
c- Sample preparation: Fifty mg of each extract was dissolved in 5ml
ethanol and diluted to 100 ppm. The final solution was filtered through a
0.45 membrane filter.

86
1-A. palaestinum: 1 2 3 5 4 7 8 9 10 11 12 6
(Figure: 3.9) Chromatogram of A. palaestinum (Table: 3.4) Retention time of separated compounds from A. palaestinum
Peak No. Retention time (minute) Compounds Unknown 2.1 Unknown 2 2.3 Unknown 3 2.5 Unknown 4 2.9 Salicylic acid 5 3.3 Phthalic acid 6 3.5 Diisobutyl phthalate 7 5.5 Unknown 8 9 Unknown 9 10.6 Benzoic acid 10 13.3 Unknown 11 18.8 Cinnamic acid 12 23.4 Unknown

87
2- U. pilulifera
4
1
5 6 7 8
2 3
(Figure: 3.10) Chromatogram of U. pilulifera (Table: 3.5) Retention time of separated compounds from U. pilulifera
Peak No Retention time (minute) Compounds 1 2.1 Unknown 2 2.4 Unknown 3 2.6 Unknown 4 4.5 Pyrocatechol 5 5.5 Unknown 6 11 Unknown 7 19 Methyl 3-hydroxy benzoate 8 21 2-phenoxy ethanol

88
3- C. capitatus 1 9 10 2 3 4 5 6 7 8
(Figure: 3.11) Chromatogram of C. capitatus (Table: 3.6) Retention time of separated compounds from C. capitatus
Peak No Retention time (minute) Compounds 1 1.9 Unknown2 2.4 Unknown3 2.8 Salicylic acid 4 4.9 Unknown5 6.9 Unknown6 7.7 Unknown7 9.8 Thymol 8 11.4 Unknown9 12.3 Unknown10 13.9 Unknown

894- M. syriaca 1 6 2 3 7 11 4 10 5 8 9 (Figure: 3.12) Chromatogram of M. syriaca (Table: 3.7) Retention time of separated compounds from M. syriaca
5- T. creticum
Peak No. Retention time (minute) Compounds 1 2 Unknown2 2.3 Unknown3 2.6 Unknown4 2.8 Salicylic acid 5 4.8 Unknown6 6.8 Unknown7 7.7 Unknown8 9.8 Thymol 9 12.2 Unknown 10 13.3 Unknown11 14.3 Unknown

90 1 2 6 3 4 5 7 8 9
(Figure: 3.13) Chromatogram of T. creticum (Table: 3.8) Retention time of separated compounds from T. creticum
6-T. polium
Peak No. Retention time (minute) Compounds 1 1.9 Sorbic acid 2 2.1 Unknown 3 2.3 Unknown 4 2.5 Unknown 5 2.9 Salicylic acid 6 3.3 Phthalic acid 7 5.3 Unknown 8 8 Unknown 9 9.3 Unknown

91 3 1 8 7 2 5 6 4
(Figure: 3.14) Chromatogram of T. polium (Table: 3.9) Retention time of separated compounds from T. polium
3.2.6 Modification of some biologically active compounds
Peak No. Retention time (minute) Compounds 1 2 Unknown2 2.5 Unknown3 4.3 Pyrocatechol 4 5.4 Unknown5 6.9 Unknown6 12.4 Unknown7 14.8 Unknown8 16.2 Unknown
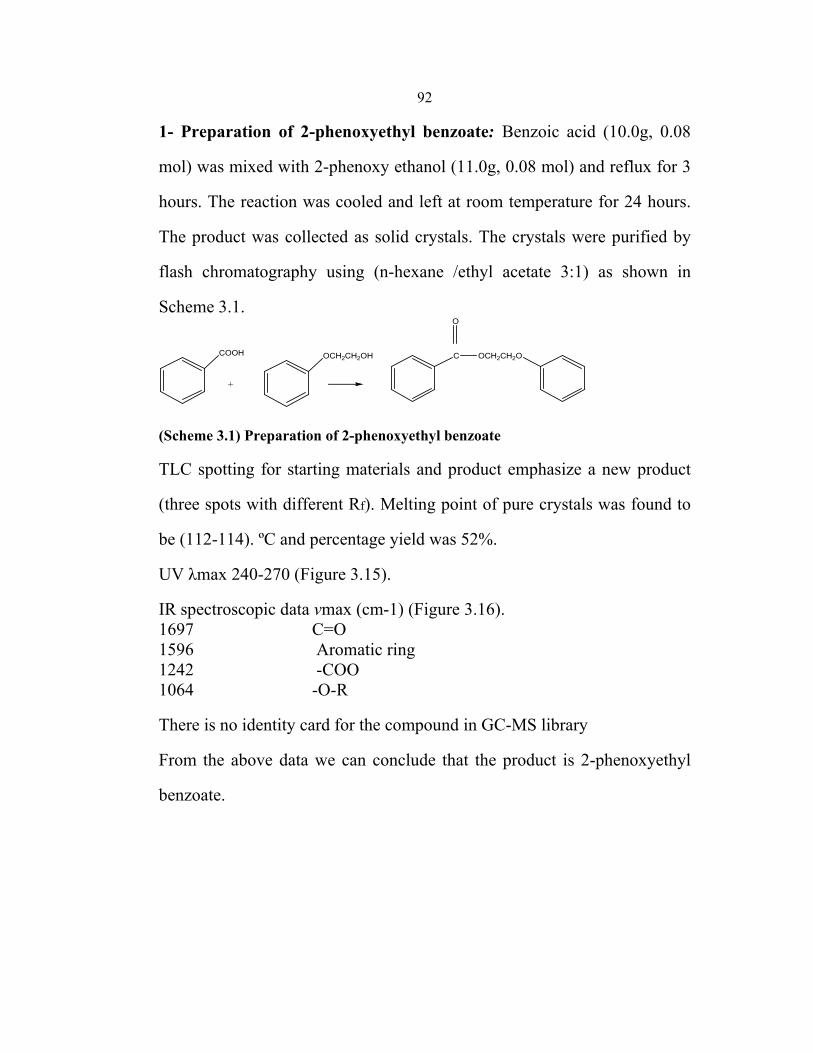
92
1- Preparation of 2-phenoxyethyl benzoate: Benzoic acid (10.0g, 0.08
mol) was mixed with 2-phenoxy ethanol (11.0g, 0.08 mol) and reflux for 3
hours. The reaction was cooled and left at room temperature for 24 hours.
The product was collected as solid crystals. The crystals were purified by
flash chromatography using (n-hexane /ethyl acetate 3:1) as shown in
Scheme 3.1.
+
OCH2CH2OHCOOH C OCH2CH2O
O
(Scheme 3.1) Preparation of 2-phenoxyethyl benzoate
TLC spotting for starting materials and product emphasize a new product
(three spots with different Rf). Melting point of pure crystals was found to
be (112-114). ºC and percentage yield was 52%.
UV λmax 240-270 (Figure 3.15).
IR spectroscopic data νmax (cm-1) (Figure 3.16). 1697 C=O 1596 Aromatic ring 1242 -COO 1064 -O-R
There is no identity card for the compound in GC-MS library
From the above data we can conclude that the product is 2-phenoxyethyl
benzoate.

93
(Figure: 3.15) U.V spectrum of 2-phenoxyethyl benzoate
(Figure: 3.16) IR spectrum of 2-phenoxyethyl benzoate
2- Preparation of 2-phenoxyethyl 2-hydroxy benzoate

94
2-Hydroxy benzoic acid (10.0g, 0.07 mol) was mixed with 2-phenoxy
ethanol (11.0g, 0.08 mol) and reflux for 3 hours. The reaction was cooled
and left at room temperature for 24 hours. The product was collected as
solid crystals. The crystals were purified by flash chromatography using (n-
hexane /ethyl acetate 3:7) as shown in Scheme 3.2.
+
OCH2CH2OHCOOH C OCH2CH2O
O
OH OH
(Scheme 3.2) Preparation of 2-phenoxyethyl 2-hydroxy benzoate
TLC spotting for starting materials and product emphasize a new product
(three spots with different Rf). The product was purified as white crystals
with melting point (104-106 ºC) and percentage yield was 71%.
UV λmax 240-270 (Figure 3.17)
IR spectroscopic data νmax (cm-1) (Figure 3.18) 3309 OH group 1712 C=O 1596 Aromatic ring 1242 -COO 1072 -O-R
There is no identity card for the compound in GC-MS library
From the above data we can conclude that the product is 2-phenoxyethyl 2-
hydroxybenzoate.

95
(Figure: 3.17) UV spectrum of 2-phenoxyethyl 2-hydroxybenzoate
(Figure: 3.18) IR spectrum of 2-phenoxyethyl 2-hydroxybenzoate
3- Preparation of 2-phenoxy ethyl 3-hydroxy benzoate

96
Methyl 3-hydroxy benzoate (10.0g, 0.07 mol) was boiled with 5ml 6 M
HCl for 10 minutes. The product was mixed with 2-phenoxy ethanol
(11.0g, 0.08 mol) and reflux for 3 hours. The reaction was cooled and left
at room temperature for 24 hours. The product was collected as solid
crystals. The crystals were purified by flash chromatography using (n-
hexane /ethyl acetate 3:7) as shown in Scheme 3.3. Melting point was
measured to be (138 -141
C). The percentage yield of the reaction was 31%. The product was
confirmed by UV and IR spectroscopic data (Fig 3.19, Fig 3.20).
+
OCH2CH2OHCOOH C OCH2CH2O
O
OHOH
COCH3
O
OH
+ HCl
COOH
OH
(Scheme 3.3) Preparation of 2-phenoxyethyl 3-hydroxy benzoate
TLC spotting for starting materials and product emphasize a new product
(three spots with different Rf )
UV λmax 240-270 (Figure 3.19)
IR spectroscopic data νmax (cm-1) (Figure 3.20) 3309 OH group 1689 C=O 1596, 1496 Aromatic ring 1242 -COO 1087 Para OH 673,694 mono substituted
There is no identity card for the compound in GC-MS library

97
From the above data we can conclude that the product is 2-phenoxyethyl 3-
hydroxybenzoate
(Figure: 3.19) UV spectrum for 2-phenoxy ethyl 3-hydroxybenzoate
(Figure: 3.20) IR spectrum of 2-phenoxyethyl 3-hydroxybenzoate
4- Preparation of 2-phenoxyethyl 4-hydroxybenzoate

98
4-Hydroxy benzoic acid (10.0g, 0.07 mol) was mixed with 2-phenoxy
ethanol (11.0g 0.08 mol) and reflux for 3 hours. The reaction was cooled
and left at room temperature for 24 hours. The product was collected as
solid crystals. The crystals were purified by flash chromatography using (n-
hexane /ethyl acetate 3:7) as shown in Scheme 3.4.
OCH2CH2OH C OCH2CH2O
O
+
COOH
HO HO
(Scheme 3.4) Preparation of 2-phenoxyethyl 4-hydroxybenzoate
TLC spotting for starting materials and product emphasize a new product
(three spots with different Rf ). Melting point was found to be (146-148
ºC). The percentage yield was 57%.
UV λmax 240-270 (Figure 3.21).
IR spectroscopic data νmax (cm-1) (Figure 3.22). 3309 OH group 1689 C=O 1596, 1496 Aromatic ring 1242 -COO 1087 -O-R 484 Para OH 673,694 mono substituted
There is no identity card for the compound in GC-MS library
From the above data we can conclude that the product is 2-phenoxyethyl 4-
hydroxybenzoate.

99
(Figure: 3.21) UV spectrum of 2-phenoxyethyl 4-hydroxybenzoate
(Figure: 3.22) IR spectrum of 2-phenoxyethyl 4-hydroxybenzoate
5- Preparation of 2-phenoxyethyl toluate

100
2-Methyl benzoic acid (13.6g, 0.1 mol) was mixed with 2-phenoxyethanol
(13.8g, 0.1 mol) and reflux for 3 hours. The reaction was cooled and left at
room temperature for 24 hours. The product was collected as solid crystals.
The crystals were purified by flash chromatography using (n-hexane /ethyl
acetate 3:7) as shown in Scheme 3.5. Melting point was found to be (134-
136ºC). TLC spotting for starting materials and product emphasize a new
product (three spots with different Rf ).The percentage yield of the product
was 73%.
OCH2CH2OH
C OCH2CH2O
O
+
CH3
COOHCH3
(Scheme 3.5) Preparation of 2-phenoxyethyl toluate.
UV λmax 240-270 (Figure 3.23).
IR spectroscopic data νmax (cm-1) (Figure 3.24).
1689 C=O
1596, 1496 Aromatic ring
1242 -COO
1087 -O-R
673,694 mono substituted
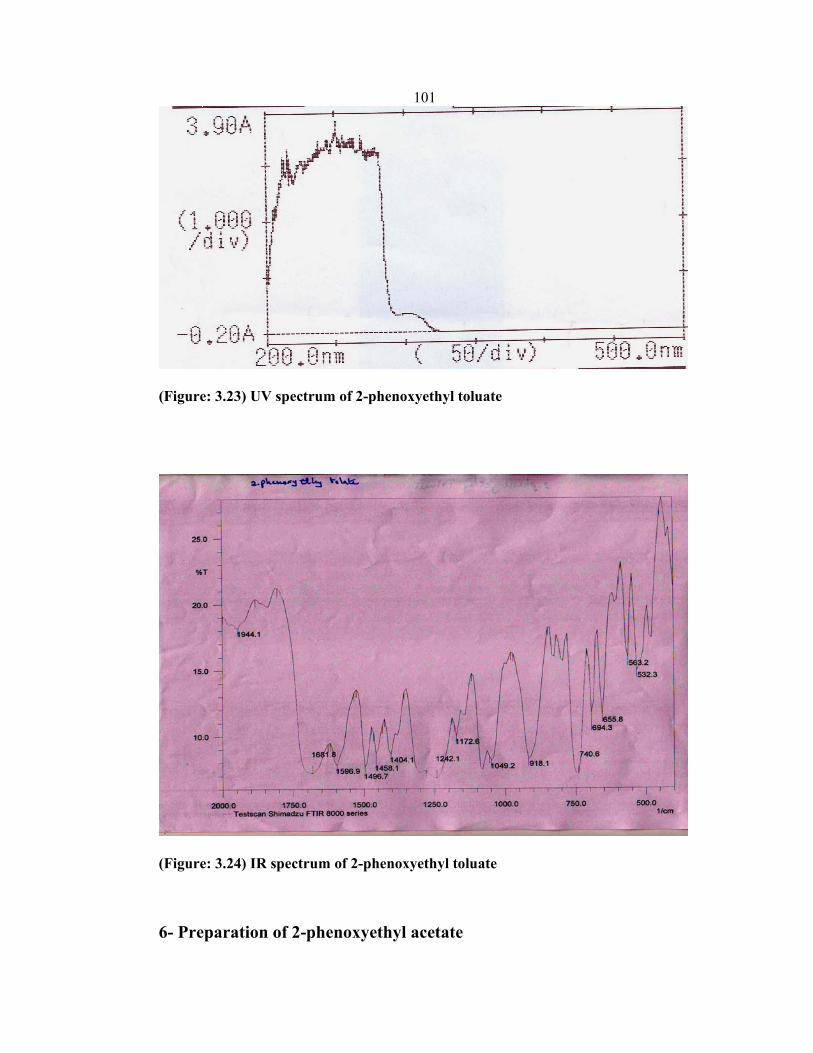
101
(Figure: 3.23) UV spectrum of 2-phenoxyethyl toluate
(Figure: 3.24) IR spectrum of 2-phenoxyethyl toluate
6- Preparation of 2-phenoxyethyl acetate

102
Glacial acetic acid (6.0g, 0.1 mol) was mixed with 2-phenoxyethanol
(13.8g, 0.1 mol) and reflux for 3 hours. The reaction was cooled and left at
room temperature for 3 hours as shown in Scheme 3.6. The product was a
clear liquid. The percentage yield of the product was 68%. The product was
confirmed by UV and IR spectroscopic data (Fig 3.25, Fig 3.26).
OCH2CH2OH
C OCH2CH2O+
O
CH3COOH H3C
(Scheme: 3.6) Preparation of 2- phenoxyethyl acetate
UV λmax 220-245 (Figure 3.25).
IR spectroscopic data νmax (cm-1) (Figure 3.24).
1689 C=O
1596, 1496 Aromatic ring
1242 -COO
1087 -O-R

103
(Figure: 3.25) UV spectrum of 2-phenoxyethyl acetate
(Figure: 3.26) IR spectrum of 2-phenoxyethyl acetate
7- Preparation of 2-phenoxyethyl propionate

104
Propanoic acid (7.4g, 0.1 mol) was mixed with 2-phenoxyethanol (13.8g,
0.1 mol) and reflux for 3 hours. The reaction was cooled and left at room
temperature for 2 hours as shown in Scheme 3.7. The product was a clear
liquid. The percentage yield of the product was 61%. TLC spotting for
starting materials and product emphasize a new product (three spots with
different Rf ).The product was confirmed by UV and IR spectroscopic data
(Fig 3.27, Fig 3.28).
OCH2CH2OH
C OCH2CH2O+
O
CH3CH2COOH H3CH2C
(Scheme: 3.7) Preparation of 2-phenoxyethyl propionate
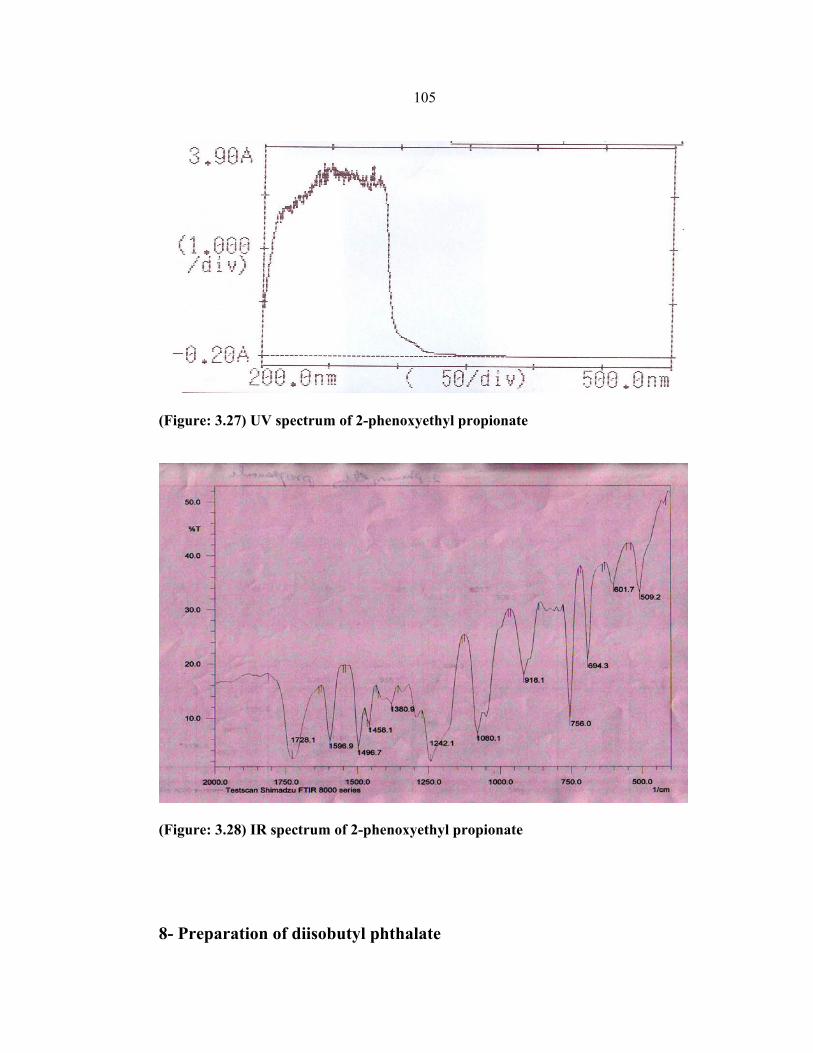
105
(Figure: 3.27) UV spectrum of 2-phenoxyethyl propionate
(Figure: 3.28) IR spectrum of 2-phenoxyethyl propionate
8- Preparation of diisobutyl phthalate

106
Isobutyl alcohol (80.0g, 1.08 mol) was mixed with phthalic anhydride
(10.0g, 0.07 mol). The mixture was catalyzed with 2ml concentrated
sulfuric acid and reflux for 3 hours according to the following scheme: O
O
+OH
O
O
O
O
H2SO4O
(Scheme 3.8) Preparation of diisobutyl phthalate
The product was a yellow liquid with boiling point 325-328 oC. It was
confirmed by comparing it with an authentic sample in addition to IR
analysis (Figure: 3.29).
(Figure: 3.29) IR spectrum of diisobutyl phthalate
9- Preparation of dibutyl phthalate

107
Butyl alcohol (80.0g, 1.08 mol) was mixed with phthalic anhydride (10.0g
0.07 mol). The mixture was catalyzed with 2ml concentrated sulfuric acid
and reflux for 3 hours according to the following Scheme: O
O
OHO
O
O
O
H2SO4O +
(Scheme 3.9) Preparation of dibutyl phthalate
The product was a clear liquid with a boiling point of 336-341 ºC.
Spectrophotometric analysis IR Figure 3.30 emphasizes the production of
dibutyl phthalate.
(Figure: 3.30) IR spectrum of dibutyl phthalate
10- Preparation of dipropyl phthalate
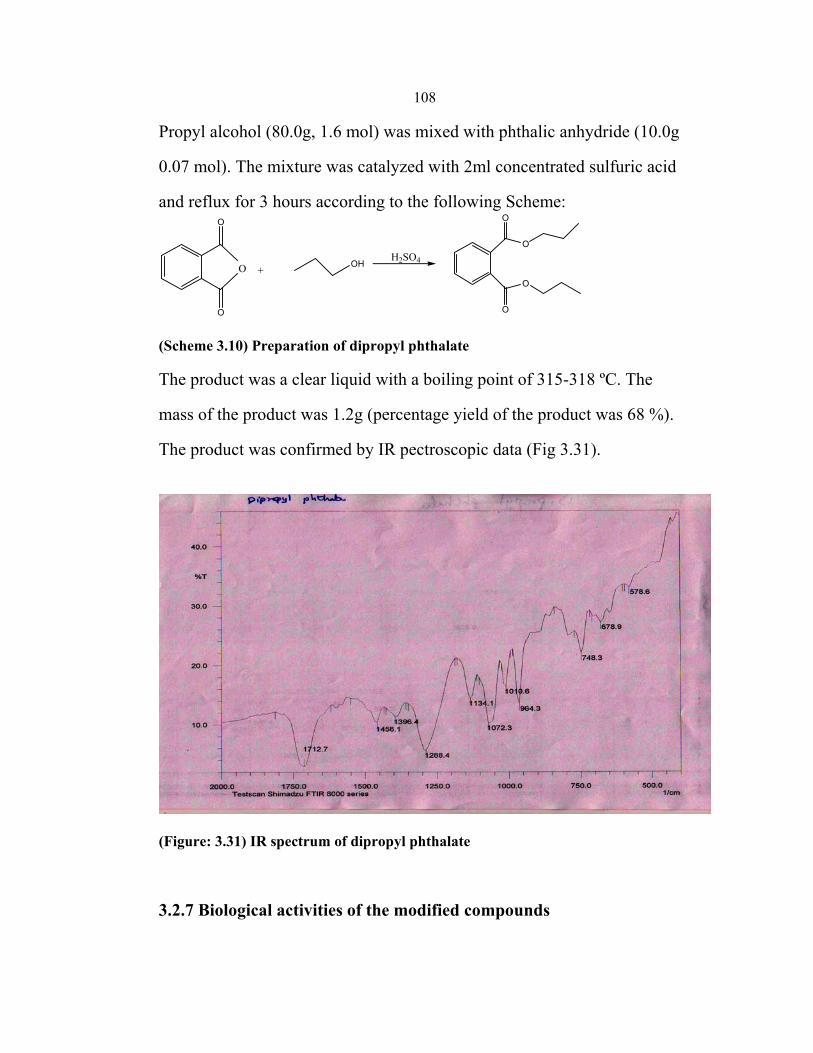
108
Propyl alcohol (80.0g, 1.6 mol) was mixed with phthalic anhydride (10.0g
0.07 mol). The mixture was catalyzed with 2ml concentrated sulfuric acid
and reflux for 3 hours according to the following Scheme: O
O
OH
O
O
O
O
H2SO4O +
(Scheme 3.10) Preparation of dipropyl phthalate
The product was a clear liquid with a boiling point of 315-318 ºC. The
mass of the product was 1.2g (percentage yield of the product was 68 %).
The product was confirmed by IR pectroscopic data (Fig 3.31).
(Figure: 3.31) IR spectrum of dipropyl phthalate
3.2.7 Biological activities of the modified compounds

109
Starting and modified compounds were tested for their biological activities
using the same procedures used for testing the activity of plant extracts
(chapter two).
3.3 Results and discussion
1- Antioxidants
Ethanolic solutions (10 mg/ml) of each compound were prepared to study
their antioxidant activities. DPPH is one of the methods used to evaluate
the antioxidative activity of antioxidants. As shown in (Table 3.10) and
(Figure 3.32) these phenolic acid esters gave various degrees of free radical
scavenging, but the values were lower than that of α-tocopherol. The
concentrations of the tested compounds needed to reduce DPPH absorption
by 50 % at 517 nm were nearly in the range of 900- 1100 µg/ml. While
for α- tocopherol was 40 µg /ml. These results show that there is a little
difference in the antioxidant activity between phenolic acid ester. It has
been shown that the antioxidant activities of the phenolic compounds are
slightly affected by the molecular structure and the position of hydroxyl
group on the site of ortho, meta and para on the benzoic moiety. This is
consistent with studies done on polyphenolic compounds and showed that
the structure is not required for the antioxidant activity [23, 24].

110(Table: 3.10) Percent inhibition of phenolic acid esters at different concentration
* Modified compounds
No. Concentration µg/ml
% inhibition
60 80 100 200 400 600 800 1000
1 α- Tocopherol 54 74 86 91 92 93 95 97
2 Benzoic acid 10 10 14 18 26 34 41 52
3 2-Hydroxy Benzoic acid 4 6 8 13 23 33 39 48
4 3-Hydroxy Benzoic acid 10 11 13 15 23 31 36 47
5 4-Hydroxy Benzoic acid 10 13 24 28 31 37 42 55
6 2-phenoxy ethanol 6 9 15 19 24 28 30 35
7 Diisobutyl phthalate 4 6 8 12 16 24 27 31
8 2-phenoxy ethyl benzoate * 12 15 17 22 39 47 51 56
9 2-phenoxy ethyl 2-hydroxy benzoate *
4 5 8 13 19 33 40 46
10 2-phenoxy ethyl 3-hydroxy benzoate *
4 11 11 21 24 40 46 54
11 2-phenoxy ethyl 4-hydroxy benzoate*
10 11 13 20 23 31 36 41
12 2-phenoxy ethyl acetate * 6 8 13 16 20 28 33 37
13 2-phenoxyethyl propanoate * 8 14 17 23 30 37 41 48
14 2-phenoxyethyl toluate * 9 12 17 20 25 29 32 37
15 Dibutyl phthalate * 15 21 26 30 34 39 44 52
16 Dipopyl phthalate * 11 15 19 26 30 35 41 56

111
% Inhibition of DPPH assay
0
10
20
30
40
50
60
70
80
90
100
0 200 400 600 800 1000 1200
concentration ug/ml
% in
hibi
tion
α- Tocopherol
Benzoic acid
2-Hydroxy Benzoicacid3-Hydroxy Benzoicacid4-Hydroxy Benzoicacid2-phenoxy ethanol
Diisobutyl phthalate
2-phenoxy ethylbenzoate2-phenoxy ethyl 2-hydroxy benzoate2-phenoxy ethyl 3-hydroxy benzoate2-phenoxy ethyl 4-hydroxy benzoate2-phenoxy ethylacetate2-phenoxyethylpropanoate2-phenoxyethyltoluateDibutyl phthalate
Dipopyl phthalate
(Figure: 3.32) Percent inhibition of phenolic acid esters at different concentrations
β-Carotene-linoleic acid is another antioxidant test used to measure
antioxidant activity of synthetic and modified compounds ( Table 3.11).

112
The same compounds were tested for their antioxidant activity using
emulsion system of β-carotene linoleic acid depending on the fact that β-
carotene loses its color in the absence of antioxidants (see chapter two).
Table 3.11 and figure 3.33 show the nature of activity of those compounds.
All of them showed higher antioxidant efficiency compared with water
(control) and the synthetic antioxidant α-tocopherol which gave the highest
β-carotene degradation (i.e. least antioxidant efficiency). 2-Phenoxy
ethanol was the least β-carotene discoloration (i.e. the highest antioxidant
efficiency. Dipropyl phthalate, dibutyl phthalate and 2-phenoxy ethyl
propionate were the second group that gave significant activity.

113
(Table: 3.11) Absorbance of phenolic acid esters using β-carotene assay
* Modified compounds
No Compounds Time (minute)
0 15 30 45 60 75 90 105 120
1 α- Tocopherol 0.722 0.532 0.453 0.355 0.282 0.237 0.218 0.209 0.191
2 water 0.722 0.643 0.416 0.325 0.254 0.208 0.186 0.178 0.169
3 Benzoic acid 0.722 0.553 0.458 0.402 0.346 0.304 0.299 0.281 0.266
4 2-Hydroxy Benzoic acid 0.722 0.678 0.601 0.543 0.48 0.435 0.402 0.386 0.365
5 3-Hydroxy Benzoic acid 0.722 0.656 0.536 0.481 0.411 0.365 0.332 0.318 0.311
6 4-Hydroxy Benzoic acid 0.722 0.556 0.467 0.396 0.355 0.321 0.315 0.294 0.283
7 2-phenoxy ethanol 0.722 1.36 1.422 1.398 1.416 1.409 1.405 1.405 1.38
8 Diisobutyl phthalate 0.722 0.551 0.483 0.412 0.335 0.31 0.279 0.246 0.218
9 2-phenoxy ethyl benzoate * 0.722 0.517 0.49 0.461 0.423 0.366 0.365 0.343 0.326
10 2-phenoxy ethyl 2-hydroxy benzoate * 0.722 0.561 0.411 0.35 0.309 0.258 0.242 0.231 0.223
11 2-phenoxy ethyl 3-hydroxybenzoate * 0.722 0.526 0.463 0.382 0.312 0.279 0.263 0.248 0.246
12 2-phenoxy ethyl 4-hydroxybenzoate * 0.722 0.525 0.43 0.361 0.292 0.265 0.253 0.26 0.256
13 2-phenoxy ethyl acetate* 0.722 0.589 0.54 0.518 0.488 0.43 0.38 0.363 0.354
14 2-phenoxyethyl propanoate * 0.722 0.596 0.576 0.548 0.519 0.497 0.476 0.458 0.435
15 2-phenoxyethyl toluate * 0.722 0.566 0.531 0.509 0.482 0.46 0.438 0.417 0.309
16 Dibutyl phthalate * 0.722 0.57 0.558 0.534 0.513 0.496 0.47 0.454 0.431
17 Dipopyl phthalate * 0.722 0.648 0.664 0.629 0.596 0.563 0.541 0.517 0.486
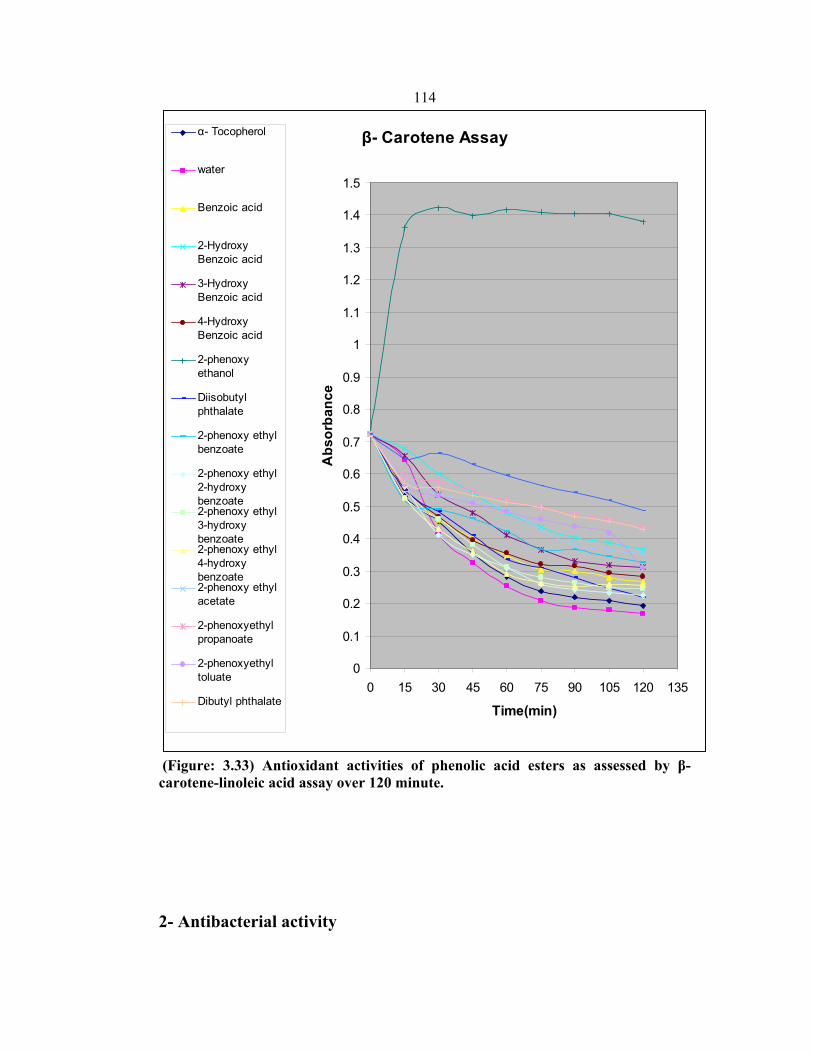
114
β- Carotene Assay
0
0.1
0.2
0.3
0.4
0.5
0.6
0.7
0.8
0.9
1
1.1
1.2
1.3
1.4
1.5
0 15 30 45 60 75 90 105 120 135
Time(min)
Abs
orba
nce
α- Tocopherol
water
Benzoic acid
2-HydroxyBenzoic acid
3-HydroxyBenzoic acid
4-HydroxyBenzoic acid
2-phenoxyethanol
Diisobutylphthalate
2-phenoxy ethylbenzoate
2-phenoxy ethyl2-hydroxybenzoate2-phenoxy ethyl3-hydroxybenzoate2-phenoxy ethyl4-hydroxybenzoate2-phenoxy ethylacetate
2-phenoxyethylpropanoate
2-phenoxyethyltoluate
Dibutyl phthalate
(Figure: 3.33) Antioxidant activities of phenolic acid esters as assessed by β-carotene-linoleic acid assay over 120 minute.
2- Antibacterial activity

115
The entire compounds (Table 3.12) were tested in vitro against six bacterial
species which are known to cause dermic and micosal infections [25]
beside other infections in human. All compounds studied in this work
showed antibacterial activity except 2-phenoxyethanol which showed no
such activity. 2-phenoxy ethyl propionate and 2-phenoxyethyl acetate were
the most active modified compounds also 2-phenoxyethyl benzoate showed
significant activity. It is noteworthy to take attention for those modified
compounds although they possess less activity than synthetic antibiotics. It
is important to prepare new therapeutics because some kinds of bacteria
become resistant to certain drugs after a period of time.
(Table: 3.12) Antibacterial activity of modified compounds at concentration 200µg/ml
No.
Compound Inhibition zone diameter (mm)a Micro-organisms
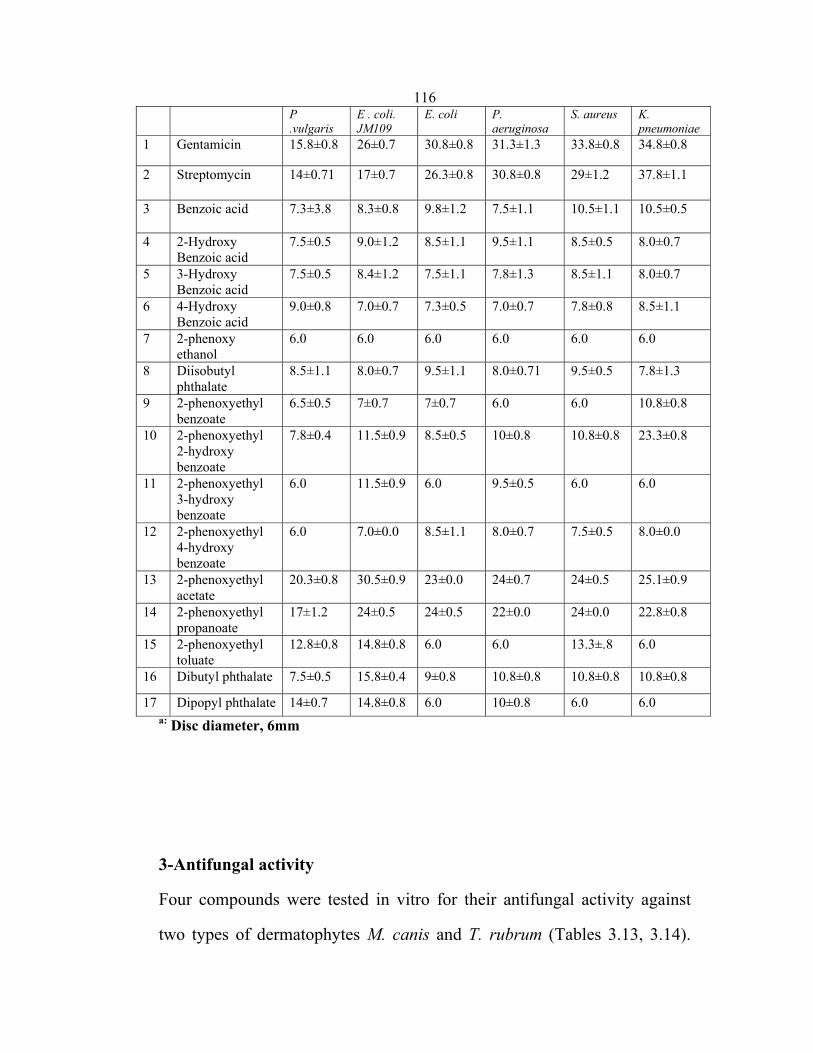
116P .vulgaris
E . coli. JM109
E. coli P. aeruginosa
S. aureus K. pneumoniae
1 Gentamicin 15.8±0.8 26±0.7 30.8±0.8 31.3±1.3 33.8±0.8 34.8±0.8
2 Streptomycin 14±0.71 17±0.7 26.3±0.8 30.8±0.8 29±1.2 37.8±1.1
3 Benzoic acid 7.3±3.8 8.3±0.8 9.8±1.2 7.5±1.1 10.5±1.1 10.5±0.5
4 2-Hydroxy Benzoic acid
7.5±0.5 9.0±1.2 8.5±1.1 9.5±1.1 8.5±0.5 8.0±0.7
5 3-Hydroxy Benzoic acid
7.5±0.5 8.4±1.2 7.5±1.1 7.8±1.3 8.5±1.1 8.0±0.7
6 4-Hydroxy Benzoic acid
9.0±0.8 7.0±0.7 7.3±0.5 7.0±0.7 7.8±0.8 8.5±1.1
7 2-phenoxy ethanol
6.0 6.0 6.0 6.0 6.0 6.0
8 Diisobutyl phthalate
8.5±1.1 8.0±0.7 9.5±1.1 8.0±0.71 9.5±0.5 7.8±1.3
9 2-phenoxyethyl benzoate
6.5±0.5 7±0.7 7±0.7 6.0 6.0 10.8±0.8
10 2-phenoxyethyl 2-hydroxy benzoate
7.8±0.4 11.5±0.9 8.5±0.5 10±0.8 10.8±0.8 23.3±0.8
11 2-phenoxyethyl 3-hydroxy benzoate
6.0 11.5±0.9 6.0 9.5±0.5 6.0 6.0
12 2-phenoxyethyl 4-hydroxy benzoate
6.0 7.0±0.0 8.5±1.1 8.0±0.7 7.5±0.5 8.0±0.0
13 2-phenoxyethyl acetate
20.3±0.8 30.5±0.9 23±0.0 24±0.7 24±0.5 25.1±0.9
14 2-phenoxyethyl propanoate
17±1.2 24±0.5 24±0.5 22±0.0 24±0.0 22.8±0.8
15 2-phenoxyethyl toluate
12.8±0.8 14.8±0.8 6.0 6.0 13.3±.8 6.0
16 Dibutyl phthalate 7.5±0.5 15.8±0.4 9±0.8 10.8±0.8 10.8±0.8 10.8±0.8
17 Dipopyl phthalate 14±0.7 14.8±0.8 6.0 10±0.8 6.0 6.0 a: Disc diameter, 6mm
3-Antifungal activity
Four compounds were tested in vitro for their antifungal activity against
two types of dermatophytes M. canis and T. rubrum (Tables 3.13, 3.14).

117
The most active compound is 2-phenoxyethyl 4-hydroxy benzoate. It
showed complete inhibition at a concentration less than 37.5 µg/ml against
M. canis and less than 50 µg/ml against T. rubrum. The other two didn’t
show significant activity. The tested compounds have the same molecular
weights and formulas, but different in structural formula especially in the
position of hydroxyl group as shown below. These results emphasize the
importance of functional group position in the activity of the compound.
C
O
O CH2 CH2 O
OH (Figure: 3.34) General formulas of acid esters
(Table: 3.13) Antifungal activity of modified compounds on M. canis No Compound Concentration µg/ml
12.5 25 37.5 50 62.5 1 2-phenoxy ethyl
benzoate 11.0 ± 2.9 19.2 ± 3.6 28.7 ± 4.2 39 ± 2.7 46 ± 3.4
2 2-phenoxy ethyl 2-hydroxy benzoate
6 ± 3.9 15 ± 6.7 20 ± 4.2 36 ± 2.6 48 ± 5.6
3 2-phenoxy ethyl 3-hydroxy benzoate
13.8 ± 2.4 23.7 ± 1.9 29.3 ± 3.3 33.5 ± 1.7 42.5 ± 4.1
4 2-phenoxy ethyl 4-hydroxy benzoate
76 ± 4.3 88 ± 3.4 100 100 100
5 Econazole * 100 100 100 100 100 * Econazole showed complete inhibition at concentration 2.5 µg/ml (Table: 3.14) Antifungal activity of modified compounds on T. rubrum % Inhibition No Compound Concentration µg/ml
12.5 25 37.5 50 62.5 1 2-phenoxy ethyl 21.5 ± 5.2 26 ± 1.4 27.8 ± 2.2 39 ± 1.6 40.3 ± 3.0

118benzoate
2 2-phenoxy ethyl 2-hydroxy benzoate
12.3 ± 5.3 17.3 ± 2.1 20.3 ± 3.9 28 ± 3.9 41.3 ± 2.1
3 2-phenoxy ethyl 3-hydroxy benzoate
10.8 ± 5.6 28.3 ± 5.6 34.3 ± 6.1 36.5 ± 2.9 46.8 ± 5.5
4 2-phenoxy ethyl 4-hydroxy benzoate
48.8 ± 4.6 70 ± 5.7 98.6 ± 1.1 100 100
5 Econazole * 100 100 100 100 100 * Econazole showed complete inhibition at concentration 2.5 µg/ml
4- Anticancer activity
Two compounds were tested in vitro against breast cancer using the same
test and procedure in Chapter Two. 2-Phenoxyethyl 4-hydroxy benzoate
showed considerable activity against MCF-7 (Table 3.15). It showed 36 %
viability at 62.5 µg/ml and 11% at 500 µg/ml, while 2-phenoxy ethyl 2-
hydroxybenzoate showed 52% at 500 µg/ml. This means that IC50 for 2-
Phenoxyethyl 4-hydroxy benzoate is less than 62.5 µg/ml.
(Table: 3.15) Percent viability of cancer cells No Compound Concentration µg/ml
62.5 125 250 500 1000 1 2-phenoxy ethyl benzoate - - - - - 2 2-phenoxy ethyl 2-
hydroxybenzoate 94 89 72 52 -
3 2-phenoxy ethyl 3-hydroxybenzoate
- - - - -
4 2-phenoxy ethyl 4-hydroxybenzoate
36 21 14 11 -
3.4 References
1- Cos P., Calomme M., Pieters M., Vietinck A. J., Vanden Berghe D.,
(2000). Studies in chemistry of natural products by Atta-Ur-Rahman,
Amsterdam. Elsevier Science, 22, 307-341.

119
2- Middleton E., Kandaswami Jr. C., Theoharides T. C. (2000). The effects
of plant flavonoids on mammalian cells: implications for inflammation,
heart disease, and cancer, Pharm. Rev., 52, 673-751
3- Chen J. H., Ho C-T. (1997). Antioxidant activities of caffeic acid and its
to hydroxy cinnamic acid compounds, J. Agric. Food Chem., 45, 2374-
2378
4- Silva F. , Borges F., Gulmaraes C., Lima J. , Matos C., Reis S. (2000).
Phenolic acids and derivatives: Studies on the relationship among
structure, radical scavenging activity, and physicochemical parameters,
J. Agric. Food Chem., 48, 2122-2126
5- Son S., Lewis B. A., (2002). Free radical scavenging and antioxidative
activity of caffeic acid amide and ester analogues: Structureactivity
relationship, J. Agric. Food Chem., 50, 468- 472.
6-Nardini M., A’Aquino M., Tomassi G., Gentili V. C., Di Felice M.,
Scaccini C., (1995). Free Radic. Biol. Med., 19, 541- 552.
7-Moon J. H., Terao J., (1998). Antioxidant activity of caffeic acid and
dihydrocaffeic acid in lard and human low-density lipoprotein, J. Agric.
Food Chem. ,46, 5062- 5065.
8-Lee H. S., Widmer B. W. (1996). Phenolic compounds. In: Nollet LML,
ed. Handbook of Food Analysis. Physical Characterization and Nutriet
Analysis. New York, USA: Marcel Dekker, Inc., 821–894.
9-Robards K., Antolovich M. (1997). Analytical chemistry of fruit
bioflavonoids, a review, Anal , 122, 11R 34R.

120
10-Delage E. , Baron G. B. , Drilleau J-F., (1991). High-performance liquid
chromatography of the phenolic compounds in the juice of some French
cider apple varieties, J. Chromatogr., 555, 125–136.
11-Torres A. M., Mau-Lastovicka T., Rezaaiyan R. (1987). Total phenolics
and high-performance liquid chromatography of phenolic acids of
avocado, J. Agric. Food Chem., 35, 921–925.
12- Justesen U., Knuthsen P., Leth T.,( 1998). Quantitative analysis of
flavonols, flavones, and flavanones in fruits, vegetables and beverages by
high-performance liquid chromatography with photo-diode array and
mass spectrometric detection, J Chromatogr , A; 799,101–110.
13-Pussayanawin V., Wetzel D. L. (1987). High-performance liquid
chromatographic determination of ferulic acid in wheat milling fractions
as a measure of bran contamination, J. Chromatogr., 391, 243–255.
14- Taga M. S., Miller E. E. , Pratt D. E. (1984). Chia Seeds as a Source of
Natural Lipid Oxidant, J. Am. Oil Chem. Soc. ,61, 928-31.
15- Slinkard K., Singleton V.L. (1977). Total phenol analyses: automation
and comparison with manual methods. American J. Enolo. Viticul., 28,
49-55.
16- Gazzani G., Papetti A., Massolini G., Daglia M., (1998). Antioxidant
and prooxidant activity of water soluble components of some common
diet vegetables and the effect of thermal treatment, J. Agric. Food Chem.
,46 , 4118-41121.
17- Martinez-Valverde I., Periago M. J., Provan G., Chesson A., (2002).
Phenolic compounds, lycopene and antioxidant activity in commercial

121
varieties of tomato (Lycopersicum esculentum), J. Sci. Food Agr., 82,
323–330.
18- Conde E., Cadahia E., Garcia-Vallejo M. C. ,(1997). Low molecular
weight polyphenols in leaves of Eucalyptus camaldulensis, E-globulus
and E-rudis, Phytochem. Anal., 8, 186–193.
19- Molyneux R. J., Mahoney N., Bayman P., Wong R. Y., Meyer K.
Irelan N., (2002). Eutypa dieback in grapevines: differential production
of acetylenic phenol metabolites by strains of Eutypa lata, J. Agric. Food.
Chem., 50, 1393–1399;
20- Penazzi G., Caboni M. F., Zunin P., Evangelisti F., Tiscornia E.,
Toschi T. G., Lercker G., (1995). Routine high-performance liquid
chromatographic determination of free 7-ketocholesterol in some foods
by two different analytical methods, J. Am. Oil Chem. Soc., 72, 1523–
1527.
21- Merken H. M., Beecher G. R. (2000). Measurement of food flavonoids
by high-performance liquid chromatography: a review, J. Agric. Food.
Chem., 48, 577–599.
22-Khokhar S., Magnusdottir S. G. M. (2002). Total phenol, catechin, and
caffeine contents of teas commonly consumed in the United Kingdom, J.
Agric. Food. Chem., 50, 565–570.
23- Hiremath S., Badami S., Swamy H., Patil S., Londonkar R. (1997).
Anti-androgenic effect of Striga orobanchioides, Journal of
Ethnopharm., 56, 55-60.

122
24- Vitalone A., Guizzetti M., Lucio G. , Tita B. (2003). Extracts of various
species of Epilobium inhibit proliferation of human prostate cells, J. P.
P., 55, 683–690.
25- Evans B., Griffiths K., Morton M. (1995). Inhibition of 5 alpha-
reductase in genital skin fibroblasts and prostate tissue by dietary lignans
and isoflavonoids, Journal of Ethnopharm. , 747, 295-302.
123
Chapter Four
General Discussion and Conclusions
4.1 General discussion
Plants are important source of useful structures for the development
of new chemotherapeutic agents. The first step towards this goal is the in
vitro biological activity assays [1]. Many reports are available on the
antioxidant, antibacterial, antifungal, anticancer properties of plants [2, 3].
Some of these reports have helped in identifying the active principle
responsible for such activities and in the developing of drugs for
therapeutic use in human beings. Medicinal plants represent a rich source

124
of antimicrobial agents [4]. A wide range of medicinal plant parts is used
for extracts as raw drugs and they possess varied medicinal properties [5,
6]. The present work was therefore aimed at investigating the biological
activity (antioxidant, antibacterial, antifungal and anticancer) of six plants
used in Traditional Arab Palestinian Herbal Medicine, TAPHM, to treat
several ailments and health problems in humans. The work was also aimed
at separating and identifying biologically active constituents in these plants,
and thereafter modifying some of these compounds in order to promote
their biological activities.
All the ethanolic extracts of the tested plants in this study revealed
varying levels of antioxidant radical scavenging activity, with M. syriaca
showing the highest radical scavenging activity using the DPPH assay, and
U. pilulifera showing the highest antioxidant activity in β-carotene assay.
Recently, methanol extract of different parts of U. pilulifera extracts were
found to exhibit powerful antioxidant activity against various oxidative
systems in vivo [7]. The antioxidant activity of these extracts has been
attributed to the reduction of lipid peroxidation and elevation of antioxidant
enzyme activities.
However, some of the species in the present work have showed low
radical scavenging activity compared to positive controls but high
antioxidant activity against linoleic acid peroxidation or vice versa. This
result is in agreement with that of Lee (2003) [8]. Different antioxidant and
radical scavenging activity may be partly, due to wide variety of
antioxidant constituents such as phenolics, flavonoids and other types of
125
free radical inhibitors, initiates oxidation and inhibits free radical chain
propagation reactions. Different mechanisms of action and kinetics of the
inhibitory effect of these antioxidants using different procedures may result
in the discrepancy of these findings [9]. Owing to the complexity of the
antioxidant materials and their mechanism of actions, it is obvious that no
single testing method is capable of providing a comprehensive picture of
the antioxidant profile of a studied samples and a combination of different
methods is necessary. Despite such limitations, DPPH or linoleic acid
peroxidation methods can be helpful for primary screening and finding of
novel antioxidants [10].Taken together, our results combined with those of
recent findings allow us to suggest that the extract of U. pilulifera contains
bioactive compounds with antioxidant activities.
In the present study ethanolic extracts of the six plants used in
traditional medicine in Palestine were tested for their ability to inhibit the
proliferation of breast cancer cells (MCF-7) and Prostate cancer cells ( PC3)
using the MTT reduction assay. The extract of U. pilulifera showed the
highest cytotoxicity against breast cancer, and this may be attributed to
high concentrations of phenolics and flavonoids present in the plant, as was
revealed in our work. This result is in agreement with that of Gülçin (2004)
[11] who also found that the antioxidant properties of Urtica dioica L.
have lead to anticancer activities. The results of the present study and of
other comparable studies emphasize the effect of polyphenolic compounds
on mutagenesis and carcinogenesis in humans by stabilizing lipid
peroxidation and protecting the cells from oxidative damage [12].

126
Furthermore, M. syriaca and C. capitatus have also showed
considerable antimicrobial activity against all different types of tested
bacteria and dermatophytic fungi. This result is in agreement with those of
Darwish (2010) [13] and Ahmet (2003) [14] who also found both plants to
posses antibacterial activity against many types of bacteria. Chemical
analysis of these plants in this work has revealed that they are rich in
phenols, thymol and carvacrol, which may therefore be responsible for
their characteristic flavor, fragrance and antimicrobial activity [15].
In the present work, chemical analysis of the test plants, the isolation
of some of their constituents, and investigating their biological activities
(antioxidant and radical scavenging, antimicrobial, and anticancer
activities), have revealed some compounds with significant activity. One of
the most promising of these constituents was 2-phenoxyethanol which was
isolated from U. pilulifera. The compound showed the highest antioxidant
activity among all bioactive constituents isolated and identified from the
six plants. To promote its activity, the compound was treated with a set of
carboxylic acids to form phenolic acid esters. These acid esters were tested
for the first time for their biological activities. The most active ester
products were 2-phenoxyethyl 2-hydroxybenzoate and 2-phenoxyethyl 4-
hydroxybenzoate, with the latter showing remarkable antifungal and
anticancer activities. Such activity may be attributed to the molecular
structure, and the position of hydroxyl group. Several previous studies have
demonstrated that the catechol moiety, with the 3, 4-dihydroxyl
configuration, is important for the free radical scavenging activity for this

127
type of phenolic compounds. On the other hand, other studies suggested
that the structure was not required for the activity [5, 6]. Thus, it is worthy
to compare the biological activities of synthesized phenolic acid esters with
different hydroxyl positions on the moiety beginning with the constituents
separated from the selected medicinal plants as starting materials.
Another interesting result from the present study was the separation and
identification of phthalate compounds such as diisobutyl phthalate and di-
n-octyl phthalate for the first time from the extract of A. palaestinum, using
HPLC and GCMS techniques. Synthetic phthalate esters are used
commonly in paints and polymer products as plasticizers [16], and widely
detected in the environments, such as sediments, natural waters, soils,
plants, and aquatic organisms [17]. Although phthalate derivatives are
harmful chemicals which are regarded as environmental health hazards due
to their toxicity, carcinogenicity [18].Other studies showed that phthalate
ester (PE) has been detected in water samples from various aquatic
environments [19], as well as in bacteria, plants and the fatty acid fractions
of certain species of marine macro-algae [20]. However, there are reports
that phthalate esters are naturally produced extracellularly by
microorganisms such as bacteria, fungi and yeasts [21]. The isolation of
these compounds from Arum palaestinum, a food and medicinal plant,
justifies for further studies on the plant, especially with regard to safety and
potential biological activity.

128
4.2 References:
1- Belpaire F. M., Bogaert M. G., (2003). The fate of xenobiotics in living
organisms, Practical Medicinal Chemistry, 501-515, Academic press.
2- Koshy P., Sri N. A., Wirkarian S., Sim K. S., Saravana K., Hong S. L.,
Lee G. S., Syarifah N. S. A. Rahman. (2009). Antimicrobial activity of
some medicinal plants from Malaysia, American J. Appl. sci., 6 (8),
1613- 1617.
3- Fyhrquist Pia. (2007). Traditional medicinal uses and biological
activities of some plant extracts of African Combretum Loefl.,
Terminalia L.and Pteleopsis Engl. species (Combretaceae), Academic
dissertation, Faculty of Biosciences of the University of Helsinki.

129
4- Abu-Dahab R., Afifi F., (2007). Antiproliferative activity of selected
medicinal plants of Jordan against a breast adenocarcinoma cell line,
Scientia Pharmaceutica, 75, 121- 136.
5- Charles M. (2005). Elevating Antioxidant Levels in Food through
Organic Farming and Food Processing. An Organic Center State of
Science Review.
6- Riss T., Moravec R., (1993). Comparison of MTT, XTT, and a novel
tetrazolium compound MTS for in vitro proliferation and chemosensitivity
assays, Biomedical Products , 1 8 , 66-68.
7- Irshaid F., Mansi K. ( 2009). Effects of leaf extract of Urtica pilulifera L.
on male reproductive system of streptozotocin-diabetic rats, American J.
Pharmacol. Toxicol. , 4 (2), 22-28.
8- Lee S. E, Hwang H. J, Ha J. S, Jeong H.S., Kim J. H. (2003). Screening
of medicinal plants for antioxidant activity, Life Sci. ,73 , 167-179
9- Kaur C., Kapoor H. C., (2002). Antioxidant activity and total phenolic
content of some Asian vegetables, Int. J. Food Sci. Tech., 37, 153-162.
10- Koleva I, Van B. T. A., Linssen J. P. H., De G. A., Evstatieva L. N.
(2002). Screening of plant extracts for antioxidant activity: a comparative
study on three testing methods, Phytochem. Anal., 13, 8-17.
11- ˙Ilhami G., Ö. ˙Irfan K., Münir O. , Mehmet E. B., (2004). Antioxidant,
antimicrobial, antiulcer and analgesic activities of nettle (Urtica dioica
L.), J. Ethnopharm., 90, 205-215.

130
12- Tanaka M., Kuei C.W., Nagashima Y., Taguchi T., (1998). Application
of antioxidative maillrad reaction products from histidine and glucose to
sardine products, Nippon Suisan Gakkaishi, 54 , 1409–1414.
13- Ahmet C. G., Gokhan B., Mine B. , Huseyin D., Esin K. E., (2003).
Analysis of essential oil of Coridothymus capitatus (L.) and its
antibacterial and antifungal activity, Z. Naturforsch., 58c, 687- 690
14- Darwish R. M., Aburjai T. A., (2010). Effect of ethnomedicinal plants
used in folklore medicine in Jordan as antibiotic resistant inhibitors on
Escherichia coli, BMC Complementary and Alternative Medicine, 1- 8.
15- Ravi K. U., Pratibha D., Shoeb A. (2010). Screening of antibacterial
activity of six plant essential oils against pathogenic bacterial strains,
Asian J. Med. Sci., 2(3), 152-158.
16- Ljungvall K., Veeramachaneni D. N. R., Hou M., Hulten F., Magnusson
U., (2008). Theriogenology, 70, 984.
17- Sultan M. Z., Moon S. S., Park K., (2010). Natural phthalate derivatives
from the bacterium burkholderia cepacia K87, J. Sci. Res., 2 (1), 191-
195.
18- Heudorf U., Mersch-Sundermann V., Angerer, (2007). J. Int. J. Hyg.
Environ. Health, 210 , 623.
19- Hashizume K. , Nanya J. , Toda C. , Yasui T. , Nagano H. , Kojima N. (
2002). Phthalate esters in various water samples and biodegradation of
the phthalates by microbes isolated from river water, Biol. Pharm. Bull.,
25, 209–14.

131
20- Namikoshi M., Fujiwara T., Nishikawa T., Ukai K. (2006). Natural
abundance 14C content of dibutyl phthalate (DBP) from three marine
algae, Mar. Drugs, 4 , 290–7.
21- Mahmoud A. H., Motawa H. M., Wahba H. E., Ebrahim A. Y., (2006).
Study of some antioxidant parameters in mice livers affected with Urtica
pilulifera extracts, Trends Med. Res., 1, 67-74.
4.3 Suggestions for further studies
1- Separation identification and determination of chemical constituents for
Teucrium creticum using GC-MS analysis.
2- Check the activity of A. palaestinum, U. pilulifera and C. capitatus plant
extracts on different types of cancer.
3- Modify new compounds depending on the other active ingredients in the
selected plants.
4- Identify unknown constituents which are detected by HPLC from the
extracts of the plants.
أ
جامعة النجاح الوطنية
كلية الدراسات العليا
زيادة فعالية وتعديل على مركبات لها فعالية حيوية من
.فلسطين مختارة في نباتات
اعداد
أحمد إبراھيم أحمد حسين
ف اشرا
محمد سليم علي اشتية ·د ·أ
وحيد جندي ·نضال زعتر د ·د
قدمت ھذه الاطروحة استكمالا لمتطلبات درجة الدكتوراه في الكيمياء بكلية الدراسات العليا
.ة النجاح الوطنية في نابلس، فلسطينعفي جام
م2010

ب فلسطين في مختارة نباتات من ةحيوي فعاليةمركبات لها وتعديل على زيادة فعالية
اعداد حمد حسينأحمد ابراھيم أ
اشراف
اشتيةعلي محمد سليم .د.أ وحيد جندي .دنضال زعتر .د
الملخصتستخدم في الطب الشعبي مختارة نباتاتفحص مستخلصات كحولية لست لىإيهدف هذا البحث
واجراء بعض الفحوصات الحيوية عليها مثل مدى منع أو مختلفة أمراضفي فلسطين لعلاج
أثر المستخلصات على أنواع مختلفه من البكتيريا والفطريات التي تصيب ،وقف عمليات التأكسد
من خلال وغدة البروستاتا التي تصيب الثدي الخلايا السرطانيةالإنسان وكذلك أثرها على
.(MTT assay )الخلايا يسمى هذه اختبار خاص بقياس حساسية
، جعدة زيته، الزعتر البري ،الزعتر الفارسي قريص ،ال هي اللوف ،المختارة ف النباتات أما
.جعدة الصبيان
وقد أظهرت النتائج المخبرية أن جميع المستخلصات لها أثر حيوي في بعض الفحوصات التي
نواع مختلفة أطرق الاستخلاص و الفصل ب فيهاقد اعتمد ما عملية فصل المستخلصات فأ .تمت
و ) GC(الورقة و غروموتوغرافيا الغاز من الكروموتوغرافيا منها ، كروموتوغرافيا
الفعالة المركبات بعض التعرف علىكما تم ، ) HPLC(غروموتوغرافيا الضغط المرتفع
الأشعة جهزة ، وأ )MS(جهزة طيف الكتلة أقيد الدراسة باستخدام المستخلصة من النباتات
ومن اهم المركبات التي . ) IR(الأشعة تحت الحمراء طيف و أجهزة (UV)فوق البنفسجية
فينوكسي ايثانول الذي تم مفاعلته مع بعض الحموض الكربوكسيلية لانتاج - 2فصلت مركب
.مركبات جديدة ،اظهرت اثرا كبيرا على خلايا السرطان وبعض انواع الفطريات
كيماويا لزيادة فعاليتها عن من النباتات الطبية التعامل مع المركبات الفعالة المستخلصةتم كما
و أ، تغيير موقع بعض المجموعات الوظيفية عليهاطريق التغيير في التركيب الكيماوي لها ب
بعض ن يكون لها فعالية في علاجأتحضير بعض المركبات المشابهة لها كيماويا و التي يمكن

ج
ومن نتائج هذه الدراسة ايضا فصل بعض مركبات الفيثاليت . التي تصيب الإنسان ضمراالأ
.لأول مرة من نبتة اللوف