modis sea-surface temperatures for ghrsst-pp robert h. evans & peter j. minnett otis brown,...
TRANSCRIPT
MODIS Sea-Surface Temperatures for GHRSST-PP
MODIS Sea-Surface Temperatures for GHRSST-PP
Robert H. Evans & Peter J. Minnett
Otis Brown, Erica Key, Goshka Szczodrak,
Kay Kilpatrick, Warner Baringer, Sue Walsh
Rosenstiel School of Marine and Atmospheric Science
University of Miami
Robert H. Evans & Peter J. Minnett
Otis Brown, Erica Key, Goshka Szczodrak,
Kay Kilpatrick, Warner Baringer, Sue Walsh
Rosenstiel School of Marine and Atmospheric Science
University of Miami
US GHRSST Meeting. November 28, 2005US GHRSST Meeting. November 28, 2005
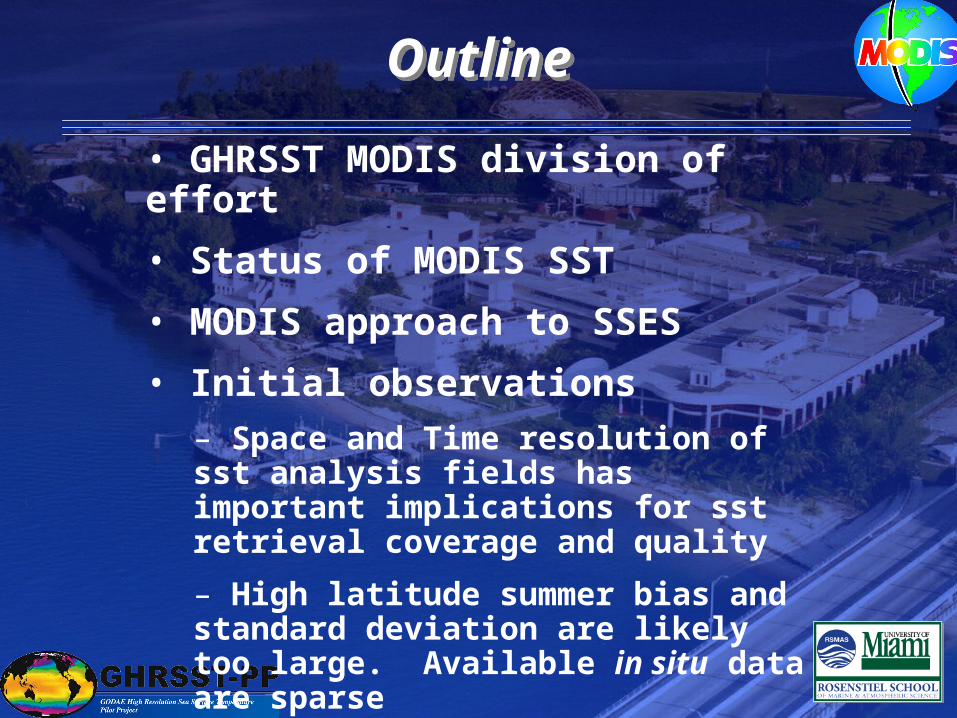
OutlineOutline
• GHRSST MODIS division of effort
• Status of MODIS SST
• MODIS approach to SSES
• Initial observations
– Space and Time resolution of sst analysis fields has important implications for sst retrieval coverage and quality
– High latitude summer bias and standard deviation are likely too large. Available in situ data are sparse
• Conclusions
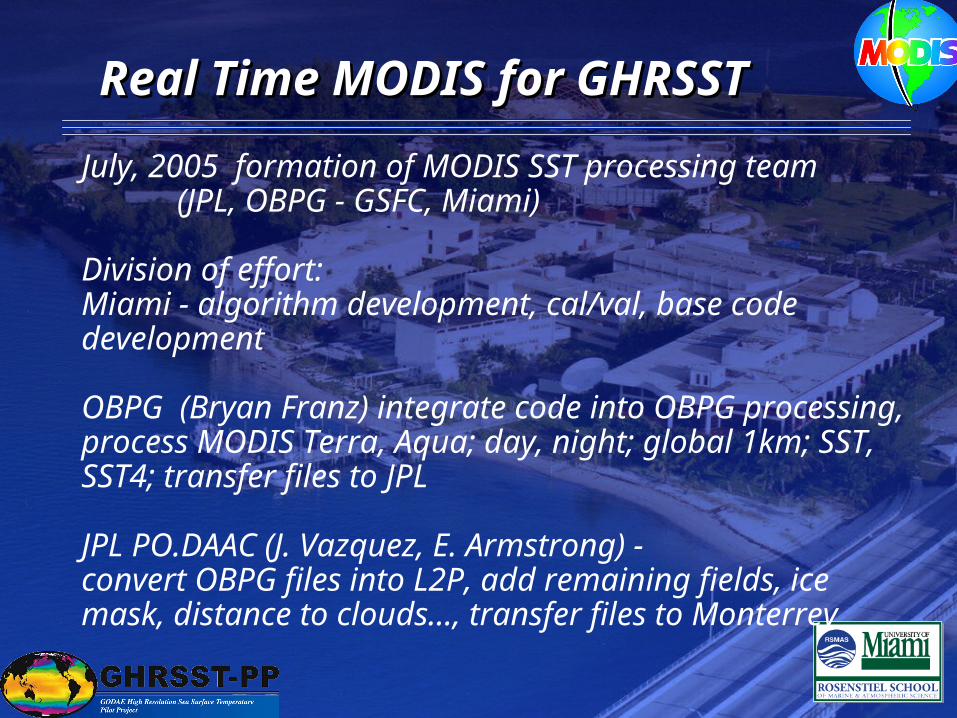
July, 2005 formation of MODIS SST processing team(JPL, OBPG - GSFC, Miami)
Division of effort:Miami - algorithm development, cal/val, base code development
OBPG (Bryan Franz) integrate code into OBPG processing, process MODIS Terra, Aqua; day, night; global 1km; SST, SST4; transfer files to JPL
JPL PO.DAAC (J. Vazquez, E. Armstrong) - convert OBPG files into L2P, add remaining fields, ice mask, distance to clouds…, transfer files to Monterrey
Real Time MODIS for GHRSSTReal Time MODIS for GHRSST
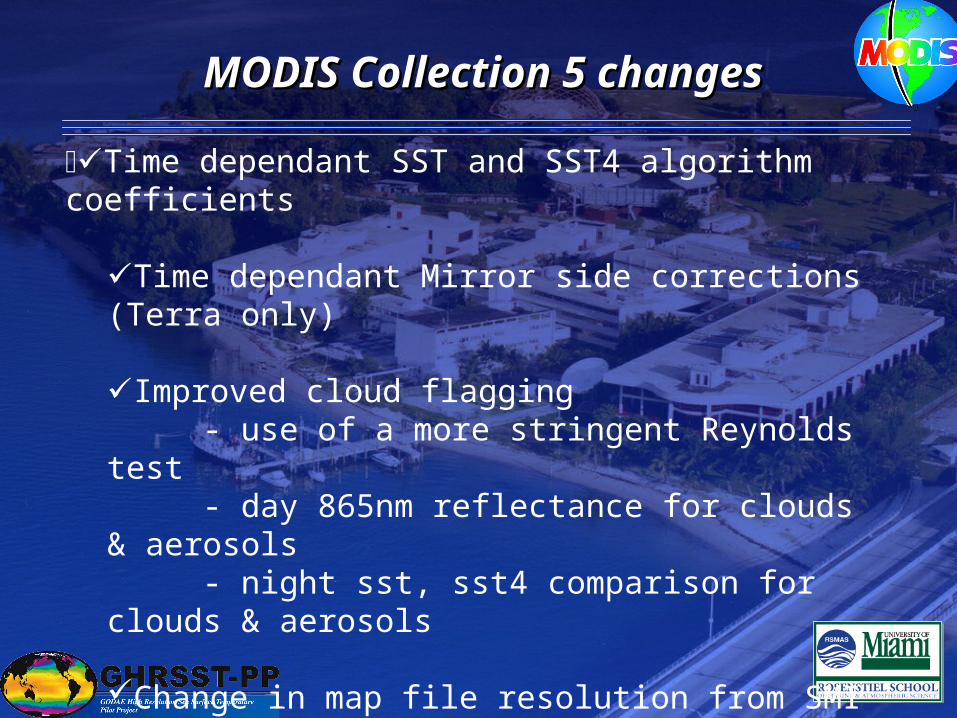
MODIS Collection 5 changesMODIS Collection 5 changes
Time dependant SST and SST4 algorithm coefficients
Time dependant Mirror side corrections (Terra only)
Improved cloud flagging - use of a more stringent Reynolds test - day 865nm reflectance for clouds & aerosols - night sst, sst4 comparison for clouds & aerosols
Change in map file resolution from SMI power of 2 projections to a true 4km, 36 km and 1 degree and maps to better assist incorporation of MODIS SST data into models.

Aqua Collection 4 & 5 SST & SST4 residualsAqua Collection 4 & 5 SST & SST4 residuals
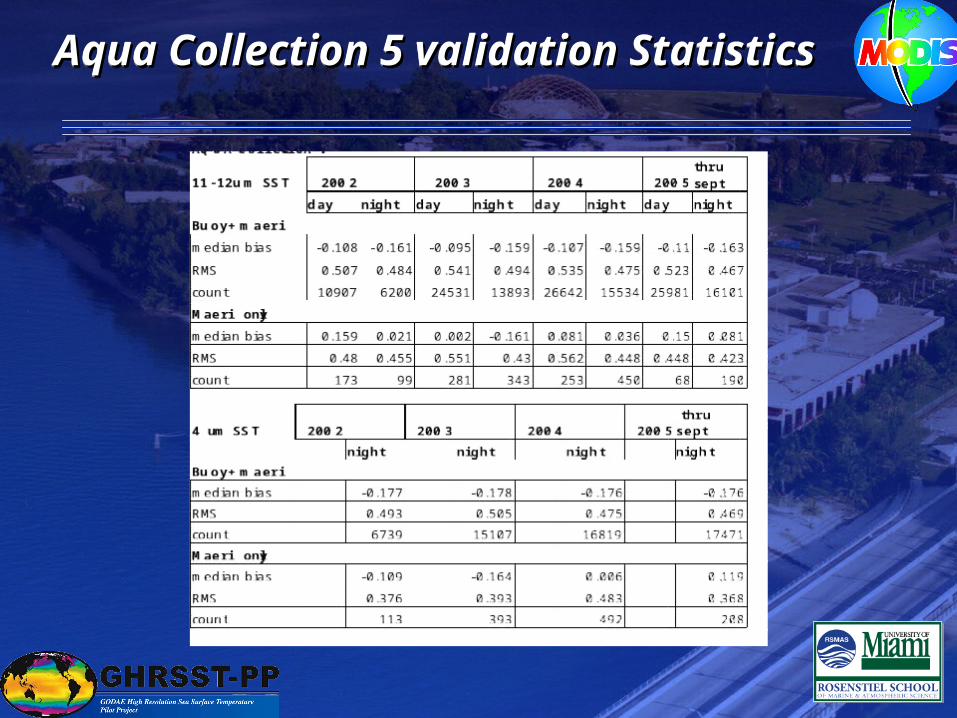
Aqua Collection 5 validation StatisticsAqua Collection 5 validation StatisticsAqua Collection 5 validation StatisticsAqua Collection 5 validation Statistics
Jan 01Feb 01Mar 01Apr 01
May 01Jun 01Jul 01Aug 01Sep 01Oct 01Nov 01Dec 01Jan 02Feb 02Mar 02Apr 02
May 02Jun 02Jul 02Aug 02Sep 02Oct 02Nov 02Dec 02Jan 03Feb 03Mar 03Apr 03
May 03Jun 03Jul 03
Aug 03Sep 03Oct 03Nov 03Dec 03Jan 04Feb 04Mar 04Apr 04
May 04Jun 04Jul 04Aug 04Sep 04Oct 04Nov 04Dec 04
-2 -1 01 2
1
-2 -1 01 2
2
newsst4v5final.res
Night TERRA V5.0.0.1 v5 monthly coef sst4 matchups
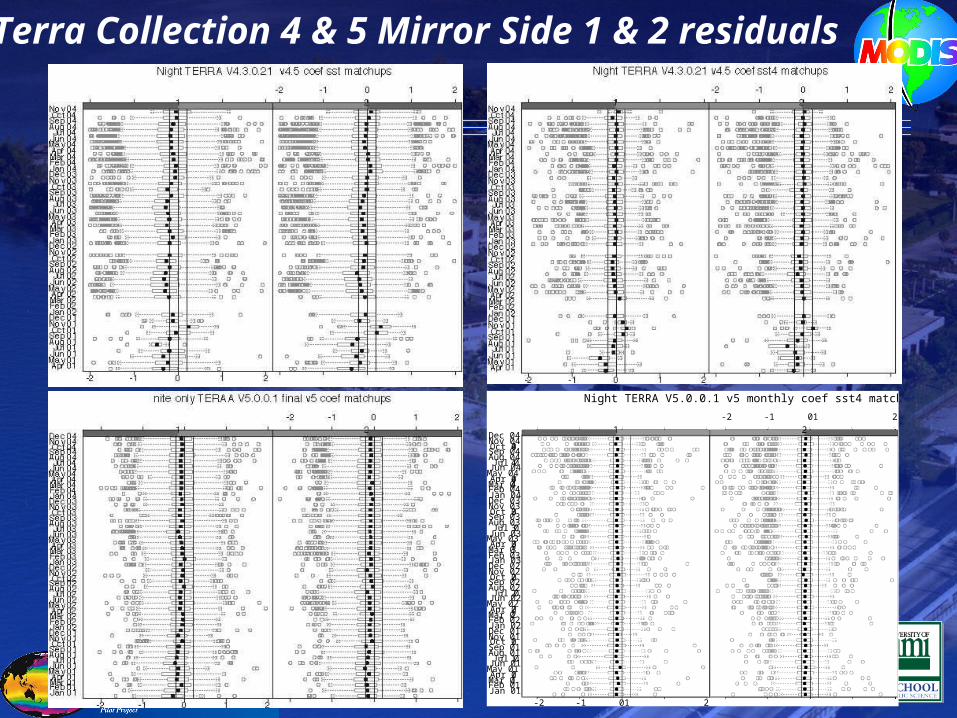
Terra Collection 4 & 5 Mirror Side 1 & 2 residuals
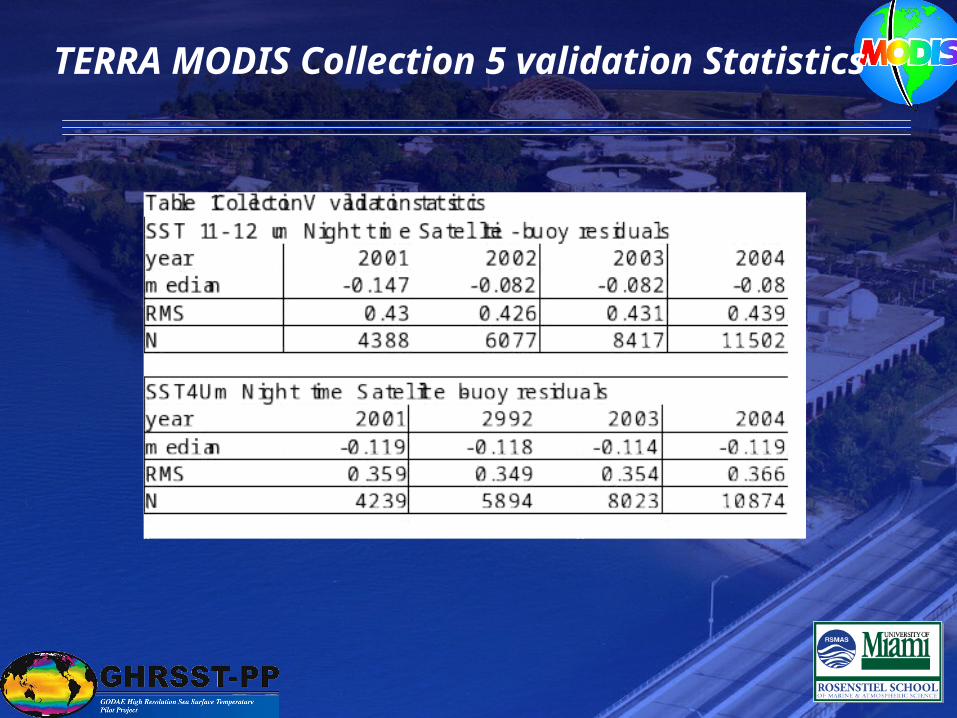
TERRA MODIS Collection 5 validation Statistics
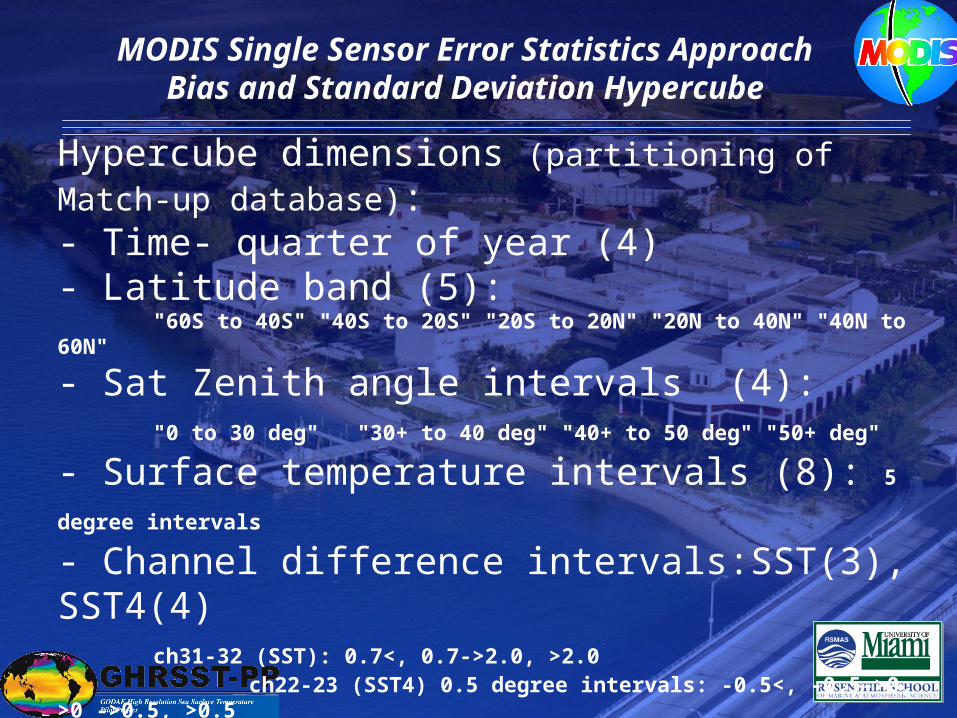
MODIS Single Sensor Error Statistics Approach Bias and Standard Deviation Hypercube
Hypercube dimensions (partitioning of Match-up database):- Time- quarter of year (4)- Latitude band (5): "60S to 40S" "40S to 20S" "20S to 20N" "20N to 40N" "40N to 60N"
- Sat Zenith angle intervals (4):"0 to 30 deg" "30+ to 40 deg" "40+ to 50 deg" "50+ deg"
- Surface temperature intervals (8): 5
degree intervals - Channel difference intervals:SST(3), SST4(4)
ch31-32 (SST): 0.7<, 0.7->2.0, >2.0 ch22-23 (SST4) 0.5 degree intervals: -0.5<, -0.5->0, >0 ->0.5, >0.5
- Quality level (2) cube created only for ql=0 and 1
Note for ql2 and 3 the bias and standard deviation are each fixed to a single value No interpolation between adjacent cells in
Hypercube
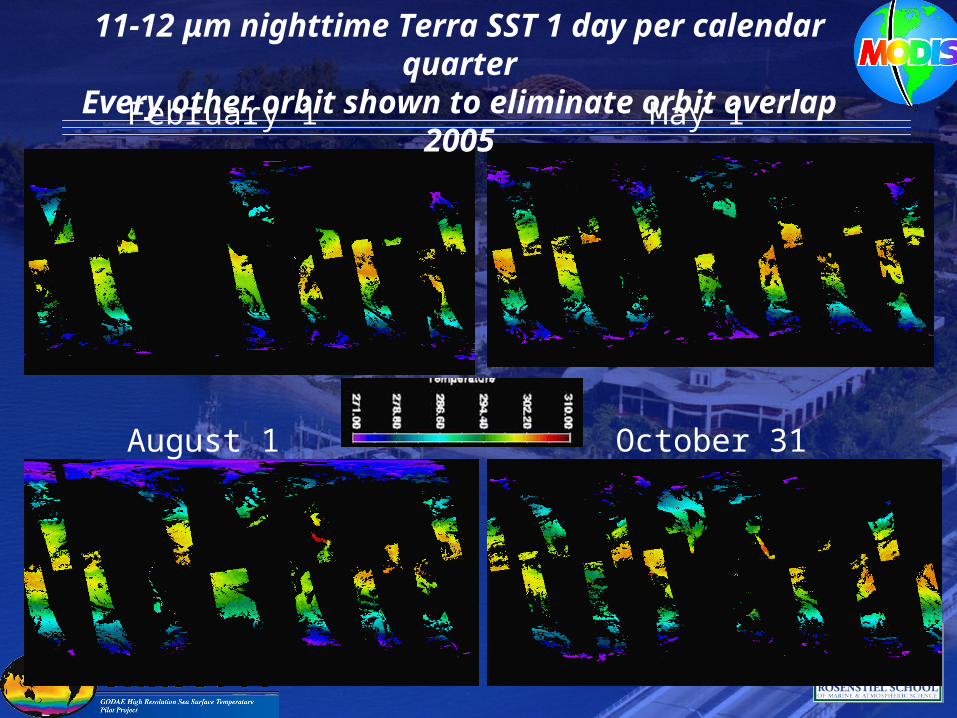
February 1 May 1
October 31August 1
11-12 μm nighttime Terra SST 1 day per calendar quarter
Every other orbit shown to eliminate orbit overlap2005
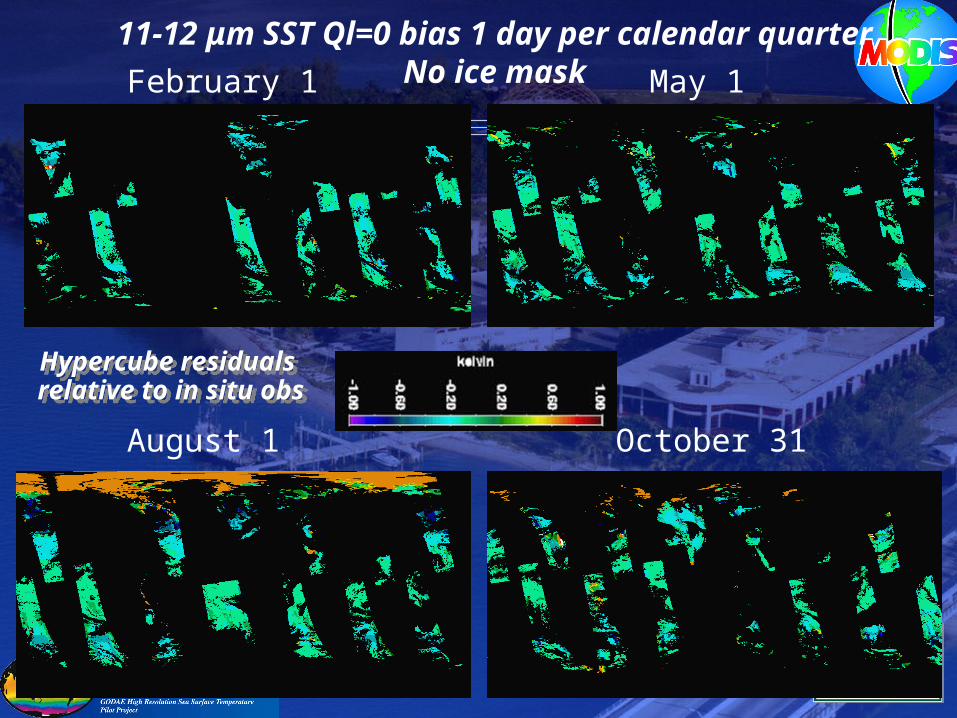
February 1 May 1
October 31August 1
11-12 μm SST Ql=0 bias 1 day per calendar quarterNo ice mask
Hypercube residuals relative to in situ obsHypercube residuals relative to in situ obs
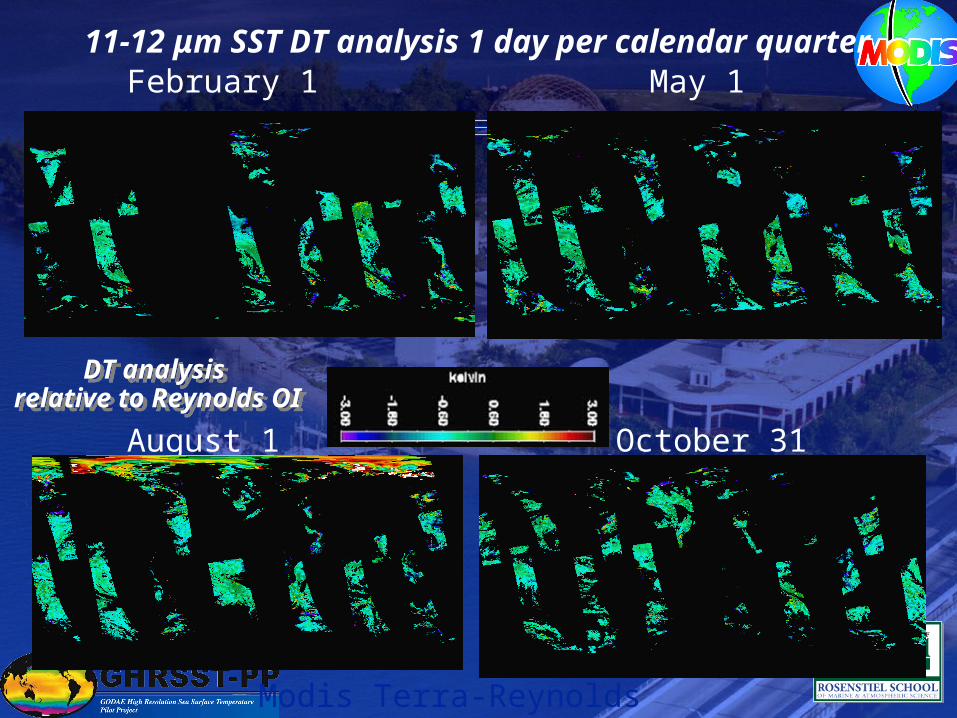
February 1 May 1
October 31August 1
11-12 μm SST DT analysis 1 day per calendar quarter
Modis Terra-Reynolds
DT analysis relative to Reynolds OI
DT analysis relative to Reynolds OI
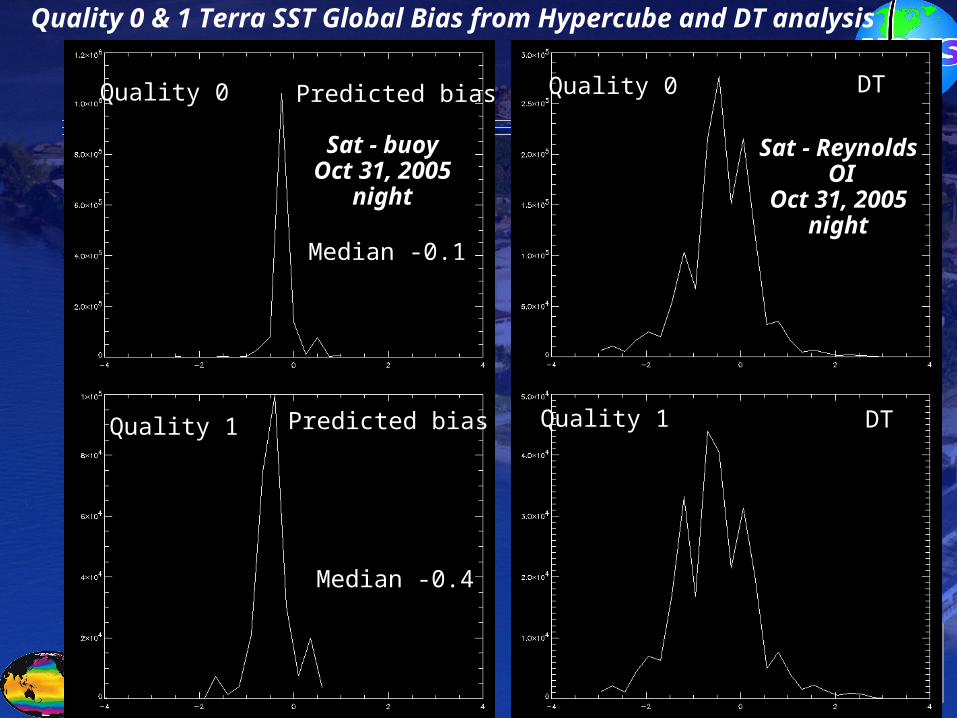
Median -0.4
Quality 0
Quality 1
Quality 0
Quality 1
Predicted bias DT
DT
Median -0.1
Predicted bias
Quality 0 & 1 Terra SST Global Bias from Hypercube and DT analysis
Sat - buoyOct 31, 2005
night
Sat - Reynolds OI
Oct 31, 2005night
all
Ql=0
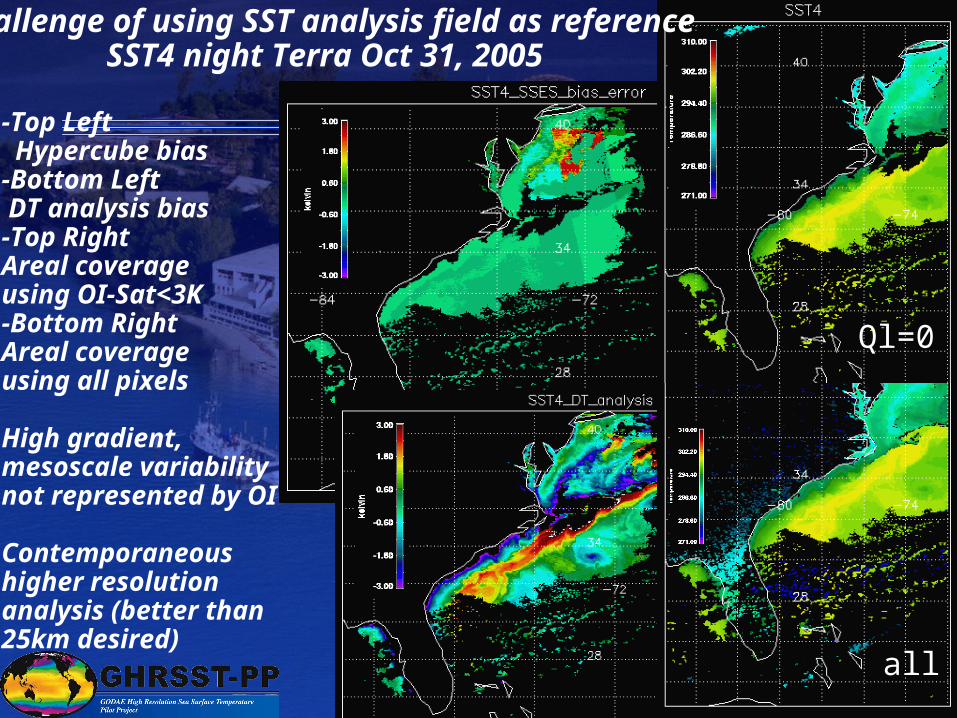
Challenge of using SST analysis field as referenceSST4 night Terra Oct 31, 2005
-Top Left Hypercube bias-Bottom Left DT analysis bias-Top RightAreal coverageusing OI-Sat<3K-Bottom RightAreal coverageusing all pixels
High gradient, mesoscale variability not represented by OI
Contemporaneous higher resolution analysis (better than 25km desired)
February 1 May 1
October 31August 1
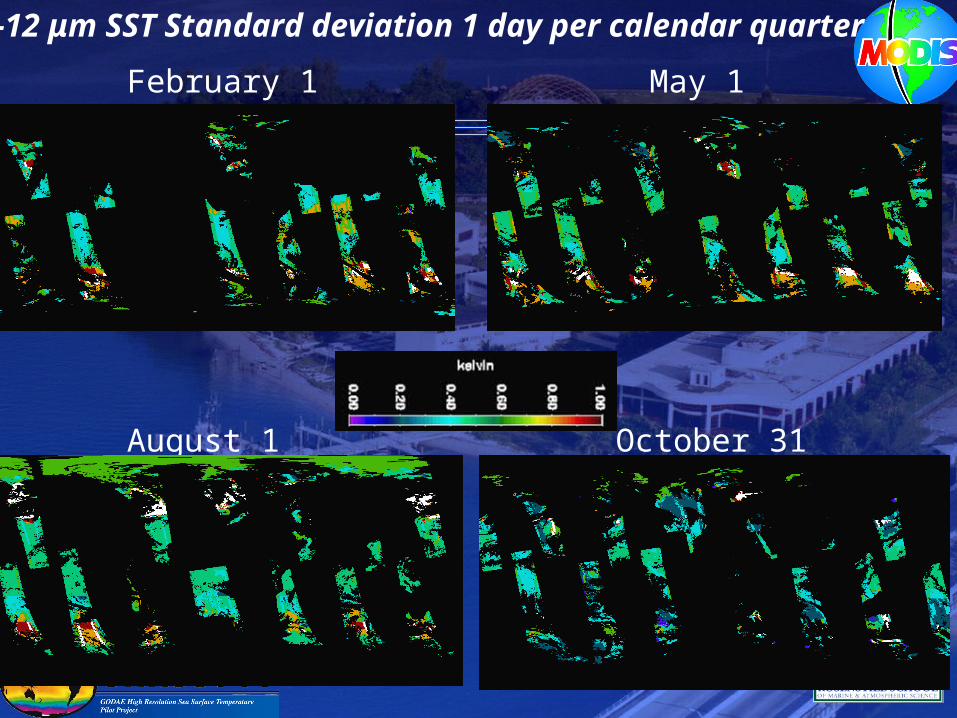
11-12 μm SST Standard deviation 1 day per calendar quarter
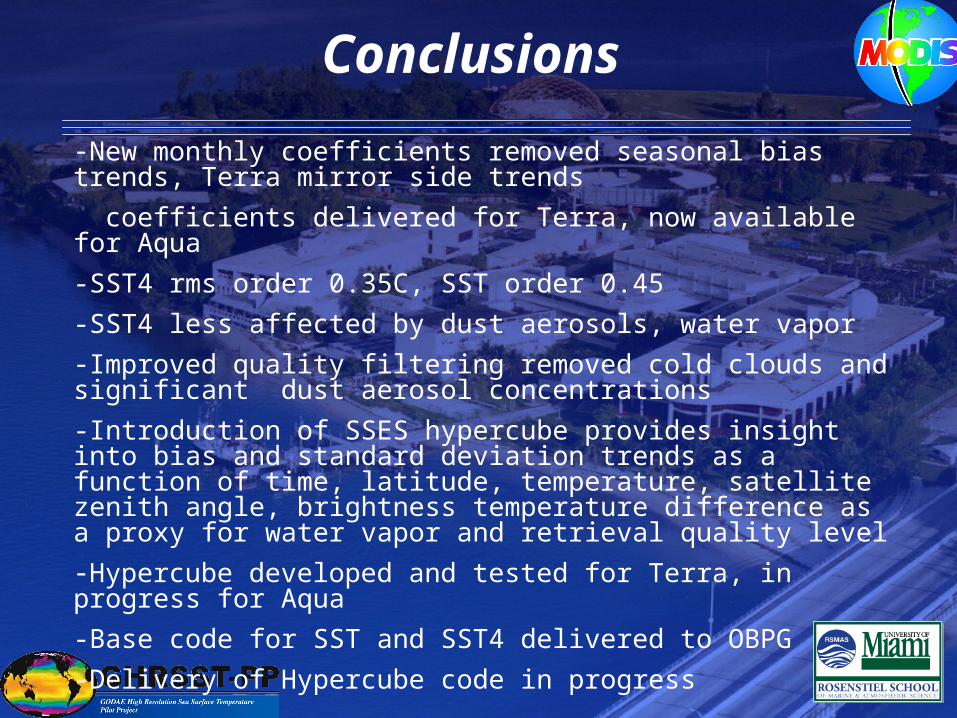
Conclusions
-New monthly coefficients removed seasonal bias trends, Terra mirror side trends
coefficients delivered for Terra, now available for Aqua
-SST4 rms order 0.35C, SST order 0.45
-SST4 less affected by dust aerosols, water vapor
-Improved quality filtering removed cold clouds and significant dust aerosol concentrations
-Introduction of SSES hypercube provides insight into bias and standard deviation trends as a function of time, latitude, temperature, satellite zenith angle, brightness temperature difference as a proxy for water vapor and retrieval quality level
-Hypercube developed and tested for Terra, in progress for Aqua
-Base code for SST and SST4 delivered to OBPG
-Delivery of Hypercube code in progress
ENDEND
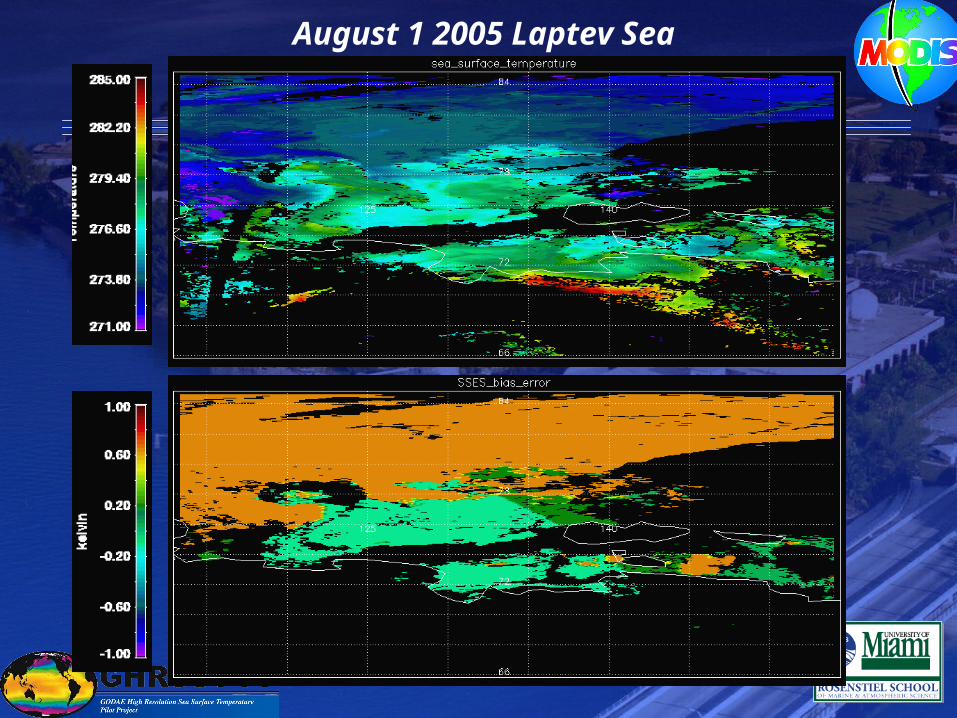
August 1 2005 Laptev Sea
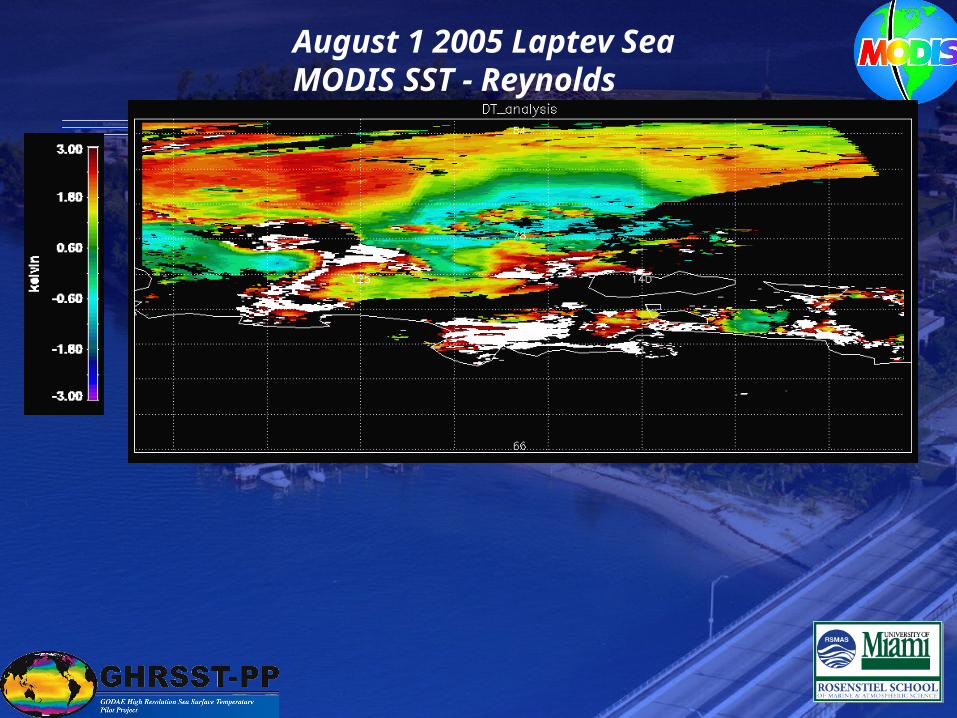
August 1 2005 Laptev SeaMODIS SST - Reynolds
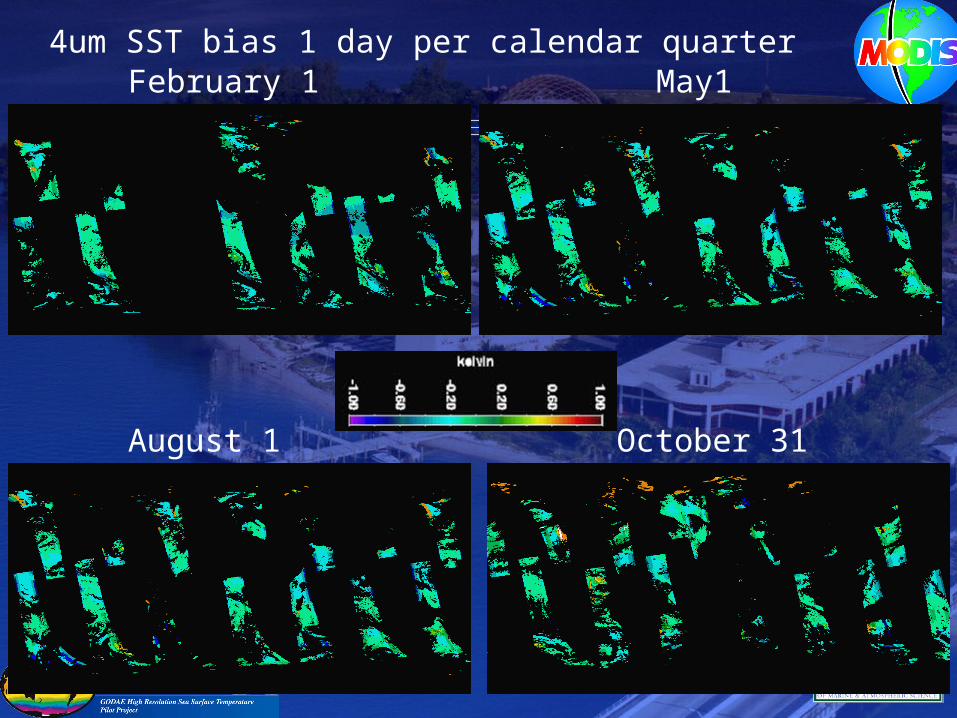
February 1 May1
October 31August 1
4um SST bias 1 day per calendar quarter
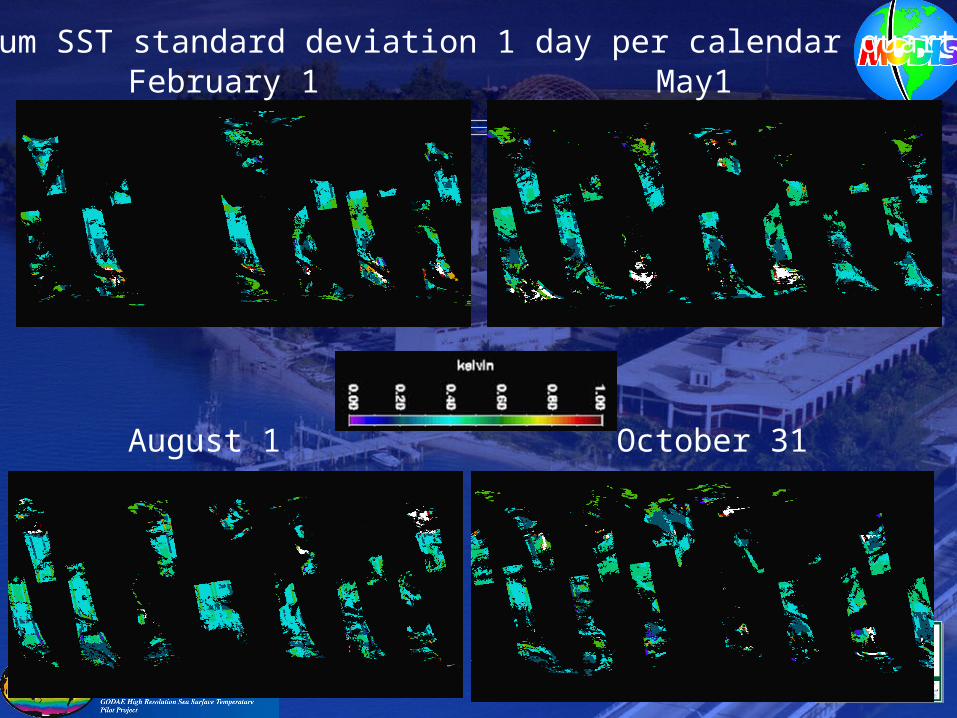
February 1 May1
October 31August 1
4 um SST standard deviation 1 day per calendar quarter
February 1 May1
October 31August 1
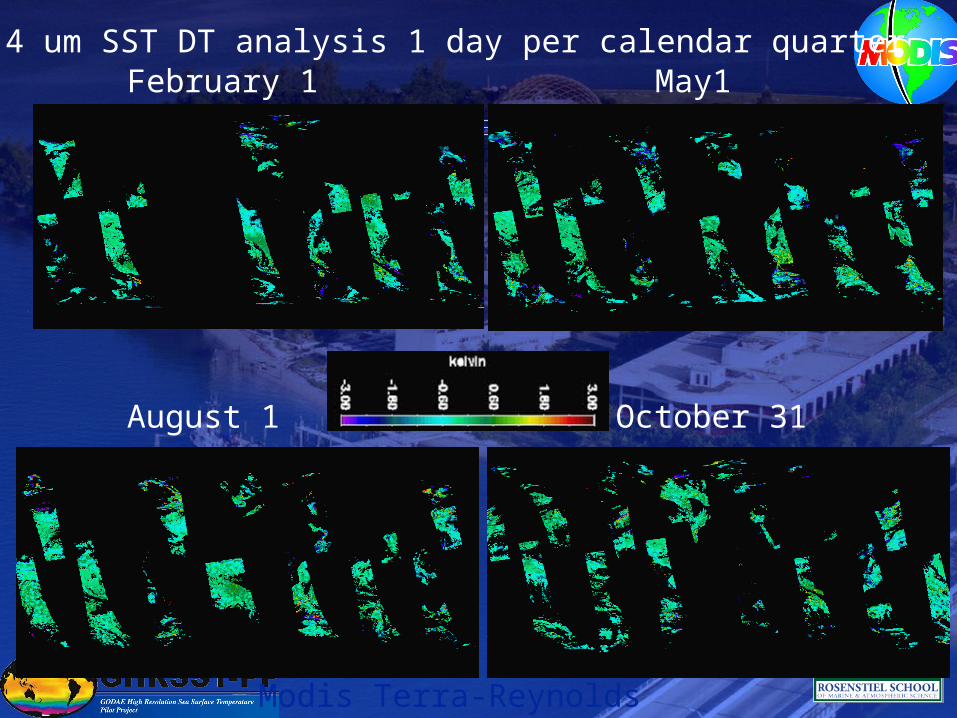
4 um SST DT analysis 1 day per calendar quarter
Modis Terra-Reynolds
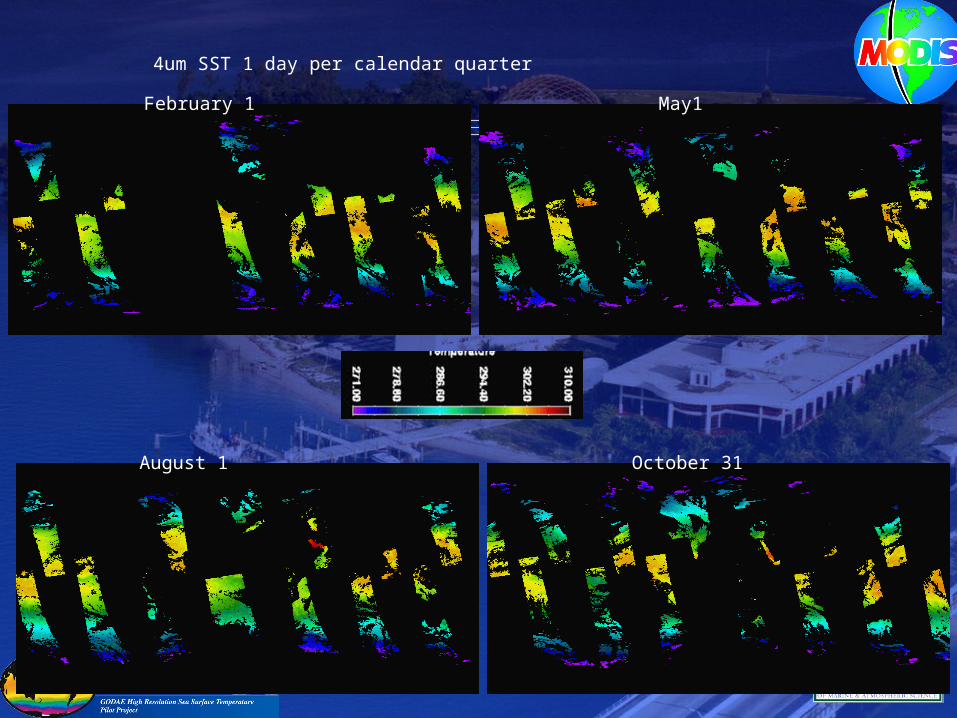
February 1 May1
October 31August 1
4um SST 1 day per calendar quarter
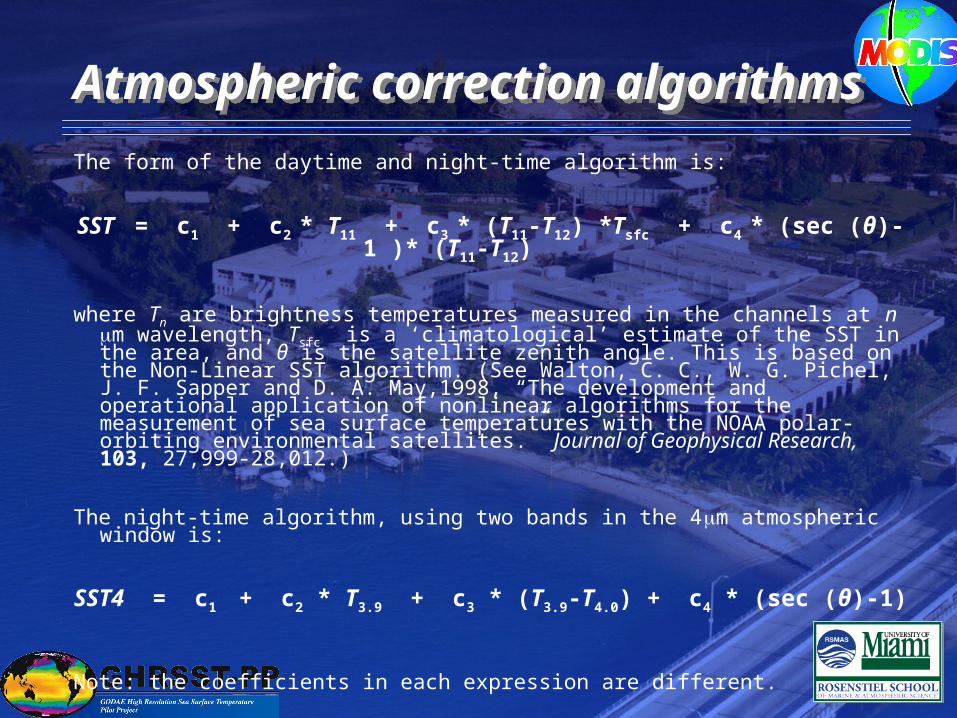
Atmospheric correction algorithmsAtmospheric correction algorithms
The form of the daytime and night-time algorithm is:
SST = c1 + c2 * T11 + c3 * (T11-T12) *Tsfc + c4 * (sec (θ)-1 )* (T11-T12)
where Tn are brightness temperatures measured in the channels at n m wavelength, Tsfc is a ‘climatological’ estimate of the SST in the area, and θ is the satellite zenith angle. This is based on the Non-Linear SST algorithm. (See Walton, C. C., W. G. Pichel, J. F. Sapper and D. A. May,1998, “The development and operational application of nonlinear algorithms for the measurement of sea surface temperatures with the NOAA polar-orbiting environmental satellites.” Journal of Geophysical Research, 103, 27,999-28,012.)
The night-time algorithm, using two bands in the 4m atmospheric window is:
SST4 = c1 + c2 * T3.9 + c3 * (T3.9-T4.0) + c4 * (sec (θ)-1)
Note: the coefficients in each expression are different.
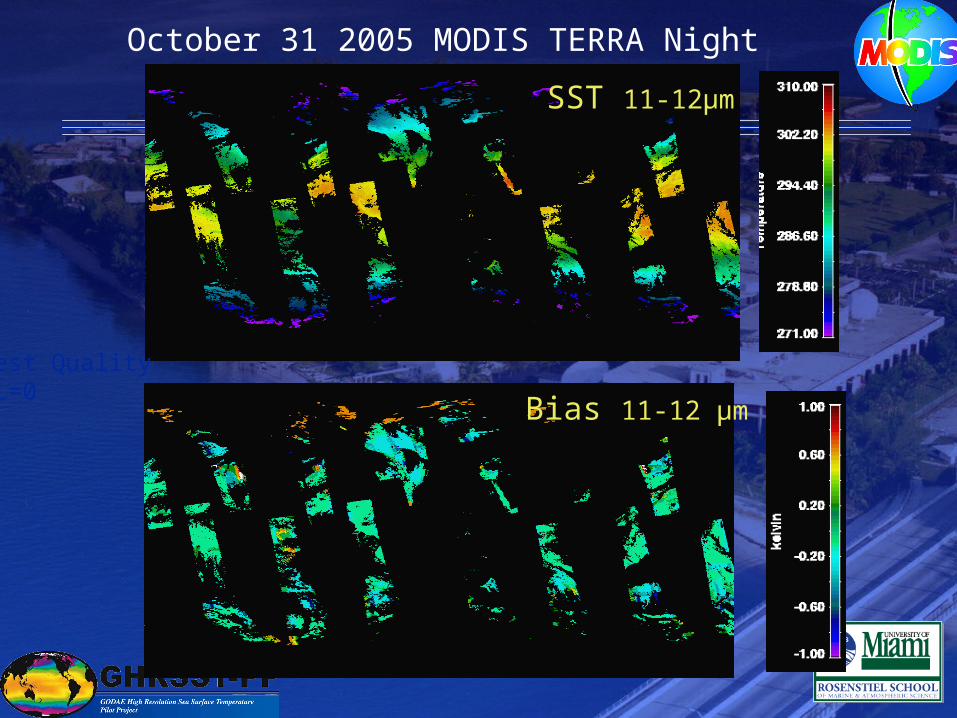
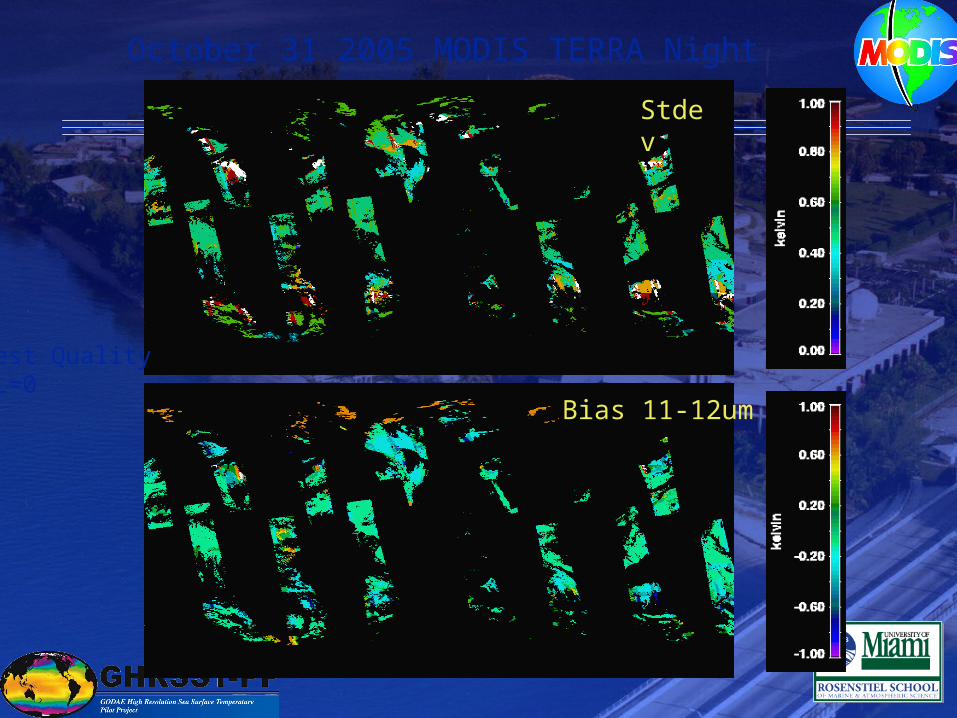
October 31 2005 MODIS TERRA Night
Bias 11-12 μm
Best Quality QL=0
SST 11-12μm
Bias 11-12um
Stdev
October 31 2005 MODIS TERRA Night
Best Quality QL=0
Bias 11-12 um
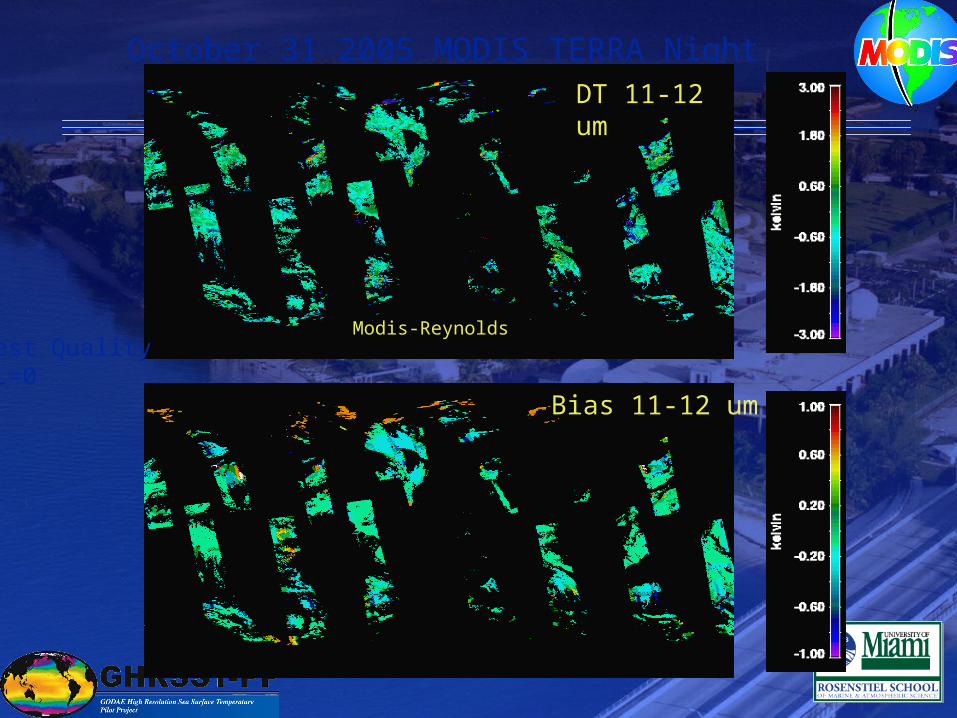
October 31 2005 MODIS TERRA Night
Best Quality QL=0
DT 11-12 um
Modis-Reynolds
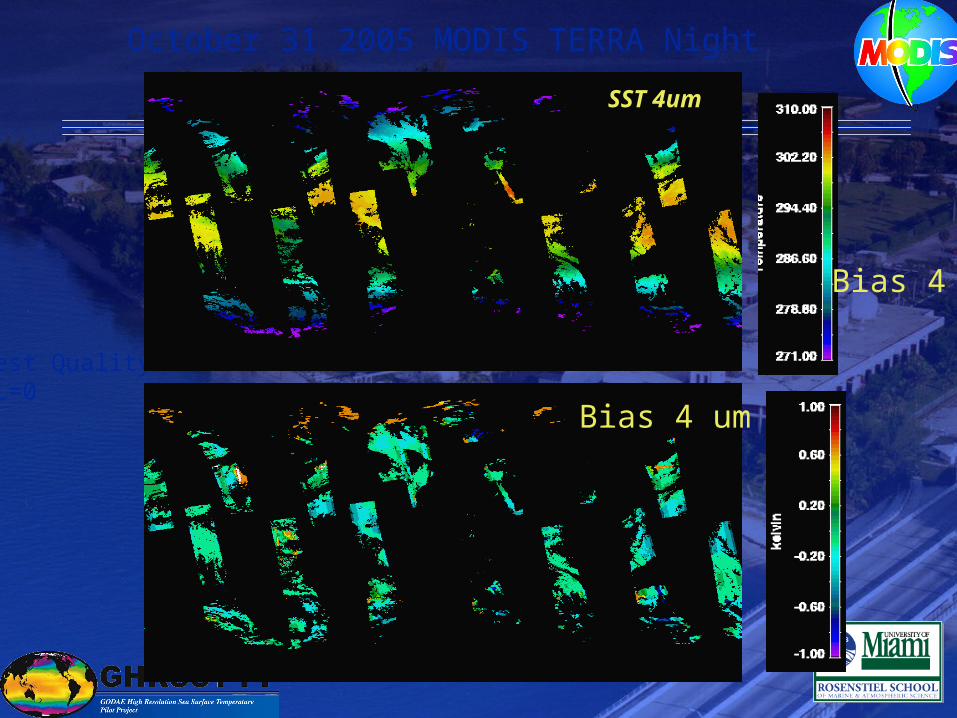
October 31 2005 MODIS TERRA Night
Bias 4 u
Best Quality QL=0
SST 4um
Bias 4 um
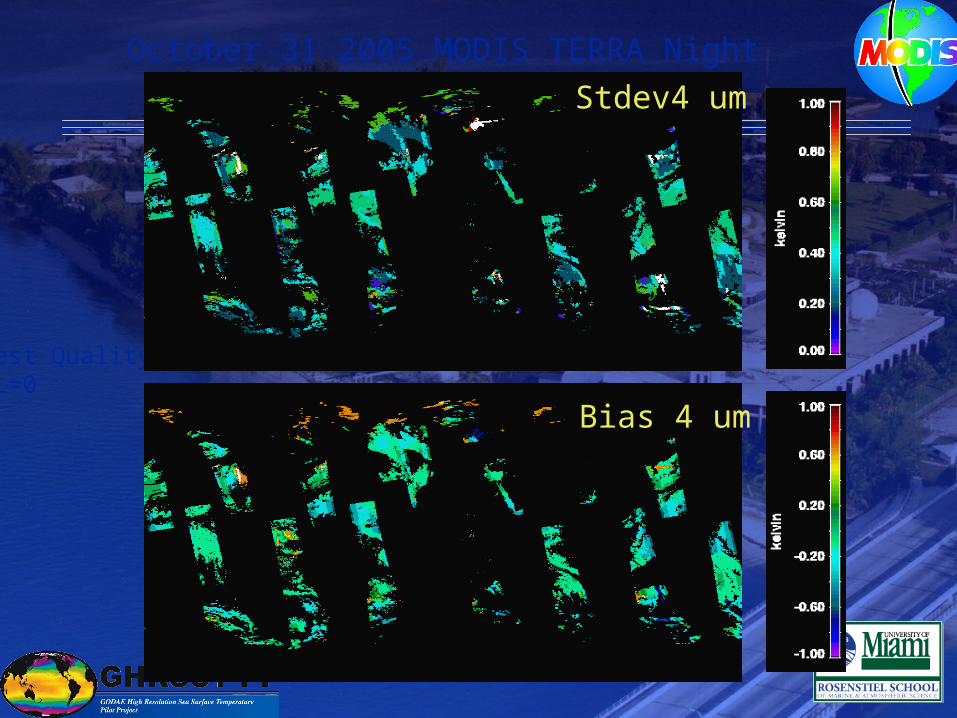
October 31 2005 MODIS TERRA Night
Best Quality QL=0
Bias 4 um
Stdev4 um
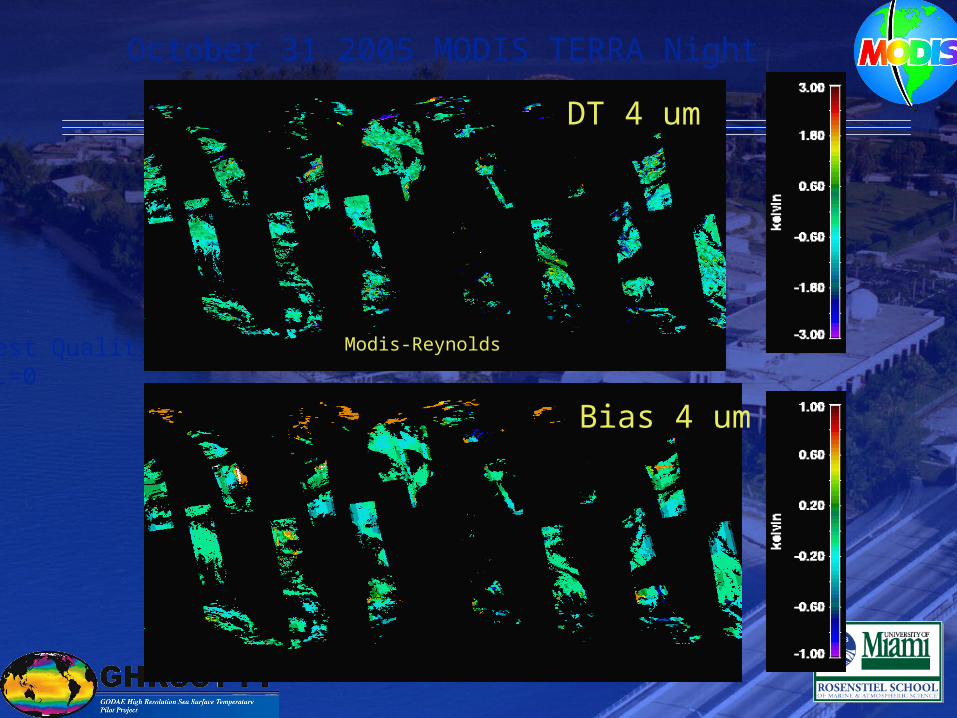
October 31 2005 MODIS TERRA Night
Best Quality QL=0
DT 4um
Bias 4 um
DT 4 um
Modis-Reynolds
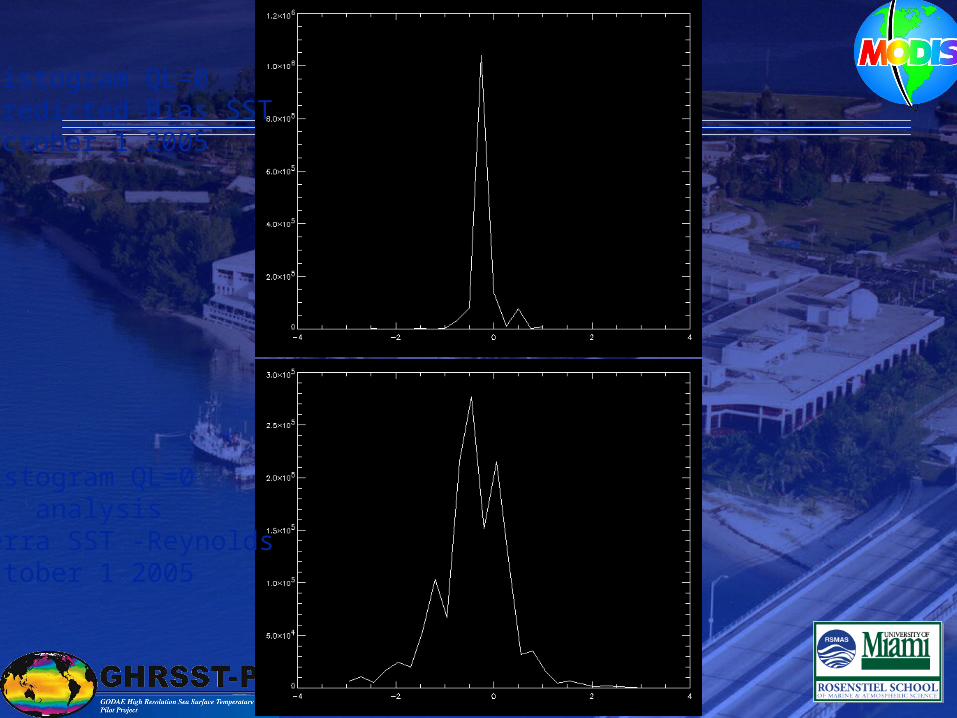
Histogram QL=0Predicted Bias SSTOctober 1 2005
Histogram QL=0DT analysisTerra SST -ReynoldsOctober 1 2005
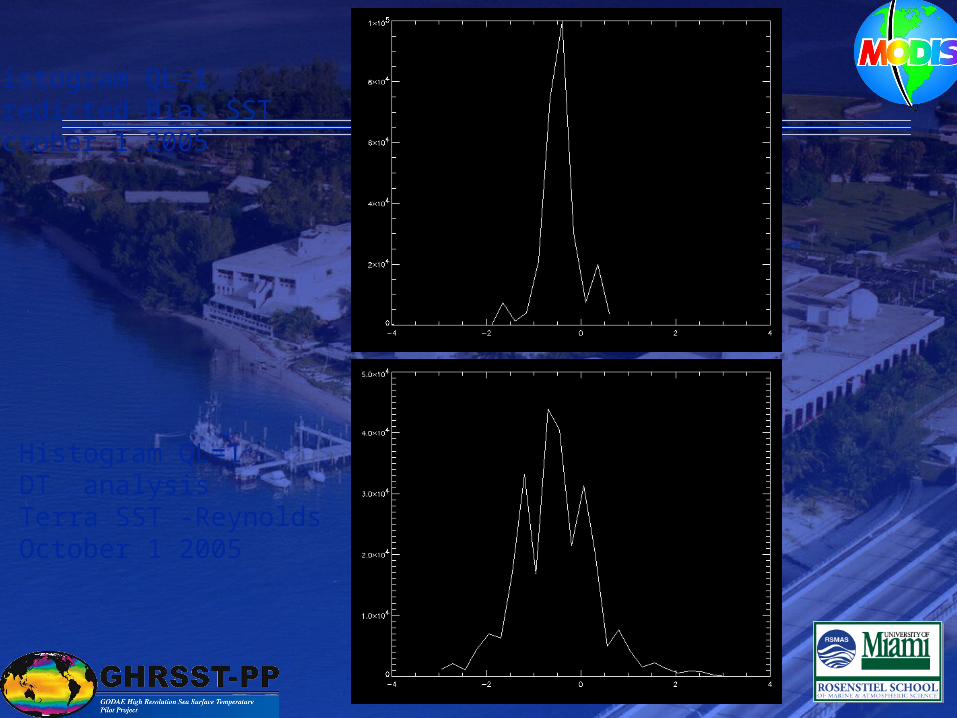
Histogram QL=1Predicted Bias SSTOctober 1 2005
Histogram QL=1DT analysisTerra SST -ReynoldsOctober 1 2005