module 2.8 overview and status of evolving · pdf filesource: radiotutorial n.d., . module...
TRANSCRIPT

Module 2.8 Overview and status of evolving technologies
REDD+ training materials by GOFC-GOLD, Wageningen University, World Bank FCPF 1
Module 2.8 Overview and status of evolving
technologies
Module developers:
Brice Mora, Wageningen University
Erika Romijn, Wageningen University
After the course the participants should be able to:
• Mention and characterize existing evolving
technologies in remote sensing for measuring
and monitoring purposes for REDD+; their
status and near-term developments
• Describe the measurement techniques using
LIDAR and RADAR data
US Forest Service
V1, May 2015
Creative Commons License

Module 2.8 Overview and status of evolving technologies
REDD+ training materials by GOFC-GOLD, Wageningen University, World Bank FCPF 2
Outline of lecture
1. Role of LIDAR observations for forest characterization and
experiences with LIDAR for monitoring purposes
2. The use of RADAR for forest monitoring

Module 2.8 Overview and status of evolving technologies
REDD+ training materials by GOFC-GOLD, Wageningen University, World Bank FCPF 3
Outline of lecture
1.Role of LIDAR observations for forest characterization
and experiences with LIDAR for monitoring purposes
2. The use of RADAR for forest monitoring

Module 2.8 Overview and status of evolving technologies
REDD+ training materials by GOFC-GOLD, Wageningen University, World Bank FCPF 4
LIDAR: Background and characteristics
LIght Detection And Ranging (LIDAR) technology uses active sensors
Information obtained from lasers to estimate the three-dimensional distribution of vegetation canopies as well as subcanopy topography
LIDAR systems classified as either full waveform or discrete return sampling systems, further divided into profiling and scanning systems
LIDAR sensors can estimate tree/stand height, volume, biomass, and stand crown closure
Ussyshkin 2011.

Module 2.8 Overview and status of evolving technologies
REDD+ training materials by GOFC-GOLD, Wageningen University, World Bank FCPF 5
Experiences for monitoring purposes (1/3)
Height estimates obtained from airborne remotely sensed LIDAR data have similar or better accuracy than field-based estimates
LIDAR measurement errors can be < 1.0 m for individual tree heights of a given species
LIDAR measurements have no saturation effect
Ground measurements required to estimate relationships between three-dimensional properties of LIDAR point cloud such as canopy height and canopy density and target biophysical properties of interest such as biomass, using parametric or nonparametric statistical techniques
A: spaceborne waveform, B: airborne waveform C: discrete return scanning LIDAR D: discrete return profiling LIDAR (Wulder et al. 2012)

Module 2.8 Overview and status of evolving technologies
REDD+ training materials by GOFC-GOLD, Wageningen University, World Bank FCPF 6
Experiences for monitoring purposes (2/3)
Wall-to-wall mode or sampling mode can be used to monitor large areas
Consider sources of error in ground allometric models
More research needed to better assess/consider model errors associated with three-stage LIDAR sampling methods
Co-registrations errors between ground plots and LIDAR data: larger plots (radius >=25m) provide improved biomass accuracy
Frazer et al. 2011.

Module 2.8 Overview and status of evolving technologies
REDD+ training materials by GOFC-GOLD, Wageningen University, World Bank FCPF 7
Experiences for monitoring purposes (3/3)
Costs: vary widely, depend on area to monitor (economies of scale possible). In Europe: $0.5-1.0 per hectare, greater in South America using local companies
Recent bids for complete, wall-to-wall LIDAR coverage for a REDD+ demonstration in Tanzania from European data providers were on the order of $0.5-1.0 per hectare
Airborne LIDAR technology may be more cost-effective than other remote sensing technologies, even when data are acquired free of charge, because fewer field observations may be needed to satisfy specified precision level
Photo credit: Spies and Olsen,
Oregon State U.

Module 2.8 Overview and status of evolving technologies
REDD+ training materials by GOFC-GOLD, Wageningen University, World Bank FCPF 8
Data availability and required national capacities (1/2)
Spaceborne LIDAR data available globally based upon GLAS data, freely available through the National Snow and Ice Data Center, NSIDC (operational period: 2003–2009)
Airborne LIDAR data can be acquired for any part of the world, with coverage on-demand via commercial agencies
Airborne data can be collected theoretically anywhere, but costs are typically greater for more unusual locations and where implementation of the survey is more difficult
Airborne data can be collected by a variety of instruments, over a range of settings, resulting in data with varying qualities
Low-flying aircraft requires agreements / participation of national agencies

Module 2.8 Overview and status of evolving technologies
REDD+ training materials by GOFC-GOLD, Wageningen University, World Bank FCPF 9
Data availability and required national capacities (2/2)
Mora et al. 2013.

Module 2.8 Overview and status of evolving technologies
REDD+ training materials by GOFC-GOLD, Wageningen University, World Bank FCPF 10
Status, expected near-term developments, and long-term sustainability
Currently no operational space laser
NASA working toward development of new spaceborne LIDAR mission to be flown on ICESat II with utility for estimation of vegetation structure, height, and biomass currently unknown
Launch of ICESat II scheduled for 2017 (http://icesat.gsfc.nasa.gov/icesat2/mission_overview.php)
LIDAR Surface Topography mission (LIST) to collect global LIDAR data over a five-year mission also planned for launch in the 2020s by NASA

Module 2.8 Overview and status of evolving technologies
REDD+ training materials by GOFC-GOLD, Wageningen University, World Bank FCPF 11
Applicability of LIDAR for forest monitoring (1/2)
LIDAR is an emerging technology in terms of large-area monitoring, especially for REDD+
However, well established as a data source for contributing to satisfaction of forest management and science objectives
Capacity for LIDAR to characterize biomass and biomass change over time positions the technology well to meet REDD+ information needs
“Costs to a program need to be vetted against the information that is acquired, how this information meets the specified needs, and the degree to which the reduction in uncertainty from LIDAR-based estimates offsets initial costs” (Wulder et al. 2012)

Module 2.8 Overview and status of evolving technologies
REDD+ training materials by GOFC-GOLD, Wageningen University, World Bank FCPF 12
Applicability of LIDAR for forest monitoring
(2/2)
De Sy et al. 2012.
Very suitable
Suitable
Contributing
Limited to no
technical
capabilities
Technical capabilities of remote sensing sensors for the generation of (national) REDD+ information products
Module 2.8 Overview and status of evolving technologies
REDD+ training materials by GOFC-GOLD, Wageningen University, World Bank FCPF 13
In summary
LIDAR technology uses active sensors
LIDAR sensors can estimate tree/stand height, volume, biomass, and stand crown closure
LIDAR measurements have high accuracy, comparable to field measurements
Relationships are established between three-dimensional properties of LIDAR point cloud (canopy height and canopy density) and biophysical properties (biomass), using allometric equations
LIDAR is an emerging technology in terms of large-area forest monitoring, especially for REDD+

Module 2.8 Overview and status of evolving technologies
REDD+ training materials by GOFC-GOLD, Wageningen University, World Bank FCPF 14
Outline of lecture
1. Role of LIDAR observations for forest characterization and
experiences with LIDAR for monitoring purposes
2.The use of RADAR for forest monitoring

Module 2.8 Overview and status of evolving technologies
REDD+ training materials by GOFC-GOLD, Wageningen University, World Bank FCPF 15
Synthetic Aperture Radar (SAR) technology
SAR sensors used since the 1960s to produce images of earth-surface based on the principals of radar (radio detection and ranging) reflectivity
SAR based on relative motion between sensor’s antenna and target: implemented using usually a moving platform (aircraft, space shuttle, satellite)
Radar is an active system, meaning it serves as the source of its own electromagnetic energy

Module 2.8 Overview and status of evolving technologies
REDD+ training materials by GOFC-GOLD, Wageningen University, World Bank FCPF 16
Radar backscattering mechanisms (1/3)
Source: Lopez-Dekker 2011.
• Radar transmits a pulse (travelling velocity is equal to velocity of light)
• Some of the energy in the radar pulse is reflected back toward the radar
• This is what the radar measures: It is known as radar backscatter σ0

Module 2.8 Overview and status of evolving technologies
REDD+ training materials by GOFC-GOLD, Wageningen University, World Bank FCPF 17
Radar backscattering mechanisms (2/3)
Source: Thiel 2011.

Module 2.8 Overview and status of evolving technologies
REDD+ training materials by GOFC-GOLD, Wageningen University, World Bank FCPF 18
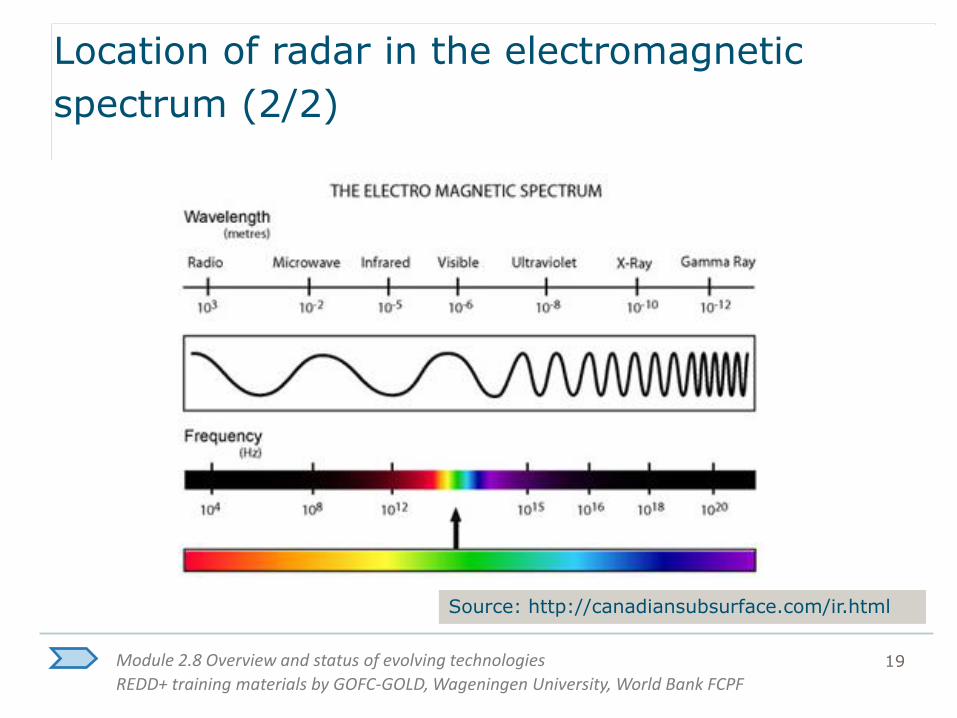
Location of radar in the electromagnetic spectrum (1/2)
While optical sensors operate primarily in the visible and infrared (ca. 0.4-15.0 μm) portions of electromagnetic spectrum, radar sensors operate in microwave region (ca. 3-70 cm)
Electromagnetic waves in visible and infrared range are scattered by atmospheric particulates (e.g., haze, smoke, and clouds); microwave signals generally penetrate through them
=> added value for imaging tropical forests covered by clouds
Module 2.8 Overview and status of evolving technologies
REDD+ training materials by GOFC-GOLD, Wageningen University, World Bank FCPF 19
Location of radar in the electromagnetic
spectrum (2/2)
Source: http://canadiansubsurface.com/ir.html

Module 2.8 Overview and status of evolving technologies
REDD+ training materials by GOFC-GOLD, Wageningen University, World Bank FCPF 20
Preprocessing of radar signal
Radar signal requires preprocessing to deal with:
● Geometric distortions such as foreshortening and layover
● Topographic effects resulting in different illumination conditions in the scene
● Speckle noise
Commercial and noncommercial software are available

Module 2.8 Overview and status of evolving technologies
REDD+ training materials by GOFC-GOLD, Wageningen University, World Bank FCPF 21
ALOS Palsar FBD data
From Alaska Space Facility (vast archive for South America, Africa, SE Asia)
Can be used from NGOs etc.
End User License Agreement, on every image should be stated:
Includes Material (c) JAXA, METI [year]
Radar Processing
FAO / Norway SEPAL Progress Report 17/09/2015

Module 2.8 Overview and status of evolving technologies
REDD+ training materials by GOFC-GOLD, Wageningen University, World Bank FCPF 22
SAR data
● Main advantages:
● No clouds
● Day and nighttime (i.e. active sensor)
● Sensitive to biomass (especially L-Band like ALOS Palsar)
Example Zambia
● ~ 400 scenes (750000km2)
● Processing duration: ~ 5 days
● Output data size of final stack: 77GB
Radar Processing
FAO / Norway SEPAL Progress Report 17/09/2015

Module 2.8 Overview and status of evolving technologies
REDD+ training materials by GOFC-GOLD, Wageningen University, World Bank FCPF 23
Tanzania 2007
FAO / Norway SEPAL Progress Report 17/09/2015
Includes Material (c) JAXA, METI 2010

Module 2.8 Overview and status of evolving technologies
REDD+ training materials by GOFC-GOLD, Wageningen University, World Bank FCPF 24
Uganda 2007
FAO / Norway SEPAL Progress Report 17/09/2015
Includes Material (c) JAXA, METI 2010

Module 2.8 Overview and status of evolving technologies
REDD+ training materials by GOFC-GOLD, Wageningen University, World Bank FCPF 25
Topographic effects
Shadowing
Source: Radiotutorial n.d., http://www.radartutorial.eu/20.airborne/ab07.en.html.

Module 2.8 Overview and status of evolving technologies
REDD+ training materials by GOFC-GOLD, Wageningen University, World Bank FCPF 26
Radar band characteristics (1/4)
Band Typical
frequency (GHz)
Wave-length (cm)
P 0,350 85
L 1.3-1.4 23-21
C 5.3-5.4 5.6-5.5
X 9.65 3.1
Ku 12-18 2.5-1.6
Ka 35 0.8
Active: radars illuminate the target so that they can operate day and night
Microwave frequencies:
● Electromagnetic waves penetrate to some extent through media
● At most frequencies clouds are transparent
Complex interaction with medium or target: a radar image is not a photo
Spatial resolution fundamentally constrained:
● Do not expect 1cm resolution SAR images at C-band

Module 2.8 Overview and status of evolving technologies
REDD+ training materials by GOFC-GOLD, Wageningen University, World Bank FCPF 27
Radar band characteristics (2/4)
Source: Lopez-Dekker 2011.

Module 2.8 Overview and status of evolving technologies
REDD+ training materials by GOFC-GOLD, Wageningen University, World Bank FCPF 28
Radar band characteristics (4/4)
C Band L Band
Forest at different frequencies
Source: Thiel 2011.

Module 2.8 Overview and status of evolving technologies
REDD+ training materials by GOFC-GOLD, Wageningen University, World Bank FCPF 29
Radar for forest monitoring
Global ALOS PALSAR color composite mosaic (Red:HH, Green:HV, Blue:HH/HV), 25 m pixel spacing, 70,000 scenes, acquired between June-October 2009
Source: JAXA 2009.

Module 2.8 Overview and status of evolving technologies
REDD+ training materials by GOFC-GOLD, Wageningen University, World Bank FCPF 30
Radar for forest monitoring
SAR (Shuttle Radar Topography Mission SRTM data) demonstrated capacity for retrieving forest height across larger areas:
JERS-1 SAR mission provided first consistent pan-tropical and pan-boreal observations; long wavelength L-band SAR data proved useful for forest/nonforest classification and identification of secondary growth
L-band data also facilitated temporal mapping of standing water below closed-canopy forests with time-series => floodplain versus swamp forests differentiation

Module 2.8 Overview and status of evolving technologies
REDD+ training materials by GOFC-GOLD, Wageningen University, World Bank FCPF 31
Past, current, and future SAR missions (1/2)
Satellites/ sensors
Period of operation
Band
Wave-length (cm)
Polarisation Spatial resolution (m)
Orbital repeat (days)
ERS-1 1991–2000 C 5.6 Single (VV) 26 3–176
JERS-1 1992–1998 L 23.5 Single (HH) 18 44
ERS-2 1995–2011 C 5.6 Single (VV) 26 35
RADARSAT 1 1995-2013 C 5.6 Single (HH) 8–100 3-24
ENVISAT/
ASAR 2002–2012 C 5.6 Single, Dual 30-1000 35
ALOS/
PALSAR 2006–2011 L 23.6
Single, Dual,
Quad 10–100 46
RADARSAT 2 2007– C 5.6 Single, Dual,
Quad 3–100 24
TerraSAR-X
TanDEM-X
2007–
2010–
X 3.1
Single, Dual,
Interfero-
metric
1–16 11

Module 2.8 Overview and status of evolving technologies
REDD+ training materials by GOFC-GOLD, Wageningen University, World Bank FCPF 32
Past, current, and future SAR missions (2/2)
Satellites/ sensors
Period of operation
Band
Wave-length (cm)
Polarisation Spatial resolution (m)
Orbital repeat (days)
COSMO- SkyMed
2007– X 3.1 Single, Dual 1–100 16
RISAT-1 2012– C 5.6 Single, Dual,
Quad 1–50
25
ALOS-2/ PALSAR-2
2014– L 23.8 Single, Dual,
Quad 1–100 14
Sentinel-1A Sentinel-1B
1A: 2014–
1B: scheduled 2015
C 5.6 Single, Dual,
Quad 91–5 12
SAOCOM-1A SAOCOM-1B
Scheduled 2015, 2016
L 23.5 Single, Dual,
Quad 101–00 16
NovaSAR Scheduled 2015
S 9.4
Single, Dual, Triple, Quad
6–30 14
RADARSAT Constellation 1/2/3
Scheduled 2018
C 5.6
Single, Dual, Quad
1–100 12
BIOMASS Scheduled 2020
P 69.0 Quad 50 Varying

Module 2.8 Overview and status of evolving technologies
REDD+ training materials by GOFC-GOLD, Wageningen University, World Bank FCPF 33
SAR data capabilities for forest cover monitoring and biomass estimation
SAR data useful in heavy cloud and rain-affected regions
SAR provides complementary information to optical data on forest/land use cover
Opportunities for improved forest monitoring and biomass estimation through integration of SAR, optical and LIDAR
SAR capacity demonstrated at subnational and regional levels

Module 2.8 Overview and status of evolving technologies
REDD+ training materials by GOFC-GOLD, Wageningen University, World Bank FCPF 34
SAR capabilities for forest monitoring
L-band SAR: demonstrated potential for forest cover and
change monitoring using time-series dual polarization data
(cross-pol most sensitive to forest structure)
Use of JERS-1 to generate a historic baseline, against which
forest cover change can be monitored using more recent ALOS
PALSAR (and ongoing monitoring using ALOS-2)
C-band (R&D): dense time-series of observations typically
required for accurate detection of forest cover change
X-band (R&D): application in forest degradation
assessment, e.g., selective logging where partial or complete
removal of canopy can be detected; also forest height
estimation using TanDEM-X

Module 2.8 Overview and status of evolving technologies
REDD+ training materials by GOFC-GOLD, Wageningen University, World Bank FCPF 35
SAR capabilities for biomass estimation (1/2)
Approaches to AGB estimation: model-based inversion and
canopy height retrieval
InSAR technique to retrieve canopy height, combined with
allometrics and ground data to estimate biomass
Signal saturation:
● C-band: < 50t/ha
● L-band: up to 100t/ha
● P-band: > 300t/ha
● combination with optical: up to 400t/ha
Combination of different polarizations (e.g., C-HV/C-HH
ratio) can improve biomass estimates

Module 2.8 Overview and status of evolving technologies
REDD+ training materials by GOFC-GOLD, Wageningen University, World Bank FCPF 36
SAR capabilities for biomass estimation (2/2)
SAR-based retrieval may be affected by terrain, rainfall, soil
moisture, localized algorithm development, saturation levels
Calibration of algorithms requires reliable ground data
SAR AGB retrieval has been more successful in temperate and
boreal forests compared to tropical forests (fewer species,
lower biomass)
Multisensor approaches (SAR-LiDAR, SAR-LiDAR-Optical)
are promising (demonstrated in the United States, Amazon,
Australia, Nepal, Borneo)
Biomass change estimation:
● Two observations in time to model change
● Modelling biomass for each time and take difference

Module 2.8 Overview and status of evolving technologies
REDD+ training materials by GOFC-GOLD, Wageningen University, World Bank FCPF 37
- Combining datasets for: - Forest / non-forest - Change detection - Biomass - Example country: Zambia
FAO / Norway SEPAL Progress Report 17/09/2015
SEPAL Data Integration

Module 2.8 Overview and status of evolving technologies
REDD+ training materials by GOFC-GOLD, Wageningen University, World Bank FCPF 38
FAO / Norway SEPAL Progress Report 17/09/2015
Biomass - Optical (Landsat) Only

Module 2.8 Overview and status of evolving technologies
REDD+ training materials by GOFC-GOLD, Wageningen University, World Bank FCPF 39
FAO / Norway SEPAL Progress Report 17/09/2015
Biomass - RADAR (ALOS) Only

Module 2.8 Overview and status of evolving technologies
REDD+ training materials by GOFC-GOLD, Wageningen University, World Bank FCPF 40
FAO / Norway SEPAL Progress Report 17/09/2015
Biomass - Optical + RADAR

Module 2.8 Overview and status of evolving technologies
REDD+ training materials by GOFC-GOLD, Wageningen University, World Bank FCPF 41
Applicability of radar for forest monitoring
De Sy et al. 2012.
Very suitable
Suitable
Contributing
Limited to no
technical
capabilities
Technical capabilities of remote sensing sensors for the generation of (national) REDD+ information products

Module 2.8 Overview and status of evolving technologies
REDD+ training materials by GOFC-GOLD, Wageningen University, World Bank FCPF 42
In summary
Radar is an active system based on the principles of radar
reflectivity: backscattering of canopy, volume, and surface.
Radar sensors operate in the microwave region and are able
to penetrate through clouds.
System parameters and surface conditions influence
backscattered energy intensity.
Preprocessing is needed to remove geometric distortions such as foreshortening and layover, topographic effects, and speckle noise.
Currently operational SARs systems operate in wavelengths from X-, C- to L-bands with different functionalities.
Opportunities for improved forest monitoring and biomass estimation exist through integration of SAR, optical, and LIDAR.