mof contract no. en0987a007 evaluation of timber deck ... · each of the ties is modeled with a...
TRANSCRIPT

MoF Contract No. EN0987A007
Evaluation of timber deck systems to develop rational engineering design and analysis of
existing systems
Ricardo O. Foschi
July 15, 2010

1. The objective:
An evaluation of the performance of wood decks in British Columbia bridges, with an assessment vis-à-vis the CSA-S6 bridge Code guidelines.
As this CSA-S6 Code is a Limit States Design document, the evaluation is carried out using a full reliability analysis of bridge timber decks, independently from S6 recommendations.
The code contains checking equations including load and resistance factors, which are supposed to lead to a desired target reliability. Here the aim is to calculate the reliability directly, using actual applied loads for B.C and a structural model for the bridge deck, and comparing the reliability level with the target in the Code.
The bridges analyzed here consist of a timber deck over two main steel girders. The deck consists of timber ties, one (or two) wood plank layers on top of the ties, and guard rails on either side of the deck.
2

Bridge deck configuration:
Δ ΔcΔcTie support 3

2. The Structural Model:
The structure is modeled as beams (the ties), with a perpendicular plate of up to two layers (the planks). Under the transverse loads from the truck load patches, the deflection of the ties and the planks must also account for the influence of shear deformation. The planks form a plate with bending stiffness in one direction only (Y), with no stiffness in the perpendicular direction (X) and no torsional stiffness.
The modulus of elasticity E for each of the ties varies randomly between ties, but obey the same probability distribution. In general, the bending strength of a tie is positively correlated with its modulus of elasticity. Similarly, the moduli of elasticity E for the planks are random variables obeying corresponding probability distributions.
4
1 2
W1 W2
L
Xθ1 θ2
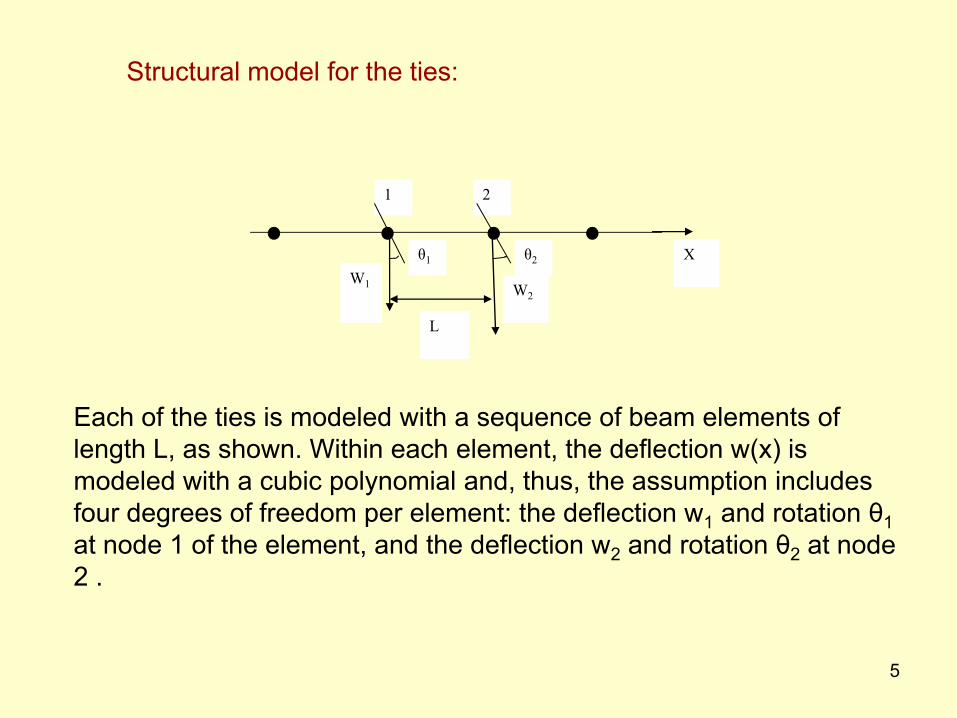
Structural model for the ties:
Each of the ties is modeled with a sequence of beam elements of length L, as shown. Within each element, the deflection w(x) is modeled with a cubic polynomial and, thus, the assumption includes four degrees of freedom per element: the deflection w1 and rotation θ1at node 1 of the element, and the deflection w2 and rotation θ2 at node 2 .
5

Each tie is subdivided into 6 elements, corresponding to 7 nodes. Each of the cantilever sections ∆C contains one element, with 4 elements assigned to the main span ∆. With 2 degrees of freedom per node, the total of degrees of freedom (unknowns) for the system is
NDOF = 14 NT
in which NT is the number of ties included in the system.
As the spacing of the ties is approximately S = 0.40m in BC bridges, and since the model must account for a nominal truck length of around 20m, the number of ties in the calculation model is NT = 50, and the number of unknowns (degrees of freedom or size of the problem) is, therefore, NDOF = 700.
6
2
22
6
3)25.01(2
636
3)5.01(3)25.01(2
)1(2
Lsym
Lg
LLL
Lg
Lg
gLIEK
−+⋅
−
−−+⋅
⋅+
=
2
2.1 ⎟⎠⎞
⎜⎝⎛=
LH
GEgbeam
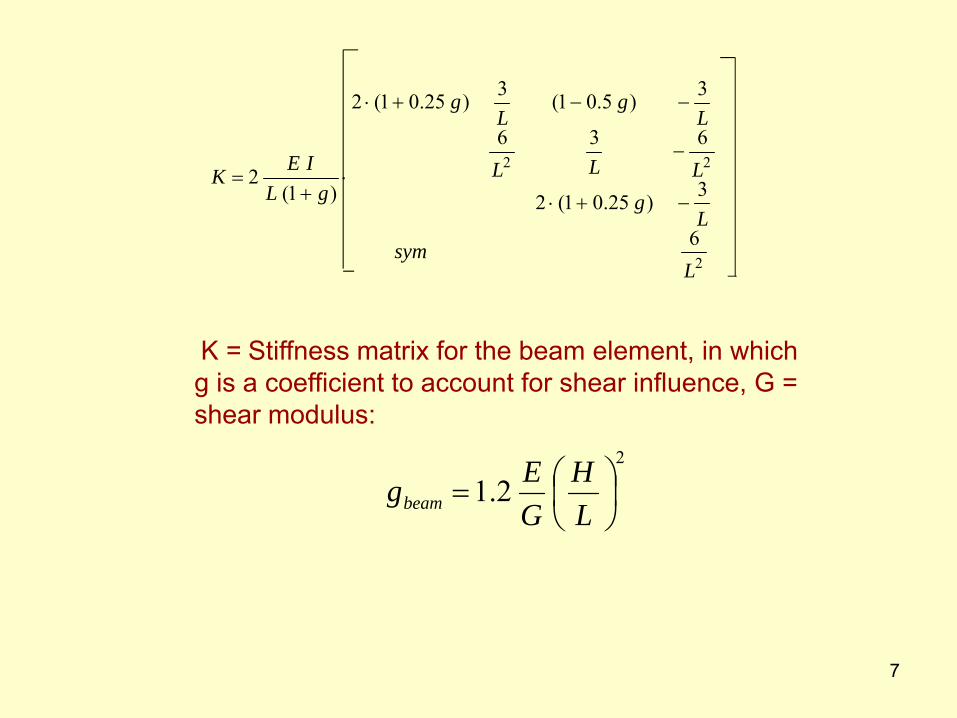
K = Stiffness matrix for the beam element, in which g is a coefficient to account for shear influence, G = shear modulus:
7

3. Truck loading data and their statistical representation.
Truck loading information was taken from three previous reports submitted by Buckland and Taylor Ltd. to the Ministry of Forests (1/2003, 11/2003 and 10/2004). These reports analyzed data based on scale surveys of logging truck vehicles in British Columbia.
The weight surveys were conducted by the Forest Engineering Research Institute of Canada (FERIC). The data were obtained in two main phases. Phase I (1/2003) contained information on 1) logging trucks generally conforming to the description of L75 loading and operating in the Interior region of BC, and 2) off-highway logging trucks (L150-L165) operating in Coastal regions. The data also included axle weight distributions (including side to side variations).
Phase II used a much more extensive amount of weight scale data for logging trucks operating in either the Interior or the Coastal regions of BC. A Phase III (10/2004) added additional data for the Coastal region.
8

9

The number of samples N collected over a period of time, were
N = 123 for L75 (Phase I)N = 78 for L150-165 (Phase I)N = 82036 for Interior BC (Phase II)N = 14055 for Coastal BC (Phase II + additional from Phase III)
10
L-75
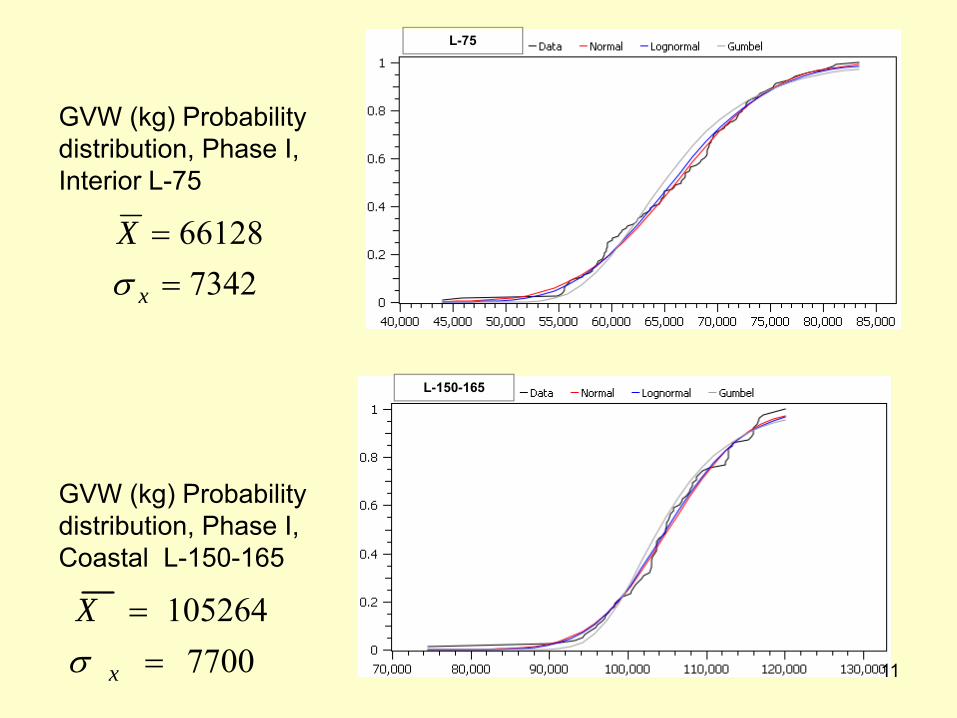
GVW (kg) Probability distribution, Phase I, Interior L-75
L-150-165
GVW (kg) Probability distribution, Phase I, Coastal L-150-165
7700105264
==
x
Xσ
734266128==
x
Xσ
11
Normal
L 75 L 100
Normal
L 75 L 100
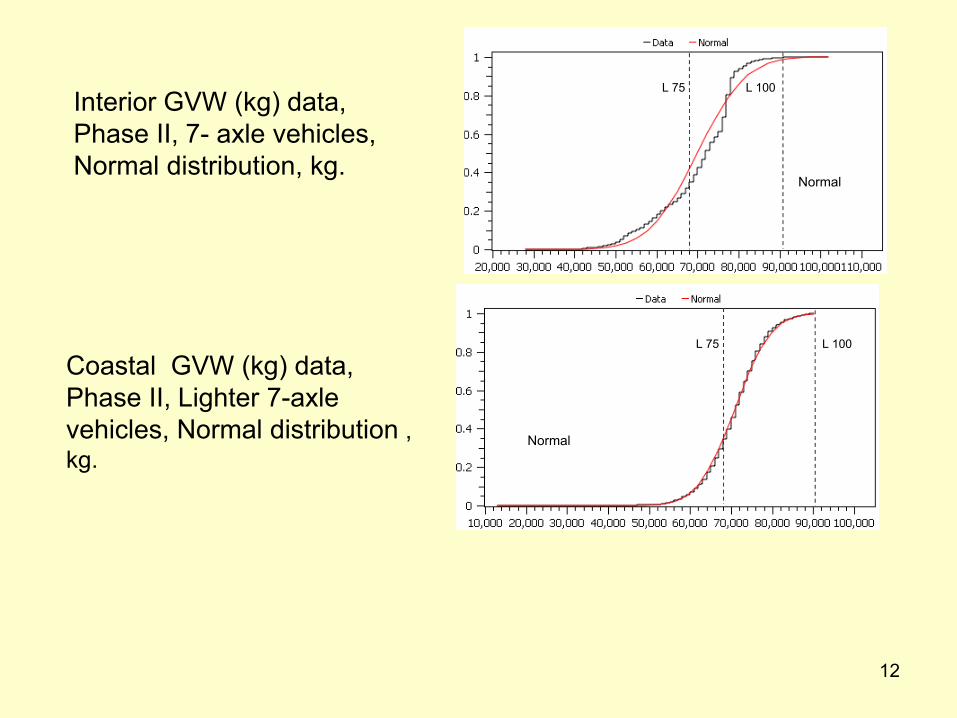
Coastal GVW (kg) data, Phase II, Lighter 7-axle vehicles, Normal distribution , kg.
Interior GVW (kg) data, Phase II, 7- axle vehicles, Normal distribution, kg.
12

Normal
L 165
Coastal GVW (kg) data, Phase II, Heavy 5-axle vehicles, Normal distribution
Axle load distribution and imbalance:
13
Structural Analysis, sample results
Example 1, one load patch, GVW = 1000 kN, symmetric loading.
The program DECK was run for the following example: 50 ties, spaced 0.4m o.c.Tie dimensions 0.20m x 0.30mCantilever span ∆C = 0.9m, main span ∆ = 3.0mAll ties with the same E = 10,000 x 103 kN/m21 plank, thickness = 0.10m and E = 10,000 x 103 kN/m2 (DECK can
accept two planks, but this example considers only one)Nail stiffness tie/plank = 1,500 kN/m , nail spacing 0.4mApplied load: One patch, 0.40m x 1.60m, applied at x = 2.025m and y =
0.4m.
The x-y location of the patch puts it on a symmetric position across the width of the deck.
14
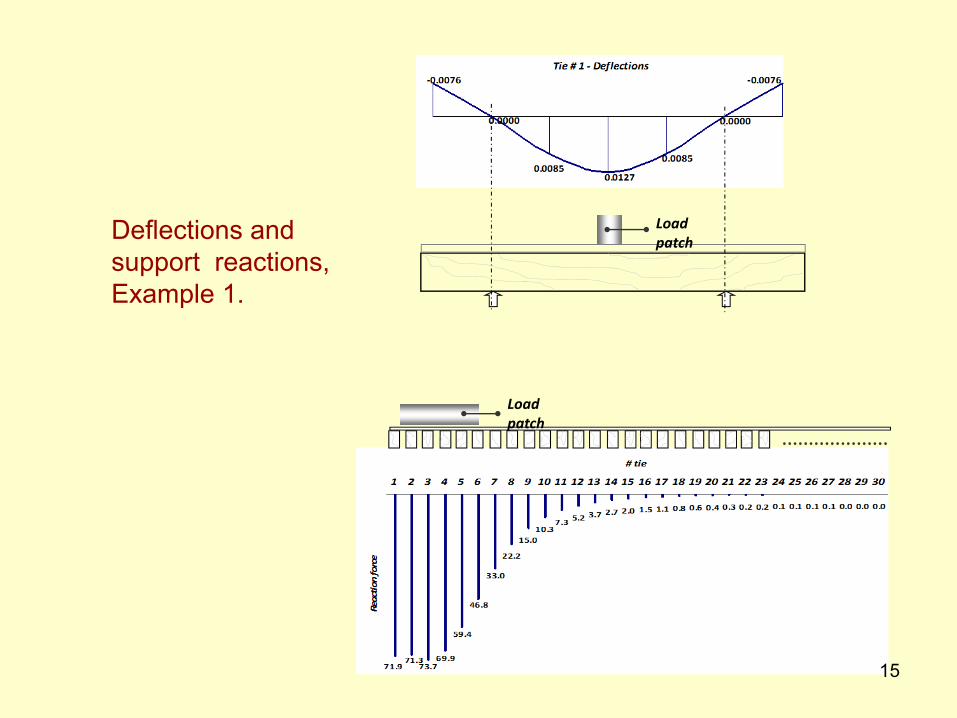
Loadpatch
Loadpatch
Deflections andsupport reactions,Example 1.
15

Example No. 2, 5-axle truck, GVW = 100000kg (1000kN), not symmetric.
The program DECK was run for the following example: 50 ties, spaced 0.406m o.c.Tie dimensions 0.20m x 0.30mCantilever span ∆C = 0.64m, main span ∆ = 3.6mAll ties with the same E = 10,000 x 103 kN/m21 plank, thickness = 0.10m and E = 10,000 x 103 kN/m2Nail stiffness tie/plank = 1,500 kN/m , nail spacing 0.4m
Applied load: 5-axle truck, 10 load patches. The dimensions of the patches for the steering axle are 0.33m x 0.40m, while those for the drive and the trailer are 0.77m x 0.40m. The coordinates of the front wheel patch are x = 1.47m and y = 0.40m. This x-y location gives an un-symmetric truck position across the width of the deck.
The length of the deck with 50 ties @ 0.406m o.c. is 19.89m. The coordinates x and y could change within the limits: 0.0m < x < 1.57m (for the limits the truck touches the curbs) and 0.0m < y < 3.69m, for the entire truck to be contained within the deck segment.
16

5-axle truck, GVW = 100000kg (1000kN),
Deflections for un-symmetric loading, tie #1
17

5-axle truck, GVW = 100000kg (1000kN),
Reactions for un-symmetric loading
Light side loading
Heavy side loading
18
4. Reliability Analysis
The reliability analysis included consideration of 3 failure modes involving 56 different random variables.
Random variables
X(1) – X(50) the modulus of elasticity E for the ties. These were different variables but assumed to obey the same probability distribution. This was justified on the assumption that all ties would come from the same stock. The probability distribution chosen was a Lognormal.
X(51) the bending strength for the ties. This variable was assumed to obey a 2-parameter Weibull distribution, based on experience from testing dimension lumber in bending.
19

X(52) coordinate X for the location of the truck, assumed to be uniform between limits controlled by the distance between curbs and the overall width of the truck.
X(53) coordinate Y for the location of the truck along the bridge, also assumed to be uniform between the limits controlled by the length of the deck and the length of the truck.
X(54) the GVW of the truck, to be used with the ratio between the actual GVW and 1000kN, the load used for the structural analysis. This variable is taken to be Normally distributed.
X(55) the shear strength of the wood in the tie, given for a unit volume (1m3) under uniform shear. From Foschi and Barrett (1976), this variable follows a 2-parameter Weibull distribution. For Douglas fir, the scale parameter of this Weibull is m = 2,540 kN/m2, with a shape parameter k = 5.3.
20
X(56) the compression perpendicular strength of the wood in the tie (following published recommendations by Blass and Gorlacher (2004)). From these data, this variable is assumed Lognormally distributed, with a mean of 3,000 kN/m2 and a coefficient of variation of 20%.
Three limit states or performance functions G were considered:
Bending failure:
in which Sbmax is the maximum overall bending stress from the structural analysis, using a GVW of 1000kN, and fi is an impact coefficient.
max )0.1000/)54(()51( bi SfXXG −=
21

Shear failure:
in which Tmax is the maximum Weibull stress from the structural analysis.
Failure in compression perpendicular:
in which Rmax is the maximum overall support reaction from the structural analysis and A is the area of contact at the support (the product of tie width
and girder flange width).
maxT )0.1000/)54(()55( ifXXG −=
max )0.1000/)54(( )56( RfXAXG i−=
22

Calculating the reliability index β for each limit state (or failure mode):
The calculation of the reliability index β (and associated probability of failure) was carried using the general software RELAN (Foschi, 2010), RELAN carries out the calculation of β, first with FORM (First Order Reliability Method), and then, whenever not quickly converging, by Importance Sampling Simulation, with a sample size of 20000, to arrive at the results presented here.
For each mode, the FORM algorithm finds out the combination of the variables most likely to result in failure. For example, the methods finds out automatically the coordinates x and y giving the worst position of the truck, as well as the combination of tie stiffness EI that are more detrimental to the strength of a given tie (load sharing).
23

Reliability results
Results were obtained for eight cases.
Four of these used the Heavy Coastal, 5-axle truck data.
The other four used the Interior 7-axle truck data.
For the Coastal, heavy trucks, the following deterministic or fixed parameters were used:50 ties5 axlesTie dimensions: 0.25m x 0.30mTie spacing: 0.406mTie main span: 3.60mTie cantilever span: 0.64mImpact coefficient: 1.201 plank: thickness = 0.10m (100mm x 300mm), E = 10,000x103 kN/m2Nails tie/plank : stiffness = 2,600 kN/m , spacing 0.30m o.c
24
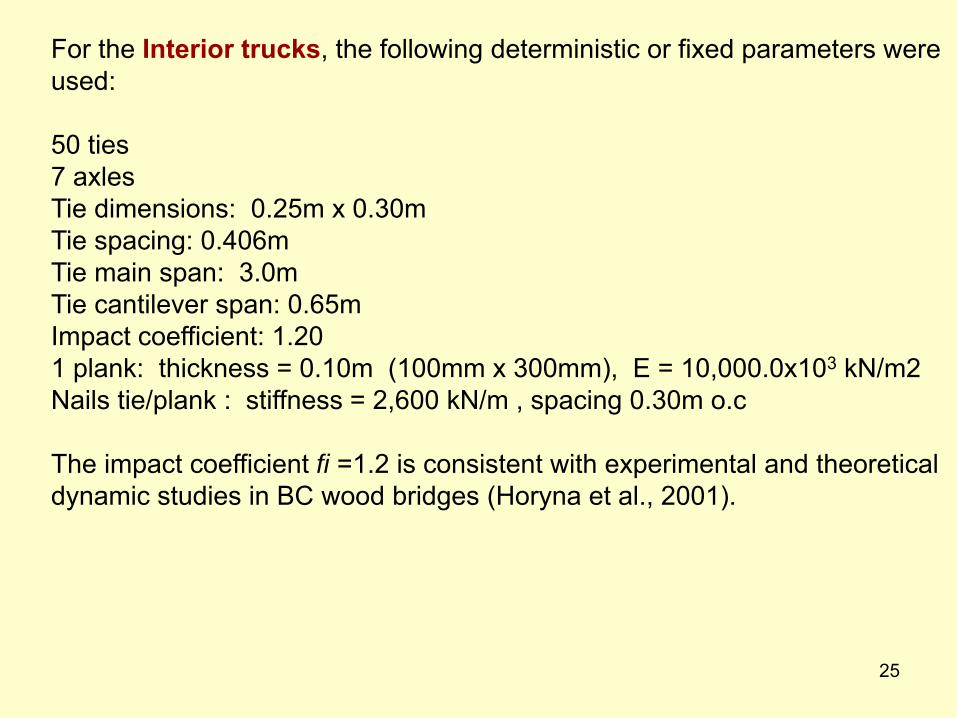
For the Interior trucks, the following deterministic or fixed parameters were used:
50 ties7 axlesTie dimensions: 0.25m x 0.30mTie spacing: 0.406mTie main span: 3.0mTie cantilever span: 0.65mImpact coefficient: 1.201 plank: thickness = 0.10m (100mm x 300mm), E = 10,000.0x103 kN/m2Nails tie/plank : stiffness = 2,600 kN/m , spacing 0.30m o.c
The impact coefficient fi =1.2 is consistent with experimental and theoretical dynamic studies in BC wood bridges (Horyna et al., 2001).
25

Assumed wood mechanical properties
Category
Modulus of Elasticity E
(kN/m2)Lognormal
Bending Strength (kN/m2)2-P Weibull distribution
Mean Cov (%)
Scale m
Shape k
5th
Percentile
(MPa)1 10,000 x
10315.0 50,000 6.0 30.48
2 12,000 x 103
15.0 50,000 6.0 30.48
3 12,000 x 103
15.0 65,000 6.0 39.62
4 14,000 x 103
15.0 80,000 6.0 48.76
26

Reliability Indices β, Heavy Coastal Trucks, 5-axles
Category Bending Shear Compression perpendicular
1 3.30 2.50 3.90
2 3.18 2.34 3.95
3 3.50 2.40 4.40
4 3.90 2.30 4.20
Reliability Indices β, Interior Trucks, 7-axles
Category Bending Shear Compression perpendicular
1 3.90 3.02 5.93
2 3.80 2.91 5.85
3 4.19 2.93 5.88
4 4.40 2.90 > 6.00
27
5. Conclusions
• This project has focused on the development of a structural analysis for the wood deck, coupling it with a reliability analysis under either heavy, coastal truck loads or lighter, interior trucks.
• The reliability assessment considered three limit states (or failure modes) for the ties: failure by bending stresses, failure related to shear, and failure related to compression perpendicular to the grain stresses due to bearing of the ties on the support girders.
• The reliability assessment was made independently from recommendations from the Canadian Highway Bridge Code S6.
28

•Lacking comprehensive data on timber strength, the analysis was done for four assumed categories of timber stiffness and strength, to provide background information on reliability until more definite timber data become available.
The timber data chosen are consistent with available experimental information. Thus, the bending strength and stiffness categories were chosen to be consistent with the limited timber data collected by Borg Madsen, at UBC, in 1982. Shear strength incorporated size effects as detailed by Foschi and Barrett in 1976, a procedure which is already used in the Canadian Code CSA-086 for wood structures. Compression perpendicular to the grain data were taken from the literature (Blass, 2004), but the data show wide scatter depending on the testing configuration. Nevertheless, the values for compression perpendicular used in this report are a reasonable lower bound from the test results.
Further testing is planned as a continuation of this project.
29

•It can be concluded that the reliability indices associated with the BC bridge configurations studied, under realistic (measured) truck loads, are satisfactory, since the consequence of one tie failing does not imply the collapse of the entire deck.
•The reliabilities in the bending mode are consistent with the aims of S6, although the comprehensive method used here for estimating reliability differs substantially from the simplified approach adopted in S6 (this makes it rather difficult to compare reliability results). On bending strength alone, BC bridges appear to be sufficiently reliable, and S6 design checks implying the contrary probably reflect gaps in the calibration procedure for that Code.
30

• Of the three limit states, shear strength appears to be the controlling mode. However, the Weibull model used for shear strength could be conservative (it is based on full brittle behavior), so that a calculated β could be lower than the actual one. As far as shear is concerned, the heavier, 5-axle truck configuration is more demanding than the 7-axle trucks. Although the calculated reliabilities for the shear mode are reasonable, the lower reliabilities in shear indicate that the new testing program should include an assessment of shear strength and the monitoring of end cracks which would affect shear capacity.
• Compression perpendicular to the grain appears to be the less likely mode of failure and does not control the performance of the bridges.
31

Thank you
With thanks to Brian Chow (MoF), Dave Barrett (Wood Science, UBC), Frank Lam (Wood Science, UBC), Laura and Ariel Quiroz (Civil
Engineering, UBC)
32